Cities with the Most Immigrants from India in New York
RELATED REPORTS & OPTIONS
India
New York
Compare Cities
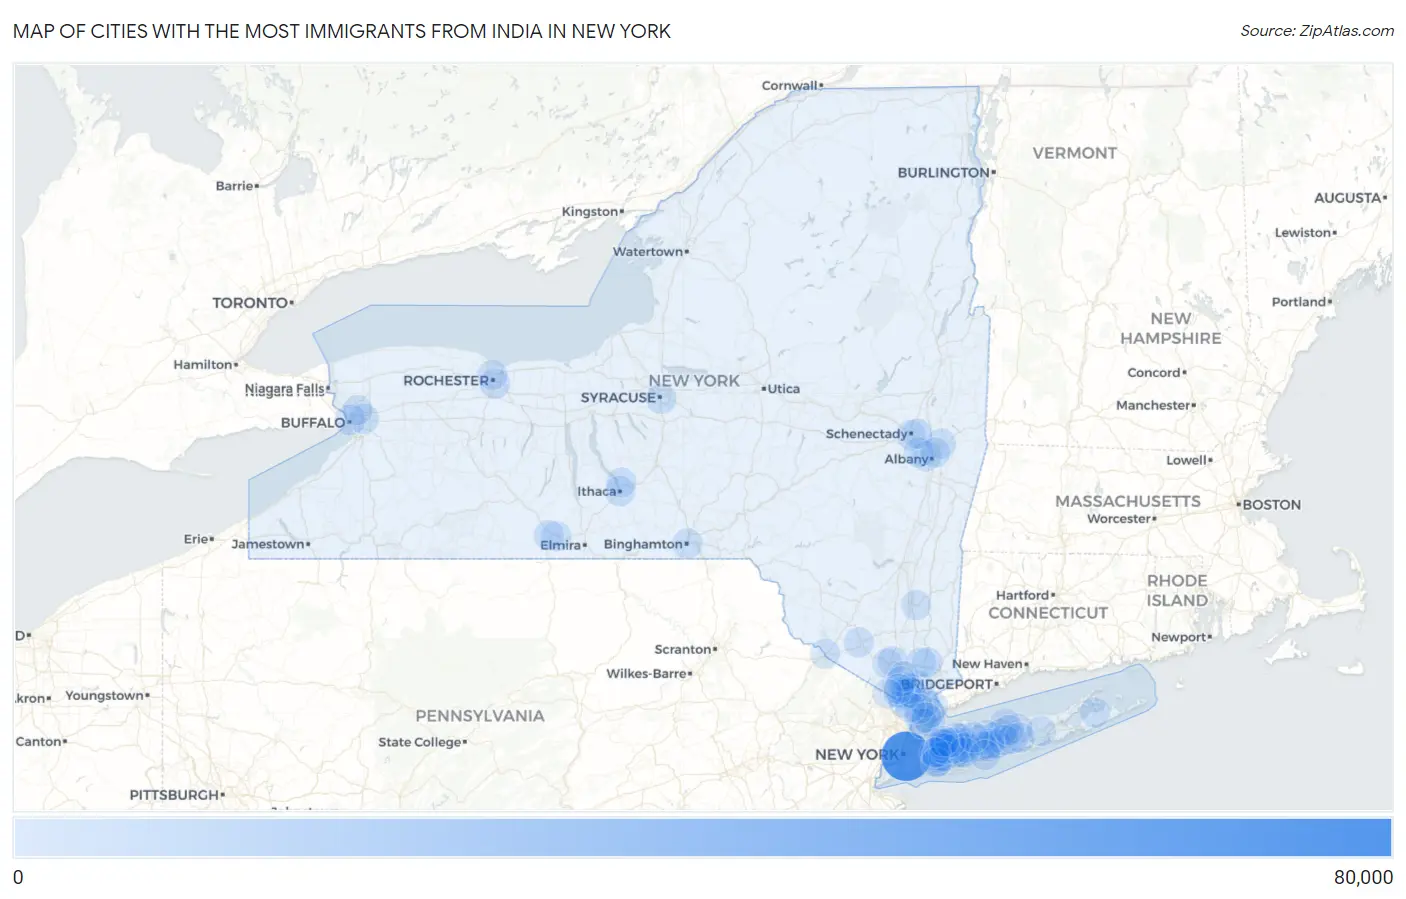
Map of Cities with the Most Immigrants from India in New York
0
80,000
Cities with the Most Immigrants from India in New York
| City | India | vs State | vs National | |
| 1. | New York | 78,976 | 158,432(49.85%)#1 | 2,732,526(2.89%)#1 |
| 2. | Hicksville | 5,110 | 158,432(3.23%)#2 | 2,732,526(0.19%)#62 |
| 3. | Yonkers | 2,866 | 158,432(1.81%)#3 | 2,732,526(0.10%)#137 |
| 4. | New City | 1,682 | 158,432(1.06%)#4 | 2,732,526(0.06%)#234 |
| 5. | North New Hyde Park | 1,660 | 158,432(1.05%)#5 | 2,732,526(0.06%)#239 |
| 6. | Buffalo | 1,532 | 158,432(0.97%)#6 | 2,732,526(0.06%)#263 |
| 7. | Franklin Square | 1,372 | 158,432(0.87%)#7 | 2,732,526(0.05%)#295 |
| 8. | Elmont | 1,140 | 158,432(0.72%)#8 | 2,732,526(0.04%)#345 |
| 9. | East Meadow | 1,134 | 158,432(0.72%)#9 | 2,732,526(0.04%)#348 |
| 10. | White Plains | 1,070 | 158,432(0.68%)#10 | 2,732,526(0.04%)#368 |
| 11. | Brighton | 1,032 | 158,432(0.65%)#11 | 2,732,526(0.04%)#381 |
| 12. | Dix Hills | 1,031 | 158,432(0.65%)#12 | 2,732,526(0.04%)#382 |
| 13. | Plainview | 958 | 158,432(0.60%)#13 | 2,732,526(0.04%)#413 |
| 14. | Syosset | 893 | 158,432(0.56%)#14 | 2,732,526(0.03%)#445 |
| 15. | Valley Stream | 872 | 158,432(0.55%)#15 | 2,732,526(0.03%)#454 |
| 16. | Garden City Park | 853 | 158,432(0.54%)#16 | 2,732,526(0.03%)#468 |
| 17. | Levittown | 749 | 158,432(0.47%)#17 | 2,732,526(0.03%)#538 |
| 18. | New Hyde Park | 733 | 158,432(0.46%)#18 | 2,732,526(0.03%)#556 |
| 19. | Syracuse | 692 | 158,432(0.44%)#19 | 2,732,526(0.03%)#591 |
| 20. | Jericho | 690 | 158,432(0.44%)#20 | 2,732,526(0.03%)#593 |
| 21. | Ithaca | 684 | 158,432(0.43%)#21 | 2,732,526(0.03%)#596 |
| 22. | Greenville Cdp Westchester County | 680 | 158,432(0.43%)#22 | 2,732,526(0.02%)#602 |
| 23. | Binghamton | 667 | 158,432(0.42%)#23 | 2,732,526(0.02%)#611 |
| 24. | Searingtown | 663 | 158,432(0.42%)#24 | 2,732,526(0.02%)#617 |
| 25. | New Rochelle | 633 | 158,432(0.40%)#25 | 2,732,526(0.02%)#644 |
| 26. | Albany | 595 | 158,432(0.38%)#26 | 2,732,526(0.02%)#676 |
| 27. | North Valley Stream | 530 | 158,432(0.33%)#27 | 2,732,526(0.02%)#737 |
| 28. | Herricks | 485 | 158,432(0.31%)#28 | 2,732,526(0.02%)#790 |
| 29. | Stony Brook University | 480 | 158,432(0.30%)#29 | 2,732,526(0.02%)#793 |
| 30. | Nanuet | 469 | 158,432(0.30%)#30 | 2,732,526(0.02%)#807 |
| 31. | Rochester | 448 | 158,432(0.28%)#31 | 2,732,526(0.02%)#827 |
| 32. | Scarsdale | 440 | 158,432(0.28%)#32 | 2,732,526(0.02%)#841 |
| 33. | Schenectady | 438 | 158,432(0.28%)#33 | 2,732,526(0.02%)#843 |
| 34. | Troy | 429 | 158,432(0.27%)#34 | 2,732,526(0.02%)#855 |
| 35. | Cheektowaga | 428 | 158,432(0.27%)#35 | 2,732,526(0.02%)#857 |
| 36. | Bethpage | 428 | 158,432(0.27%)#36 | 2,732,526(0.02%)#859 |
| 37. | Coram | 422 | 158,432(0.27%)#37 | 2,732,526(0.02%)#868 |
| 38. | Hauppauge | 397 | 158,432(0.25%)#38 | 2,732,526(0.01%)#900 |
| 39. | Muttontown | 392 | 158,432(0.25%)#39 | 2,732,526(0.01%)#906 |
| 40. | Floral Park | 382 | 158,432(0.24%)#40 | 2,732,526(0.01%)#926 |
| 41. | Pearl River | 370 | 158,432(0.23%)#41 | 2,732,526(0.01%)#946 |
| 42. | Nesconset | 370 | 158,432(0.23%)#42 | 2,732,526(0.01%)#947 |
| 43. | Deer Park | 365 | 158,432(0.23%)#43 | 2,732,526(0.01%)#955 |
| 44. | Manhasset Hills | 364 | 158,432(0.23%)#44 | 2,732,526(0.01%)#960 |
| 45. | Albertson | 362 | 158,432(0.23%)#45 | 2,732,526(0.01%)#966 |
| 46. | Bardonia | 344 | 158,432(0.22%)#46 | 2,732,526(0.01%)#1,004 |
| 47. | Westmere | 342 | 158,432(0.22%)#47 | 2,732,526(0.01%)#1,008 |
| 48. | Spring Valley | 337 | 158,432(0.21%)#48 | 2,732,526(0.01%)#1,022 |
| 49. | North Hills | 332 | 158,432(0.21%)#49 | 2,732,526(0.01%)#1,034 |
| 50. | Ossining | 331 | 158,432(0.21%)#50 | 2,732,526(0.01%)#1,035 |
| 51. | Salisbury | 325 | 158,432(0.21%)#51 | 2,732,526(0.01%)#1,056 |
| 52. | Mount Vernon | 320 | 158,432(0.20%)#52 | 2,732,526(0.01%)#1,072 |
| 53. | Commack | 317 | 158,432(0.20%)#53 | 2,732,526(0.01%)#1,079 |
| 54. | North Bay Shore | 317 | 158,432(0.20%)#54 | 2,732,526(0.01%)#1,082 |
| 55. | Roslyn Heights | 304 | 158,432(0.19%)#55 | 2,732,526(0.01%)#1,116 |
| 56. | Central Islip | 298 | 158,432(0.19%)#56 | 2,732,526(0.01%)#1,131 |
| 57. | West Hempstead | 287 | 158,432(0.18%)#57 | 2,732,526(0.01%)#1,159 |
| 58. | Roessleville | 287 | 158,432(0.18%)#58 | 2,732,526(0.01%)#1,160 |
| 59. | Congers | 274 | 158,432(0.17%)#59 | 2,732,526(0.01%)#1,197 |
| 60. | Brentwood | 273 | 158,432(0.17%)#60 | 2,732,526(0.01%)#1,198 |
| 61. | Valley Cottage | 272 | 158,432(0.17%)#61 | 2,732,526(0.01%)#1,206 |
| 62. | Niskayuna | 271 | 158,432(0.17%)#62 | 2,732,526(0.01%)#1,207 |
| 63. | Ronkonkoma | 270 | 158,432(0.17%)#63 | 2,732,526(0.01%)#1,208 |
| 64. | Old Bethpage | 250 | 158,432(0.16%)#64 | 2,732,526(0.01%)#1,256 |
| 65. | Menands | 250 | 158,432(0.16%)#65 | 2,732,526(0.01%)#1,257 |
| 66. | Mineola | 240 | 158,432(0.15%)#66 | 2,732,526(0.01%)#1,291 |
| 67. | Holtsville | 236 | 158,432(0.15%)#67 | 2,732,526(0.01%)#1,307 |
| 68. | Lake Mohegan | 231 | 158,432(0.15%)#68 | 2,732,526(0.01%)#1,327 |
| 69. | Elmsford | 231 | 158,432(0.15%)#69 | 2,732,526(0.01%)#1,328 |
| 70. | Dobbs Ferry | 217 | 158,432(0.14%)#70 | 2,732,526(0.01%)#1,377 |
| 71. | Harriman | 216 | 158,432(0.14%)#71 | 2,732,526(0.01%)#1,382 |
| 72. | Plainedge | 214 | 158,432(0.14%)#72 | 2,732,526(0.01%)#1,389 |
| 73. | Woodbury | 209 | 158,432(0.13%)#73 | 2,732,526(0.01%)#1,406 |
| 74. | Jefferson Valley Yorktown | 187 | 158,432(0.12%)#74 | 2,732,526(0.01%)#1,496 |
| 75. | Eastchester | 185 | 158,432(0.12%)#75 | 2,732,526(0.01%)#1,506 |
| 76. | Tappan | 182 | 158,432(0.11%)#76 | 2,732,526(0.01%)#1,527 |
| 77. | South Valley Stream | 182 | 158,432(0.11%)#77 | 2,732,526(0.01%)#1,528 |
| 78. | Stony Point | 179 | 158,432(0.11%)#78 | 2,732,526(0.01%)#1,545 |
| 79. | South Huntington | 178 | 158,432(0.11%)#79 | 2,732,526(0.01%)#1,548 |
| 80. | Lansing | 178 | 158,432(0.11%)#80 | 2,732,526(0.01%)#1,550 |
| 81. | De Witt | 177 | 158,432(0.11%)#81 | 2,732,526(0.01%)#1,554 |
| 82. | Mount Ivy | 174 | 158,432(0.11%)#82 | 2,732,526(0.01%)#1,575 |
| 83. | New Hempstead | 169 | 158,432(0.11%)#83 | 2,732,526(0.01%)#1,602 |
| 84. | Old Westbury | 166 | 158,432(0.10%)#84 | 2,732,526(0.01%)#1,619 |
| 85. | Roslyn | 166 | 158,432(0.10%)#85 | 2,732,526(0.01%)#1,621 |
| 86. | Port Jervis | 165 | 158,432(0.10%)#86 | 2,732,526(0.01%)#1,626 |
| 87. | Noyack | 165 | 158,432(0.10%)#87 | 2,732,526(0.01%)#1,629 |
| 88. | Latham | 158 | 158,432(0.10%)#88 | 2,732,526(0.01%)#1,674 |
| 89. | Suffern | 152 | 158,432(0.10%)#89 | 2,732,526(0.01%)#1,710 |
| 90. | Eggertsville | 150 | 158,432(0.09%)#90 | 2,732,526(0.01%)#1,730 |
| 91. | East Setauket | 150 | 158,432(0.09%)#91 | 2,732,526(0.01%)#1,732 |
| 92. | Arlington | 149 | 158,432(0.09%)#92 | 2,732,526(0.01%)#1,739 |
| 93. | Centereach | 147 | 158,432(0.09%)#93 | 2,732,526(0.01%)#1,750 |
| 94. | West Islip | 147 | 158,432(0.09%)#94 | 2,732,526(0.01%)#1,751 |
| 95. | Corning | 147 | 158,432(0.09%)#95 | 2,732,526(0.01%)#1,753 |
| 96. | Mechanicstown | 146 | 158,432(0.09%)#96 | 2,732,526(0.01%)#1,758 |
| 97. | Manorville | 144 | 158,432(0.09%)#97 | 2,732,526(0.01%)#1,775 |
| 98. | Bellerose Terrace | 142 | 158,432(0.09%)#98 | 2,732,526(0.01%)#1,785 |
| 99. | Medford | 141 | 158,432(0.09%)#99 | 2,732,526(0.01%)#1,789 |
| 100. | Gang Mills | 138 | 158,432(0.09%)#100 | 2,732,526(0.01%)#1,805 |
Common Questions
What are the Top 10 Cities with the Most Immigrants from India in New York?
Top 10 Cities with the Most Immigrants from India in New York are:
#1
78,976
#2
5,110
#3
2,866
#4
1,682
#5
1,660
#6
1,532
#7
1,372
#8
1,140
#9
1,134
#10
1,070
What city has the Most Immigrants from India in New York?
New York has the Most Immigrants from India in New York with 78,976.
What is the Total Immigrants from India in the State of New York?
Total Immigrants from India in New York is 158,432.
What is the Total Immigrants from India in the United States?
Total Immigrants from India in the United States is 2,732,526.