Cities with the Highest Percentage of Immigrants from Europe in Virginia
RELATED REPORTS & OPTIONS
Europe
Virginia
Compare Cities
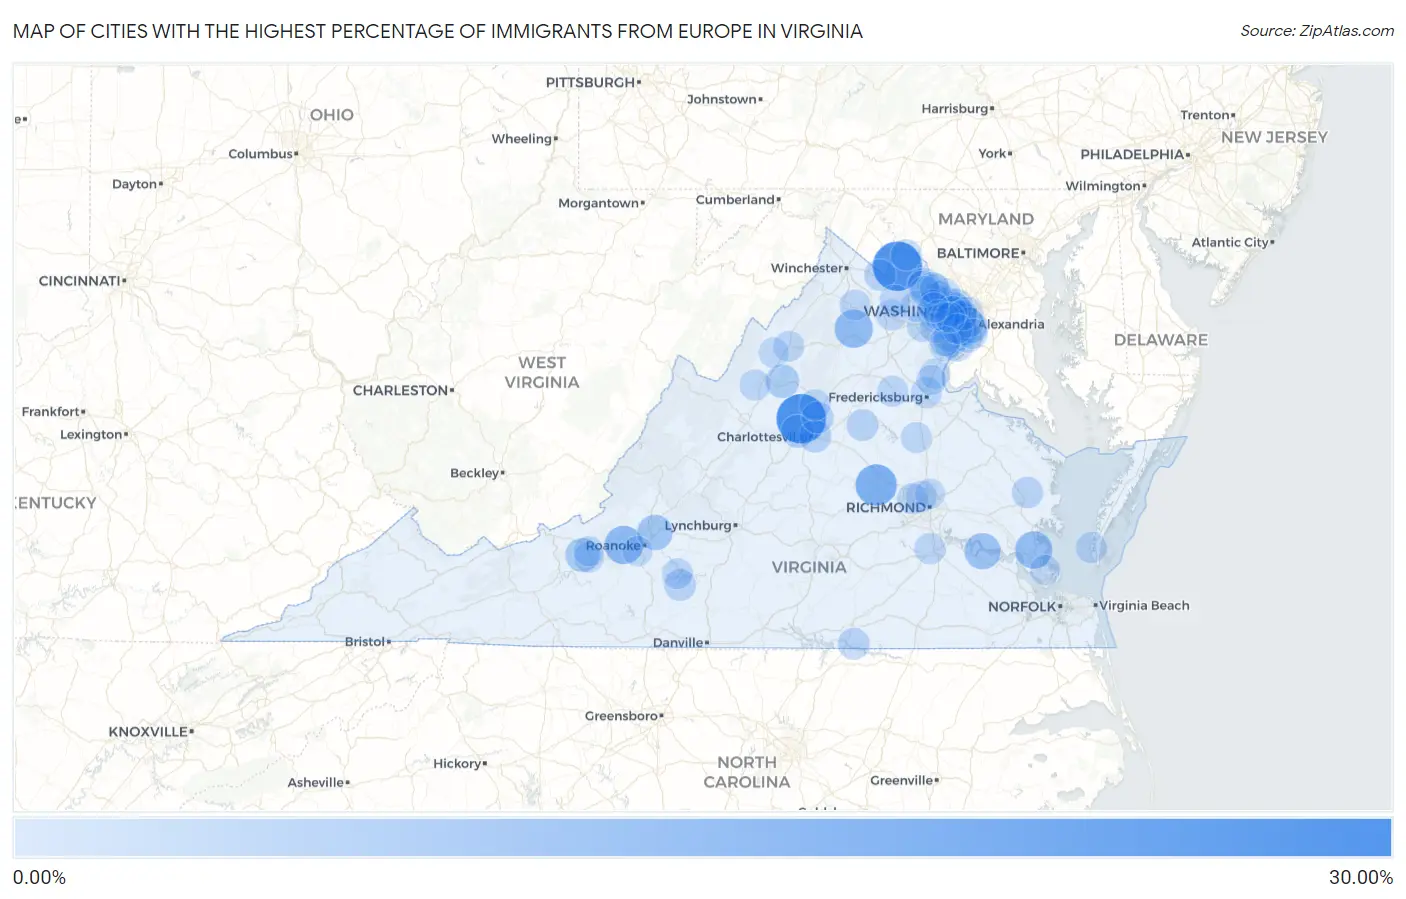
Map of Cities with the Highest Percentage of Immigrants from Europe in Virginia
0.00%
30.00%
Cities with the Highest Percentage of Immigrants from Europe in Virginia
| City | Europe | vs State | vs National | |
| 1. | Free Union | 25.95% | 1.21%(+24.7)#1 | 1.46%(+24.5)#28 |
| 2. | Hillsboro | 25.66% | 1.21%(+24.4)#2 | 1.46%(+24.2)#30 |
| 3. | Goochland | 15.53% | 1.21%(+14.3)#3 | 1.46%(+14.1)#80 |
| 4. | Paris | 13.33% | 1.21%(+12.1)#4 | 1.46%(+11.9)#113 |
| 5. | Brandy Station | 12.22% | 1.21%(+11.0)#5 | 1.46%(+10.8)#134 |
| 6. | Glenvar | 11.91% | 1.21%(+10.7)#6 | 1.46%(+10.5)#145 |
| 7. | Flint Hill | 11.60% | 1.21%(+10.4)#7 | 1.46%(+10.1)#151 |
| 8. | Yorktown | 10.60% | 1.21%(+9.38)#8 | 1.46%(+9.14)#179 |
| 9. | Claremont | 9.26% | 1.21%(+8.05)#9 | 1.46%(+7.81)#254 |
| 10. | Laymantown | 8.25% | 1.21%(+7.04)#10 | 1.46%(+6.79)#328 |
| 11. | Sully Square | 7.97% | 1.21%(+6.75)#11 | 1.46%(+6.51)#362 |
| 12. | Moneta | 7.14% | 1.21%(+5.93)#12 | 1.46%(+5.69)#454 |
| 13. | Prices Fork | 6.51% | 1.21%(+5.29)#13 | 1.46%(+5.05)#563 |
| 14. | Camp Barrett | 6.18% | 1.21%(+4.96)#14 | 1.46%(+4.72)#630 |
| 15. | Massanutten | 6.04% | 1.21%(+4.82)#15 | 1.46%(+4.58)#669 |
| 16. | Glen Wilton | 6.02% | 1.21%(+4.80)#16 | 1.46%(+4.56)#674 |
| 17. | Ivy | 5.28% | 1.21%(+4.06)#17 | 1.46%(+3.82)#885 |
| 18. | Woodburn | 4.92% | 1.21%(+3.71)#18 | 1.46%(+3.46)#994 |
| 19. | Pantops | 4.73% | 1.21%(+3.51)#19 | 1.46%(+3.27)#1,073 |
| 20. | Wolf Trap | 4.61% | 1.21%(+3.40)#20 | 1.46%(+3.16)#1,133 |
| 21. | Mclean | 4.49% | 1.21%(+3.28)#21 | 1.46%(+3.04)#1,186 |
| 22. | Occoquan | 4.48% | 1.21%(+3.26)#22 | 1.46%(+3.02)#1,193 |
| 23. | Port Republic | 4.37% | 1.21%(+3.16)#23 | 1.46%(+2.92)#1,242 |
| 24. | Braddock | 4.12% | 1.21%(+2.91)#24 | 1.46%(+2.66)#1,348 |
| 25. | Vienna | 3.98% | 1.21%(+2.76)#25 | 1.46%(+2.52)#1,436 |
| 26. | Merrifield | 3.97% | 1.21%(+2.76)#26 | 1.46%(+2.51)#1,438 |
| 27. | Blue Ridge Shores | 3.90% | 1.21%(+2.69)#27 | 1.46%(+2.45)#1,473 |
| 28. | Penhook | 3.88% | 1.21%(+2.67)#28 | 1.46%(+2.43)#1,487 |
| 29. | Piney Mountain | 3.85% | 1.21%(+2.64)#29 | 1.46%(+2.40)#1,508 |
| 30. | Bracey | 3.81% | 1.21%(+2.60)#30 | 1.46%(+2.36)#1,530 |
| 31. | Baywood | 3.78% | 1.21%(+2.57)#31 | 1.46%(+2.33)#1,546 |
| 32. | Idylwood | 3.67% | 1.21%(+2.46)#32 | 1.46%(+2.22)#1,614 |
| 33. | Tysons | 3.65% | 1.21%(+2.44)#33 | 1.46%(+2.20)#1,627 |
| 34. | Shenandoah Retreat | 3.54% | 1.21%(+2.32)#34 | 1.46%(+2.08)#1,722 |
| 35. | Huntington | 3.54% | 1.21%(+2.32)#35 | 1.46%(+2.08)#1,723 |
| 36. | Reston | 3.53% | 1.21%(+2.32)#36 | 1.46%(+2.07)#1,731 |
| 37. | Urbanna | 3.43% | 1.21%(+2.22)#37 | 1.46%(+1.98)#1,805 |
| 38. | Lansdowne | 3.41% | 1.21%(+2.20)#38 | 1.46%(+1.96)#1,823 |
| 39. | Fair Lakes | 3.32% | 1.21%(+2.11)#39 | 1.46%(+1.86)#1,903 |
| 40. | Twin Lakes | 3.20% | 1.21%(+1.99)#40 | 1.46%(+1.75)#1,994 |
| 41. | Lovettsville | 3.19% | 1.21%(+1.97)#41 | 1.46%(+1.73)#2,009 |
| 42. | Lake Of The Woods | 3.16% | 1.21%(+1.95)#42 | 1.46%(+1.70)#2,033 |
| 43. | Difficult Run | 3.13% | 1.21%(+1.92)#43 | 1.46%(+1.68)#2,057 |
| 44. | Belmont | 3.12% | 1.21%(+1.91)#44 | 1.46%(+1.67)#2,065 |
| 45. | Oakton | 3.12% | 1.21%(+1.90)#45 | 1.46%(+1.66)#2,079 |
| 46. | Sudley | 3.05% | 1.21%(+1.84)#46 | 1.46%(+1.60)#2,141 |
| 47. | Falls Church | 3.04% | 1.21%(+1.83)#47 | 1.46%(+1.58)#2,151 |
| 48. | Dranesville | 3.02% | 1.21%(+1.81)#48 | 1.46%(+1.56)#2,176 |
| 49. | Countryside | 3.02% | 1.21%(+1.80)#49 | 1.46%(+1.56)#2,180 |
| 50. | Hayfield | 3.01% | 1.21%(+1.79)#50 | 1.46%(+1.55)#2,187 |
| 51. | Arlington | 2.99% | 1.21%(+1.78)#51 | 1.46%(+1.53)#2,200 |
| 52. | Ettrick | 2.98% | 1.21%(+1.77)#52 | 1.46%(+1.53)#2,205 |
| 53. | Cape Charles | 2.96% | 1.21%(+1.74)#53 | 1.46%(+1.50)#2,225 |
| 54. | Bridgewater | 2.90% | 1.21%(+1.69)#54 | 1.46%(+1.45)#2,286 |
| 55. | Pimmit Hills | 2.88% | 1.21%(+1.66)#55 | 1.46%(+1.42)#2,320 |
| 56. | North Shore | 2.84% | 1.21%(+1.63)#56 | 1.46%(+1.39)#2,358 |
| 57. | Stone Ridge | 2.82% | 1.21%(+1.61)#57 | 1.46%(+1.37)#2,381 |
| 58. | Falmouth | 2.82% | 1.21%(+1.60)#58 | 1.46%(+1.36)#2,391 |
| 59. | Great Falls | 2.80% | 1.21%(+1.59)#59 | 1.46%(+1.34)#2,411 |
| 60. | Dumbarton | 2.77% | 1.21%(+1.55)#60 | 1.46%(+1.31)#2,452 |
| 61. | Belle Haven | 2.70% | 1.21%(+1.49)#61 | 1.46%(+1.25)#2,519 |
| 62. | North Garden | 2.67% | 1.21%(+1.46)#62 | 1.46%(+1.22)#2,563 |
| 63. | New Market | 2.64% | 1.21%(+1.42)#63 | 1.46%(+1.18)#2,621 |
| 64. | Lake Land Or | 2.61% | 1.21%(+1.40)#64 | 1.46%(+1.16)#2,651 |
| 65. | Tuckahoe | 2.60% | 1.21%(+1.39)#65 | 1.46%(+1.15)#2,663 |
| 66. | Mason Neck | 2.59% | 1.21%(+1.37)#66 | 1.46%(+1.13)#2,687 |
| 67. | The Plains | 2.56% | 1.21%(+1.35)#67 | 1.46%(+1.11)#2,723 |
| 68. | Floris | 2.56% | 1.21%(+1.35)#68 | 1.46%(+1.11)#2,728 |
| 69. | Skyland Estates | 2.53% | 1.21%(+1.31)#69 | 1.46%(+1.07)#2,764 |
| 70. | West Springfield | 2.50% | 1.21%(+1.28)#70 | 1.46%(+1.04)#2,810 |
| 71. | Middleburg | 2.49% | 1.21%(+1.27)#71 | 1.46%(+1.03)#2,829 |
| 72. | Ashburn | 2.48% | 1.21%(+1.27)#72 | 1.46%(+1.03)#2,837 |
| 73. | Crosspointe | 2.41% | 1.21%(+1.20)#73 | 1.46%(+0.957)#2,921 |
| 74. | Kingstowne | 2.40% | 1.21%(+1.19)#74 | 1.46%(+0.947)#2,932 |
| 75. | Lake Barcroft | 2.40% | 1.21%(+1.18)#75 | 1.46%(+0.942)#2,942 |
| 76. | Union Mill | 2.32% | 1.21%(+1.11)#76 | 1.46%(+0.869)#3,058 |
| 77. | Goose Creek | 2.32% | 1.21%(+1.10)#77 | 1.46%(+0.860)#3,072 |
| 78. | Mount Vernon | 2.31% | 1.21%(+1.09)#78 | 1.46%(+0.853)#3,081 |
| 79. | Alexandria | 2.28% | 1.21%(+1.07)#79 | 1.46%(+0.824)#3,127 |
| 80. | Broadway | 2.28% | 1.21%(+1.06)#80 | 1.46%(+0.823)#3,128 |
| 81. | Clifton | 2.23% | 1.21%(+1.02)#81 | 1.46%(+0.779)#3,199 |
| 82. | Seven Corners | 2.20% | 1.21%(+0.985)#82 | 1.46%(+0.743)#3,256 |
| 83. | Cascades | 2.19% | 1.21%(+0.979)#83 | 1.46%(+0.737)#3,269 |
| 84. | Fair Oaks | 2.18% | 1.21%(+0.966)#84 | 1.46%(+0.725)#3,294 |
| 85. | Dunn Loring | 2.16% | 1.21%(+0.945)#85 | 1.46%(+0.703)#3,329 |
| 86. | Fairfax | 2.15% | 1.21%(+0.935)#86 | 1.46%(+0.693)#3,341 |
| 87. | Fort Hunt | 2.12% | 1.21%(+0.910)#87 | 1.46%(+0.668)#3,373 |
| 88. | Rose Hill Cdp Fairfax County | 2.10% | 1.21%(+0.885)#88 | 1.46%(+0.643)#3,417 |
| 89. | Chamberlayne | 2.09% | 1.21%(+0.881)#89 | 1.46%(+0.639)#3,429 |
| 90. | Aquia Harbour | 2.07% | 1.21%(+0.859)#90 | 1.46%(+0.617)#3,466 |
| 91. | Merrimac | 2.06% | 1.21%(+0.845)#91 | 1.46%(+0.604)#3,489 |
| 92. | Potomac Mills | 2.04% | 1.21%(+0.829)#92 | 1.46%(+0.587)#3,517 |
| 93. | Lake Ridge | 2.01% | 1.21%(+0.794)#93 | 1.46%(+0.552)#3,589 |
| 94. | Blacksburg | 2.00% | 1.21%(+0.782)#94 | 1.46%(+0.540)#3,618 |
| 95. | Springfield | 2.00% | 1.21%(+0.781)#95 | 1.46%(+0.540)#3,620 |
| 96. | Mantua | 1.99% | 1.21%(+0.778)#96 | 1.46%(+0.536)#3,625 |
| 97. | Stafford Courthouse | 1.98% | 1.21%(+0.767)#97 | 1.46%(+0.526)#3,647 |
| 98. | Franklin Farm | 1.98% | 1.21%(+0.764)#98 | 1.46%(+0.523)#3,653 |
| 99. | Cave Spring | 1.97% | 1.21%(+0.758)#99 | 1.46%(+0.516)#3,668 |
| 100. | Bethel Manor | 1.97% | 1.21%(+0.753)#100 | 1.46%(+0.512)#3,681 |
Common Questions
What are the Top 10 Cities with the Highest Percentage of Immigrants from Europe in Virginia?
Top 10 Cities with the Highest Percentage of Immigrants from Europe in Virginia are:
#1
25.95%
#2
25.66%
#3
15.53%
#4
11.91%
#5
11.60%
#6
10.60%
#7
9.26%
#8
8.25%
#9
6.51%
#10
6.04%
What city has the Highest Percentage of Immigrants from Europe in Virginia?
Free Union has the Highest Percentage of Immigrants from Europe in Virginia with 25.95%.
What is the Percentage of Immigrants from Europe in the State of Virginia?
Percentage of Immigrants from Europe in Virginia is 1.21%.
What is the Percentage of Immigrants from Europe in the United States?
Percentage of Immigrants from Europe in the United States is 1.46%.