Omena, MI
Omena Map
Omena Overview
250
TOTAL POPULATION
106
MALE POPULATION
144
FEMALE POPULATION
73.61
MALES / 100 FEMALES
135.85
FEMALES / 100 MALES
73.5
MEDIAN AGE
2.4
AVG FAMILY SIZE
2.1
AVG HOUSEHOLD SIZE
$45,262
PER CAPITA INCOME
$115,655
AVG FAMILY INCOME
$95,750
AVG HOUSEHOLD INCOME
7.6%
WAGE / INCOME GAP [ % ]
92.4¢/ $1
WAGE / INCOME GAP [ $ ]
0.30
INEQUALITY / GINI INDEX
52
LABOR FORCE [ PEOPLE ]
21.9%
PERCENT IN LABOR FORCE
Omena Zip Codes
Omena Area Codes
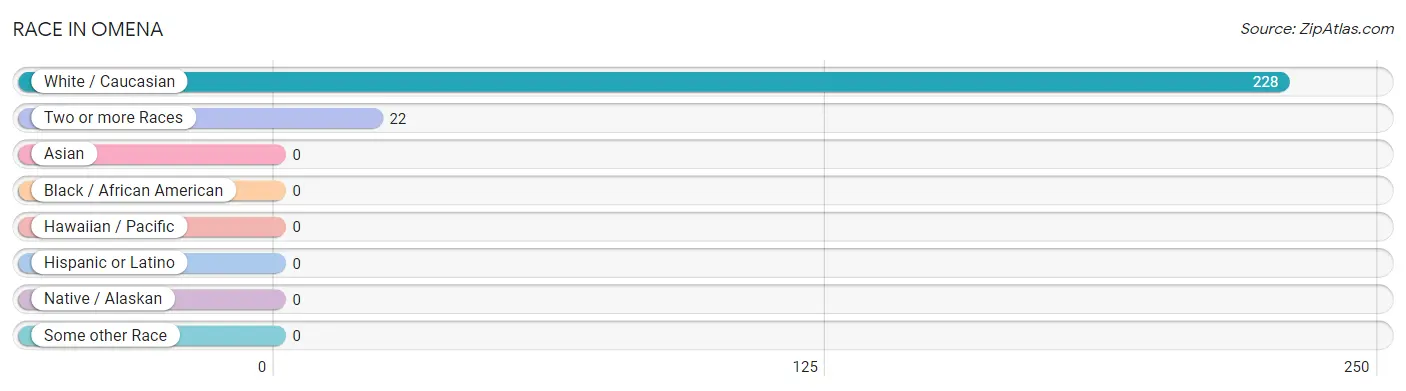
Race in Omena
The most populous races in Omena are White / Caucasian (228 | 91.2%), and Two or more Races (22 | 8.8%).
| Race | # Population | % Population |
| Asian | 0 | 0.0% |
| Black / African American | 0 | 0.0% |
| Hawaiian / Pacific | 0 | 0.0% |
| Hispanic or Latino | 0 | 0.0% |
| Native / Alaskan | 0 | 0.0% |
| White / Caucasian | 228 | 91.2% |
| Two or more Races | 22 | 8.8% |
| Some other Race | 0 | 0.0% |
| Total | 250 | 100.0% |
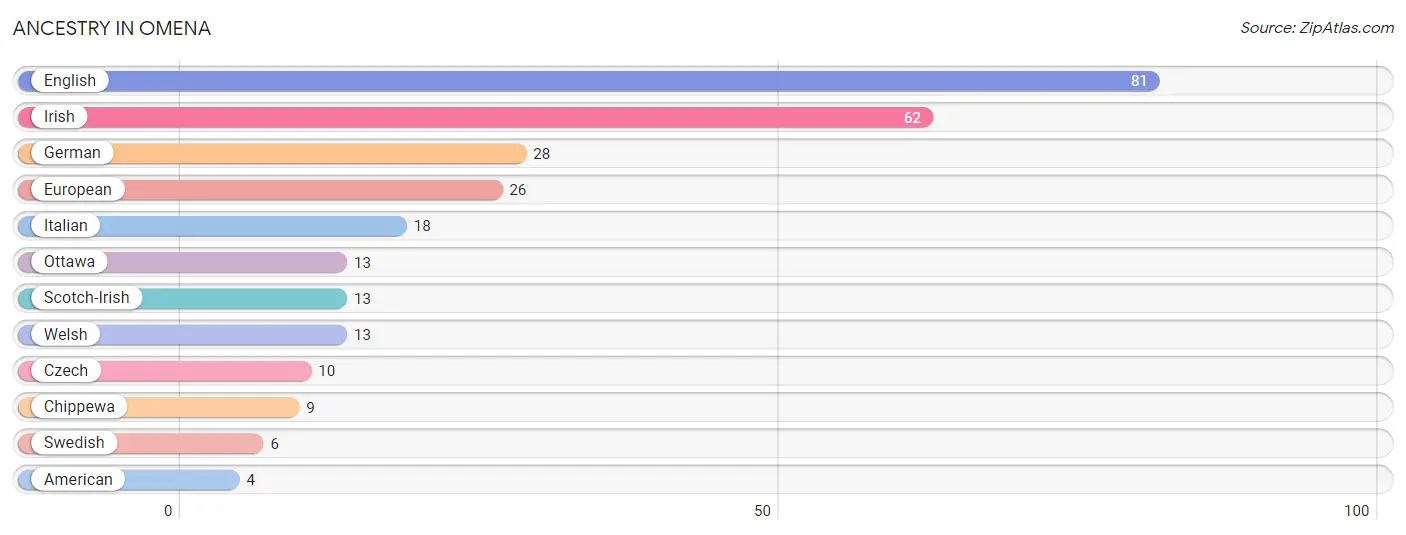
Ancestry in Omena
The most populous ancestries reported in Omena are English (81 | 32.4%), Irish (62 | 24.8%), German (28 | 11.2%), European (26 | 10.4%), and Italian (18 | 7.2%), together accounting for 86.0% of all Omena residents.
| Ancestry | # Population | % Population |
| American | 4 | 1.6% |
| Chippewa | 9 | 3.6% |
| Czech | 10 | 4.0% |
| English | 81 | 32.4% |
| European | 26 | 10.4% |
| German | 28 | 11.2% |
| Irish | 62 | 24.8% |
| Italian | 18 | 7.2% |
| Ottawa | 13 | 5.2% |
| Scotch-Irish | 13 | 5.2% |
| Swedish | 6 | 2.4% |
| Welsh | 13 | 5.2% | View All 12 Rows |
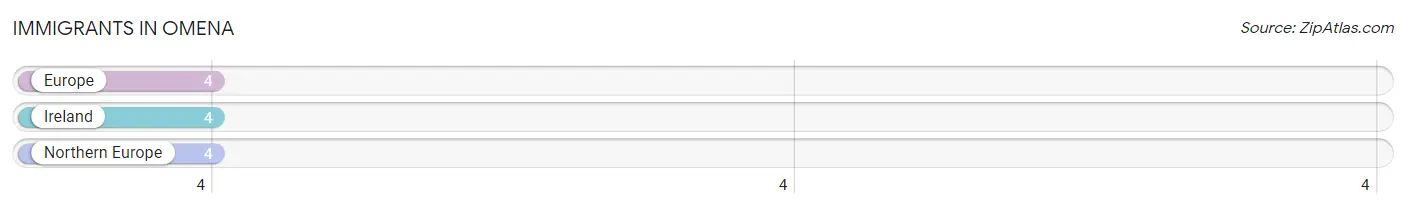
Immigrants in Omena
The most numerous immigrant groups reported in Omena came from Europe (4 | 1.6%), Ireland (4 | 1.6%), and Northern Europe (4 | 1.6%), together accounting for 4.8% of all Omena residents.
| Immigration Origin | # Population | % Population |
| Europe | 4 | 1.6% |
| Ireland | 4 | 1.6% |
| Northern Europe | 4 | 1.6% | View All 3 Rows |
Sex and Age in Omena
Sex and Age in Omena
The most populous age groups in Omena are 70 to 74 Years (35 | 33.0%) for men and 70 to 74 Years (40 | 27.8%) for women.
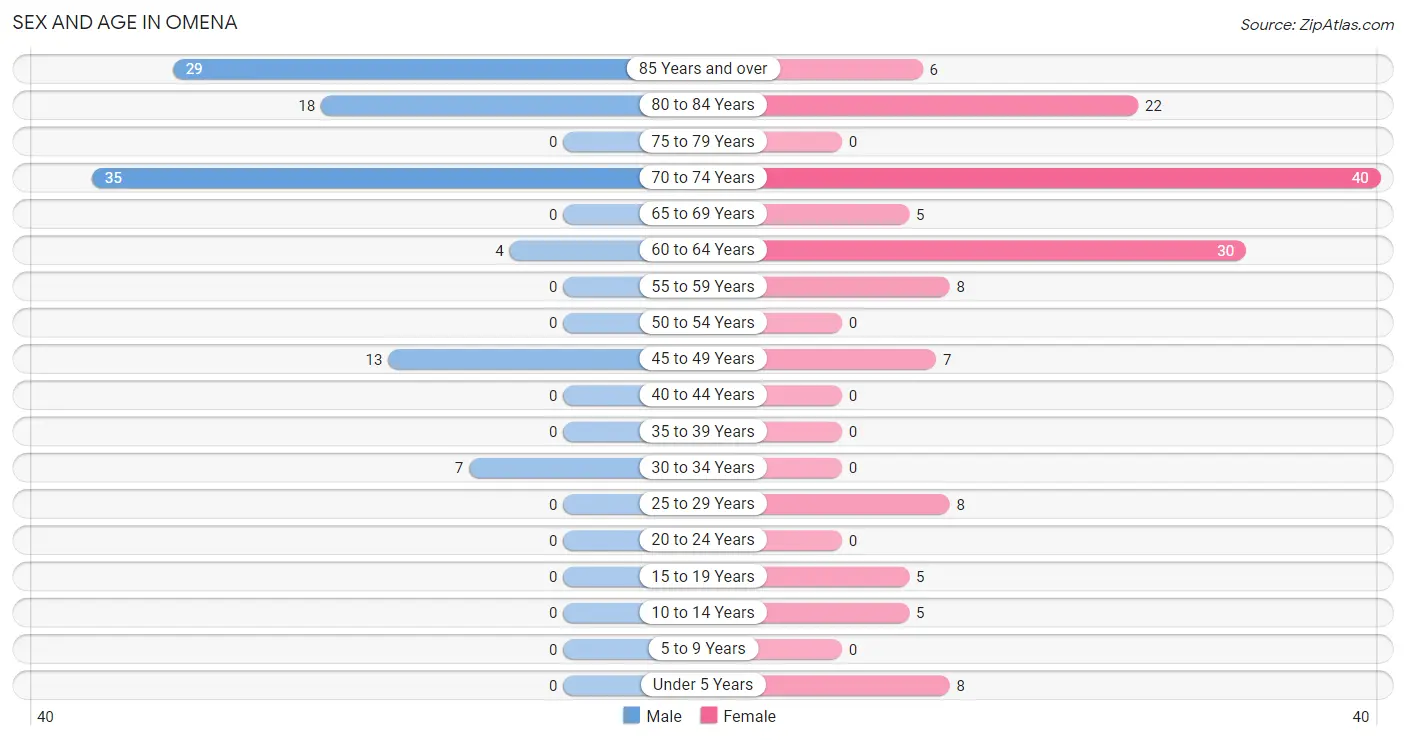
| Age Bracket | Male | Female |
| Under 5 Years | 0 (0.0%) | 8 (5.6%) |
| 5 to 9 Years | 0 (0.0%) | 0 (0.0%) |
| 10 to 14 Years | 0 (0.0%) | 5 (3.5%) |
| 15 to 19 Years | 0 (0.0%) | 5 (3.5%) |
| 20 to 24 Years | 0 (0.0%) | 0 (0.0%) |
| 25 to 29 Years | 0 (0.0%) | 8 (5.6%) |
| 30 to 34 Years | 7 (6.6%) | 0 (0.0%) |
| 35 to 39 Years | 0 (0.0%) | 0 (0.0%) |
| 40 to 44 Years | 0 (0.0%) | 0 (0.0%) |
| 45 to 49 Years | 13 (12.3%) | 7 (4.9%) |
| 50 to 54 Years | 0 (0.0%) | 0 (0.0%) |
| 55 to 59 Years | 0 (0.0%) | 8 (5.6%) |
| 60 to 64 Years | 4 (3.8%) | 30 (20.8%) |
| 65 to 69 Years | 0 (0.0%) | 5 (3.5%) |
| 70 to 74 Years | 35 (33.0%) | 40 (27.8%) |
| 75 to 79 Years | 0 (0.0%) | 0 (0.0%) |
| 80 to 84 Years | 18 (17.0%) | 22 (15.3%) |
| 85 Years and over | 29 (27.4%) | 6 (4.2%) |
| Total | 106 (100.0%) | 144 (100.0%) |
Families and Households in Omena
Median Family Size in Omena
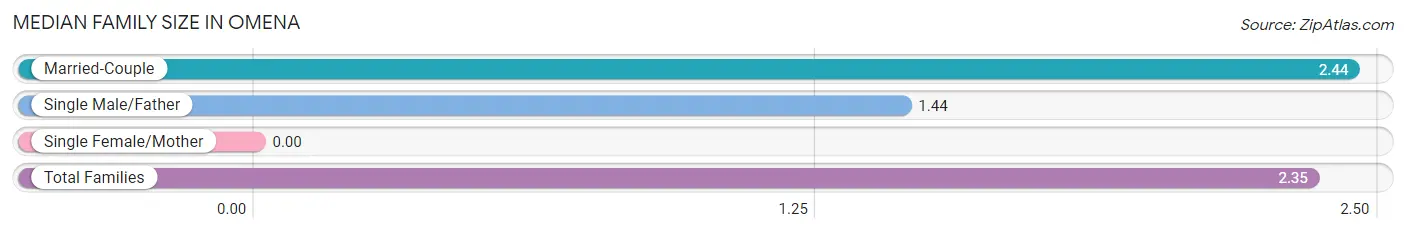
| Family Type | # Families | Family Size |
| Married-Couple | 88 (90.7%) | 2.44 |
| Single Male/Father | 9 (9.3%) | 1.44 |
| Single Female/Mother | 0 (0.0%) | - |
| Total Families | 97 (100.0%) | 2.35 |
Median Household Size in Omena
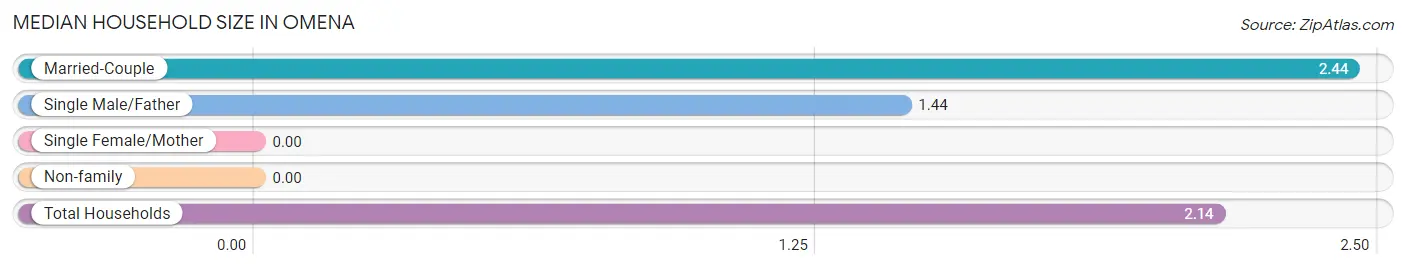
| Household Type | # Households | Household Size |
| Married-Couple | 88 (76.5%) | 2.44 |
| Single Male/Father | 9 (7.8%) | 1.44 |
| Single Female/Mother | 0 (0.0%) | - |
| Non-family | 18 (15.7%) | - |
| Total Households | 115 (100.0%) | 2.14 |
Household Size by Marriage Status in Omena
Out of a total of 115 households in Omena, 97 (84.4%) are family households, while 18 (15.7%) are nonfamily households. The most numerous type of family households are 2-person households, comprising 86, and the most common type of nonfamily households are 1-person households, comprising 18.

| Household Size | Family Households | Nonfamily Households |
| 1-Person Households | - | 18 (15.7%) |
| 2-Person Households | 86 (74.8%) | 0 (0.0%) |
| 3-Person Households | 0 (0.0%) | 0 (0.0%) |
| 4-Person Households | 11 (9.6%) | 0 (0.0%) |
| 5-Person Households | 0 (0.0%) | 0 (0.0%) |
| 6-Person Households | 0 (0.0%) | 0 (0.0%) |
| 7+ Person Households | 0 (0.0%) | 0 (0.0%) |
| Total | 97 (84.4%) | 18 (15.7%) |
Female Fertility in Omena
Fertility by Age in Omena
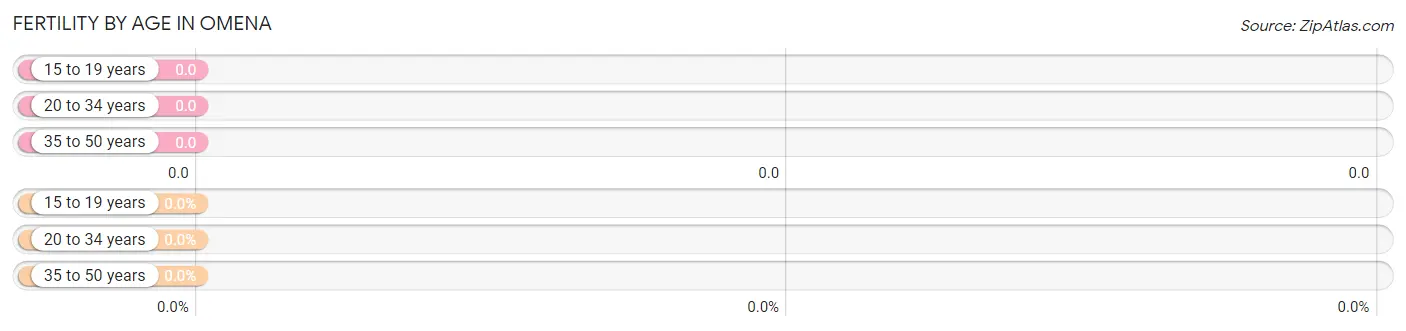
| Age Bracket | Women with Births | Births / 1,000 Women |
| 15 to 19 years | 0 (0.0%) | 0.0 |
| 20 to 34 years | 0 (0.0%) | 0.0 |
| 35 to 50 years | 0 (0.0%) | 0.0 |
| Total | 0 (0.0%) | 0.0 |
Fertility by Age by Marriage Status in Omena
| Age Bracket | Married | Unmarried |
| 15 to 19 years | 0 (0.0%) | 0 (0.0%) |
| 20 to 34 years | 0 (0.0%) | 0 (0.0%) |
| 35 to 50 years | 0 (0.0%) | 0 (0.0%) |
| Total | 0 (0.0%) | 0 (0.0%) |
Fertility by Education in Omena

| Educational Attainment | Women with Births | Births / 1,000 Women |
| Less than High School | 0 (0.0%) | 0.0 |
| High School Diploma | 0 (0.0%) | 0.0 |
| College or Associate's Degree | 0 (0.0%) | 0.0 |
| Bachelor's Degree | 0 (0.0%) | 0.0 |
| Graduate Degree | 0 (0.0%) | 0.0 |
| Total | 0 (0.0%) | 0.0 |
Fertility by Education by Marriage Status in Omena
| Educational Attainment | Married | Unmarried |
| Less than High School | 0 (0.0%) | 0 (0.0%) |
| High School Diploma | 0 (0.0%) | 0 (0.0%) |
| College or Associate's Degree | 0 (0.0%) | 0 (0.0%) |
| Bachelor's Degree | 0 (0.0%) | 0 (0.0%) |
| Graduate Degree | 0 (0.0%) | 0 (0.0%) |
| Total | 0 (0.0%) | 0 (0.0%) |
Income in Omena
Income Overview in Omena
Per Capita Income in Omena is $45,262, while median incomes of families and households are $115,655 and $95,750 respectively.
| Characteristic | Number | Measure |
| Per Capita Income | 250 | $45,262 |
| Median Family Income | 97 | $115,655 |
| Mean Family Income | 97 | $100,078 |
| Median Household Income | 115 | $95,750 |
| Mean Household Income | 115 | $91,378 |
| Income Deficit | 97 | $0 |
| Wage / Income Gap (%) | 250 | 7.64% |
| Wage / Income Gap ($) | 250 | 92.36¢ per $1 |
| Gini / Inequality Index | 250 | 0.30 |
Earnings by Sex in Omena
Average Earnings in Omena are $54,444, $52,778 for men and $57,143 for women, a difference of 7.6%.
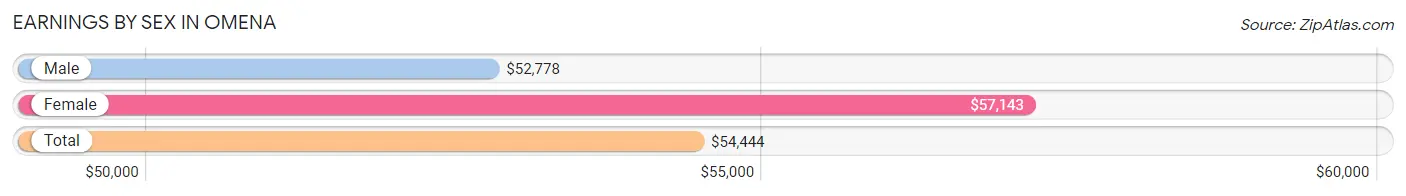
| Sex | Number | Average Earnings |
| Male | 24 (46.2%) | $52,778 |
| Female | 28 (53.8%) | $57,143 |
| Total | 52 (100.0%) | $54,444 |
Earnings by Sex by Income Bracket in Omena
The most common earnings brackets in Omena are $50,000 to $54,999 for men (9 | 37.5%) and $55,000 to $64,999 for women (15 | 53.6%).
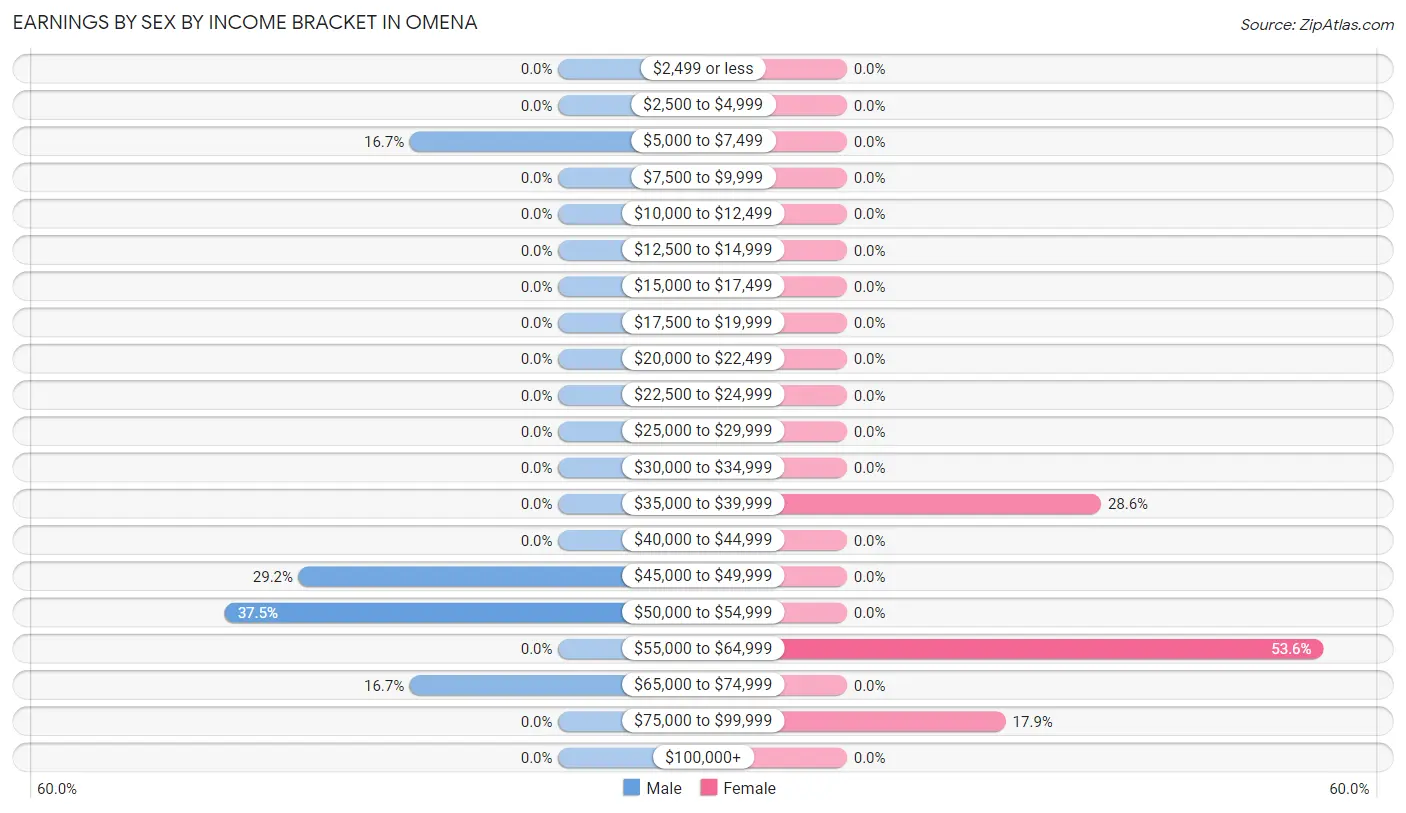
| Income | Male | Female |
| $2,499 or less | 0 (0.0%) | 0 (0.0%) |
| $2,500 to $4,999 | 0 (0.0%) | 0 (0.0%) |
| $5,000 to $7,499 | 4 (16.7%) | 0 (0.0%) |
| $7,500 to $9,999 | 0 (0.0%) | 0 (0.0%) |
| $10,000 to $12,499 | 0 (0.0%) | 0 (0.0%) |
| $12,500 to $14,999 | 0 (0.0%) | 0 (0.0%) |
| $15,000 to $17,499 | 0 (0.0%) | 0 (0.0%) |
| $17,500 to $19,999 | 0 (0.0%) | 0 (0.0%) |
| $20,000 to $22,499 | 0 (0.0%) | 0 (0.0%) |
| $22,500 to $24,999 | 0 (0.0%) | 0 (0.0%) |
| $25,000 to $29,999 | 0 (0.0%) | 0 (0.0%) |
| $30,000 to $34,999 | 0 (0.0%) | 0 (0.0%) |
| $35,000 to $39,999 | 0 (0.0%) | 8 (28.6%) |
| $40,000 to $44,999 | 0 (0.0%) | 0 (0.0%) |
| $45,000 to $49,999 | 7 (29.2%) | 0 (0.0%) |
| $50,000 to $54,999 | 9 (37.5%) | 0 (0.0%) |
| $55,000 to $64,999 | 0 (0.0%) | 15 (53.6%) |
| $65,000 to $74,999 | 4 (16.7%) | 0 (0.0%) |
| $75,000 to $99,999 | 0 (0.0%) | 5 (17.9%) |
| $100,000+ | 0 (0.0%) | 0 (0.0%) |
| Total | 24 (100.0%) | 28 (100.0%) |
Earnings by Sex by Educational Attainment in Omena
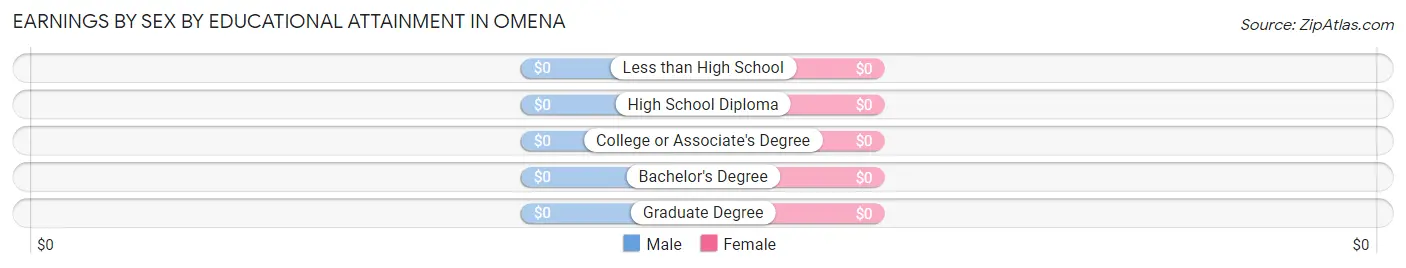
| Educational Attainment | Male Income | Female Income |
| Less than High School | - | - |
| High School Diploma | - | - |
| College or Associate's Degree | - | - |
| Bachelor's Degree | - | - |
| Graduate Degree | - | - |
| Total | $52,778 | $57,143 |
Family Income in Omena
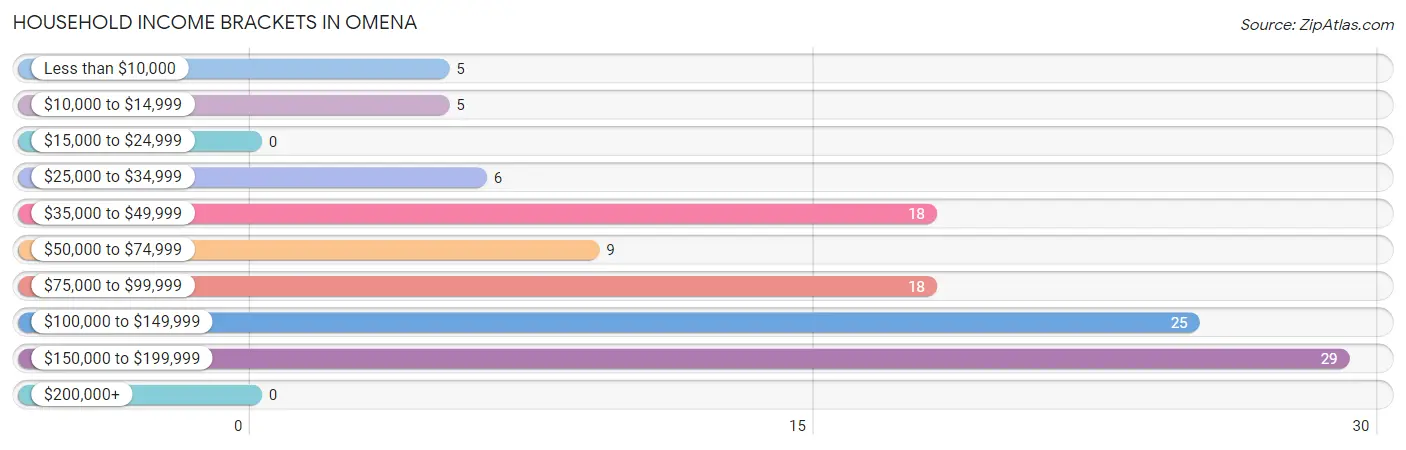
Family Income Brackets in Omena
According to the Omena family income data, there are 29 families falling into the $150,000 to $199,999 income range, which is the most common income bracket and makes up 29.9% of all families.
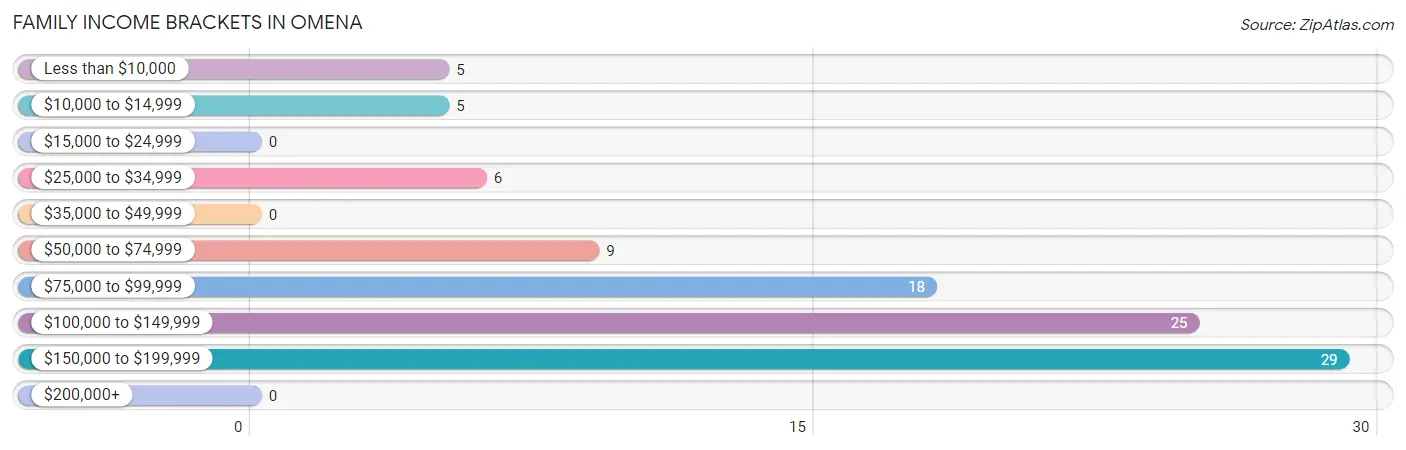
| Income Bracket | # Families | % Families |
| Less than $10,000 | 5 | 5.2% |
| $10,000 to $14,999 | 5 | 5.2% |
| $15,000 to $24,999 | 0 | 0.0% |
| $25,000 to $34,999 | 6 | 6.2% |
| $35,000 to $49,999 | 0 | 0.0% |
| $50,000 to $74,999 | 9 | 9.3% |
| $75,000 to $99,999 | 18 | 18.6% |
| $100,000 to $149,999 | 25 | 25.8% |
| $150,000 to $199,999 | 29 | 29.9% |
| $200,000+ | 0 | 0.0% |
Family Income by Famaliy Size in Omena
2-person families (86 | 88.7%) account for the highest median family income in Omena with $106,250 per family, while 2-person families (86 | 88.7%) have the highest median income of $53,125 per family member.
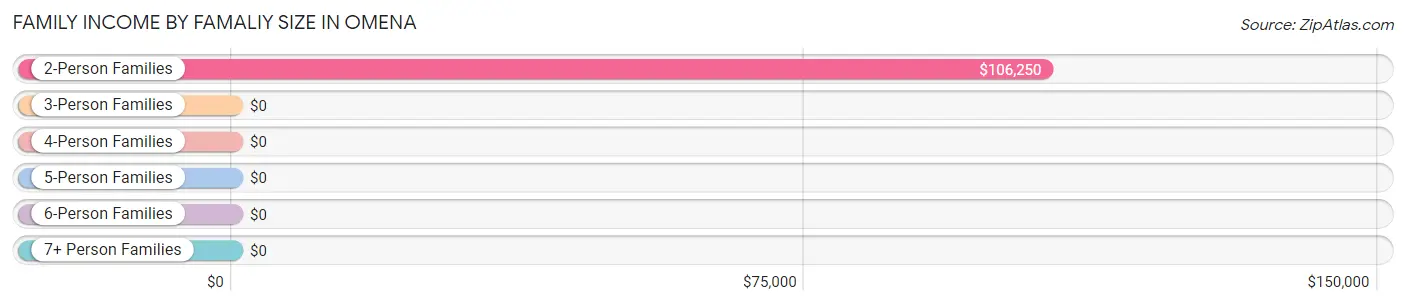
| Income Bracket | # Families | Median Income |
| 2-Person Families | 86 (88.7%) | $106,250 |
| 3-Person Families | 0 (0.0%) | $0 |
| 4-Person Families | 11 (11.3%) | $0 |
| 5-Person Families | 0 (0.0%) | $0 |
| 6-Person Families | 0 (0.0%) | $0 |
| 7+ Person Families | 0 (0.0%) | $0 |
| Total | 97 (100.0%) | $115,655 |
Family Income by Number of Earners in Omena
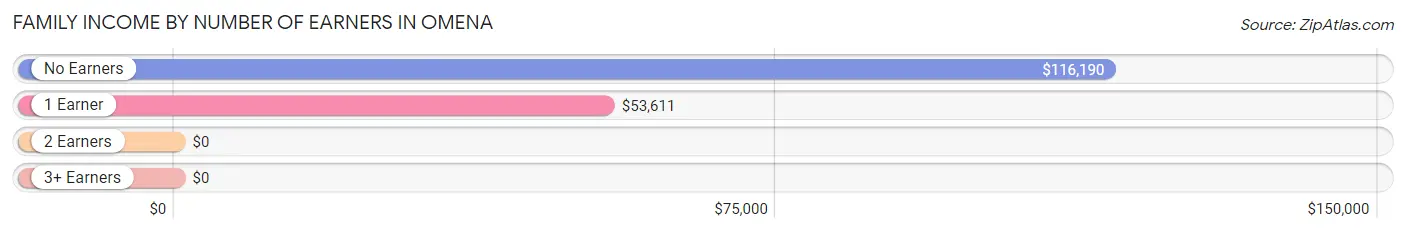
| Number of Earners | # Families | Median Income |
| No Earners | 66 (68.0%) | $116,190 |
| 1 Earner | 20 (20.6%) | $53,611 |
| 2 Earners | 4 (4.1%) | $0 |
| 3+ Earners | 7 (7.2%) | $0 |
| Total | 97 (100.0%) | $115,655 |
Household Income in Omena
Household Income Brackets in Omena
With 29 households falling in the category, the $150,000 to $199,999 income range is the most frequent in Omena, accounting for 25.2% of all households.
| Income Bracket | # Households | % Households |
| Less than $10,000 | 5 | 4.3% |
| $10,000 to $14,999 | 5 | 4.3% |
| $15,000 to $24,999 | 0 | 0.0% |
| $25,000 to $34,999 | 6 | 5.2% |
| $35,000 to $49,999 | 18 | 15.7% |
| $50,000 to $74,999 | 9 | 7.8% |
| $75,000 to $99,999 | 18 | 15.7% |
| $100,000 to $149,999 | 25 | 21.7% |
| $150,000 to $199,999 | 29 | 25.2% |
| $200,000+ | 0 | 0.0% |
Household Income by Householder Age in Omena
The median household income in Omena is $95,750, with the highest median household income of $96,750 found in the 65+ years age bracket for the primary householder. A total of 89 households (77.4%) fall into this category.
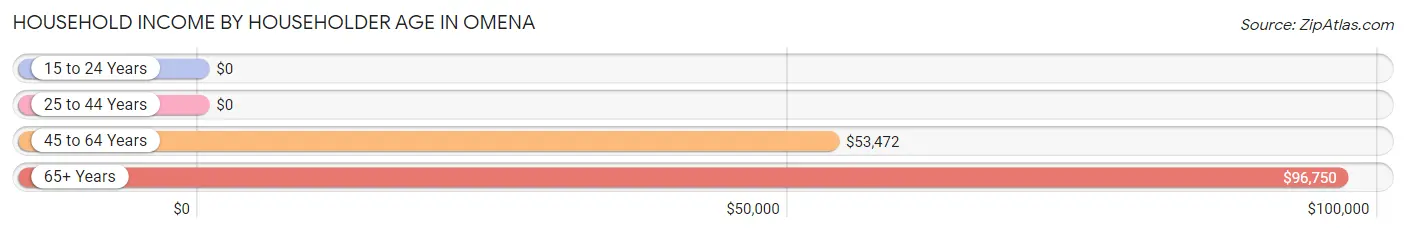
| Income Bracket | # Households | Median Income |
| 15 to 24 Years | 0 (0.0%) | $0 |
| 25 to 44 Years | 7 (6.1%) | $0 |
| 45 to 64 Years | 19 (16.5%) | $53,472 |
| 65+ Years | 89 (77.4%) | $96,750 |
| Total | 115 (100.0%) | $95,750 |
Poverty in Omena
Income Below Poverty by Sex and Age in Omena
With 9.4% poverty level for males and 10.4% for females among the residents of Omena, 75 year old and over males and 75 year old and over females are the most vulnerable to poverty, with 10 males (21.3%) and 15 females (53.6%) in their respective age groups living below the poverty level.
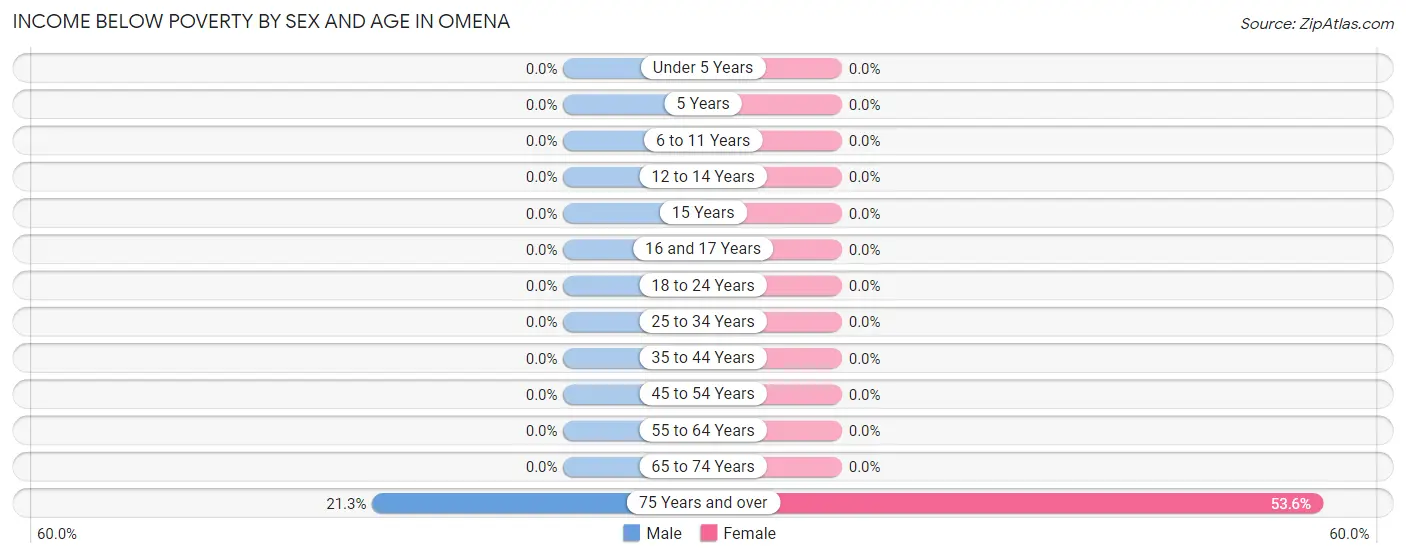
| Age Bracket | Male | Female |
| Under 5 Years | 0 (0.0%) | 0 (0.0%) |
| 5 Years | 0 (0.0%) | 0 (0.0%) |
| 6 to 11 Years | 0 (0.0%) | 0 (0.0%) |
| 12 to 14 Years | 0 (0.0%) | 0 (0.0%) |
| 15 Years | 0 (0.0%) | 0 (0.0%) |
| 16 and 17 Years | 0 (0.0%) | 0 (0.0%) |
| 18 to 24 Years | 0 (0.0%) | 0 (0.0%) |
| 25 to 34 Years | 0 (0.0%) | 0 (0.0%) |
| 35 to 44 Years | 0 (0.0%) | 0 (0.0%) |
| 45 to 54 Years | 0 (0.0%) | 0 (0.0%) |
| 55 to 64 Years | 0 (0.0%) | 0 (0.0%) |
| 65 to 74 Years | 0 (0.0%) | 0 (0.0%) |
| 75 Years and over | 10 (21.3%) | 15 (53.6%) |
| Total | 10 (9.4%) | 15 (10.4%) |
Income Above Poverty by Sex and Age in Omena
According to the poverty statistics in Omena, males aged 25 to 34 years and females aged under 5 years are the age groups that are most secure financially, with 100.0% of males and 100.0% of females in these age groups living above the poverty line.
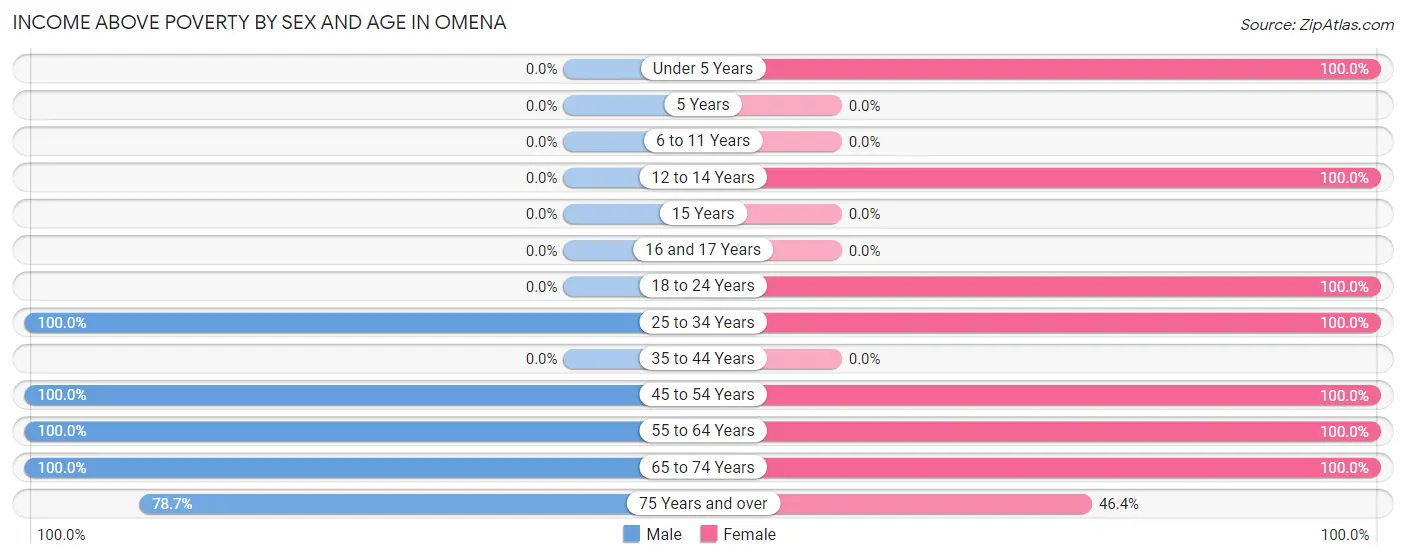
| Age Bracket | Male | Female |
| Under 5 Years | 0 (0.0%) | 8 (100.0%) |
| 5 Years | 0 (0.0%) | 0 (0.0%) |
| 6 to 11 Years | 0 (0.0%) | 0 (0.0%) |
| 12 to 14 Years | 0 (0.0%) | 5 (100.0%) |
| 15 Years | 0 (0.0%) | 0 (0.0%) |
| 16 and 17 Years | 0 (0.0%) | 0 (0.0%) |
| 18 to 24 Years | 0 (0.0%) | 5 (100.0%) |
| 25 to 34 Years | 7 (100.0%) | 8 (100.0%) |
| 35 to 44 Years | 0 (0.0%) | 0 (0.0%) |
| 45 to 54 Years | 13 (100.0%) | 7 (100.0%) |
| 55 to 64 Years | 4 (100.0%) | 38 (100.0%) |
| 65 to 74 Years | 35 (100.0%) | 45 (100.0%) |
| 75 Years and over | 37 (78.7%) | 13 (46.4%) |
| Total | 96 (90.6%) | 129 (89.6%) |
Income Below Poverty Among Married-Couple Families in Omena
The poverty statistics for married-couple families in Omena show that 11.4% or 10 of the total 88 families live below the poverty line. Families with no children have the highest poverty rate of 13.0%, comprising of 10 families. On the other hand, families with 1 or 2 children have the lowest poverty rate of 0.0%, which includes 0 families.
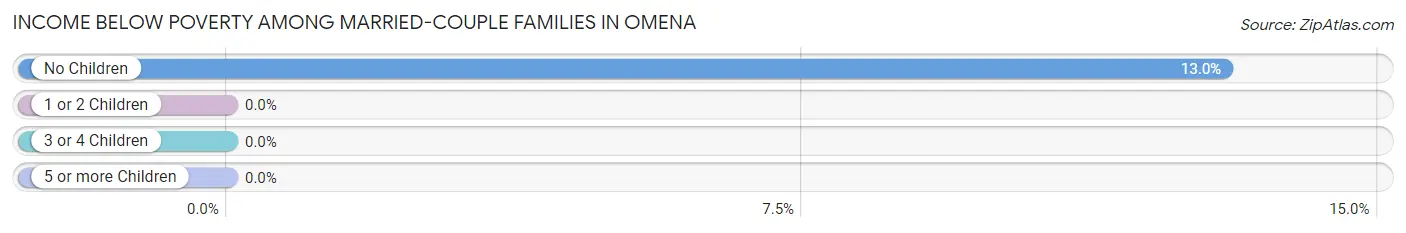
| Children | Above Poverty | Below Poverty |
| No Children | 67 (87.0%) | 10 (13.0%) |
| 1 or 2 Children | 11 (100.0%) | 0 (0.0%) |
| 3 or 4 Children | 0 (0.0%) | 0 (0.0%) |
| 5 or more Children | 0 (0.0%) | 0 (0.0%) |
| Total | 78 (88.6%) | 10 (11.4%) |
Income Below Poverty Among Single-Parent Households in Omena
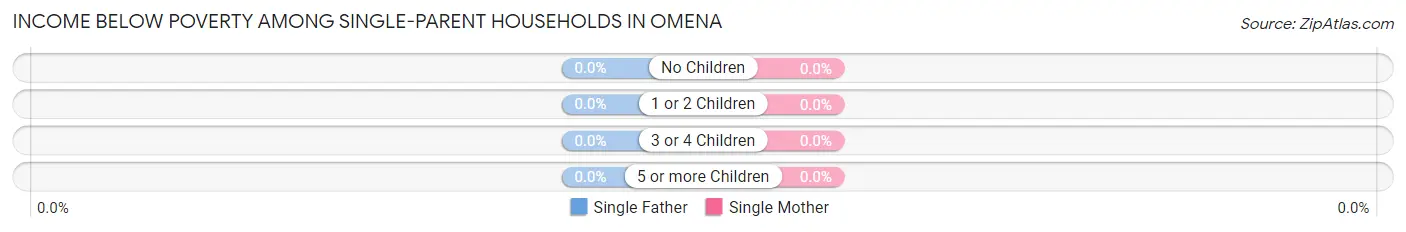
| Children | Single Father | Single Mother |
| No Children | 0 (0.0%) | 0 (0.0%) |
| 1 or 2 Children | 0 (0.0%) | 0 (0.0%) |
| 3 or 4 Children | 0 (0.0%) | 0 (0.0%) |
| 5 or more Children | 0 (0.0%) | 0 (0.0%) |
| Total | 0 (0.0%) | 0 (0.0%) |
Income Below Poverty Among Married-Couple vs Single-Parent Households in Omena
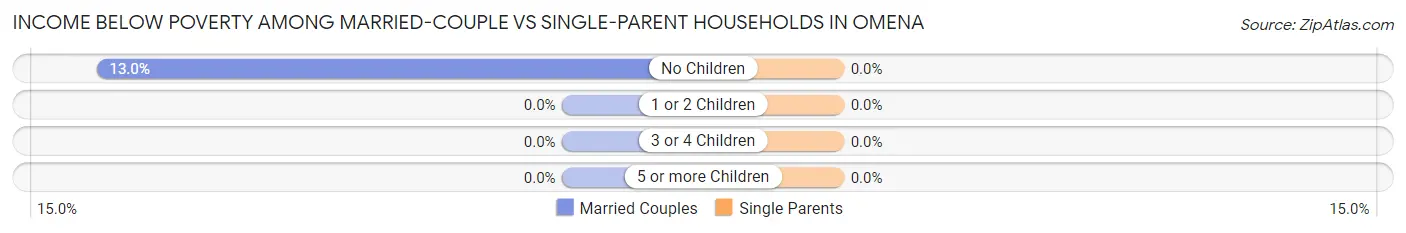
| Children | Married-Couple Families | Single-Parent Households |
| No Children | 10 (13.0%) | 0 (0.0%) |
| 1 or 2 Children | 0 (0.0%) | 0 (0.0%) |
| 3 or 4 Children | 0 (0.0%) | 0 (0.0%) |
| 5 or more Children | 0 (0.0%) | 0 (0.0%) |
| Total | 10 (11.4%) | 0 (0.0%) |
Employment Characteristics in Omena
Employment by Class of Employer in Omena
Among the 52 employed individuals in Omena, private company employees (33 | 63.5%), local government employees (8 | 15.4%), and federal government employees (7 | 13.5%) make up the most common classes of employment.
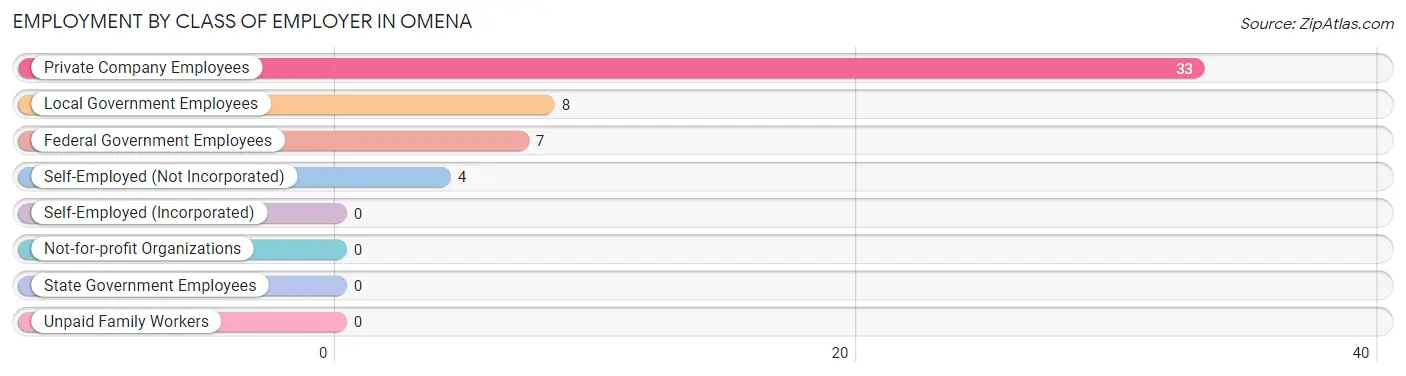
| Employer Class | # Employees | % Employees |
| Private Company Employees | 33 | 63.5% |
| Self-Employed (Incorporated) | 0 | 0.0% |
| Self-Employed (Not Incorporated) | 4 | 7.7% |
| Not-for-profit Organizations | 0 | 0.0% |
| Local Government Employees | 8 | 15.4% |
| State Government Employees | 0 | 0.0% |
| Federal Government Employees | 7 | 13.5% |
| Unpaid Family Workers | 0 | 0.0% |
| Total | 52 | 100.0% |
Employment Status by Age in Omena
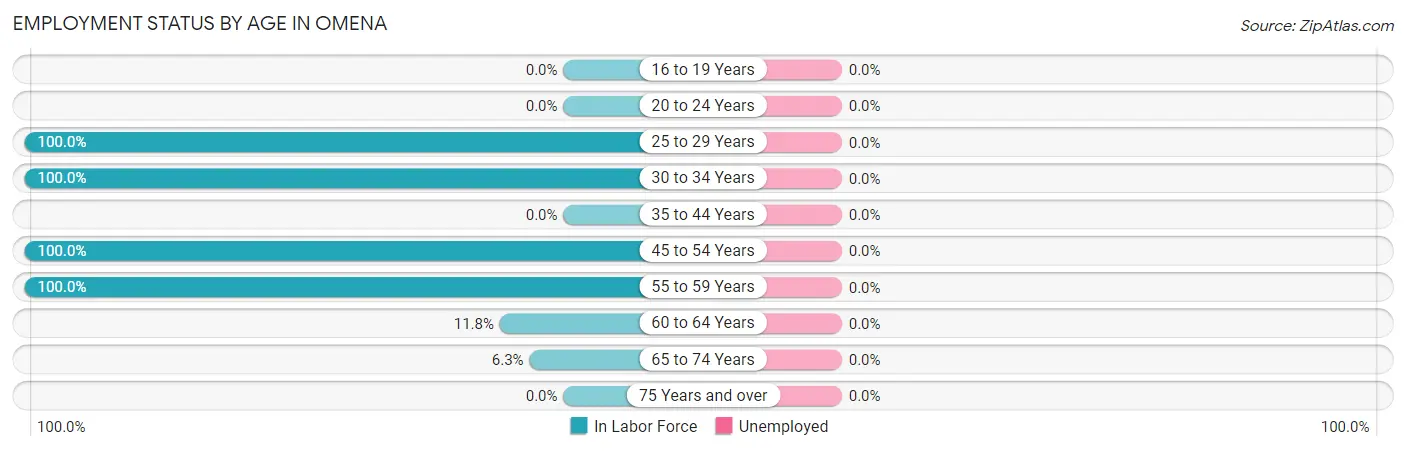
| Age Bracket | In Labor Force | Unemployed |
| 16 to 19 Years | 0 (0.0%) | 0 (0.0%) |
| 20 to 24 Years | 0 (0.0%) | 0 (0.0%) |
| 25 to 29 Years | 8 (100.0%) | 0 (0.0%) |
| 30 to 34 Years | 7 (100.0%) | 0 (0.0%) |
| 35 to 44 Years | 0 (0.0%) | 0 (0.0%) |
| 45 to 54 Years | 20 (100.0%) | 0 (0.0%) |
| 55 to 59 Years | 8 (100.0%) | 0 (0.0%) |
| 60 to 64 Years | 4 (11.8%) | 0 (0.0%) |
| 65 to 74 Years | 5 (6.3%) | 0 (0.0%) |
| 75 Years and over | 0 (0.0%) | 0 (0.0%) |
| Total | 52 (21.9%) | 0 (0.0%) |
Employment Status by Educational Attainment in Omena
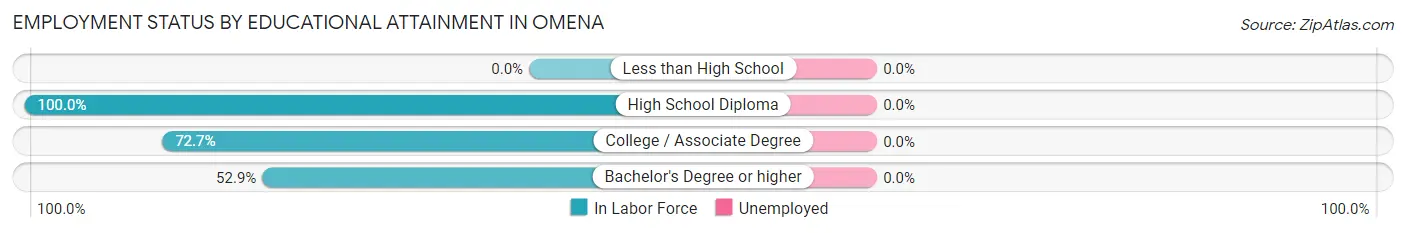
| Educational Attainment | In Labor Force | Unemployed |
| Less than High School | 0 (0.0%) | 0 (0.0%) |
| High School Diploma | 4 (100.0%) | 0 (0.0%) |
| College / Associate Degree | 16 (72.7%) | 0 (0.0%) |
| Bachelor's Degree or higher | 27 (52.9%) | 0 (0.0%) |
| Total | 47 (61.0%) | 0 (0.0%) |
Employment Occupations by Sex in Omena
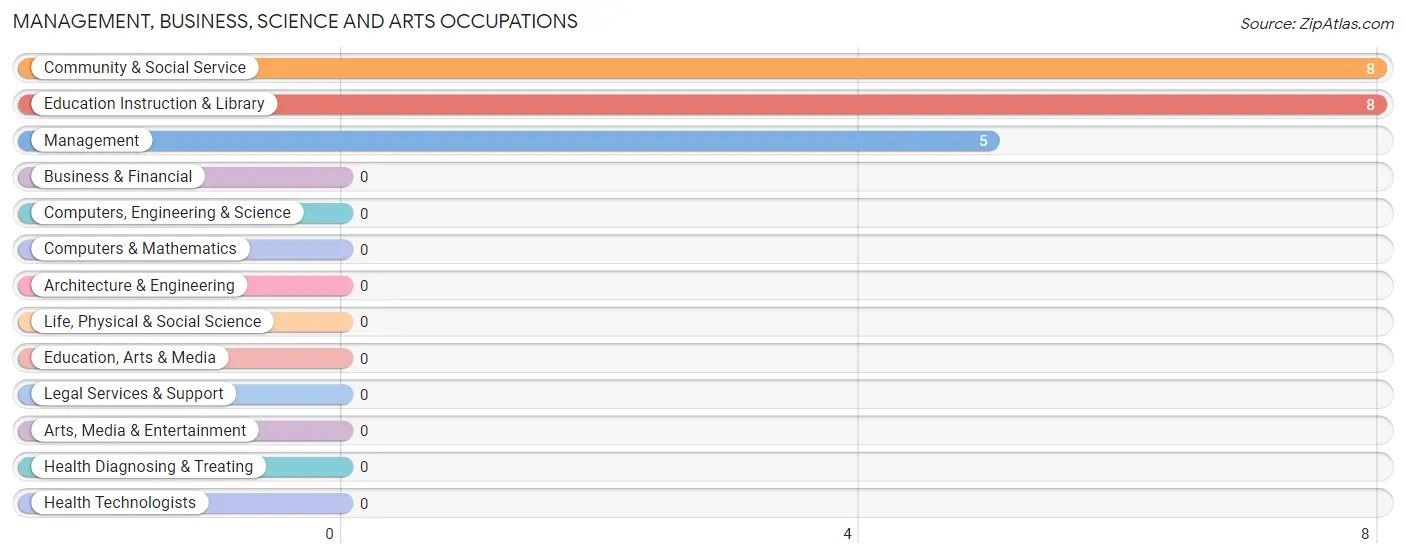
Management, Business, Science and Arts Occupations
The most common Management, Business, Science and Arts occupations in Omena are Community & Social Service (8 | 15.4%), Education Instruction & Library (8 | 15.4%), and Management (5 | 9.6%).
Management, Business, Science and Arts Occupations by Sex
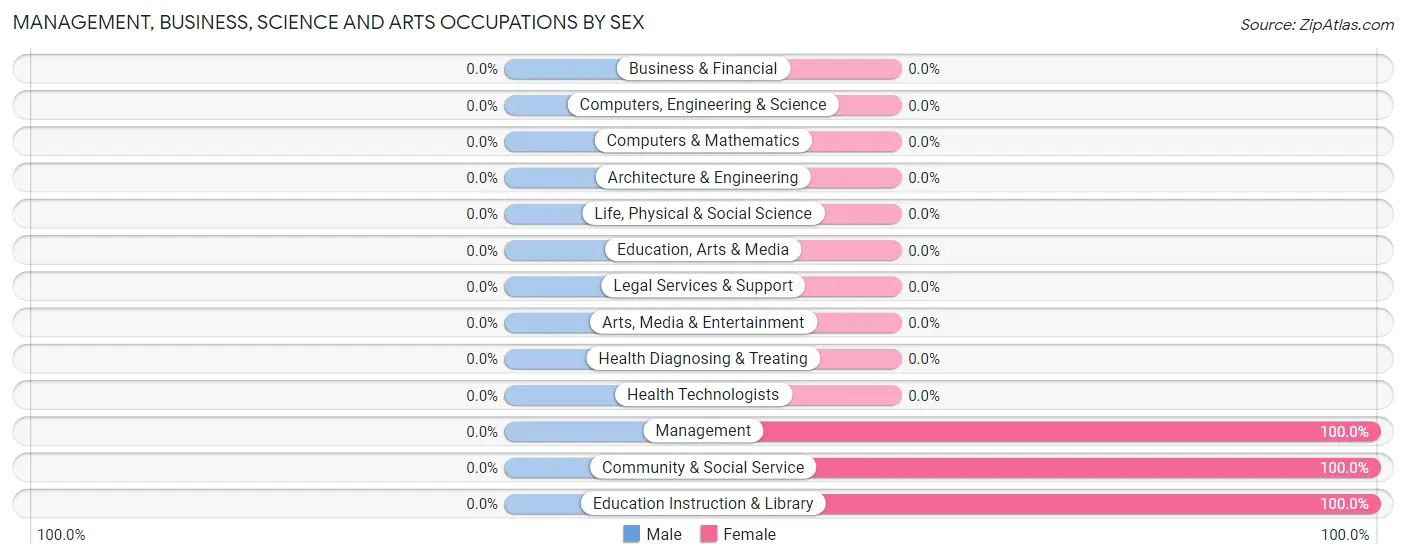
| Occupation | Male | Female |
| Management | 0 (0.0%) | 5 (100.0%) |
| Business & Financial | 0 (0.0%) | 0 (0.0%) |
| Computers, Engineering & Science | 0 (0.0%) | 0 (0.0%) |
| Computers & Mathematics | 0 (0.0%) | 0 (0.0%) |
| Architecture & Engineering | 0 (0.0%) | 0 (0.0%) |
| Life, Physical & Social Science | 0 (0.0%) | 0 (0.0%) |
| Community & Social Service | 0 (0.0%) | 8 (100.0%) |
| Education, Arts & Media | 0 (0.0%) | 0 (0.0%) |
| Legal Services & Support | 0 (0.0%) | 0 (0.0%) |
| Education Instruction & Library | 0 (0.0%) | 8 (100.0%) |
| Arts, Media & Entertainment | 0 (0.0%) | 0 (0.0%) |
| Health Diagnosing & Treating | 0 (0.0%) | 0 (0.0%) |
| Health Technologists | 0 (0.0%) | 0 (0.0%) |
| Total (Category) | 0 (0.0%) | 13 (100.0%) |
| Total (Overall) | 24 (46.2%) | 28 (53.8%) |
Services Occupations
The most common Services occupations in Omena are Security & Protection (4 | 7.7%), and Firefighting & Prevention (4 | 7.7%).
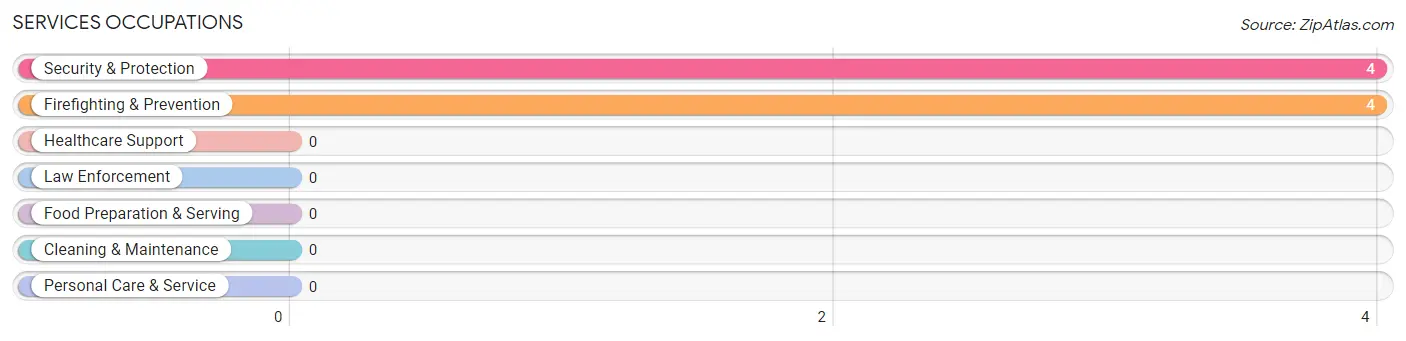
Services Occupations by Sex
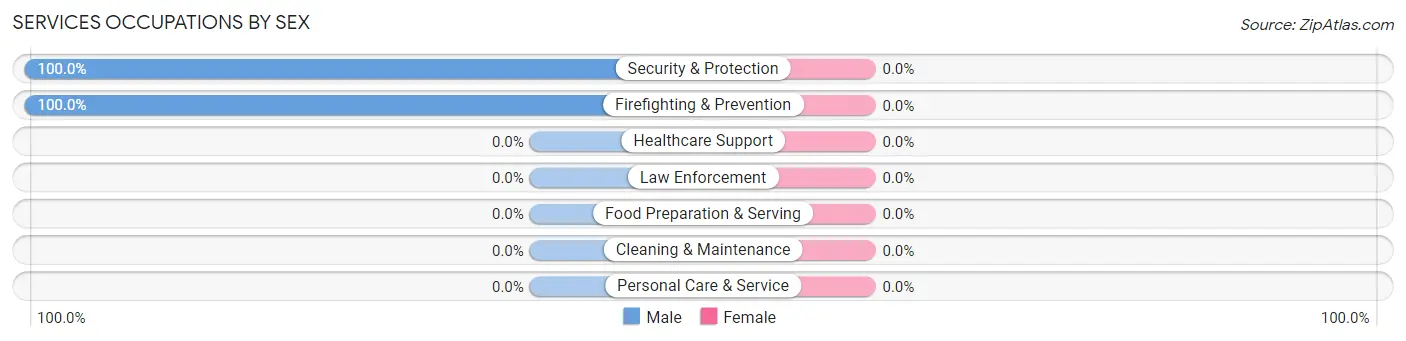
| Occupation | Male | Female |
| Healthcare Support | 0 (0.0%) | 0 (0.0%) |
| Security & Protection | 4 (100.0%) | 0 (0.0%) |
| Firefighting & Prevention | 4 (100.0%) | 0 (0.0%) |
| Law Enforcement | 0 (0.0%) | 0 (0.0%) |
| Food Preparation & Serving | 0 (0.0%) | 0 (0.0%) |
| Cleaning & Maintenance | 0 (0.0%) | 0 (0.0%) |
| Personal Care & Service | 0 (0.0%) | 0 (0.0%) |
| Total (Category) | 4 (100.0%) | 0 (0.0%) |
| Total (Overall) | 24 (46.2%) | 28 (53.8%) |
Sales and Office Occupations
The most common Sales and Office occupations in Omena are , and Office & Administration (16 | 30.8%).
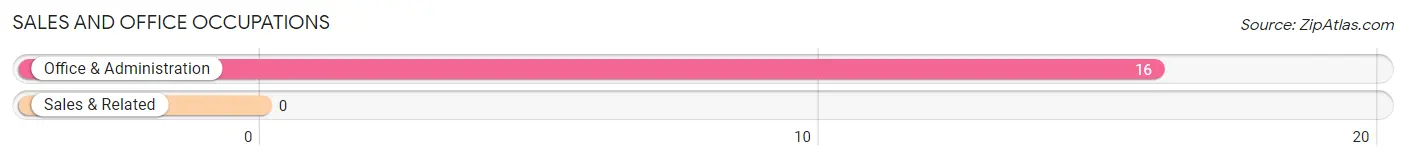
Sales and Office Occupations by Sex
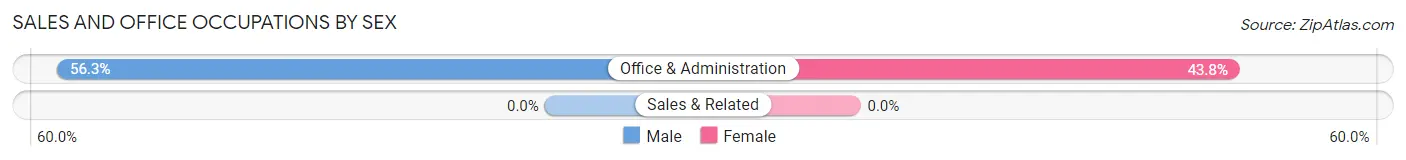
| Occupation | Male | Female |
| Sales & Related | 0 (0.0%) | 0 (0.0%) |
| Office & Administration | 9 (56.2%) | 7 (43.8%) |
| Total (Category) | 9 (56.2%) | 7 (43.8%) |
| Total (Overall) | 24 (46.2%) | 28 (53.8%) |
Natural Resources, Construction and Maintenance Occupations
The most common Natural Resources, Construction and Maintenance occupations in Omena are Installation, Maintenance & Repair (7 | 13.5%), and Farming, Fishing & Forestry (4 | 7.7%).
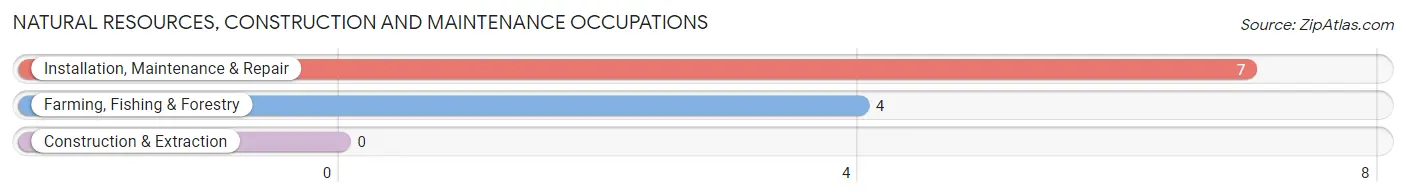
Natural Resources, Construction and Maintenance Occupations by Sex
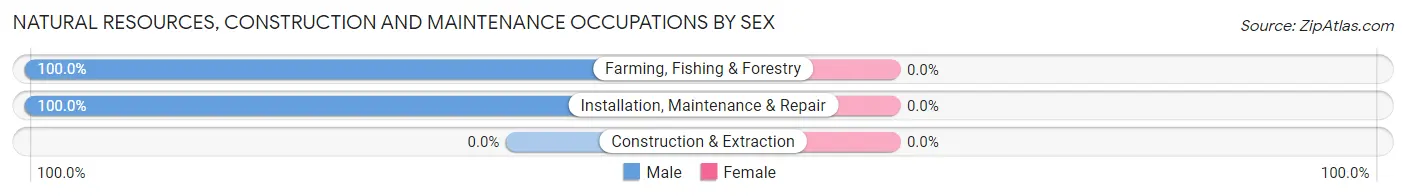
| Occupation | Male | Female |
| Farming, Fishing & Forestry | 4 (100.0%) | 0 (0.0%) |
| Construction & Extraction | 0 (0.0%) | 0 (0.0%) |
| Installation, Maintenance & Repair | 7 (100.0%) | 0 (0.0%) |
| Total (Category) | 11 (100.0%) | 0 (0.0%) |
| Total (Overall) | 24 (46.2%) | 28 (53.8%) |
Production, Transportation and Moving Occupations
The most common Production, Transportation and Moving occupations in Omena are , and Production (8 | 15.4%).
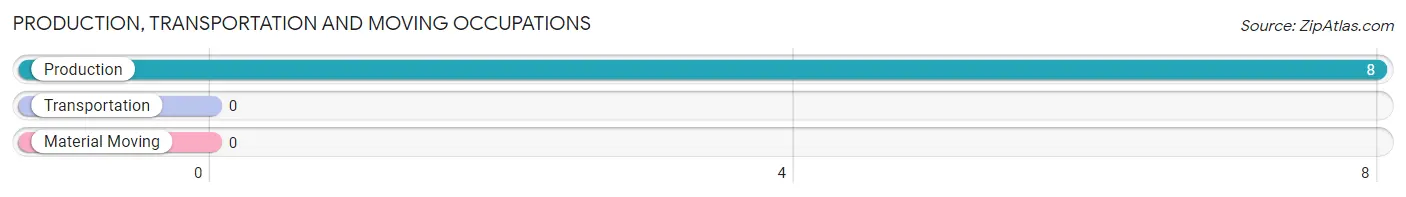
Production, Transportation and Moving Occupations by Sex
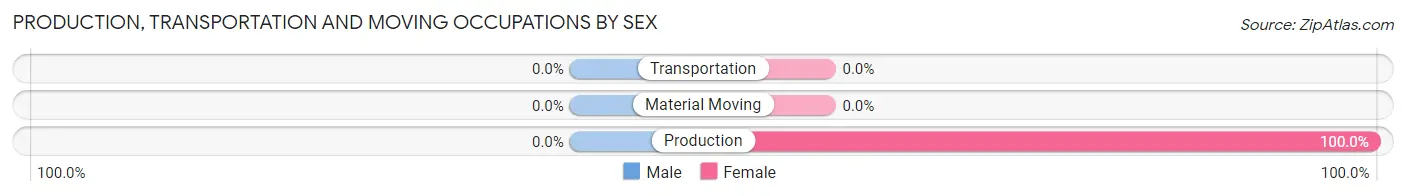
| Occupation | Male | Female |
| Production | 0 (0.0%) | 8 (100.0%) |
| Transportation | 0 (0.0%) | 0 (0.0%) |
| Material Moving | 0 (0.0%) | 0 (0.0%) |
| Total (Category) | 0 (0.0%) | 8 (100.0%) |
| Total (Overall) | 24 (46.2%) | 28 (53.8%) |
Employment Industries by Sex in Omena
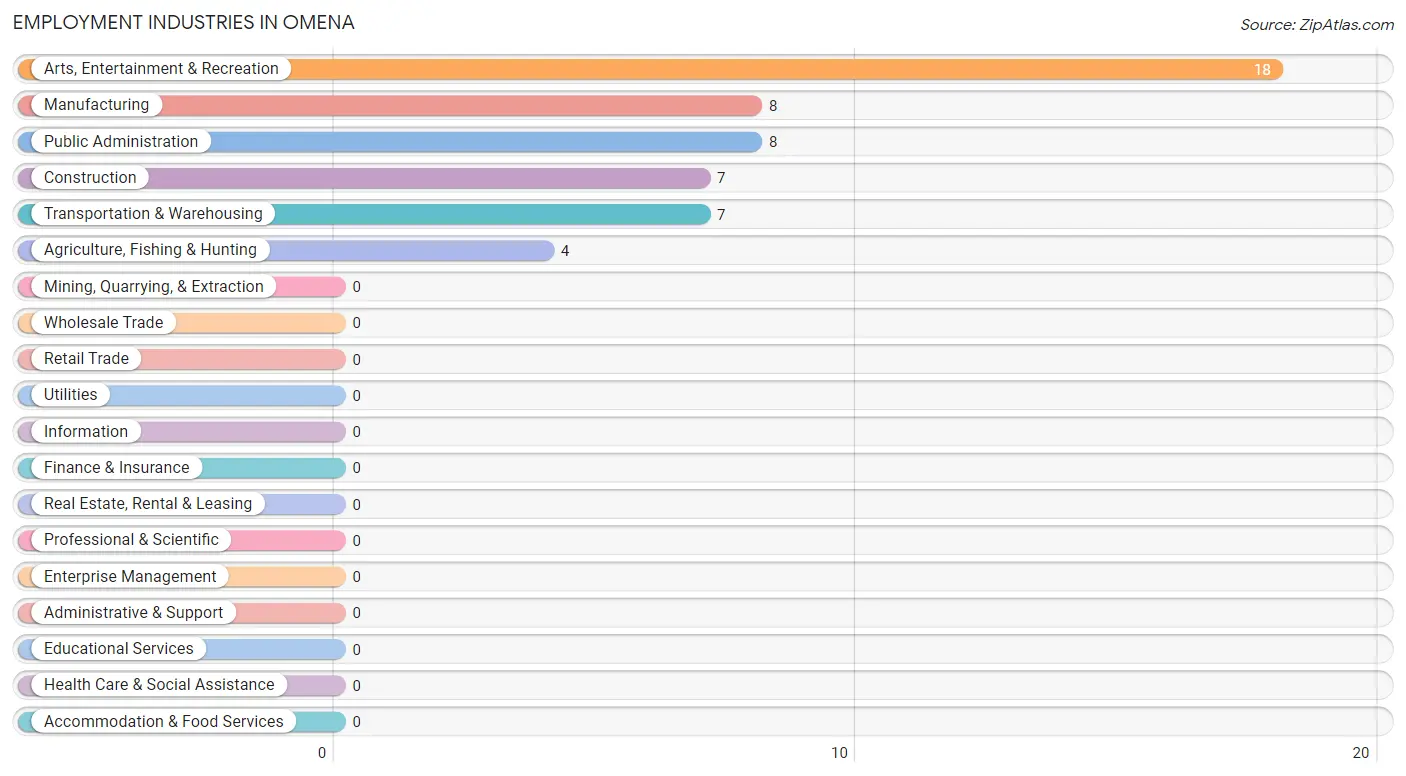
Employment Industries in Omena
The major employment industries in Omena include Arts, Entertainment & Recreation (18 | 34.6%), Manufacturing (8 | 15.4%), Public Administration (8 | 15.4%), Construction (7 | 13.5%), and Transportation & Warehousing (7 | 13.5%).
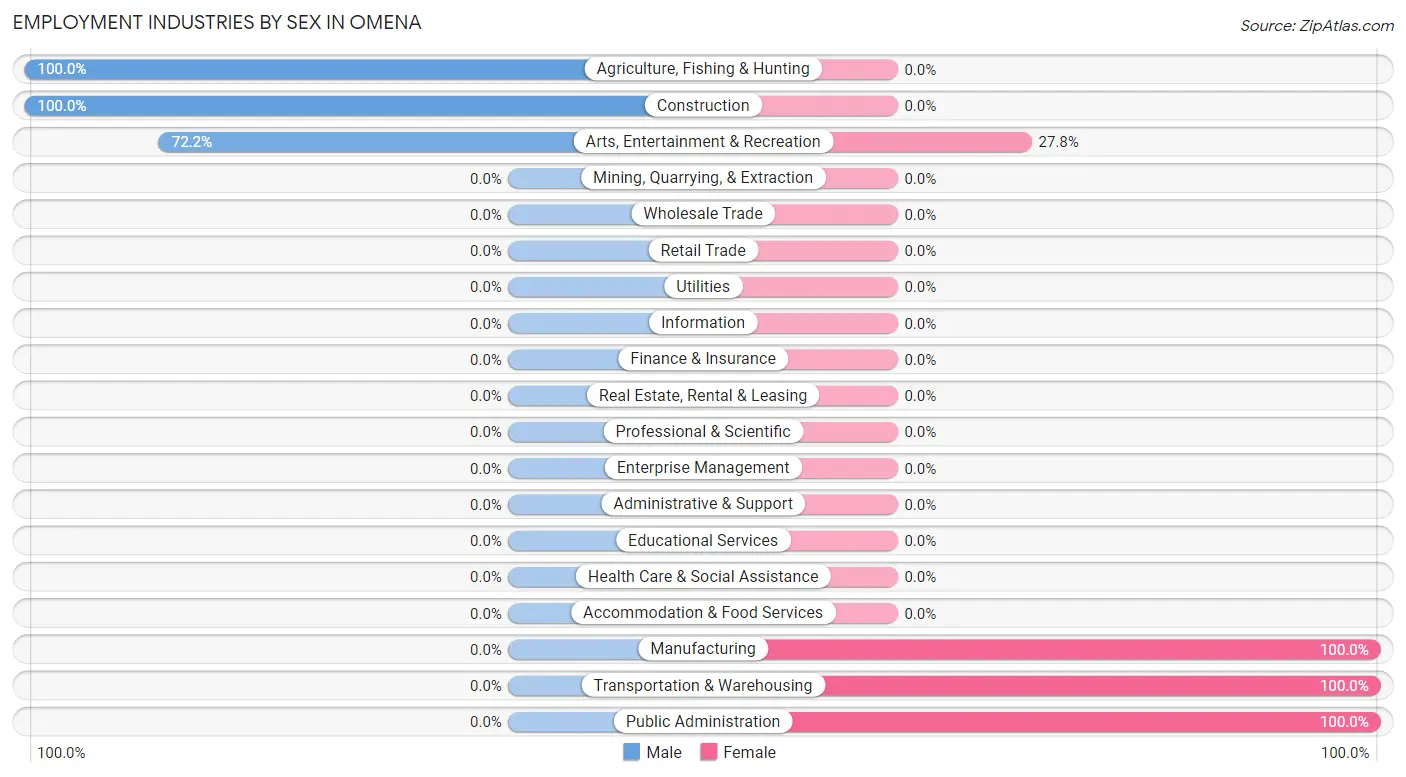
Employment Industries by Sex in Omena
The Omena industries that see more men than women are Agriculture, Fishing & Hunting (100.0%), Construction (100.0%), and Arts, Entertainment & Recreation (72.2%), whereas the industries that tend to have a higher number of women are Manufacturing (100.0%), Transportation & Warehousing (100.0%), and Public Administration (100.0%).
| Industry | Male | Female |
| Agriculture, Fishing & Hunting | 4 (100.0%) | 0 (0.0%) |
| Mining, Quarrying, & Extraction | 0 (0.0%) | 0 (0.0%) |
| Construction | 7 (100.0%) | 0 (0.0%) |
| Manufacturing | 0 (0.0%) | 8 (100.0%) |
| Wholesale Trade | 0 (0.0%) | 0 (0.0%) |
| Retail Trade | 0 (0.0%) | 0 (0.0%) |
| Transportation & Warehousing | 0 (0.0%) | 7 (100.0%) |
| Utilities | 0 (0.0%) | 0 (0.0%) |
| Information | 0 (0.0%) | 0 (0.0%) |
| Finance & Insurance | 0 (0.0%) | 0 (0.0%) |
| Real Estate, Rental & Leasing | 0 (0.0%) | 0 (0.0%) |
| Professional & Scientific | 0 (0.0%) | 0 (0.0%) |
| Enterprise Management | 0 (0.0%) | 0 (0.0%) |
| Administrative & Support | 0 (0.0%) | 0 (0.0%) |
| Educational Services | 0 (0.0%) | 0 (0.0%) |
| Health Care & Social Assistance | 0 (0.0%) | 0 (0.0%) |
| Arts, Entertainment & Recreation | 13 (72.2%) | 5 (27.8%) |
| Accommodation & Food Services | 0 (0.0%) | 0 (0.0%) |
| Public Administration | 0 (0.0%) | 8 (100.0%) |
| Total | 24 (46.2%) | 28 (53.8%) |
Education in Omena
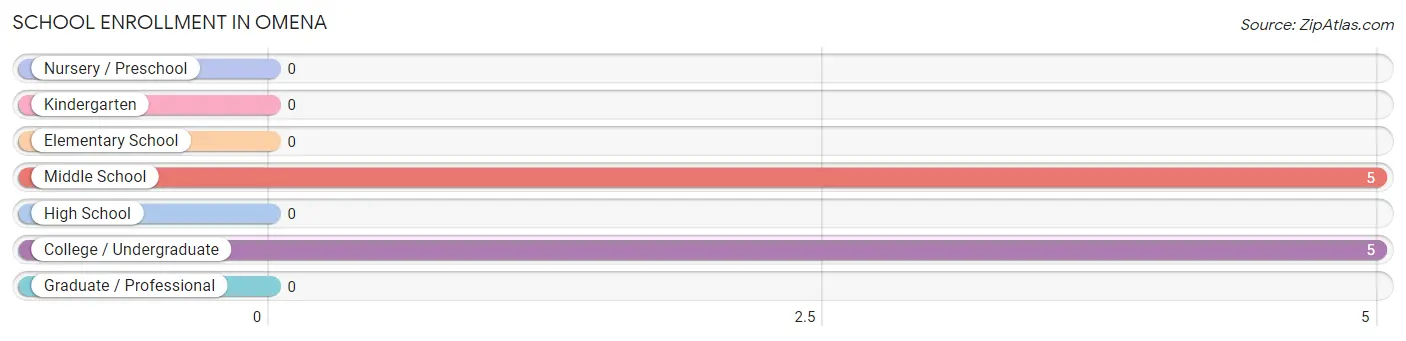
School Enrollment in Omena
The most common levels of schooling among the 10 students in Omena are middle school (5 | 50.0%), and college / undergraduate (5 | 50.0%).
| School Level | # Students | % Students |
| Nursery / Preschool | 0 | 0.0% |
| Kindergarten | 0 | 0.0% |
| Elementary School | 0 | 0.0% |
| Middle School | 5 | 50.0% |
| High School | 0 | 0.0% |
| College / Undergraduate | 5 | 50.0% |
| Graduate / Professional | 0 | 0.0% |
| Total | 10 | 100.0% |
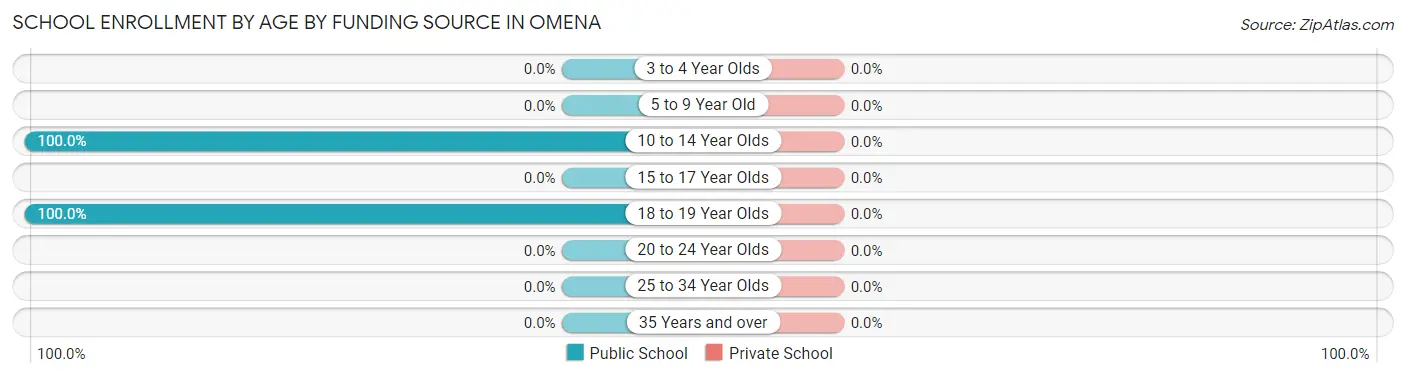
School Enrollment by Age by Funding Source in Omena
| Age Bracket | Public School | Private School |
| 3 to 4 Year Olds | 0 (0.0%) | 0 (0.0%) |
| 5 to 9 Year Old | 0 (0.0%) | 0 (0.0%) |
| 10 to 14 Year Olds | 5 (100.0%) | 0 (0.0%) |
| 15 to 17 Year Olds | 0 (0.0%) | 0 (0.0%) |
| 18 to 19 Year Olds | 5 (100.0%) | 0 (0.0%) |
| 20 to 24 Year Olds | 0 (0.0%) | 0 (0.0%) |
| 25 to 34 Year Olds | 0 (0.0%) | 0 (0.0%) |
| 35 Years and over | 0 (0.0%) | 0 (0.0%) |
| Total | 10 (100.0%) | 0 (0.0%) |
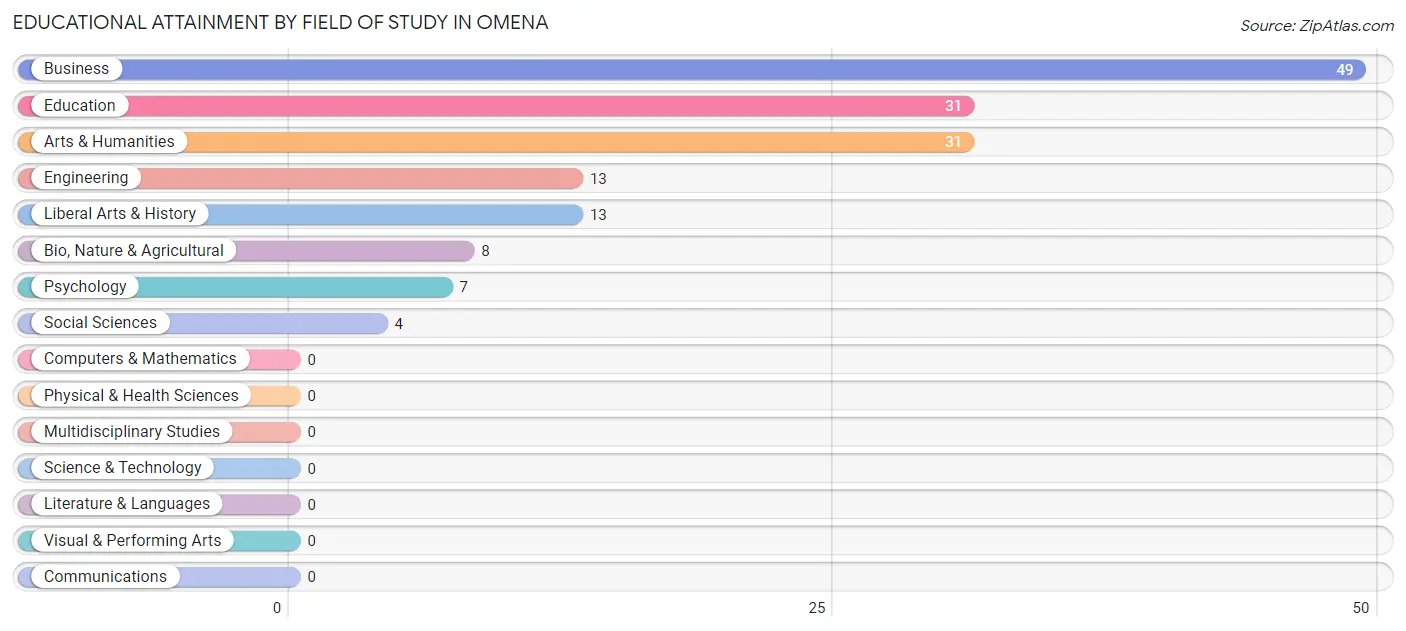
Educational Attainment by Field of Study in Omena
Business (49 | 31.4%), education (31 | 19.9%), arts & humanities (31 | 19.9%), engineering (13 | 8.3%), and liberal arts & history (13 | 8.3%) are the most common fields of study among 156 individuals in Omena who have obtained a bachelor's degree or higher.
| Field of Study | # Graduates | % Graduates |
| Computers & Mathematics | 0 | 0.0% |
| Bio, Nature & Agricultural | 8 | 5.1% |
| Physical & Health Sciences | 0 | 0.0% |
| Psychology | 7 | 4.5% |
| Social Sciences | 4 | 2.6% |
| Engineering | 13 | 8.3% |
| Multidisciplinary Studies | 0 | 0.0% |
| Science & Technology | 0 | 0.0% |
| Business | 49 | 31.4% |
| Education | 31 | 19.9% |
| Literature & Languages | 0 | 0.0% |
| Liberal Arts & History | 13 | 8.3% |
| Visual & Performing Arts | 0 | 0.0% |
| Communications | 0 | 0.0% |
| Arts & Humanities | 31 | 19.9% |
| Total | 156 | 100.0% |
Transportation & Commute in Omena
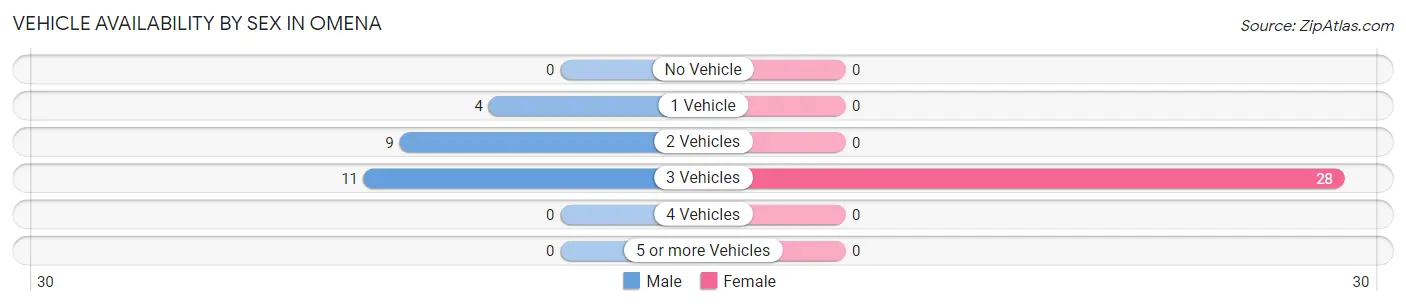
Vehicle Availability by Sex in Omena
The most prevalent vehicle ownership categories in Omena are males with 3 vehicles (11, accounting for 45.8%) and females with 3 vehicles (28, making up 39.3%).
| Vehicles Available | Male | Female |
| No Vehicle | 0 (0.0%) | 0 (0.0%) |
| 1 Vehicle | 4 (16.7%) | 0 (0.0%) |
| 2 Vehicles | 9 (37.5%) | 0 (0.0%) |
| 3 Vehicles | 11 (45.8%) | 28 (100.0%) |
| 4 Vehicles | 0 (0.0%) | 0 (0.0%) |
| 5 or more Vehicles | 0 (0.0%) | 0 (0.0%) |
| Total | 24 (100.0%) | 28 (100.0%) |
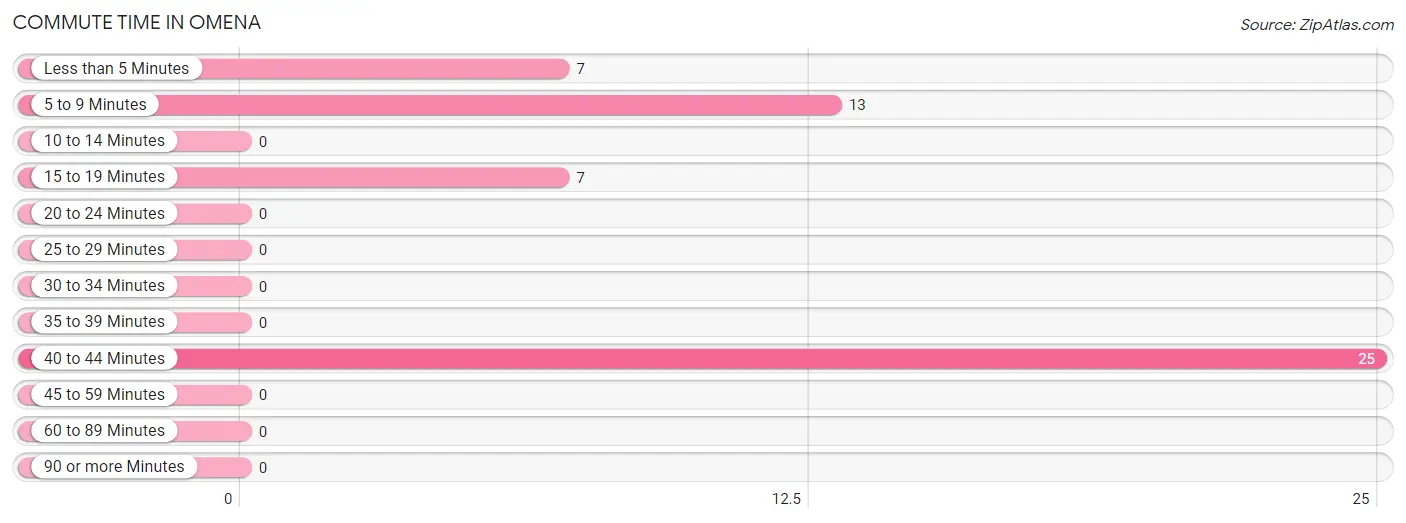
Commute Time in Omena
The most frequently occuring commute durations in Omena are 40 to 44 minutes (25 commuters, 48.1%), 5 to 9 minutes (13 commuters, 25.0%), and less than 5 minutes (7 commuters, 13.5%).
| Commute Time | # Commuters | % Commuters |
| Less than 5 Minutes | 7 | 13.5% |
| 5 to 9 Minutes | 13 | 25.0% |
| 10 to 14 Minutes | 0 | 0.0% |
| 15 to 19 Minutes | 7 | 13.5% |
| 20 to 24 Minutes | 0 | 0.0% |
| 25 to 29 Minutes | 0 | 0.0% |
| 30 to 34 Minutes | 0 | 0.0% |
| 35 to 39 Minutes | 0 | 0.0% |
| 40 to 44 Minutes | 25 | 48.1% |
| 45 to 59 Minutes | 0 | 0.0% |
| 60 to 89 Minutes | 0 | 0.0% |
| 90 or more Minutes | 0 | 0.0% |
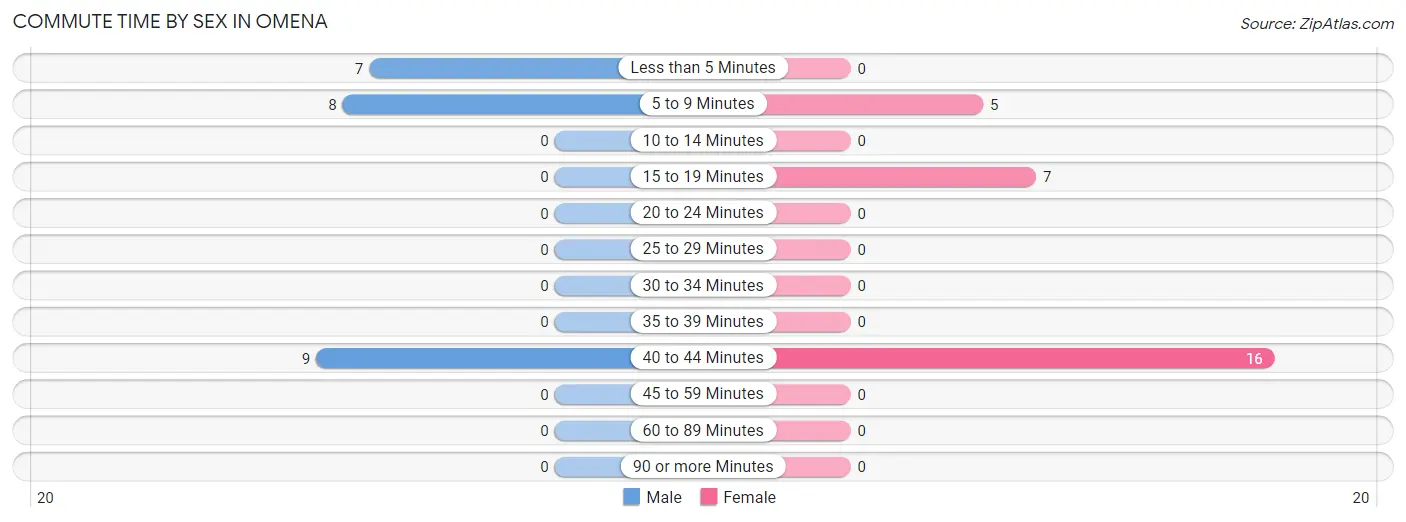
Commute Time by Sex in Omena
The most common commute times in Omena are 40 to 44 minutes (9 commuters, 37.5%) for males and 40 to 44 minutes (16 commuters, 57.1%) for females.
| Commute Time | Male | Female |
| Less than 5 Minutes | 7 (29.2%) | 0 (0.0%) |
| 5 to 9 Minutes | 8 (33.3%) | 5 (17.9%) |
| 10 to 14 Minutes | 0 (0.0%) | 0 (0.0%) |
| 15 to 19 Minutes | 0 (0.0%) | 7 (25.0%) |
| 20 to 24 Minutes | 0 (0.0%) | 0 (0.0%) |
| 25 to 29 Minutes | 0 (0.0%) | 0 (0.0%) |
| 30 to 34 Minutes | 0 (0.0%) | 0 (0.0%) |
| 35 to 39 Minutes | 0 (0.0%) | 0 (0.0%) |
| 40 to 44 Minutes | 9 (37.5%) | 16 (57.1%) |
| 45 to 59 Minutes | 0 (0.0%) | 0 (0.0%) |
| 60 to 89 Minutes | 0 (0.0%) | 0 (0.0%) |
| 90 or more Minutes | 0 (0.0%) | 0 (0.0%) |
Time of Departure to Work by Sex in Omena
The most frequent times of departure to work in Omena are 8:00 AM to 8:29 AM (9, 37.5%) for males and 7:00 AM to 7:29 AM (23, 82.1%) for females.

| Time of Departure | Male | Female |
| 12:00 AM to 4:59 AM | 0 (0.0%) | 0 (0.0%) |
| 5:00 AM to 5:29 AM | 0 (0.0%) | 0 (0.0%) |
| 5:30 AM to 5:59 AM | 0 (0.0%) | 0 (0.0%) |
| 6:00 AM to 6:29 AM | 0 (0.0%) | 0 (0.0%) |
| 6:30 AM to 6:59 AM | 4 (16.7%) | 5 (17.9%) |
| 7:00 AM to 7:29 AM | 7 (29.2%) | 23 (82.1%) |
| 7:30 AM to 7:59 AM | 0 (0.0%) | 0 (0.0%) |
| 8:00 AM to 8:29 AM | 9 (37.5%) | 0 (0.0%) |
| 8:30 AM to 8:59 AM | 0 (0.0%) | 0 (0.0%) |
| 9:00 AM to 9:59 AM | 4 (16.7%) | 0 (0.0%) |
| 10:00 AM to 10:59 AM | 0 (0.0%) | 0 (0.0%) |
| 11:00 AM to 11:59 AM | 0 (0.0%) | 0 (0.0%) |
| 12:00 PM to 3:59 PM | 0 (0.0%) | 0 (0.0%) |
| 4:00 PM to 11:59 PM | 0 (0.0%) | 0 (0.0%) |
| Total | 24 (100.0%) | 28 (100.0%) |
Housing Occupancy in Omena
Occupancy by Ownership in Omena
Of the total 115 dwellings in Omena, owner-occupied units account for 115 (100.0%), while renter-occupied units make up 0 (0.0%).
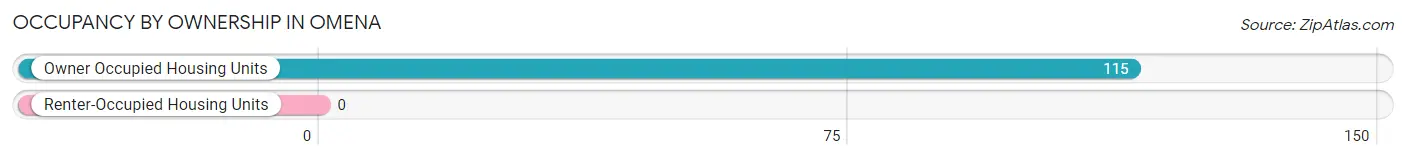
| Occupancy | # Housing Units | % Housing Units |
| Owner Occupied Housing Units | 115 | 100.0% |
| Renter-Occupied Housing Units | 0 | 0.0% |
| Total Occupied Housing Units | 115 | 100.0% |
Occupancy by Household Size in Omena
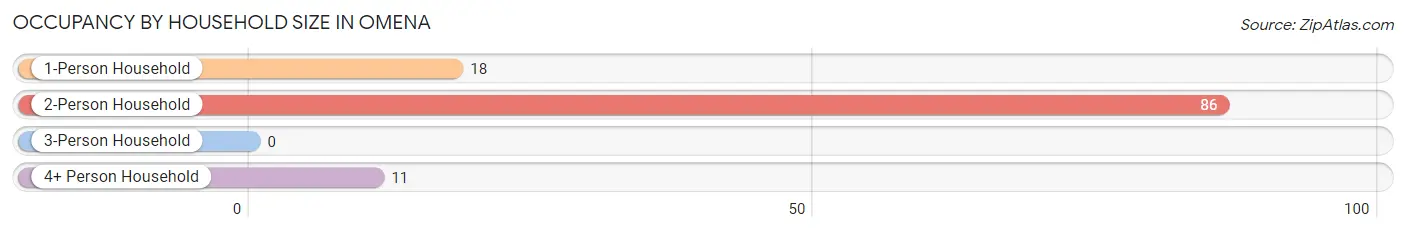
| Household Size | # Housing Units | % Housing Units |
| 1-Person Household | 18 | 15.7% |
| 2-Person Household | 86 | 74.8% |
| 3-Person Household | 0 | 0.0% |
| 4+ Person Household | 11 | 9.6% |
| Total Housing Units | 115 | 100.0% |
Occupancy by Ownership by Household Size in Omena
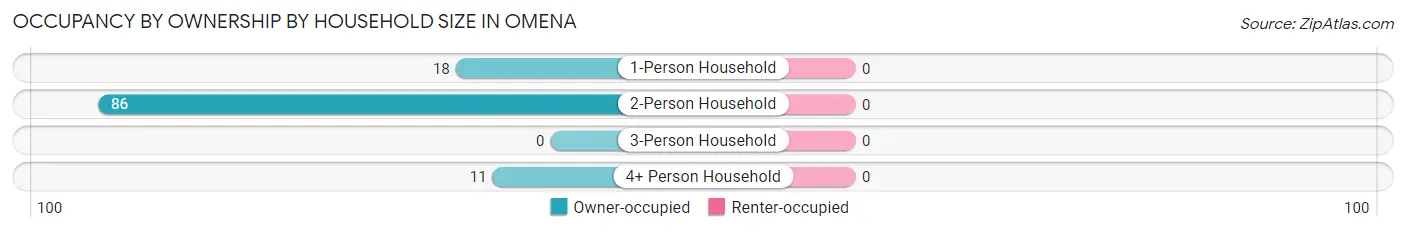
| Household Size | Owner-occupied | Renter-occupied |
| 1-Person Household | 18 (100.0%) | 0 (0.0%) |
| 2-Person Household | 86 (100.0%) | 0 (0.0%) |
| 3-Person Household | 0 (0.0%) | 0 (0.0%) |
| 4+ Person Household | 11 (100.0%) | 0 (0.0%) |
| Total Housing Units | 115 (100.0%) | 0 (0.0%) |
Occupancy by Educational Attainment in Omena
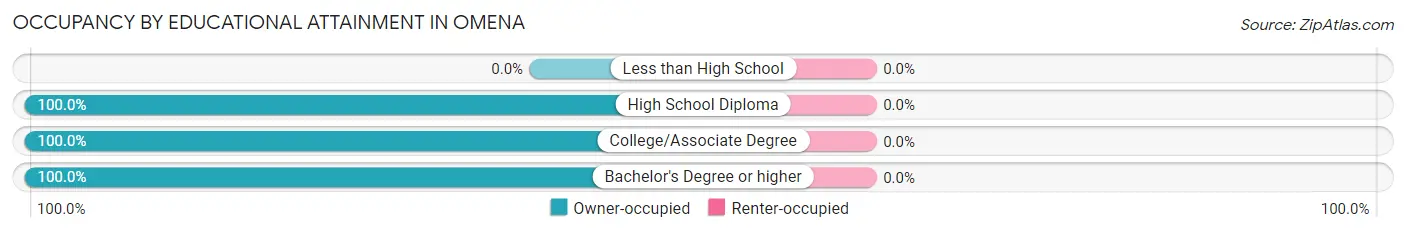
| Household Size | Owner-occupied | Renter-occupied |
| Less than High School | 0 (0.0%) | 0 (0.0%) |
| High School Diploma | 27 (100.0%) | 0 (0.0%) |
| College/Associate Degree | 27 (100.0%) | 0 (0.0%) |
| Bachelor's Degree or higher | 61 (100.0%) | 0 (0.0%) |
Occupancy by Age of Householder in Omena
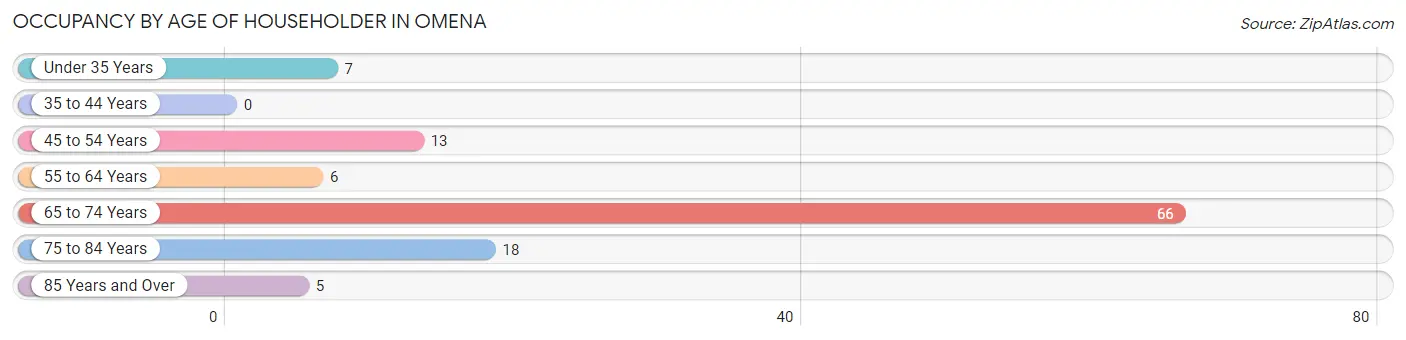
| Age Bracket | # Households | % Households |
| Under 35 Years | 7 | 6.1% |
| 35 to 44 Years | 0 | 0.0% |
| 45 to 54 Years | 13 | 11.3% |
| 55 to 64 Years | 6 | 5.2% |
| 65 to 74 Years | 66 | 57.4% |
| 75 to 84 Years | 18 | 15.7% |
| 85 Years and Over | 5 | 4.3% |
| Total | 115 | 100.0% |
Housing Finances in Omena
Median Income by Occupancy in Omena
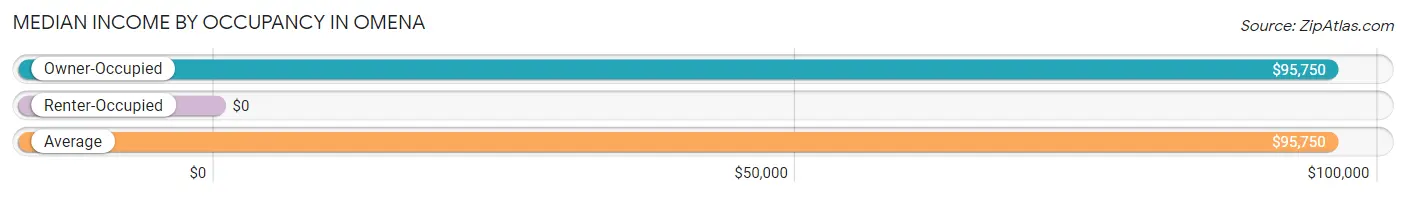
| Occupancy Type | # Households | Median Income |
| Owner-Occupied | 115 (100.0%) | $95,750 |
| Renter-Occupied | 0 (0.0%) | $0 |
| Average | 115 (100.0%) | $95,750 |
Occupancy by Householder Income Bracket in Omena
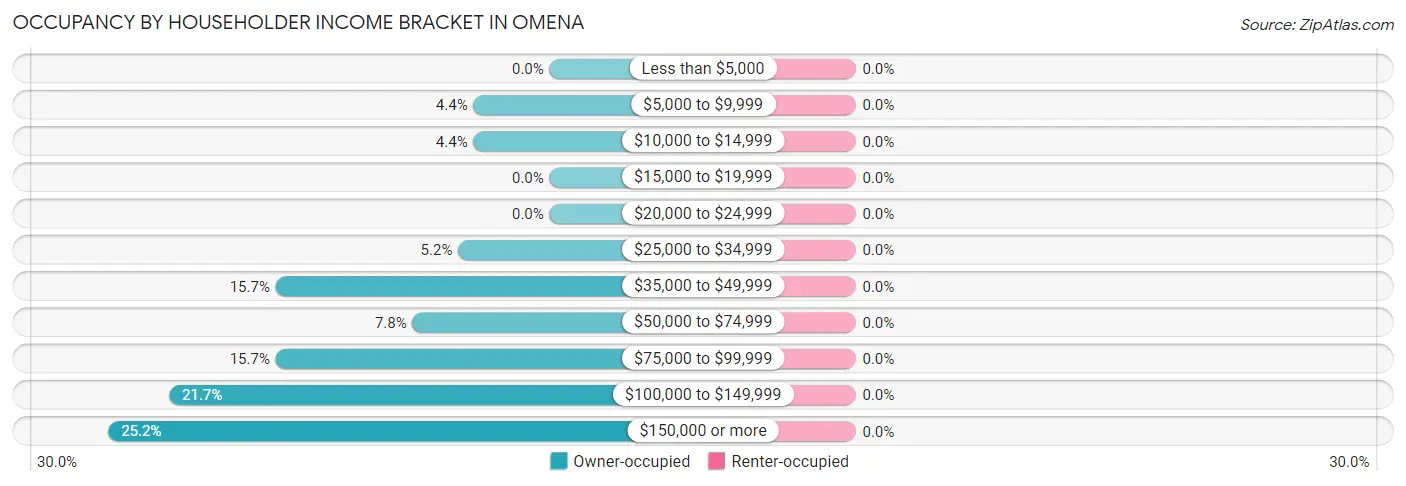
| Income Bracket | Owner-occupied | Renter-occupied |
| Less than $5,000 | 0 (0.0%) | 0 (0.0%) |
| $5,000 to $9,999 | 5 (4.3%) | 0 (0.0%) |
| $10,000 to $14,999 | 5 (4.3%) | 0 (0.0%) |
| $15,000 to $19,999 | 0 (0.0%) | 0 (0.0%) |
| $20,000 to $24,999 | 0 (0.0%) | 0 (0.0%) |
| $25,000 to $34,999 | 6 (5.2%) | 0 (0.0%) |
| $35,000 to $49,999 | 18 (15.7%) | 0 (0.0%) |
| $50,000 to $74,999 | 9 (7.8%) | 0 (0.0%) |
| $75,000 to $99,999 | 18 (15.7%) | 0 (0.0%) |
| $100,000 to $149,999 | 25 (21.7%) | 0 (0.0%) |
| $150,000 or more | 29 (25.2%) | 0 (0.0%) |
| Total | 115 (100.0%) | 0 (0.0%) |
Monthly Housing Cost Tiers in Omena
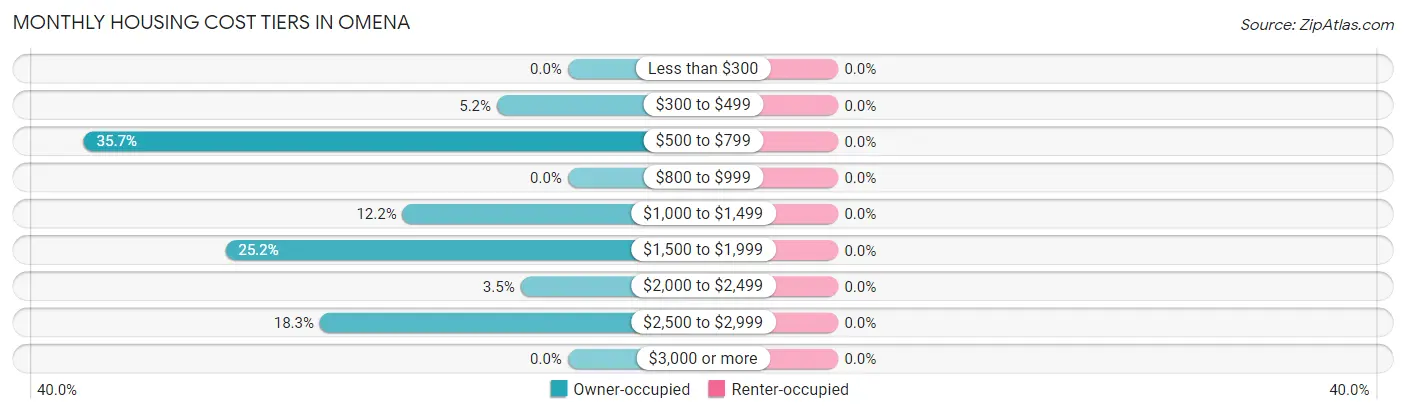
| Monthly Cost | Owner-occupied | Renter-occupied |
| Less than $300 | 0 (0.0%) | 0 (0.0%) |
| $300 to $499 | 6 (5.2%) | 0 (0.0%) |
| $500 to $799 | 41 (35.6%) | 0 (0.0%) |
| $800 to $999 | 0 (0.0%) | 0 (0.0%) |
| $1,000 to $1,499 | 14 (12.2%) | 0 (0.0%) |
| $1,500 to $1,999 | 29 (25.2%) | 0 (0.0%) |
| $2,000 to $2,499 | 4 (3.5%) | 0 (0.0%) |
| $2,500 to $2,999 | 21 (18.3%) | 0 (0.0%) |
| $3,000 or more | 0 (0.0%) | 0 (0.0%) |
| Total | 115 (100.0%) | 0 (0.0%) |
Physical Housing Characteristics in Omena
Housing Structures in Omena
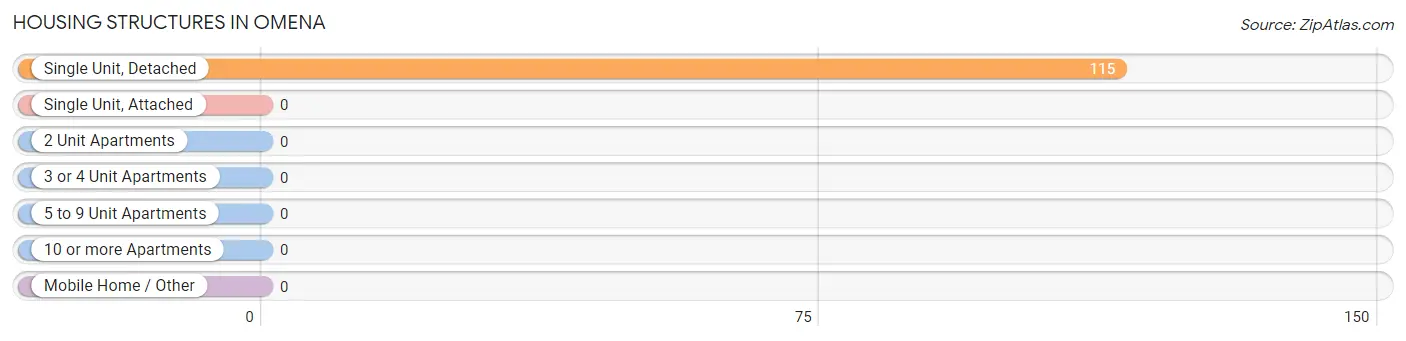
| Structure Type | # Housing Units | % Housing Units |
| Single Unit, Detached | 115 | 100.0% |
| Single Unit, Attached | 0 | 0.0% |
| 2 Unit Apartments | 0 | 0.0% |
| 3 or 4 Unit Apartments | 0 | 0.0% |
| 5 to 9 Unit Apartments | 0 | 0.0% |
| 10 or more Apartments | 0 | 0.0% |
| Mobile Home / Other | 0 | 0.0% |
| Total | 115 | 100.0% |
Housing Structures by Occupancy in Omena
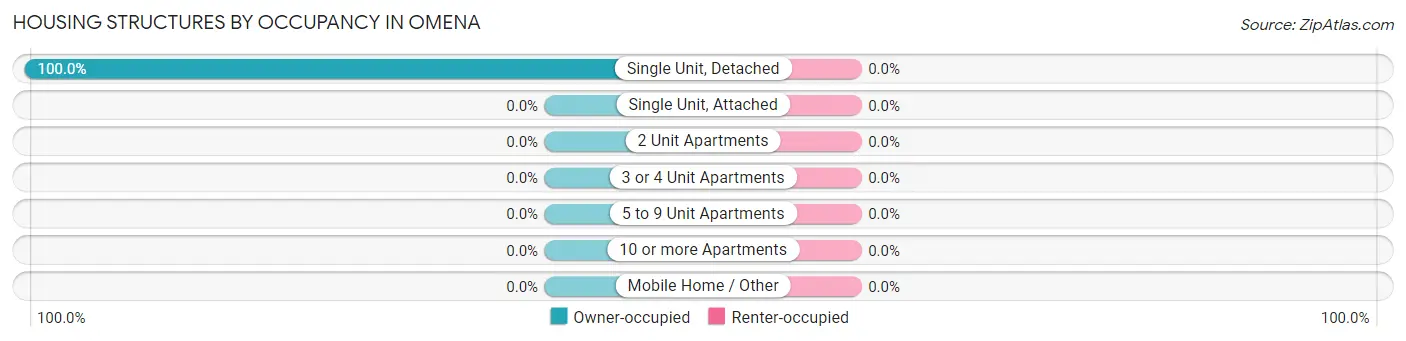
| Structure Type | Owner-occupied | Renter-occupied |
| Single Unit, Detached | 115 (100.0%) | 0 (0.0%) |
| Single Unit, Attached | 0 (0.0%) | 0 (0.0%) |
| 2 Unit Apartments | 0 (0.0%) | 0 (0.0%) |
| 3 or 4 Unit Apartments | 0 (0.0%) | 0 (0.0%) |
| 5 to 9 Unit Apartments | 0 (0.0%) | 0 (0.0%) |
| 10 or more Apartments | 0 (0.0%) | 0 (0.0%) |
| Mobile Home / Other | 0 (0.0%) | 0 (0.0%) |
| Total | 115 (100.0%) | 0 (0.0%) |
Housing Structures by Number of Rooms in Omena
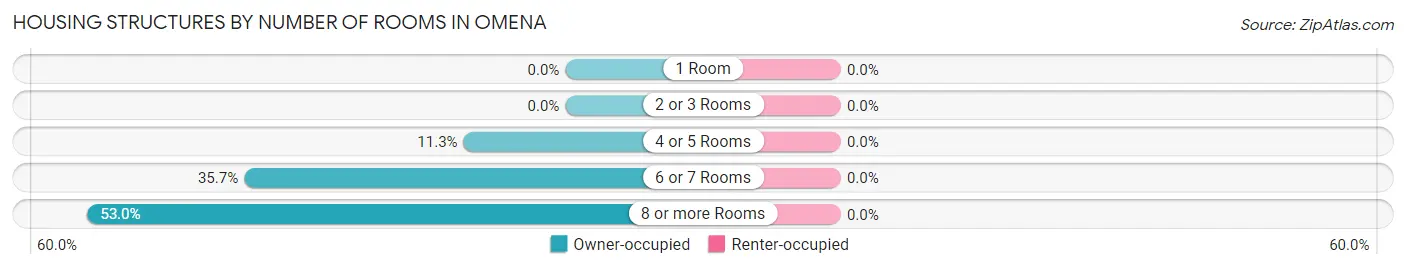
| Number of Rooms | Owner-occupied | Renter-occupied |
| 1 Room | 0 (0.0%) | 0 (0.0%) |
| 2 or 3 Rooms | 0 (0.0%) | 0 (0.0%) |
| 4 or 5 Rooms | 13 (11.3%) | 0 (0.0%) |
| 6 or 7 Rooms | 41 (35.6%) | 0 (0.0%) |
| 8 or more Rooms | 61 (53.0%) | 0 (0.0%) |
| Total | 115 (100.0%) | 0 (0.0%) |
Housing Structure by Heating Type in Omena
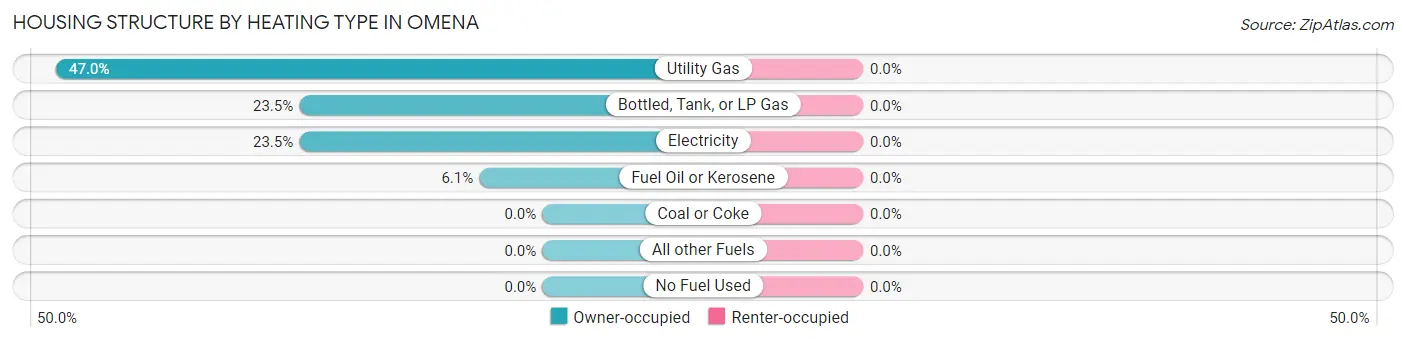
| Heating Type | Owner-occupied | Renter-occupied |
| Utility Gas | 54 (47.0%) | 0 (0.0%) |
| Bottled, Tank, or LP Gas | 27 (23.5%) | 0 (0.0%) |
| Electricity | 27 (23.5%) | 0 (0.0%) |
| Fuel Oil or Kerosene | 7 (6.1%) | 0 (0.0%) |
| Coal or Coke | 0 (0.0%) | 0 (0.0%) |
| All other Fuels | 0 (0.0%) | 0 (0.0%) |
| No Fuel Used | 0 (0.0%) | 0 (0.0%) |
| Total | 115 (100.0%) | 0 (0.0%) |
Household Vehicle Usage in Omena
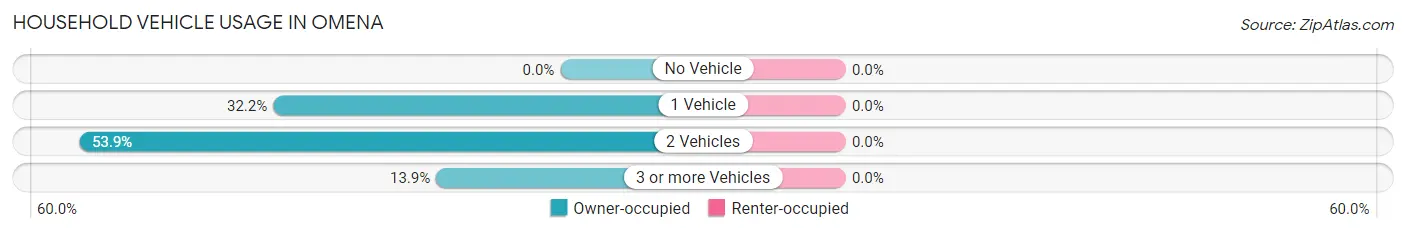
| Vehicles per Household | Owner-occupied | Renter-occupied |
| No Vehicle | 0 (0.0%) | 0 (0.0%) |
| 1 Vehicle | 37 (32.2%) | 0 (0.0%) |
| 2 Vehicles | 62 (53.9%) | 0 (0.0%) |
| 3 or more Vehicles | 16 (13.9%) | 0 (0.0%) |
| Total | 115 (100.0%) | 0 (0.0%) |
Real Estate & Mortgages in Omena
Real Estate and Mortgage Overview in Omena
| Characteristic | Without Mortgage | With Mortgage |
| Housing Units | 41 | 74 |
| Median Property Value | $784,700 | $568,200 |
| Median Household Income | $43,958 | $29 |
| Monthly Housing Costs | $711 | $0 |
| Real Estate Taxes | $5,272 | $0 |
Property Value by Mortgage Status in Omena
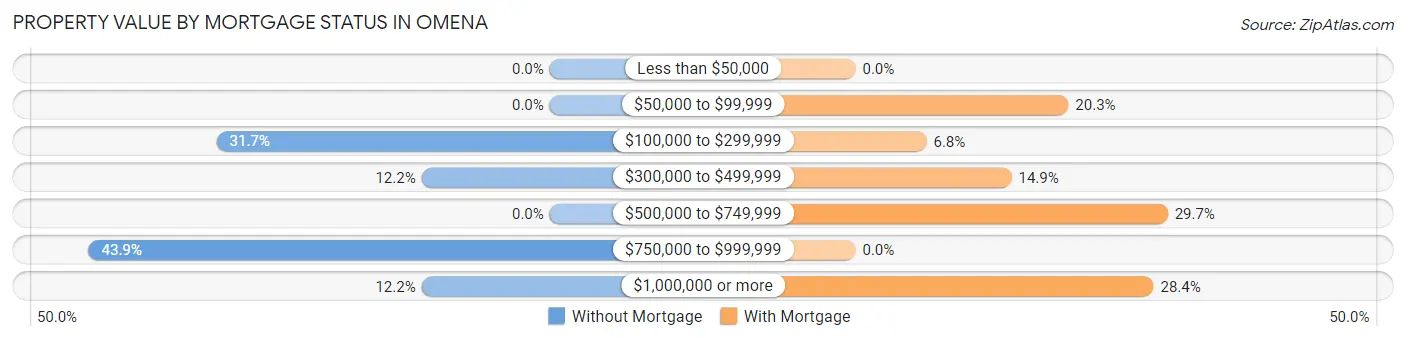
| Property Value | Without Mortgage | With Mortgage |
| Less than $50,000 | 0 (0.0%) | 0 (0.0%) |
| $50,000 to $99,999 | 0 (0.0%) | 15 (20.3%) |
| $100,000 to $299,999 | 13 (31.7%) | 5 (6.8%) |
| $300,000 to $499,999 | 5 (12.2%) | 11 (14.9%) |
| $500,000 to $749,999 | 0 (0.0%) | 22 (29.7%) |
| $750,000 to $999,999 | 18 (43.9%) | 0 (0.0%) |
| $1,000,000 or more | 5 (12.2%) | 21 (28.4%) |
| Total | 41 (100.0%) | 74 (100.0%) |
Household Income by Mortgage Status in Omena
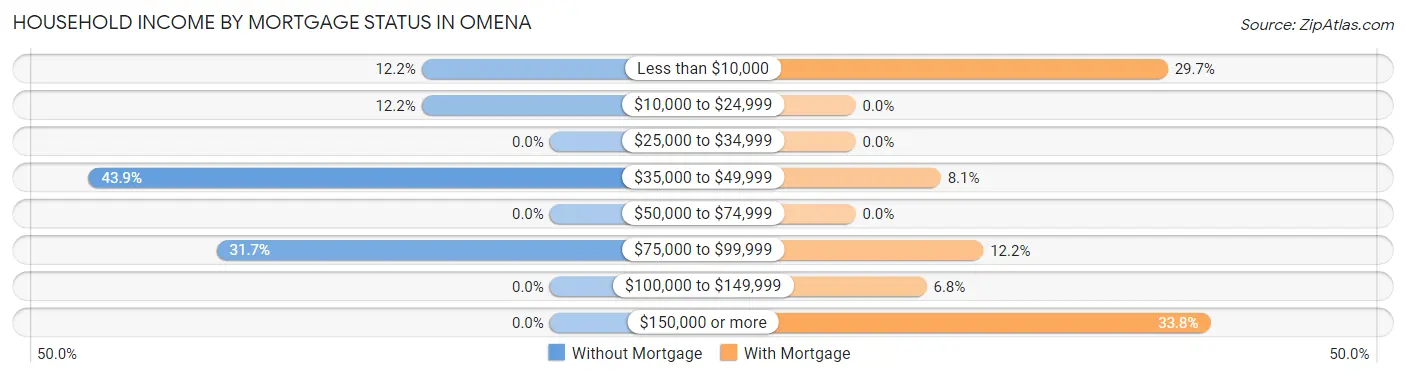
| Household Income | Without Mortgage | With Mortgage |
| Less than $10,000 | 5 (12.2%) | 22 (29.7%) |
| $10,000 to $24,999 | 5 (12.2%) | 0 (0.0%) |
| $25,000 to $34,999 | 0 (0.0%) | 0 (0.0%) |
| $35,000 to $49,999 | 18 (43.9%) | 6 (8.1%) |
| $50,000 to $74,999 | 0 (0.0%) | 0 (0.0%) |
| $75,000 to $99,999 | 13 (31.7%) | 9 (12.2%) |
| $100,000 to $149,999 | 0 (0.0%) | 5 (6.8%) |
| $150,000 or more | 0 (0.0%) | 25 (33.8%) |
| Total | 41 (100.0%) | 74 (100.0%) |
Property Value to Household Income Ratio in Omena
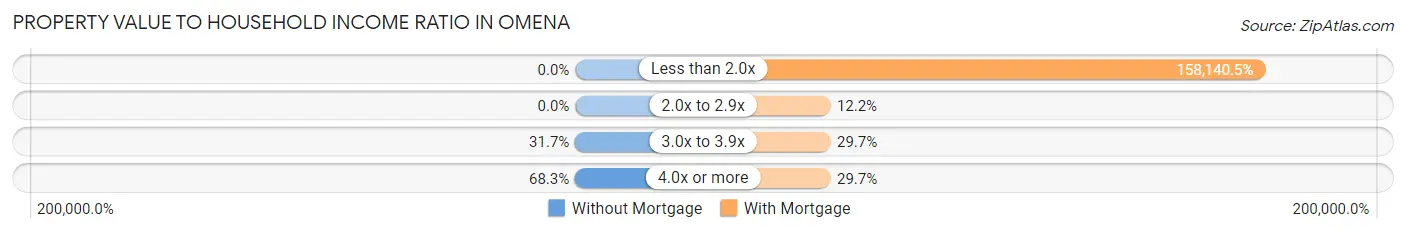
| Value-to-Income Ratio | Without Mortgage | With Mortgage |
| Less than 2.0x | 0 (0.0%) | 117,024 (158,140.5%) |
| 2.0x to 2.9x | 0 (0.0%) | 9 (12.2%) |
| 3.0x to 3.9x | 13 (31.7%) | 22 (29.7%) |
| 4.0x or more | 28 (68.3%) | 22 (29.7%) |
| Total | 41 (100.0%) | 74 (100.0%) |
Real Estate Taxes by Mortgage Status in Omena
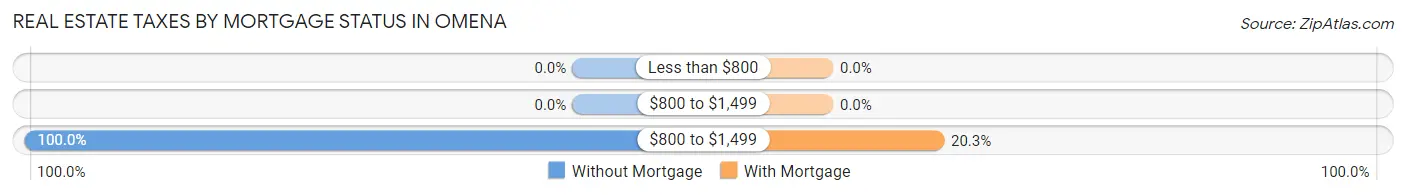
| Property Taxes | Without Mortgage | With Mortgage |
| Less than $800 | 0 (0.0%) | 0 (0.0%) |
| $800 to $1,499 | 0 (0.0%) | 0 (0.0%) |
| $800 to $1,499 | 41 (100.0%) | 15 (20.3%) |
| Total | 41 (100.0%) | 74 (100.0%) |
Health & Disability in Omena
Health Insurance Coverage by Age in Omena
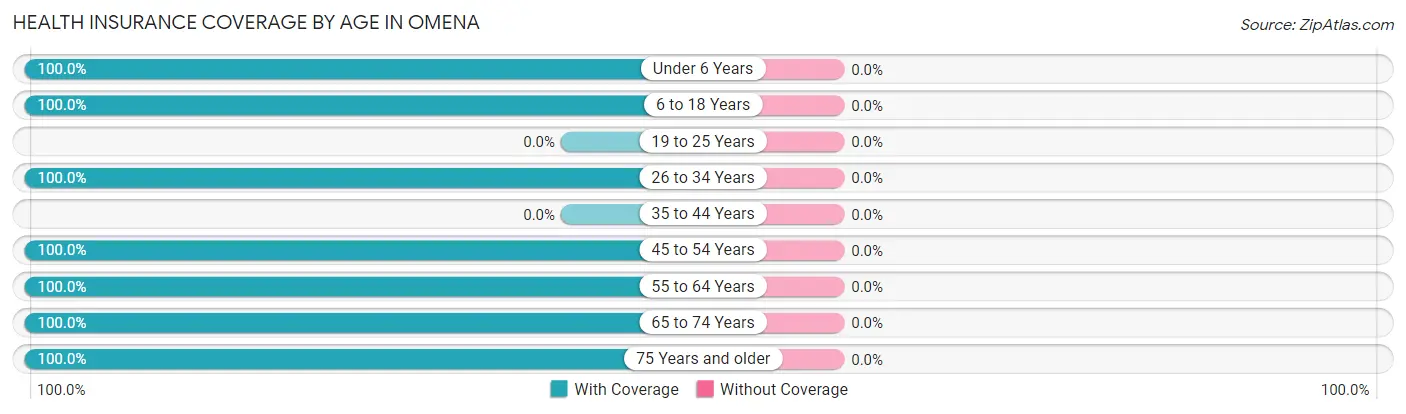
| Age Bracket | With Coverage | Without Coverage |
| Under 6 Years | 8 (100.0%) | 0 (0.0%) |
| 6 to 18 Years | 10 (100.0%) | 0 (0.0%) |
| 19 to 25 Years | 0 (0.0%) | 0 (0.0%) |
| 26 to 34 Years | 15 (100.0%) | 0 (0.0%) |
| 35 to 44 Years | 0 (0.0%) | 0 (0.0%) |
| 45 to 54 Years | 20 (100.0%) | 0 (0.0%) |
| 55 to 64 Years | 42 (100.0%) | 0 (0.0%) |
| 65 to 74 Years | 80 (100.0%) | 0 (0.0%) |
| 75 Years and older | 75 (100.0%) | 0 (0.0%) |
| Total | 250 (100.0%) | 0 (0.0%) |
Health Insurance Coverage by Citizenship Status in Omena
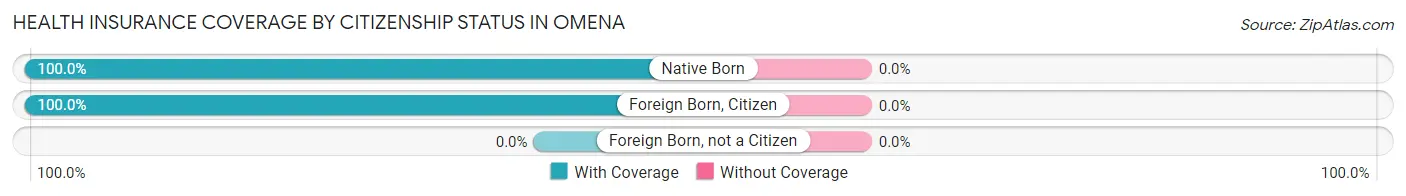
| Citizenship Status | With Coverage | Without Coverage |
| Native Born | 8 (100.0%) | 0 (0.0%) |
| Foreign Born, Citizen | 10 (100.0%) | 0 (0.0%) |
| Foreign Born, not a Citizen | 0 (0.0%) | 0 (0.0%) |
Health Insurance Coverage by Household Income in Omena
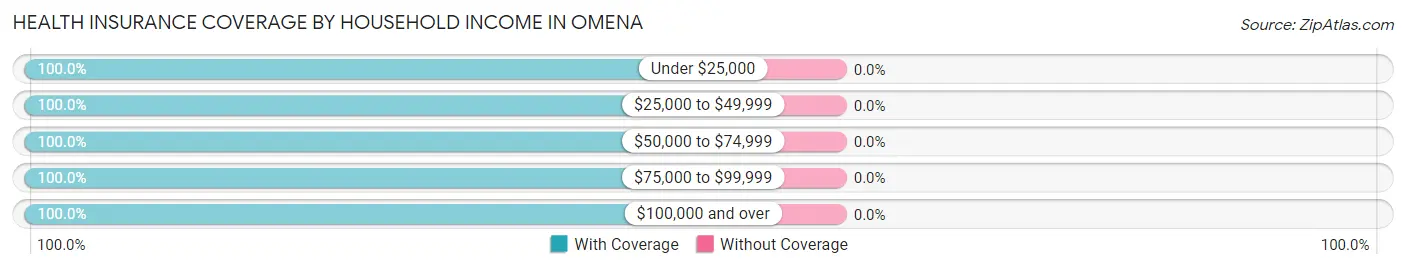
| Household Income | With Coverage | Without Coverage |
| Under $25,000 | 21 (100.0%) | 0 (0.0%) |
| $25,000 to $49,999 | 28 (100.0%) | 0 (0.0%) |
| $50,000 to $74,999 | 13 (100.0%) | 0 (0.0%) |
| $75,000 to $99,999 | 45 (100.0%) | 0 (0.0%) |
| $100,000 and over | 139 (100.0%) | 0 (0.0%) |
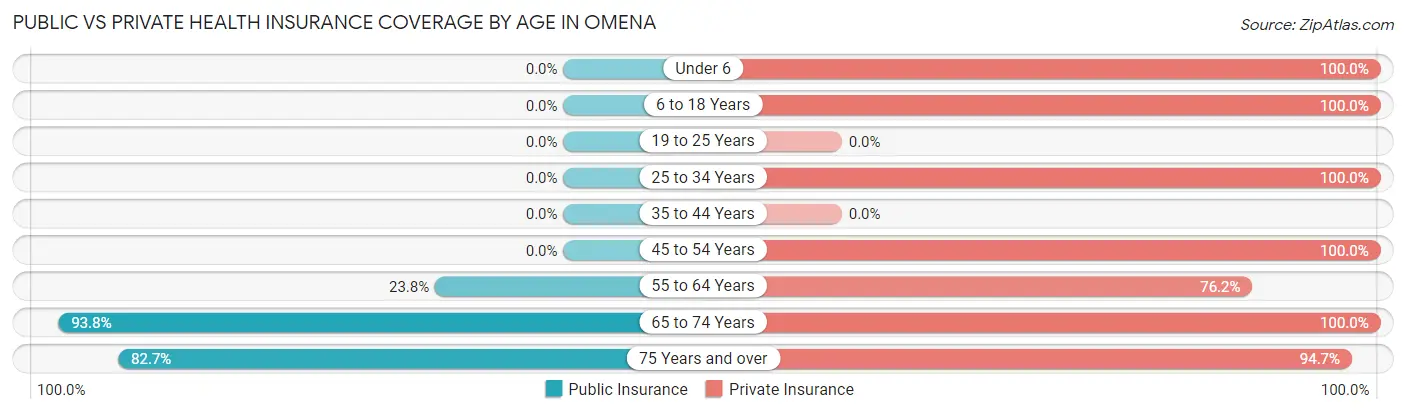
Public vs Private Health Insurance Coverage by Age in Omena
| Age Bracket | Public Insurance | Private Insurance |
| Under 6 | 0 (0.0%) | 8 (100.0%) |
| 6 to 18 Years | 0 (0.0%) | 10 (100.0%) |
| 19 to 25 Years | 0 (0.0%) | 0 (0.0%) |
| 25 to 34 Years | 0 (0.0%) | 15 (100.0%) |
| 35 to 44 Years | 0 (0.0%) | 0 (0.0%) |
| 45 to 54 Years | 0 (0.0%) | 20 (100.0%) |
| 55 to 64 Years | 10 (23.8%) | 32 (76.2%) |
| 65 to 74 Years | 75 (93.8%) | 80 (100.0%) |
| 75 Years and over | 62 (82.7%) | 71 (94.7%) |
| Total | 147 (58.8%) | 236 (94.4%) |
Disability Status by Sex by Age in Omena
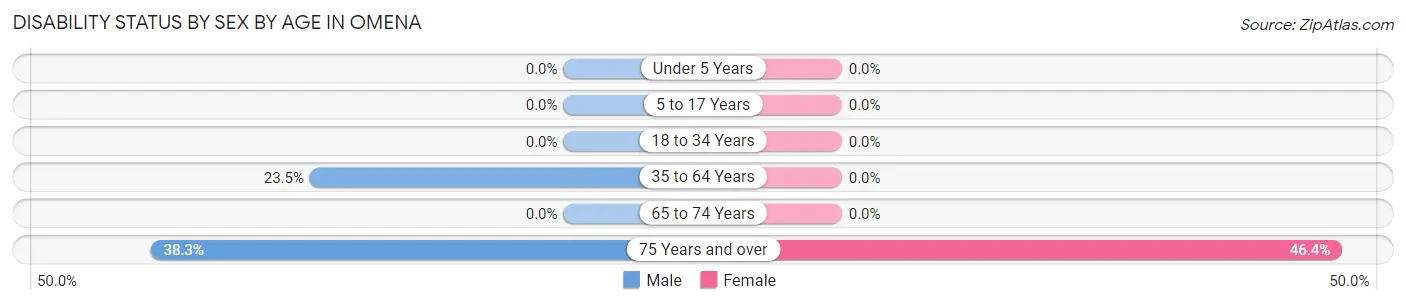
| Age Bracket | Male | Female |
| Under 5 Years | 0 (0.0%) | 0 (0.0%) |
| 5 to 17 Years | 0 (0.0%) | 0 (0.0%) |
| 18 to 34 Years | 0 (0.0%) | 0 (0.0%) |
| 35 to 64 Years | 4 (23.5%) | 0 (0.0%) |
| 65 to 74 Years | 0 (0.0%) | 0 (0.0%) |
| 75 Years and over | 18 (38.3%) | 13 (46.4%) |
Disability Class by Sex by Age in Omena
Disability Class: Hearing Difficulty
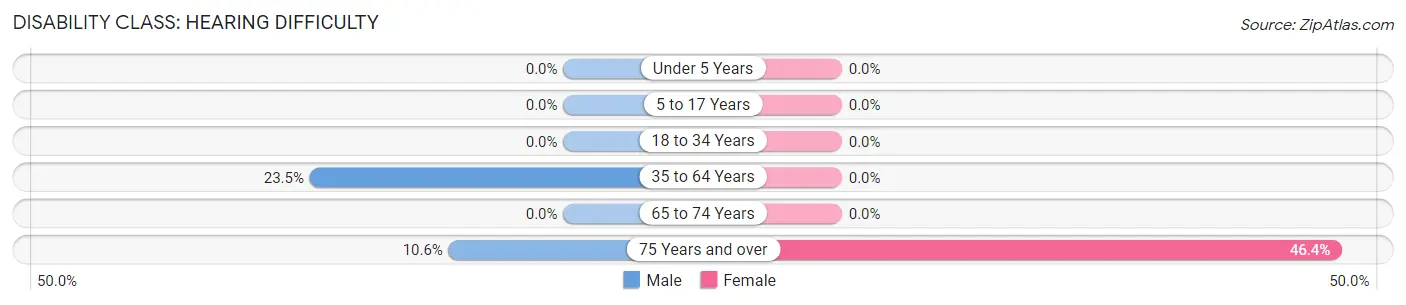
| Age Bracket | Male | Female |
| Under 5 Years | 0 (0.0%) | 0 (0.0%) |
| 5 to 17 Years | 0 (0.0%) | 0 (0.0%) |
| 18 to 34 Years | 0 (0.0%) | 0 (0.0%) |
| 35 to 64 Years | 4 (23.5%) | 0 (0.0%) |
| 65 to 74 Years | 0 (0.0%) | 0 (0.0%) |
| 75 Years and over | 5 (10.6%) | 13 (46.4%) |
Disability Class: Vision Difficulty
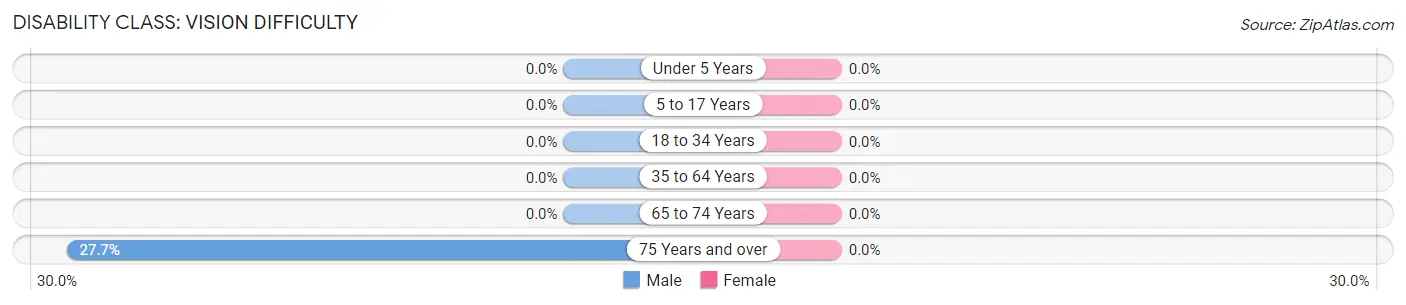
| Age Bracket | Male | Female |
| Under 5 Years | 0 (0.0%) | 0 (0.0%) |
| 5 to 17 Years | 0 (0.0%) | 0 (0.0%) |
| 18 to 34 Years | 0 (0.0%) | 0 (0.0%) |
| 35 to 64 Years | 0 (0.0%) | 0 (0.0%) |
| 65 to 74 Years | 0 (0.0%) | 0 (0.0%) |
| 75 Years and over | 13 (27.7%) | 0 (0.0%) |
Disability Class: Cognitive Difficulty

| Age Bracket | Male | Female |
| 5 to 17 Years | 0 (0.0%) | 0 (0.0%) |
| 18 to 34 Years | 0 (0.0%) | 0 (0.0%) |
| 35 to 64 Years | 0 (0.0%) | 0 (0.0%) |
| 65 to 74 Years | 0 (0.0%) | 0 (0.0%) |
| 75 Years and over | 0 (0.0%) | 0 (0.0%) |
Disability Class: Ambulatory Difficulty
| Age Bracket | Male | Female |
| 5 to 17 Years | 0 (0.0%) | 0 (0.0%) |
| 18 to 34 Years | 0 (0.0%) | 0 (0.0%) |
| 35 to 64 Years | 0 (0.0%) | 0 (0.0%) |
| 65 to 74 Years | 0 (0.0%) | 0 (0.0%) |
| 75 Years and over | 0 (0.0%) | 0 (0.0%) |
Disability Class: Self-Care Difficulty
| Age Bracket | Male | Female |
| 5 to 17 Years | 0 (0.0%) | 0 (0.0%) |
| 18 to 34 Years | 0 (0.0%) | 0 (0.0%) |
| 35 to 64 Years | 0 (0.0%) | 0 (0.0%) |
| 65 to 74 Years | 0 (0.0%) | 0 (0.0%) |
| 75 Years and over | 0 (0.0%) | 0 (0.0%) |
Technology Access in Omena
Computing Device Access in Omena
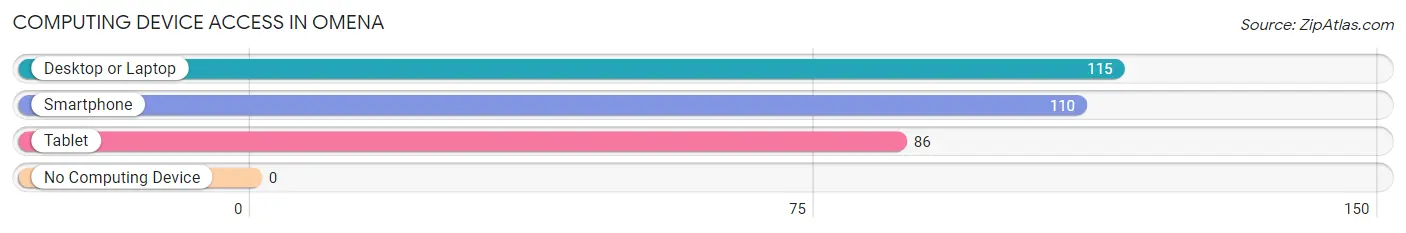
| Device Type | # Households | % Households |
| Desktop or Laptop | 115 | 100.0% |
| Smartphone | 110 | 95.7% |
| Tablet | 86 | 74.8% |
| No Computing Device | 0 | 0.0% |
| Total | 115 | 100.0% |
Internet Access in Omena
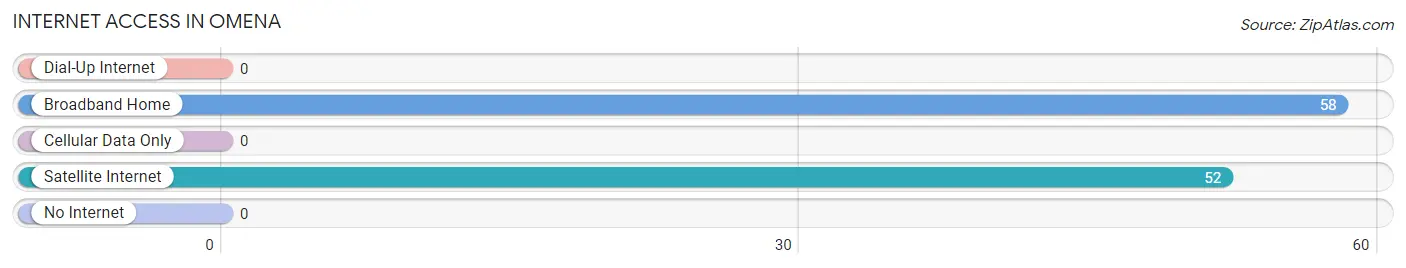
| Internet Type | # Households | % Households |
| Dial-Up Internet | 0 | 0.0% |
| Broadband Home | 58 | 50.4% |
| Cellular Data Only | 0 | 0.0% |
| Satellite Internet | 52 | 45.2% |
| No Internet | 0 | 0.0% |
| Total | 115 | 100.0% |
Omena Summary
Omena, Michigan is a small unincorporated community located in Leelanau County, Michigan. It is situated on the Leelanau Peninsula, which is located on the northwest side of the state. The community is located on the shores of Grand Traverse Bay, which is part of Lake Michigan. Omena is a popular tourist destination due to its proximity to Traverse City, which is the largest city in the region.
History
Omena was first settled in the late 1800s by a group of Finnish immigrants. The name “Omena” is derived from the Finnish word for apple, which was the primary crop grown in the area. The community was originally known as “Finn Town” due to the large number of Finnish immigrants who settled there.
The first post office in Omena was established in 1891. The community was officially incorporated in 1895. In the early 1900s, the area was a popular tourist destination due to its proximity to Traverse City. The area was also known for its apple orchards, which were a major source of income for the community.
Geography
Omena is located in Leelanau County, Michigan. It is situated on the Leelanau Peninsula, which is located on the northwest side of the state. The community is located on the shores of Grand Traverse Bay, which is part of Lake Michigan. The area is known for its rolling hills and lush forests.
The climate in Omena is typical of the Great Lakes region. Summers are warm and humid, while winters are cold and snowy. The average annual temperature is around 45 degrees Fahrenheit.
Economy
The economy of Omena is largely based on tourism. The area is a popular destination for visitors due to its proximity to Traverse City and its natural beauty. The area is also known for its apple orchards, which are a major source of income for the community.
In addition to tourism, Omena is home to several small businesses. These include restaurants, shops, and other services. The area is also home to several wineries, which produce a variety of wines.
Demographics
As of the 2010 census, the population of Omena was 1,072. The racial makeup of the community was 97.3% White, 0.7% African American, 0.3% Native American, 0.2% Asian, and 1.5% from other races. The median household income was $45,000.
Omena is a small, close-knit community. The area is known for its friendly atmosphere and welcoming attitude towards visitors. The community is also known for its strong sense of community and its commitment to preserving its natural beauty.
Common Questions
What is the Total Population of Omena?
Total Population of Omena is 250.
What is the Total Male Population of Omena?
Total Male Population of Omena is 106.
What is the Total Female Population of Omena?
Total Female Population of Omena is 144.
What is the Ratio of Males per 100 Females in Omena?
There are 73.61 Males per 100 Females in Omena.
What is the Ratio of Females per 100 Males in Omena?
There are 135.85 Females per 100 Males in Omena.
What is the Median Population Age in Omena?
Median Population Age in Omena is 73.5 Years.
What is the Average Family Size in Omena
Average Family Size in Omena is 2.4 People.
What is the Average Household Size in Omena
Average Household Size in Omena is 2.1 People.
What is Per Capita Income in Omena?
Per Capita income in Omena is $45,262.
What is the Median Family Income in Omena?
Median Family Income in Omena is $115,655.
What is the Median Household income in Omena?
Median Household Income in Omena is $95,750.
What is Income or Wage Gap in Omena?
Income or Wage Gap in Omena is 7.6%.
Women in Omena earn 92.4 cents for every dollar earned by a man.
What is Inequality or Gini Index in Omena?
Inequality or Gini Index in Omena is 0.30.
How Large is the Labor Force in Omena?
There are 52 People in the Labor Forcein in Omena.
What is the Percentage of People in the Labor Force in Omena?
21.9% of People are in the Labor Force in Omena.