Cities with the Highest Percentage of Immigrants from Europe in Tennessee
RELATED REPORTS & OPTIONS
Europe
Tennessee
Compare Cities
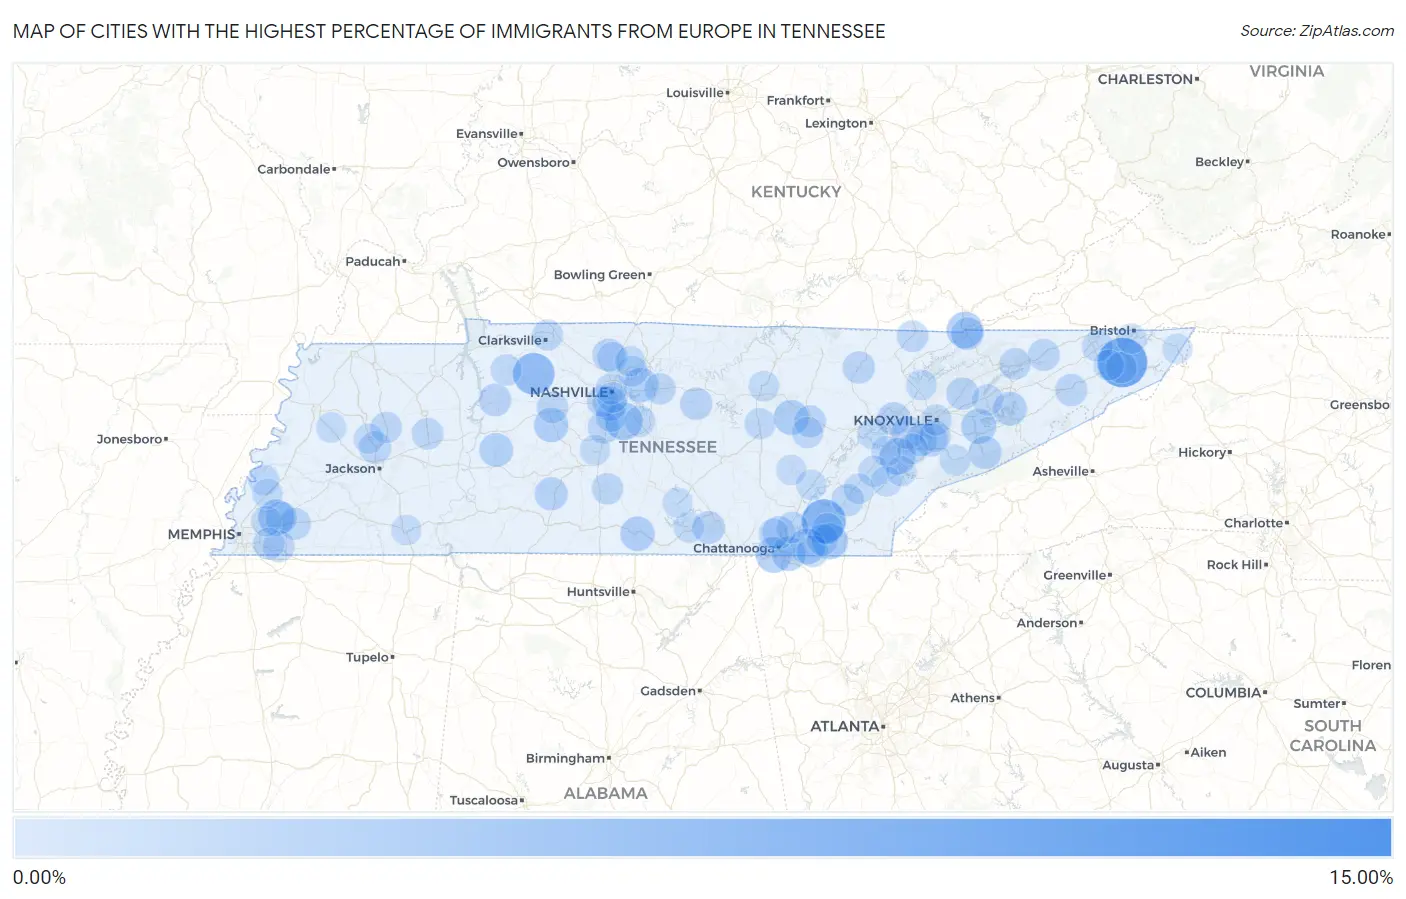
Map of Cities with the Highest Percentage of Immigrants from Europe in Tennessee
0.00%
15.00%
Cities with the Highest Percentage of Immigrants from Europe in Tennessee
| City | Europe | vs State | vs National | |
| 1. | Rarity Bay | 10.17% | 0.57%(+9.60)#1 | 1.46%(+8.71)#204 |
| 2. | Watauga | 7.28% | 0.57%(+6.72)#2 | 1.46%(+5.83)#434 |
| 3. | Hopewell | 5.35% | 0.57%(+4.78)#3 | 1.46%(+3.89)#867 |
| 4. | Slayden | 4.46% | 0.57%(+3.89)#4 | 1.46%(+3.00)#1,207 |
| 5. | Walnut Grove Cdp Sumner County | 3.64% | 0.57%(+3.07)#5 | 1.46%(+2.18)#1,636 |
| 6. | Nolensville | 3.06% | 0.57%(+2.49)#6 | 1.46%(+1.60)#2,130 |
| 7. | Tellico Village | 2.67% | 0.57%(+2.10)#7 | 1.46%(+1.21)#2,570 |
| 8. | Cumberland Gap | 2.66% | 0.57%(+2.09)#8 | 1.46%(+1.20)#2,583 |
| 9. | Lakeland | 2.57% | 0.57%(+2.00)#9 | 1.46%(+1.11)#2,711 |
| 10. | Wildwood Lake | 2.50% | 0.57%(+1.93)#10 | 1.46%(+1.05)#2,803 |
| 11. | Collegedale | 2.43% | 0.57%(+1.86)#11 | 1.46%(+0.971)#2,905 |
| 12. | Lookout Mountain | 2.40% | 0.57%(+1.83)#12 | 1.46%(+0.941)#2,945 |
| 13. | Pleasant Hill | 2.21% | 0.57%(+1.64)#13 | 1.46%(+0.751)#3,237 |
| 14. | Sevierville | 2.17% | 0.57%(+1.60)#14 | 1.46%(+0.713)#3,313 |
| 15. | East Ridge | 2.03% | 0.57%(+1.46)#15 | 1.46%(+0.572)#3,546 |
| 16. | Mount Juliet | 2.01% | 0.57%(+1.44)#16 | 1.46%(+0.550)#3,597 |
| 17. | Fayetteville | 1.98% | 0.57%(+1.41)#17 | 1.46%(+0.523)#3,655 |
| 18. | Bon Aqua Junction | 1.97% | 0.57%(+1.40)#18 | 1.46%(+0.512)#3,679 |
| 19. | Oak Hill | 1.81% | 0.57%(+1.24)#19 | 1.46%(+0.349)#4,022 |
| 20. | Lobelville | 1.79% | 0.57%(+1.22)#20 | 1.46%(+0.336)#4,051 |
| 21. | Baneberry | 1.77% | 0.57%(+1.21)#21 | 1.46%(+0.318)#4,095 |
| 22. | Oak Ridge | 1.56% | 0.57%(+0.993)#22 | 1.46%(+0.104)#4,632 |
| 23. | Summertown | 1.55% | 0.57%(+0.982)#23 | 1.46%(+0.093)#4,655 |
| 24. | Alcoa | 1.49% | 0.57%(+0.920)#24 | 1.46%(+0.031)#4,859 |
| 25. | Gatlinburg | 1.46% | 0.57%(+0.890)#25 | 1.46%(+0.002)#4,953 |
| 26. | Walden | 1.44% | 0.57%(+0.876)#26 | 1.46%(-0.013)#5,006 |
| 27. | Farragut | 1.43% | 0.57%(+0.866)#27 | 1.46%(-0.023)#5,034 |
| 28. | Sewanee | 1.40% | 0.57%(+0.836)#28 | 1.46%(-0.053)#5,121 |
| 29. | Harrogate | 1.40% | 0.57%(+0.828)#29 | 1.46%(-0.060)#5,144 |
| 30. | Greenbrier | 1.39% | 0.57%(+0.828)#30 | 1.46%(-0.061)#5,148 |
| 31. | Waverly | 1.35% | 0.57%(+0.787)#31 | 1.46%(-0.102)#5,292 |
| 32. | Alexandria | 1.29% | 0.57%(+0.726)#32 | 1.46%(-0.163)#5,480 |
| 33. | Blaine | 1.28% | 0.57%(+0.715)#33 | 1.46%(-0.174)#5,534 |
| 34. | Elgin | 1.27% | 0.57%(+0.707)#34 | 1.46%(-0.182)#5,570 |
| 35. | Tusculum | 1.26% | 0.57%(+0.690)#35 | 1.46%(-0.199)#5,625 |
| 36. | Three Way | 1.25% | 0.57%(+0.686)#36 | 1.46%(-0.202)#5,641 |
| 37. | Riceville | 1.24% | 0.57%(+0.678)#37 | 1.46%(-0.211)#5,675 |
| 38. | Louisville | 1.19% | 0.57%(+0.626)#38 | 1.46%(-0.263)#5,853 |
| 39. | Franklin | 1.19% | 0.57%(+0.619)#39 | 1.46%(-0.270)#5,875 |
| 40. | Crossville | 1.16% | 0.57%(+0.590)#40 | 1.46%(-0.299)#6,003 |
| 41. | Rogersville | 1.14% | 0.57%(+0.577)#41 | 1.46%(-0.311)#6,061 |
| 42. | Oakland | 1.14% | 0.57%(+0.571)#42 | 1.46%(-0.318)#6,091 |
| 43. | Arlington | 1.10% | 0.57%(+0.534)#43 | 1.46%(-0.354)#6,241 |
| 44. | Apison | 1.10% | 0.57%(+0.528)#44 | 1.46%(-0.360)#6,268 |
| 45. | Collierville | 1.09% | 0.57%(+0.523)#45 | 1.46%(-0.365)#6,285 |
| 46. | Clarksburg | 1.03% | 0.57%(+0.458)#46 | 1.46%(-0.430)#6,591 |
| 47. | Germantown | 1.01% | 0.57%(+0.440)#47 | 1.46%(-0.448)#6,667 |
| 48. | Middle Valley | 1.01% | 0.57%(+0.440)#48 | 1.46%(-0.449)#6,671 |
| 49. | Lynchburg | 1.01% | 0.57%(+0.439)#49 | 1.46%(-0.449)#6,676 |
| 50. | Burns | 1.00% | 0.57%(+0.432)#50 | 1.46%(-0.457)#6,713 |
| 51. | Mooresburg | 1.00% | 0.57%(+0.429)#51 | 1.46%(-0.459)#6,725 |
| 52. | South Cleveland | 0.99% | 0.57%(+0.420)#52 | 1.46%(-0.468)#6,767 |
| 53. | Central | 0.98% | 0.57%(+0.411)#53 | 1.46%(-0.477)#6,814 |
| 54. | Lewisburg | 0.96% | 0.57%(+0.394)#54 | 1.46%(-0.494)#6,882 |
| 55. | Lebanon | 0.96% | 0.57%(+0.393)#55 | 1.46%(-0.495)#6,895 |
| 56. | Milan | 0.96% | 0.57%(+0.388)#56 | 1.46%(-0.501)#6,925 |
| 57. | Belle Meade | 0.95% | 0.57%(+0.387)#57 | 1.46%(-0.501)#6,929 |
| 58. | Delano | 0.94% | 0.57%(+0.377)#58 | 1.46%(-0.511)#6,984 |
| 59. | Rockford | 0.94% | 0.57%(+0.375)#59 | 1.46%(-0.514)#6,997 |
| 60. | Jellico | 0.94% | 0.57%(+0.373)#60 | 1.46%(-0.516)#7,011 |
| 61. | Cleveland | 0.93% | 0.57%(+0.367)#61 | 1.46%(-0.521)#7,049 |
| 62. | Lake Tansi | 0.92% | 0.57%(+0.356)#62 | 1.46%(-0.533)#7,101 |
| 63. | Brentwood | 0.92% | 0.57%(+0.350)#63 | 1.46%(-0.539)#7,141 |
| 64. | Jefferson City | 0.91% | 0.57%(+0.338)#64 | 1.46%(-0.550)#7,212 |
| 65. | Erin | 0.89% | 0.57%(+0.323)#65 | 1.46%(-0.565)#7,283 |
| 66. | Sparta | 0.89% | 0.57%(+0.322)#66 | 1.46%(-0.567)#7,294 |
| 67. | Nashville | 0.88% | 0.57%(+0.316)#67 | 1.46%(-0.573)#7,316 |
| 68. | Knoxville | 0.86% | 0.57%(+0.291)#68 | 1.46%(-0.598)#7,465 |
| 69. | Clarksville | 0.85% | 0.57%(+0.283)#69 | 1.46%(-0.606)#7,504 |
| 70. | Colonial Heights | 0.82% | 0.57%(+0.258)#70 | 1.46%(-0.631)#7,627 |
| 71. | Sweetwater | 0.82% | 0.57%(+0.257)#71 | 1.46%(-0.632)#7,634 |
| 72. | Hendersonville | 0.80% | 0.57%(+0.236)#72 | 1.46%(-0.652)#7,755 |
| 73. | Smyrna | 0.79% | 0.57%(+0.220)#73 | 1.46%(-0.669)#7,866 |
| 74. | Gilt Edge | 0.78% | 0.57%(+0.212)#74 | 1.46%(-0.676)#7,899 |
| 75. | Ridgetop | 0.76% | 0.57%(+0.190)#75 | 1.46%(-0.698)#8,021 |
| 76. | Norris | 0.75% | 0.57%(+0.187)#76 | 1.46%(-0.702)#8,040 |
| 77. | Berry Hill | 0.75% | 0.57%(+0.184)#77 | 1.46%(-0.704)#8,053 |
| 78. | Kingston | 0.73% | 0.57%(+0.168)#78 | 1.46%(-0.721)#8,167 |
| 79. | Athens | 0.73% | 0.57%(+0.164)#79 | 1.46%(-0.725)#8,196 |
| 80. | Friendsville | 0.73% | 0.57%(+0.162)#80 | 1.46%(-0.727)#8,203 |
| 81. | Madisonville | 0.72% | 0.57%(+0.155)#81 | 1.46%(-0.733)#8,253 |
| 82. | Johnson City | 0.71% | 0.57%(+0.147)#82 | 1.46%(-0.742)#8,311 |
| 83. | Townsend | 0.69% | 0.57%(+0.119)#83 | 1.46%(-0.770)#8,487 |
| 84. | Winchester | 0.67% | 0.57%(+0.099)#84 | 1.46%(-0.789)#8,627 |
| 85. | Algood | 0.66% | 0.57%(+0.092)#85 | 1.46%(-0.797)#8,678 |
| 86. | Dayton | 0.64% | 0.57%(+0.077)#86 | 1.46%(-0.812)#8,795 |
| 87. | Shackle Island | 0.64% | 0.57%(+0.073)#87 | 1.46%(-0.816)#8,828 |
| 88. | Spring Hill | 0.63% | 0.57%(+0.062)#88 | 1.46%(-0.826)#8,907 |
| 89. | Atoka | 0.63% | 0.57%(+0.058)#89 | 1.46%(-0.830)#8,937 |
| 90. | Humboldt | 0.61% | 0.57%(+0.044)#90 | 1.46%(-0.844)#9,067 |
| 91. | Signal Mountain | 0.61% | 0.57%(+0.044)#91 | 1.46%(-0.845)#9,070 |
| 92. | Bartlett | 0.61% | 0.57%(+0.040)#92 | 1.46%(-0.849)#9,096 |
| 93. | Friendship | 0.60% | 0.57%(+0.028)#93 | 1.46%(-0.861)#9,188 |
| 94. | Bristol | 0.59% | 0.57%(+0.019)#94 | 1.46%(-0.870)#9,252 |
| 95. | Selmer | 0.59% | 0.57%(+0.018)#95 | 1.46%(-0.871)#9,260 |
| 96. | Mountain City | 0.58% | 0.57%(+0.017)#96 | 1.46%(-0.872)#9,270 |
| 97. | Vonore | 0.58% | 0.57%(+0.011)#97 | 1.46%(-0.878)#9,320 |
| 98. | Loudon | 0.56% | 0.57%(-0.007)#98 | 1.46%(-0.896)#9,475 |
| 99. | Tullahoma | 0.55% | 0.57%(-0.013)#99 | 1.46%(-0.902)#9,511 |
| 100. | Pikeville | 0.55% | 0.57%(-0.016)#100 | 1.46%(-0.905)#9,543 |
Common Questions
What are the Top 10 Cities with the Highest Percentage of Immigrants from Europe in Tennessee?
Top 10 Cities with the Highest Percentage of Immigrants from Europe in Tennessee are:
#1
7.28%
#2
5.35%
#3
4.46%
#4
3.06%
#5
2.67%
#6
2.66%
#7
2.57%
#8
2.50%
#9
2.43%
#10
2.40%
What city has the Highest Percentage of Immigrants from Europe in Tennessee?
Watauga has the Highest Percentage of Immigrants from Europe in Tennessee with 7.28%.
What is the Percentage of Immigrants from Europe in the State of Tennessee?
Percentage of Immigrants from Europe in Tennessee is 0.57%.
What is the Percentage of Immigrants from Europe in the United States?
Percentage of Immigrants from Europe in the United States is 1.46%.