Cities with the Highest Percentage of Immigrants from Europe in Nebraska
RELATED REPORTS & OPTIONS
Europe
Nebraska
Compare Cities
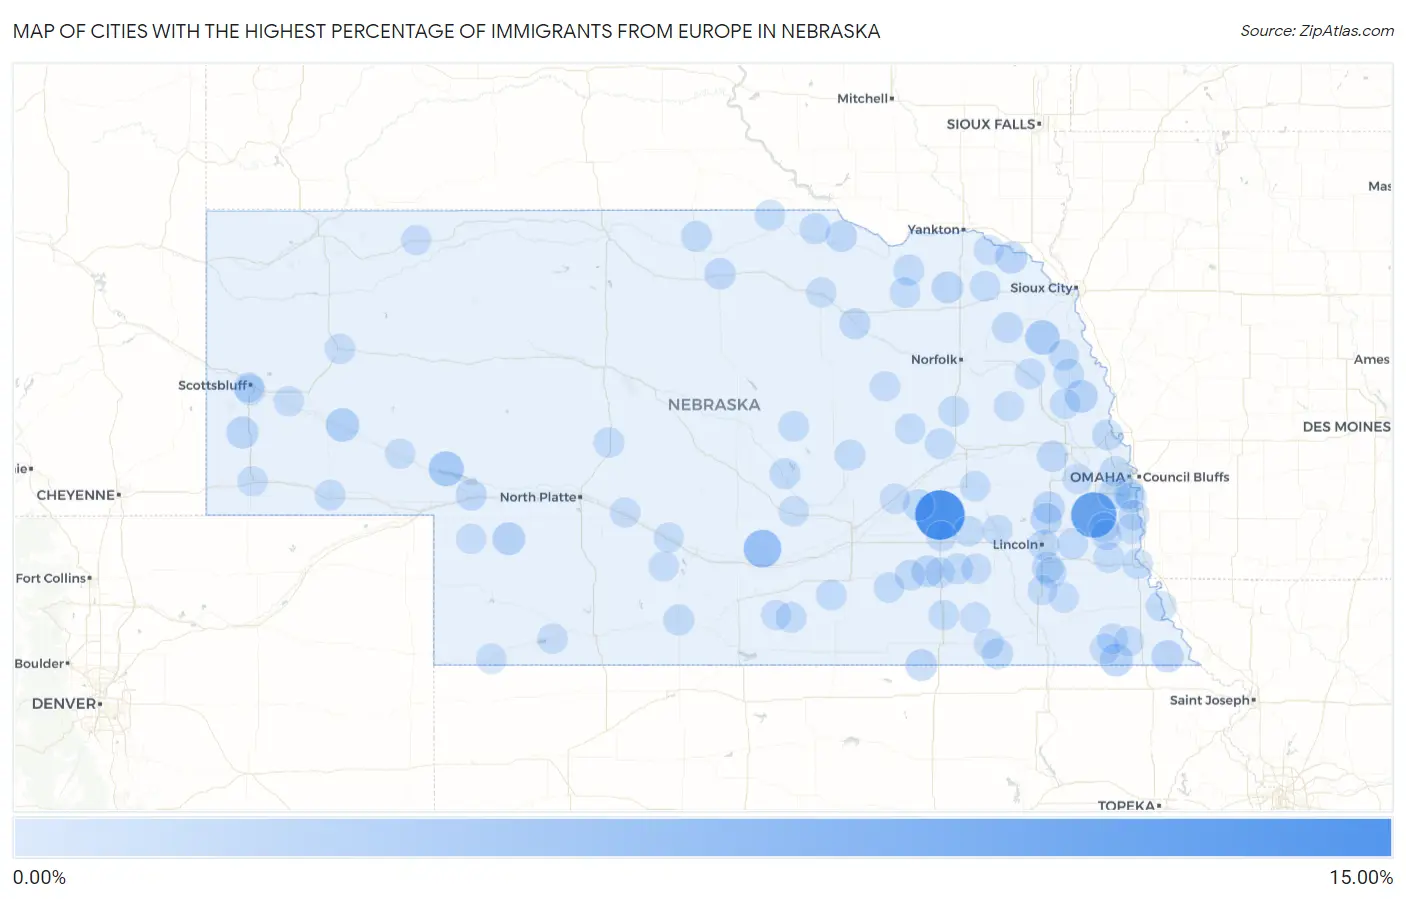
Map of Cities with the Highest Percentage of Immigrants from Europe in Nebraska
0.00%
15.00%
Cities with the Highest Percentage of Immigrants from Europe in Nebraska
| City | Europe | vs State | vs National | |
| 1. | Benedict | 13.87% | 0.50%(+13.4)#1 | 1.46%(+12.4)#105 |
| 2. | South Bend | 10.87% | 0.50%(+10.4)#2 | 1.46%(+9.41)#174 |
| 3. | Riverdale | 5.43% | 0.50%(+4.93)#3 | 1.46%(+3.98)#834 |
| 4. | Belmar | 3.57% | 0.50%(+3.07)#4 | 1.46%(+2.12)#1,697 |
| 5. | Thurston | 3.28% | 0.50%(+2.78)#5 | 1.46%(+1.82)#1,929 |
| 6. | Broadwater | 2.63% | 0.50%(+2.13)#6 | 1.46%(+1.18)#2,624 |
| 7. | Du Bois | 2.13% | 0.50%(+1.63)#7 | 1.46%(+0.672)#3,366 |
| 8. | Craig | 2.10% | 0.50%(+1.60)#8 | 1.46%(+0.642)#3,420 |
| 9. | Elsie | 2.05% | 0.50%(+1.55)#9 | 1.46%(+0.599)#3,497 |
| 10. | Harrisburg | 1.69% | 0.50%(+1.19)#10 | 1.46%(+0.239)#4,284 |
| 11. | Maskell | 1.61% | 0.50%(+1.11)#11 | 1.46%(+0.157)#4,477 |
| 12. | Ceresco | 1.56% | 0.50%(+1.05)#12 | 1.46%(+0.100)#4,644 |
| 13. | Falls City | 1.50% | 0.50%(+1.00)#13 | 1.46%(+0.048)#4,801 |
| 14. | Wausa | 1.49% | 0.50%(+0.988)#14 | 1.46%(+0.034)#4,850 |
| 15. | Grafton | 1.35% | 0.50%(+0.850)#15 | 1.46%(-0.104)#5,308 |
| 16. | Davey | 1.34% | 0.50%(+0.841)#16 | 1.46%(-0.114)#5,334 |
| 17. | Byron | 1.30% | 0.50%(+0.797)#17 | 1.46%(-0.157)#5,461 |
| 18. | Roca | 1.26% | 0.50%(+0.756)#18 | 1.46%(-0.198)#5,624 |
| 19. | Polk | 1.19% | 0.50%(+0.689)#19 | 1.46%(-0.265)#5,861 |
| 20. | Lynch | 1.18% | 0.50%(+0.682)#20 | 1.46%(-0.272)#5,884 |
| 21. | Bassett | 1.16% | 0.50%(+0.661)#21 | 1.46%(-0.293)#5,979 |
| 22. | Cedar Bluffs | 1.06% | 0.50%(+0.555)#22 | 1.46%(-0.399)#6,443 |
| 23. | Ogallala | 1.05% | 0.50%(+0.553)#23 | 1.46%(-0.401)#6,457 |
| 24. | Ewing | 1.04% | 0.50%(+0.540)#24 | 1.46%(-0.414)#6,508 |
| 25. | Endicott | 1.03% | 0.50%(+0.529)#25 | 1.46%(-0.425)#6,565 |
| 26. | Center | 1.01% | 0.50%(+0.503)#26 | 1.46%(-0.451)#6,683 |
| 27. | Wayne | 1.00% | 0.50%(+0.503)#27 | 1.46%(-0.451)#6,686 |
| 28. | Papillion | 0.98% | 0.50%(+0.481)#28 | 1.46%(-0.473)#6,796 |
| 29. | Exeter | 0.95% | 0.50%(+0.453)#29 | 1.46%(-0.502)#6,932 |
| 30. | Spencer | 0.95% | 0.50%(+0.448)#30 | 1.46%(-0.506)#6,962 |
| 31. | Offutt Afb | 0.94% | 0.50%(+0.440)#31 | 1.46%(-0.514)#7,001 |
| 32. | Arapahoe | 0.92% | 0.50%(+0.421)#32 | 1.46%(-0.534)#7,104 |
| 33. | Blair | 0.92% | 0.50%(+0.420)#33 | 1.46%(-0.534)#7,112 |
| 34. | Loup City | 0.92% | 0.50%(+0.417)#34 | 1.46%(-0.537)#7,135 |
| 35. | Lincoln | 0.91% | 0.50%(+0.413)#35 | 1.46%(-0.542)#7,159 |
| 36. | Springview | 0.91% | 0.50%(+0.407)#36 | 1.46%(-0.547)#7,196 |
| 37. | Eagle | 0.90% | 0.50%(+0.399)#37 | 1.46%(-0.555)#7,233 |
| 38. | Sutton | 0.87% | 0.50%(+0.365)#38 | 1.46%(-0.589)#7,402 |
| 39. | Rosalie | 0.86% | 0.50%(+0.357)#39 | 1.46%(-0.597)#7,463 |
| 40. | Bellevue | 0.82% | 0.50%(+0.316)#40 | 1.46%(-0.638)#7,675 |
| 41. | Hickman | 0.82% | 0.50%(+0.314)#41 | 1.46%(-0.640)#7,690 |
| 42. | Wolbach | 0.81% | 0.50%(+0.305)#42 | 1.46%(-0.649)#7,737 |
| 43. | Creighton | 0.81% | 0.50%(+0.304)#43 | 1.46%(-0.650)#7,740 |
| 44. | Upland | 0.79% | 0.50%(+0.292)#44 | 1.46%(-0.662)#7,826 |
| 45. | Roseland | 0.78% | 0.50%(+0.274)#45 | 1.46%(-0.681)#7,933 |
| 46. | Gering | 0.77% | 0.50%(+0.267)#46 | 1.46%(-0.687)#7,968 |
| 47. | Stapleton | 0.76% | 0.50%(+0.262)#47 | 1.46%(-0.692)#7,998 |
| 48. | Otoe | 0.75% | 0.50%(+0.245)#48 | 1.46%(-0.710)#8,091 |
| 49. | Brownville | 0.72% | 0.50%(+0.223)#49 | 1.46%(-0.731)#8,240 |
| 50. | Beemer | 0.72% | 0.50%(+0.221)#50 | 1.46%(-0.733)#8,254 |
| 51. | Bruning | 0.72% | 0.50%(+0.218)#51 | 1.46%(-0.736)#8,279 |
| 52. | Utica | 0.72% | 0.50%(+0.215)#52 | 1.46%(-0.740)#8,297 |
| 53. | Sidney | 0.70% | 0.50%(+0.201)#53 | 1.46%(-0.753)#8,385 |
| 54. | Humphrey | 0.69% | 0.50%(+0.191)#54 | 1.46%(-0.763)#8,444 |
| 55. | Uehling | 0.69% | 0.50%(+0.190)#55 | 1.46%(-0.764)#8,449 |
| 56. | Coleridge | 0.68% | 0.50%(+0.183)#56 | 1.46%(-0.771)#8,497 |
| 57. | St Edward | 0.67% | 0.50%(+0.170)#57 | 1.46%(-0.785)#8,601 |
| 58. | Ord | 0.66% | 0.50%(+0.158)#58 | 1.46%(-0.796)#8,666 |
| 59. | Clay Center | 0.64% | 0.50%(+0.139)#59 | 1.46%(-0.815)#8,822 |
| 60. | Naper | 0.64% | 0.50%(+0.139)#60 | 1.46%(-0.815)#8,823 |
| 61. | Monroe | 0.64% | 0.50%(+0.135)#61 | 1.46%(-0.819)#8,853 |
| 62. | Lyons | 0.61% | 0.50%(+0.112)#62 | 1.46%(-0.842)#9,039 |
| 63. | Omaha | 0.61% | 0.50%(+0.110)#63 | 1.46%(-0.845)#9,073 |
| 64. | Nebraska City | 0.61% | 0.50%(+0.105)#64 | 1.46%(-0.850)#9,106 |
| 65. | Table Rock | 0.60% | 0.50%(+0.097)#65 | 1.46%(-0.857)#9,162 |
| 66. | Rising City | 0.59% | 0.50%(+0.092)#66 | 1.46%(-0.862)#9,199 |
| 67. | York | 0.59% | 0.50%(+0.091)#67 | 1.46%(-0.863)#9,202 |
| 68. | Weeping Water | 0.58% | 0.50%(+0.081)#68 | 1.46%(-0.873)#9,281 |
| 69. | Howells | 0.57% | 0.50%(+0.071)#69 | 1.46%(-0.884)#9,363 |
| 70. | Humboldt | 0.57% | 0.50%(+0.069)#70 | 1.46%(-0.885)#9,378 |
| 71. | Central City | 0.56% | 0.50%(+0.059)#71 | 1.46%(-0.896)#9,478 |
| 72. | Bayard | 0.56% | 0.50%(+0.056)#72 | 1.46%(-0.898)#9,494 |
| 73. | Yutan | 0.55% | 0.50%(+0.050)#73 | 1.46%(-0.905)#9,538 |
| 74. | Seward | 0.55% | 0.50%(+0.046)#74 | 1.46%(-0.908)#9,570 |
| 75. | Plattsmouth | 0.55% | 0.50%(+0.045)#75 | 1.46%(-0.909)#9,585 |
| 76. | Benkelman | 0.54% | 0.50%(+0.041)#76 | 1.46%(-0.913)#9,616 |
| 77. | Daykin | 0.53% | 0.50%(+0.030)#77 | 1.46%(-0.924)#9,721 |
| 78. | Pawnee City | 0.53% | 0.50%(+0.028)#78 | 1.46%(-0.926)#9,736 |
| 79. | Adams | 0.53% | 0.50%(+0.027)#79 | 1.46%(-0.928)#9,743 |
| 80. | Alliance | 0.52% | 0.50%(+0.016)#80 | 1.46%(-0.938)#9,847 |
| 81. | Grant | 0.50% | 0.50%(-0.001)#81 | 1.46%(-0.955)#10,013 |
| 82. | Ravenna | 0.50% | 0.50%(-0.004)#82 | 1.46%(-0.959)#10,040 |
| 83. | Eustis | 0.49% | 0.50%(-0.013)#83 | 1.46%(-0.967)#10,105 |
| 84. | Fairmont | 0.48% | 0.50%(-0.019)#84 | 1.46%(-0.973)#10,149 |
| 85. | O Neill | 0.47% | 0.50%(-0.027)#85 | 1.46%(-0.982)#10,237 |
| 86. | Manley | 0.47% | 0.50%(-0.028)#86 | 1.46%(-0.982)#10,243 |
| 87. | Wynot | 0.47% | 0.50%(-0.028)#87 | 1.46%(-0.982)#10,244 |
| 88. | Gordon | 0.47% | 0.50%(-0.030)#88 | 1.46%(-0.984)#10,266 |
| 89. | Hildreth | 0.47% | 0.50%(-0.033)#89 | 1.46%(-0.987)#10,291 |
| 90. | Petersburg | 0.46% | 0.50%(-0.040)#90 | 1.46%(-0.994)#10,352 |
| 91. | Fairbury | 0.46% | 0.50%(-0.042)#91 | 1.46%(-0.996)#10,374 |
| 92. | Brady | 0.46% | 0.50%(-0.046)#92 | 1.46%(-1.00)#10,413 |
| 93. | Trenton | 0.45% | 0.50%(-0.049)#93 | 1.46%(-1.00)#10,431 |
| 94. | Friend | 0.45% | 0.50%(-0.054)#94 | 1.46%(-1.01)#10,471 |
| 95. | Murray | 0.44% | 0.50%(-0.066)#95 | 1.46%(-1.02)#10,581 |
| 96. | Terrytown | 0.42% | 0.50%(-0.081)#96 | 1.46%(-1.04)#10,733 |
| 97. | Kimball | 0.42% | 0.50%(-0.083)#97 | 1.46%(-1.04)#10,749 |
| 98. | Oshkosh | 0.41% | 0.50%(-0.087)#98 | 1.46%(-1.04)#10,786 |
| 99. | Cozad | 0.41% | 0.50%(-0.096)#99 | 1.46%(-1.05)#10,857 |
| 100. | Cortland | 0.38% | 0.50%(-0.118)#100 | 1.46%(-1.07)#11,083 |
Common Questions
What are the Top 10 Cities with the Highest Percentage of Immigrants from Europe in Nebraska?
Top 10 Cities with the Highest Percentage of Immigrants from Europe in Nebraska are:
#1
13.87%
#2
10.87%
#3
5.43%
#4
3.57%
#5
3.28%
#6
2.63%
#7
2.13%
#8
2.10%
#9
2.05%
#10
1.69%
What city has the Highest Percentage of Immigrants from Europe in Nebraska?
Benedict has the Highest Percentage of Immigrants from Europe in Nebraska with 13.87%.
What is the Percentage of Immigrants from Europe in the State of Nebraska?
Percentage of Immigrants from Europe in Nebraska is 0.50%.
What is the Percentage of Immigrants from Europe in the United States?
Percentage of Immigrants from Europe in the United States is 1.46%.