Cities with the Highest Percentage of Population Employed in Administrative & Support Services in Washington
RELATED REPORTS & OPTIONS
Administrative & Support Services
Washington
Compare Cities
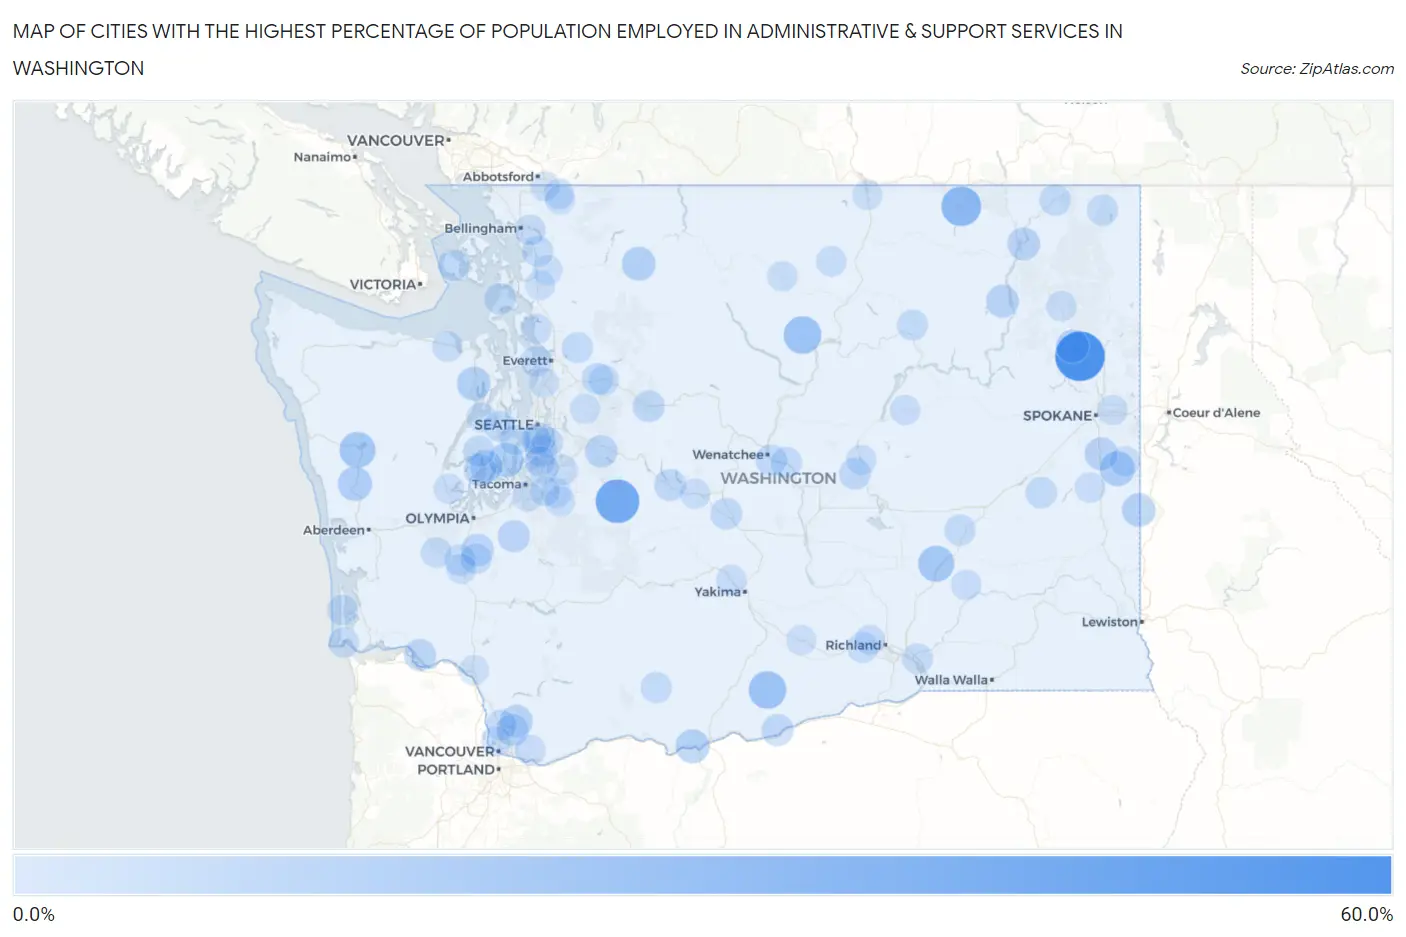
Map of Cities with the Highest Percentage of Population Employed in Administrative & Support Services in Washington
0.0%
60.0%
Cities with the Highest Percentage of Population Employed in Administrative & Support Services in Washington
| City | % Employed | vs State | vs National | |
| 1. | Clayton | 57.3% | 3.8%(+53.6)#1 | 4.1%(+53.2)#38 |
| 2. | Greenwater | 41.4% | 3.8%(+37.7)#2 | 4.1%(+37.3)#97 |
| 3. | Curlew | 30.6% | 3.8%(+26.8)#3 | 4.1%(+26.5)#175 |
| 4. | Methow | 25.0% | 3.8%(+21.2)#4 | 4.1%(+20.9)#282 |
| 5. | Bickleton | 25.0% | 3.8%(+21.2)#5 | 4.1%(+20.9)#283 |
| 6. | Hatton | 21.0% | 3.8%(+17.2)#6 | 4.1%(+16.8)#408 |
| 7. | Amanda Park | 20.8% | 3.8%(+17.1)#7 | 4.1%(+16.7)#412 |
| 8. | Waverly | 18.0% | 3.8%(+14.2)#8 | 4.1%(+13.8)#543 |
| 9. | Purdy | 17.4% | 3.8%(+13.7)#9 | 4.1%(+13.3)#581 |
| 10. | Clear Lake Cdp Pierce County | 16.7% | 3.8%(+13.0)#10 | 4.1%(+12.6)#626 |
| 11. | Humptulips | 16.4% | 3.8%(+12.7)#11 | 4.1%(+12.3)#652 |
| 12. | Wishram | 15.6% | 3.8%(+11.9)#12 | 4.1%(+11.5)#717 |
| 13. | Marblemount | 15.3% | 3.8%(+11.5)#13 | 4.1%(+11.2)#762 |
| 14. | Quilcene | 15.1% | 3.8%(+11.4)#14 | 4.1%(+11.0)#778 |
| 15. | Farmington | 14.3% | 3.8%(+10.5)#15 | 4.1%(+10.1)#904 |
| 16. | Loon Lake | 13.7% | 3.8%(+9.96)#16 | 4.1%(+9.58)#987 |
| 17. | Lewisville | 13.2% | 3.8%(+9.43)#17 | 4.1%(+9.05)#1,079 |
| 18. | Spangle | 13.1% | 3.8%(+9.34)#18 | 4.1%(+8.95)#1,099 |
| 19. | Inchelium | 12.8% | 3.8%(+9.05)#19 | 4.1%(+8.67)#1,151 |
| 20. | Marcus | 12.8% | 3.8%(+9.00)#20 | 4.1%(+8.62)#1,165 |
| 21. | Pataha | 12.5% | 3.8%(+8.73)#21 | 4.1%(+8.35)#1,210 |
| 22. | Tenino | 12.3% | 3.8%(+8.57)#22 | 4.1%(+8.18)#1,239 |
| 23. | Wilderness Rim | 11.7% | 3.8%(+7.96)#23 | 4.1%(+7.58)#1,372 |
| 24. | Vaughn | 11.6% | 3.8%(+7.88)#24 | 4.1%(+7.50)#1,393 |
| 25. | Meadow Glade | 11.5% | 3.8%(+7.70)#25 | 4.1%(+7.32)#1,430 |
| 26. | Mckenna | 11.2% | 3.8%(+7.40)#26 | 4.1%(+7.02)#1,500 |
| 27. | Grapeview | 11.1% | 3.8%(+7.33)#27 | 4.1%(+6.94)#1,530 |
| 28. | Lower Elochoman | 10.8% | 3.8%(+7.02)#28 | 4.1%(+6.64)#1,616 |
| 29. | Whidbey Island Station | 10.4% | 3.8%(+6.68)#29 | 4.1%(+6.30)#1,720 |
| 30. | Skykomish | 10.4% | 3.8%(+6.65)#30 | 4.1%(+6.27)#1,734 |
| 31. | Roosevelt | 10.3% | 3.8%(+6.58)#31 | 4.1%(+6.20)#1,762 |
| 32. | Seatac | 10.2% | 3.8%(+6.39)#32 | 4.1%(+6.01)#1,835 |
| 33. | Easton | 10.1% | 3.8%(+6.37)#33 | 4.1%(+5.99)#1,842 |
| 34. | Ephrata | 10.0% | 3.8%(+6.22)#34 | 4.1%(+5.84)#1,923 |
| 35. | Boulevard Park | 10.0% | 3.8%(+6.21)#35 | 4.1%(+5.82)#1,928 |
| 36. | Thorp | 9.8% | 3.8%(+5.99)#36 | 4.1%(+5.61)#2,014 |
| 37. | Sultan | 9.6% | 3.8%(+5.81)#37 | 4.1%(+5.43)#2,086 |
| 38. | Lamont | 9.4% | 3.8%(+5.67)#38 | 4.1%(+5.28)#2,153 |
| 39. | Friday Harbor | 9.4% | 3.8%(+5.59)#39 | 4.1%(+5.20)#2,189 |
| 40. | Belfair | 9.3% | 3.8%(+5.55)#40 | 4.1%(+5.17)#2,204 |
| 41. | South Wenatchee | 9.3% | 3.8%(+5.54)#41 | 4.1%(+5.15)#2,209 |
| 42. | Rocky Point | 9.3% | 3.8%(+5.51)#42 | 4.1%(+5.12)#2,228 |
| 43. | Northport | 9.3% | 3.8%(+5.49)#43 | 4.1%(+5.11)#2,234 |
| 44. | Lind | 9.0% | 3.8%(+5.19)#44 | 4.1%(+4.81)#2,395 |
| 45. | Grand Mound | 9.0% | 3.8%(+5.19)#45 | 4.1%(+4.80)#2,401 |
| 46. | Rock Island | 8.9% | 3.8%(+5.17)#46 | 4.1%(+4.79)#2,410 |
| 47. | Glenwood | 8.8% | 3.8%(+5.08)#47 | 4.1%(+4.70)#2,466 |
| 48. | Metaline Falls | 8.7% | 3.8%(+4.93)#48 | 4.1%(+4.55)#2,554 |
| 49. | Alger | 8.5% | 3.8%(+4.77)#49 | 4.1%(+4.39)#2,660 |
| 50. | Lake Bosworth | 8.5% | 3.8%(+4.75)#50 | 4.1%(+4.36)#2,673 |
| 51. | Nespelem Community | 8.2% | 3.8%(+4.42)#51 | 4.1%(+4.03)#2,880 |
| 52. | Bucoda | 8.1% | 3.8%(+4.37)#52 | 4.1%(+3.98)#2,905 |
| 53. | Startup | 8.0% | 3.8%(+4.20)#53 | 4.1%(+3.82)#3,009 |
| 54. | Geneva | 7.9% | 3.8%(+4.18)#54 | 4.1%(+3.79)#3,031 |
| 55. | Clinton | 7.9% | 3.8%(+4.17)#55 | 4.1%(+3.79)#3,037 |
| 56. | Benton City | 7.7% | 3.8%(+3.97)#56 | 4.1%(+3.59)#3,195 |
| 57. | Oakville | 7.6% | 3.8%(+3.79)#57 | 4.1%(+3.40)#3,335 |
| 58. | Bryn Mawr Skyway | 7.5% | 3.8%(+3.77)#58 | 4.1%(+3.39)#3,354 |
| 59. | Duluth | 7.5% | 3.8%(+3.73)#59 | 4.1%(+3.35)#3,403 |
| 60. | Ocean Park | 7.5% | 3.8%(+3.71)#60 | 4.1%(+3.33)#3,419 |
| 61. | Burbank | 7.5% | 3.8%(+3.70)#61 | 4.1%(+3.32)#3,432 |
| 62. | Conconully | 7.5% | 3.8%(+3.70)#62 | 4.1%(+3.31)#3,435 |
| 63. | River Road | 7.4% | 3.8%(+3.68)#63 | 4.1%(+3.30)#3,455 |
| 64. | Ilwaco | 7.3% | 3.8%(+3.57)#64 | 4.1%(+3.19)#3,552 |
| 65. | Warm Beach | 7.3% | 3.8%(+3.52)#65 | 4.1%(+3.14)#3,598 |
| 66. | Midland | 7.3% | 3.8%(+3.48)#66 | 4.1%(+3.10)#3,635 |
| 67. | Fern Prairie | 7.2% | 3.8%(+3.46)#67 | 4.1%(+3.07)#3,663 |
| 68. | Millwood | 7.2% | 3.8%(+3.38)#68 | 4.1%(+3.00)#3,732 |
| 69. | Malden | 7.1% | 3.8%(+3.38)#69 | 4.1%(+2.99)#3,752 |
| 70. | Peaceful Valley | 7.1% | 3.8%(+3.35)#70 | 4.1%(+2.97)#3,779 |
| 71. | Fairfield | 7.1% | 3.8%(+3.35)#71 | 4.1%(+2.96)#3,787 |
| 72. | Shelton | 7.0% | 3.8%(+3.24)#72 | 4.1%(+2.86)#3,902 |
| 73. | Eschbach | 6.9% | 3.8%(+3.16)#73 | 4.1%(+2.77)#3,970 |
| 74. | Lake Morton Berrydale | 6.9% | 3.8%(+3.15)#74 | 4.1%(+2.77)#3,975 |
| 75. | Soap Lake | 6.9% | 3.8%(+3.09)#75 | 4.1%(+2.71)#4,042 |
| 76. | Chewelah | 6.8% | 3.8%(+3.04)#76 | 4.1%(+2.65)#4,095 |
| 77. | Kahlotus | 6.8% | 3.8%(+3.01)#77 | 4.1%(+2.63)#4,118 |
| 78. | Fords Prairie | 6.7% | 3.8%(+2.90)#78 | 4.1%(+2.52)#4,216 |
| 79. | South Cle Elum | 6.7% | 3.8%(+2.90)#79 | 4.1%(+2.52)#4,222 |
| 80. | Hartline | 6.7% | 3.8%(+2.90)#80 | 4.1%(+2.52)#4,235 |
| 81. | Winthrop | 6.6% | 3.8%(+2.87)#81 | 4.1%(+2.48)#4,281 |
| 82. | West Richland | 6.6% | 3.8%(+2.86)#82 | 4.1%(+2.47)#4,292 |
| 83. | Lakeland North | 6.6% | 3.8%(+2.83)#83 | 4.1%(+2.44)#4,331 |
| 84. | Des Moines | 6.6% | 3.8%(+2.82)#84 | 4.1%(+2.44)#4,333 |
| 85. | White Center | 6.5% | 3.8%(+2.76)#85 | 4.1%(+2.37)#4,406 |
| 86. | Bonney Lake | 6.5% | 3.8%(+2.75)#86 | 4.1%(+2.36)#4,429 |
| 87. | Prairie Ridge | 6.5% | 3.8%(+2.75)#87 | 4.1%(+2.36)#4,431 |
| 88. | Lake Marcel Stillwater | 6.4% | 3.8%(+2.67)#88 | 4.1%(+2.28)#4,526 |
| 89. | North Lynnwood | 6.4% | 3.8%(+2.66)#89 | 4.1%(+2.28)#4,533 |
| 90. | Southworth | 6.4% | 3.8%(+2.64)#90 | 4.1%(+2.25)#4,567 |
| 91. | Kelso | 6.4% | 3.8%(+2.63)#91 | 4.1%(+2.25)#4,570 |
| 92. | Lake Shore | 6.2% | 3.8%(+2.48)#92 | 4.1%(+2.09)#4,783 |
| 93. | Sedro Woolley | 6.2% | 3.8%(+2.43)#93 | 4.1%(+2.05)#4,845 |
| 94. | Seabeck | 6.1% | 3.8%(+2.34)#94 | 4.1%(+1.95)#4,977 |
| 95. | Oroville | 6.1% | 3.8%(+2.31)#95 | 4.1%(+1.93)#5,007 |
| 96. | Sumas | 6.1% | 3.8%(+2.31)#96 | 4.1%(+1.93)#5,010 |
| 97. | Kendall | 6.1% | 3.8%(+2.31)#97 | 4.1%(+1.93)#5,015 |
| 98. | North Puyallup | 6.1% | 3.8%(+2.30)#98 | 4.1%(+1.92)#5,030 |
| 99. | Sunnyside | 6.0% | 3.8%(+2.27)#99 | 4.1%(+1.88)#5,085 |
| 100. | Mount Vernon | 6.0% | 3.8%(+2.25)#100 | 4.1%(+1.86)#5,127 |
Common Questions
What are the Top 10 Cities with the Highest Percentage of Population Employed in Administrative & Support Services in Washington?
Top 10 Cities with the Highest Percentage of Population Employed in Administrative & Support Services in Washington are:
#1
57.3%
#2
41.4%
#3
30.6%
#4
25.0%
#5
25.0%
#6
21.0%
#7
20.8%
#8
18.0%
#9
17.4%
#10
16.4%
What city has the Highest Percentage of Population Employed in Administrative & Support Services in Washington?
Clayton has the Highest Percentage of Population Employed in Administrative & Support Services in Washington with 57.3%.
What is the Percentage of Population Employed in Administrative & Support Services in the State of Washington?
Percentage of Population Employed in Administrative & Support Services in Washington is 3.8%.
What is the Percentage of Population Employed in Administrative & Support Services in the United States?
Percentage of Population Employed in Administrative & Support Services in the United States is 4.1%.