Zip Codes with the Highest Percentage of Population Employed in Administrative & Support Services in Dearborn, MI
RELATED REPORTS & OPTIONS
Administrative & Support Services
Dearborn
Compare Zip Codes
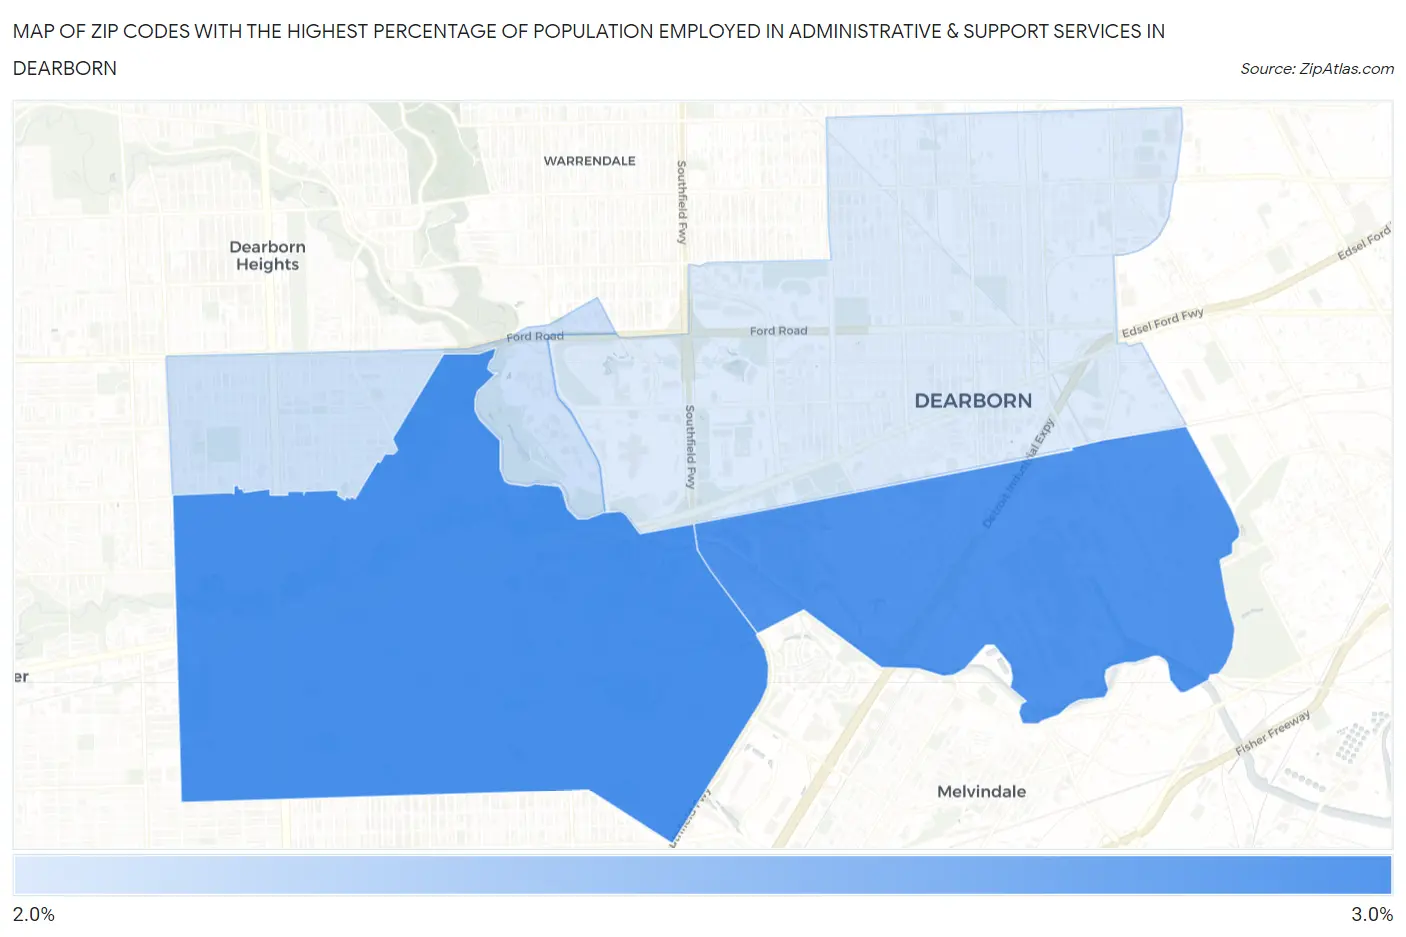
Map of Zip Codes with the Highest Percentage of Population Employed in Administrative & Support Services in Dearborn
0.0%
3.0%
Zip Codes with the Highest Percentage of Population Employed in Administrative & Support Services in Dearborn, MI
| Zip Code | % Employed | vs State | vs National | |
| 1. | 48124 | 3.0% | 3.7%(-0.775)#532 | 4.1%(-1.20)#15,726 |
| 2. | 48120 | 2.9% | 3.7%(-0.817)#536 | 4.1%(-1.24)#15,939 |
| 3. | 48128 | 2.2% | 3.7%(-1.55)#693 | 4.1%(-1.98)#19,774 |
| 4. | 48126 | 2.1% | 3.7%(-1.65)#718 | 4.1%(-2.08)#20,253 |
1
Common Questions
What are the Top 3 Zip Codes with the Highest Percentage of Population Employed in Administrative & Support Services in Dearborn, MI?
Top 3 Zip Codes with the Highest Percentage of Population Employed in Administrative & Support Services in Dearborn, MI are:
What zip code has the Highest Percentage of Population Employed in Administrative & Support Services in Dearborn, MI?
48124 has the Highest Percentage of Population Employed in Administrative & Support Services in Dearborn, MI with 3.0%.
What is the Percentage of Population Employed in Administrative & Support Services in Dearborn, MI?
Percentage of Population Employed in Administrative & Support Services in Dearborn is 2.5%.
What is the Percentage of Population Employed in Administrative & Support Services in Michigan?
Percentage of Population Employed in Administrative & Support Services in Michigan is 3.7%.
What is the Percentage of Population Employed in Administrative & Support Services in the United States?
Percentage of Population Employed in Administrative & Support Services in the United States is 4.1%.