Cities with the Highest Percentage of Population Employed in Administrative & Support Services in South Carolina
RELATED REPORTS & OPTIONS
Administrative & Support Services
South Carolina
Compare Cities
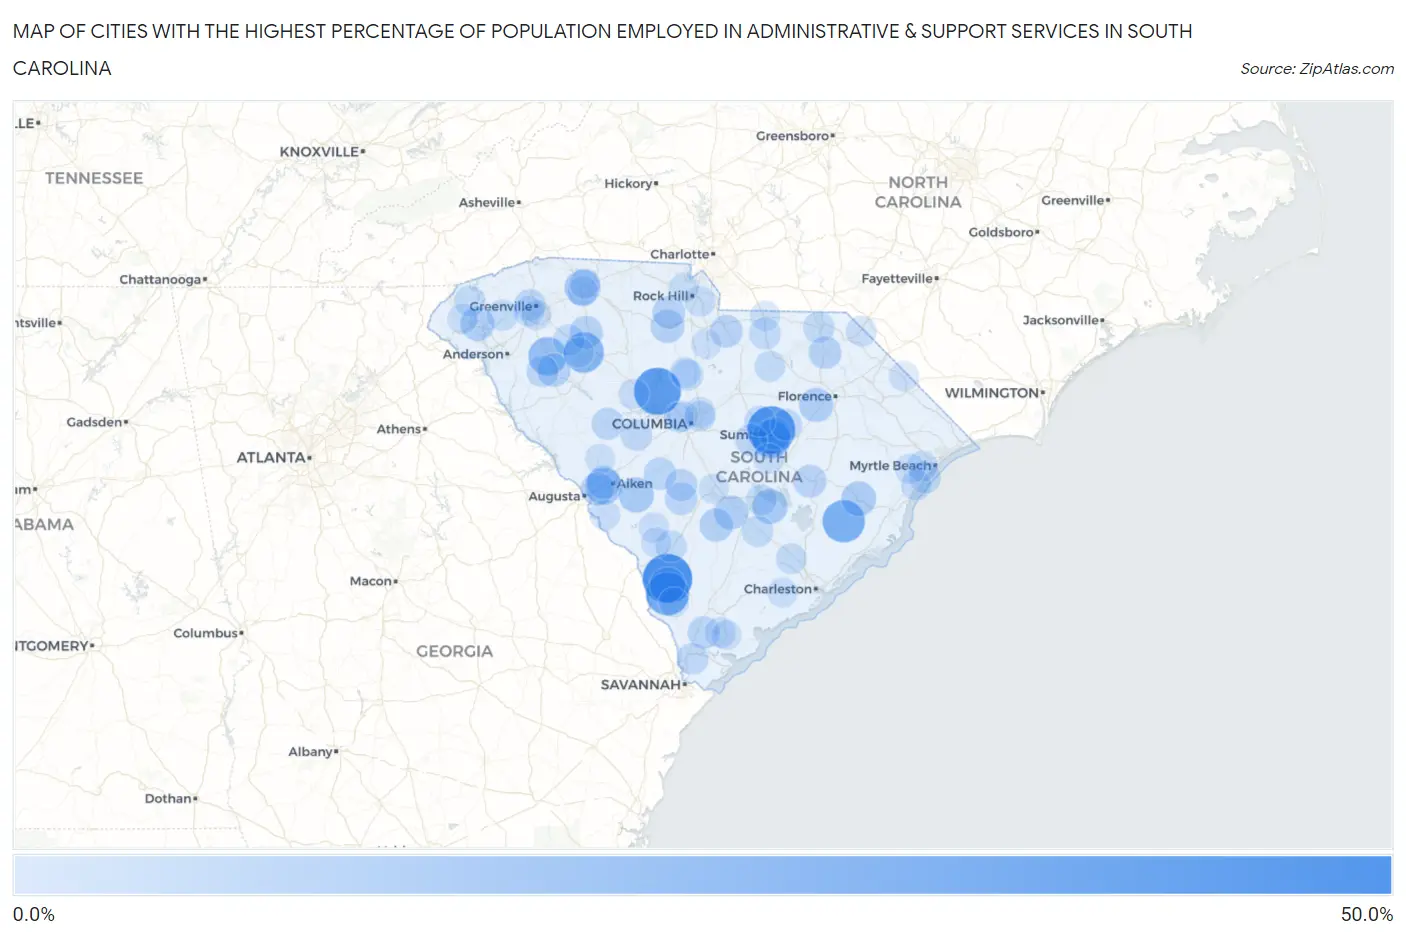
Map of Cities with the Highest Percentage of Population Employed in Administrative & Support Services in South Carolina
0.0%
50.0%
Cities with the Highest Percentage of Population Employed in Administrative & Support Services in South Carolina
| City | % Employed | vs State | vs National | |
| 1. | Gifford | 46.5% | 4.8%(+41.7)#1 | 4.1%(+42.4)#72 |
| 2. | Mulberry | 42.9% | 4.8%(+38.0)#2 | 4.1%(+38.7)#87 |
| 3. | Peak | 41.2% | 4.8%(+36.3)#3 | 4.1%(+37.0)#100 |
| 4. | Estill | 33.4% | 4.8%(+28.5)#4 | 4.1%(+29.2)#138 |
| 5. | Jamestown | 31.9% | 4.8%(+27.1)#5 | 4.1%(+27.8)#160 |
| 6. | Manville | 29.0% | 4.8%(+24.2)#6 | 4.1%(+24.9)#203 |
| 7. | Watts Mills | 27.9% | 4.8%(+23.1)#7 | 4.1%(+23.8)#225 |
| 8. | South Sumter | 24.4% | 4.8%(+19.5)#8 | 4.1%(+20.2)#303 |
| 9. | Princeton | 23.6% | 4.8%(+18.8)#9 | 4.1%(+19.5)#322 |
| 10. | Lobeco | 23.0% | 4.8%(+18.2)#10 | 4.1%(+18.9)#345 |
| 11. | The Cliffs Valley | 22.3% | 4.8%(+17.4)#11 | 4.1%(+18.1)#364 |
| 12. | Wisacky | 21.0% | 4.8%(+16.2)#12 | 4.1%(+16.9)#407 |
| 13. | Warrenville | 19.9% | 4.8%(+15.0)#13 | 4.1%(+15.7)#446 |
| 14. | Seabrook | 18.9% | 4.8%(+14.0)#14 | 4.1%(+14.7)#489 |
| 15. | Southern Shops | 18.6% | 4.8%(+13.8)#15 | 4.1%(+14.5)#502 |
| 16. | Luray | 18.3% | 4.8%(+13.4)#16 | 4.1%(+14.1)#520 |
| 17. | Eutawville | 17.6% | 4.8%(+12.8)#17 | 4.1%(+13.5)#569 |
| 18. | Windsor | 17.5% | 4.8%(+12.7)#18 | 4.1%(+13.4)#572 |
| 19. | Andrews | 16.6% | 4.8%(+11.8)#19 | 4.1%(+12.5)#639 |
| 20. | Fairview Crossroads | 16.6% | 4.8%(+11.7)#20 | 4.1%(+12.4)#641 |
| 21. | Timmonsville | 15.8% | 4.8%(+11.0)#21 | 4.1%(+11.7)#695 |
| 22. | Newry | 15.6% | 4.8%(+10.8)#22 | 4.1%(+11.5)#719 |
| 23. | Debordieu Colony | 15.6% | 4.8%(+10.7)#23 | 4.1%(+11.4)#726 |
| 24. | Bowman | 15.3% | 4.8%(+10.5)#24 | 4.1%(+11.2)#765 |
| 25. | Branchville | 14.4% | 4.8%(+9.60)#25 | 4.1%(+10.3)#872 |
| 26. | Gayle Mill | 14.4% | 4.8%(+9.60)#26 | 4.1%(+10.3)#873 |
| 27. | Ware Shoals | 13.9% | 4.8%(+9.05)#27 | 4.1%(+9.75)#958 |
| 28. | Graniteville | 13.8% | 4.8%(+8.93)#28 | 4.1%(+9.63)#976 |
| 29. | Burnettown | 13.6% | 4.8%(+8.76)#29 | 4.1%(+9.45)#1,019 |
| 30. | Enoree | 13.6% | 4.8%(+8.72)#30 | 4.1%(+9.42)#1,025 |
| 31. | Greeleyville | 13.1% | 4.8%(+8.26)#31 | 4.1%(+8.95)#1,098 |
| 32. | Lowrys | 13.0% | 4.8%(+8.12)#32 | 4.1%(+8.81)#1,126 |
| 33. | Society Hill | 12.7% | 4.8%(+7.87)#33 | 4.1%(+8.56)#1,173 |
| 34. | Elgin | 12.6% | 4.8%(+7.74)#34 | 4.1%(+8.44)#1,193 |
| 35. | Perry | 12.4% | 4.8%(+7.55)#35 | 4.1%(+8.24)#1,229 |
| 36. | East Sumter | 12.4% | 4.8%(+7.52)#36 | 4.1%(+8.21)#1,231 |
| 37. | Norway | 12.2% | 4.8%(+7.37)#37 | 4.1%(+8.06)#1,265 |
| 38. | Ridgeland | 12.2% | 4.8%(+7.35)#38 | 4.1%(+8.04)#1,272 |
| 39. | Arthurtown | 12.0% | 4.8%(+7.12)#39 | 4.1%(+7.81)#1,319 |
| 40. | East Camden | 11.9% | 4.8%(+7.03)#40 | 4.1%(+7.73)#1,340 |
| 41. | Livingston | 11.8% | 4.8%(+6.92)#41 | 4.1%(+7.61)#1,365 |
| 42. | Wedgefield | 11.4% | 4.8%(+6.53)#42 | 4.1%(+7.23)#1,449 |
| 43. | Saluda | 11.4% | 4.8%(+6.52)#43 | 4.1%(+7.22)#1,452 |
| 44. | Donalds | 10.9% | 4.8%(+6.11)#44 | 4.1%(+6.80)#1,570 |
| 45. | Hardeeville | 10.9% | 4.8%(+6.04)#45 | 4.1%(+6.73)#1,591 |
| 46. | Mayesville | 10.9% | 4.8%(+6.01)#46 | 4.1%(+6.71)#1,600 |
| 47. | Surfside Beach | 10.8% | 4.8%(+5.95)#47 | 4.1%(+6.64)#1,615 |
| 48. | Parker | 10.8% | 4.8%(+5.91)#48 | 4.1%(+6.60)#1,627 |
| 49. | Batesburg Leesville | 10.7% | 4.8%(+5.82)#49 | 4.1%(+6.51)#1,646 |
| 50. | Gray Court | 10.6% | 4.8%(+5.78)#50 | 4.1%(+6.47)#1,659 |
| 51. | Harleyville | 10.5% | 4.8%(+5.68)#51 | 4.1%(+6.38)#1,683 |
| 52. | Ulmer | 10.5% | 4.8%(+5.68)#52 | 4.1%(+6.38)#1,689 |
| 53. | Winnsboro Mills | 10.5% | 4.8%(+5.67)#53 | 4.1%(+6.36)#1,696 |
| 54. | Jefferson | 10.5% | 4.8%(+5.65)#54 | 4.1%(+6.35)#1,699 |
| 55. | Arkwright | 10.5% | 4.8%(+5.63)#55 | 4.1%(+6.32)#1,709 |
| 56. | Beech Island | 10.3% | 4.8%(+5.42)#56 | 4.1%(+6.11)#1,792 |
| 57. | Cheraw | 10.2% | 4.8%(+5.35)#57 | 4.1%(+6.04)#1,818 |
| 58. | Dalzell | 10.0% | 4.8%(+5.18)#58 | 4.1%(+5.87)#1,889 |
| 59. | Liberty | 10.0% | 4.8%(+5.11)#59 | 4.1%(+5.81)#1,931 |
| 60. | La France | 9.9% | 4.8%(+5.10)#60 | 4.1%(+5.80)#1,935 |
| 61. | Adams Run | 9.8% | 4.8%(+4.98)#61 | 4.1%(+5.67)#1,983 |
| 62. | Salem | 9.8% | 4.8%(+4.96)#62 | 4.1%(+5.65)#1,991 |
| 63. | Vance | 9.8% | 4.8%(+4.96)#63 | 4.1%(+5.65)#1,993 |
| 64. | Cash | 9.8% | 4.8%(+4.93)#64 | 4.1%(+5.62)#2,001 |
| 65. | Ben Avon | 9.5% | 4.8%(+4.63)#65 | 4.1%(+5.33)#2,131 |
| 66. | Lincolnville | 9.5% | 4.8%(+4.62)#66 | 4.1%(+5.31)#2,140 |
| 67. | Bethune | 9.5% | 4.8%(+4.62)#67 | 4.1%(+5.31)#2,141 |
| 68. | Dentsville | 9.3% | 4.8%(+4.50)#68 | 4.1%(+5.19)#2,190 |
| 69. | Laurel Bay | 9.3% | 4.8%(+4.49)#69 | 4.1%(+5.19)#2,193 |
| 70. | St Andrews | 9.3% | 4.8%(+4.46)#70 | 4.1%(+5.16)#2,208 |
| 71. | Lesslie | 9.3% | 4.8%(+4.43)#71 | 4.1%(+5.12)#2,226 |
| 72. | Welcome | 9.1% | 4.8%(+4.22)#72 | 4.1%(+4.92)#2,342 |
| 73. | Socastee | 8.9% | 4.8%(+4.10)#73 | 4.1%(+4.80)#2,406 |
| 74. | Mccoll | 8.9% | 4.8%(+4.05)#74 | 4.1%(+4.75)#2,436 |
| 75. | Arcadia Lakes | 8.9% | 4.8%(+4.03)#75 | 4.1%(+4.72)#2,458 |
| 76. | Paxville | 8.8% | 4.8%(+3.98)#76 | 4.1%(+4.67)#2,485 |
| 77. | Murrells Inlet | 8.7% | 4.8%(+3.87)#77 | 4.1%(+4.57)#2,542 |
| 78. | White Knoll | 8.7% | 4.8%(+3.85)#78 | 4.1%(+4.55)#2,551 |
| 79. | Barnwell | 8.7% | 4.8%(+3.85)#79 | 4.1%(+4.54)#2,566 |
| 80. | Winnsboro | 8.7% | 4.8%(+3.82)#80 | 4.1%(+4.51)#2,581 |
| 81. | West Union | 8.6% | 4.8%(+3.75)#81 | 4.1%(+4.44)#2,623 |
| 82. | Bucksport | 8.6% | 4.8%(+3.73)#82 | 4.1%(+4.42)#2,632 |
| 83. | Kline | 8.6% | 4.8%(+3.73)#83 | 4.1%(+4.42)#2,636 |
| 84. | Jackson | 8.5% | 4.8%(+3.64)#84 | 4.1%(+4.34)#2,688 |
| 85. | Seven Oaks | 8.5% | 4.8%(+3.63)#85 | 4.1%(+4.33)#2,692 |
| 86. | Arcadia | 8.5% | 4.8%(+3.62)#86 | 4.1%(+4.31)#2,698 |
| 87. | Prosperity | 8.4% | 4.8%(+3.58)#87 | 4.1%(+4.28)#2,718 |
| 88. | Gantt | 8.4% | 4.8%(+3.52)#88 | 4.1%(+4.21)#2,756 |
| 89. | Valley Falls | 8.3% | 4.8%(+3.41)#89 | 4.1%(+4.11)#2,827 |
| 90. | Hollywood | 8.2% | 4.8%(+3.38)#90 | 4.1%(+4.07)#2,855 |
| 91. | Whitney | 8.2% | 4.8%(+3.34)#91 | 4.1%(+4.04)#2,878 |
| 92. | Laurens | 8.2% | 4.8%(+3.33)#92 | 4.1%(+4.02)#2,887 |
| 93. | Brookdale | 8.1% | 4.8%(+3.23)#93 | 4.1%(+3.92)#2,946 |
| 94. | Great Falls | 7.9% | 4.8%(+3.10)#94 | 4.1%(+3.79)#3,034 |
| 95. | Furman | 7.8% | 4.8%(+2.99)#95 | 4.1%(+3.68)#3,123 |
| 96. | Lake View | 7.8% | 4.8%(+2.94)#96 | 4.1%(+3.64)#3,153 |
| 97. | Pageland | 7.8% | 4.8%(+2.91)#97 | 4.1%(+3.60)#3,185 |
| 98. | Beaufort | 7.7% | 4.8%(+2.91)#98 | 4.1%(+3.60)#3,186 |
| 99. | Newport | 7.7% | 4.8%(+2.90)#99 | 4.1%(+3.59)#3,189 |
| 100. | Trenton | 7.7% | 4.8%(+2.89)#100 | 4.1%(+3.59)#3,193 |
Common Questions
What are the Top 10 Cities with the Highest Percentage of Population Employed in Administrative & Support Services in South Carolina?
Top 10 Cities with the Highest Percentage of Population Employed in Administrative & Support Services in South Carolina are:
#1
46.5%
#2
42.9%
#3
41.2%
#4
33.4%
#5
31.9%
#6
27.9%
#7
24.4%
#8
23.6%
#9
19.9%
#10
18.6%
What city has the Highest Percentage of Population Employed in Administrative & Support Services in South Carolina?
Gifford has the Highest Percentage of Population Employed in Administrative & Support Services in South Carolina with 46.5%.
What is the Percentage of Population Employed in Administrative & Support Services in the State of South Carolina?
Percentage of Population Employed in Administrative & Support Services in South Carolina is 4.8%.
What is the Percentage of Population Employed in Administrative & Support Services in the United States?
Percentage of Population Employed in Administrative & Support Services in the United States is 4.1%.