Cities with the Highest Percentage of Population Employed in Administrative & Support Services in Connecticut
RELATED REPORTS & OPTIONS
Administrative & Support Services
Connecticut
Compare Cities
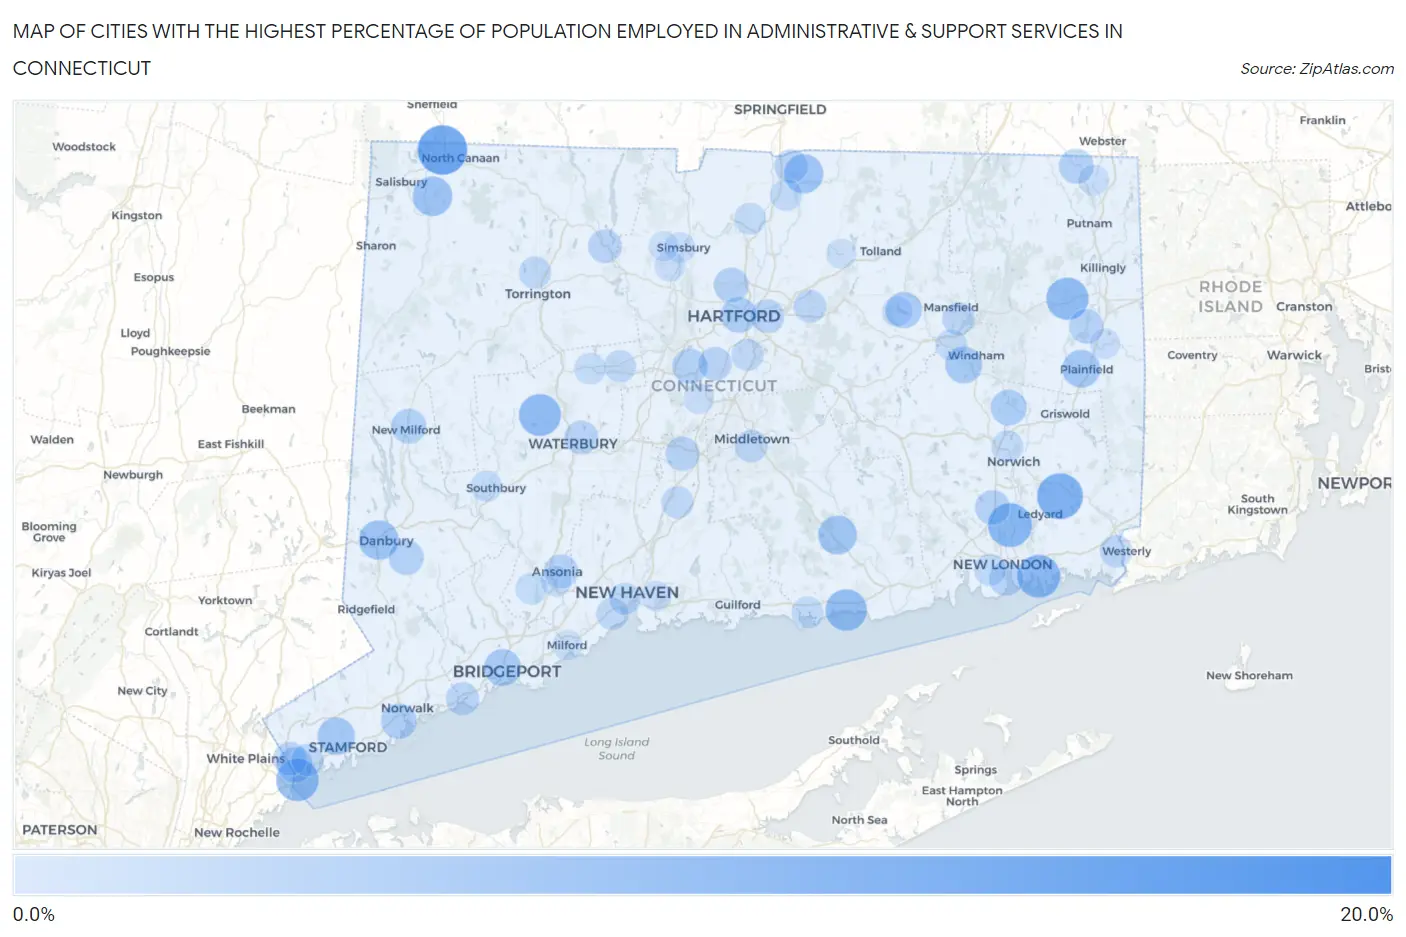
Map of Cities with the Highest Percentage of Population Employed in Administrative & Support Services in Connecticut
0.0%
20.0%
Cities with the Highest Percentage of Population Employed in Administrative & Support Services in Connecticut
| City | % Employed | vs State | vs National | |
| 1. | Lake Bungee | 18.4% | 4.0%(+14.5)#1 | 4.1%(+14.3)#511 |
| 2. | Canaan | 14.1% | 4.0%(+10.2)#2 | 4.1%(+10.00)#922 |
| 3. | Route 7 Gateway | 12.9% | 4.0%(+8.98)#3 | 4.1%(+8.79)#1,129 |
| 4. | Mashantucket | 11.9% | 4.0%(+7.94)#4 | 4.1%(+7.75)#1,332 |
| 5. | Cornwall Bridge | 11.2% | 4.0%(+7.26)#5 | 4.1%(+7.07)#1,487 |
| 6. | Gales Ferry | 10.9% | 4.0%(+6.92)#6 | 4.1%(+6.73)#1,589 |
| 7. | South Wilton | 10.5% | 4.0%(+6.54)#7 | 4.1%(+6.35)#1,697 |
| 8. | Poquonock Bridge | 10.2% | 4.0%(+6.26)#8 | 4.1%(+6.07)#1,808 |
| 9. | Byram | 9.9% | 4.0%(+5.91)#9 | 4.1%(+5.72)#1,961 |
| 10. | Brooklyn | 9.8% | 4.0%(+5.81)#10 | 4.1%(+5.62)#2,002 |
| 11. | Watertown | 9.7% | 4.0%(+5.73)#11 | 4.1%(+5.54)#2,040 |
| 12. | Westbrook Center | 9.4% | 4.0%(+5.41)#12 | 4.1%(+5.22)#2,186 |
| 13. | Stepney | 8.8% | 4.0%(+4.89)#13 | 4.1%(+4.70)#2,467 |
| 14. | Falls Village | 8.2% | 4.0%(+4.26)#14 | 4.1%(+4.07)#2,858 |
| 15. | Danbury | 8.2% | 4.0%(+4.20)#15 | 4.1%(+4.01)#2,895 |
| 16. | Candlewood Shores | 8.0% | 4.0%(+4.01)#16 | 4.1%(+3.82)#3,013 |
| 17. | Hazardville | 7.9% | 4.0%(+3.92)#17 | 4.1%(+3.74)#3,081 |
| 18. | Chester Center | 7.7% | 4.0%(+3.75)#18 | 4.1%(+3.56)#3,209 |
| 19. | Saugatuck | 7.5% | 4.0%(+3.51)#19 | 4.1%(+3.32)#3,420 |
| 20. | Plainfield Village | 7.2% | 4.0%(+3.27)#20 | 4.1%(+3.08)#3,653 |
| 21. | Stamford | 7.0% | 4.0%(+3.09)#21 | 4.1%(+2.90)#3,857 |
| 22. | Dayville | 7.0% | 4.0%(+3.00)#22 | 4.1%(+2.81)#3,945 |
| 23. | South Windham | 6.6% | 4.0%(+2.69)#23 | 4.1%(+2.50)#4,267 |
| 24. | Bridgeport | 6.6% | 4.0%(+2.65)#24 | 4.1%(+2.46)#4,311 |
| 25. | Stratford Downtown | 6.5% | 4.0%(+2.56)#25 | 4.1%(+2.37)#4,409 |
| 26. | South Coventry | 6.3% | 4.0%(+2.33)#26 | 4.1%(+2.14)#4,702 |
| 27. | Baltic | 6.1% | 4.0%(+2.12)#27 | 4.1%(+1.94)#4,999 |
| 28. | Hartford | 6.0% | 4.0%(+2.08)#28 | 4.1%(+1.89)#5,073 |
| 29. | Pemberwick | 5.9% | 4.0%(+1.90)#29 | 4.1%(+1.71)#5,367 |
| 30. | Groton Long Point Borough | 5.9% | 4.0%(+1.90)#30 | 4.1%(+1.71)#5,369 |
| 31. | Norwalk | 5.8% | 4.0%(+1.82)#31 | 4.1%(+1.63)#5,492 |
| 32. | New Britain | 5.6% | 4.0%(+1.68)#32 | 4.1%(+1.49)#5,722 |
| 33. | Lordship | 5.6% | 4.0%(+1.62)#33 | 4.1%(+1.43)#5,839 |
| 34. | Westport | 5.6% | 4.0%(+1.61)#34 | 4.1%(+1.42)#5,858 |
| 35. | New Milford | 5.6% | 4.0%(+1.60)#35 | 4.1%(+1.41)#5,872 |
| 36. | Bethel | 5.5% | 4.0%(+1.57)#36 | 4.1%(+1.38)#5,940 |
| 37. | Stonington Borough | 5.5% | 4.0%(+1.53)#37 | 4.1%(+1.34)#6,023 |
| 38. | Quinebaug | 5.4% | 4.0%(+1.48)#38 | 4.1%(+1.29)#6,120 |
| 39. | Blue Hills | 5.4% | 4.0%(+1.47)#39 | 4.1%(+1.28)#6,135 |
| 40. | Oxoboxo River | 5.4% | 4.0%(+1.40)#40 | 4.1%(+1.21)#6,255 |
| 41. | Trumbull Center | 5.2% | 4.0%(+1.29)#41 | 4.1%(+1.10)#6,518 |
| 42. | Wauregan | 5.1% | 4.0%(+1.18)#42 | 4.1%(+0.989)#6,739 |
| 43. | New London | 5.1% | 4.0%(+1.17)#43 | 4.1%(+0.979)#6,753 |
| 44. | Oronoque | 5.1% | 4.0%(+1.17)#44 | 4.1%(+0.977)#6,768 |
| 45. | Daniels Farm | 5.1% | 4.0%(+1.09)#45 | 4.1%(+0.904)#6,922 |
| 46. | Meriden | 5.0% | 4.0%(+1.06)#46 | 4.1%(+0.869)#7,009 |
| 47. | Ansonia | 5.0% | 4.0%(+1.04)#47 | 4.1%(+0.847)#7,071 |
| 48. | Waterbury | 4.9% | 4.0%(+0.984)#48 | 4.1%(+0.795)#7,176 |
| 49. | East Hartford | 4.8% | 4.0%(+0.878)#49 | 4.1%(+0.689)#7,418 |
| 50. | New Hartford Center | 4.8% | 4.0%(+0.850)#50 | 4.1%(+0.661)#7,484 |
| 51. | Glenville | 4.8% | 4.0%(+0.832)#51 | 4.1%(+0.643)#7,533 |
| 52. | Gaylordsville | 4.8% | 4.0%(+0.815)#52 | 4.1%(+0.626)#7,579 |
| 53. | Sherwood Manor | 4.7% | 4.0%(+0.782)#53 | 4.1%(+0.593)#7,671 |
| 54. | Newington | 4.7% | 4.0%(+0.745)#54 | 4.1%(+0.556)#7,766 |
| 55. | Candlewood Orchards | 4.7% | 4.0%(+0.690)#55 | 4.1%(+0.501)#7,907 |
| 56. | Southport | 4.5% | 4.0%(+0.519)#56 | 4.1%(+0.330)#8,358 |
| 57. | Inglenook | 4.5% | 4.0%(+0.497)#57 | 4.1%(+0.308)#8,422 |
| 58. | Mansfield Center | 4.3% | 4.0%(+0.354)#58 | 4.1%(+0.165)#8,869 |
| 59. | Manchester | 4.3% | 4.0%(+0.352)#59 | 4.1%(+0.163)#8,875 |
| 60. | Taylor Corners | 4.3% | 4.0%(+0.350)#60 | 4.1%(+0.161)#8,888 |
| 61. | Pawcatuck | 4.3% | 4.0%(+0.339)#61 | 4.1%(+0.150)#8,935 |
| 62. | Plattsville | 4.2% | 4.0%(+0.261)#62 | 4.1%(+0.072)#9,159 |
| 63. | Coleytown | 4.2% | 4.0%(+0.228)#63 | 4.1%(+0.039)#9,257 |
| 64. | Middletown | 4.2% | 4.0%(+0.201)#64 | 4.1%(+0.012)#9,350 |
| 65. | West Haven | 4.1% | 4.0%(+0.106)#65 | 4.1%(-0.083)#9,625 |
| 66. | Wallingford Center | 4.1% | 4.0%(+0.103)#66 | 4.1%(-0.086)#9,632 |
| 67. | Greenwich | 4.0% | 4.0%(+0.079)#67 | 4.1%(-0.110)#9,710 |
| 68. | New Canaan | 4.0% | 4.0%(+0.039)#68 | 4.1%(-0.150)#9,844 |
| 69. | Bristol | 4.0% | 4.0%(+0.029)#69 | 4.1%(-0.160)#9,894 |
| 70. | Wethersfield | 3.9% | 4.0%(-0.031)#70 | 4.1%(-0.220)#10,080 |
| 71. | Torrington | 3.9% | 4.0%(-0.039)#71 | 4.1%(-0.228)#10,120 |
| 72. | New Haven | 3.9% | 4.0%(-0.063)#72 | 4.1%(-0.252)#10,178 |
| 73. | Clinton | 3.9% | 4.0%(-0.095)#73 | 4.1%(-0.284)#10,291 |
| 74. | Southwood Acres | 3.8% | 4.0%(-0.181)#74 | 4.1%(-0.370)#10,588 |
| 75. | Norwich | 3.8% | 4.0%(-0.210)#75 | 4.1%(-0.399)#10,691 |
| 76. | Ball Pond | 3.7% | 4.0%(-0.241)#76 | 4.1%(-0.430)#10,808 |
| 77. | Waterford | 3.7% | 4.0%(-0.264)#77 | 4.1%(-0.453)#10,888 |
| 78. | Windsor Locks | 3.7% | 4.0%(-0.274)#78 | 4.1%(-0.463)#10,918 |
| 79. | Newtown Borough | 3.7% | 4.0%(-0.295)#79 | 4.1%(-0.484)#10,999 |
| 80. | Terryville | 3.6% | 4.0%(-0.355)#80 | 4.1%(-0.544)#11,227 |
| 81. | Willimantic | 3.6% | 4.0%(-0.364)#81 | 4.1%(-0.553)#11,262 |
| 82. | Shelton | 3.5% | 4.0%(-0.454)#82 | 4.1%(-0.643)#11,585 |
| 83. | Heritage Village | 3.4% | 4.0%(-0.565)#83 | 4.1%(-0.754)#12,002 |
| 84. | Rock Ridge | 3.2% | 4.0%(-0.735)#84 | 4.1%(-0.924)#12,617 |
| 85. | Sandy Hook | 3.2% | 4.0%(-0.801)#85 | 4.1%(-0.990)#12,850 |
| 86. | Derby | 3.1% | 4.0%(-0.819)#86 | 4.1%(-1.01)#12,923 |
| 87. | Simsbury Center | 3.1% | 4.0%(-0.903)#87 | 4.1%(-1.09)#13,208 |
| 88. | Weatogue | 3.0% | 4.0%(-0.912)#88 | 4.1%(-1.10)#13,232 |
| 89. | Noroton Heights | 3.0% | 4.0%(-0.934)#89 | 4.1%(-1.12)#13,344 |
| 90. | Kensington | 3.0% | 4.0%(-0.940)#90 | 4.1%(-1.13)#13,369 |
| 91. | Coventry Lake | 3.0% | 4.0%(-0.949)#91 | 4.1%(-1.14)#13,396 |
| 92. | Murray | 3.0% | 4.0%(-0.991)#92 | 4.1%(-1.18)#13,562 |
| 93. | North Grosvenor Dale | 3.0% | 4.0%(-0.999)#93 | 4.1%(-1.19)#13,595 |
| 94. | Moosup | 2.9% | 4.0%(-1.03)#94 | 4.1%(-1.22)#13,726 |
| 95. | Noroton | 2.9% | 4.0%(-1.07)#95 | 4.1%(-1.26)#13,855 |
| 96. | East Haven | 2.8% | 4.0%(-1.12)#96 | 4.1%(-1.31)#14,070 |
| 97. | Woodmont Borough | 2.8% | 4.0%(-1.14)#97 | 4.1%(-1.33)#14,143 |
| 98. | Milford City Balance | 2.8% | 4.0%(-1.17)#98 | 4.1%(-1.36)#14,263 |
| 99. | West Simsbury | 2.7% | 4.0%(-1.23)#99 | 4.1%(-1.42)#14,503 |
| 100. | Rockville | 2.7% | 4.0%(-1.24)#100 | 4.1%(-1.43)#14,551 |
Common Questions
What are the Top 10 Cities with the Highest Percentage of Population Employed in Administrative & Support Services in Connecticut?
Top 10 Cities with the Highest Percentage of Population Employed in Administrative & Support Services in Connecticut are:
#1
14.1%
#2
11.9%
#3
10.9%
#4
10.2%
#5
9.9%
#6
9.8%
#7
9.7%
#8
9.4%
#9
8.2%
#10
8.2%
What city has the Highest Percentage of Population Employed in Administrative & Support Services in Connecticut?
Canaan has the Highest Percentage of Population Employed in Administrative & Support Services in Connecticut with 14.1%.
What is the Percentage of Population Employed in Administrative & Support Services in the State of Connecticut?
Percentage of Population Employed in Administrative & Support Services in Connecticut is 4.0%.
What is the Percentage of Population Employed in Administrative & Support Services in the United States?
Percentage of Population Employed in Administrative & Support Services in the United States is 4.1%.