Alanson, MI
Alanson Map
Alanson Overview
862
TOTAL POPULATION
472
MALE POPULATION
390
FEMALE POPULATION
121.03
MALES / 100 FEMALES
82.63
FEMALES / 100 MALES
42.0
MEDIAN AGE
2.8
AVG FAMILY SIZE
2.4
AVG HOUSEHOLD SIZE
$24,739
PER CAPITA INCOME
$52,125
AVG FAMILY INCOME
$46,800
AVG HOUSEHOLD INCOME
30.3%
WAGE / INCOME GAP [ % ]
69.7¢/ $1
WAGE / INCOME GAP [ $ ]
0.38
INEQUALITY / GINI INDEX
429
LABOR FORCE [ PEOPLE ]
60.0%
PERCENT IN LABOR FORCE
12.1%
UNEMPLOYMENT RATE
Alanson Zip Codes
Alanson Area Codes
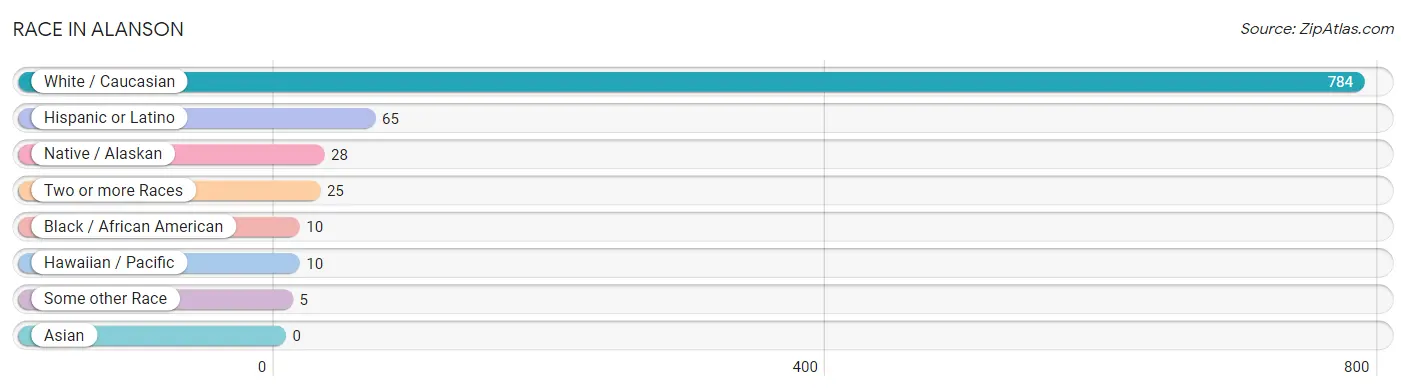
Race in Alanson
The most populous races in Alanson are White / Caucasian (784 | 90.9%), Hispanic or Latino (65 | 7.5%), and Native / Alaskan (28 | 3.3%).
| Race | # Population | % Population |
| Asian | 0 | 0.0% |
| Black / African American | 10 | 1.2% |
| Hawaiian / Pacific | 10 | 1.2% |
| Hispanic or Latino | 65 | 7.5% |
| Native / Alaskan | 28 | 3.3% |
| White / Caucasian | 784 | 90.9% |
| Two or more Races | 25 | 2.9% |
| Some other Race | 5 | 0.6% |
| Total | 862 | 100.0% |
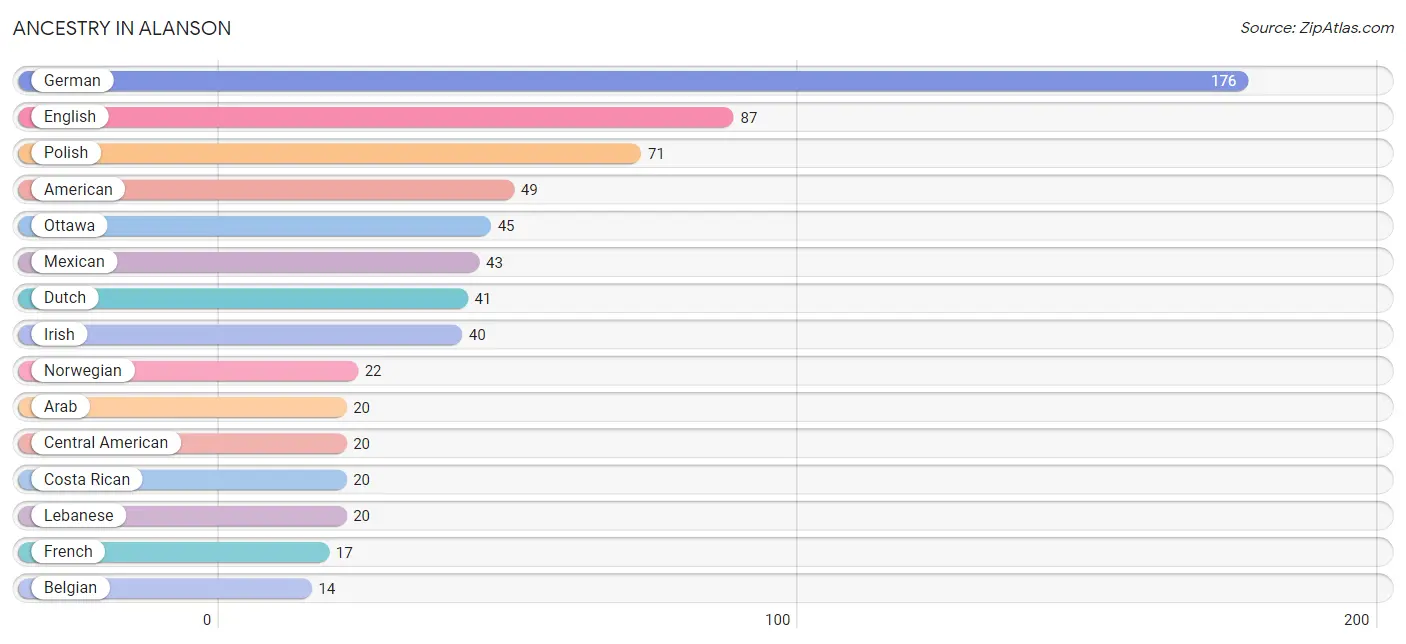
Ancestry in Alanson
The most populous ancestries reported in Alanson are German (176 | 20.4%), English (87 | 10.1%), Polish (71 | 8.2%), American (49 | 5.7%), and Ottawa (45 | 5.2%), together accounting for 49.6% of all Alanson residents.
| Ancestry | # Population | % Population |
| American | 49 | 5.7% |
| Arab | 20 | 2.3% |
| Austrian | 11 | 1.3% |
| Belgian | 14 | 1.6% |
| Canadian | 4 | 0.5% |
| Central American | 20 | 2.3% |
| Chippewa | 6 | 0.7% |
| Costa Rican | 20 | 2.3% |
| Czechoslovakian | 4 | 0.5% |
| Danish | 2 | 0.2% |
| Dutch | 41 | 4.8% |
| English | 87 | 10.1% |
| European | 13 | 1.5% |
| French | 17 | 2.0% |
| French Canadian | 13 | 1.5% |
| German | 176 | 20.4% |
| Hungarian | 7 | 0.8% |
| Irish | 40 | 4.6% |
| Italian | 14 | 1.6% |
| Jamaican | 7 | 0.8% |
| Lebanese | 20 | 2.3% |
| Lithuanian | 6 | 0.7% |
| Mexican | 43 | 5.0% |
| Native Hawaiian | 10 | 1.2% |
| Norwegian | 22 | 2.5% |
| Ottawa | 45 | 5.2% |
| Polish | 71 | 8.2% |
| Potawatomi | 3 | 0.4% |
| Puerto Rican | 2 | 0.2% |
| Scandinavian | 11 | 1.3% |
| Scotch-Irish | 7 | 0.8% |
| Scottish | 7 | 0.8% | View All 32 Rows |
Immigrants in Alanson
The most numerous immigrant groups reported in Alanson came from , and Canada (4 | 0.5%), together accounting for 0.5% of all Alanson residents.

| Immigration Origin | # Population | % Population |
| Canada | 4 | 0.5% | View All 1 Rows |
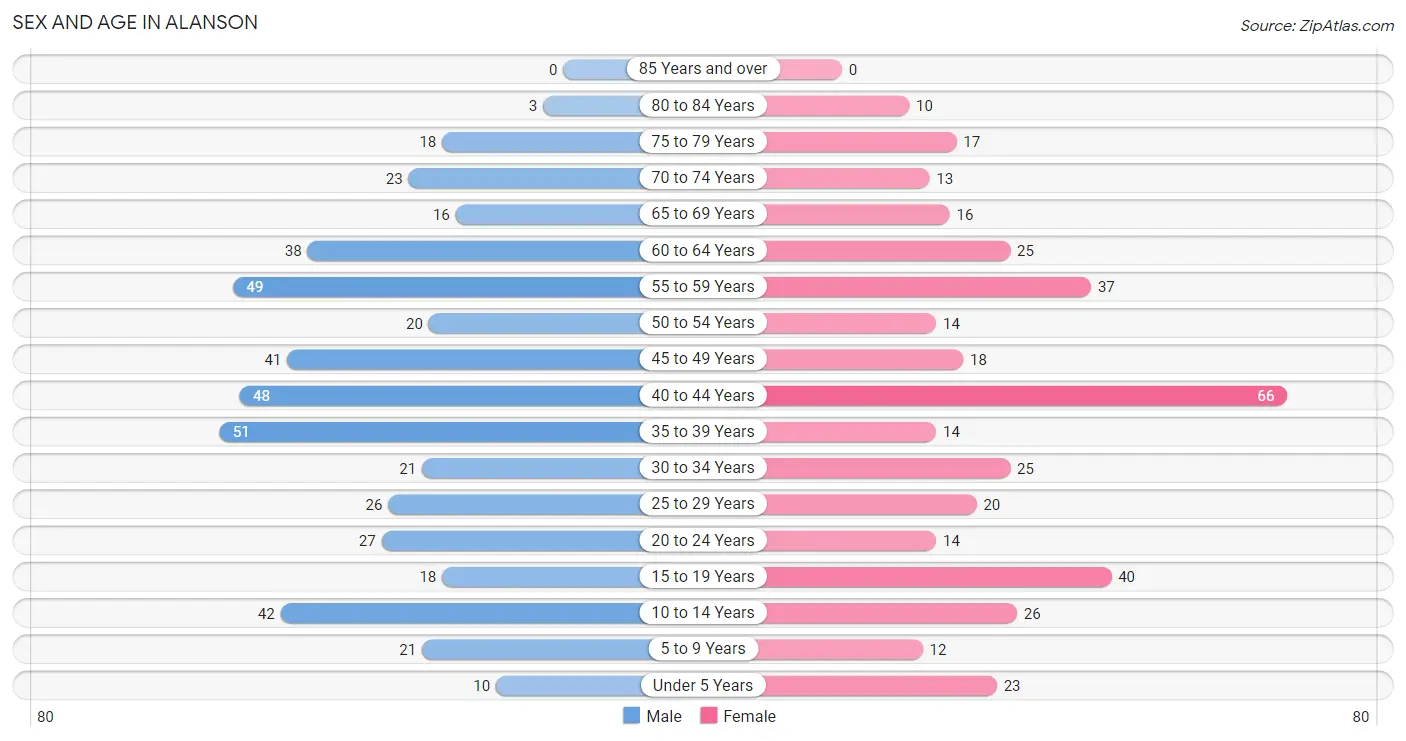
Sex and Age in Alanson
Sex and Age in Alanson
The most populous age groups in Alanson are 35 to 39 Years (51 | 10.8%) for men and 40 to 44 Years (66 | 16.9%) for women.
| Age Bracket | Male | Female |
| Under 5 Years | 10 (2.1%) | 23 (5.9%) |
| 5 to 9 Years | 21 (4.4%) | 12 (3.1%) |
| 10 to 14 Years | 42 (8.9%) | 26 (6.7%) |
| 15 to 19 Years | 18 (3.8%) | 40 (10.3%) |
| 20 to 24 Years | 27 (5.7%) | 14 (3.6%) |
| 25 to 29 Years | 26 (5.5%) | 20 (5.1%) |
| 30 to 34 Years | 21 (4.4%) | 25 (6.4%) |
| 35 to 39 Years | 51 (10.8%) | 14 (3.6%) |
| 40 to 44 Years | 48 (10.2%) | 66 (16.9%) |
| 45 to 49 Years | 41 (8.7%) | 18 (4.6%) |
| 50 to 54 Years | 20 (4.2%) | 14 (3.6%) |
| 55 to 59 Years | 49 (10.4%) | 37 (9.5%) |
| 60 to 64 Years | 38 (8.1%) | 25 (6.4%) |
| 65 to 69 Years | 16 (3.4%) | 16 (4.1%) |
| 70 to 74 Years | 23 (4.9%) | 13 (3.3%) |
| 75 to 79 Years | 18 (3.8%) | 17 (4.4%) |
| 80 to 84 Years | 3 (0.6%) | 10 (2.6%) |
| 85 Years and over | 0 (0.0%) | 0 (0.0%) |
| Total | 472 (100.0%) | 390 (100.0%) |
Families and Households in Alanson
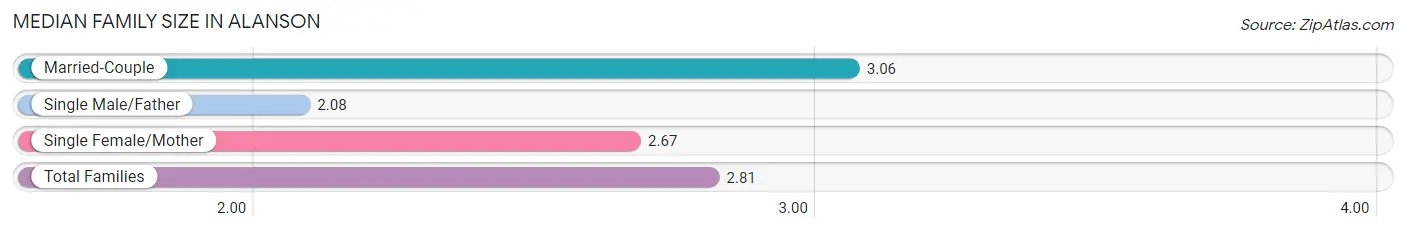
Median Family Size in Alanson
The median family size in Alanson is 2.81 persons per family, with married-couple families (154 | 71.0%) accounting for the largest median family size of 3.06 persons per family. On the other hand, single male/father families (51 | 23.5%) represent the smallest median family size with 2.08 persons per family.
| Family Type | # Families | Family Size |
| Married-Couple | 154 (71.0%) | 3.06 |
| Single Male/Father | 51 (23.5%) | 2.08 |
| Single Female/Mother | 12 (5.5%) | 2.67 |
| Total Families | 217 (100.0%) | 2.81 |
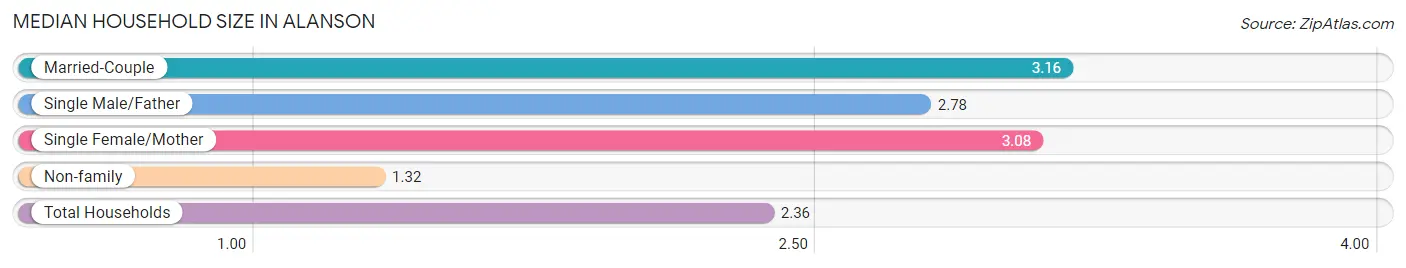
Median Household Size in Alanson
The median household size in Alanson is 2.36 persons per household, with married-couple households (154 | 42.1%) accounting for the largest median household size of 3.16 persons per household. non-family households (149 | 40.7%) represent the smallest median household size with 1.32 persons per household.
| Household Type | # Households | Household Size |
| Married-Couple | 154 (42.1%) | 3.16 |
| Single Male/Father | 51 (13.9%) | 2.78 |
| Single Female/Mother | 12 (3.3%) | 3.08 |
| Non-family | 149 (40.7%) | 1.32 |
| Total Households | 366 (100.0%) | 2.36 |
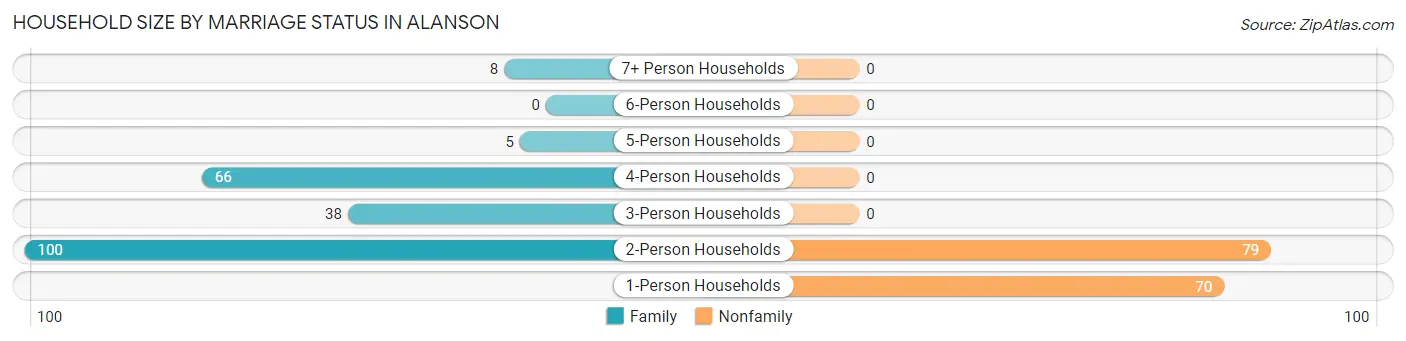
Household Size by Marriage Status in Alanson
Out of a total of 366 households in Alanson, 217 (59.3%) are family households, while 149 (40.7%) are nonfamily households. The most numerous type of family households are 2-person households, comprising 100, and the most common type of nonfamily households are 2-person households, comprising 79.
| Household Size | Family Households | Nonfamily Households |
| 1-Person Households | - | 70 (19.1%) |
| 2-Person Households | 100 (27.3%) | 79 (21.6%) |
| 3-Person Households | 38 (10.4%) | 0 (0.0%) |
| 4-Person Households | 66 (18.0%) | 0 (0.0%) |
| 5-Person Households | 5 (1.4%) | 0 (0.0%) |
| 6-Person Households | 0 (0.0%) | 0 (0.0%) |
| 7+ Person Households | 8 (2.2%) | 0 (0.0%) |
| Total | 217 (59.3%) | 149 (40.7%) |
Female Fertility in Alanson
Fertility by Age in Alanson
| Age Bracket | Women with Births | Births / 1,000 Women |
| 15 to 19 years | 0 (0.0%) | 0.0 |
| 20 to 34 years | 0 (0.0%) | 0.0 |
| 35 to 50 years | 0 (0.0%) | 0.0 |
| Total | 0 (0.0%) | 0.0 |
Fertility by Age by Marriage Status in Alanson
| Age Bracket | Married | Unmarried |
| 15 to 19 years | 0 (0.0%) | 0 (0.0%) |
| 20 to 34 years | 0 (0.0%) | 0 (0.0%) |
| 35 to 50 years | 0 (0.0%) | 0 (0.0%) |
| Total | 0 (0.0%) | 0 (0.0%) |
Fertility by Education in Alanson
| Educational Attainment | Women with Births | Births / 1,000 Women |
| Less than High School | 0 (0.0%) | 0.0 |
| High School Diploma | 0 (0.0%) | 0.0 |
| College or Associate's Degree | 0 (0.0%) | 0.0 |
| Bachelor's Degree | 0 (0.0%) | 0.0 |
| Graduate Degree | 0 (0.0%) | 0.0 |
| Total | 0 (0.0%) | 0.0 |
Fertility by Education by Marriage Status in Alanson
| Educational Attainment | Married | Unmarried |
| Less than High School | 0 (0.0%) | 0 (0.0%) |
| High School Diploma | 0 (0.0%) | 0 (0.0%) |
| College or Associate's Degree | 0 (0.0%) | 0 (0.0%) |
| Bachelor's Degree | 0 (0.0%) | 0 (0.0%) |
| Graduate Degree | 0 (0.0%) | 0 (0.0%) |
| Total | 0 (0.0%) | 0 (0.0%) |
Income in Alanson
Income Overview in Alanson
Per Capita Income in Alanson is $24,739, while median incomes of families and households are $52,125 and $46,800 respectively.
| Characteristic | Number | Measure |
| Per Capita Income | 862 | $24,739 |
| Median Family Income | 217 | $52,125 |
| Mean Family Income | 217 | $65,875 |
| Median Household Income | 366 | $46,800 |
| Mean Household Income | 366 | $58,641 |
| Income Deficit | 217 | $0 |
| Wage / Income Gap (%) | 862 | 30.33% |
| Wage / Income Gap ($) | 862 | 69.67¢ per $1 |
| Gini / Inequality Index | 862 | 0.38 |
Earnings by Sex in Alanson
Average Earnings in Alanson are $30,670, $32,857 for men and $22,891 for women, a difference of 30.3%.
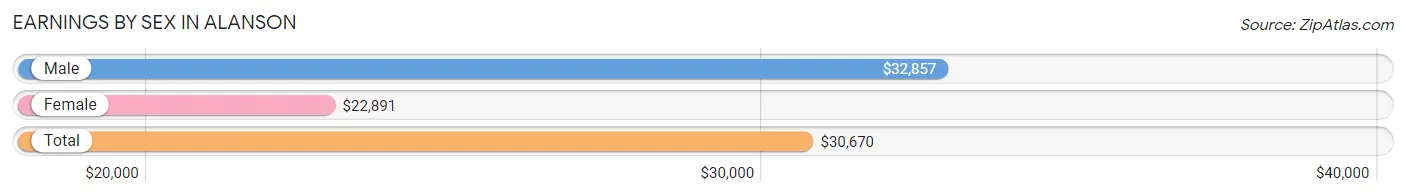
| Sex | Number | Average Earnings |
| Male | 282 (61.2%) | $32,857 |
| Female | 179 (38.8%) | $22,891 |
| Total | 461 (100.0%) | $30,670 |
Earnings by Sex by Income Bracket in Alanson
The most common earnings brackets in Alanson are $30,000 to $34,999 for men (35 | 12.4%) and $20,000 to $22,499 for women (32 | 17.9%).
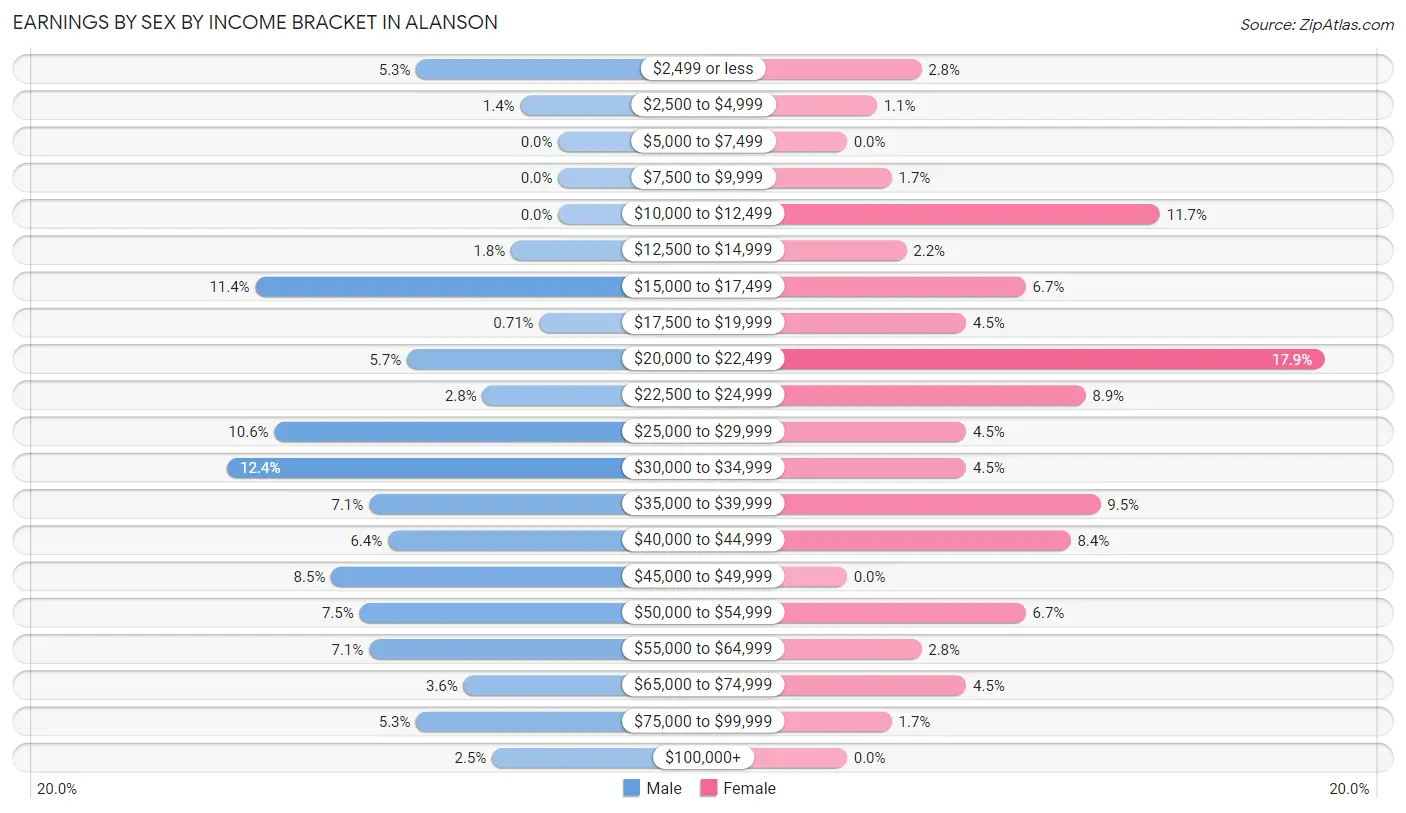
| Income | Male | Female |
| $2,499 or less | 15 (5.3%) | 5 (2.8%) |
| $2,500 to $4,999 | 4 (1.4%) | 2 (1.1%) |
| $5,000 to $7,499 | 0 (0.0%) | 0 (0.0%) |
| $7,500 to $9,999 | 0 (0.0%) | 3 (1.7%) |
| $10,000 to $12,499 | 0 (0.0%) | 21 (11.7%) |
| $12,500 to $14,999 | 5 (1.8%) | 4 (2.2%) |
| $15,000 to $17,499 | 32 (11.4%) | 12 (6.7%) |
| $17,500 to $19,999 | 2 (0.7%) | 8 (4.5%) |
| $20,000 to $22,499 | 16 (5.7%) | 32 (17.9%) |
| $22,500 to $24,999 | 8 (2.8%) | 16 (8.9%) |
| $25,000 to $29,999 | 30 (10.6%) | 8 (4.5%) |
| $30,000 to $34,999 | 35 (12.4%) | 8 (4.5%) |
| $35,000 to $39,999 | 20 (7.1%) | 17 (9.5%) |
| $40,000 to $44,999 | 18 (6.4%) | 15 (8.4%) |
| $45,000 to $49,999 | 24 (8.5%) | 0 (0.0%) |
| $50,000 to $54,999 | 21 (7.4%) | 12 (6.7%) |
| $55,000 to $64,999 | 20 (7.1%) | 5 (2.8%) |
| $65,000 to $74,999 | 10 (3.5%) | 8 (4.5%) |
| $75,000 to $99,999 | 15 (5.3%) | 3 (1.7%) |
| $100,000+ | 7 (2.5%) | 0 (0.0%) |
| Total | 282 (100.0%) | 179 (100.0%) |
Earnings by Sex by Educational Attainment in Alanson
Average earnings in Alanson are $36,875 for men and $24,688 for women, a difference of 33.1%. Men with an educational attainment of bachelor's degree enjoy the highest average annual earnings of $73,250, while those with high school diploma education earn the least with $31,667. Women with an educational attainment of college or associate's degree earn the most with the average annual earnings of $27,813, while those with high school diploma education have the smallest earnings of $21,161.
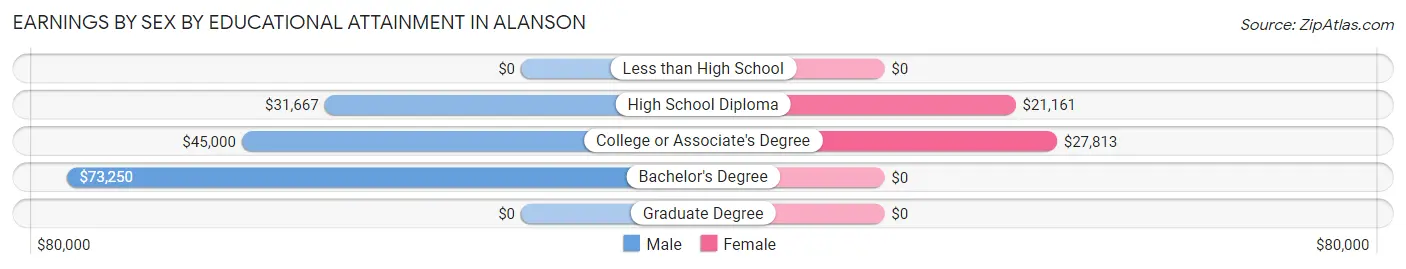
| Educational Attainment | Male Income | Female Income |
| Less than High School | - | - |
| High School Diploma | $31,667 | $21,161 |
| College or Associate's Degree | $45,000 | $27,813 |
| Bachelor's Degree | $73,250 | $0 |
| Graduate Degree | - | - |
| Total | $36,875 | $24,688 |
Family Income in Alanson
Family Income Brackets in Alanson
According to the Alanson family income data, there are 63 families falling into the $35,000 to $49,999 income range, which is the most common income bracket and makes up 29.0% of all families.
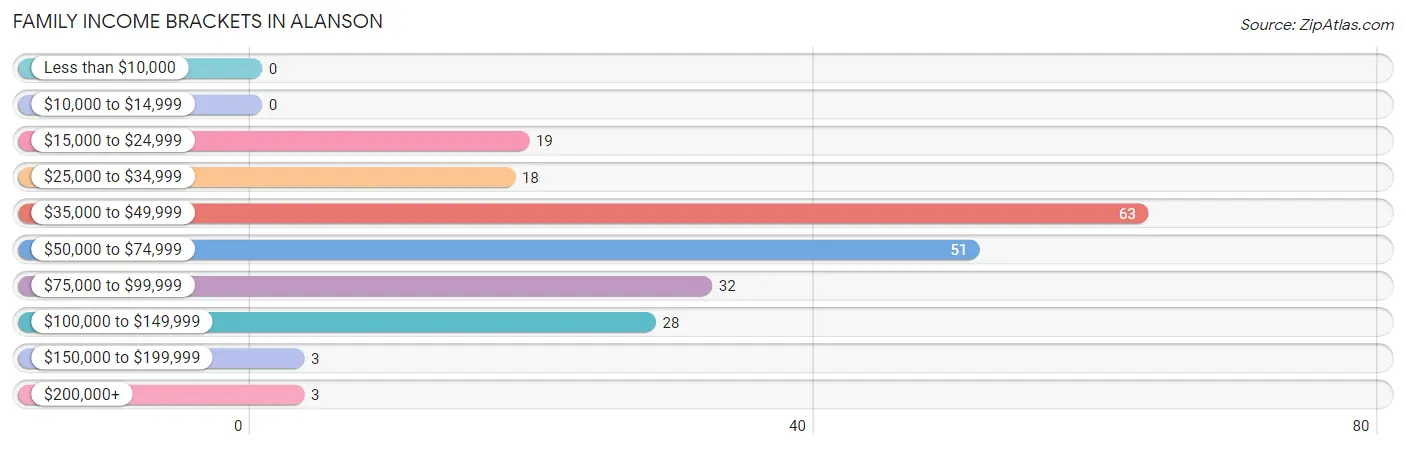
| Income Bracket | # Families | % Families |
| Less than $10,000 | 0 | 0.0% |
| $10,000 to $14,999 | 0 | 0.0% |
| $15,000 to $24,999 | 19 | 8.8% |
| $25,000 to $34,999 | 18 | 8.3% |
| $35,000 to $49,999 | 63 | 29.0% |
| $50,000 to $74,999 | 51 | 23.5% |
| $75,000 to $99,999 | 32 | 14.7% |
| $100,000 to $149,999 | 28 | 12.9% |
| $150,000 to $199,999 | 3 | 1.4% |
| $200,000+ | 3 | 1.4% |
Family Income by Famaliy Size in Alanson
4-person families (43 | 19.8%) account for the highest median family income in Alanson with $82,750 per family, while 2-person families (123 | 56.7%) have the highest median income of $25,312 per family member.
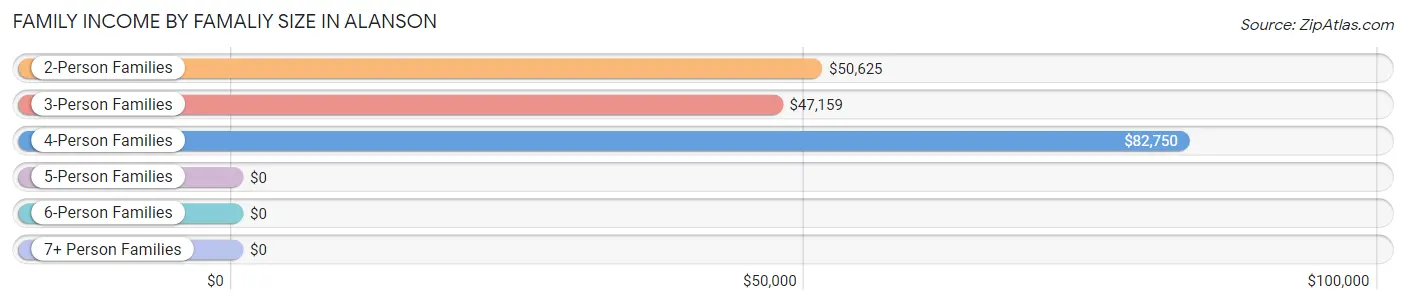
| Income Bracket | # Families | Median Income |
| 2-Person Families | 123 (56.7%) | $50,625 |
| 3-Person Families | 43 (19.8%) | $47,159 |
| 4-Person Families | 43 (19.8%) | $82,750 |
| 5-Person Families | 0 (0.0%) | $0 |
| 6-Person Families | 0 (0.0%) | $0 |
| 7+ Person Families | 8 (3.7%) | $0 |
| Total | 217 (100.0%) | $52,125 |
Family Income by Number of Earners in Alanson
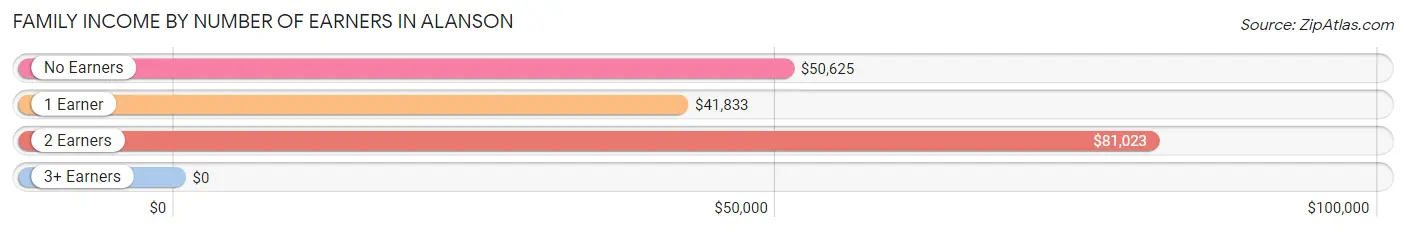
| Number of Earners | # Families | Median Income |
| No Earners | 45 (20.7%) | $50,625 |
| 1 Earner | 76 (35.0%) | $41,833 |
| 2 Earners | 83 (38.3%) | $81,023 |
| 3+ Earners | 13 (6.0%) | $0 |
| Total | 217 (100.0%) | $52,125 |
Household Income in Alanson
Household Income Brackets in Alanson
With 85 households falling in the category, the $35,000 to $49,999 income range is the most frequent in Alanson, accounting for 23.2% of all households.
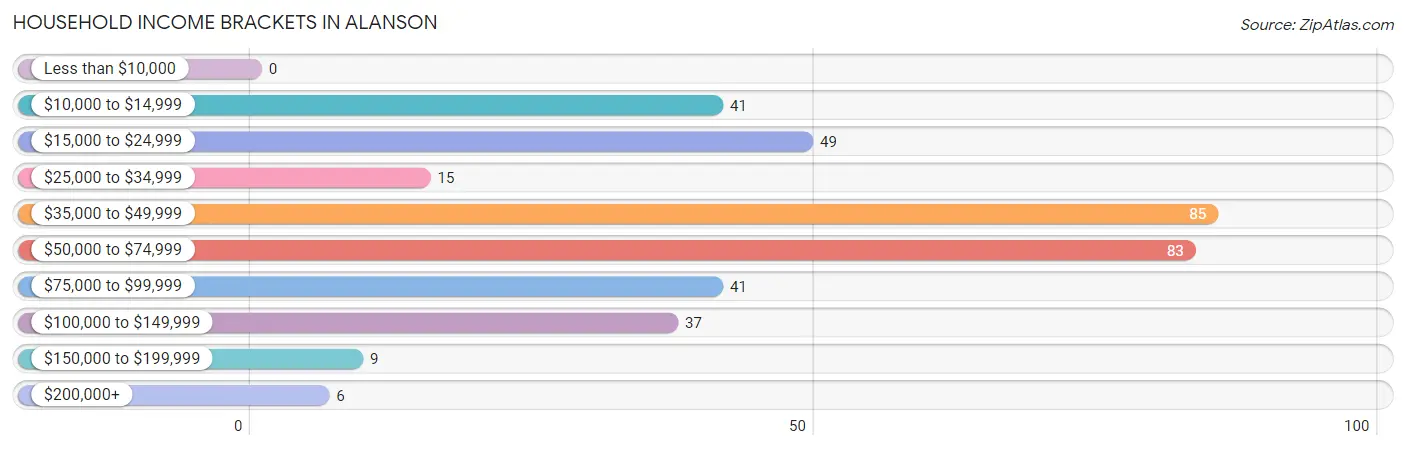
| Income Bracket | # Households | % Households |
| Less than $10,000 | 0 | 0.0% |
| $10,000 to $14,999 | 41 | 11.2% |
| $15,000 to $24,999 | 49 | 13.4% |
| $25,000 to $34,999 | 15 | 4.1% |
| $35,000 to $49,999 | 85 | 23.2% |
| $50,000 to $74,999 | 83 | 22.7% |
| $75,000 to $99,999 | 41 | 11.2% |
| $100,000 to $149,999 | 37 | 10.1% |
| $150,000 to $199,999 | 9 | 2.5% |
| $200,000+ | 6 | 1.6% |
Household Income by Householder Age in Alanson
The median household income in Alanson is $46,800, with the highest median household income of $58,194 found in the 45 to 64 years age bracket for the primary householder. A total of 137 households (37.4%) fall into this category.
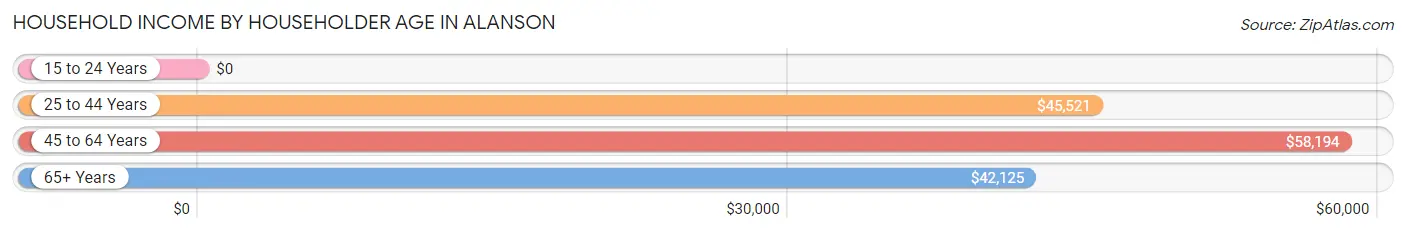
| Income Bracket | # Households | Median Income |
| 15 to 24 Years | 0 (0.0%) | $0 |
| 25 to 44 Years | 166 (45.4%) | $45,521 |
| 45 to 64 Years | 137 (37.4%) | $58,194 |
| 65+ Years | 63 (17.2%) | $42,125 |
| Total | 366 (100.0%) | $46,800 |
Poverty in Alanson
Income Below Poverty by Sex and Age in Alanson
With 8.7% poverty level for males and 15.6% for females among the residents of Alanson, 45 to 54 year old males and 35 to 44 year old females are the most vulnerable to poverty, with 11 males (18.0%) and 36 females (45.0%) in their respective age groups living below the poverty level.
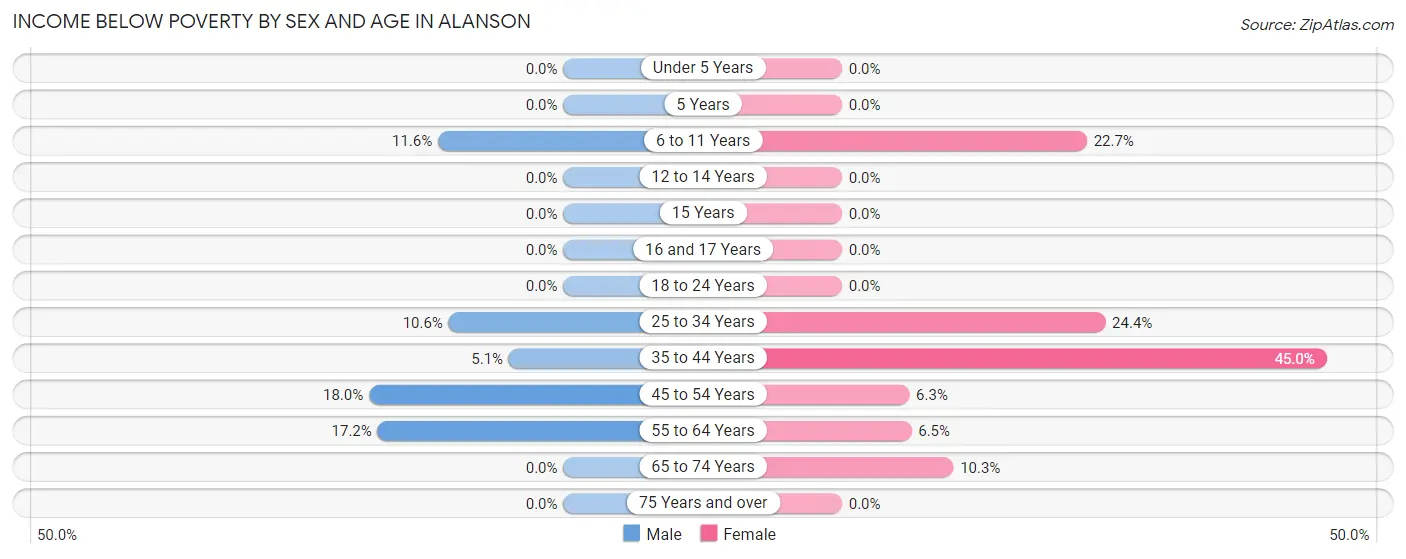
| Age Bracket | Male | Female |
| Under 5 Years | 0 (0.0%) | 0 (0.0%) |
| 5 Years | 0 (0.0%) | 0 (0.0%) |
| 6 to 11 Years | 5 (11.6%) | 5 (22.7%) |
| 12 to 14 Years | 0 (0.0%) | 0 (0.0%) |
| 15 Years | 0 (0.0%) | 0 (0.0%) |
| 16 and 17 Years | 0 (0.0%) | 0 (0.0%) |
| 18 to 24 Years | 0 (0.0%) | 0 (0.0%) |
| 25 to 34 Years | 5 (10.6%) | 11 (24.4%) |
| 35 to 44 Years | 5 (5.1%) | 36 (45.0%) |
| 45 to 54 Years | 11 (18.0%) | 2 (6.2%) |
| 55 to 64 Years | 15 (17.2%) | 4 (6.5%) |
| 65 to 74 Years | 0 (0.0%) | 3 (10.3%) |
| 75 Years and over | 0 (0.0%) | 0 (0.0%) |
| Total | 41 (8.7%) | 61 (15.6%) |
Income Above Poverty by Sex and Age in Alanson
According to the poverty statistics in Alanson, males aged under 5 years and females aged under 5 years are the age groups that are most secure financially, with 100.0% of males and 100.0% of females in these age groups living above the poverty line.
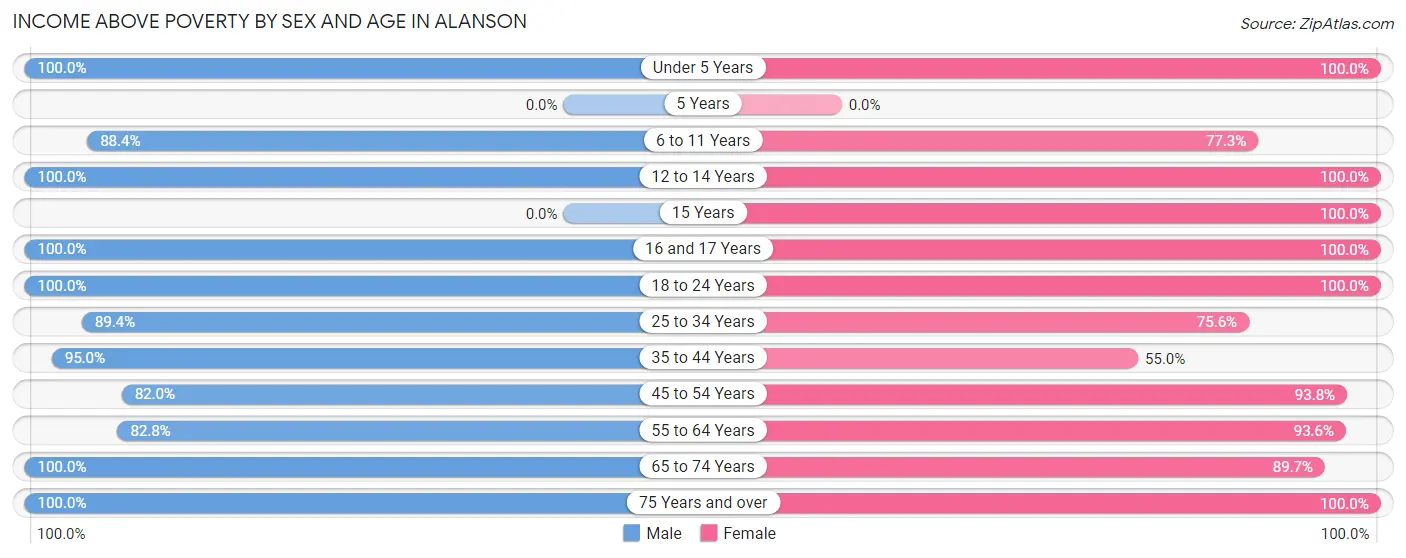
| Age Bracket | Male | Female |
| Under 5 Years | 10 (100.0%) | 23 (100.0%) |
| 5 Years | 0 (0.0%) | 0 (0.0%) |
| 6 to 11 Years | 38 (88.4%) | 17 (77.3%) |
| 12 to 14 Years | 20 (100.0%) | 16 (100.0%) |
| 15 Years | 0 (0.0%) | 13 (100.0%) |
| 16 and 17 Years | 10 (100.0%) | 20 (100.0%) |
| 18 to 24 Years | 35 (100.0%) | 21 (100.0%) |
| 25 to 34 Years | 42 (89.4%) | 34 (75.6%) |
| 35 to 44 Years | 94 (95.0%) | 44 (55.0%) |
| 45 to 54 Years | 50 (82.0%) | 30 (93.8%) |
| 55 to 64 Years | 72 (82.8%) | 58 (93.5%) |
| 65 to 74 Years | 39 (100.0%) | 26 (89.7%) |
| 75 Years and over | 21 (100.0%) | 27 (100.0%) |
| Total | 431 (91.3%) | 329 (84.4%) |
Income Below Poverty Among Married-Couple Families in Alanson
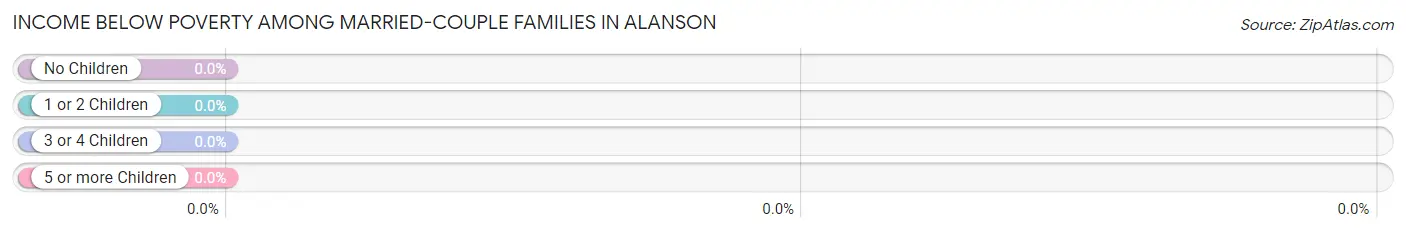
| Children | Above Poverty | Below Poverty |
| No Children | 95 (100.0%) | 0 (0.0%) |
| 1 or 2 Children | 51 (100.0%) | 0 (0.0%) |
| 3 or 4 Children | 8 (100.0%) | 0 (0.0%) |
| 5 or more Children | 0 (0.0%) | 0 (0.0%) |
| Total | 154 (100.0%) | 0 (0.0%) |
Income Below Poverty Among Single-Parent Households in Alanson
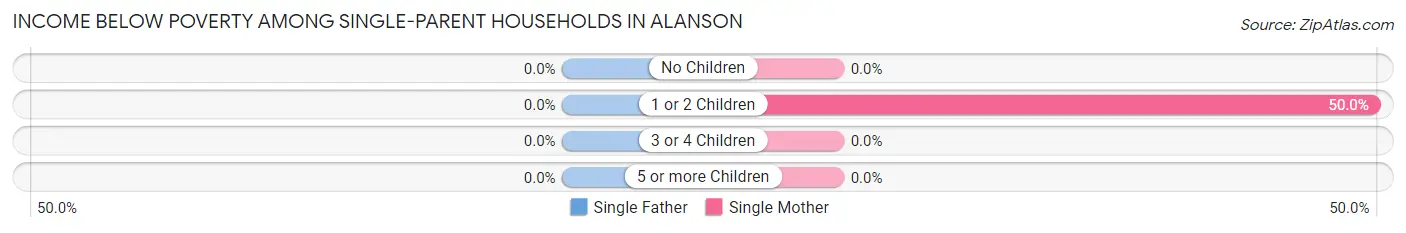
| Children | Single Father | Single Mother |
| No Children | 0 (0.0%) | 0 (0.0%) |
| 1 or 2 Children | 0 (0.0%) | 4 (50.0%) |
| 3 or 4 Children | 0 (0.0%) | 0 (0.0%) |
| 5 or more Children | 0 (0.0%) | 0 (0.0%) |
| Total | 0 (0.0%) | 4 (33.3%) |
Income Below Poverty Among Married-Couple vs Single-Parent Households in Alanson
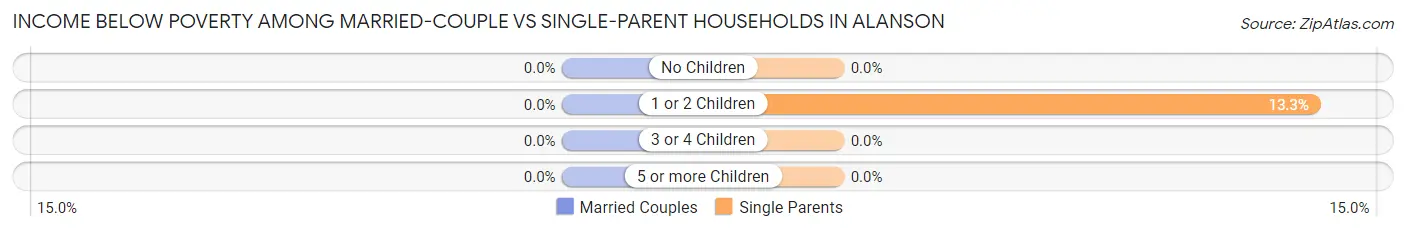
| Children | Married-Couple Families | Single-Parent Households |
| No Children | 0 (0.0%) | 0 (0.0%) |
| 1 or 2 Children | 0 (0.0%) | 4 (13.3%) |
| 3 or 4 Children | 0 (0.0%) | 0 (0.0%) |
| 5 or more Children | 0 (0.0%) | 0 (0.0%) |
| Total | 0 (0.0%) | 4 (6.4%) |
Employment Characteristics in Alanson
Employment by Class of Employer in Alanson
Among the 366 employed individuals in Alanson, private company employees (277 | 75.7%), not-for-profit organizations (26 | 7.1%), and self-employed (not incorporated) (22 | 6.0%) make up the most common classes of employment.
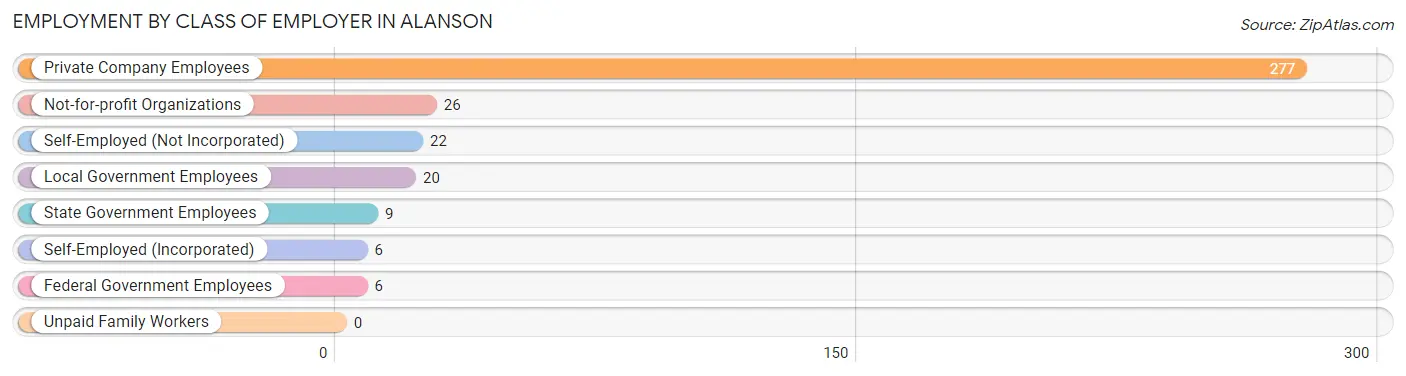
| Employer Class | # Employees | % Employees |
| Private Company Employees | 277 | 75.7% |
| Self-Employed (Incorporated) | 6 | 1.6% |
| Self-Employed (Not Incorporated) | 22 | 6.0% |
| Not-for-profit Organizations | 26 | 7.1% |
| Local Government Employees | 20 | 5.5% |
| State Government Employees | 9 | 2.5% |
| Federal Government Employees | 6 | 1.6% |
| Unpaid Family Workers | 0 | 0.0% |
| Total | 366 | 100.0% |
Employment Status by Age in Alanson
According to the labor force statistics for Alanson, out of the total population over 16 years of age (715), 60.0% or 429 individuals are in the labor force, with 12.1% or 52 of them unemployed. The age group with the highest labor force participation rate is 55 to 59 years, with 100.0% or 86 individuals in the labor force. Within the labor force, the 20 to 24 years age range has the highest percentage of unemployed individuals, with 44.1% or 15 of them being unemployed.
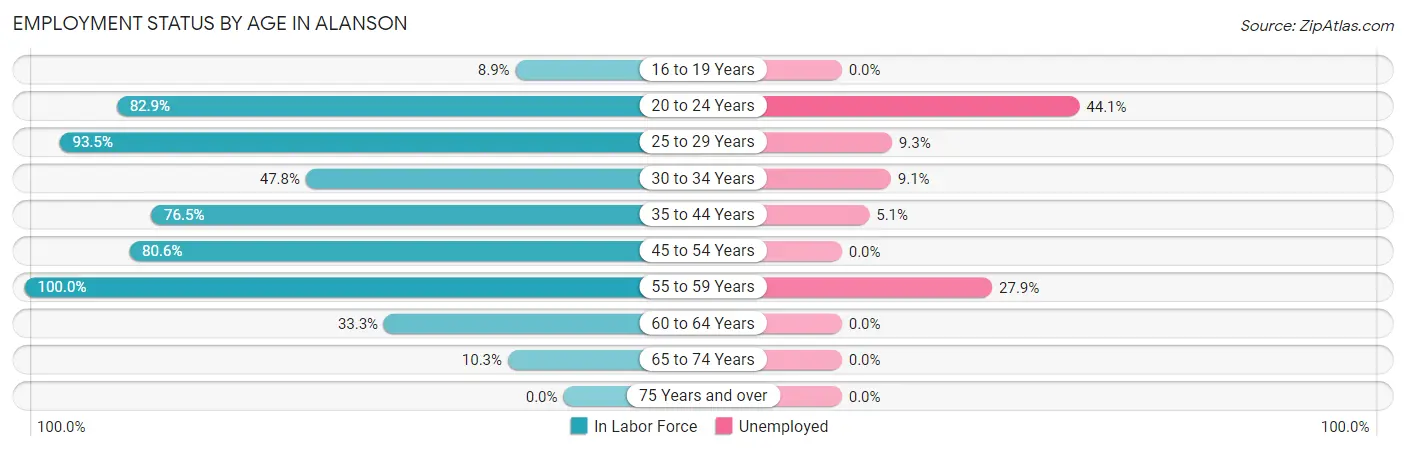
| Age Bracket | In Labor Force | Unemployed |
| 16 to 19 Years | 4 (8.9%) | 0 (0.0%) |
| 20 to 24 Years | 34 (82.9%) | 15 (44.1%) |
| 25 to 29 Years | 43 (93.5%) | 4 (9.3%) |
| 30 to 34 Years | 22 (47.8%) | 2 (9.1%) |
| 35 to 44 Years | 137 (76.5%) | 7 (5.1%) |
| 45 to 54 Years | 75 (80.6%) | 0 (0.0%) |
| 55 to 59 Years | 86 (100.0%) | 24 (27.9%) |
| 60 to 64 Years | 21 (33.3%) | 0 (0.0%) |
| 65 to 74 Years | 7 (10.3%) | 0 (0.0%) |
| 75 Years and over | 0 (0.0%) | 0 (0.0%) |
| Total | 429 (60.0%) | 52 (12.1%) |
Employment Status by Educational Attainment in Alanson
According to labor force statistics for Alanson, 74.9% of individuals (384) out of the total population between 25 and 64 years of age (513) are in the labor force, with 9.6% or 37 of them being unemployed. The group with the highest labor force participation rate are those with the educational attainment of less than high school, with 80.0% or 16 individuals in the labor force. Within the labor force, individuals with high school diploma education have the highest percentage of unemployment, with 18.2% or 35 of them being unemployed.
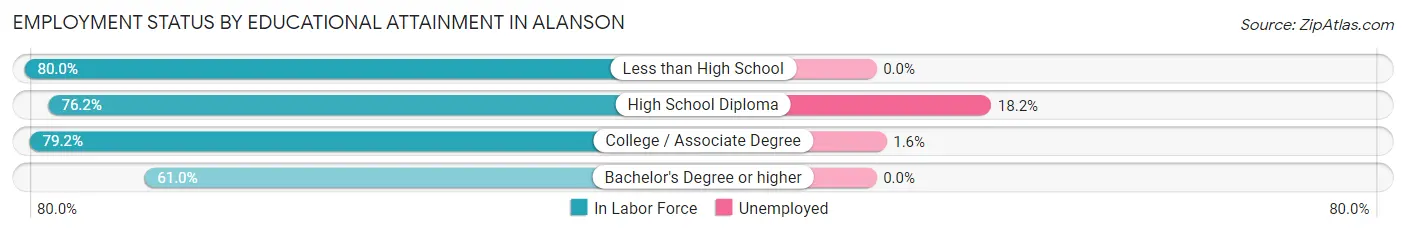
| Educational Attainment | In Labor Force | Unemployed |
| Less than High School | 16 (80.0%) | 0 (0.0%) |
| High School Diploma | 192 (76.2%) | 46 (18.2%) |
| College / Associate Degree | 126 (79.2%) | 3 (1.6%) |
| Bachelor's Degree or higher | 50 (61.0%) | 0 (0.0%) |
| Total | 384 (74.9%) | 49 (9.6%) |
Employment Occupations by Sex in Alanson
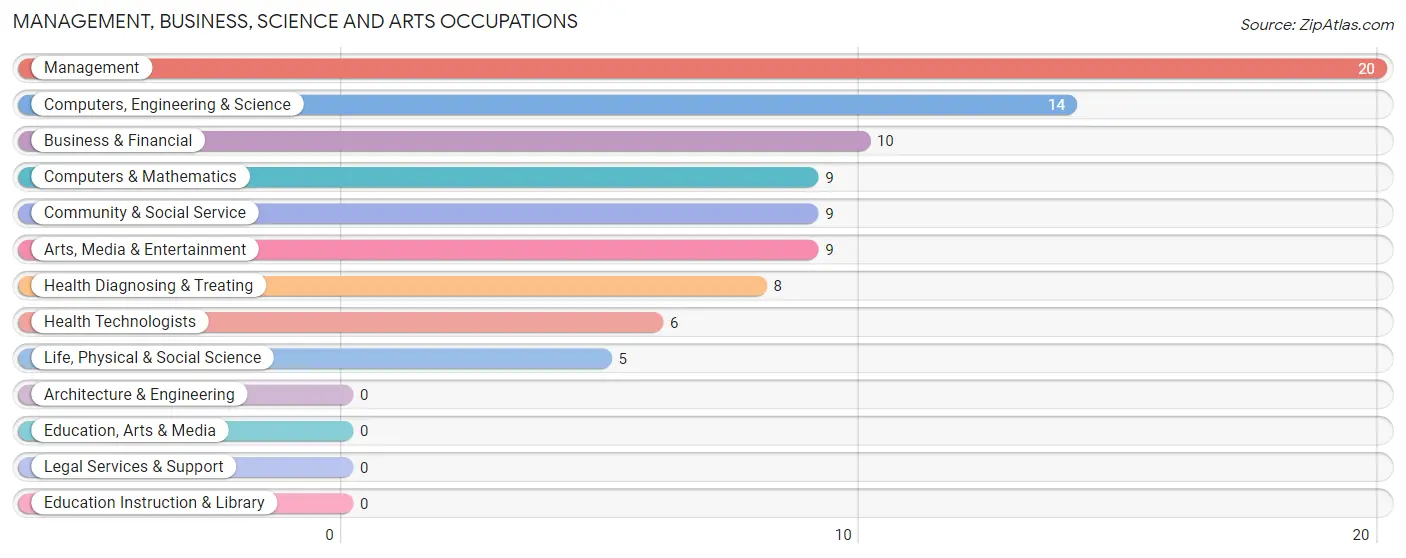
Management, Business, Science and Arts Occupations
The most common Management, Business, Science and Arts occupations in Alanson are Management (20 | 5.3%), Computers, Engineering & Science (14 | 3.7%), Business & Financial (10 | 2.6%), Computers & Mathematics (9 | 2.4%), and Community & Social Service (9 | 2.4%).
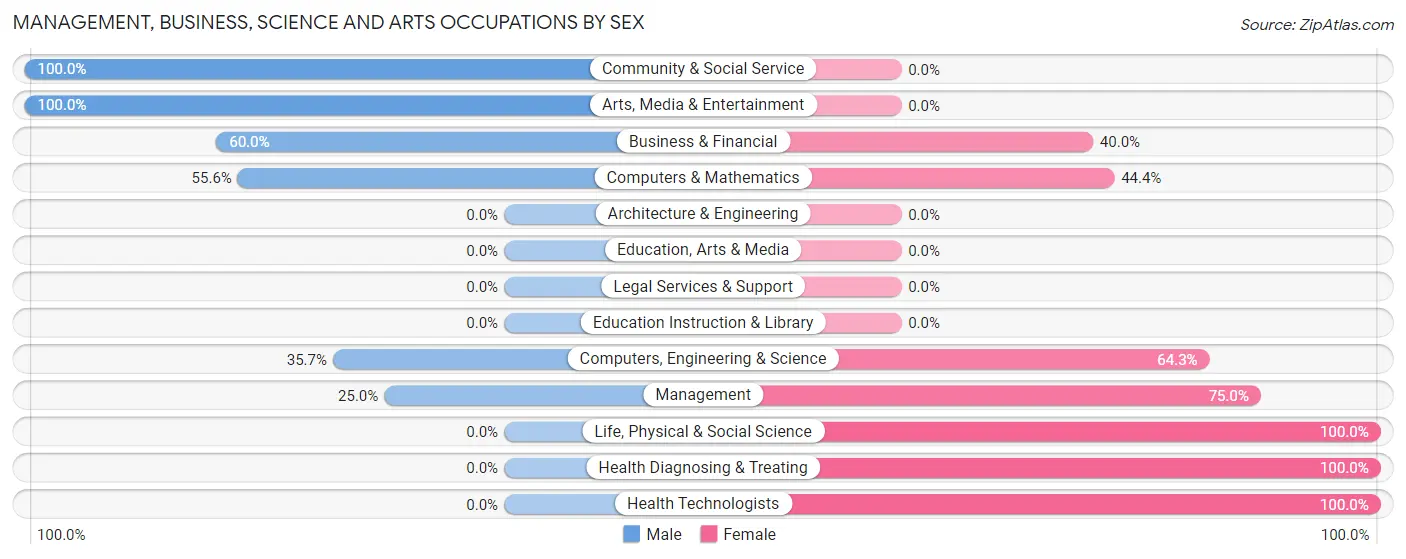
Management, Business, Science and Arts Occupations by Sex
Within the Management, Business, Science and Arts occupations in Alanson, the most male-oriented occupations are Community & Social Service (100.0%), Arts, Media & Entertainment (100.0%), and Business & Financial (60.0%), while the most female-oriented occupations are Life, Physical & Social Science (100.0%), Health Diagnosing & Treating (100.0%), and Health Technologists (100.0%).
| Occupation | Male | Female |
| Management | 5 (25.0%) | 15 (75.0%) |
| Business & Financial | 6 (60.0%) | 4 (40.0%) |
| Computers, Engineering & Science | 5 (35.7%) | 9 (64.3%) |
| Computers & Mathematics | 5 (55.6%) | 4 (44.4%) |
| Architecture & Engineering | 0 (0.0%) | 0 (0.0%) |
| Life, Physical & Social Science | 0 (0.0%) | 5 (100.0%) |
| Community & Social Service | 9 (100.0%) | 0 (0.0%) |
| Education, Arts & Media | 0 (0.0%) | 0 (0.0%) |
| Legal Services & Support | 0 (0.0%) | 0 (0.0%) |
| Education Instruction & Library | 0 (0.0%) | 0 (0.0%) |
| Arts, Media & Entertainment | 9 (100.0%) | 0 (0.0%) |
| Health Diagnosing & Treating | 0 (0.0%) | 8 (100.0%) |
| Health Technologists | 0 (0.0%) | 6 (100.0%) |
| Total (Category) | 25 (41.0%) | 36 (59.0%) |
| Total (Overall) | 239 (63.4%) | 138 (36.6%) |
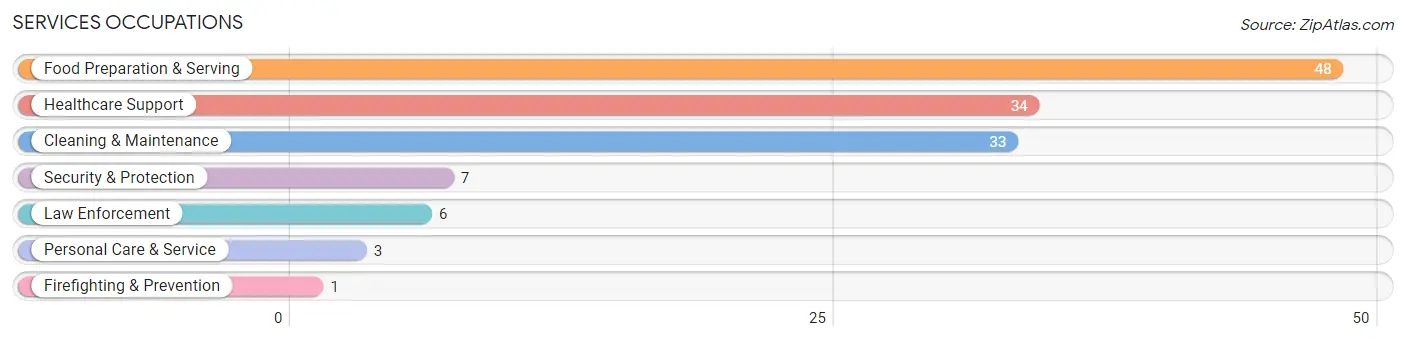
Services Occupations
The most common Services occupations in Alanson are Food Preparation & Serving (48 | 12.7%), Healthcare Support (34 | 9.0%), Cleaning & Maintenance (33 | 8.7%), Security & Protection (7 | 1.9%), and Law Enforcement (6 | 1.6%).
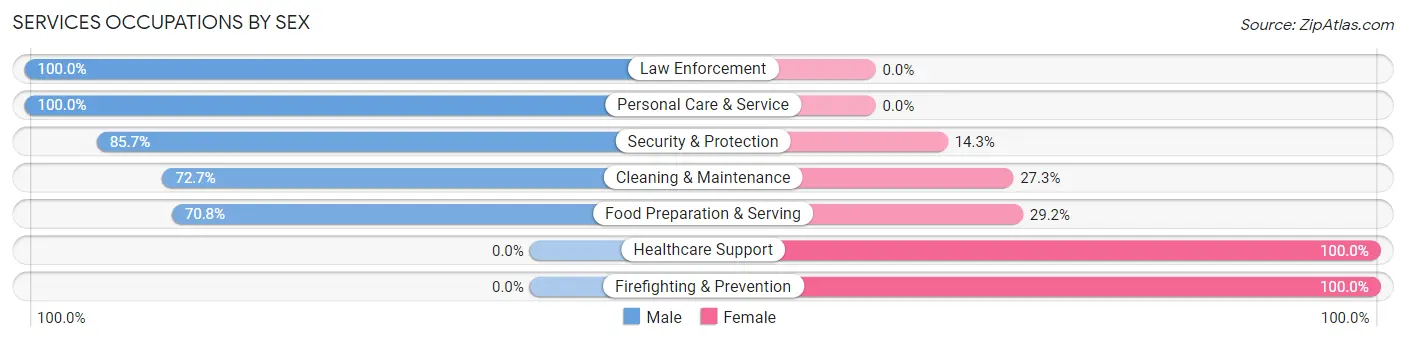
Services Occupations by Sex
Within the Services occupations in Alanson, the most male-oriented occupations are Law Enforcement (100.0%), Personal Care & Service (100.0%), and Security & Protection (85.7%), while the most female-oriented occupations are Healthcare Support (100.0%), Firefighting & Prevention (100.0%), and Food Preparation & Serving (29.2%).
| Occupation | Male | Female |
| Healthcare Support | 0 (0.0%) | 34 (100.0%) |
| Security & Protection | 6 (85.7%) | 1 (14.3%) |
| Firefighting & Prevention | 0 (0.0%) | 1 (100.0%) |
| Law Enforcement | 6 (100.0%) | 0 (0.0%) |
| Food Preparation & Serving | 34 (70.8%) | 14 (29.2%) |
| Cleaning & Maintenance | 24 (72.7%) | 9 (27.3%) |
| Personal Care & Service | 3 (100.0%) | 0 (0.0%) |
| Total (Category) | 67 (53.6%) | 58 (46.4%) |
| Total (Overall) | 239 (63.4%) | 138 (36.6%) |
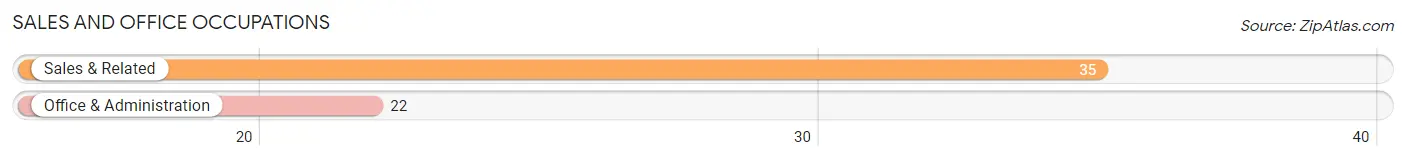
Sales and Office Occupations
The most common Sales and Office occupations in Alanson are Sales & Related (35 | 9.3%), and Office & Administration (22 | 5.8%).
Sales and Office Occupations by Sex
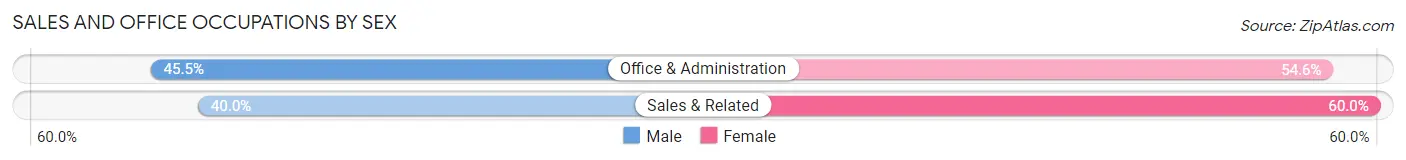
| Occupation | Male | Female |
| Sales & Related | 14 (40.0%) | 21 (60.0%) |
| Office & Administration | 10 (45.5%) | 12 (54.5%) |
| Total (Category) | 24 (42.1%) | 33 (57.9%) |
| Total (Overall) | 239 (63.4%) | 138 (36.6%) |
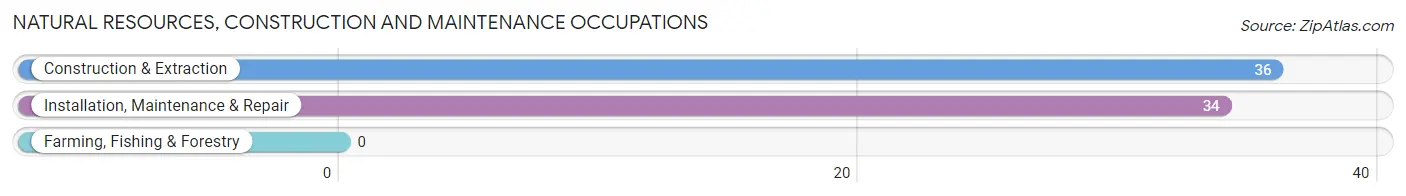
Natural Resources, Construction and Maintenance Occupations
The most common Natural Resources, Construction and Maintenance occupations in Alanson are Construction & Extraction (36 | 9.6%), and Installation, Maintenance & Repair (34 | 9.0%).
Natural Resources, Construction and Maintenance Occupations by Sex
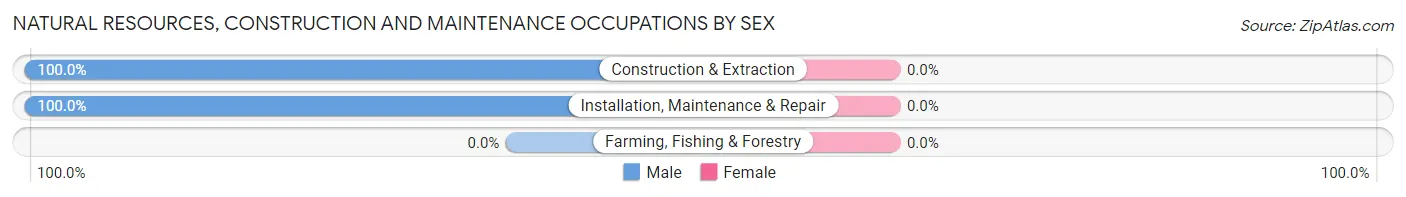
| Occupation | Male | Female |
| Farming, Fishing & Forestry | 0 (0.0%) | 0 (0.0%) |
| Construction & Extraction | 36 (100.0%) | 0 (0.0%) |
| Installation, Maintenance & Repair | 34 (100.0%) | 0 (0.0%) |
| Total (Category) | 70 (100.0%) | 0 (0.0%) |
| Total (Overall) | 239 (63.4%) | 138 (36.6%) |
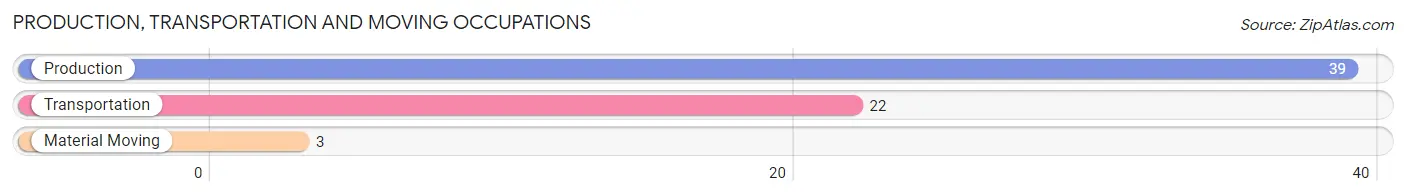
Production, Transportation and Moving Occupations
The most common Production, Transportation and Moving occupations in Alanson are Production (39 | 10.3%), Transportation (22 | 5.8%), and Material Moving (3 | 0.8%).
Production, Transportation and Moving Occupations by Sex
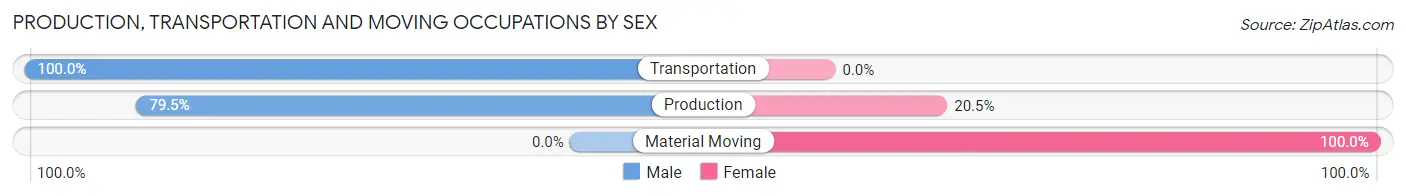
| Occupation | Male | Female |
| Production | 31 (79.5%) | 8 (20.5%) |
| Transportation | 22 (100.0%) | 0 (0.0%) |
| Material Moving | 0 (0.0%) | 3 (100.0%) |
| Total (Category) | 53 (82.8%) | 11 (17.2%) |
| Total (Overall) | 239 (63.4%) | 138 (36.6%) |
Employment Industries by Sex in Alanson
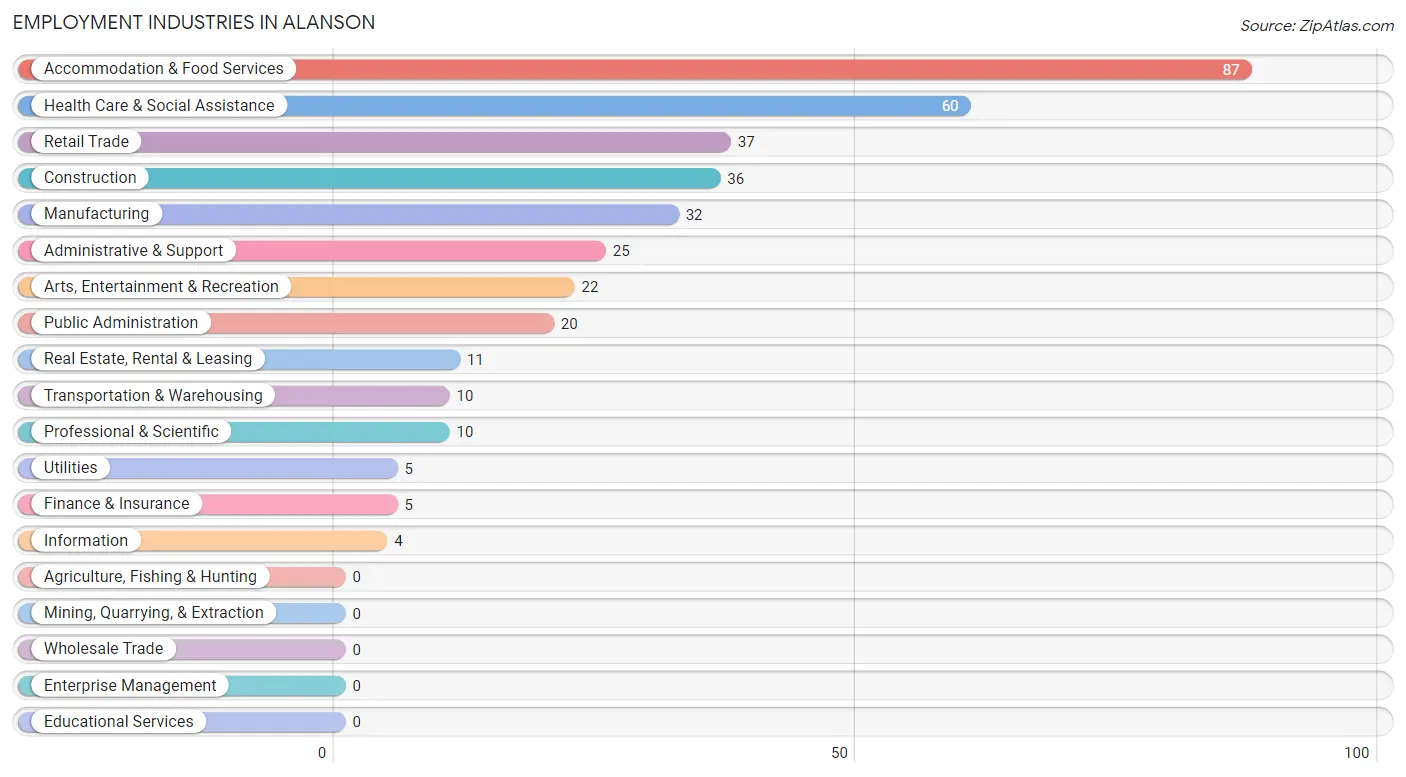
Employment Industries in Alanson
The major employment industries in Alanson include Accommodation & Food Services (87 | 23.1%), Health Care & Social Assistance (60 | 15.9%), Retail Trade (37 | 9.8%), Construction (36 | 9.6%), and Manufacturing (32 | 8.5%).
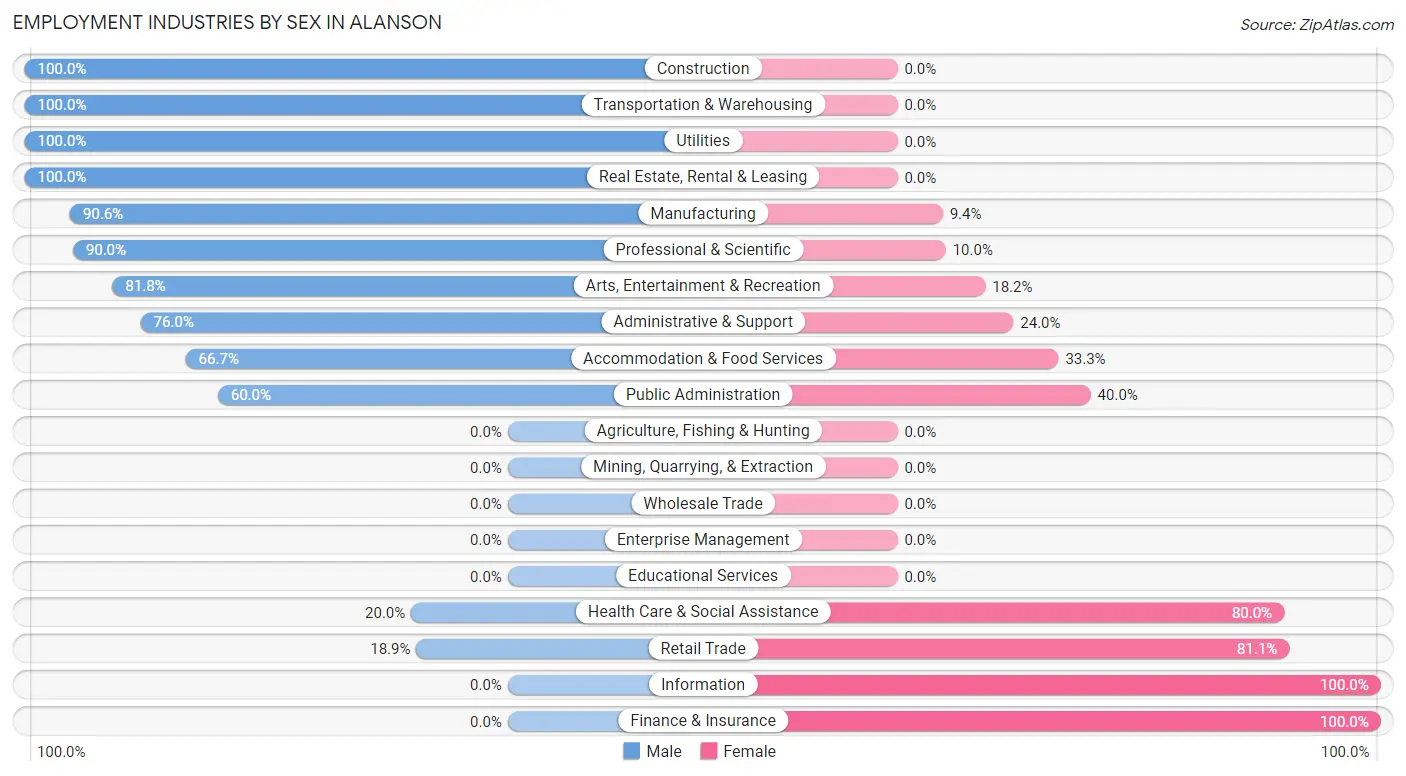
Employment Industries by Sex in Alanson
The Alanson industries that see more men than women are Construction (100.0%), Transportation & Warehousing (100.0%), and Utilities (100.0%), whereas the industries that tend to have a higher number of women are Information (100.0%), Finance & Insurance (100.0%), and Retail Trade (81.1%).
| Industry | Male | Female |
| Agriculture, Fishing & Hunting | 0 (0.0%) | 0 (0.0%) |
| Mining, Quarrying, & Extraction | 0 (0.0%) | 0 (0.0%) |
| Construction | 36 (100.0%) | 0 (0.0%) |
| Manufacturing | 29 (90.6%) | 3 (9.4%) |
| Wholesale Trade | 0 (0.0%) | 0 (0.0%) |
| Retail Trade | 7 (18.9%) | 30 (81.1%) |
| Transportation & Warehousing | 10 (100.0%) | 0 (0.0%) |
| Utilities | 5 (100.0%) | 0 (0.0%) |
| Information | 0 (0.0%) | 4 (100.0%) |
| Finance & Insurance | 0 (0.0%) | 5 (100.0%) |
| Real Estate, Rental & Leasing | 11 (100.0%) | 0 (0.0%) |
| Professional & Scientific | 9 (90.0%) | 1 (10.0%) |
| Enterprise Management | 0 (0.0%) | 0 (0.0%) |
| Administrative & Support | 19 (76.0%) | 6 (24.0%) |
| Educational Services | 0 (0.0%) | 0 (0.0%) |
| Health Care & Social Assistance | 12 (20.0%) | 48 (80.0%) |
| Arts, Entertainment & Recreation | 18 (81.8%) | 4 (18.2%) |
| Accommodation & Food Services | 58 (66.7%) | 29 (33.3%) |
| Public Administration | 12 (60.0%) | 8 (40.0%) |
| Total | 239 (63.4%) | 138 (36.6%) |
Education in Alanson
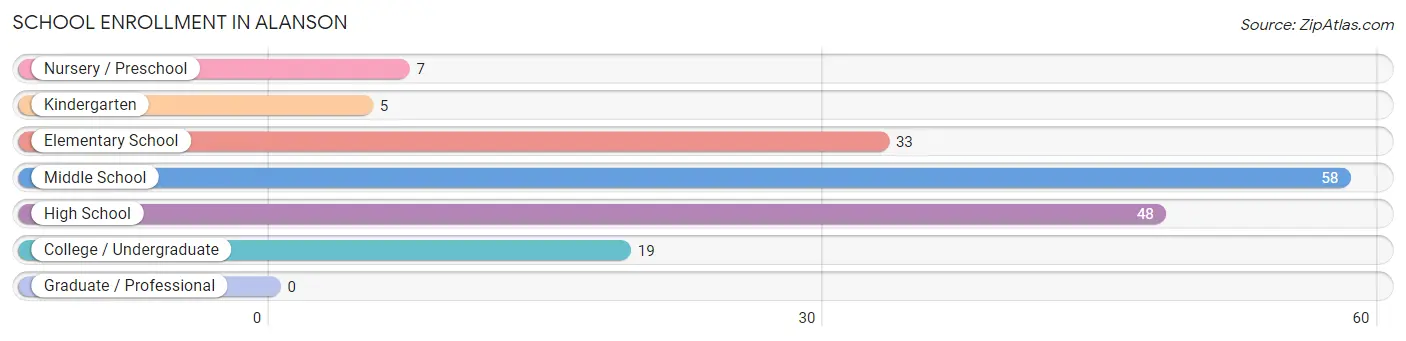
School Enrollment in Alanson
The most common levels of schooling among the 170 students in Alanson are middle school (58 | 34.1%), high school (48 | 28.2%), and elementary school (33 | 19.4%).
| School Level | # Students | % Students |
| Nursery / Preschool | 7 | 4.1% |
| Kindergarten | 5 | 2.9% |
| Elementary School | 33 | 19.4% |
| Middle School | 58 | 34.1% |
| High School | 48 | 28.2% |
| College / Undergraduate | 19 | 11.2% |
| Graduate / Professional | 0 | 0.0% |
| Total | 170 | 100.0% |
School Enrollment by Age by Funding Source in Alanson
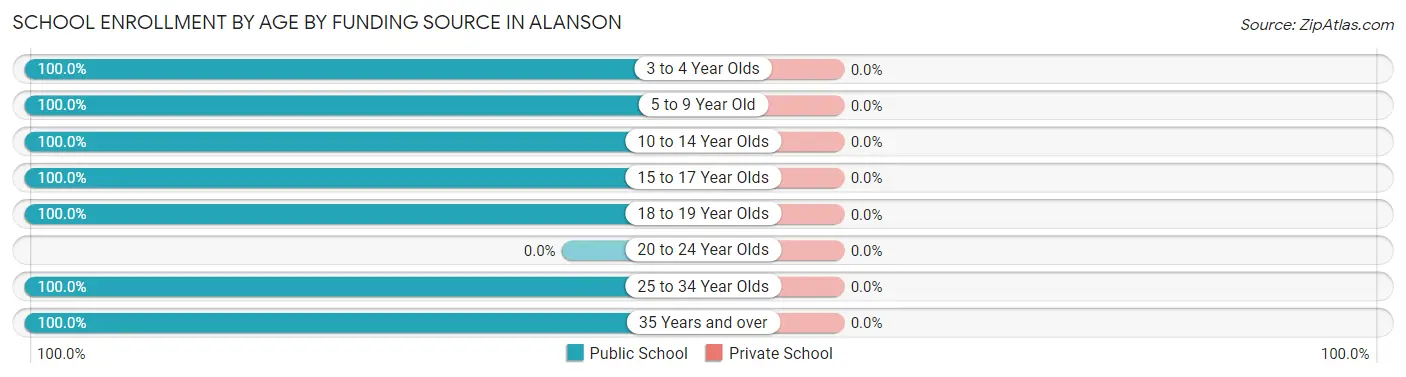
| Age Bracket | Public School | Private School |
| 3 to 4 Year Olds | 7 (100.0%) | 0 (0.0%) |
| 5 to 9 Year Old | 33 (100.0%) | 0 (0.0%) |
| 10 to 14 Year Olds | 68 (100.0%) | 0 (0.0%) |
| 15 to 17 Year Olds | 43 (100.0%) | 0 (0.0%) |
| 18 to 19 Year Olds | 7 (100.0%) | 0 (0.0%) |
| 20 to 24 Year Olds | 0 (0.0%) | 0 (0.0%) |
| 25 to 34 Year Olds | 11 (100.0%) | 0 (0.0%) |
| 35 Years and over | 1 (100.0%) | 0 (0.0%) |
| Total | 170 (100.0%) | 0 (0.0%) |
Educational Attainment by Field of Study in Alanson
Arts & humanities (40 | 48.2%), business (19 | 22.9%), science & technology (6 | 7.2%), bio, nature & agricultural (5 | 6.0%), and engineering (5 | 6.0%) are the most common fields of study among 83 individuals in Alanson who have obtained a bachelor's degree or higher.
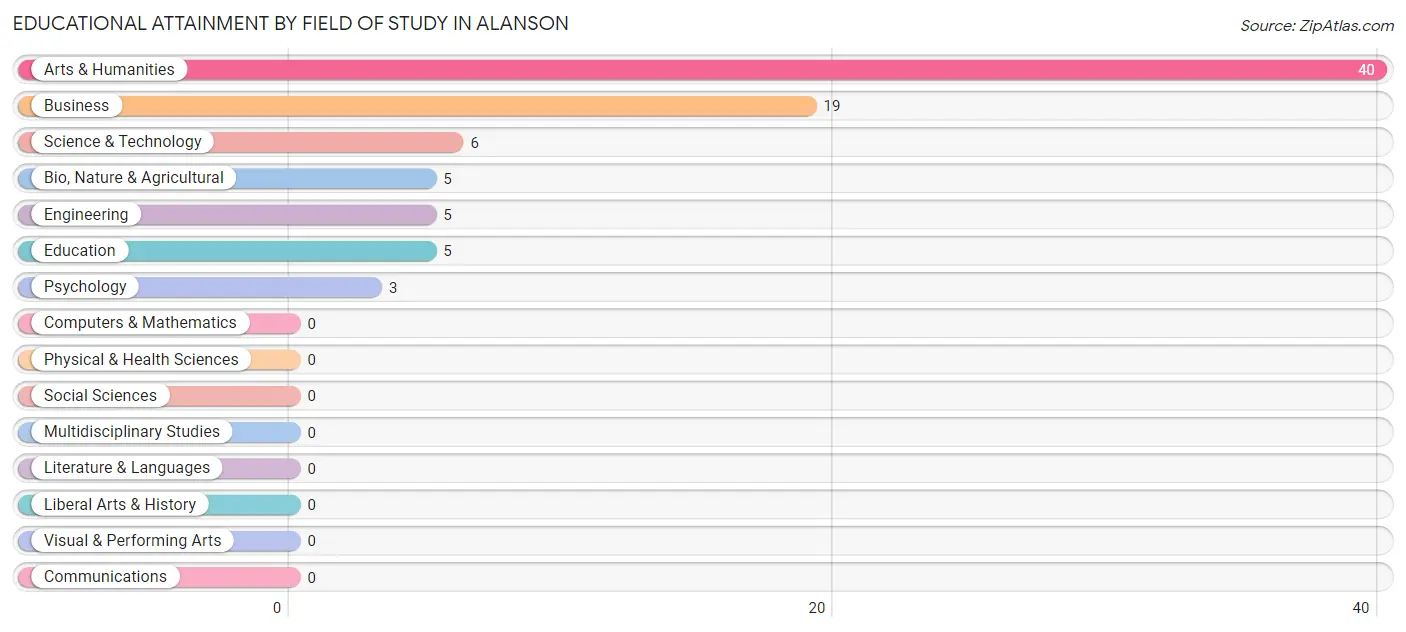
| Field of Study | # Graduates | % Graduates |
| Computers & Mathematics | 0 | 0.0% |
| Bio, Nature & Agricultural | 5 | 6.0% |
| Physical & Health Sciences | 0 | 0.0% |
| Psychology | 3 | 3.6% |
| Social Sciences | 0 | 0.0% |
| Engineering | 5 | 6.0% |
| Multidisciplinary Studies | 0 | 0.0% |
| Science & Technology | 6 | 7.2% |
| Business | 19 | 22.9% |
| Education | 5 | 6.0% |
| Literature & Languages | 0 | 0.0% |
| Liberal Arts & History | 0 | 0.0% |
| Visual & Performing Arts | 0 | 0.0% |
| Communications | 0 | 0.0% |
| Arts & Humanities | 40 | 48.2% |
| Total | 83 | 100.0% |
Transportation & Commute in Alanson
Vehicle Availability by Sex in Alanson
The most prevalent vehicle ownership categories in Alanson are males with 2 vehicles (119, accounting for 50.8%) and females with 2 vehicles (67, making up 90.1%).
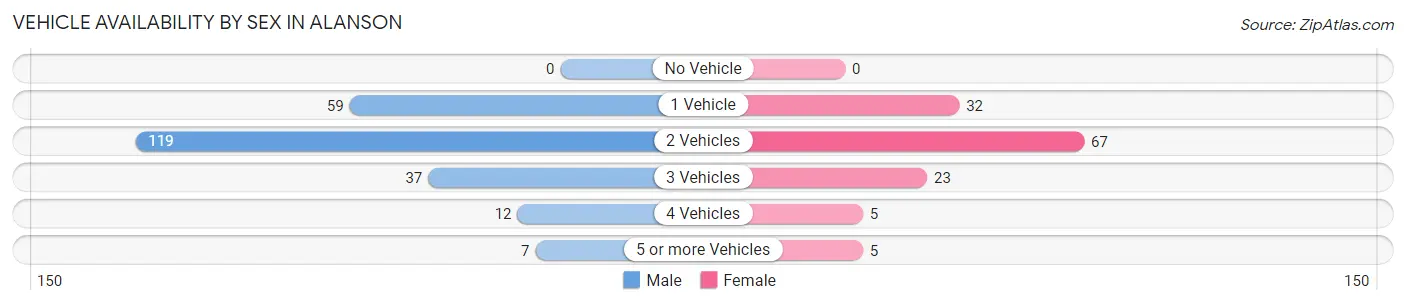
| Vehicles Available | Male | Female |
| No Vehicle | 0 (0.0%) | 0 (0.0%) |
| 1 Vehicle | 59 (25.2%) | 32 (24.2%) |
| 2 Vehicles | 119 (50.8%) | 67 (50.8%) |
| 3 Vehicles | 37 (15.8%) | 23 (17.4%) |
| 4 Vehicles | 12 (5.1%) | 5 (3.8%) |
| 5 or more Vehicles | 7 (3.0%) | 5 (3.8%) |
| Total | 234 (100.0%) | 132 (100.0%) |
Commute Time in Alanson
The most frequently occuring commute durations in Alanson are 30 to 34 minutes (76 commuters, 21.6%), 20 to 24 minutes (51 commuters, 14.5%), and 10 to 14 minutes (49 commuters, 14.0%).
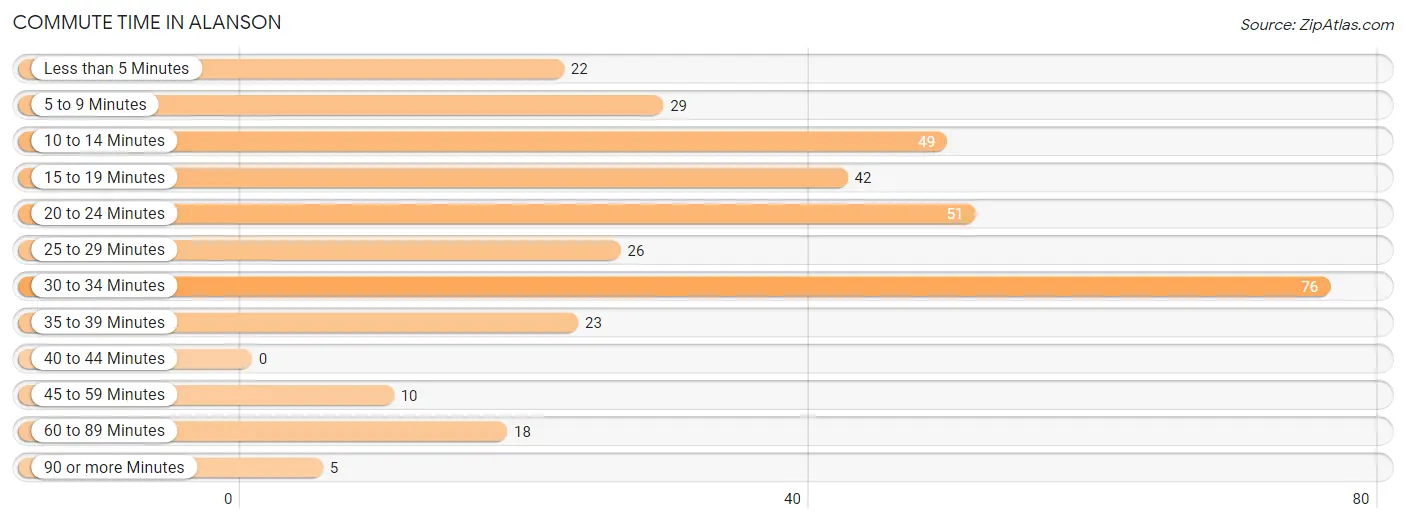
| Commute Time | # Commuters | % Commuters |
| Less than 5 Minutes | 22 | 6.3% |
| 5 to 9 Minutes | 29 | 8.3% |
| 10 to 14 Minutes | 49 | 14.0% |
| 15 to 19 Minutes | 42 | 12.0% |
| 20 to 24 Minutes | 51 | 14.5% |
| 25 to 29 Minutes | 26 | 7.4% |
| 30 to 34 Minutes | 76 | 21.6% |
| 35 to 39 Minutes | 23 | 6.6% |
| 40 to 44 Minutes | 0 | 0.0% |
| 45 to 59 Minutes | 10 | 2.9% |
| 60 to 89 Minutes | 18 | 5.1% |
| 90 or more Minutes | 5 | 1.4% |
Commute Time by Sex in Alanson
The most common commute times in Alanson are 30 to 34 minutes (47 commuters, 21.0%) for males and 30 to 34 minutes (29 commuters, 22.8%) for females.
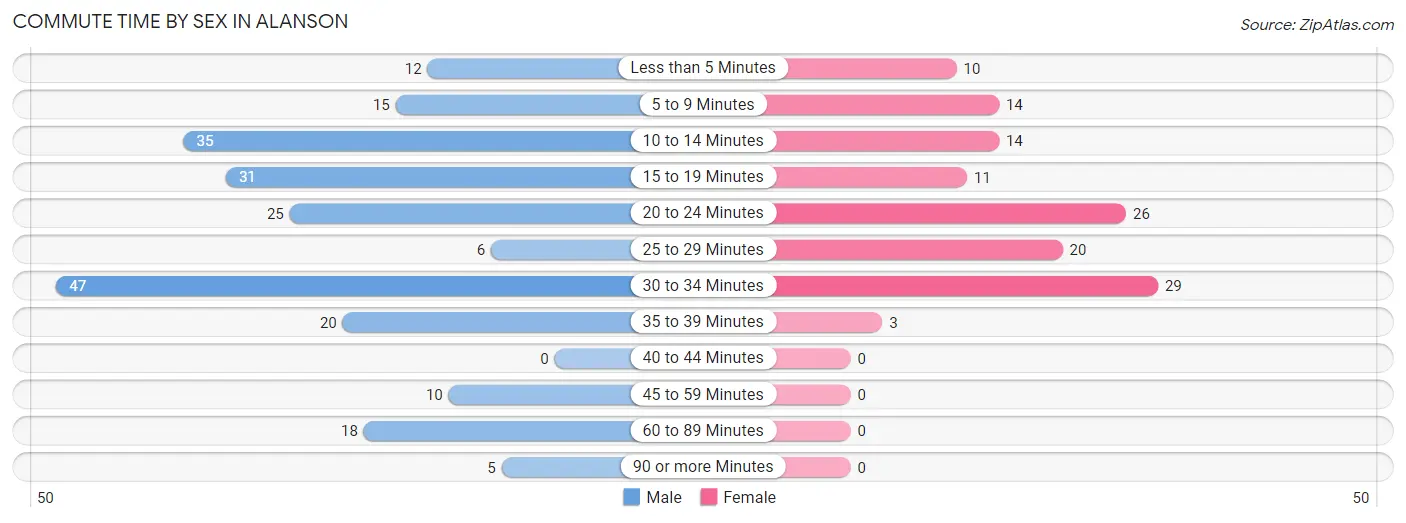
| Commute Time | Male | Female |
| Less than 5 Minutes | 12 (5.4%) | 10 (7.9%) |
| 5 to 9 Minutes | 15 (6.7%) | 14 (11.0%) |
| 10 to 14 Minutes | 35 (15.6%) | 14 (11.0%) |
| 15 to 19 Minutes | 31 (13.8%) | 11 (8.7%) |
| 20 to 24 Minutes | 25 (11.2%) | 26 (20.5%) |
| 25 to 29 Minutes | 6 (2.7%) | 20 (15.8%) |
| 30 to 34 Minutes | 47 (21.0%) | 29 (22.8%) |
| 35 to 39 Minutes | 20 (8.9%) | 3 (2.4%) |
| 40 to 44 Minutes | 0 (0.0%) | 0 (0.0%) |
| 45 to 59 Minutes | 10 (4.5%) | 0 (0.0%) |
| 60 to 89 Minutes | 18 (8.0%) | 0 (0.0%) |
| 90 or more Minutes | 5 (2.2%) | 0 (0.0%) |
Time of Departure to Work by Sex in Alanson
The most frequent times of departure to work in Alanson are 6:00 AM to 6:29 AM (36, 16.1%) for males and 7:00 AM to 7:29 AM (30, 23.6%) for females.
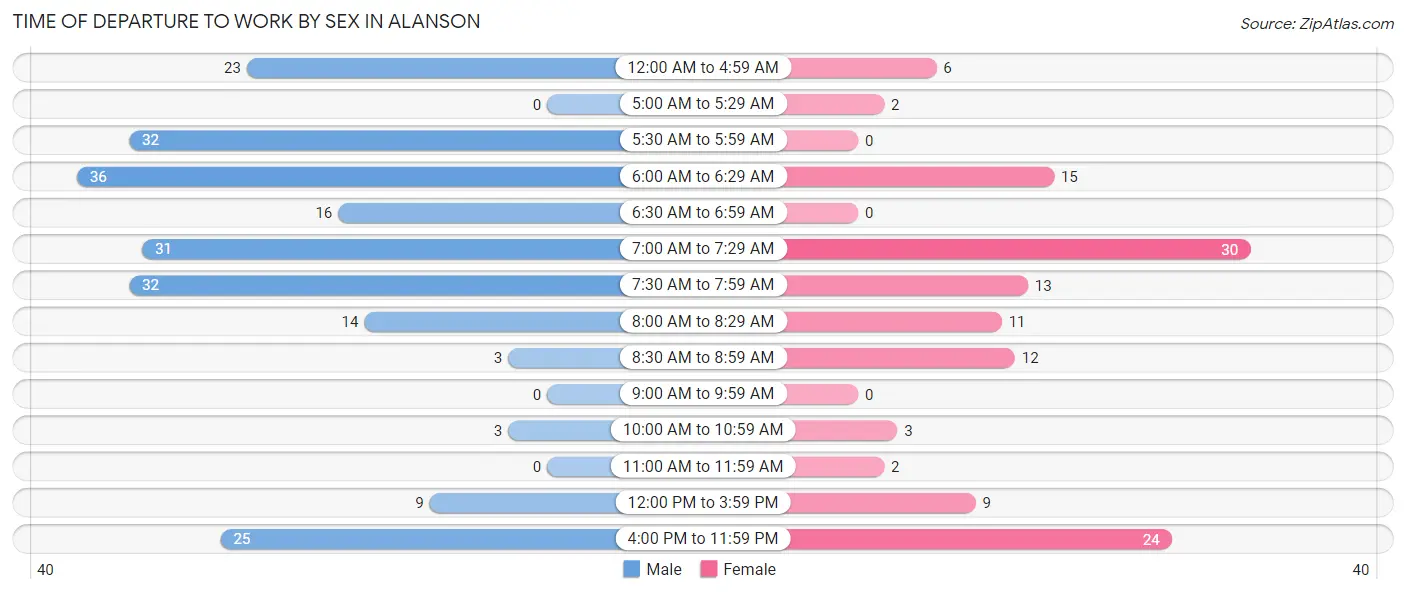
| Time of Departure | Male | Female |
| 12:00 AM to 4:59 AM | 23 (10.3%) | 6 (4.7%) |
| 5:00 AM to 5:29 AM | 0 (0.0%) | 2 (1.6%) |
| 5:30 AM to 5:59 AM | 32 (14.3%) | 0 (0.0%) |
| 6:00 AM to 6:29 AM | 36 (16.1%) | 15 (11.8%) |
| 6:30 AM to 6:59 AM | 16 (7.1%) | 0 (0.0%) |
| 7:00 AM to 7:29 AM | 31 (13.8%) | 30 (23.6%) |
| 7:30 AM to 7:59 AM | 32 (14.3%) | 13 (10.2%) |
| 8:00 AM to 8:29 AM | 14 (6.2%) | 11 (8.7%) |
| 8:30 AM to 8:59 AM | 3 (1.3%) | 12 (9.5%) |
| 9:00 AM to 9:59 AM | 0 (0.0%) | 0 (0.0%) |
| 10:00 AM to 10:59 AM | 3 (1.3%) | 3 (2.4%) |
| 11:00 AM to 11:59 AM | 0 (0.0%) | 2 (1.6%) |
| 12:00 PM to 3:59 PM | 9 (4.0%) | 9 (7.1%) |
| 4:00 PM to 11:59 PM | 25 (11.2%) | 24 (18.9%) |
| Total | 224 (100.0%) | 127 (100.0%) |
Housing Occupancy in Alanson
Occupancy by Ownership in Alanson
Of the total 366 dwellings in Alanson, owner-occupied units account for 291 (79.5%), while renter-occupied units make up 75 (20.5%).
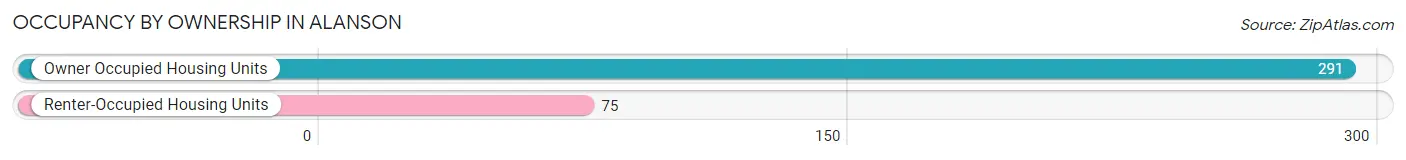
| Occupancy | # Housing Units | % Housing Units |
| Owner Occupied Housing Units | 291 | 79.5% |
| Renter-Occupied Housing Units | 75 | 20.5% |
| Total Occupied Housing Units | 366 | 100.0% |
Occupancy by Household Size in Alanson
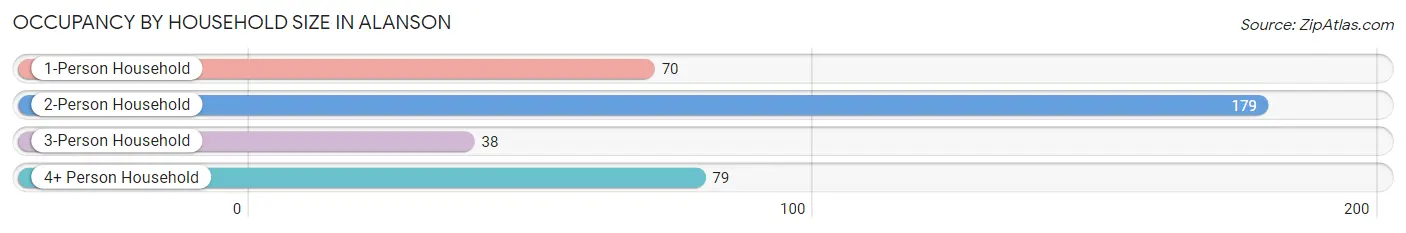
| Household Size | # Housing Units | % Housing Units |
| 1-Person Household | 70 | 19.1% |
| 2-Person Household | 179 | 48.9% |
| 3-Person Household | 38 | 10.4% |
| 4+ Person Household | 79 | 21.6% |
| Total Housing Units | 366 | 100.0% |
Occupancy by Ownership by Household Size in Alanson
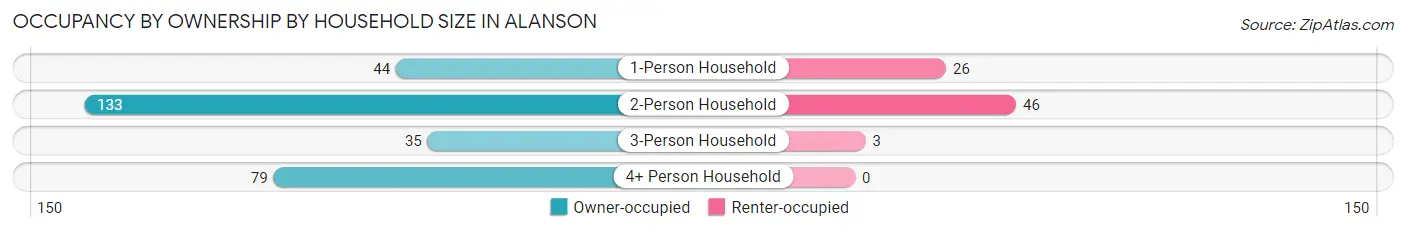
| Household Size | Owner-occupied | Renter-occupied |
| 1-Person Household | 44 (62.9%) | 26 (37.1%) |
| 2-Person Household | 133 (74.3%) | 46 (25.7%) |
| 3-Person Household | 35 (92.1%) | 3 (7.9%) |
| 4+ Person Household | 79 (100.0%) | 0 (0.0%) |
| Total Housing Units | 291 (79.5%) | 75 (20.5%) |
Occupancy by Educational Attainment in Alanson
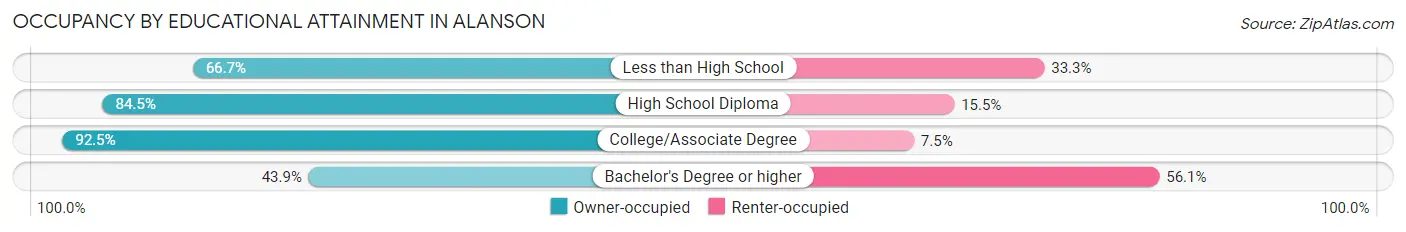
| Household Size | Owner-occupied | Renter-occupied |
| Less than High School | 14 (66.7%) | 7 (33.3%) |
| High School Diploma | 153 (84.5%) | 28 (15.5%) |
| College/Associate Degree | 99 (92.5%) | 8 (7.5%) |
| Bachelor's Degree or higher | 25 (43.9%) | 32 (56.1%) |
Occupancy by Age of Householder in Alanson
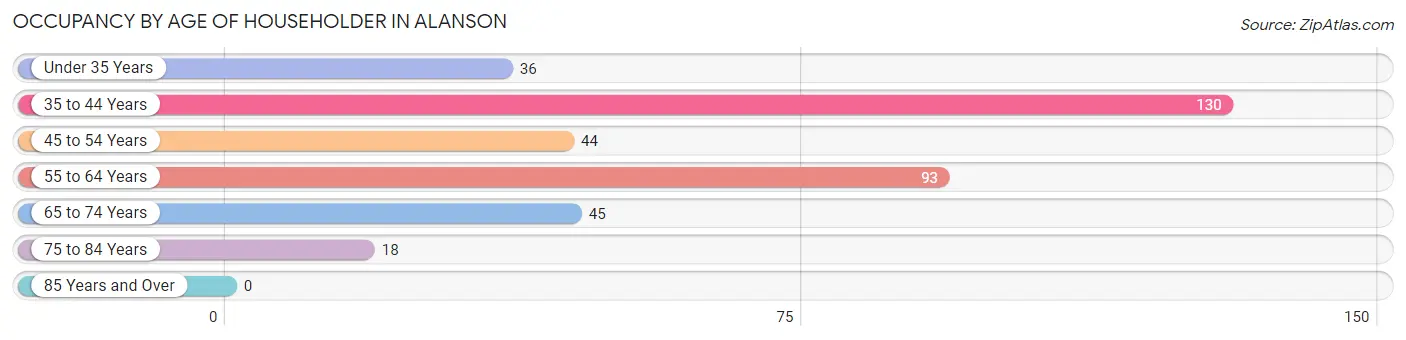
| Age Bracket | # Households | % Households |
| Under 35 Years | 36 | 9.8% |
| 35 to 44 Years | 130 | 35.5% |
| 45 to 54 Years | 44 | 12.0% |
| 55 to 64 Years | 93 | 25.4% |
| 65 to 74 Years | 45 | 12.3% |
| 75 to 84 Years | 18 | 4.9% |
| 85 Years and Over | 0 | 0.0% |
| Total | 366 | 100.0% |
Housing Finances in Alanson
Median Income by Occupancy in Alanson
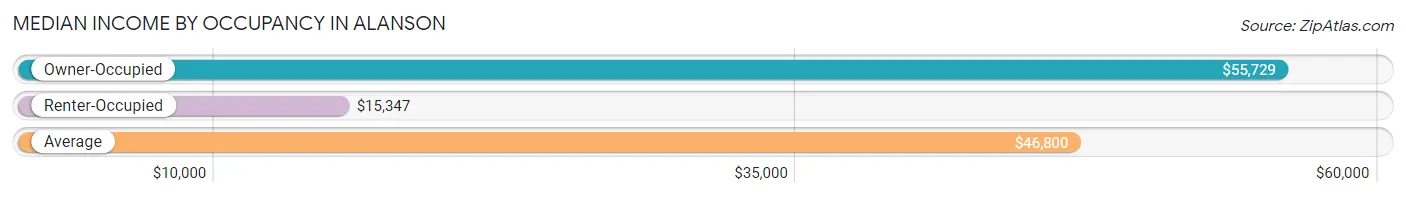
| Occupancy Type | # Households | Median Income |
| Owner-Occupied | 291 (79.5%) | $55,729 |
| Renter-Occupied | 75 (20.5%) | $15,347 |
| Average | 366 (100.0%) | $46,800 |
Occupancy by Householder Income Bracket in Alanson
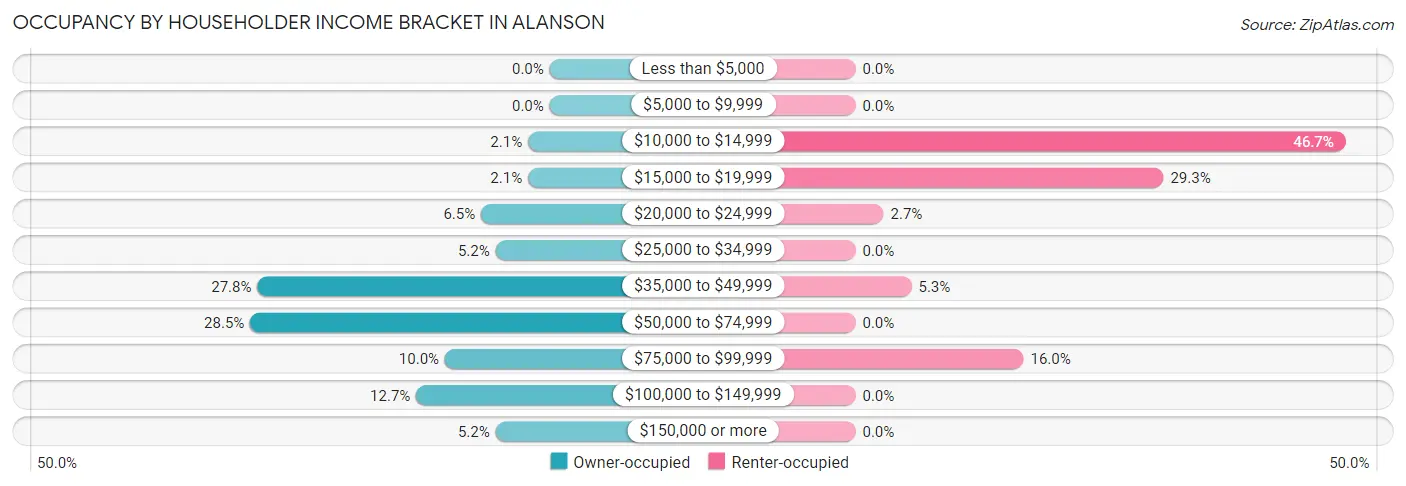
| Income Bracket | Owner-occupied | Renter-occupied |
| Less than $5,000 | 0 (0.0%) | 0 (0.0%) |
| $5,000 to $9,999 | 0 (0.0%) | 0 (0.0%) |
| $10,000 to $14,999 | 6 (2.1%) | 35 (46.7%) |
| $15,000 to $19,999 | 6 (2.1%) | 22 (29.3%) |
| $20,000 to $24,999 | 19 (6.5%) | 2 (2.7%) |
| $25,000 to $34,999 | 15 (5.1%) | 0 (0.0%) |
| $35,000 to $49,999 | 81 (27.8%) | 4 (5.3%) |
| $50,000 to $74,999 | 83 (28.5%) | 0 (0.0%) |
| $75,000 to $99,999 | 29 (10.0%) | 12 (16.0%) |
| $100,000 to $149,999 | 37 (12.7%) | 0 (0.0%) |
| $150,000 or more | 15 (5.1%) | 0 (0.0%) |
| Total | 291 (100.0%) | 75 (100.0%) |
Monthly Housing Cost Tiers in Alanson
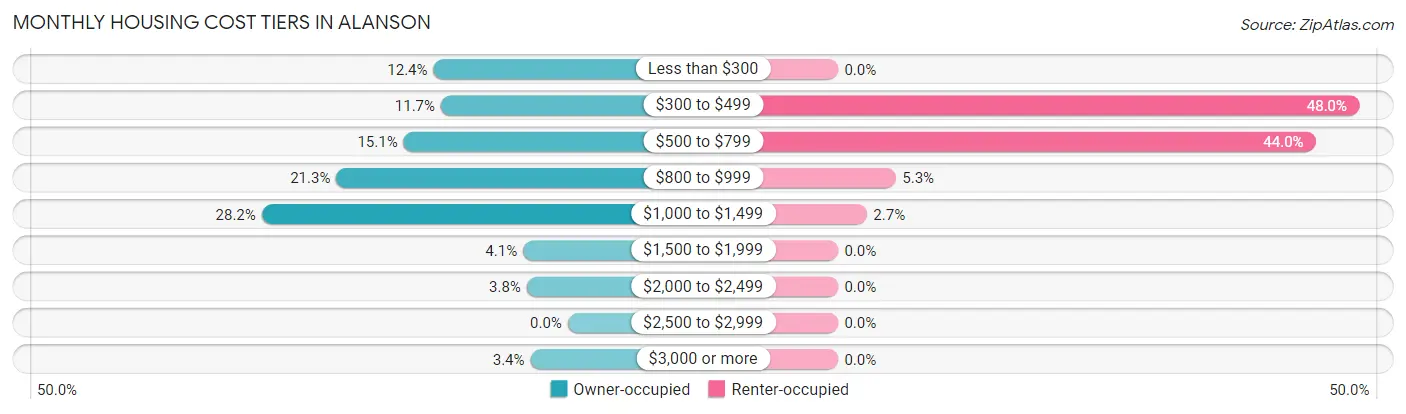
| Monthly Cost | Owner-occupied | Renter-occupied |
| Less than $300 | 36 (12.4%) | 0 (0.0%) |
| $300 to $499 | 34 (11.7%) | 36 (48.0%) |
| $500 to $799 | 44 (15.1%) | 33 (44.0%) |
| $800 to $999 | 62 (21.3%) | 4 (5.3%) |
| $1,000 to $1,499 | 82 (28.2%) | 2 (2.7%) |
| $1,500 to $1,999 | 12 (4.1%) | 0 (0.0%) |
| $2,000 to $2,499 | 11 (3.8%) | 0 (0.0%) |
| $2,500 to $2,999 | 0 (0.0%) | 0 (0.0%) |
| $3,000 or more | 10 (3.4%) | 0 (0.0%) |
| Total | 291 (100.0%) | 75 (100.0%) |
Physical Housing Characteristics in Alanson
Housing Structures in Alanson
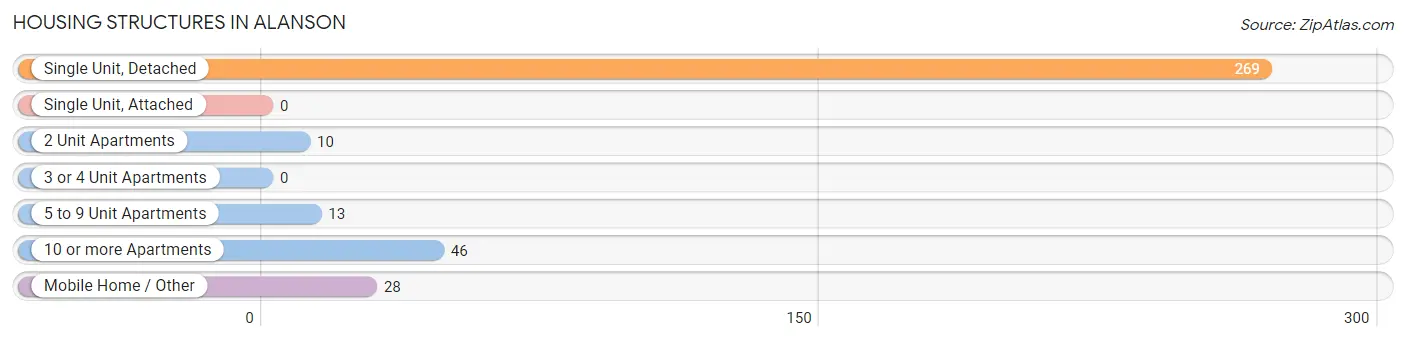
| Structure Type | # Housing Units | % Housing Units |
| Single Unit, Detached | 269 | 73.5% |
| Single Unit, Attached | 0 | 0.0% |
| 2 Unit Apartments | 10 | 2.7% |
| 3 or 4 Unit Apartments | 0 | 0.0% |
| 5 to 9 Unit Apartments | 13 | 3.5% |
| 10 or more Apartments | 46 | 12.6% |
| Mobile Home / Other | 28 | 7.6% |
| Total | 366 | 100.0% |
Housing Structures by Occupancy in Alanson
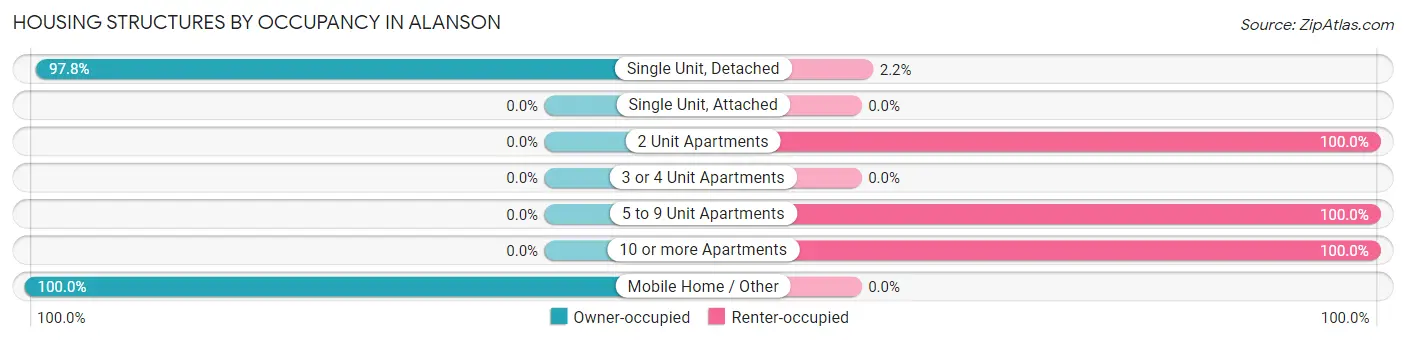
| Structure Type | Owner-occupied | Renter-occupied |
| Single Unit, Detached | 263 (97.8%) | 6 (2.2%) |
| Single Unit, Attached | 0 (0.0%) | 0 (0.0%) |
| 2 Unit Apartments | 0 (0.0%) | 10 (100.0%) |
| 3 or 4 Unit Apartments | 0 (0.0%) | 0 (0.0%) |
| 5 to 9 Unit Apartments | 0 (0.0%) | 13 (100.0%) |
| 10 or more Apartments | 0 (0.0%) | 46 (100.0%) |
| Mobile Home / Other | 28 (100.0%) | 0 (0.0%) |
| Total | 291 (79.5%) | 75 (20.5%) |
Housing Structures by Number of Rooms in Alanson
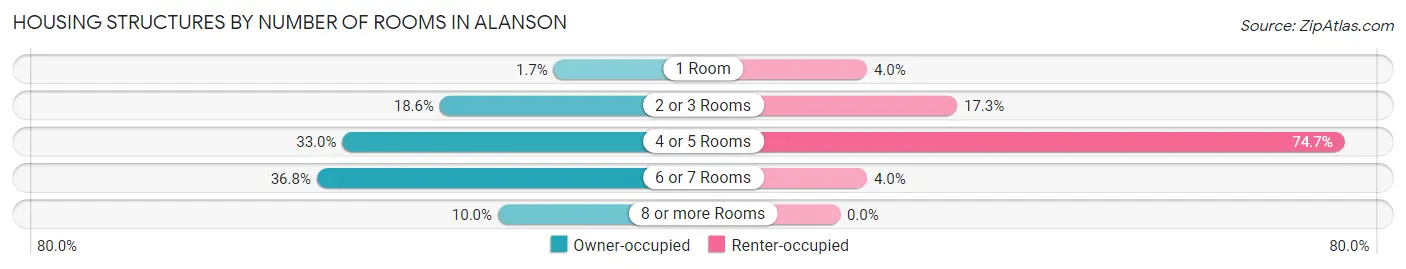
| Number of Rooms | Owner-occupied | Renter-occupied |
| 1 Room | 5 (1.7%) | 3 (4.0%) |
| 2 or 3 Rooms | 54 (18.6%) | 13 (17.3%) |
| 4 or 5 Rooms | 96 (33.0%) | 56 (74.7%) |
| 6 or 7 Rooms | 107 (36.8%) | 3 (4.0%) |
| 8 or more Rooms | 29 (10.0%) | 0 (0.0%) |
| Total | 291 (100.0%) | 75 (100.0%) |
Housing Structure by Heating Type in Alanson
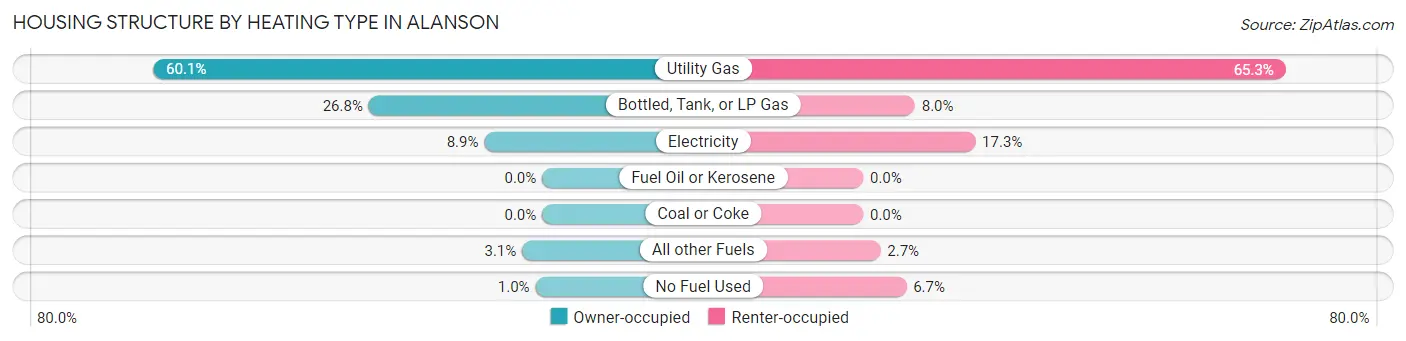
| Heating Type | Owner-occupied | Renter-occupied |
| Utility Gas | 175 (60.1%) | 49 (65.3%) |
| Bottled, Tank, or LP Gas | 78 (26.8%) | 6 (8.0%) |
| Electricity | 26 (8.9%) | 13 (17.3%) |
| Fuel Oil or Kerosene | 0 (0.0%) | 0 (0.0%) |
| Coal or Coke | 0 (0.0%) | 0 (0.0%) |
| All other Fuels | 9 (3.1%) | 2 (2.7%) |
| No Fuel Used | 3 (1.0%) | 5 (6.7%) |
| Total | 291 (100.0%) | 75 (100.0%) |
Household Vehicle Usage in Alanson
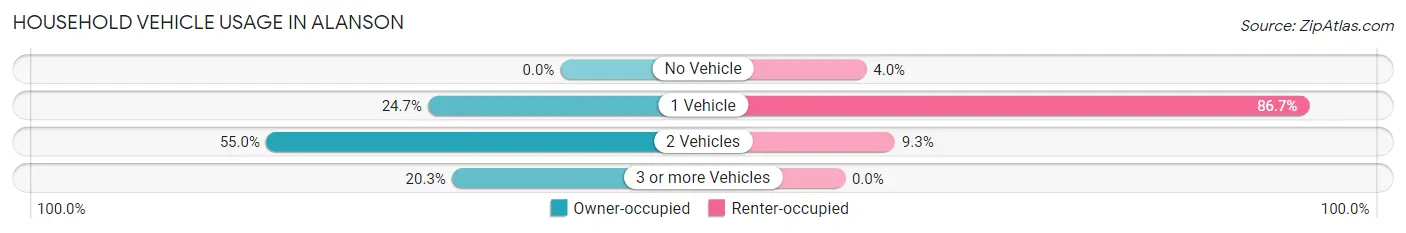
| Vehicles per Household | Owner-occupied | Renter-occupied |
| No Vehicle | 0 (0.0%) | 3 (4.0%) |
| 1 Vehicle | 72 (24.7%) | 65 (86.7%) |
| 2 Vehicles | 160 (55.0%) | 7 (9.3%) |
| 3 or more Vehicles | 59 (20.3%) | 0 (0.0%) |
| Total | 291 (100.0%) | 75 (100.0%) |
Real Estate & Mortgages in Alanson
Real Estate and Mortgage Overview in Alanson
| Characteristic | Without Mortgage | With Mortgage |
| Housing Units | 92 | 199 |
| Median Property Value | $82,000 | $134,800 |
| Median Household Income | $40,750 | $12 |
| Monthly Housing Costs | $420 | $10 |
| Real Estate Taxes | $1,087 | $22 |
Property Value by Mortgage Status in Alanson
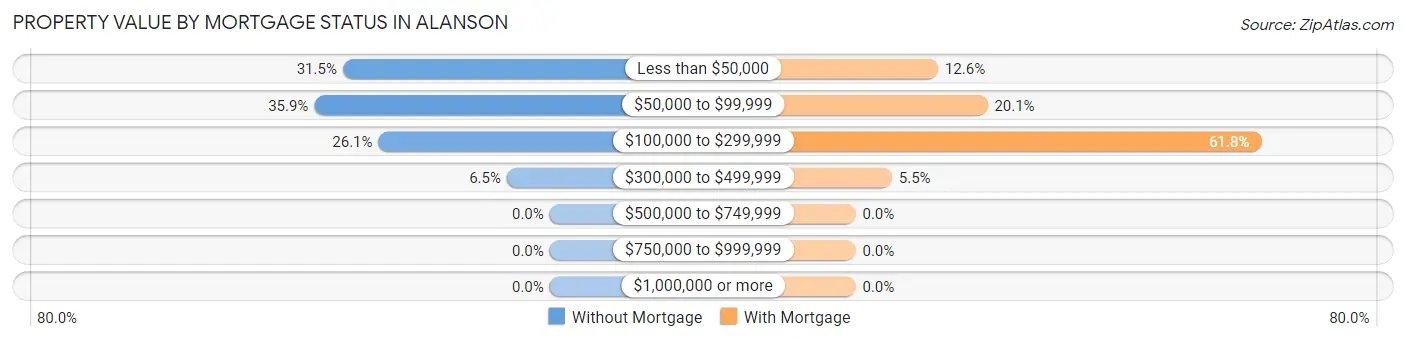
| Property Value | Without Mortgage | With Mortgage |
| Less than $50,000 | 29 (31.5%) | 25 (12.6%) |
| $50,000 to $99,999 | 33 (35.9%) | 40 (20.1%) |
| $100,000 to $299,999 | 24 (26.1%) | 123 (61.8%) |
| $300,000 to $499,999 | 6 (6.5%) | 11 (5.5%) |
| $500,000 to $749,999 | 0 (0.0%) | 0 (0.0%) |
| $750,000 to $999,999 | 0 (0.0%) | 0 (0.0%) |
| $1,000,000 or more | 0 (0.0%) | 0 (0.0%) |
| Total | 92 (100.0%) | 199 (100.0%) |
Household Income by Mortgage Status in Alanson
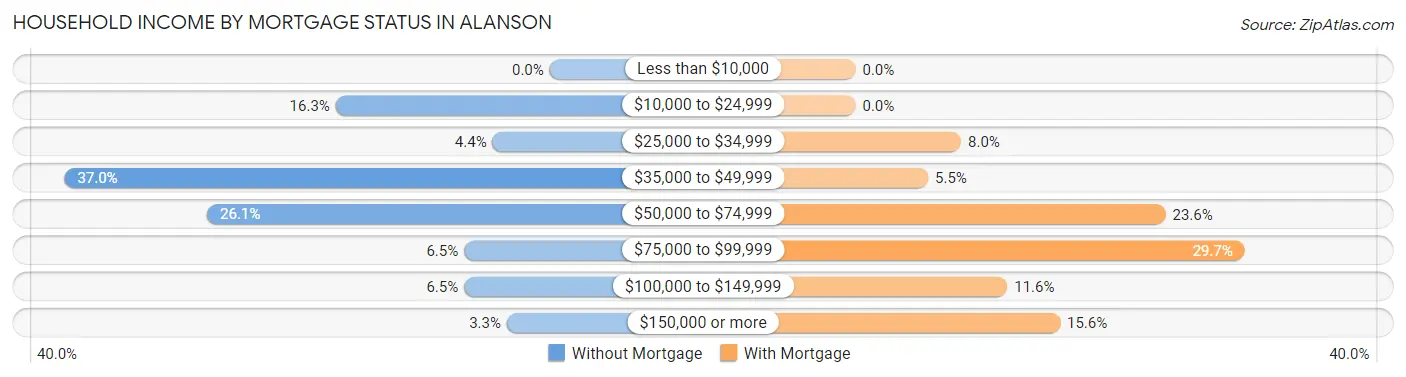
| Household Income | Without Mortgage | With Mortgage |
| Less than $10,000 | 0 (0.0%) | 0 (0.0%) |
| $10,000 to $24,999 | 15 (16.3%) | 0 (0.0%) |
| $25,000 to $34,999 | 4 (4.3%) | 16 (8.0%) |
| $35,000 to $49,999 | 34 (37.0%) | 11 (5.5%) |
| $50,000 to $74,999 | 24 (26.1%) | 47 (23.6%) |
| $75,000 to $99,999 | 6 (6.5%) | 59 (29.6%) |
| $100,000 to $149,999 | 6 (6.5%) | 23 (11.6%) |
| $150,000 or more | 3 (3.3%) | 31 (15.6%) |
| Total | 92 (100.0%) | 199 (100.0%) |
Property Value to Household Income Ratio in Alanson
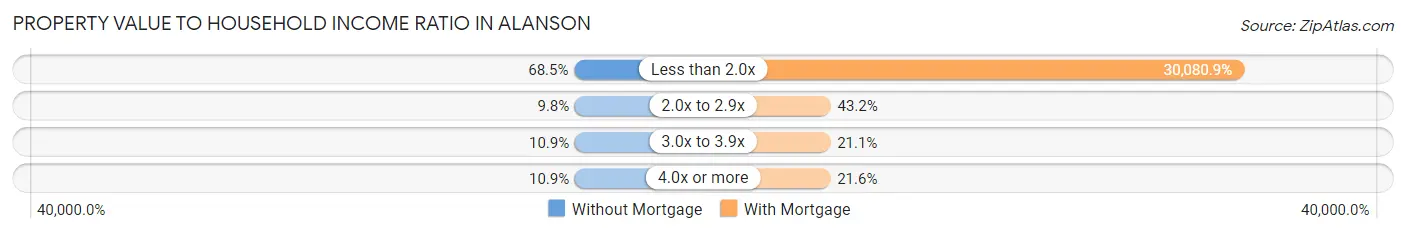
| Value-to-Income Ratio | Without Mortgage | With Mortgage |
| Less than 2.0x | 63 (68.5%) | 59,861 (30,080.9%) |
| 2.0x to 2.9x | 9 (9.8%) | 86 (43.2%) |
| 3.0x to 3.9x | 10 (10.9%) | 42 (21.1%) |
| 4.0x or more | 10 (10.9%) | 43 (21.6%) |
| Total | 92 (100.0%) | 199 (100.0%) |
Real Estate Taxes by Mortgage Status in Alanson
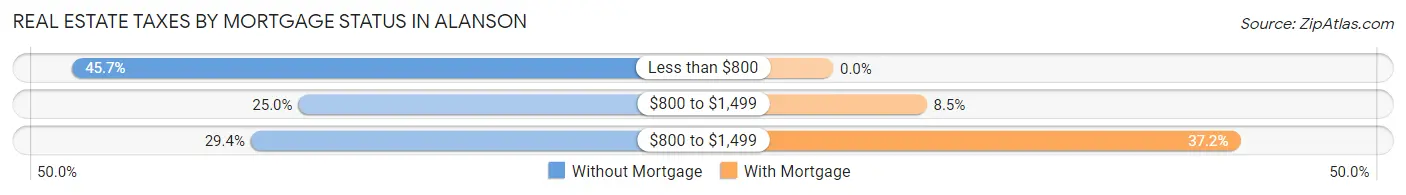
| Property Taxes | Without Mortgage | With Mortgage |
| Less than $800 | 42 (45.7%) | 0 (0.0%) |
| $800 to $1,499 | 23 (25.0%) | 17 (8.5%) |
| $800 to $1,499 | 27 (29.3%) | 74 (37.2%) |
| Total | 92 (100.0%) | 199 (100.0%) |
Health & Disability in Alanson
Health Insurance Coverage by Age in Alanson
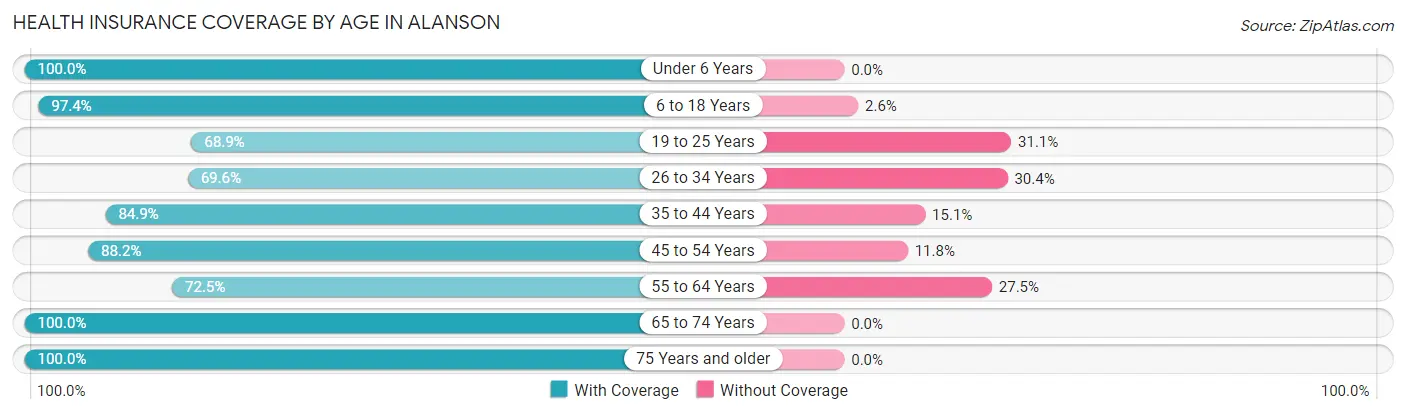
| Age Bracket | With Coverage | Without Coverage |
| Under 6 Years | 33 (100.0%) | 0 (0.0%) |
| 6 to 18 Years | 151 (97.4%) | 4 (2.6%) |
| 19 to 25 Years | 31 (68.9%) | 14 (31.1%) |
| 26 to 34 Years | 64 (69.6%) | 28 (30.4%) |
| 35 to 44 Years | 152 (84.9%) | 27 (15.1%) |
| 45 to 54 Years | 82 (88.2%) | 11 (11.8%) |
| 55 to 64 Years | 108 (72.5%) | 41 (27.5%) |
| 65 to 74 Years | 68 (100.0%) | 0 (0.0%) |
| 75 Years and older | 48 (100.0%) | 0 (0.0%) |
| Total | 737 (85.5%) | 125 (14.5%) |
Health Insurance Coverage by Citizenship Status in Alanson
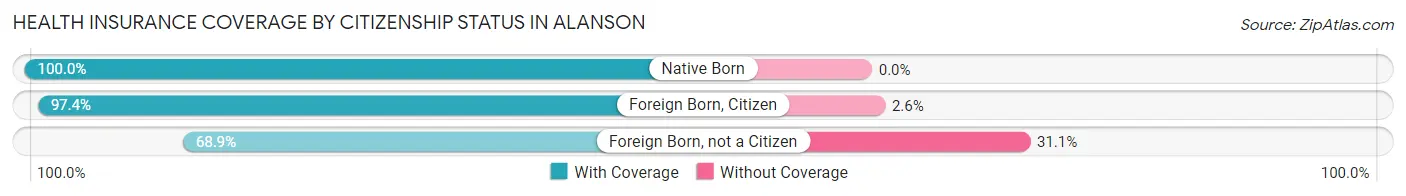
| Citizenship Status | With Coverage | Without Coverage |
| Native Born | 33 (100.0%) | 0 (0.0%) |
| Foreign Born, Citizen | 151 (97.4%) | 4 (2.6%) |
| Foreign Born, not a Citizen | 31 (68.9%) | 14 (31.1%) |
Health Insurance Coverage by Household Income in Alanson
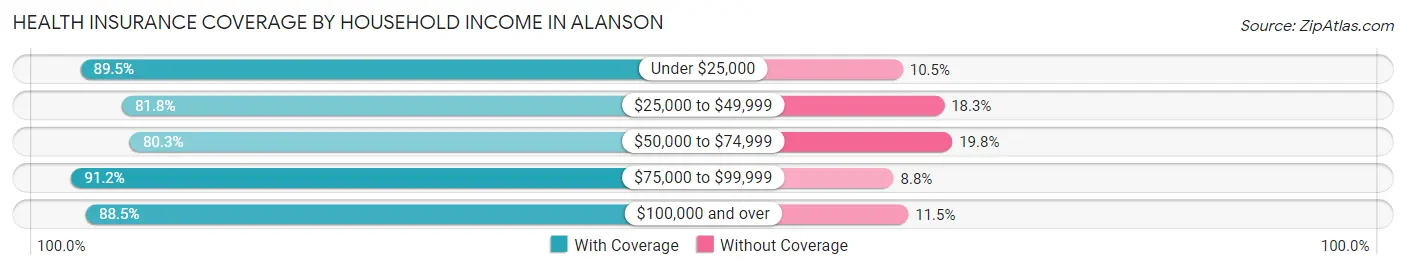
| Household Income | With Coverage | Without Coverage |
| Under $25,000 | 128 (89.5%) | 15 (10.5%) |
| $25,000 to $49,999 | 206 (81.8%) | 46 (18.2%) |
| $50,000 to $74,999 | 130 (80.2%) | 32 (19.8%) |
| $75,000 to $99,999 | 104 (91.2%) | 10 (8.8%) |
| $100,000 and over | 169 (88.5%) | 22 (11.5%) |
Public vs Private Health Insurance Coverage by Age in Alanson
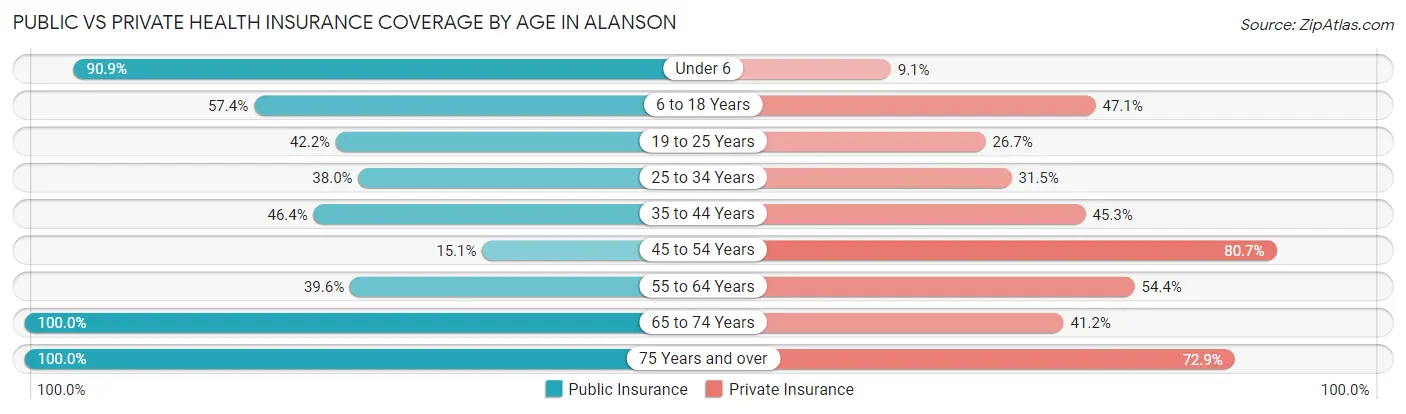
| Age Bracket | Public Insurance | Private Insurance |
| Under 6 | 30 (90.9%) | 3 (9.1%) |
| 6 to 18 Years | 89 (57.4%) | 73 (47.1%) |
| 19 to 25 Years | 19 (42.2%) | 12 (26.7%) |
| 25 to 34 Years | 35 (38.0%) | 29 (31.5%) |
| 35 to 44 Years | 83 (46.4%) | 81 (45.3%) |
| 45 to 54 Years | 14 (15.0%) | 75 (80.6%) |
| 55 to 64 Years | 59 (39.6%) | 81 (54.4%) |
| 65 to 74 Years | 68 (100.0%) | 28 (41.2%) |
| 75 Years and over | 48 (100.0%) | 35 (72.9%) |
| Total | 445 (51.6%) | 417 (48.4%) |
Disability Status by Sex by Age in Alanson
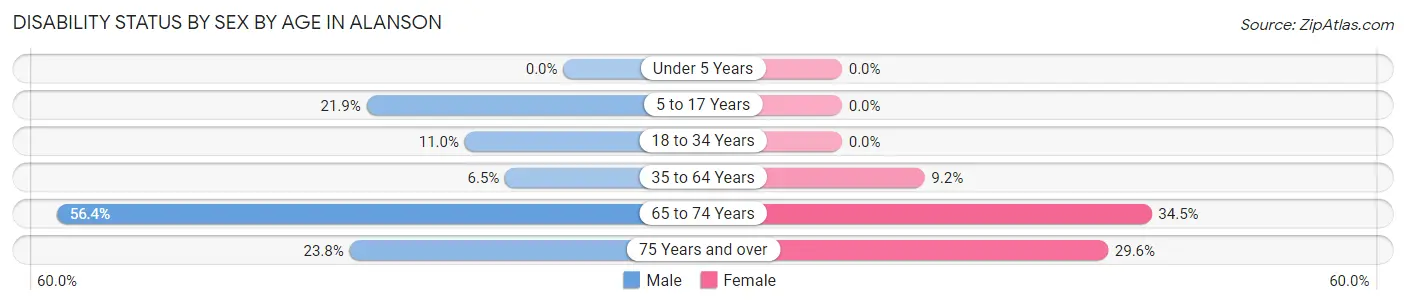
| Age Bracket | Male | Female |
| Under 5 Years | 0 (0.0%) | 0 (0.0%) |
| 5 to 17 Years | 16 (21.9%) | 0 (0.0%) |
| 18 to 34 Years | 9 (11.0%) | 0 (0.0%) |
| 35 to 64 Years | 16 (6.5%) | 16 (9.2%) |
| 65 to 74 Years | 22 (56.4%) | 10 (34.5%) |
| 75 Years and over | 5 (23.8%) | 8 (29.6%) |
Disability Class by Sex by Age in Alanson
Disability Class: Hearing Difficulty
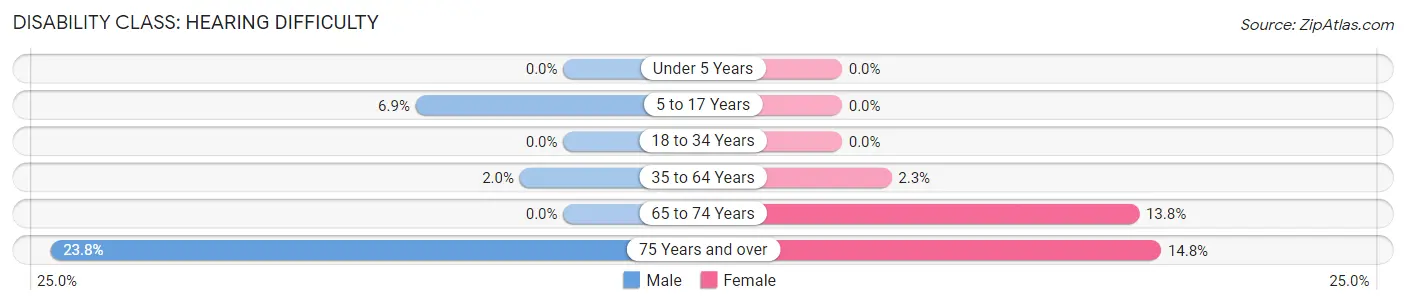
| Age Bracket | Male | Female |
| Under 5 Years | 0 (0.0%) | 0 (0.0%) |
| 5 to 17 Years | 5 (6.9%) | 0 (0.0%) |
| 18 to 34 Years | 0 (0.0%) | 0 (0.0%) |
| 35 to 64 Years | 5 (2.0%) | 4 (2.3%) |
| 65 to 74 Years | 0 (0.0%) | 4 (13.8%) |
| 75 Years and over | 5 (23.8%) | 4 (14.8%) |
Disability Class: Vision Difficulty
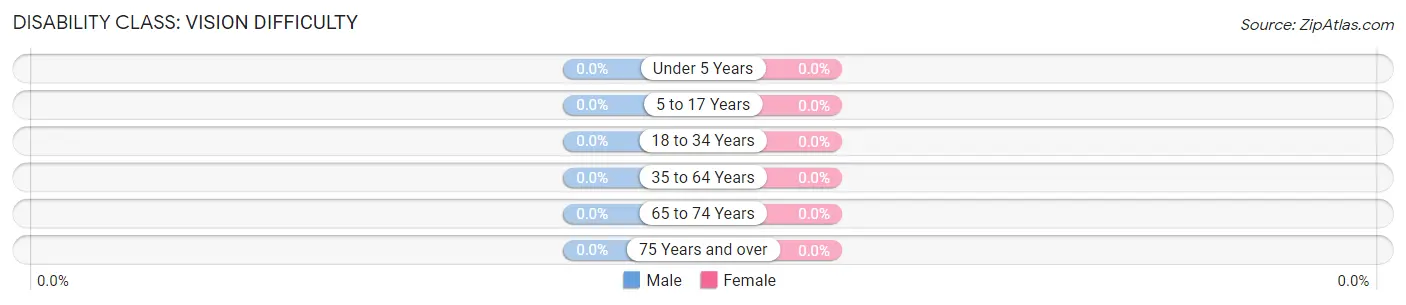
| Age Bracket | Male | Female |
| Under 5 Years | 0 (0.0%) | 0 (0.0%) |
| 5 to 17 Years | 0 (0.0%) | 0 (0.0%) |
| 18 to 34 Years | 0 (0.0%) | 0 (0.0%) |
| 35 to 64 Years | 0 (0.0%) | 0 (0.0%) |
| 65 to 74 Years | 0 (0.0%) | 0 (0.0%) |
| 75 Years and over | 0 (0.0%) | 0 (0.0%) |
Disability Class: Cognitive Difficulty
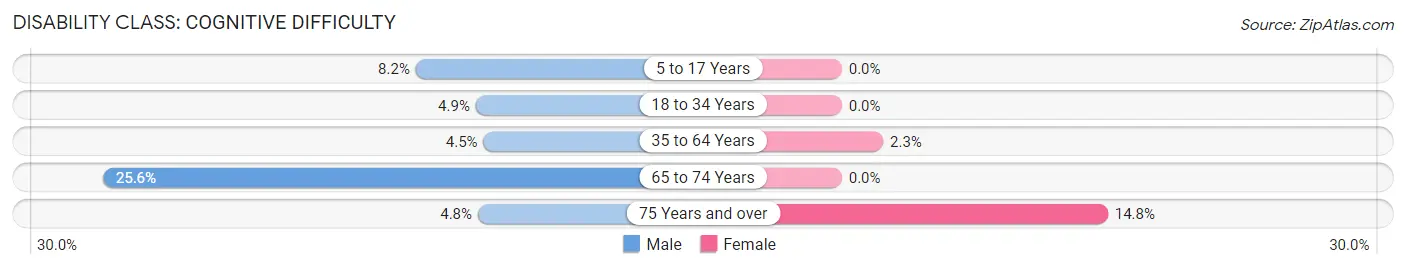
| Age Bracket | Male | Female |
| 5 to 17 Years | 6 (8.2%) | 0 (0.0%) |
| 18 to 34 Years | 4 (4.9%) | 0 (0.0%) |
| 35 to 64 Years | 11 (4.4%) | 4 (2.3%) |
| 65 to 74 Years | 10 (25.6%) | 0 (0.0%) |
| 75 Years and over | 1 (4.8%) | 4 (14.8%) |
Disability Class: Ambulatory Difficulty
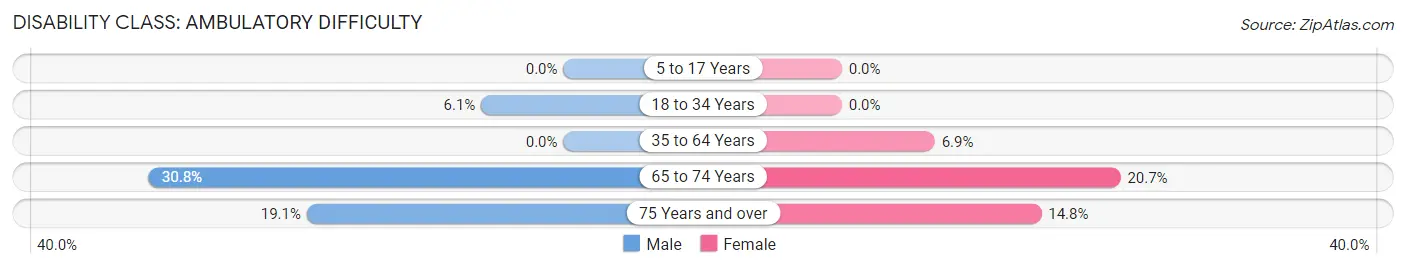
| Age Bracket | Male | Female |
| 5 to 17 Years | 0 (0.0%) | 0 (0.0%) |
| 18 to 34 Years | 5 (6.1%) | 0 (0.0%) |
| 35 to 64 Years | 0 (0.0%) | 12 (6.9%) |
| 65 to 74 Years | 12 (30.8%) | 6 (20.7%) |
| 75 Years and over | 4 (19.1%) | 4 (14.8%) |
Disability Class: Self-Care Difficulty
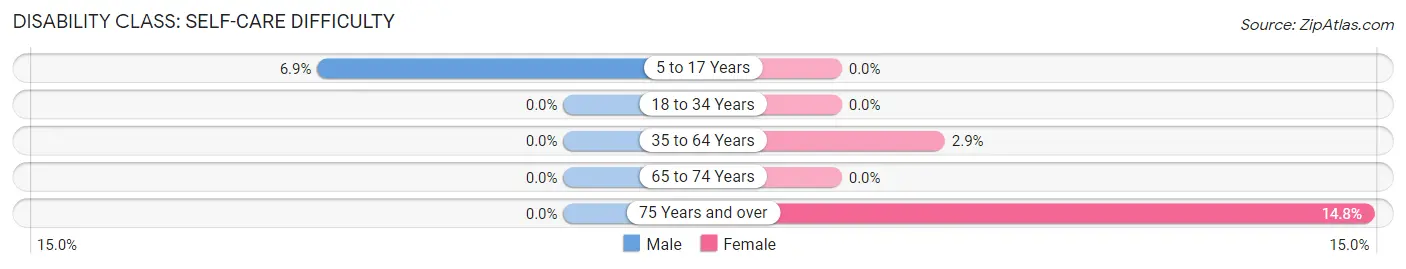
| Age Bracket | Male | Female |
| 5 to 17 Years | 5 (6.9%) | 0 (0.0%) |
| 18 to 34 Years | 0 (0.0%) | 0 (0.0%) |
| 35 to 64 Years | 0 (0.0%) | 5 (2.9%) |
| 65 to 74 Years | 0 (0.0%) | 0 (0.0%) |
| 75 Years and over | 0 (0.0%) | 4 (14.8%) |
Technology Access in Alanson
Computing Device Access in Alanson
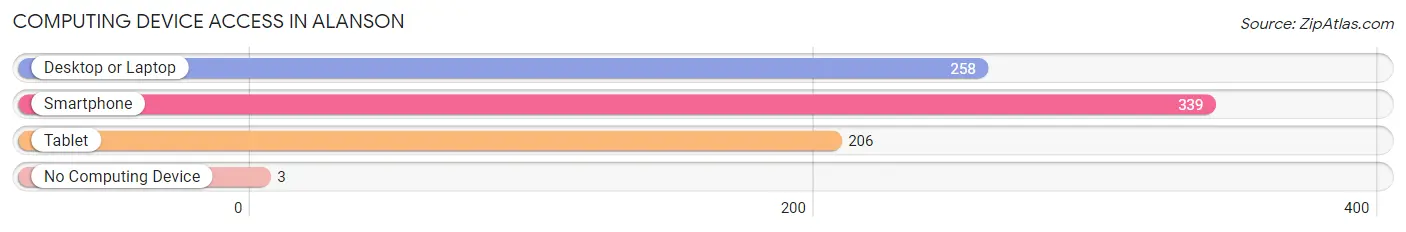
| Device Type | # Households | % Households |
| Desktop or Laptop | 258 | 70.5% |
| Smartphone | 339 | 92.6% |
| Tablet | 206 | 56.3% |
| No Computing Device | 3 | 0.8% |
| Total | 366 | 100.0% |
Internet Access in Alanson
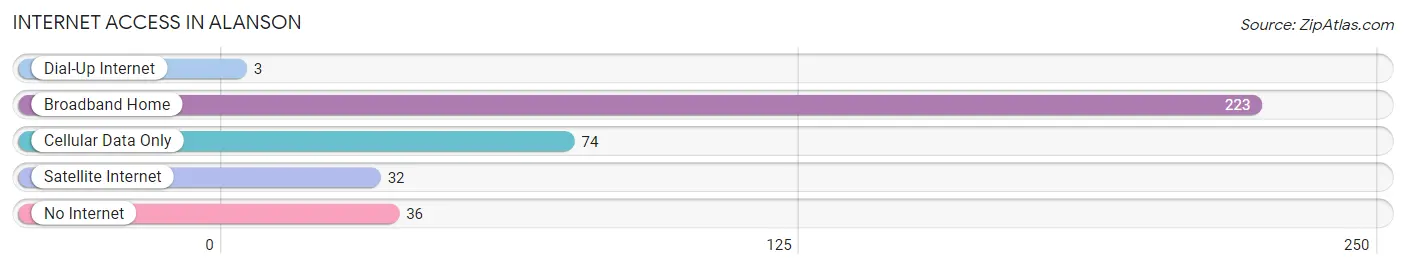
| Internet Type | # Households | % Households |
| Dial-Up Internet | 3 | 0.8% |
| Broadband Home | 223 | 60.9% |
| Cellular Data Only | 74 | 20.2% |
| Satellite Internet | 32 | 8.7% |
| No Internet | 36 | 9.8% |
| Total | 366 | 100.0% |
Alanson Summary
Alanson is a small village located in the northern part of Michigan’s Lower Peninsula. It is situated in Emmet County, along the banks of the Crooked River. The village is surrounded by the beautiful forests of the northern Michigan wilderness, and is home to a population of just over 500 people.
History
Alanson was first settled in 1875 by a group of lumberjacks from Wisconsin. The village was originally known as “Crooked River”, but was later renamed after the first postmaster, Alanson Smith. The village was incorporated in 1891, and the first mayor was elected in 1892.
In the early 1900s, Alanson was a thriving lumber town. The village was home to several sawmills, and the surrounding forests provided an abundance of timber for the lumber industry. The village also had a thriving agricultural industry, with many farmers growing potatoes, apples, and other crops.
In the 1950s, the lumber industry began to decline, and the village’s economy shifted to tourism. Alanson became a popular destination for outdoor recreation, and the village was home to several resorts and campgrounds.
Geography
Alanson is located in the northern part of Michigan’s Lower Peninsula, along the banks of the Crooked River. The village is surrounded by the beautiful forests of the northern Michigan wilderness, and is home to a population of just over 500 people.
The village is situated at the intersection of US-31 and M-68. The nearest major cities are Petoskey, about 20 miles to the north, and Traverse City, about 40 miles to the south.
Economy
Alanson’s economy is largely based on tourism. The village is home to several resorts and campgrounds, and is a popular destination for outdoor recreation. The village also has a thriving agricultural industry, with many farmers growing potatoes, apples, and other crops.
The village is also home to several small businesses, including restaurants, shops, and other services.
Demographics
As of the 2010 census, Alanson had a population of 517 people. The racial makeup of the village was 97.3% White, 0.6% Native American, 0.2% Asian, 0.2% from other races, and 1.7% from two or more races.
The median household income in Alanson was $37,500, and the median family income was $45,000. The per capita income was $20,000. About 10.3% of the population was below the poverty line.
Conclusion
Alanson is a small village located in the northern part of Michigan’s Lower Peninsula. It is situated in Emmet County, along the banks of the Crooked River. The village is surrounded by the beautiful forests of the northern Michigan wilderness, and is home to a population of just over 500 people. The village’s economy is largely based on tourism, and it is a popular destination for outdoor recreation. Alanson also has a thriving agricultural industry, with many farmers growing potatoes, apples, and other crops. The village is also home to several small businesses, including restaurants, shops, and other services.
Common Questions
What is the Total Population of Alanson?
Total Population of Alanson is 862.
What is the Total Male Population of Alanson?
Total Male Population of Alanson is 472.
What is the Total Female Population of Alanson?
Total Female Population of Alanson is 390.
What is the Ratio of Males per 100 Females in Alanson?
There are 121.03 Males per 100 Females in Alanson.
What is the Ratio of Females per 100 Males in Alanson?
There are 82.63 Females per 100 Males in Alanson.
What is the Median Population Age in Alanson?
Median Population Age in Alanson is 42.0 Years.
What is the Average Family Size in Alanson
Average Family Size in Alanson is 2.8 People.
What is the Average Household Size in Alanson
Average Household Size in Alanson is 2.4 People.
What is Per Capita Income in Alanson?
Per Capita income in Alanson is $24,739.
What is the Median Family Income in Alanson?
Median Family Income in Alanson is $52,125.
What is the Median Household income in Alanson?
Median Household Income in Alanson is $46,800.
What is Income or Wage Gap in Alanson?
Income or Wage Gap in Alanson is 30.3%.
Women in Alanson earn 69.7 cents for every dollar earned by a man.
What is Inequality or Gini Index in Alanson?
Inequality or Gini Index in Alanson is 0.38.
How Large is the Labor Force in Alanson?
There are 429 People in the Labor Forcein in Alanson.
What is the Percentage of People in the Labor Force in Alanson?
60.0% of People are in the Labor Force in Alanson.
What is the Unemployment Rate in Alanson?
Unemployment Rate in Alanson is 12.1%.