Zip Codes with the Highest Percentage of Population Employed in Administrative & Support Services in Detroit, MI
RELATED REPORTS & OPTIONS
Administrative & Support Services
Detroit
Compare Zip Codes
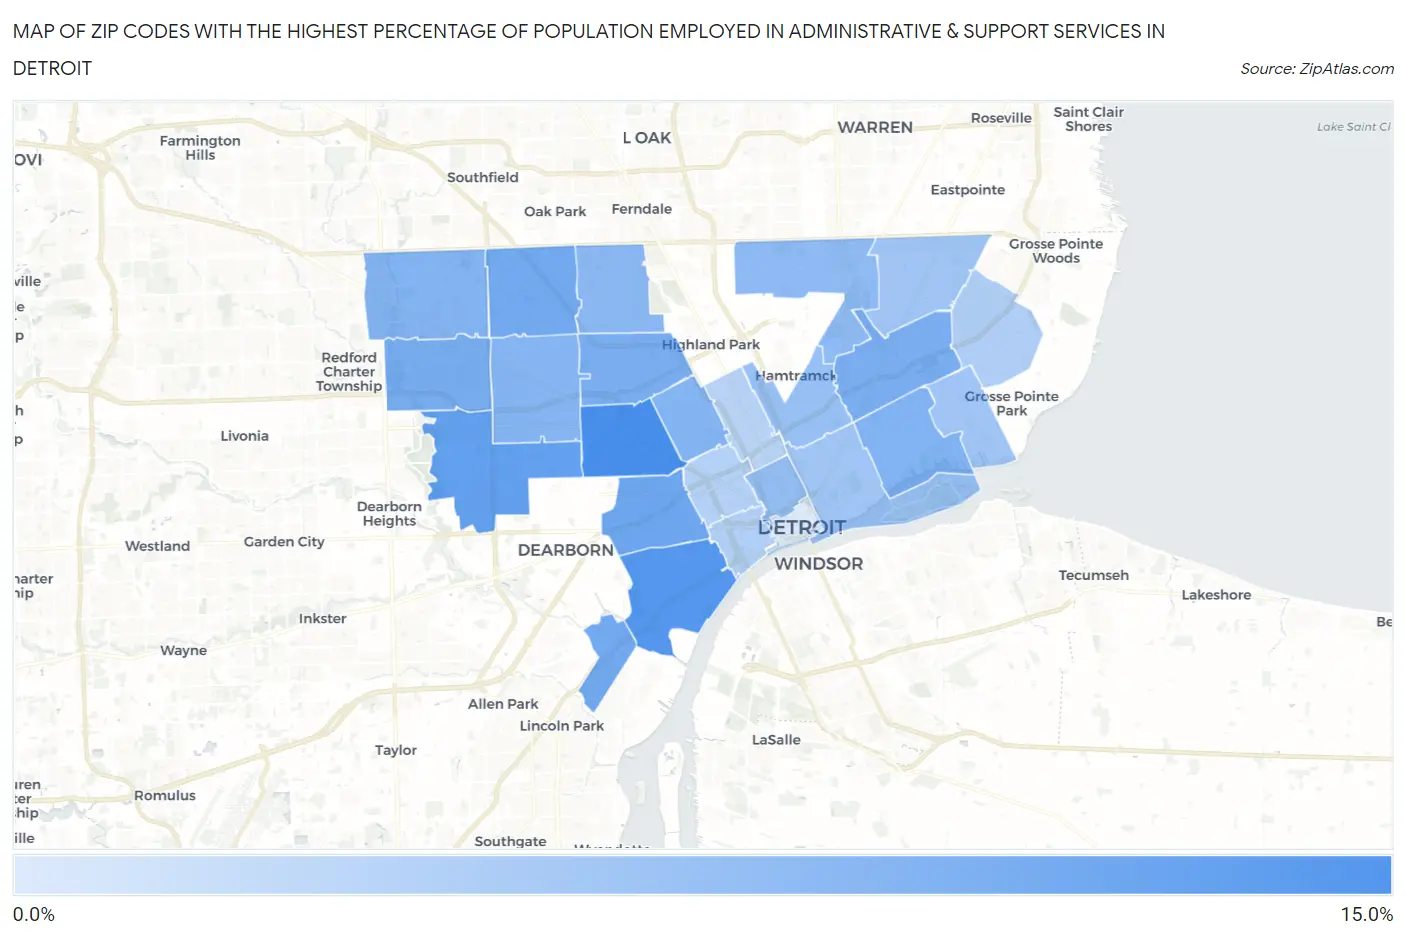
Map of Zip Codes with the Highest Percentage of Population Employed in Administrative & Support Services in Detroit
0.0%
15.0%
Zip Codes with the Highest Percentage of Population Employed in Administrative & Support Services in Detroit, MI
| Zip Code | % Employed | vs State | vs National | |
| 1. | 48204 | 11.7% | 3.7%(+7.98)#8 | 4.1%(+7.56)#889 |
| 2. | 48209 | 10.7% | 3.7%(+6.93)#11 | 4.1%(+6.51)#1,107 |
| 3. | 48228 | 9.8% | 3.7%(+6.08)#15 | 4.1%(+5.65)#1,361 |
| 4. | 48210 | 9.0% | 3.7%(+5.23)#23 | 4.1%(+4.80)#1,717 |
| 5. | 48217 | 8.6% | 3.7%(+4.87)#26 | 4.1%(+4.45)#1,915 |
| 6. | 48235 | 8.6% | 3.7%(+4.85)#27 | 4.1%(+4.43)#1,925 |
| 7. | 48223 | 8.2% | 3.7%(+4.51)#30 | 4.1%(+4.08)#2,121 |
| 8. | 48213 | 8.2% | 3.7%(+4.46)#31 | 4.1%(+4.03)#2,151 |
| 9. | 48238 | 8.1% | 3.7%(+4.36)#33 | 4.1%(+3.94)#2,210 |
| 10. | 48214 | 7.6% | 3.7%(+3.89)#42 | 4.1%(+3.47)#2,579 |
| 11. | 48206 | 7.5% | 3.7%(+3.80)#45 | 4.1%(+3.37)#2,665 |
| 12. | 48219 | 7.5% | 3.7%(+3.77)#47 | 4.1%(+3.35)#2,693 |
| 13. | 48227 | 7.4% | 3.7%(+3.65)#50 | 4.1%(+3.23)#2,810 |
| 14. | 48221 | 7.0% | 3.7%(+3.26)#71 | 4.1%(+2.84)#3,235 |
| 15. | 48234 | 6.7% | 3.7%(+2.98)#78 | 4.1%(+2.56)#3,610 |
| 16. | 48201 | 6.4% | 3.7%(+2.65)#95 | 4.1%(+2.23)#4,111 |
| 17. | 48211 | 6.1% | 3.7%(+2.33)#113 | 4.1%(+1.91)#4,671 |
| 18. | 48205 | 5.5% | 3.7%(+1.75)#150 | 4.1%(+1.32)#5,910 |
| 19. | 48215 | 5.4% | 3.7%(+1.66)#159 | 4.1%(+1.24)#6,107 |
| 20. | 48207 | 5.4% | 3.7%(+1.63)#161 | 4.1%(+1.21)#6,184 |
| 21. | 48224 | 4.5% | 3.7%(+0.749)#243 | 4.1%(+0.326)#8,804 |
| 22. | 48216 | 4.4% | 3.7%(+0.658)#257 | 4.1%(+0.236)#9,140 |
| 23. | 48208 | 4.1% | 3.7%(+0.395)#293 | 4.1%(-0.028)#10,153 |
| 24. | 48202 | 3.9% | 3.7%(+0.187)#328 | 4.1%(-0.236)#11,036 |
| 25. | 48226 | 1.4% | 3.7%(-2.31)#807 | 4.1%(-2.73)#23,054 |
1
Common Questions
What are the Top 10 Zip Codes with the Highest Percentage of Population Employed in Administrative & Support Services in Detroit, MI?
Top 10 Zip Codes with the Highest Percentage of Population Employed in Administrative & Support Services in Detroit, MI are:
What zip code has the Highest Percentage of Population Employed in Administrative & Support Services in Detroit, MI?
48204 has the Highest Percentage of Population Employed in Administrative & Support Services in Detroit, MI with 11.7%.
What is the Percentage of Population Employed in Administrative & Support Services in Detroit, MI?
Percentage of Population Employed in Administrative & Support Services in Detroit is 7.2%.
What is the Percentage of Population Employed in Administrative & Support Services in Michigan?
Percentage of Population Employed in Administrative & Support Services in Michigan is 3.7%.
What is the Percentage of Population Employed in Administrative & Support Services in the United States?
Percentage of Population Employed in Administrative & Support Services in the United States is 4.1%.