Cities with the Most Immigrants from South Africa in Georgia
RELATED REPORTS & OPTIONS
South Africa
Georgia
Compare Cities
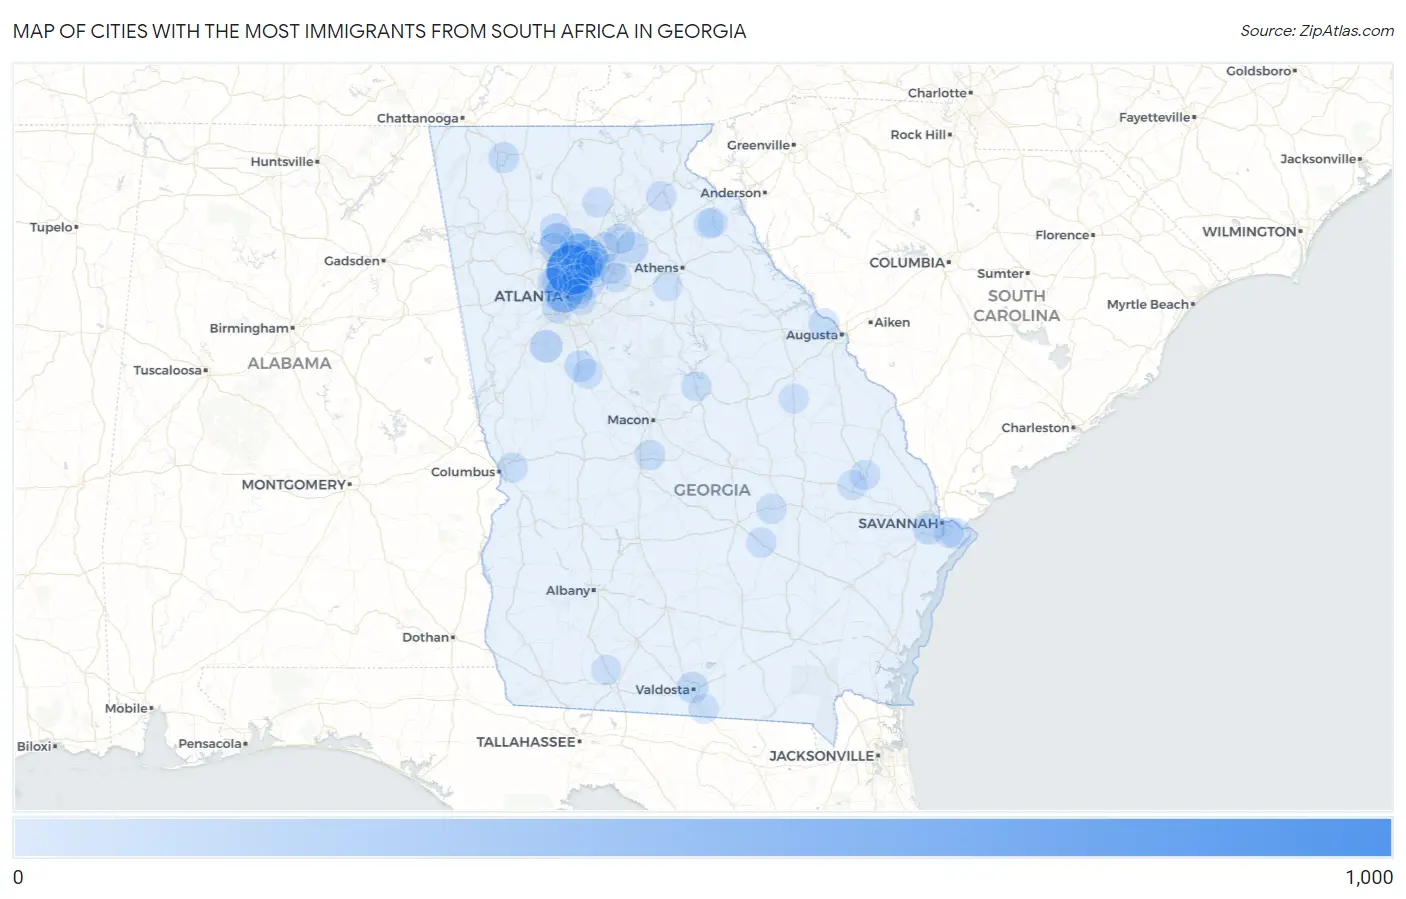
Map of Cities with the Most Immigrants from South Africa in Georgia
0
1,000
Cities with the Most Immigrants from South Africa in Georgia
| City | South Africa | vs State | vs National | |
| 1. | Sandy Springs | 956 | 6,116(15.63%)#1 | 117,055(0.82%)#5 |
| 2. | Atlanta | 361 | 6,116(5.90%)#2 | 117,055(0.31%)#21 |
| 3. | Alpharetta | 355 | 6,116(5.80%)#3 | 117,055(0.30%)#24 |
| 4. | Johns Creek | 266 | 6,116(4.35%)#4 | 117,055(0.23%)#44 |
| 5. | Holly Springs | 160 | 6,116(2.62%)#5 | 117,055(0.14%)#88 |
| 6. | Peachtree City | 123 | 6,116(2.01%)#6 | 117,055(0.11%)#125 |
| 7. | Dunwoody | 94 | 6,116(1.54%)#7 | 117,055(0.08%)#200 |
| 8. | Peachtree Corners | 91 | 6,116(1.49%)#8 | 117,055(0.08%)#210 |
| 9. | Savannah | 84 | 6,116(1.37%)#9 | 117,055(0.07%)#232 |
| 10. | Tucker | 75 | 6,116(1.23%)#10 | 117,055(0.06%)#279 |
| 11. | Braselton | 74 | 6,116(1.21%)#11 | 117,055(0.06%)#283 |
| 12. | Griffin | 67 | 6,116(1.10%)#12 | 117,055(0.06%)#318 |
| 13. | Valdosta | 66 | 6,116(1.08%)#13 | 117,055(0.06%)#321 |
| 14. | Athens-Clarke County Unified Government (Balance) | 62 | 6,116(1.01%)#14 | 117,055(0.05%)#350 |
| 15. | Milton | 61 | 6,116(1.00%)#15 | 117,055(0.05%)#362 |
| 16. | Roswell | 56 | 6,116(0.92%)#16 | 117,055(0.05%)#395 |
| 17. | Augusta-Richmond County Consolidated Government (Balance) | 53 | 6,116(0.87%)#17 | 117,055(0.05%)#413 |
| 18. | Vinings | 51 | 6,116(0.83%)#18 | 117,055(0.04%)#441 |
| 19. | Flowery Branch | 41 | 6,116(0.67%)#19 | 117,055(0.04%)#548 |
| 20. | Dalton | 40 | 6,116(0.65%)#20 | 117,055(0.03%)#559 |
| 21. | East Point | 39 | 6,116(0.64%)#21 | 117,055(0.03%)#576 |
| 22. | North Druid Hills | 36 | 6,116(0.59%)#22 | 117,055(0.03%)#622 |
| 23. | Evans | 35 | 6,116(0.57%)#23 | 117,055(0.03%)#635 |
| 24. | Warner Robins | 28 | 6,116(0.46%)#24 | 117,055(0.02%)#771 |
| 25. | North Decatur | 28 | 6,116(0.46%)#25 | 117,055(0.02%)#777 |
| 26. | Norcross | 24 | 6,116(0.39%)#26 | 117,055(0.02%)#872 |
| 27. | Brookhaven | 21 | 6,116(0.34%)#27 | 117,055(0.02%)#938 |
| 28. | Canton | 21 | 6,116(0.34%)#28 | 117,055(0.02%)#942 |
| 29. | Wilmington Island | 21 | 6,116(0.34%)#29 | 117,055(0.02%)#948 |
| 30. | Chamblee | 18 | 6,116(0.29%)#30 | 117,055(0.02%)#1,039 |
| 31. | Statesboro | 17 | 6,116(0.28%)#31 | 117,055(0.01%)#1,086 |
| 32. | Columbus | 16 | 6,116(0.26%)#32 | 117,055(0.01%)#1,111 |
| 33. | Sugar Hill | 15 | 6,116(0.25%)#33 | 117,055(0.01%)#1,179 |
| 34. | Baldwin | 14 | 6,116(0.23%)#34 | 117,055(0.01%)#1,254 |
| 35. | Lumber City | 12 | 6,116(0.20%)#35 | 117,055(0.01%)#1,380 |
| 36. | Decatur | 11 | 6,116(0.18%)#36 | 117,055(0.01%)#1,404 |
| 37. | Candler Mcafee | 11 | 6,116(0.18%)#37 | 117,055(0.01%)#1,405 |
| 38. | Milledgeville | 11 | 6,116(0.18%)#38 | 117,055(0.01%)#1,414 |
| 39. | Duluth | 10 | 6,116(0.16%)#39 | 117,055(0.01%)#1,454 |
| 40. | Mount Vernon | 10 | 6,116(0.16%)#40 | 117,055(0.01%)#1,481 |
| 41. | Dutch Island | 9 | 6,116(0.15%)#41 | 117,055(0.01%)#1,555 |
| 42. | Smyrna | 8 | 6,116(0.13%)#42 | 117,055(0.01%)#1,567 |
| 43. | Lawrenceville | 8 | 6,116(0.13%)#43 | 117,055(0.01%)#1,578 |
| 44. | Woodstock | 7 | 6,116(0.11%)#44 | 117,055(0.01%)#1,638 |
| 45. | Dawsonville | 6 | 6,116(0.10%)#45 | 117,055(0.01%)#1,727 |
| 46. | Louisville | 6 | 6,116(0.10%)#46 | 117,055(0.01%)#1,731 |
| 47. | Franklin Springs | 6 | 6,116(0.10%)#47 | 117,055(0.01%)#1,743 |
| 48. | Register | 6 | 6,116(0.10%)#48 | 117,055(0.01%)#1,754 |
| 49. | Lake Park | 5 | 6,116(0.08%)#49 | 117,055(0.00%)#1,812 |
| 50. | Orchard Hill | 5 | 6,116(0.08%)#50 | 117,055(0.00%)#1,822 |
| 51. | Berkeley Lake | 4 | 6,116(0.07%)#51 | 117,055(0.00%)#1,862 |
| 52. | Royston | 4 | 6,116(0.07%)#52 | 117,055(0.00%)#1,863 |
| 53. | Grayson | 2 | 6,116(0.03%)#53 | 117,055(0.00%)#1,960 |
| 54. | North High Shoals | 2 | 6,116(0.03%)#54 | 117,055(0.00%)#1,986 |
| 55. | Ochlocknee | 2 | 6,116(0.03%)#55 | 117,055(0.00%)#1,988 |
Common Questions
What are the Top 10 Cities with the Most Immigrants from South Africa in Georgia?
Top 10 Cities with the Most Immigrants from South Africa in Georgia are:
#1
956
#2
361
#3
355
#4
266
#5
160
#6
123
#7
94
#8
91
#9
84
#10
75
What city has the Most Immigrants from South Africa in Georgia?
Sandy Springs has the Most Immigrants from South Africa in Georgia with 956.
What is the Total Immigrants from South Africa in the State of Georgia?
Total Immigrants from South Africa in Georgia is 6,116.
What is the Total Immigrants from South Africa in the United States?
Total Immigrants from South Africa in the United States is 117,055.