Cities with the Most Immigrants from South Africa in Missouri
RELATED REPORTS & OPTIONS
South Africa
Missouri
Compare Cities
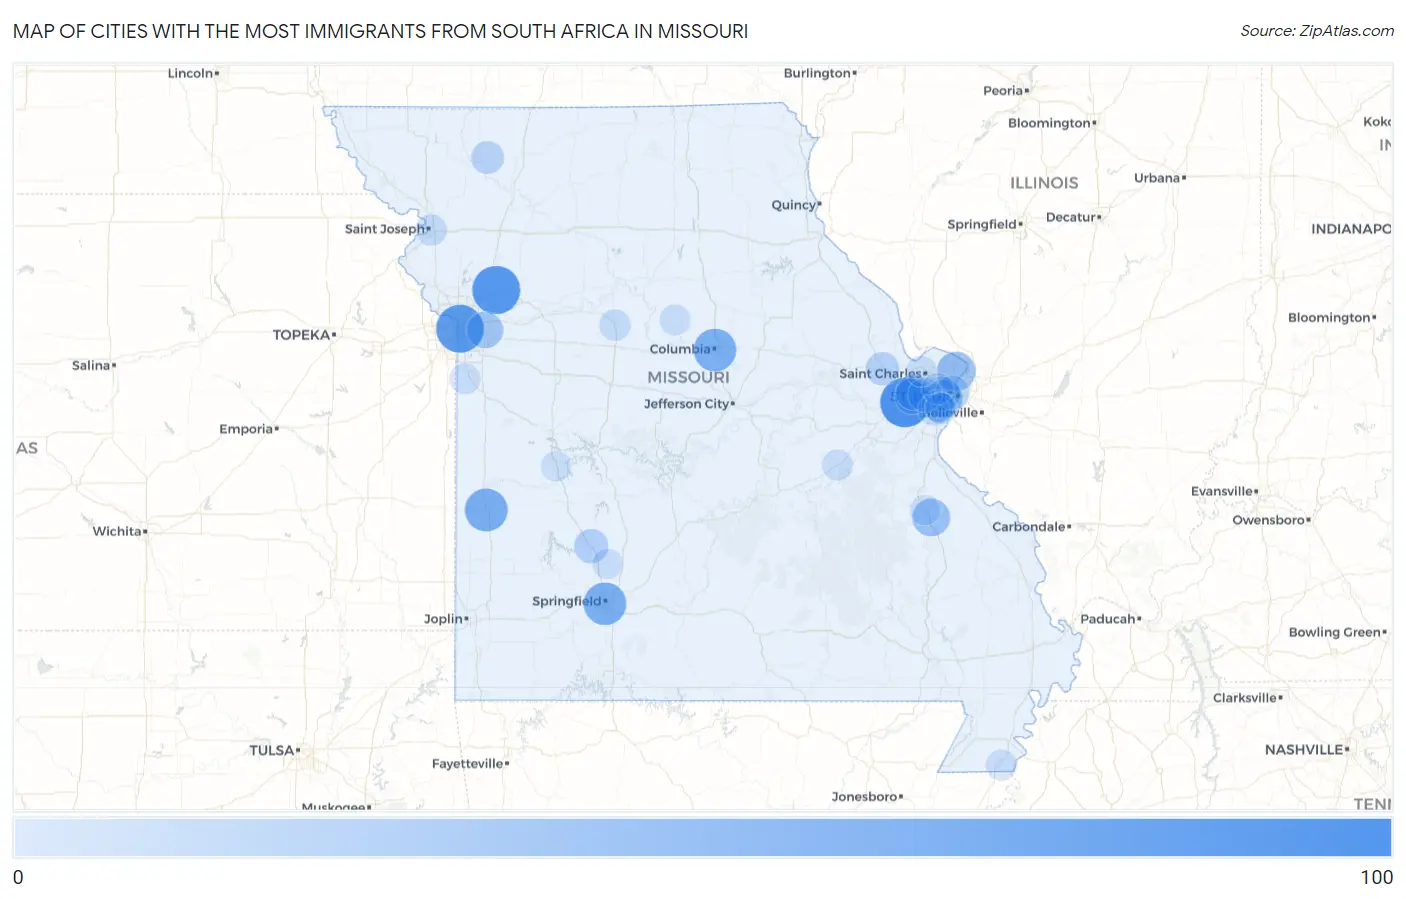
Map of Cities with the Most Immigrants from South Africa in Missouri
0
100
Cities with the Most Immigrants from South Africa in Missouri
| City | South Africa | vs State | vs National | |
| 1. | Wildwood | 98 | 1,043(9.40%)#1 | 117,055(0.08%)#183 |
| 2. | Excelsior Springs | 90 | 1,043(8.63%)#2 | 117,055(0.08%)#216 |
| 3. | Kansas City | 89 | 1,043(8.53%)#3 | 117,055(0.08%)#218 |
| 4. | Nevada | 63 | 1,043(6.04%)#4 | 117,055(0.05%)#344 |
| 5. | Springfield | 62 | 1,043(5.94%)#5 | 117,055(0.05%)#348 |
| 6. | Columbia | 62 | 1,043(5.94%)#6 | 117,055(0.05%)#351 |
| 7. | Spanish Lake | 42 | 1,043(4.03%)#7 | 117,055(0.04%)#530 |
| 8. | Farmington | 38 | 1,043(3.64%)#8 | 117,055(0.03%)#589 |
| 9. | Maplewood | 37 | 1,043(3.55%)#9 | 117,055(0.03%)#605 |
| 10. | Independence | 31 | 1,043(2.97%)#10 | 117,055(0.03%)#711 |
| 11. | Clarkson Valley | 28 | 1,043(2.68%)#11 | 117,055(0.02%)#788 |
| 12. | Chesterfield | 26 | 1,043(2.49%)#12 | 117,055(0.02%)#815 |
| 13. | Clayton | 22 | 1,043(2.11%)#13 | 117,055(0.02%)#915 |
| 14. | Bolivar | 20 | 1,043(1.92%)#14 | 117,055(0.02%)#979 |
| 15. | St Louis | 18 | 1,043(1.73%)#15 | 117,055(0.02%)#1,023 |
| 16. | Town And Country | 18 | 1,043(1.73%)#16 | 117,055(0.02%)#1,051 |
| 17. | Wentzville | 16 | 1,043(1.53%)#17 | 117,055(0.01%)#1,124 |
| 18. | Albany | 14 | 1,043(1.34%)#18 | 117,055(0.01%)#1,261 |
| 19. | Crestwood | 8 | 1,043(0.77%)#19 | 117,055(0.01%)#1,597 |
| 20. | St Joseph | 6 | 1,043(0.58%)#20 | 117,055(0.01%)#1,690 |
| 21. | Marshall | 6 | 1,043(0.58%)#21 | 117,055(0.01%)#1,706 |
| 22. | Sunset Hills | 6 | 1,043(0.58%)#22 | 117,055(0.01%)#1,712 |
| 23. | Olivette | 6 | 1,043(0.58%)#23 | 117,055(0.01%)#1,714 |
| 24. | Lakeshire | 5 | 1,043(0.48%)#24 | 117,055(0.00%)#1,808 |
| 25. | St Charles | 4 | 1,043(0.38%)#25 | 117,055(0.00%)#1,825 |
| 26. | Fayette | 4 | 1,043(0.38%)#26 | 117,055(0.00%)#1,860 |
| 27. | Bourbon | 4 | 1,043(0.38%)#27 | 117,055(0.00%)#1,871 |
| 28. | Cooter | 3 | 1,043(0.29%)#28 | 117,055(0.00%)#1,940 |
| 29. | Riverview Estates | 3 | 1,043(0.29%)#29 | 117,055(0.00%)#1,948 |
| 30. | Grantwood Village | 2 | 1,043(0.19%)#30 | 117,055(0.00%)#1,979 |
| 31. | Pleasant Hope | 2 | 1,043(0.19%)#31 | 117,055(0.00%)#1,985 |
| 32. | Deering | 2 | 1,043(0.19%)#32 | 117,055(0.00%)#2,006 |
| 33. | Leadington | 1 | 1,043(0.10%)#33 | 117,055(0.00%)#2,028 |
| 34. | Lowry City | 1 | 1,043(0.10%)#34 | 117,055(0.00%)#2,032 |
Common Questions
What are the Top 10 Cities with the Most Immigrants from South Africa in Missouri?
Top 10 Cities with the Most Immigrants from South Africa in Missouri are:
#1
98
#2
90
#3
89
#4
63
#5
62
#6
62
#7
42
#8
38
#9
37
#10
31
What city has the Most Immigrants from South Africa in Missouri?
Wildwood has the Most Immigrants from South Africa in Missouri with 98.
What is the Total Immigrants from South Africa in the State of Missouri?
Total Immigrants from South Africa in Missouri is 1,043.
What is the Total Immigrants from South Africa in the United States?
Total Immigrants from South Africa in the United States is 117,055.