Cities with the Highest Percentage of Immigrants from Japan in Oklahoma
RELATED REPORTS & OPTIONS
Japan
Oklahoma
Compare Cities
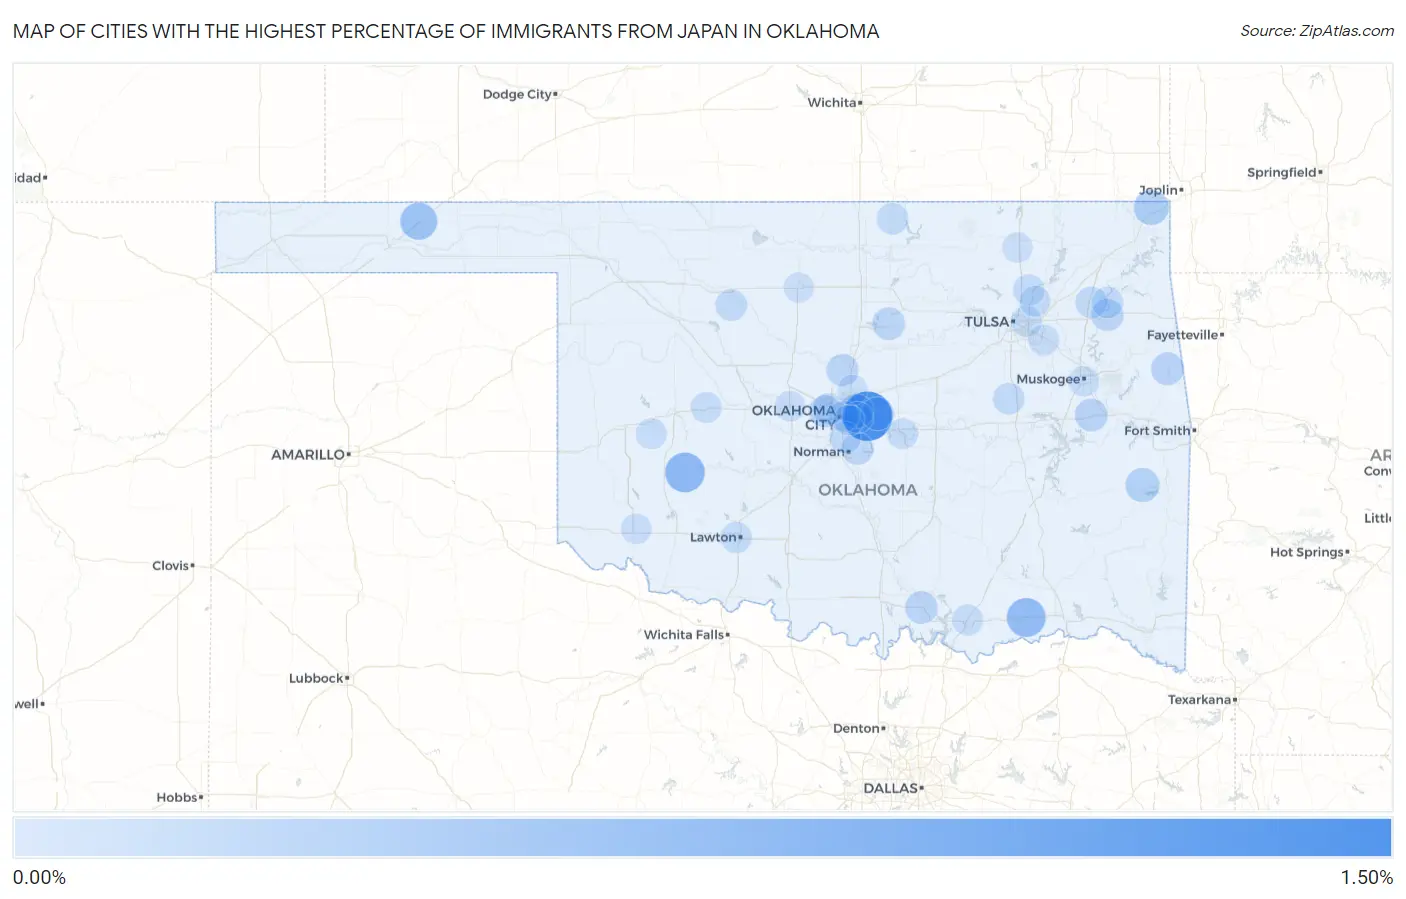
Map of Cities with the Highest Percentage of Immigrants from Japan in Oklahoma
0.00%
1.50%
Cities with the Highest Percentage of Immigrants from Japan in Oklahoma
| City | Japan | vs State | vs National | |
| 1. | Choctaw | 1.50% | 0.040%(+1.46)#1 | 0.10%(+1.39)#152 |
| 2. | Keefton | 1.30% | 0.040%(+1.26)#2 | 0.10%(+1.20)#198 |
| 3. | Cedar Lake | 0.83% | 0.040%(+0.794)#3 | 0.10%(+0.730)#357 |
| 4. | Gotebo | 0.72% | 0.040%(+0.680)#4 | 0.10%(+0.616)#435 |
| 5. | Boswell | 0.65% | 0.040%(+0.612)#5 | 0.10%(+0.548)#474 |
| 6. | Hooker | 0.51% | 0.040%(+0.473)#6 | 0.10%(+0.409)#639 |
| 7. | Quapaw | 0.35% | 0.040%(+0.313)#7 | 0.10%(+0.249)#930 |
| 8. | Spencer | 0.30% | 0.040%(+0.263)#8 | 0.10%(+0.199)#1,060 |
| 9. | Fanshawe | 0.28% | 0.040%(+0.241)#9 | 0.10%(+0.177)#1,133 |
| 10. | Harrah | 0.19% | 0.040%(+0.152)#10 | 0.10%(+0.088)#1,540 |
| 11. | Warner | 0.19% | 0.040%(+0.151)#11 | 0.10%(+0.087)#1,550 |
| 12. | Stilwell | 0.19% | 0.040%(+0.148)#12 | 0.10%(+0.084)#1,572 |
| 13. | Stillwater | 0.18% | 0.040%(+0.139)#13 | 0.10%(+0.075)#1,616 |
| 14. | Oakland | 0.17% | 0.040%(+0.132)#14 | 0.10%(+0.069)#1,656 |
| 15. | Bethany | 0.15% | 0.040%(+0.111)#15 | 0.10%(+0.047)#1,802 |
| 16. | Locust Grove | 0.14% | 0.040%(+0.101)#16 | 0.10%(+0.037)#1,894 |
| 17. | Guthrie | 0.14% | 0.040%(+0.098)#17 | 0.10%(+0.035)#1,911 |
| 18. | Norman | 0.13% | 0.040%(+0.093)#18 | 0.10%(+0.030)#1,946 |
| 19. | Fairview | 0.11% | 0.040%(+0.071)#19 | 0.10%(+0.008)#2,150 |
| 20. | Newkirk | 0.11% | 0.040%(+0.066)#20 | 0.10%(+0.002)#2,197 |
| 21. | Okmulgee | 0.11% | 0.040%(+0.066)#21 | 0.10%(+0.002)#2,201 |
| 22. | Pryor Creek | 0.11% | 0.040%(+0.066)#22 | 0.10%(+0.002)#2,205 |
| 23. | Moore | 0.093% | 0.040%(+0.053)#23 | 0.10%(-0.011)#2,341 |
| 24. | Collinsville | 0.087% | 0.040%(+0.047)#24 | 0.10%(-0.017)#2,399 |
| 25. | Warr Acres | 0.086% | 0.040%(+0.047)#25 | 0.10%(-0.017)#2,404 |
| 26. | Salina | 0.079% | 0.040%(+0.039)#26 | 0.10%(-0.024)#2,496 |
| 27. | Midwest City | 0.077% | 0.040%(+0.038)#27 | 0.10%(-0.026)#2,517 |
| 28. | Lawton | 0.075% | 0.040%(+0.035)#28 | 0.10%(-0.029)#2,555 |
| 29. | Tulsa | 0.063% | 0.040%(+0.023)#29 | 0.10%(-0.040)#2,692 |
| 30. | Durant | 0.059% | 0.040%(+0.019)#30 | 0.10%(-0.045)#2,765 |
| 31. | Shawnee | 0.054% | 0.040%(+0.014)#31 | 0.10%(-0.049)#2,838 |
| 32. | Weatherford | 0.050% | 0.040%(+0.010)#32 | 0.10%(-0.053)#2,899 |
| 33. | Burns Flat | 0.049% | 0.040%(+0.009)#33 | 0.10%(-0.054)#2,915 |
| 34. | Owasso | 0.047% | 0.040%(+0.007)#34 | 0.10%(-0.056)#2,938 |
| 35. | Oklahoma City | 0.045% | 0.040%(+0.006)#35 | 0.10%(-0.058)#2,960 |
| 36. | Broken Arrow | 0.042% | 0.040%(+0.002)#36 | 0.10%(-0.061)#3,021 |
| 37. | Del City | 0.037% | 0.040%(-0.003)#37 | 0.10%(-0.067)#3,085 |
| 38. | El Reno | 0.023% | 0.040%(-0.017)#38 | 0.10%(-0.081)#3,291 |
| 39. | Altus | 0.021% | 0.040%(-0.018)#39 | 0.10%(-0.082)#3,314 |
| 40. | Muskogee | 0.019% | 0.040%(-0.021)#40 | 0.10%(-0.084)#3,357 |
| 41. | Edmond | 0.013% | 0.040%(-0.027)#41 | 0.10%(-0.091)#3,450 |
| 42. | Bartlesville | 0.011% | 0.040%(-0.029)#42 | 0.10%(-0.093)#3,468 |
| 43. | Enid | 0.0078% | 0.040%(-0.032)#43 | 0.10%(-0.096)#3,504 |
Common Questions
What are the Top 10 Cities with the Highest Percentage of Immigrants from Japan in Oklahoma?
Top 10 Cities with the Highest Percentage of Immigrants from Japan in Oklahoma are:
What city has the Highest Percentage of Immigrants from Japan in Oklahoma?
Choctaw has the Highest Percentage of Immigrants from Japan in Oklahoma with 1.50%.
What is the Percentage of Immigrants from Japan in the State of Oklahoma?
Percentage of Immigrants from Japan in Oklahoma is 0.040%.
What is the Percentage of Immigrants from Japan in the United States?
Percentage of Immigrants from Japan in the United States is 0.10%.