Cities with the Highest Percentage of Immigrants from Japan in Virginia
RELATED REPORTS & OPTIONS
Japan
Virginia
Compare Cities
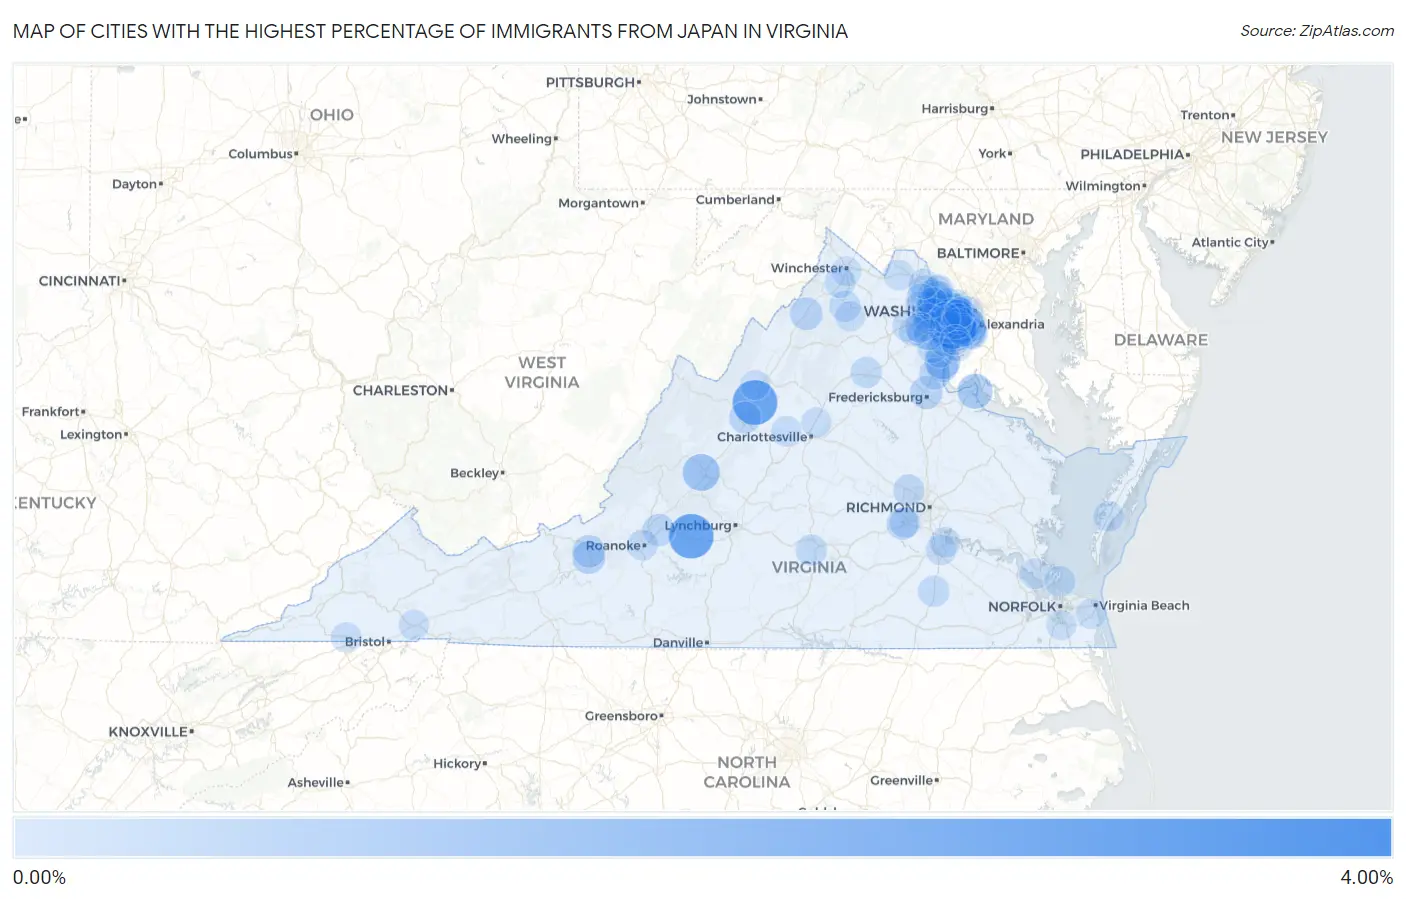
Map of Cities with the Highest Percentage of Immigrants from Japan in Virginia
0.00%
4.00%
Cities with the Highest Percentage of Immigrants from Japan in Virginia
| City | Japan | vs State | vs National | |
| 1. | Kings Park | 3.87% | 0.10%(+3.77)#1 | 0.10%(+3.77)#25 |
| 2. | Mount Sidney | 2.91% | 0.10%(+2.81)#2 | 0.10%(+2.80)#54 |
| 3. | Bedford | 2.88% | 0.10%(+2.77)#3 | 0.10%(+2.77)#55 |
| 4. | Lexington | 1.35% | 0.10%(+1.25)#4 | 0.10%(+1.24)#181 |
| 5. | Triangle | 1.07% | 0.10%(+0.963)#5 | 0.10%(+0.962)#257 |
| 6. | Dunn Loring | 0.99% | 0.10%(+0.886)#6 | 0.10%(+0.884)#286 |
| 7. | Dahlgren Center | 0.97% | 0.10%(+0.866)#7 | 0.10%(+0.865)#295 |
| 8. | Lake Barcroft | 0.81% | 0.10%(+0.710)#8 | 0.10%(+0.709)#378 |
| 9. | Groveton | 0.61% | 0.10%(+0.507)#9 | 0.10%(+0.505)#525 |
| 10. | Merrimac | 0.59% | 0.10%(+0.486)#10 | 0.10%(+0.485)#548 |
| 11. | Woodstock | 0.53% | 0.10%(+0.433)#11 | 0.10%(+0.431)#616 |
| 12. | Falmouth | 0.53% | 0.10%(+0.431)#12 | 0.10%(+0.430)#618 |
| 13. | Blacksburg | 0.51% | 0.10%(+0.407)#13 | 0.10%(+0.406)#643 |
| 14. | George Mason | 0.51% | 0.10%(+0.407)#14 | 0.10%(+0.406)#644 |
| 15. | Braddock | 0.50% | 0.10%(+0.401)#15 | 0.10%(+0.400)#661 |
| 16. | Floris | 0.50% | 0.10%(+0.397)#16 | 0.10%(+0.395)#666 |
| 17. | Hybla Valley | 0.50% | 0.10%(+0.395)#17 | 0.10%(+0.394)#670 |
| 18. | Manassas | 0.49% | 0.10%(+0.386)#18 | 0.10%(+0.385)#688 |
| 19. | Kingstowne | 0.47% | 0.10%(+0.370)#19 | 0.10%(+0.368)#711 |
| 20. | Vienna | 0.47% | 0.10%(+0.367)#20 | 0.10%(+0.366)#715 |
| 21. | Blue Ridge | 0.47% | 0.10%(+0.366)#21 | 0.10%(+0.364)#717 |
| 22. | Fair Lakes | 0.43% | 0.10%(+0.324)#22 | 0.10%(+0.323)#794 |
| 23. | Long Branch | 0.42% | 0.10%(+0.317)#23 | 0.10%(+0.316)#806 |
| 24. | Staunton | 0.41% | 0.10%(+0.304)#24 | 0.10%(+0.303)#831 |
| 25. | Woodlake | 0.40% | 0.10%(+0.294)#25 | 0.10%(+0.293)#847 |
| 26. | South Riding | 0.38% | 0.10%(+0.276)#26 | 0.10%(+0.274)#883 |
| 27. | Fair Oaks | 0.37% | 0.10%(+0.265)#27 | 0.10%(+0.264)#897 |
| 28. | Quantico Base | 0.35% | 0.10%(+0.252)#28 | 0.10%(+0.250)#928 |
| 29. | Arlington | 0.35% | 0.10%(+0.246)#29 | 0.10%(+0.245)#938 |
| 30. | Aquia Harbour | 0.35% | 0.10%(+0.243)#30 | 0.10%(+0.242)#947 |
| 31. | Crosspointe | 0.34% | 0.10%(+0.237)#31 | 0.10%(+0.236)#961 |
| 32. | Franklin Farm | 0.34% | 0.10%(+0.236)#32 | 0.10%(+0.235)#963 |
| 33. | Ashburn | 0.34% | 0.10%(+0.234)#33 | 0.10%(+0.233)#971 |
| 34. | Short Pump | 0.30% | 0.10%(+0.194)#34 | 0.10%(+0.192)#1,077 |
| 35. | Huntington | 0.29% | 0.10%(+0.193)#35 | 0.10%(+0.191)#1,081 |
| 36. | Leesylvania | 0.29% | 0.10%(+0.192)#36 | 0.10%(+0.191)#1,084 |
| 37. | Oakton | 0.29% | 0.10%(+0.191)#37 | 0.10%(+0.190)#1,088 |
| 38. | Idylwood | 0.29% | 0.10%(+0.190)#38 | 0.10%(+0.189)#1,089 |
| 39. | Mclean | 0.29% | 0.10%(+0.186)#39 | 0.10%(+0.185)#1,106 |
| 40. | Stony Creek | 0.29% | 0.10%(+0.184)#40 | 0.10%(+0.182)#1,114 |
| 41. | Culpeper | 0.27% | 0.10%(+0.166)#41 | 0.10%(+0.165)#1,171 |
| 42. | Sterling | 0.27% | 0.10%(+0.165)#42 | 0.10%(+0.164)#1,178 |
| 43. | Front Royal | 0.27% | 0.10%(+0.163)#43 | 0.10%(+0.162)#1,185 |
| 44. | Pimmit Hills | 0.26% | 0.10%(+0.159)#44 | 0.10%(+0.158)#1,209 |
| 45. | Hampden Sydney | 0.26% | 0.10%(+0.156)#45 | 0.10%(+0.155)#1,228 |
| 46. | West Springfield | 0.24% | 0.10%(+0.138)#46 | 0.10%(+0.136)#1,307 |
| 47. | Yorkshire | 0.23% | 0.10%(+0.125)#47 | 0.10%(+0.124)#1,364 |
| 48. | Reston | 0.21% | 0.10%(+0.113)#48 | 0.10%(+0.112)#1,426 |
| 49. | Sugarland Run | 0.21% | 0.10%(+0.109)#49 | 0.10%(+0.107)#1,443 |
| 50. | Wolf Trap | 0.21% | 0.10%(+0.108)#50 | 0.10%(+0.107)#1,445 |
| 51. | Brandermill | 0.20% | 0.10%(+0.101)#51 | 0.10%(+0.100)#1,480 |
| 52. | Chantilly | 0.20% | 0.10%(+0.097)#52 | 0.10%(+0.096)#1,503 |
| 53. | Hampton | 0.19% | 0.10%(+0.089)#53 | 0.10%(+0.088)#1,548 |
| 54. | Alexandria | 0.19% | 0.10%(+0.088)#54 | 0.10%(+0.087)#1,553 |
| 55. | Stephens City | 0.19% | 0.10%(+0.088)#55 | 0.10%(+0.086)#1,556 |
| 56. | Roanoke | 0.18% | 0.10%(+0.080)#56 | 0.10%(+0.079)#1,594 |
| 57. | Newington Forest | 0.18% | 0.10%(+0.080)#57 | 0.10%(+0.078)#1,598 |
| 58. | Dranesville | 0.18% | 0.10%(+0.079)#58 | 0.10%(+0.078)#1,604 |
| 59. | Greenbriar | 0.18% | 0.10%(+0.074)#59 | 0.10%(+0.073)#1,632 |
| 60. | Independent Hill | 0.16% | 0.10%(+0.060)#60 | 0.10%(+0.059)#1,712 |
| 61. | Lincolnia | 0.16% | 0.10%(+0.054)#61 | 0.10%(+0.053)#1,751 |
| 62. | Burke | 0.15% | 0.10%(+0.049)#62 | 0.10%(+0.048)#1,789 |
| 63. | Fort Hunt | 0.15% | 0.10%(+0.048)#63 | 0.10%(+0.047)#1,807 |
| 64. | Gainesville | 0.15% | 0.10%(+0.045)#64 | 0.10%(+0.044)#1,830 |
| 65. | Newport News | 0.15% | 0.10%(+0.044)#65 | 0.10%(+0.043)#1,834 |
| 66. | Centreville | 0.15% | 0.10%(+0.044)#66 | 0.10%(+0.042)#1,839 |
| 67. | Merrifield | 0.15% | 0.10%(+0.043)#67 | 0.10%(+0.042)#1,841 |
| 68. | Fort Lee | 0.15% | 0.10%(+0.043)#68 | 0.10%(+0.042)#1,846 |
| 69. | Lowes Island | 0.14% | 0.10%(+0.040)#69 | 0.10%(+0.039)#1,878 |
| 70. | Franconia | 0.14% | 0.10%(+0.038)#70 | 0.10%(+0.036)#1,899 |
| 71. | Hayfield | 0.14% | 0.10%(+0.035)#71 | 0.10%(+0.033)#1,920 |
| 72. | Kings Park West | 0.14% | 0.10%(+0.034)#72 | 0.10%(+0.032)#1,930 |
| 73. | Crozet | 0.13% | 0.10%(+0.033)#73 | 0.10%(+0.032)#1,938 |
| 74. | Nassawadox | 0.13% | 0.10%(+0.033)#74 | 0.10%(+0.031)#1,939 |
| 75. | West Falls Church | 0.13% | 0.10%(+0.026)#75 | 0.10%(+0.025)#1,980 |
| 76. | Weber City | 0.13% | 0.10%(+0.024)#76 | 0.10%(+0.022)#2,004 |
| 77. | Purcellville | 0.12% | 0.10%(+0.021)#77 | 0.10%(+0.020)#2,027 |
| 78. | Mcnair | 0.12% | 0.10%(+0.015)#78 | 0.10%(+0.014)#2,086 |
| 79. | Difficult Run | 0.12% | 0.10%(+0.013)#79 | 0.10%(+0.012)#2,106 |
| 80. | Lake Ridge | 0.11% | 0.10%(+0.007)#80 | 0.10%(+0.006)#2,163 |
| 81. | Montclair | 0.11% | 0.10%(+0.007)#81 | 0.10%(+0.005)#2,169 |
| 82. | Hopewell | 0.11% | 0.10%(+0.006)#82 | 0.10%(+0.005)#2,172 |
| 83. | Abingdon | 0.11% | 0.10%(+0.006)#83 | 0.10%(+0.004)#2,179 |
| 84. | Loudoun Valley Estates | 0.10% | 0.10%(+0.003)#84 | 0.10%(+0.001)#2,211 |
| 85. | Annandale | 0.10% | 0.10%(+0.002)#85 | 0.10%(+0.001)#2,214 |
| 86. | Mason Neck | 0.10% | 0.10%(+0.001)#86 | 0.10%(+0.000)#2,218 |
| 87. | Hollymead | 0.10% | 0.10%(+0.001)#87 | 0.10%(-0.000)#2,227 |
| 88. | North Springfield | 0.10% | 0.10%(-0.001)#88 | 0.10%(-0.002)#2,257 |
| 89. | Buckhall | 0.100% | 0.10%(-0.003)#89 | 0.10%(-0.004)#2,279 |
| 90. | Falls Church | 0.096% | 0.10%(-0.006)#90 | 0.10%(-0.007)#2,312 |
| 91. | Fairfax | 0.095% | 0.10%(-0.007)#91 | 0.10%(-0.009)#2,318 |
| 92. | Chester Gap | 0.094% | 0.10%(-0.009)#92 | 0.10%(-0.010)#2,334 |
| 93. | Virginia Beach | 0.090% | 0.10%(-0.012)#93 | 0.10%(-0.013)#2,365 |
| 94. | Winchester | 0.082% | 0.10%(-0.020)#94 | 0.10%(-0.022)#2,465 |
| 95. | Lansdowne | 0.078% | 0.10%(-0.024)#95 | 0.10%(-0.026)#2,508 |
| 96. | Lorton | 0.077% | 0.10%(-0.025)#96 | 0.10%(-0.026)#2,523 |
| 97. | Bridgewater | 0.076% | 0.10%(-0.026)#97 | 0.10%(-0.027)#2,535 |
| 98. | Chesapeake | 0.076% | 0.10%(-0.026)#98 | 0.10%(-0.028)#2,539 |
| 99. | Linton Hall | 0.075% | 0.10%(-0.027)#99 | 0.10%(-0.028)#2,552 |
| 100. | Bull Run | 0.072% | 0.10%(-0.030)#100 | 0.10%(-0.031)#2,592 |
Common Questions
What are the Top 10 Cities with the Highest Percentage of Immigrants from Japan in Virginia?
Top 10 Cities with the Highest Percentage of Immigrants from Japan in Virginia are:
#1
3.87%
#2
2.91%
#3
2.88%
#4
1.35%
#5
1.07%
#6
0.99%
#7
0.97%
#8
0.81%
#9
0.61%
#10
0.59%
What city has the Highest Percentage of Immigrants from Japan in Virginia?
Kings Park has the Highest Percentage of Immigrants from Japan in Virginia with 3.87%.
What is the Percentage of Immigrants from Japan in the State of Virginia?
Percentage of Immigrants from Japan in Virginia is 0.10%.
What is the Percentage of Immigrants from Japan in the United States?
Percentage of Immigrants from Japan in the United States is 0.10%.