Cities with the Highest Percentage of Population Employed in Health Technologists in Virginia
RELATED REPORTS & OPTIONS
Health Technologists
Virginia
Compare Cities
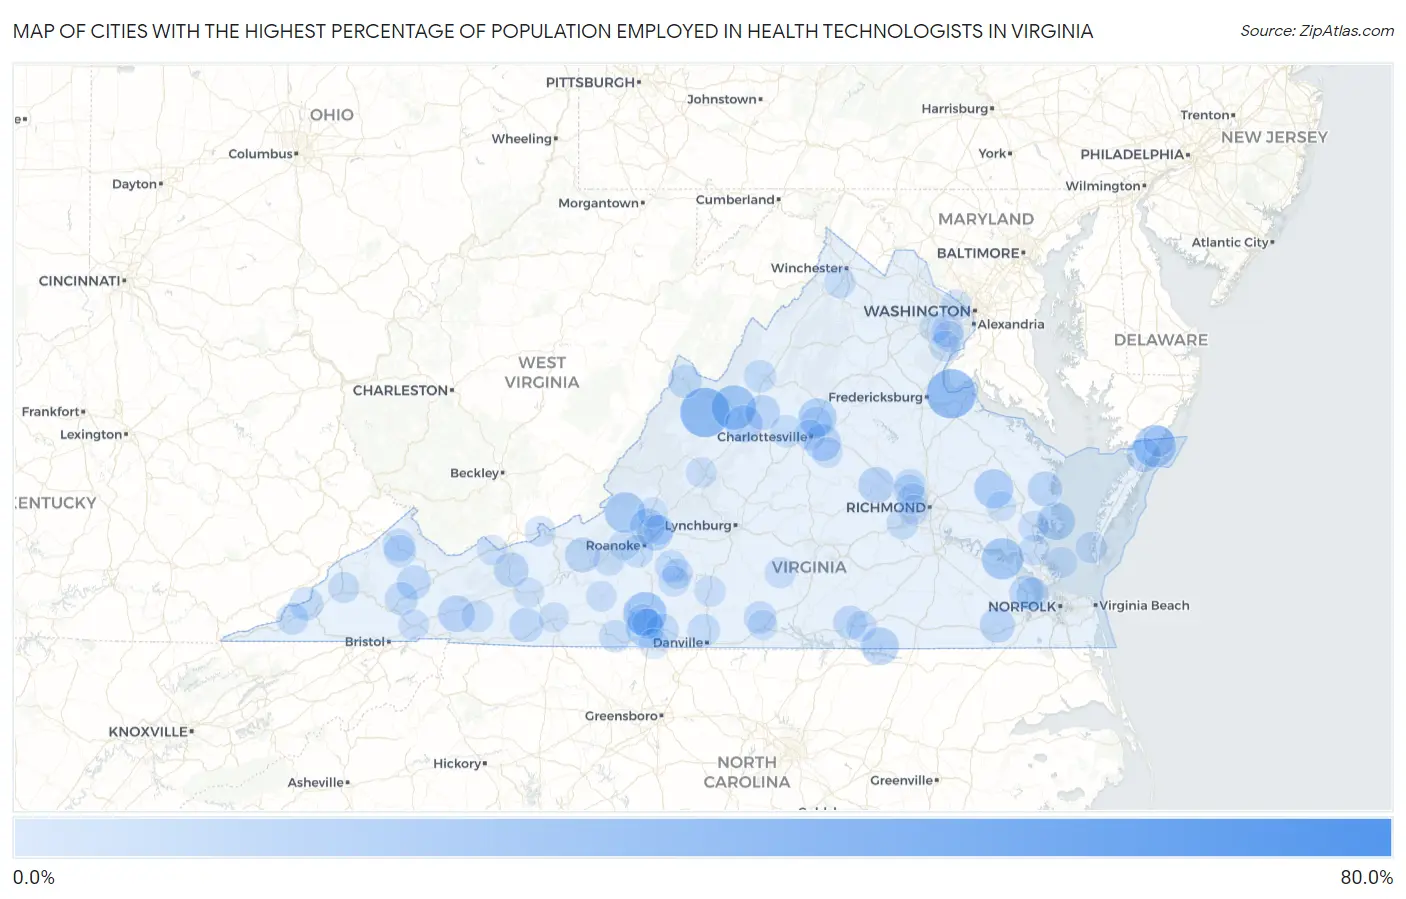
Map of Cities with the Highest Percentage of Population Employed in Health Technologists in Virginia
0.0%
80.0%
Cities with the Highest Percentage of Population Employed in Health Technologists in Virginia
| City | % Employed | vs State | vs National | |
| 1. | Jewell Ridge | 66.7% | 3.9%(+62.8)#1 | 4.3%(+62.4)#17 |
| 2. | Cliftondale Park | 61.5% | 3.9%(+57.6)#2 | 4.3%(+57.3)#19 |
| 3. | Kincora | 34.9% | 3.9%(+31.0)#3 | 4.3%(+30.6)#102 |
| 4. | Port Republic | 34.8% | 3.9%(+30.9)#4 | 4.3%(+30.5)#105 |
| 5. | Stewartsville | 32.3% | 3.9%(+28.4)#5 | 4.3%(+28.1)#128 |
| 6. | Deerfield | 31.8% | 3.9%(+27.9)#6 | 4.3%(+27.5)#140 |
| 7. | Fairview Beach | 31.7% | 3.9%(+27.8)#7 | 4.3%(+27.4)#142 |
| 8. | Abbs Valley | 27.3% | 3.9%(+23.4)#8 | 4.3%(+23.0)#186 |
| 9. | Churchville | 25.0% | 3.9%(+21.1)#9 | 4.3%(+20.7)#220 |
| 10. | Bastian | 24.1% | 3.9%(+20.2)#10 | 4.3%(+19.8)#242 |
| 11. | Oak Level | 23.5% | 3.9%(+19.6)#11 | 4.3%(+19.2)#257 |
| 12. | Horntown | 21.8% | 3.9%(+17.9)#12 | 4.3%(+17.6)#299 |
| 13. | Scotland | 20.8% | 3.9%(+16.9)#13 | 4.3%(+16.5)#332 |
| 14. | New Castle | 19.6% | 3.9%(+15.7)#14 | 4.3%(+15.4)#377 |
| 15. | Disputanta | 19.3% | 3.9%(+15.4)#15 | 4.3%(+15.0)#396 |
| 16. | Boissevain | 18.1% | 3.9%(+14.2)#16 | 4.3%(+13.9)#464 |
| 17. | King And Queen Court House | 17.6% | 3.9%(+13.7)#17 | 4.3%(+13.4)#483 |
| 18. | Piney Mountain | 16.7% | 3.9%(+12.8)#18 | 4.3%(+12.4)#541 |
| 19. | Fieldale | 16.5% | 3.9%(+12.6)#19 | 4.3%(+12.2)#557 |
| 20. | Mathews | 15.8% | 3.9%(+11.9)#20 | 4.3%(+11.5)#621 |
| 21. | Gasburg | 15.7% | 3.9%(+11.8)#21 | 4.3%(+11.4)#625 |
| 22. | Jolivue | 15.1% | 3.9%(+11.2)#22 | 4.3%(+10.8)#681 |
| 23. | Rivanna | 14.8% | 3.9%(+10.9)#23 | 4.3%(+10.6)#705 |
| 24. | Adwolf | 14.4% | 3.9%(+10.5)#24 | 4.3%(+10.1)#762 |
| 25. | Laymantown | 13.7% | 3.9%(+9.81)#25 | 4.3%(+9.42)#859 |
| 26. | Glen Wilton | 13.6% | 3.9%(+9.73)#26 | 4.3%(+9.35)#872 |
| 27. | Goochland | 13.6% | 3.9%(+9.68)#27 | 4.3%(+9.30)#884 |
| 28. | Daleville | 12.8% | 3.9%(+8.87)#28 | 4.3%(+8.48)#1,023 |
| 29. | Carrsville | 12.5% | 3.9%(+8.60)#29 | 4.3%(+8.21)#1,076 |
| 30. | New Hope | 12.3% | 3.9%(+8.43)#30 | 4.3%(+8.05)#1,118 |
| 31. | Prices Fork | 12.3% | 3.9%(+8.37)#31 | 4.3%(+7.98)#1,121 |
| 32. | Bland | 12.0% | 3.9%(+8.05)#32 | 4.3%(+7.67)#1,194 |
| 33. | Irvington | 11.9% | 3.9%(+8.02)#33 | 4.3%(+7.64)#1,204 |
| 34. | Fries | 11.3% | 3.9%(+7.42)#34 | 4.3%(+7.03)#1,370 |
| 35. | Temperanceville | 11.2% | 3.9%(+7.30)#35 | 4.3%(+6.91)#1,403 |
| 36. | Honaker | 11.1% | 3.9%(+7.23)#36 | 4.3%(+6.85)#1,416 |
| 37. | Benns Church | 11.1% | 3.9%(+7.18)#37 | 4.3%(+6.80)#1,437 |
| 38. | South Hill | 10.6% | 3.9%(+6.67)#38 | 4.3%(+6.29)#1,588 |
| 39. | Monterey | 10.4% | 3.9%(+6.51)#39 | 4.3%(+6.13)#1,637 |
| 40. | Keokee | 10.2% | 3.9%(+6.30)#40 | 4.3%(+5.92)#1,718 |
| 41. | Lebanon | 10.0% | 3.9%(+6.11)#41 | 4.3%(+5.72)#1,774 |
| 42. | Chatmoss | 9.4% | 3.9%(+5.53)#42 | 4.3%(+5.14)#2,047 |
| 43. | Carrollton | 9.4% | 3.9%(+5.47)#43 | 4.3%(+5.08)#2,073 |
| 44. | Grundy | 9.3% | 3.9%(+5.42)#44 | 4.3%(+5.04)#2,097 |
| 45. | Halifax | 9.2% | 3.9%(+5.28)#45 | 4.3%(+4.90)#2,173 |
| 46. | Belmont Estates | 9.0% | 3.9%(+5.15)#46 | 4.3%(+4.76)#2,260 |
| 47. | Cave Spring | 9.0% | 3.9%(+5.11)#47 | 4.3%(+4.72)#2,282 |
| 48. | Mount Hermon | 9.0% | 3.9%(+5.06)#48 | 4.3%(+4.67)#2,316 |
| 49. | Vansant | 8.9% | 3.9%(+5.01)#49 | 4.3%(+4.62)#2,339 |
| 50. | Westlake Corner | 8.8% | 3.9%(+4.94)#50 | 4.3%(+4.56)#2,386 |
| 51. | Patrick Springs | 8.8% | 3.9%(+4.92)#51 | 4.3%(+4.53)#2,402 |
| 52. | Afton | 8.8% | 3.9%(+4.85)#52 | 4.3%(+4.47)#2,436 |
| 53. | Crozet | 8.7% | 3.9%(+4.81)#53 | 4.3%(+4.43)#2,469 |
| 54. | Wyndham | 8.5% | 3.9%(+4.63)#54 | 4.3%(+4.24)#2,574 |
| 55. | Difficult Run | 8.5% | 3.9%(+4.57)#55 | 4.3%(+4.18)#2,629 |
| 56. | Pennington Gap | 8.5% | 3.9%(+4.55)#56 | 4.3%(+4.16)#2,641 |
| 57. | Sugar Grove | 8.2% | 3.9%(+4.26)#57 | 4.3%(+3.88)#2,842 |
| 58. | Hollymead | 8.1% | 3.9%(+4.15)#58 | 4.3%(+3.77)#2,930 |
| 59. | South Run | 8.0% | 3.9%(+4.11)#59 | 4.3%(+3.73)#2,961 |
| 60. | Midlothian | 8.0% | 3.9%(+4.10)#60 | 4.3%(+3.71)#2,983 |
| 61. | Stanleytown | 7.9% | 3.9%(+3.99)#61 | 4.3%(+3.61)#3,066 |
| 62. | Woodlake | 7.9% | 3.9%(+3.98)#62 | 4.3%(+3.60)#3,085 |
| 63. | Stephens City | 7.8% | 3.9%(+3.88)#63 | 4.3%(+3.50)#3,163 |
| 64. | Shawsville | 7.6% | 3.9%(+3.69)#64 | 4.3%(+3.30)#3,353 |
| 65. | Union Mill | 7.5% | 3.9%(+3.63)#65 | 4.3%(+3.24)#3,407 |
| 66. | Cape Charles | 7.5% | 3.9%(+3.59)#66 | 4.3%(+3.20)#3,446 |
| 67. | Short Pump | 7.4% | 3.9%(+3.53)#67 | 4.3%(+3.14)#3,508 |
| 68. | Wise | 7.4% | 3.9%(+3.46)#68 | 4.3%(+3.08)#3,566 |
| 69. | Poquoson | 7.3% | 3.9%(+3.42)#69 | 4.3%(+3.04)#3,604 |
| 70. | Phenix | 7.3% | 3.9%(+3.38)#70 | 4.3%(+3.00)#3,636 |
| 71. | Gretna | 7.1% | 3.9%(+3.24)#71 | 4.3%(+2.86)#3,785 |
| 72. | Captains Cove | 7.1% | 3.9%(+3.16)#72 | 4.3%(+2.78)#3,892 |
| 73. | Clifton | 7.1% | 3.9%(+3.16)#73 | 4.3%(+2.78)#3,895 |
| 74. | Lexington | 7.1% | 3.9%(+3.15)#74 | 4.3%(+2.77)#3,909 |
| 75. | Crosspointe | 6.9% | 3.9%(+3.02)#75 | 4.3%(+2.64)#4,045 |
| 76. | Abingdon | 6.9% | 3.9%(+3.02)#76 | 4.3%(+2.63)#4,062 |
| 77. | Union Hall | 6.9% | 3.9%(+2.98)#77 | 4.3%(+2.59)#4,107 |
| 78. | Mclean | 6.8% | 3.9%(+2.94)#78 | 4.3%(+2.55)#4,163 |
| 79. | Braddock | 6.8% | 3.9%(+2.90)#79 | 4.3%(+2.52)#4,209 |
| 80. | Gloucester Courthouse | 6.8% | 3.9%(+2.89)#80 | 4.3%(+2.51)#4,217 |
| 81. | Tuckahoe | 6.8% | 3.9%(+2.88)#81 | 4.3%(+2.50)#4,221 |
| 82. | North Shore | 6.7% | 3.9%(+2.83)#82 | 4.3%(+2.45)#4,292 |
| 83. | Brodnax | 6.7% | 3.9%(+2.80)#83 | 4.3%(+2.41)#4,344 |
| 84. | Potomac Mills | 6.7% | 3.9%(+2.77)#84 | 4.3%(+2.39)#4,376 |
| 85. | Glen Lyn | 6.7% | 3.9%(+2.76)#85 | 4.3%(+2.38)#4,404 |
| 86. | Charlottesville | 6.6% | 3.9%(+2.74)#86 | 4.3%(+2.35)#4,432 |
| 87. | Yorktown | 6.6% | 3.9%(+2.72)#87 | 4.3%(+2.34)#4,452 |
| 88. | Floyd | 6.6% | 3.9%(+2.67)#88 | 4.3%(+2.28)#4,523 |
| 89. | Lake Monticello | 6.4% | 3.9%(+2.53)#89 | 4.3%(+2.15)#4,701 |
| 90. | Fincastle | 6.3% | 3.9%(+2.43)#90 | 4.3%(+2.04)#4,835 |
| 91. | Glenvar | 6.3% | 3.9%(+2.38)#91 | 4.3%(+1.99)#4,912 |
| 92. | Collinsville | 6.3% | 3.9%(+2.37)#92 | 4.3%(+1.99)#4,921 |
| 93. | Fort Chiswell | 6.2% | 3.9%(+2.27)#93 | 4.3%(+1.89)#5,075 |
| 94. | Bon Air | 6.1% | 3.9%(+2.24)#94 | 4.3%(+1.86)#5,139 |
| 95. | Ridgeway | 6.1% | 3.9%(+2.20)#95 | 4.3%(+1.82)#5,213 |
| 96. | Bluefield | 6.0% | 3.9%(+2.14)#96 | 4.3%(+1.76)#5,300 |
| 97. | South Boston | 6.0% | 3.9%(+2.14)#97 | 4.3%(+1.76)#5,304 |
| 98. | Hillsville | 6.0% | 3.9%(+2.14)#98 | 4.3%(+1.76)#5,305 |
| 99. | Blue Ridge | 6.0% | 3.9%(+2.09)#99 | 4.3%(+1.71)#5,387 |
| 100. | West Point | 5.8% | 3.9%(+1.92)#100 | 4.3%(+1.54)#5,658 |
Common Questions
What are the Top 10 Cities with the Highest Percentage of Population Employed in Health Technologists in Virginia?
Top 10 Cities with the Highest Percentage of Population Employed in Health Technologists in Virginia are:
#1
31.8%
#2
31.7%
#3
25.0%
#4
23.5%
#5
21.8%
#6
20.8%
#7
19.6%
#8
17.6%
#9
16.7%
#10
16.5%
What city has the Highest Percentage of Population Employed in Health Technologists in Virginia?
Deerfield has the Highest Percentage of Population Employed in Health Technologists in Virginia with 31.8%.
What is the Percentage of Population Employed in Health Technologists in the State of Virginia?
Percentage of Population Employed in Health Technologists in Virginia is 3.9%.
What is the Percentage of Population Employed in Health Technologists in the United States?
Percentage of Population Employed in Health Technologists in the United States is 4.3%.