Sawyerville, IL
Sawyerville Map
Sawyerville Overview
199
TOTAL POPULATION
98
MALE POPULATION
101
FEMALE POPULATION
97.03
MALES / 100 FEMALES
103.06
FEMALES / 100 MALES
48.3
MEDIAN AGE
3.5
AVG FAMILY SIZE
2.4
AVG HOUSEHOLD SIZE
$29,805
PER CAPITA INCOME
$72,500
AVG FAMILY INCOME
$46,161
AVG HOUSEHOLD INCOME
46.7%
WAGE / INCOME GAP [ % ]
53.3¢/ $1
WAGE / INCOME GAP [ $ ]
0.40
INEQUALITY / GINI INDEX
88
LABOR FORCE [ PEOPLE ]
52.4%
PERCENT IN LABOR FORCE
5.7%
UNEMPLOYMENT RATE
Sawyerville Zip Codes
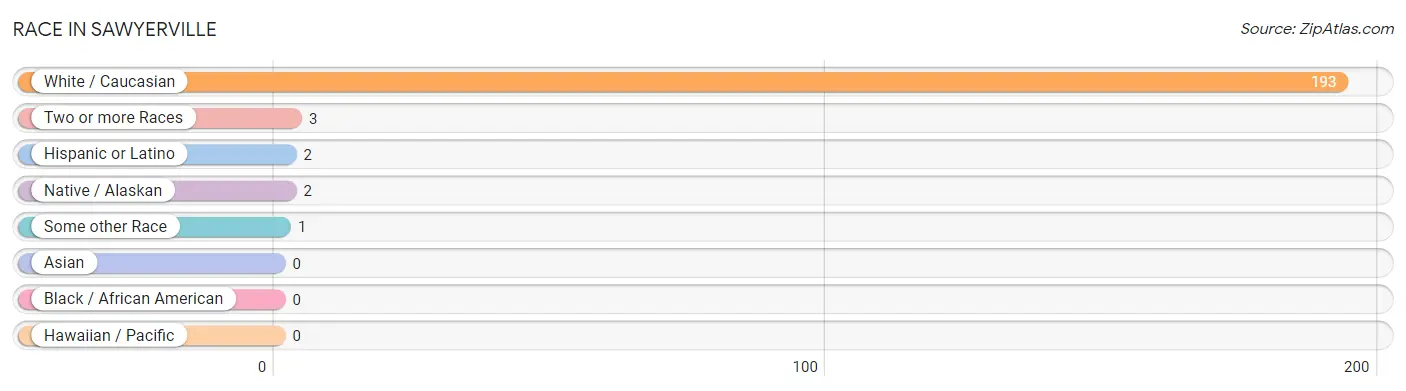
Race in Sawyerville
The most populous races in Sawyerville are White / Caucasian (193 | 97.0%), Two or more Races (3 | 1.5%), and Hispanic or Latino (2 | 1.0%).
| Race | # Population | % Population |
| Asian | 0 | 0.0% |
| Black / African American | 0 | 0.0% |
| Hawaiian / Pacific | 0 | 0.0% |
| Hispanic or Latino | 2 | 1.0% |
| Native / Alaskan | 2 | 1.0% |
| White / Caucasian | 193 | 97.0% |
| Two or more Races | 3 | 1.5% |
| Some other Race | 1 | 0.5% |
| Total | 199 | 100.0% |
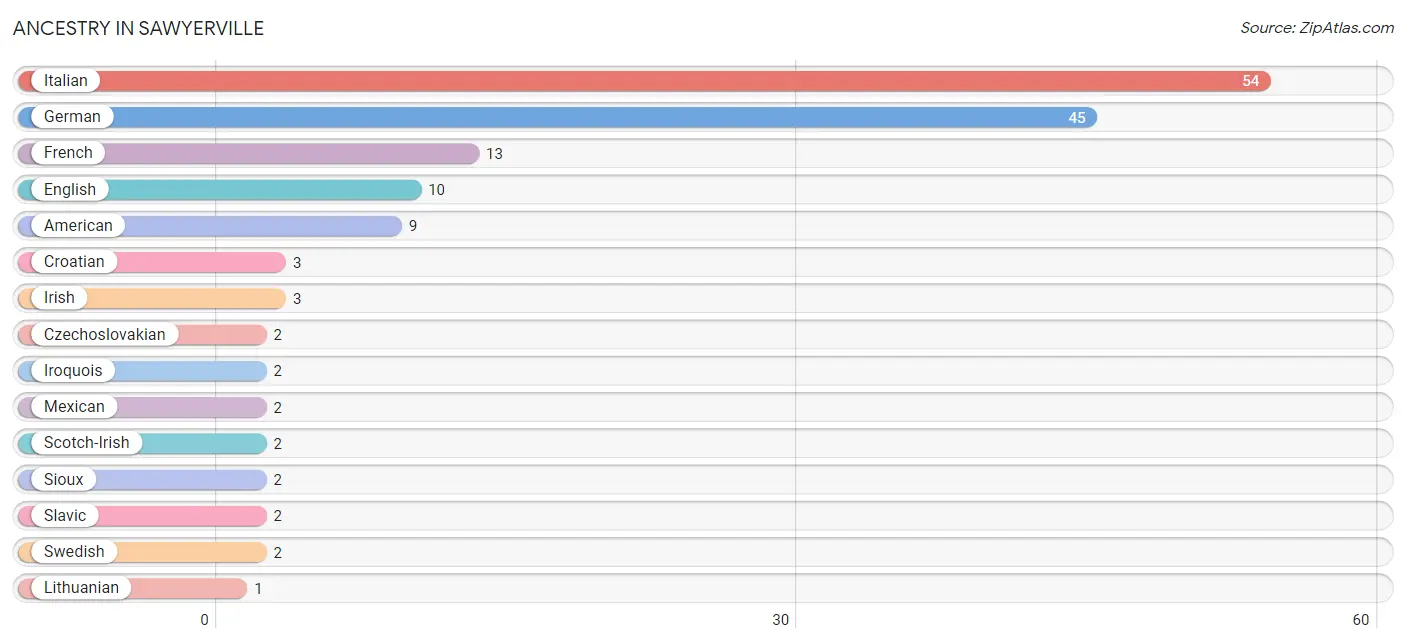
Ancestry in Sawyerville
The most populous ancestries reported in Sawyerville are Italian (54 | 27.1%), German (45 | 22.6%), French (13 | 6.5%), English (10 | 5.0%), and American (9 | 4.5%), together accounting for 65.8% of all Sawyerville residents.
| Ancestry | # Population | % Population |
| American | 9 | 4.5% |
| Croatian | 3 | 1.5% |
| Czechoslovakian | 2 | 1.0% |
| English | 10 | 5.0% |
| French | 13 | 6.5% |
| German | 45 | 22.6% |
| Irish | 3 | 1.5% |
| Iroquois | 2 | 1.0% |
| Italian | 54 | 27.1% |
| Lithuanian | 1 | 0.5% |
| Mexican | 2 | 1.0% |
| Scotch-Irish | 2 | 1.0% |
| Sioux | 2 | 1.0% |
| Slavic | 2 | 1.0% |
| Swedish | 2 | 1.0% | View All 15 Rows |
Immigrants in Sawyerville

| Immigration Origin | # Population | % Population | View All 0 Rows |
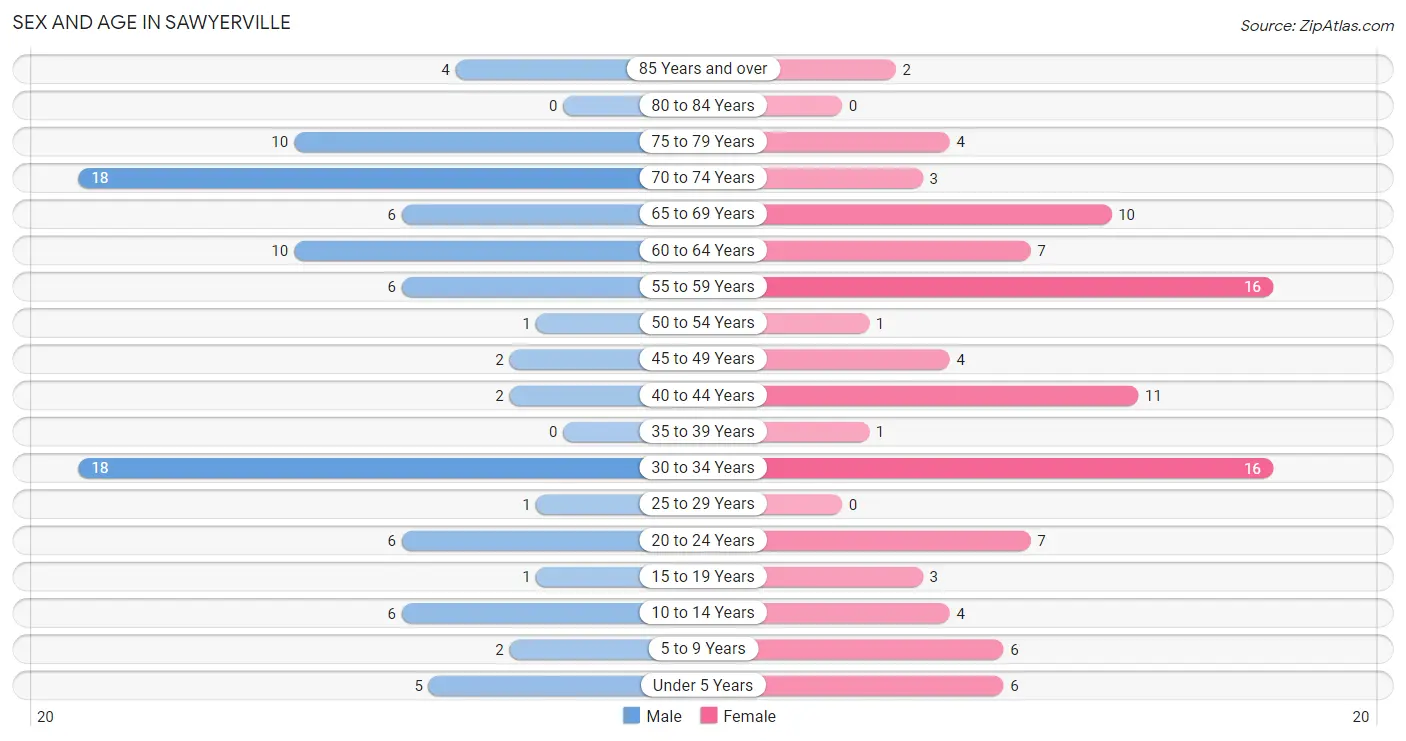
Sex and Age in Sawyerville
Sex and Age in Sawyerville
The most populous age groups in Sawyerville are 30 to 34 Years (18 | 18.4%) for men and 30 to 34 Years (16 | 15.8%) for women.
| Age Bracket | Male | Female |
| Under 5 Years | 5 (5.1%) | 6 (5.9%) |
| 5 to 9 Years | 2 (2.0%) | 6 (5.9%) |
| 10 to 14 Years | 6 (6.1%) | 4 (4.0%) |
| 15 to 19 Years | 1 (1.0%) | 3 (3.0%) |
| 20 to 24 Years | 6 (6.1%) | 7 (6.9%) |
| 25 to 29 Years | 1 (1.0%) | 0 (0.0%) |
| 30 to 34 Years | 18 (18.4%) | 16 (15.8%) |
| 35 to 39 Years | 0 (0.0%) | 1 (1.0%) |
| 40 to 44 Years | 2 (2.0%) | 11 (10.9%) |
| 45 to 49 Years | 2 (2.0%) | 4 (4.0%) |
| 50 to 54 Years | 1 (1.0%) | 1 (1.0%) |
| 55 to 59 Years | 6 (6.1%) | 16 (15.8%) |
| 60 to 64 Years | 10 (10.2%) | 7 (6.9%) |
| 65 to 69 Years | 6 (6.1%) | 10 (9.9%) |
| 70 to 74 Years | 18 (18.4%) | 3 (3.0%) |
| 75 to 79 Years | 10 (10.2%) | 4 (4.0%) |
| 80 to 84 Years | 0 (0.0%) | 0 (0.0%) |
| 85 Years and over | 4 (4.1%) | 2 (2.0%) |
| Total | 98 (100.0%) | 101 (100.0%) |
Families and Households in Sawyerville
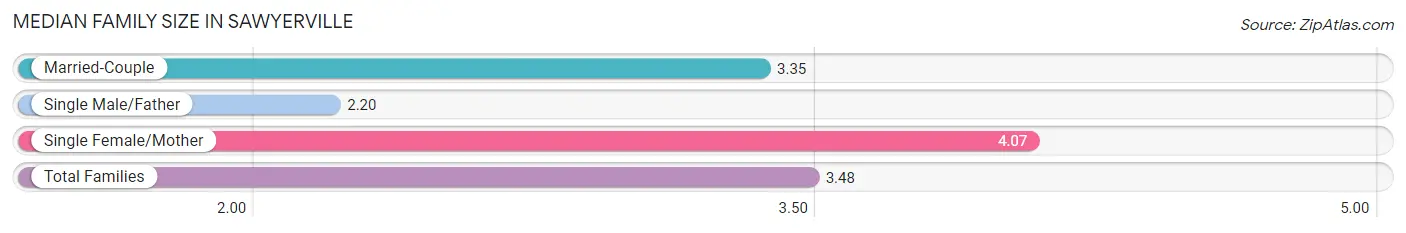
Median Family Size in Sawyerville
The median family size in Sawyerville is 3.48 persons per family, with single female/mother families (15 | 37.5%) accounting for the largest median family size of 4.07 persons per family. On the other hand, single male/father families (5 | 12.5%) represent the smallest median family size with 2.20 persons per family.
| Family Type | # Families | Family Size |
| Married-Couple | 20 (50.0%) | 3.35 |
| Single Male/Father | 5 (12.5%) | 2.20 |
| Single Female/Mother | 15 (37.5%) | 4.07 |
| Total Families | 40 (100.0%) | 3.48 |
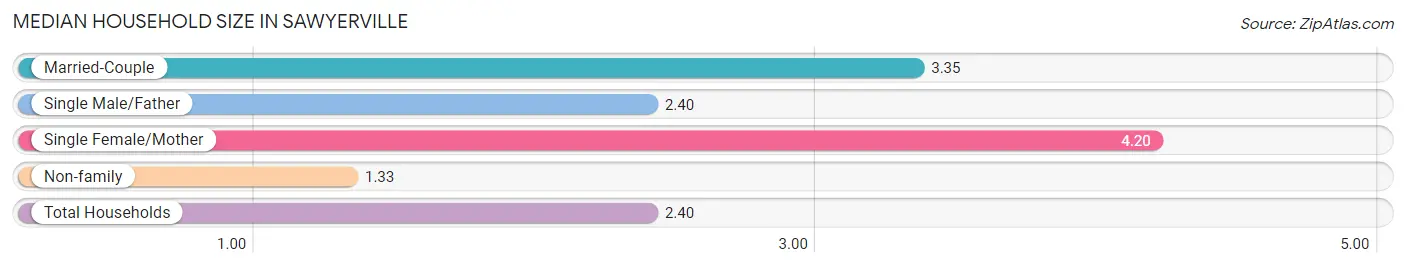
Median Household Size in Sawyerville
The median household size in Sawyerville is 2.40 persons per household, with single female/mother households (15 | 18.1%) accounting for the largest median household size of 4.2 persons per household. non-family households (43 | 51.8%) represent the smallest median household size with 1.33 persons per household.
| Household Type | # Households | Household Size |
| Married-Couple | 20 (24.1%) | 3.35 |
| Single Male/Father | 5 (6.0%) | 2.40 |
| Single Female/Mother | 15 (18.1%) | 4.20 |
| Non-family | 43 (51.8%) | 1.33 |
| Total Households | 83 (100.0%) | 2.40 |
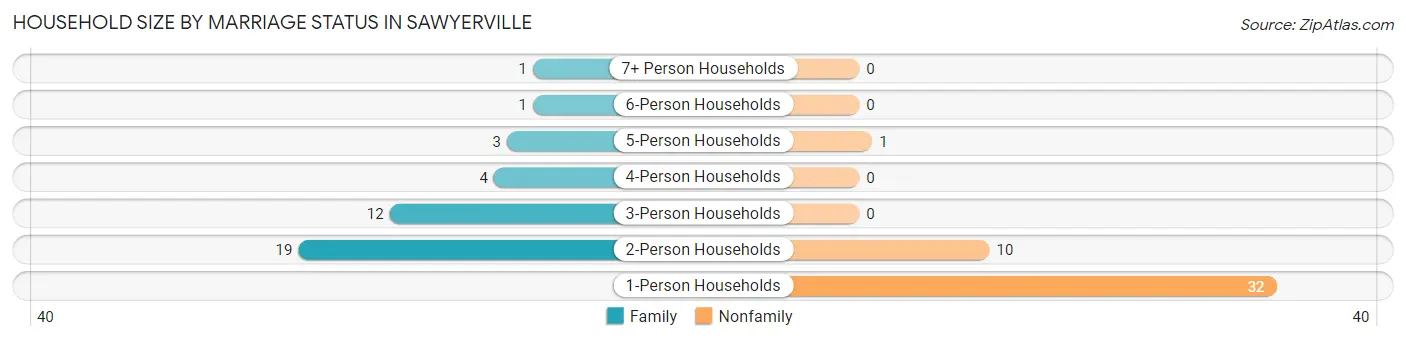
Household Size by Marriage Status in Sawyerville
Out of a total of 83 households in Sawyerville, 40 (48.2%) are family households, while 43 (51.8%) are nonfamily households. The most numerous type of family households are 2-person households, comprising 19, and the most common type of nonfamily households are 1-person households, comprising 32.
| Household Size | Family Households | Nonfamily Households |
| 1-Person Households | - | 32 (38.6%) |
| 2-Person Households | 19 (22.9%) | 10 (12.0%) |
| 3-Person Households | 12 (14.5%) | 0 (0.0%) |
| 4-Person Households | 4 (4.8%) | 0 (0.0%) |
| 5-Person Households | 3 (3.6%) | 1 (1.2%) |
| 6-Person Households | 1 (1.2%) | 0 (0.0%) |
| 7+ Person Households | 1 (1.2%) | 0 (0.0%) |
| Total | 40 (48.2%) | 43 (51.8%) |
Female Fertility in Sawyerville
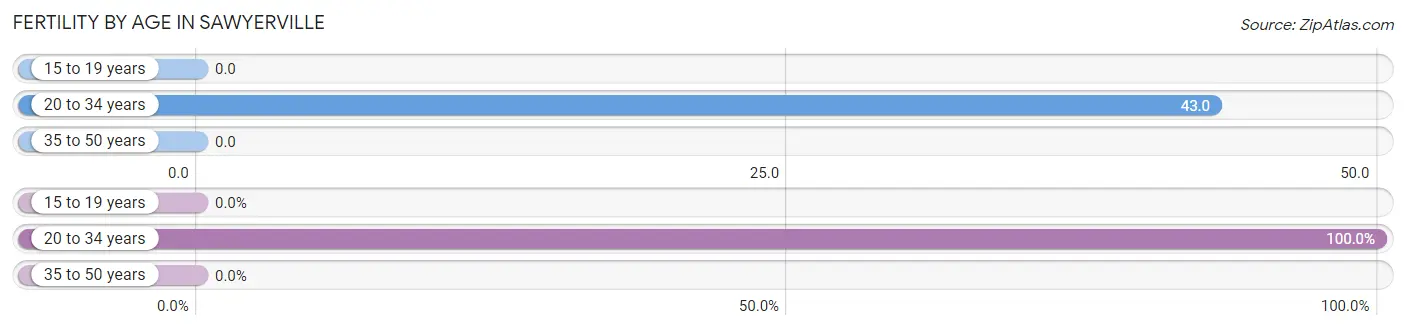
Fertility by Age in Sawyerville
Average fertility rate in Sawyerville is 24.0 births per 1,000 women. Women in the age bracket of 20 to 34 years have the highest fertility rate with 43.0 births per 1,000 women. Women in the age bracket of 20 to 34 years acount for 100.0% of all women with births.
| Age Bracket | Women with Births | Births / 1,000 Women |
| 15 to 19 years | 0 (0.0%) | 0.0 |
| 20 to 34 years | 1 (100.0%) | 43.0 |
| 35 to 50 years | 0 (0.0%) | 0.0 |
| Total | 1 (100.0%) | 24.0 |
Fertility by Age by Marriage Status in Sawyerville
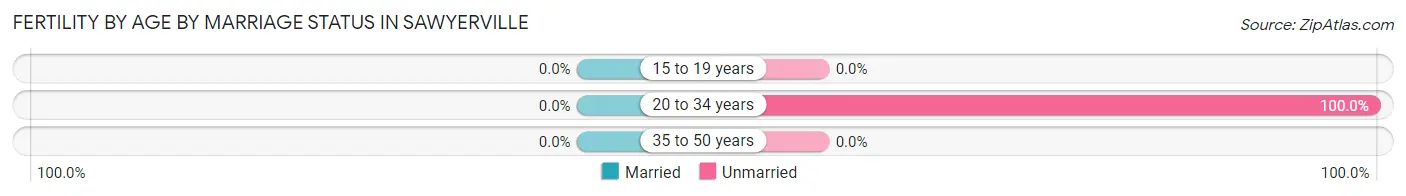
| Age Bracket | Married | Unmarried |
| 15 to 19 years | 0 (0.0%) | 0 (0.0%) |
| 20 to 34 years | 0 (0.0%) | 1 (100.0%) |
| 35 to 50 years | 0 (0.0%) | 0 (0.0%) |
| Total | 0 (0.0%) | 1 (100.0%) |
Fertility by Education in Sawyerville
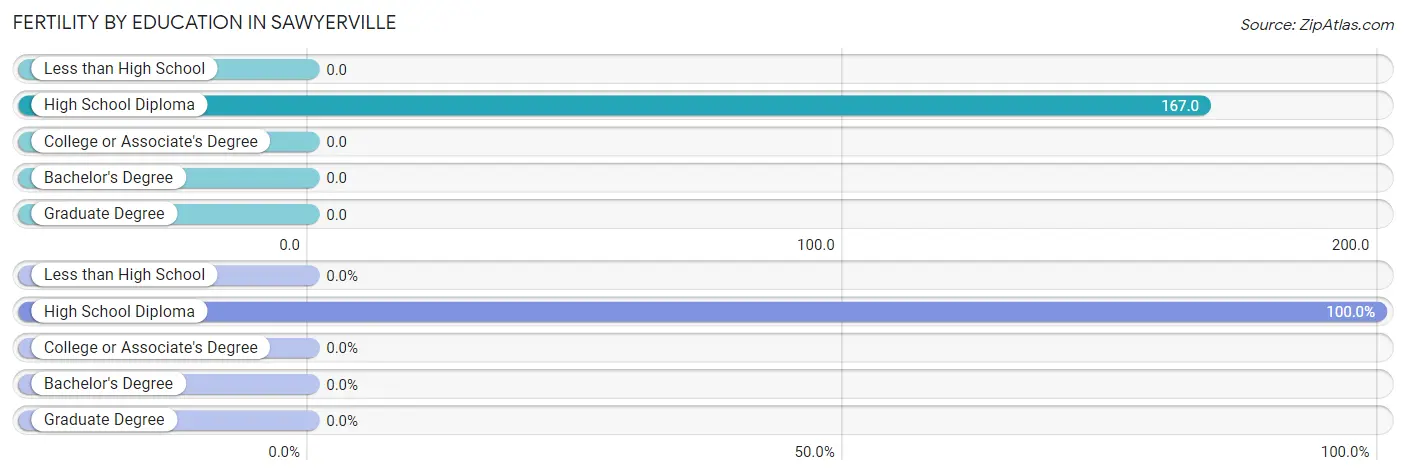
| Educational Attainment | Women with Births | Births / 1,000 Women |
| Less than High School | 0 (0.0%) | 0.0 |
| High School Diploma | 1 (100.0%) | 167.0 |
| College or Associate's Degree | 0 (0.0%) | 0.0 |
| Bachelor's Degree | 0 (0.0%) | 0.0 |
| Graduate Degree | 0 (0.0%) | 0.0 |
| Total | 1 (100.0%) | 24.0 |
Fertility by Education by Marriage Status in Sawyerville
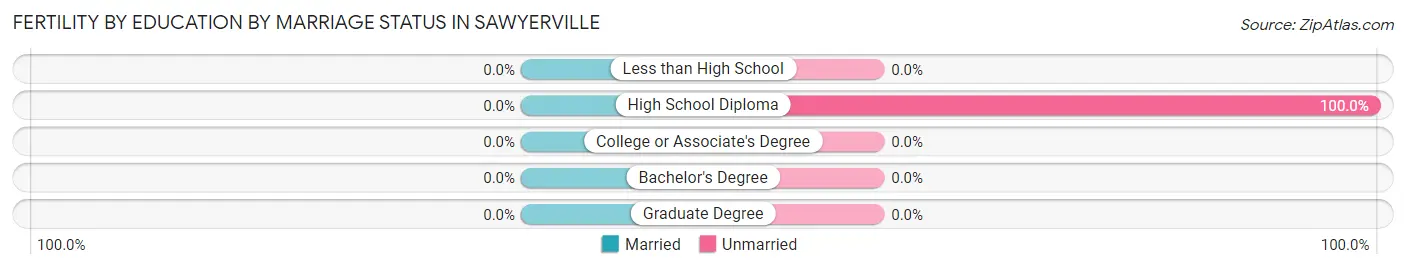
| Educational Attainment | Married | Unmarried |
| Less than High School | 0 (0.0%) | 0 (0.0%) |
| High School Diploma | 0 (0.0%) | 1 (100.0%) |
| College or Associate's Degree | 0 (0.0%) | 0 (0.0%) |
| Bachelor's Degree | 0 (0.0%) | 0 (0.0%) |
| Graduate Degree | 0 (0.0%) | 0 (0.0%) |
| Total | 0 (0.0%) | 1 (100.0%) |
Income in Sawyerville
Income Overview in Sawyerville
Per Capita Income in Sawyerville is $29,805, while median incomes of families and households are $72,500 and $46,161 respectively.
| Characteristic | Number | Measure |
| Per Capita Income | 199 | $29,805 |
| Median Family Income | 40 | $72,500 |
| Mean Family Income | 40 | $82,715 |
| Median Household Income | 83 | $46,161 |
| Mean Household Income | 83 | $62,486 |
| Income Deficit | 40 | $0 |
| Wage / Income Gap (%) | 199 | 46.72% |
| Wage / Income Gap ($) | 199 | 53.28¢ per $1 |
| Gini / Inequality Index | 199 | 0.40 |
Earnings by Sex in Sawyerville
Average Earnings in Sawyerville are $36,250, $45,982 for men and $24,500 for women, a difference of 46.7%.
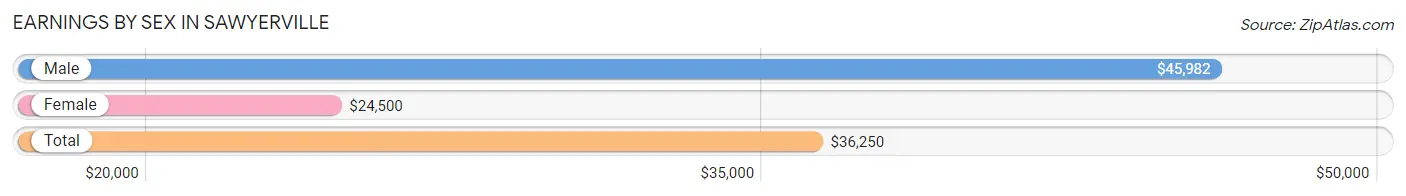
| Sex | Number | Average Earnings |
| Male | 45 (50.6%) | $45,982 |
| Female | 44 (49.4%) | $24,500 |
| Total | 89 (100.0%) | $36,250 |
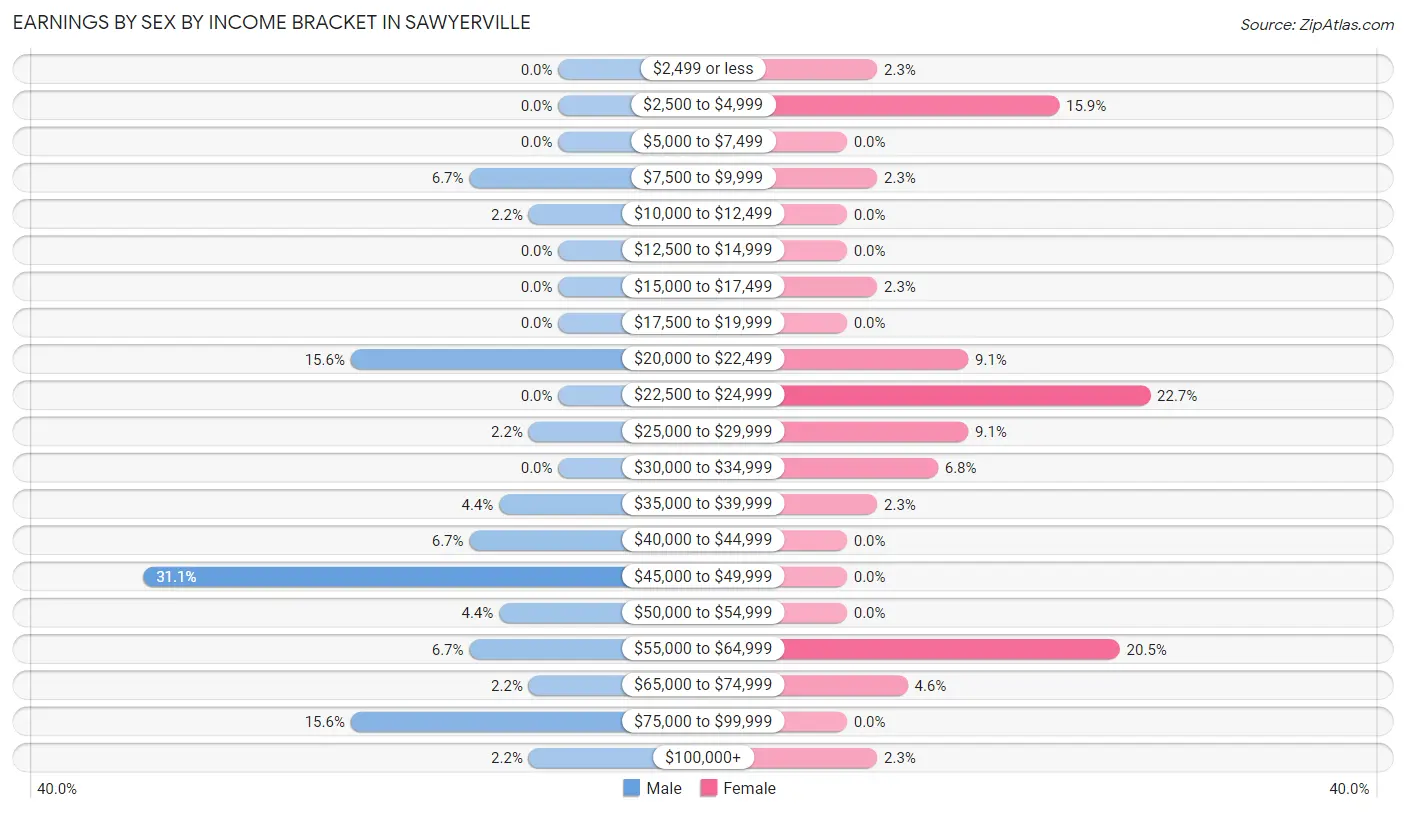
Earnings by Sex by Income Bracket in Sawyerville
The most common earnings brackets in Sawyerville are $45,000 to $49,999 for men (14 | 31.1%) and $22,500 to $24,999 for women (10 | 22.7%).
| Income | Male | Female |
| $2,499 or less | 0 (0.0%) | 1 (2.3%) |
| $2,500 to $4,999 | 0 (0.0%) | 7 (15.9%) |
| $5,000 to $7,499 | 0 (0.0%) | 0 (0.0%) |
| $7,500 to $9,999 | 3 (6.7%) | 1 (2.3%) |
| $10,000 to $12,499 | 1 (2.2%) | 0 (0.0%) |
| $12,500 to $14,999 | 0 (0.0%) | 0 (0.0%) |
| $15,000 to $17,499 | 0 (0.0%) | 1 (2.3%) |
| $17,500 to $19,999 | 0 (0.0%) | 0 (0.0%) |
| $20,000 to $22,499 | 7 (15.6%) | 4 (9.1%) |
| $22,500 to $24,999 | 0 (0.0%) | 10 (22.7%) |
| $25,000 to $29,999 | 1 (2.2%) | 4 (9.1%) |
| $30,000 to $34,999 | 0 (0.0%) | 3 (6.8%) |
| $35,000 to $39,999 | 2 (4.4%) | 1 (2.3%) |
| $40,000 to $44,999 | 3 (6.7%) | 0 (0.0%) |
| $45,000 to $49,999 | 14 (31.1%) | 0 (0.0%) |
| $50,000 to $54,999 | 2 (4.4%) | 0 (0.0%) |
| $55,000 to $64,999 | 3 (6.7%) | 9 (20.4%) |
| $65,000 to $74,999 | 1 (2.2%) | 2 (4.5%) |
| $75,000 to $99,999 | 7 (15.6%) | 0 (0.0%) |
| $100,000+ | 1 (2.2%) | 1 (2.3%) |
| Total | 45 (100.0%) | 44 (100.0%) |
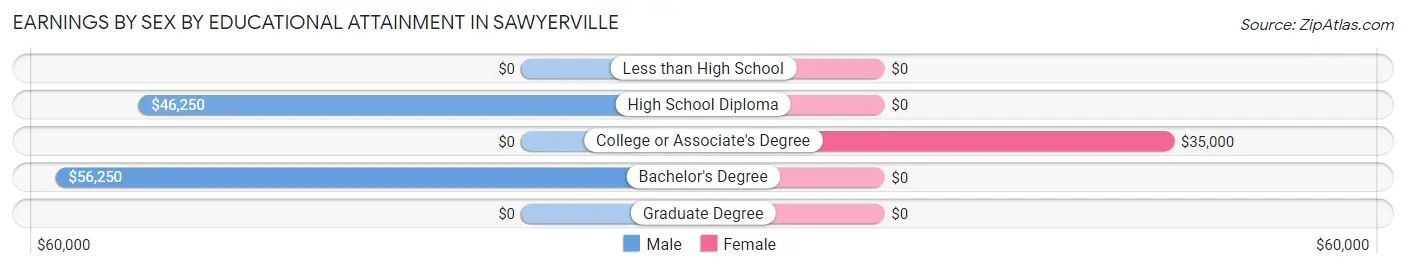
Earnings by Sex by Educational Attainment in Sawyerville
Average earnings in Sawyerville are $45,982 for men and $27,500 for women, a difference of 40.2%. Men with an educational attainment of bachelor's degree enjoy the highest average annual earnings of $56,250, while those with high school diploma education earn the least with $46,250. Women with an educational attainment of college or associate's degree earn the most with the average annual earnings of $35,000, while those with college or associate's degree education have the smallest earnings of $35,000.
| Educational Attainment | Male Income | Female Income |
| Less than High School | - | - |
| High School Diploma | $46,250 | $0 |
| College or Associate's Degree | - | - |
| Bachelor's Degree | $56,250 | $0 |
| Graduate Degree | - | - |
| Total | $45,982 | $27,500 |
Family Income in Sawyerville
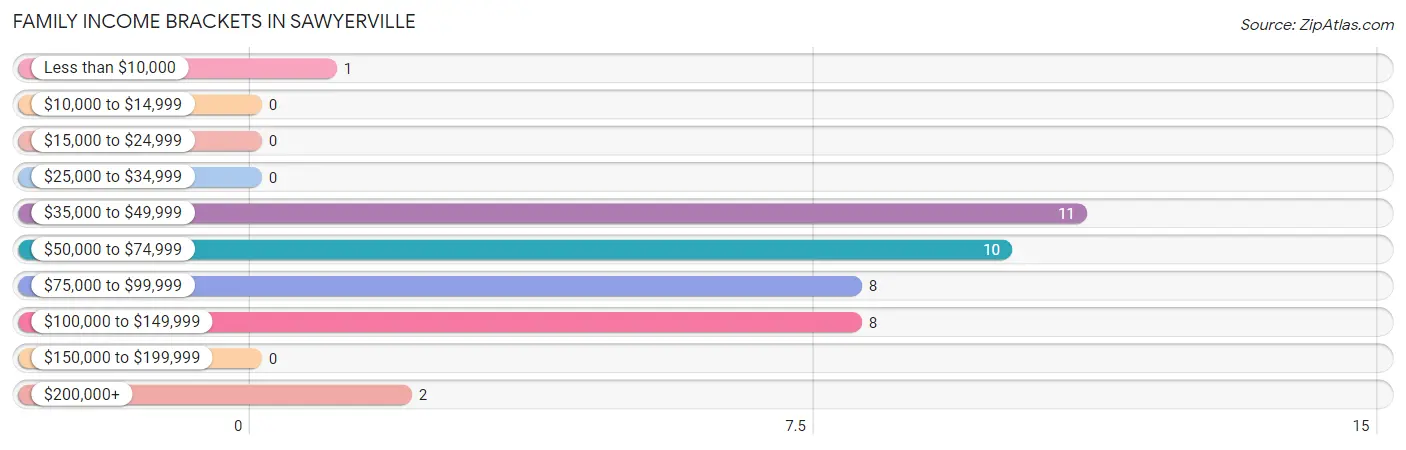
Family Income Brackets in Sawyerville
According to the Sawyerville family income data, there are 11 families falling into the $35,000 to $49,999 income range, which is the most common income bracket and makes up 27.5% of all families.
| Income Bracket | # Families | % Families |
| Less than $10,000 | 1 | 2.5% |
| $10,000 to $14,999 | 0 | 0.0% |
| $15,000 to $24,999 | 0 | 0.0% |
| $25,000 to $34,999 | 0 | 0.0% |
| $35,000 to $49,999 | 11 | 27.5% |
| $50,000 to $74,999 | 10 | 25.0% |
| $75,000 to $99,999 | 8 | 20.0% |
| $100,000 to $149,999 | 8 | 20.0% |
| $150,000 to $199,999 | 0 | 0.0% |
| $200,000+ | 2 | 5.0% |
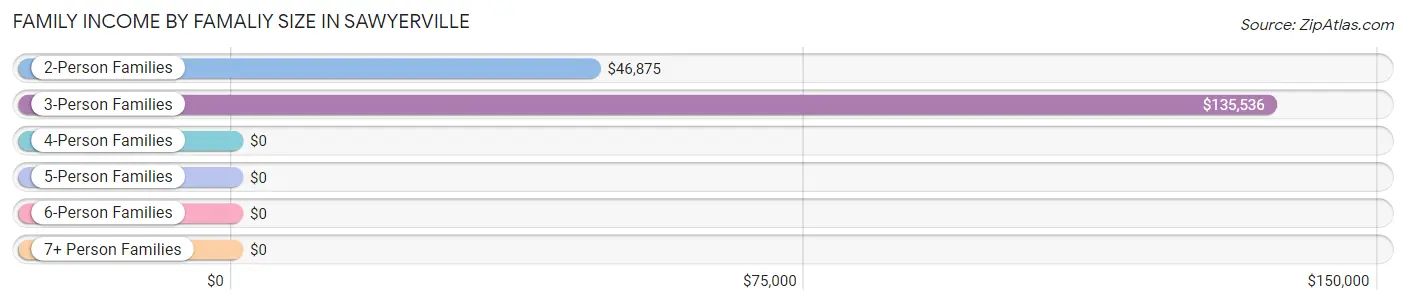
Family Income by Famaliy Size in Sawyerville
3-person families (13 | 32.5%) account for the highest median family income in Sawyerville with $135,536 per family, while 3-person families (13 | 32.5%) have the highest median income of $45,179 per family member.
| Income Bracket | # Families | Median Income |
| 2-Person Families | 20 (50.0%) | $46,875 |
| 3-Person Families | 13 (32.5%) | $135,536 |
| 4-Person Families | 2 (5.0%) | $0 |
| 5-Person Families | 3 (7.5%) | $0 |
| 6-Person Families | 1 (2.5%) | $0 |
| 7+ Person Families | 1 (2.5%) | $0 |
| Total | 40 (100.0%) | $72,500 |
Family Income by Number of Earners in Sawyerville
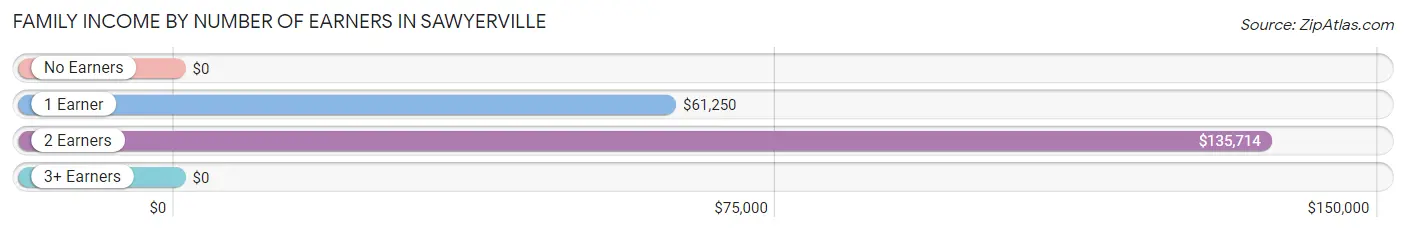
| Number of Earners | # Families | Median Income |
| No Earners | 4 (10.0%) | $0 |
| 1 Earner | 23 (57.5%) | $61,250 |
| 2 Earners | 12 (30.0%) | $135,714 |
| 3+ Earners | 1 (2.5%) | $0 |
| Total | 40 (100.0%) | $72,500 |
Household Income in Sawyerville
Household Income Brackets in Sawyerville
With 32 households falling in the category, the $35,000 to $49,999 income range is the most frequent in Sawyerville, accounting for 38.6% of all households. In contrast, only 2 households (2.4%) fall into the $25,000 to $34,999 income bracket, making it the least populous group.
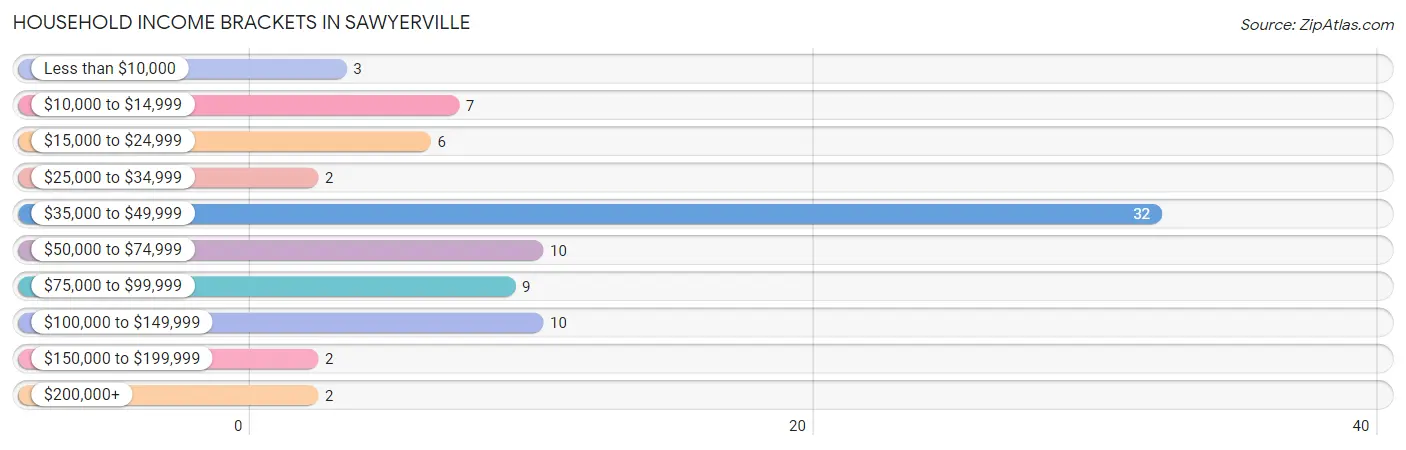
| Income Bracket | # Households | % Households |
| Less than $10,000 | 3 | 3.6% |
| $10,000 to $14,999 | 7 | 8.4% |
| $15,000 to $24,999 | 6 | 7.2% |
| $25,000 to $34,999 | 2 | 2.4% |
| $35,000 to $49,999 | 32 | 38.6% |
| $50,000 to $74,999 | 10 | 12.0% |
| $75,000 to $99,999 | 9 | 10.8% |
| $100,000 to $149,999 | 10 | 12.0% |
| $150,000 to $199,999 | 2 | 2.4% |
| $200,000+ | 2 | 2.4% |
Household Income by Householder Age in Sawyerville
The median household income in Sawyerville is $46,161, with the highest median household income of $80,313 found in the 25 to 44 years age bracket for the primary householder. A total of 25 households (30.1%) fall into this category. Meanwhile, the 15 to 24 years age bracket for the primary householder has the lowest median household income of $0, with 2 households (2.4%) in this group.
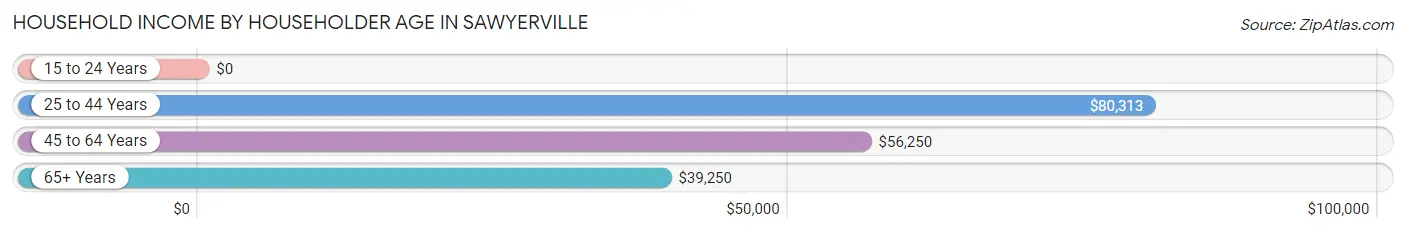
| Income Bracket | # Households | Median Income |
| 15 to 24 Years | 2 (2.4%) | $0 |
| 25 to 44 Years | 25 (30.1%) | $80,313 |
| 45 to 64 Years | 25 (30.1%) | $56,250 |
| 65+ Years | 31 (37.3%) | $39,250 |
| Total | 83 (100.0%) | $46,161 |
Poverty in Sawyerville
Income Below Poverty by Sex and Age in Sawyerville
With 7.3% poverty level for males and 7.1% for females among the residents of Sawyerville, 35 to 44 year old males and under 5 year old females are the most vulnerable to poverty, with 1 males (50.0%) and 1 females (33.3%) in their respective age groups living below the poverty level.
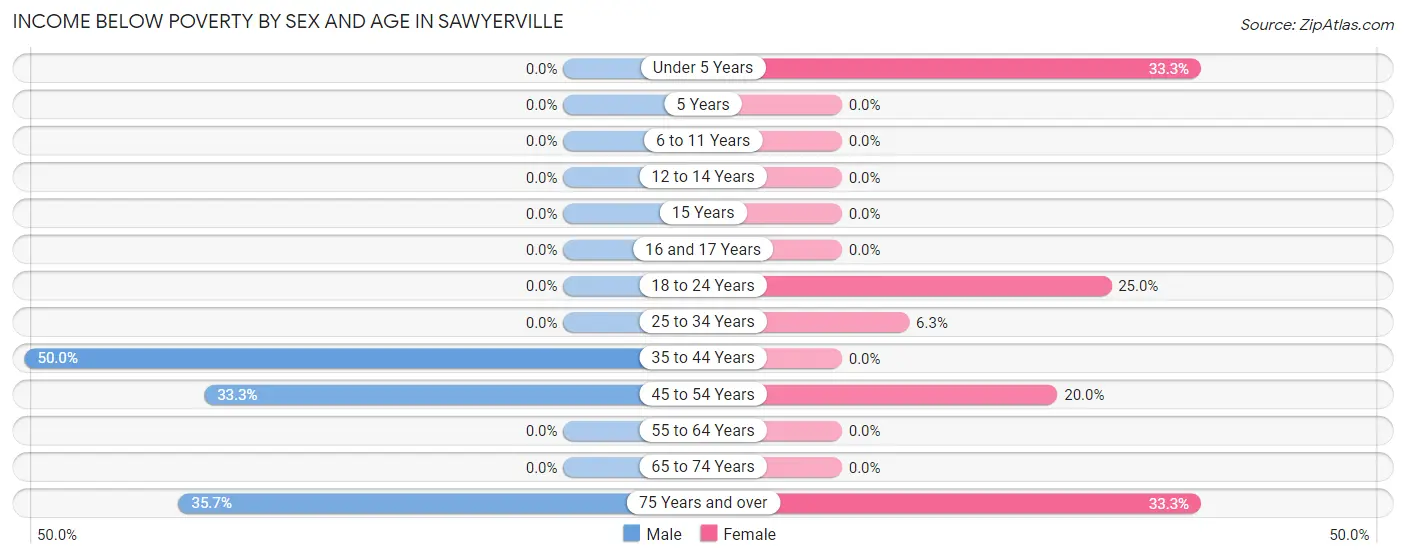
| Age Bracket | Male | Female |
| Under 5 Years | 0 (0.0%) | 1 (33.3%) |
| 5 Years | 0 (0.0%) | 0 (0.0%) |
| 6 to 11 Years | 0 (0.0%) | 0 (0.0%) |
| 12 to 14 Years | 0 (0.0%) | 0 (0.0%) |
| 15 Years | 0 (0.0%) | 0 (0.0%) |
| 16 and 17 Years | 0 (0.0%) | 0 (0.0%) |
| 18 to 24 Years | 0 (0.0%) | 2 (25.0%) |
| 25 to 34 Years | 0 (0.0%) | 1 (6.2%) |
| 35 to 44 Years | 1 (50.0%) | 0 (0.0%) |
| 45 to 54 Years | 1 (33.3%) | 1 (20.0%) |
| 55 to 64 Years | 0 (0.0%) | 0 (0.0%) |
| 65 to 74 Years | 0 (0.0%) | 0 (0.0%) |
| 75 Years and over | 5 (35.7%) | 2 (33.3%) |
| Total | 7 (7.3%) | 7 (7.1%) |
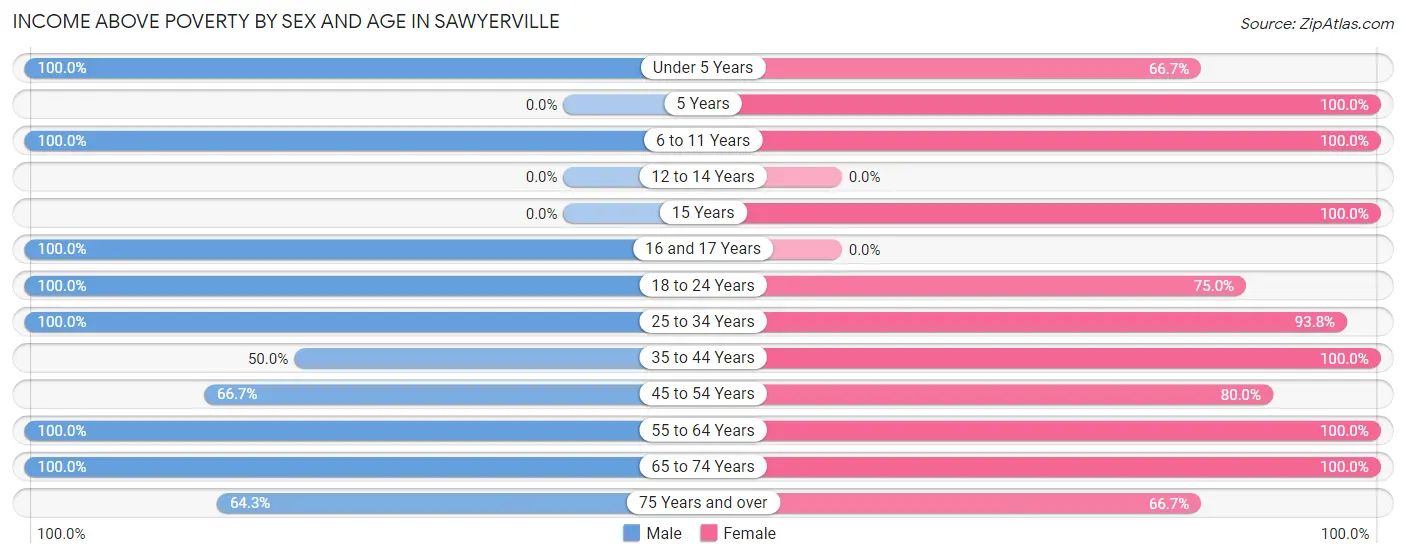
Income Above Poverty by Sex and Age in Sawyerville
According to the poverty statistics in Sawyerville, males aged under 5 years and females aged 5 years are the age groups that are most secure financially, with 100.0% of males and 100.0% of females in these age groups living above the poverty line.
| Age Bracket | Male | Female |
| Under 5 Years | 4 (100.0%) | 2 (66.7%) |
| 5 Years | 0 (0.0%) | 1 (100.0%) |
| 6 to 11 Years | 7 (100.0%) | 9 (100.0%) |
| 12 to 14 Years | 0 (0.0%) | 0 (0.0%) |
| 15 Years | 0 (0.0%) | 2 (100.0%) |
| 16 and 17 Years | 1 (100.0%) | 0 (0.0%) |
| 18 to 24 Years | 6 (100.0%) | 6 (75.0%) |
| 25 to 34 Years | 19 (100.0%) | 15 (93.8%) |
| 35 to 44 Years | 1 (50.0%) | 12 (100.0%) |
| 45 to 54 Years | 2 (66.7%) | 4 (80.0%) |
| 55 to 64 Years | 16 (100.0%) | 23 (100.0%) |
| 65 to 74 Years | 24 (100.0%) | 13 (100.0%) |
| 75 Years and over | 9 (64.3%) | 4 (66.7%) |
| Total | 89 (92.7%) | 91 (92.9%) |
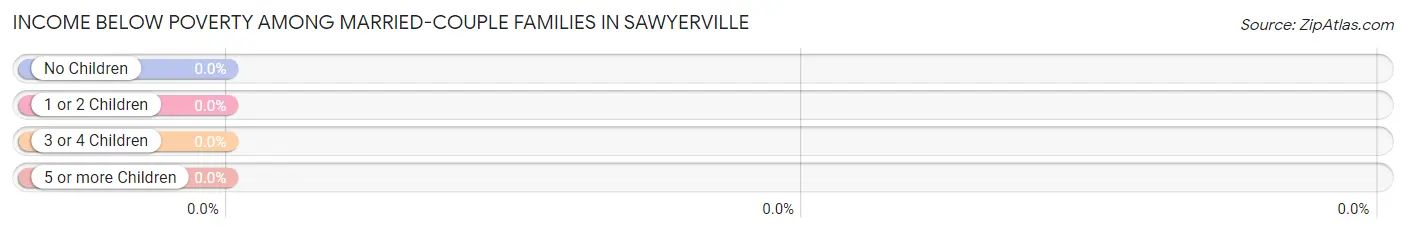
Income Below Poverty Among Married-Couple Families in Sawyerville
| Children | Above Poverty | Below Poverty |
| No Children | 14 (100.0%) | 0 (0.0%) |
| 1 or 2 Children | 2 (100.0%) | 0 (0.0%) |
| 3 or 4 Children | 4 (100.0%) | 0 (0.0%) |
| 5 or more Children | 0 (0.0%) | 0 (0.0%) |
| Total | 20 (100.0%) | 0 (0.0%) |
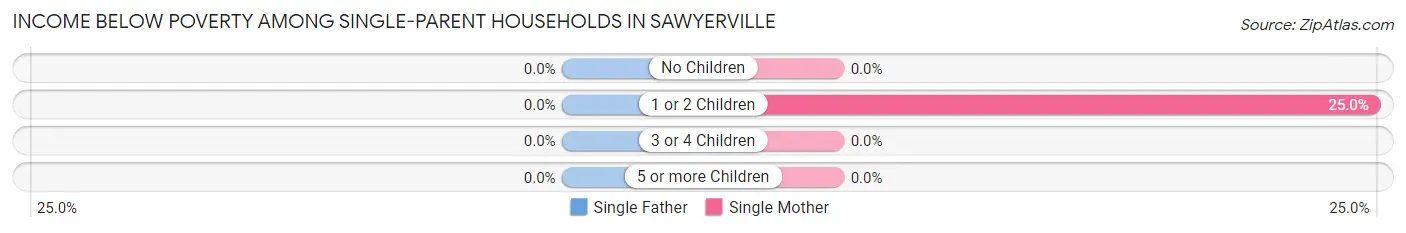
Income Below Poverty Among Single-Parent Households in Sawyerville
| Children | Single Father | Single Mother |
| No Children | 0 (0.0%) | 0 (0.0%) |
| 1 or 2 Children | 0 (0.0%) | 1 (25.0%) |
| 3 or 4 Children | 0 (0.0%) | 0 (0.0%) |
| 5 or more Children | 0 (0.0%) | 0 (0.0%) |
| Total | 0 (0.0%) | 1 (6.7%) |
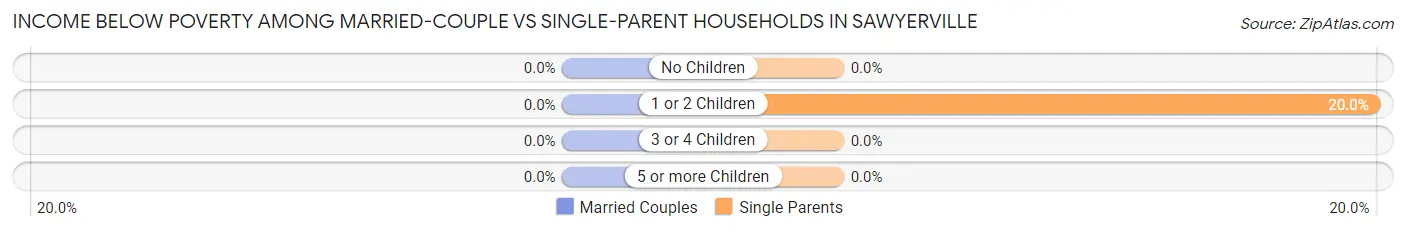
Income Below Poverty Among Married-Couple vs Single-Parent Households in Sawyerville
| Children | Married-Couple Families | Single-Parent Households |
| No Children | 0 (0.0%) | 0 (0.0%) |
| 1 or 2 Children | 0 (0.0%) | 1 (20.0%) |
| 3 or 4 Children | 0 (0.0%) | 0 (0.0%) |
| 5 or more Children | 0 (0.0%) | 0 (0.0%) |
| Total | 0 (0.0%) | 1 (5.0%) |
Employment Characteristics in Sawyerville
Employment by Class of Employer in Sawyerville
Among the 82 employed individuals in Sawyerville, private company employees (67 | 81.7%), state government employees (8 | 9.8%), and not-for-profit organizations (7 | 8.5%) make up the most common classes of employment.
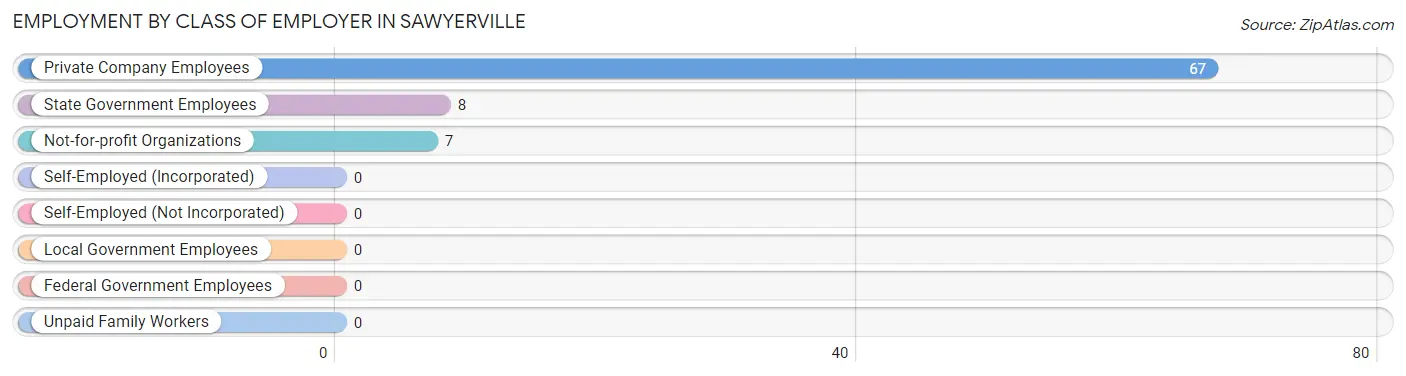
| Employer Class | # Employees | % Employees |
| Private Company Employees | 67 | 81.7% |
| Self-Employed (Incorporated) | 0 | 0.0% |
| Self-Employed (Not Incorporated) | 0 | 0.0% |
| Not-for-profit Organizations | 7 | 8.5% |
| Local Government Employees | 0 | 0.0% |
| State Government Employees | 8 | 9.8% |
| Federal Government Employees | 0 | 0.0% |
| Unpaid Family Workers | 0 | 0.0% |
| Total | 82 | 100.0% |
Employment Status by Age in Sawyerville
According to the labor force statistics for Sawyerville, out of the total population over 16 years of age (168), 52.4% or 88 individuals are in the labor force, with 5.7% or 5 of them unemployed. The age group with the highest labor force participation rate is 25 to 29 years, with 100.0% or 1 individuals in the labor force. Within the labor force, the 30 to 34 years age range has the highest percentage of unemployed individuals, with 13.3% or 4 of them being unemployed.
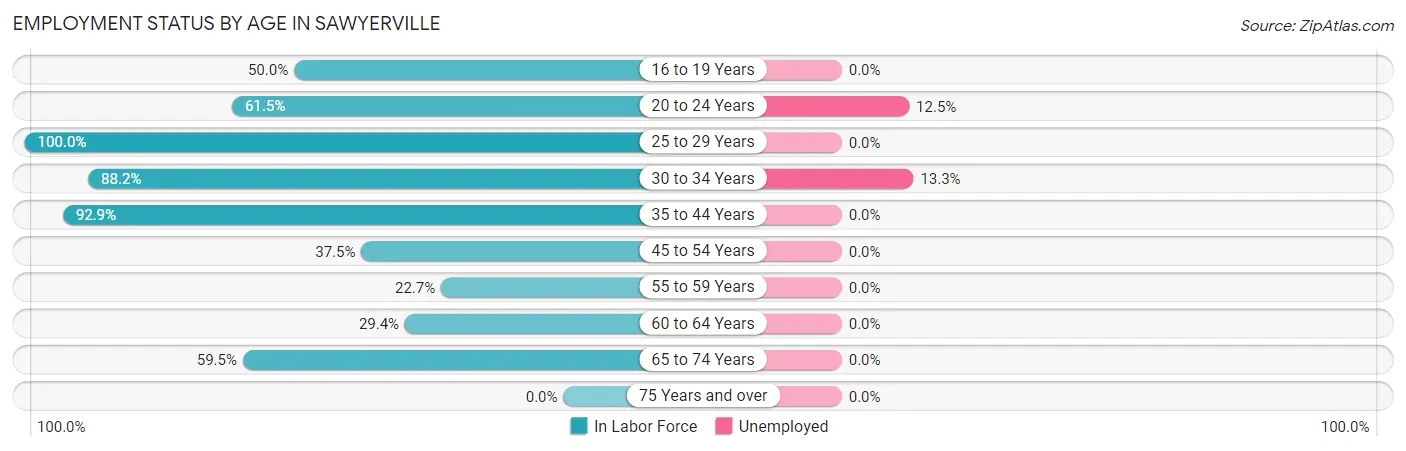
| Age Bracket | In Labor Force | Unemployed |
| 16 to 19 Years | 1 (50.0%) | 0 (0.0%) |
| 20 to 24 Years | 8 (61.5%) | 1 (12.5%) |
| 25 to 29 Years | 1 (100.0%) | 0 (0.0%) |
| 30 to 34 Years | 30 (88.2%) | 4 (13.3%) |
| 35 to 44 Years | 13 (92.9%) | 0 (0.0%) |
| 45 to 54 Years | 3 (37.5%) | 0 (0.0%) |
| 55 to 59 Years | 5 (22.7%) | 0 (0.0%) |
| 60 to 64 Years | 5 (29.4%) | 0 (0.0%) |
| 65 to 74 Years | 22 (59.5%) | 0 (0.0%) |
| 75 Years and over | 0 (0.0%) | 0 (0.0%) |
| Total | 88 (52.4%) | 5 (5.7%) |
Employment Status by Educational Attainment in Sawyerville
According to labor force statistics for Sawyerville, 59.4% of individuals (57) out of the total population between 25 and 64 years of age (96) are in the labor force, with 7.0% or 4 of them being unemployed. The group with the highest labor force participation rate are those with the educational attainment of less than high school, with 100.0% or 8 individuals in the labor force. Within the labor force, individuals with high school diploma education have the highest percentage of unemployment, with 28.6% or 4 of them being unemployed.
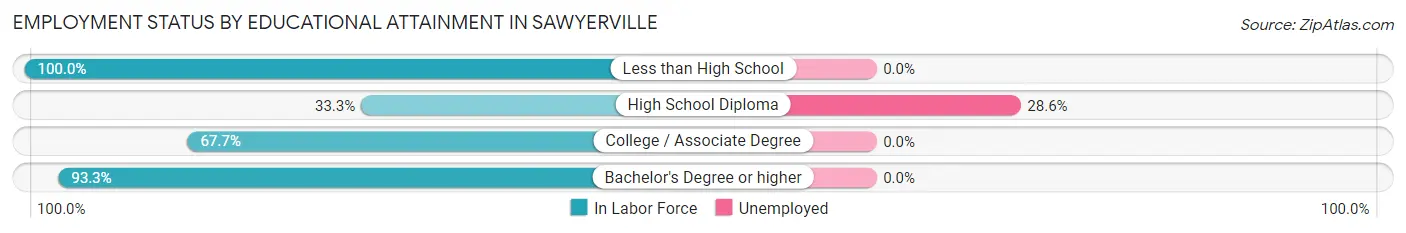
| Educational Attainment | In Labor Force | Unemployed |
| Less than High School | 8 (100.0%) | 0 (0.0%) |
| High School Diploma | 14 (33.3%) | 12 (28.6%) |
| College / Associate Degree | 21 (67.7%) | 0 (0.0%) |
| Bachelor's Degree or higher | 14 (93.3%) | 0 (0.0%) |
| Total | 57 (59.4%) | 7 (7.0%) |
Employment Occupations by Sex in Sawyerville
Management, Business, Science and Arts Occupations
The most common Management, Business, Science and Arts occupations in Sawyerville are Business & Financial (9 | 10.8%), Health Diagnosing & Treating (4 | 4.8%), Management (3 | 3.6%), Community & Social Service (3 | 3.6%), and Education Instruction & Library (3 | 3.6%).
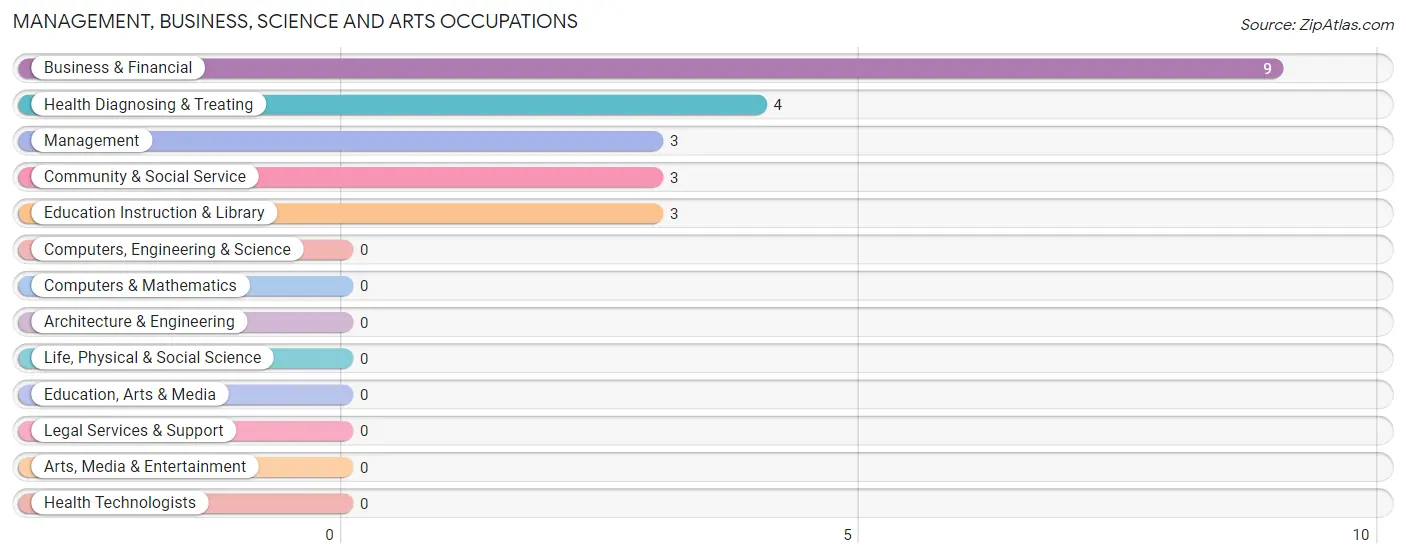
Management, Business, Science and Arts Occupations by Sex
Within the Management, Business, Science and Arts occupations in Sawyerville, the most male-oriented occupations are Management (66.7%), and Business & Financial (11.1%), while the most female-oriented occupations are Community & Social Service (100.0%), Education Instruction & Library (100.0%), and Health Diagnosing & Treating (100.0%).
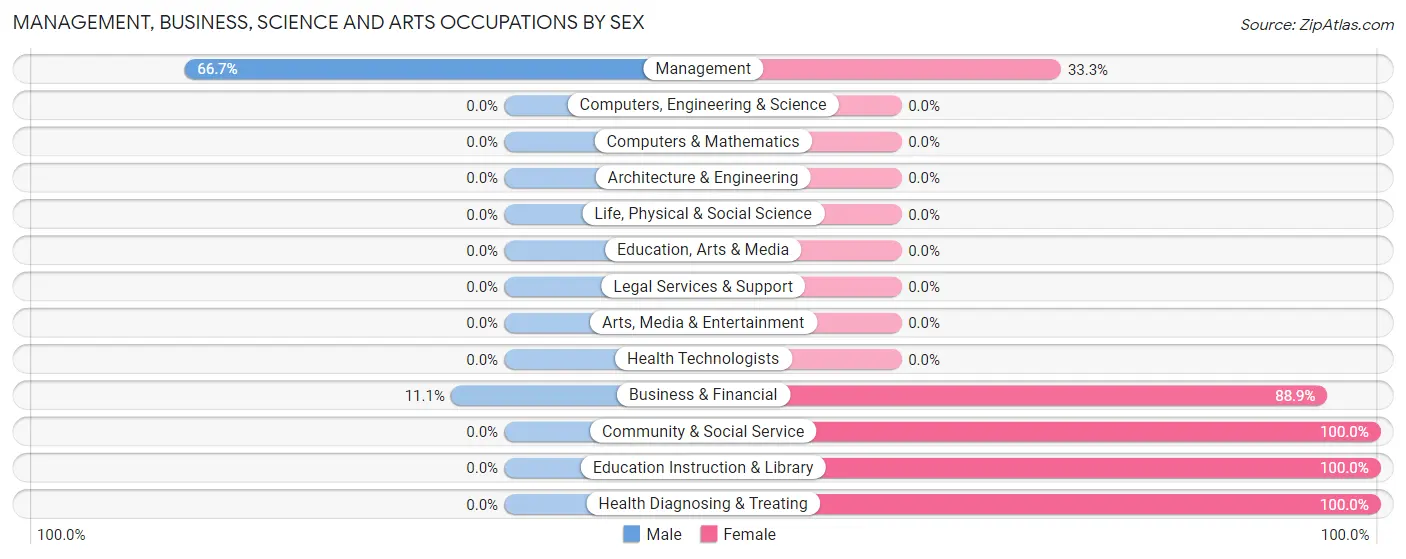
| Occupation | Male | Female |
| Management | 2 (66.7%) | 1 (33.3%) |
| Business & Financial | 1 (11.1%) | 8 (88.9%) |
| Computers, Engineering & Science | 0 (0.0%) | 0 (0.0%) |
| Computers & Mathematics | 0 (0.0%) | 0 (0.0%) |
| Architecture & Engineering | 0 (0.0%) | 0 (0.0%) |
| Life, Physical & Social Science | 0 (0.0%) | 0 (0.0%) |
| Community & Social Service | 0 (0.0%) | 3 (100.0%) |
| Education, Arts & Media | 0 (0.0%) | 0 (0.0%) |
| Legal Services & Support | 0 (0.0%) | 0 (0.0%) |
| Education Instruction & Library | 0 (0.0%) | 3 (100.0%) |
| Arts, Media & Entertainment | 0 (0.0%) | 0 (0.0%) |
| Health Diagnosing & Treating | 0 (0.0%) | 4 (100.0%) |
| Health Technologists | 0 (0.0%) | 0 (0.0%) |
| Total (Category) | 3 (15.8%) | 16 (84.2%) |
| Total (Overall) | 41 (49.4%) | 42 (50.6%) |
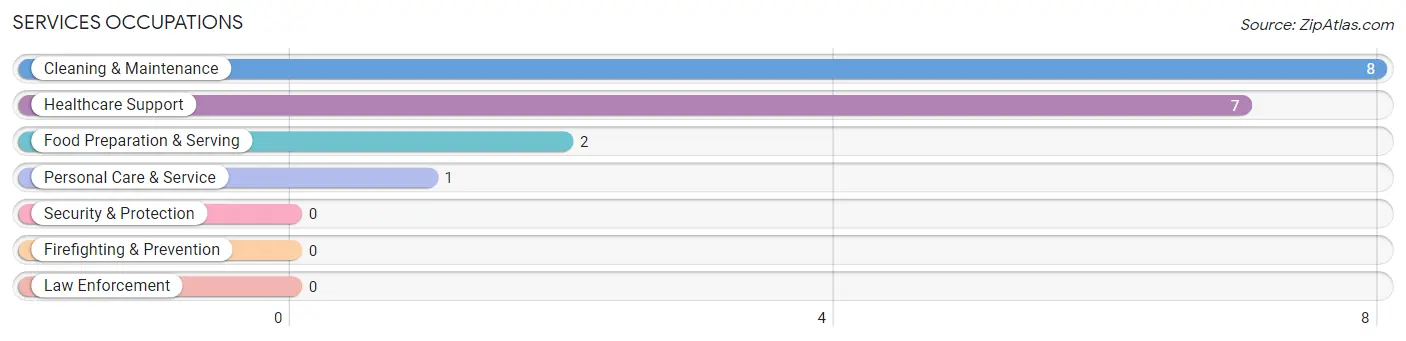
Services Occupations
The most common Services occupations in Sawyerville are Cleaning & Maintenance (8 | 9.6%), Healthcare Support (7 | 8.4%), Food Preparation & Serving (2 | 2.4%), and Personal Care & Service (1 | 1.2%).
Services Occupations by Sex
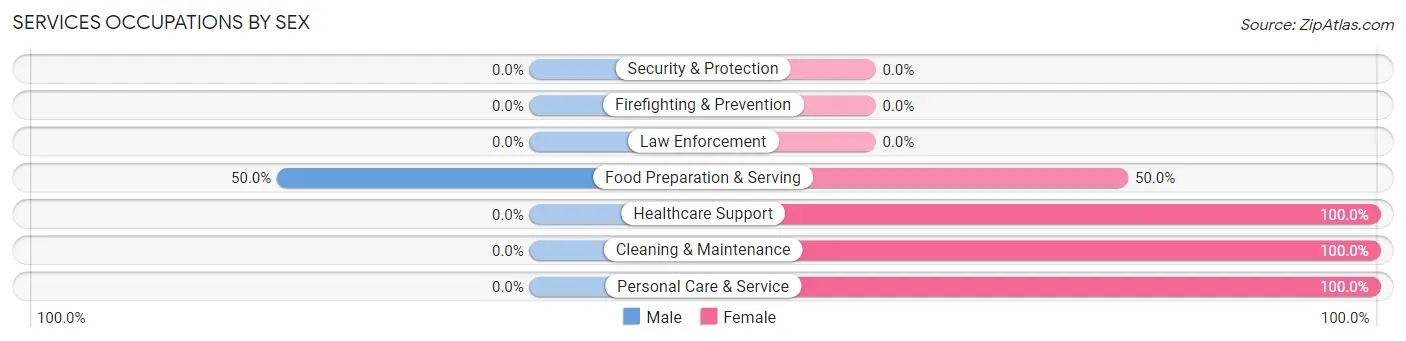
| Occupation | Male | Female |
| Healthcare Support | 0 (0.0%) | 7 (100.0%) |
| Security & Protection | 0 (0.0%) | 0 (0.0%) |
| Firefighting & Prevention | 0 (0.0%) | 0 (0.0%) |
| Law Enforcement | 0 (0.0%) | 0 (0.0%) |
| Food Preparation & Serving | 1 (50.0%) | 1 (50.0%) |
| Cleaning & Maintenance | 0 (0.0%) | 8 (100.0%) |
| Personal Care & Service | 0 (0.0%) | 1 (100.0%) |
| Total (Category) | 1 (5.6%) | 17 (94.4%) |
| Total (Overall) | 41 (49.4%) | 42 (50.6%) |
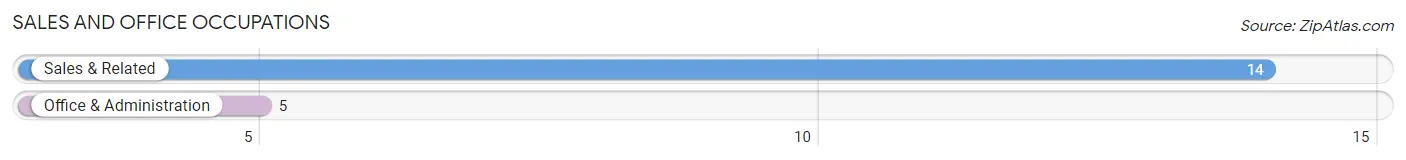
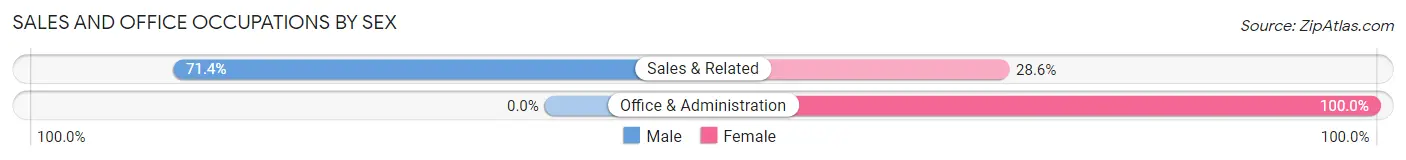
Sales and Office Occupations
The most common Sales and Office occupations in Sawyerville are Sales & Related (14 | 16.9%), and Office & Administration (5 | 6.0%).
Sales and Office Occupations by Sex
| Occupation | Male | Female |
| Sales & Related | 10 (71.4%) | 4 (28.6%) |
| Office & Administration | 0 (0.0%) | 5 (100.0%) |
| Total (Category) | 10 (52.6%) | 9 (47.4%) |
| Total (Overall) | 41 (49.4%) | 42 (50.6%) |
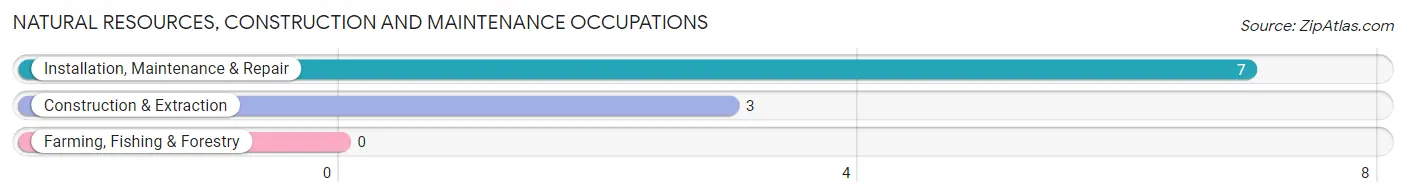
Natural Resources, Construction and Maintenance Occupations
The most common Natural Resources, Construction and Maintenance occupations in Sawyerville are Installation, Maintenance & Repair (7 | 8.4%), and Construction & Extraction (3 | 3.6%).
Natural Resources, Construction and Maintenance Occupations by Sex
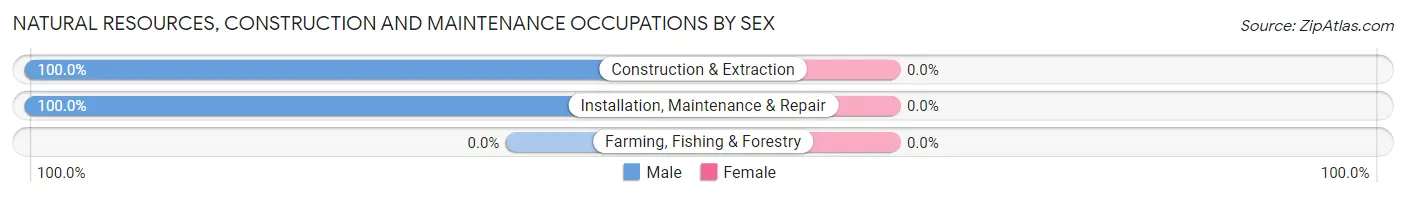
| Occupation | Male | Female |
| Farming, Fishing & Forestry | 0 (0.0%) | 0 (0.0%) |
| Construction & Extraction | 3 (100.0%) | 0 (0.0%) |
| Installation, Maintenance & Repair | 7 (100.0%) | 0 (0.0%) |
| Total (Category) | 10 (100.0%) | 0 (0.0%) |
| Total (Overall) | 41 (49.4%) | 42 (50.6%) |
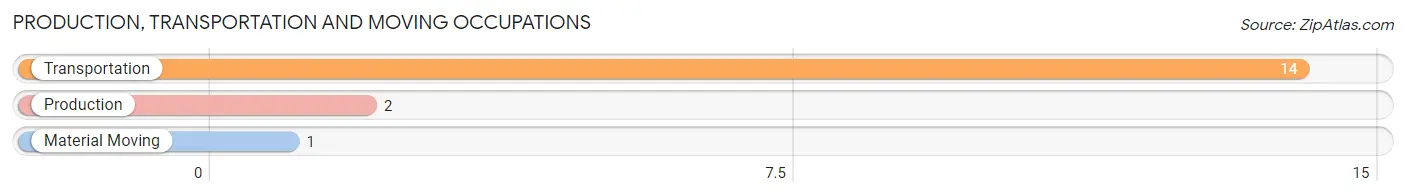
Production, Transportation and Moving Occupations
The most common Production, Transportation and Moving occupations in Sawyerville are Transportation (14 | 16.9%), Production (2 | 2.4%), and Material Moving (1 | 1.2%).
Production, Transportation and Moving Occupations by Sex
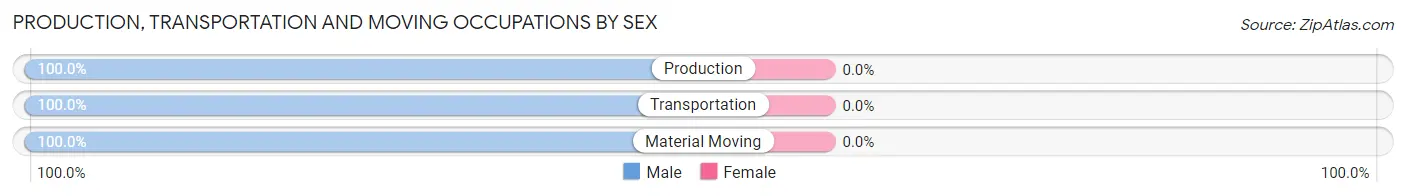
| Occupation | Male | Female |
| Production | 2 (100.0%) | 0 (0.0%) |
| Transportation | 14 (100.0%) | 0 (0.0%) |
| Material Moving | 1 (100.0%) | 0 (0.0%) |
| Total (Category) | 17 (100.0%) | 0 (0.0%) |
| Total (Overall) | 41 (49.4%) | 42 (50.6%) |
Employment Industries by Sex in Sawyerville
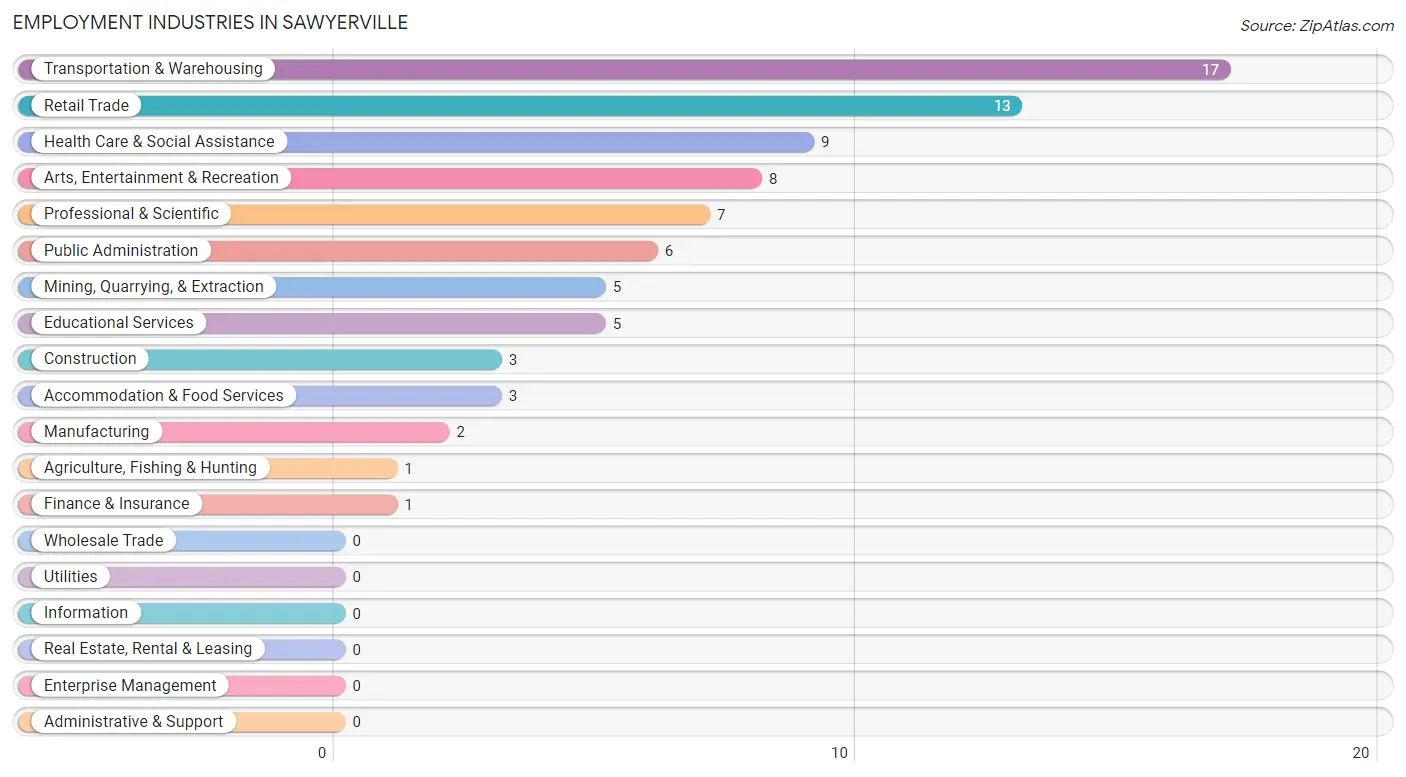
Employment Industries in Sawyerville
The major employment industries in Sawyerville include Transportation & Warehousing (17 | 20.5%), Retail Trade (13 | 15.7%), Health Care & Social Assistance (9 | 10.8%), Arts, Entertainment & Recreation (8 | 9.6%), and Professional & Scientific (7 | 8.4%).
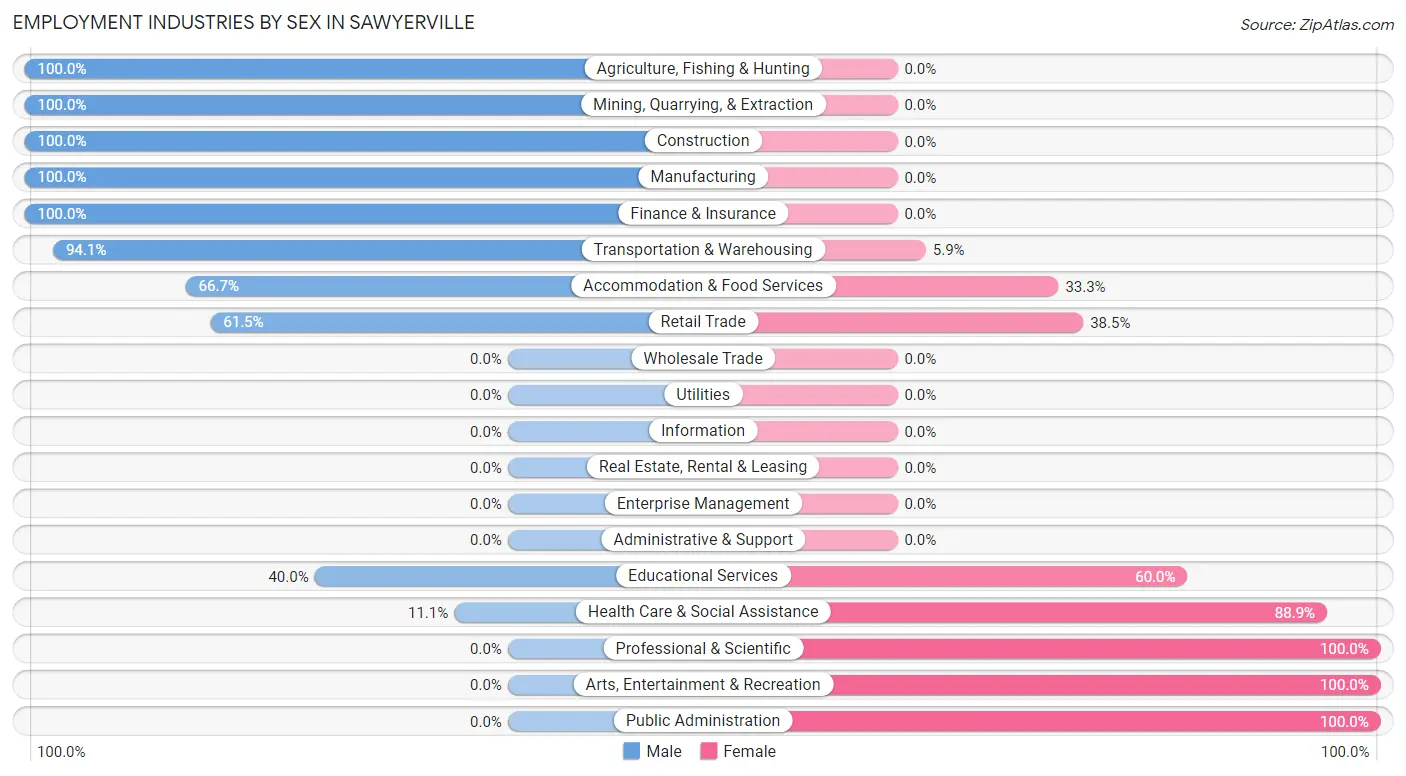
Employment Industries by Sex in Sawyerville
The Sawyerville industries that see more men than women are Agriculture, Fishing & Hunting (100.0%), Mining, Quarrying, & Extraction (100.0%), and Construction (100.0%), whereas the industries that tend to have a higher number of women are Professional & Scientific (100.0%), Arts, Entertainment & Recreation (100.0%), and Public Administration (100.0%).
| Industry | Male | Female |
| Agriculture, Fishing & Hunting | 1 (100.0%) | 0 (0.0%) |
| Mining, Quarrying, & Extraction | 5 (100.0%) | 0 (0.0%) |
| Construction | 3 (100.0%) | 0 (0.0%) |
| Manufacturing | 2 (100.0%) | 0 (0.0%) |
| Wholesale Trade | 0 (0.0%) | 0 (0.0%) |
| Retail Trade | 8 (61.5%) | 5 (38.5%) |
| Transportation & Warehousing | 16 (94.1%) | 1 (5.9%) |
| Utilities | 0 (0.0%) | 0 (0.0%) |
| Information | 0 (0.0%) | 0 (0.0%) |
| Finance & Insurance | 1 (100.0%) | 0 (0.0%) |
| Real Estate, Rental & Leasing | 0 (0.0%) | 0 (0.0%) |
| Professional & Scientific | 0 (0.0%) | 7 (100.0%) |
| Enterprise Management | 0 (0.0%) | 0 (0.0%) |
| Administrative & Support | 0 (0.0%) | 0 (0.0%) |
| Educational Services | 2 (40.0%) | 3 (60.0%) |
| Health Care & Social Assistance | 1 (11.1%) | 8 (88.9%) |
| Arts, Entertainment & Recreation | 0 (0.0%) | 8 (100.0%) |
| Accommodation & Food Services | 2 (66.7%) | 1 (33.3%) |
| Public Administration | 0 (0.0%) | 6 (100.0%) |
| Total | 41 (49.4%) | 42 (50.6%) |
Education in Sawyerville
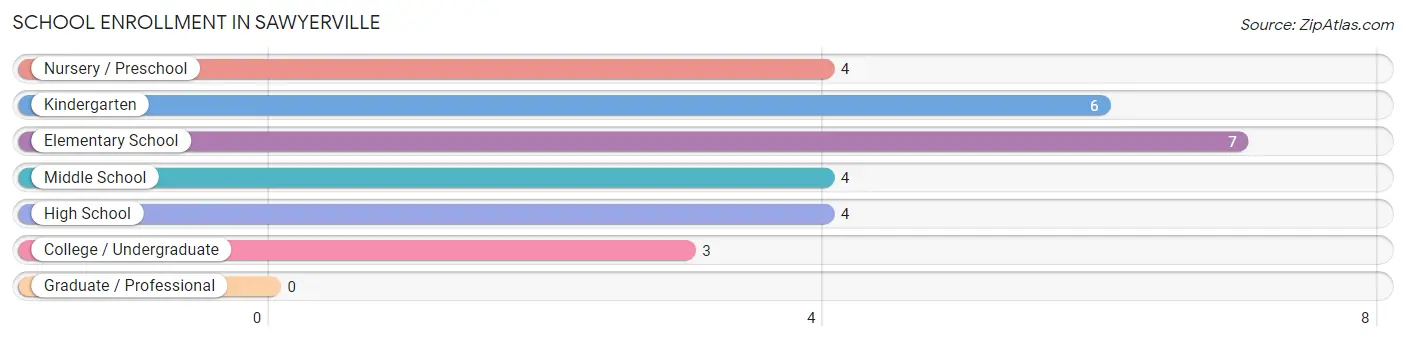
School Enrollment in Sawyerville
The most common levels of schooling among the 28 students in Sawyerville are elementary school (7 | 25.0%), kindergarten (6 | 21.4%), and nursery / preschool (4 | 14.3%).
| School Level | # Students | % Students |
| Nursery / Preschool | 4 | 14.3% |
| Kindergarten | 6 | 21.4% |
| Elementary School | 7 | 25.0% |
| Middle School | 4 | 14.3% |
| High School | 4 | 14.3% |
| College / Undergraduate | 3 | 10.7% |
| Graduate / Professional | 0 | 0.0% |
| Total | 28 | 100.0% |
School Enrollment by Age by Funding Source in Sawyerville
Out of a total of 28 students who are enrolled in schools in Sawyerville, 1 (3.6%) attend a private institution, while the remaining 27 (96.4%) are enrolled in public schools. The age group of 3 to 4 year olds has the highest likelihood of being enrolled in private schools, with 1 (33.3% in the age bracket) enrolled. Conversely, the age group of 5 to 9 year old has the lowest likelihood of being enrolled in a private school, with 8 (100.0% in the age bracket) attending a public institution.
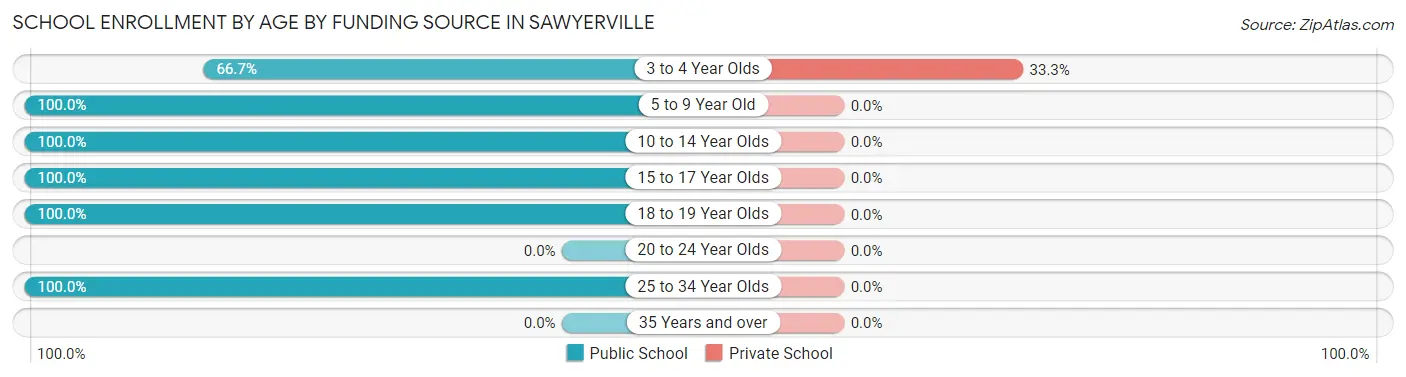
| Age Bracket | Public School | Private School |
| 3 to 4 Year Olds | 2 (66.7%) | 1 (33.3%) |
| 5 to 9 Year Old | 8 (100.0%) | 0 (0.0%) |
| 10 to 14 Year Olds | 10 (100.0%) | 0 (0.0%) |
| 15 to 17 Year Olds | 3 (100.0%) | 0 (0.0%) |
| 18 to 19 Year Olds | 1 (100.0%) | 0 (0.0%) |
| 20 to 24 Year Olds | 0 (0.0%) | 0 (0.0%) |
| 25 to 34 Year Olds | 3 (100.0%) | 0 (0.0%) |
| 35 Years and over | 0 (0.0%) | 0 (0.0%) |
| Total | 27 (96.4%) | 1 (3.6%) |
Educational Attainment by Field of Study in Sawyerville
Bio, nature & agricultural (7 | 29.2%), education (6 | 25.0%), business (5 | 20.8%), science & technology (2 | 8.3%), and visual & performing arts (2 | 8.3%) are the most common fields of study among 24 individuals in Sawyerville who have obtained a bachelor's degree or higher.
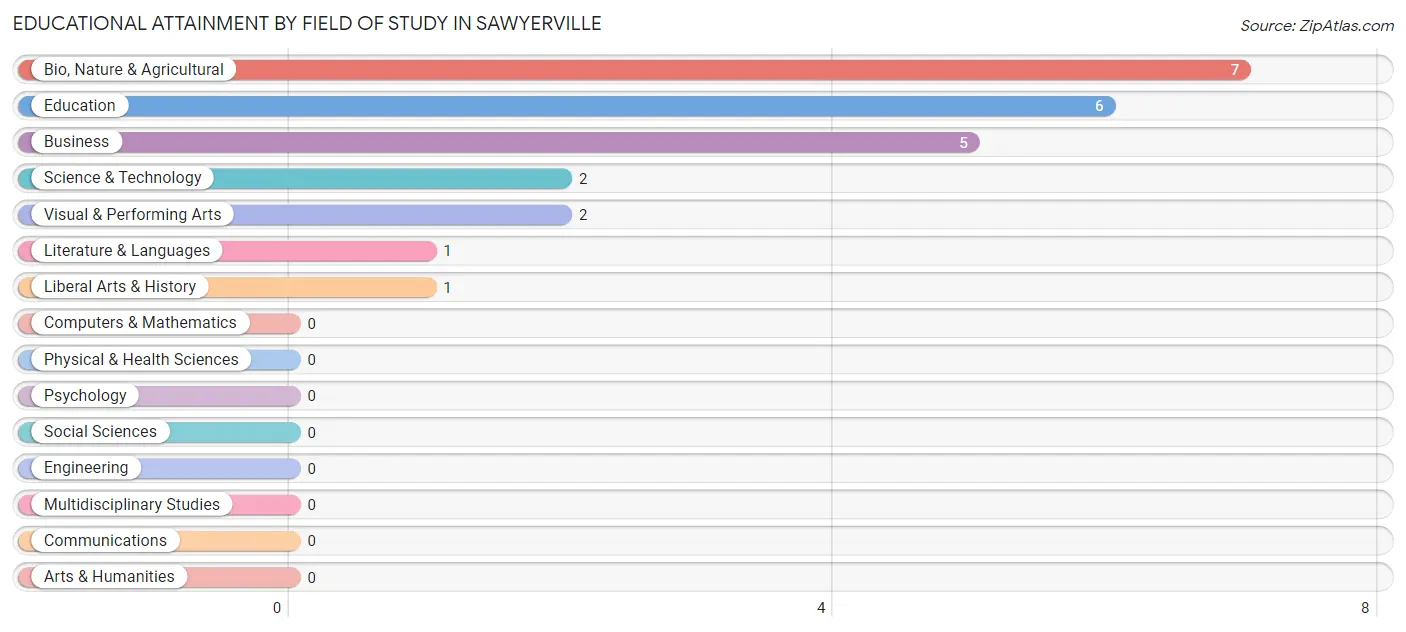
| Field of Study | # Graduates | % Graduates |
| Computers & Mathematics | 0 | 0.0% |
| Bio, Nature & Agricultural | 7 | 29.2% |
| Physical & Health Sciences | 0 | 0.0% |
| Psychology | 0 | 0.0% |
| Social Sciences | 0 | 0.0% |
| Engineering | 0 | 0.0% |
| Multidisciplinary Studies | 0 | 0.0% |
| Science & Technology | 2 | 8.3% |
| Business | 5 | 20.8% |
| Education | 6 | 25.0% |
| Literature & Languages | 1 | 4.2% |
| Liberal Arts & History | 1 | 4.2% |
| Visual & Performing Arts | 2 | 8.3% |
| Communications | 0 | 0.0% |
| Arts & Humanities | 0 | 0.0% |
| Total | 24 | 100.0% |
Transportation & Commute in Sawyerville
Vehicle Availability by Sex in Sawyerville
The most prevalent vehicle ownership categories in Sawyerville are males with 5 or more vehicles (17, accounting for 42.5%) and females with 5 or more vehicles (10, making up 40.5%).
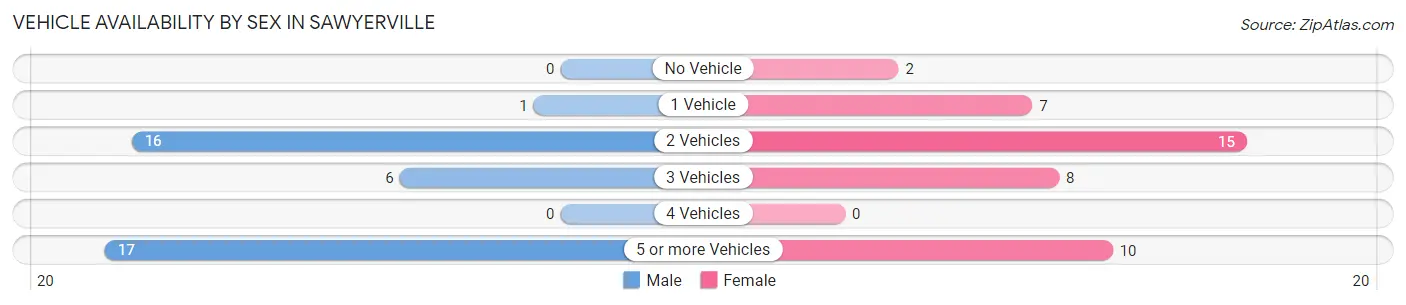
| Vehicles Available | Male | Female |
| No Vehicle | 0 (0.0%) | 2 (4.8%) |
| 1 Vehicle | 1 (2.5%) | 7 (16.7%) |
| 2 Vehicles | 16 (40.0%) | 15 (35.7%) |
| 3 Vehicles | 6 (15.0%) | 8 (19.1%) |
| 4 Vehicles | 0 (0.0%) | 0 (0.0%) |
| 5 or more Vehicles | 17 (42.5%) | 10 (23.8%) |
| Total | 40 (100.0%) | 42 (100.0%) |
Commute Time in Sawyerville
The most frequently occuring commute durations in Sawyerville are 45 to 59 minutes (23 commuters, 29.9%), 60 to 89 minutes (20 commuters, 26.0%), and 20 to 24 minutes (9 commuters, 11.7%).
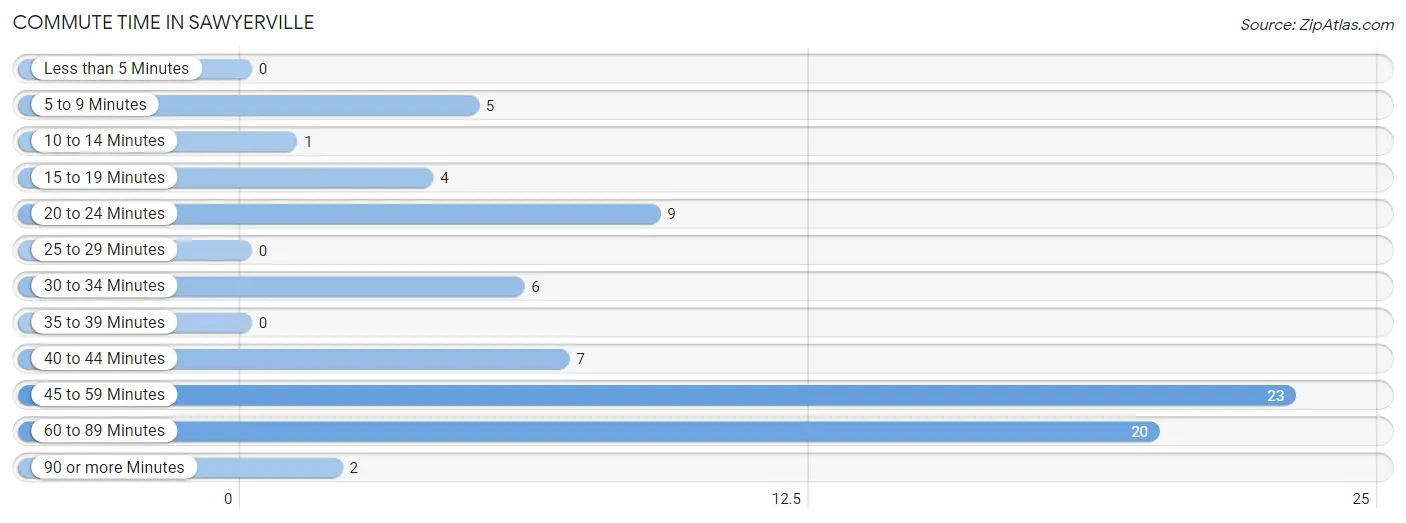
| Commute Time | # Commuters | % Commuters |
| Less than 5 Minutes | 0 | 0.0% |
| 5 to 9 Minutes | 5 | 6.5% |
| 10 to 14 Minutes | 1 | 1.3% |
| 15 to 19 Minutes | 4 | 5.2% |
| 20 to 24 Minutes | 9 | 11.7% |
| 25 to 29 Minutes | 0 | 0.0% |
| 30 to 34 Minutes | 6 | 7.8% |
| 35 to 39 Minutes | 0 | 0.0% |
| 40 to 44 Minutes | 7 | 9.1% |
| 45 to 59 Minutes | 23 | 29.9% |
| 60 to 89 Minutes | 20 | 26.0% |
| 90 or more Minutes | 2 | 2.6% |
Commute Time by Sex in Sawyerville
The most common commute times in Sawyerville are 60 to 89 minutes (18 commuters, 45.0%) for males and 45 to 59 minutes (12 commuters, 32.4%) for females.
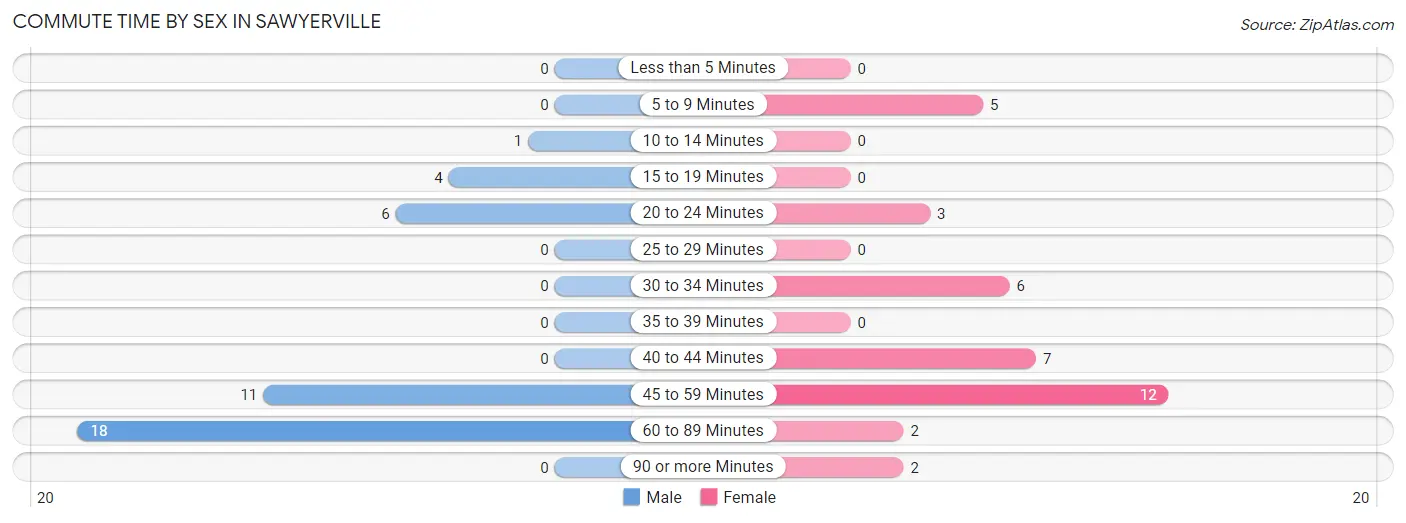
| Commute Time | Male | Female |
| Less than 5 Minutes | 0 (0.0%) | 0 (0.0%) |
| 5 to 9 Minutes | 0 (0.0%) | 5 (13.5%) |
| 10 to 14 Minutes | 1 (2.5%) | 0 (0.0%) |
| 15 to 19 Minutes | 4 (10.0%) | 0 (0.0%) |
| 20 to 24 Minutes | 6 (15.0%) | 3 (8.1%) |
| 25 to 29 Minutes | 0 (0.0%) | 0 (0.0%) |
| 30 to 34 Minutes | 0 (0.0%) | 6 (16.2%) |
| 35 to 39 Minutes | 0 (0.0%) | 0 (0.0%) |
| 40 to 44 Minutes | 0 (0.0%) | 7 (18.9%) |
| 45 to 59 Minutes | 11 (27.5%) | 12 (32.4%) |
| 60 to 89 Minutes | 18 (45.0%) | 2 (5.4%) |
| 90 or more Minutes | 0 (0.0%) | 2 (5.4%) |
Time of Departure to Work by Sex in Sawyerville
The most frequent times of departure to work in Sawyerville are 4:00 PM to 11:59 PM (15, 37.5%) for males and 4:00 PM to 11:59 PM (11, 29.7%) for females.
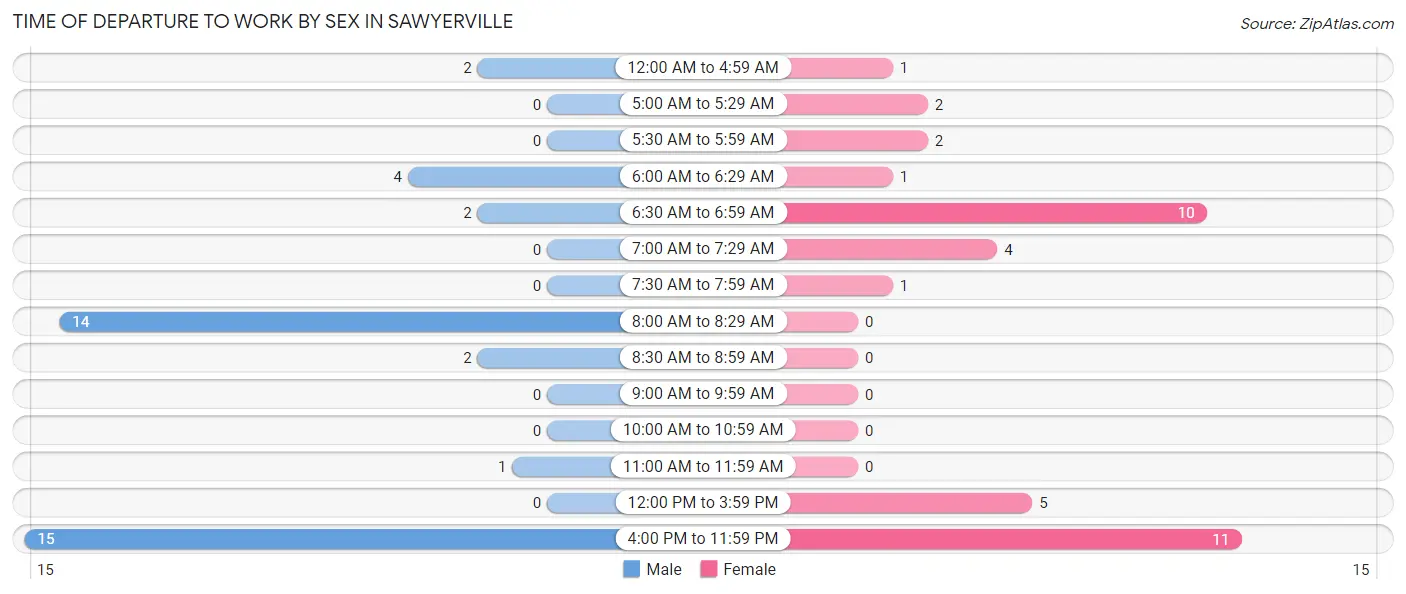
| Time of Departure | Male | Female |
| 12:00 AM to 4:59 AM | 2 (5.0%) | 1 (2.7%) |
| 5:00 AM to 5:29 AM | 0 (0.0%) | 2 (5.4%) |
| 5:30 AM to 5:59 AM | 0 (0.0%) | 2 (5.4%) |
| 6:00 AM to 6:29 AM | 4 (10.0%) | 1 (2.7%) |
| 6:30 AM to 6:59 AM | 2 (5.0%) | 10 (27.0%) |
| 7:00 AM to 7:29 AM | 0 (0.0%) | 4 (10.8%) |
| 7:30 AM to 7:59 AM | 0 (0.0%) | 1 (2.7%) |
| 8:00 AM to 8:29 AM | 14 (35.0%) | 0 (0.0%) |
| 8:30 AM to 8:59 AM | 2 (5.0%) | 0 (0.0%) |
| 9:00 AM to 9:59 AM | 0 (0.0%) | 0 (0.0%) |
| 10:00 AM to 10:59 AM | 0 (0.0%) | 0 (0.0%) |
| 11:00 AM to 11:59 AM | 1 (2.5%) | 0 (0.0%) |
| 12:00 PM to 3:59 PM | 0 (0.0%) | 5 (13.5%) |
| 4:00 PM to 11:59 PM | 15 (37.5%) | 11 (29.7%) |
| Total | 40 (100.0%) | 37 (100.0%) |
Housing Occupancy in Sawyerville
Occupancy by Ownership in Sawyerville
Of the total 83 dwellings in Sawyerville, owner-occupied units account for 65 (78.3%), while renter-occupied units make up 18 (21.7%).
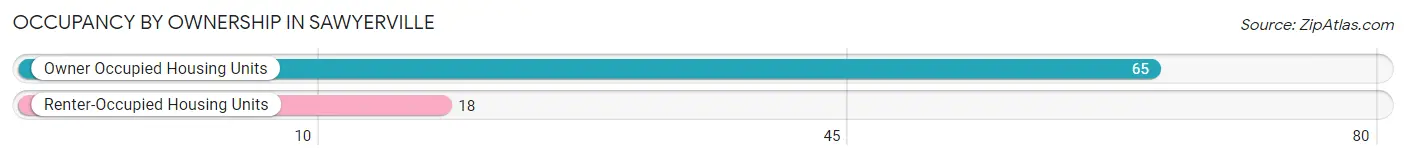
| Occupancy | # Housing Units | % Housing Units |
| Owner Occupied Housing Units | 65 | 78.3% |
| Renter-Occupied Housing Units | 18 | 21.7% |
| Total Occupied Housing Units | 83 | 100.0% |
Occupancy by Household Size in Sawyerville
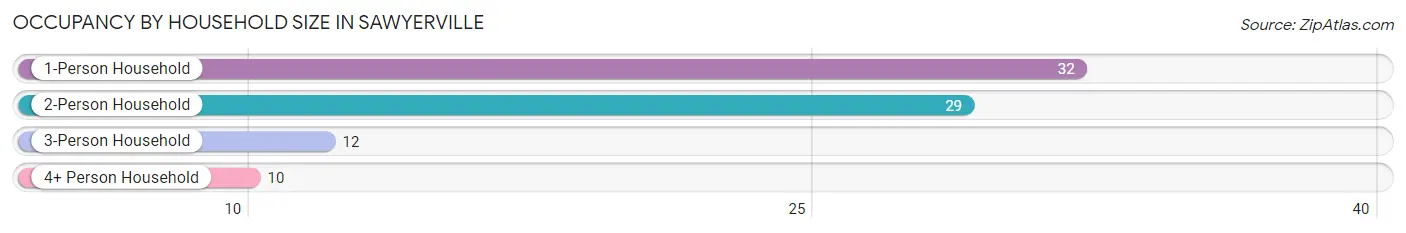
| Household Size | # Housing Units | % Housing Units |
| 1-Person Household | 32 | 38.6% |
| 2-Person Household | 29 | 34.9% |
| 3-Person Household | 12 | 14.5% |
| 4+ Person Household | 10 | 12.0% |
| Total Housing Units | 83 | 100.0% |
Occupancy by Ownership by Household Size in Sawyerville
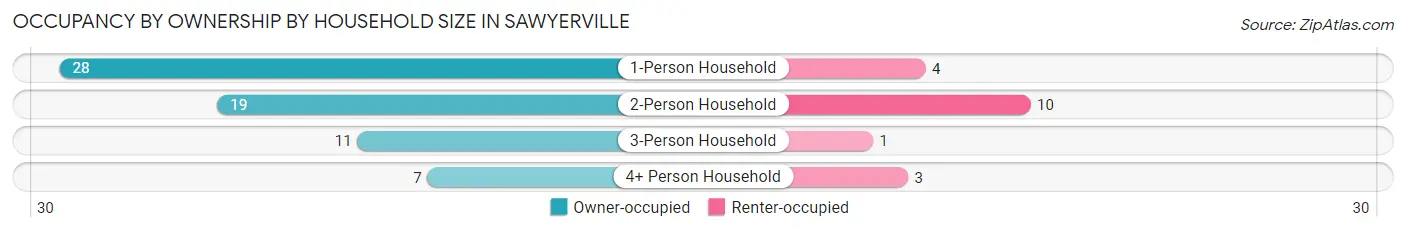
| Household Size | Owner-occupied | Renter-occupied |
| 1-Person Household | 28 (87.5%) | 4 (12.5%) |
| 2-Person Household | 19 (65.5%) | 10 (34.5%) |
| 3-Person Household | 11 (91.7%) | 1 (8.3%) |
| 4+ Person Household | 7 (70.0%) | 3 (30.0%) |
| Total Housing Units | 65 (78.3%) | 18 (21.7%) |
Occupancy by Educational Attainment in Sawyerville
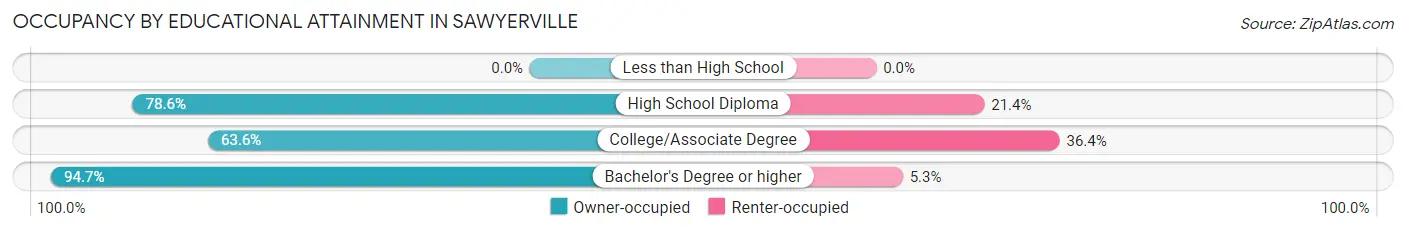
| Household Size | Owner-occupied | Renter-occupied |
| Less than High School | 0 (0.0%) | 0 (0.0%) |
| High School Diploma | 33 (78.6%) | 9 (21.4%) |
| College/Associate Degree | 14 (63.6%) | 8 (36.4%) |
| Bachelor's Degree or higher | 18 (94.7%) | 1 (5.3%) |
Occupancy by Age of Householder in Sawyerville
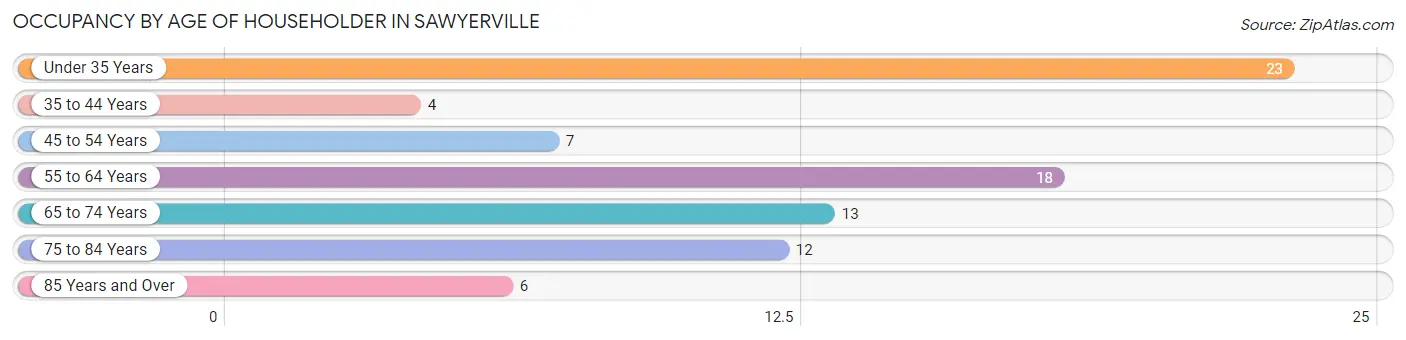
| Age Bracket | # Households | % Households |
| Under 35 Years | 23 | 27.7% |
| 35 to 44 Years | 4 | 4.8% |
| 45 to 54 Years | 7 | 8.4% |
| 55 to 64 Years | 18 | 21.7% |
| 65 to 74 Years | 13 | 15.7% |
| 75 to 84 Years | 12 | 14.5% |
| 85 Years and Over | 6 | 7.2% |
| Total | 83 | 100.0% |
Housing Finances in Sawyerville
Median Income by Occupancy in Sawyerville
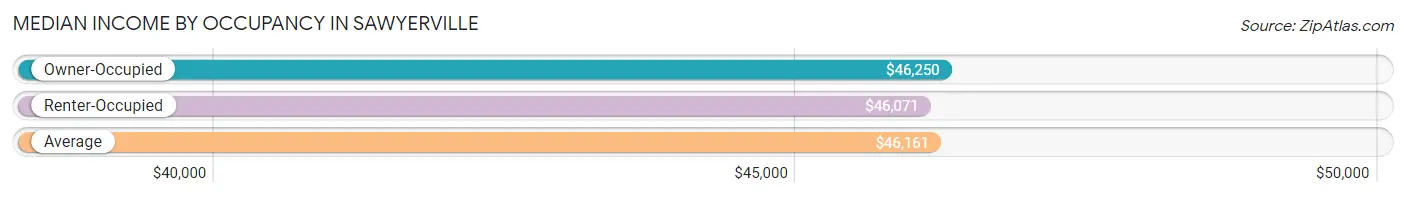
| Occupancy Type | # Households | Median Income |
| Owner-Occupied | 65 (78.3%) | $46,250 |
| Renter-Occupied | 18 (21.7%) | $46,071 |
| Average | 83 (100.0%) | $46,161 |
Occupancy by Householder Income Bracket in Sawyerville
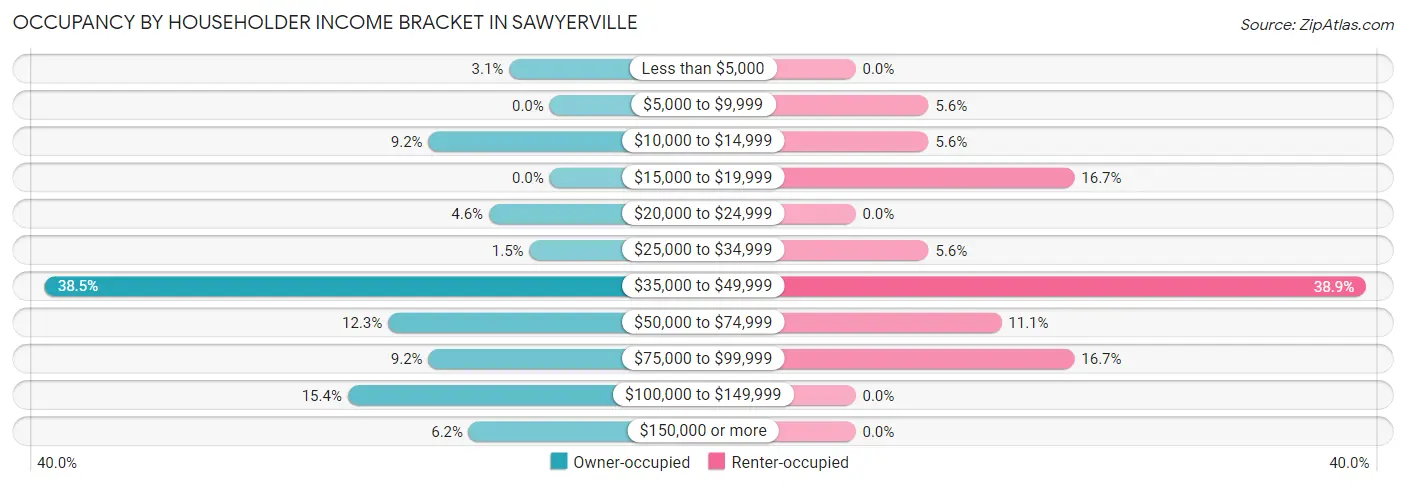
| Income Bracket | Owner-occupied | Renter-occupied |
| Less than $5,000 | 2 (3.1%) | 0 (0.0%) |
| $5,000 to $9,999 | 0 (0.0%) | 1 (5.6%) |
| $10,000 to $14,999 | 6 (9.2%) | 1 (5.6%) |
| $15,000 to $19,999 | 0 (0.0%) | 3 (16.7%) |
| $20,000 to $24,999 | 3 (4.6%) | 0 (0.0%) |
| $25,000 to $34,999 | 1 (1.5%) | 1 (5.6%) |
| $35,000 to $49,999 | 25 (38.5%) | 7 (38.9%) |
| $50,000 to $74,999 | 8 (12.3%) | 2 (11.1%) |
| $75,000 to $99,999 | 6 (9.2%) | 3 (16.7%) |
| $100,000 to $149,999 | 10 (15.4%) | 0 (0.0%) |
| $150,000 or more | 4 (6.1%) | 0 (0.0%) |
| Total | 65 (100.0%) | 18 (100.0%) |
Monthly Housing Cost Tiers in Sawyerville
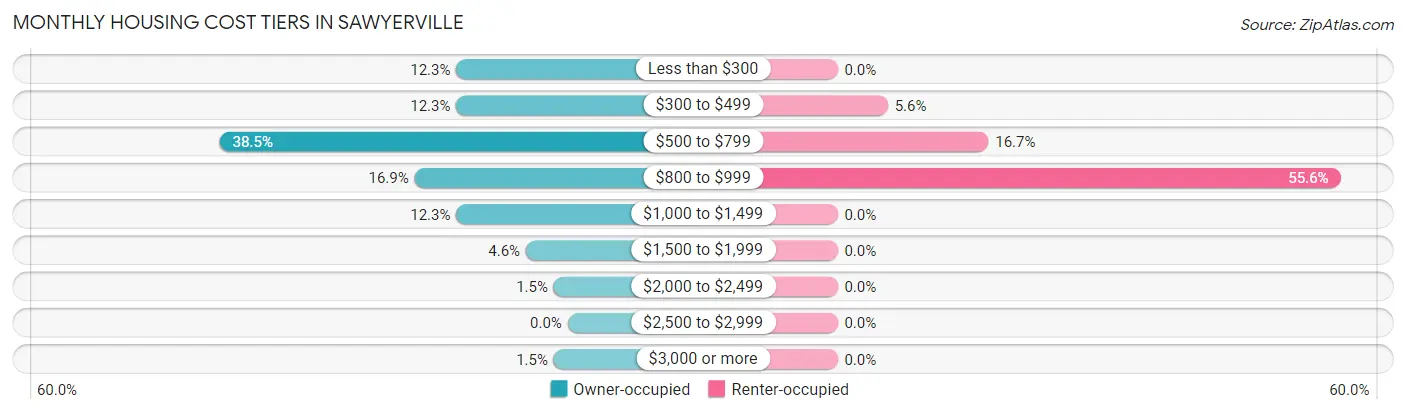
| Monthly Cost | Owner-occupied | Renter-occupied |
| Less than $300 | 8 (12.3%) | 0 (0.0%) |
| $300 to $499 | 8 (12.3%) | 1 (5.6%) |
| $500 to $799 | 25 (38.5%) | 3 (16.7%) |
| $800 to $999 | 11 (16.9%) | 10 (55.6%) |
| $1,000 to $1,499 | 8 (12.3%) | 0 (0.0%) |
| $1,500 to $1,999 | 3 (4.6%) | 0 (0.0%) |
| $2,000 to $2,499 | 1 (1.5%) | 0 (0.0%) |
| $2,500 to $2,999 | 0 (0.0%) | 0 (0.0%) |
| $3,000 or more | 1 (1.5%) | 0 (0.0%) |
| Total | 65 (100.0%) | 18 (100.0%) |
Physical Housing Characteristics in Sawyerville
Housing Structures in Sawyerville
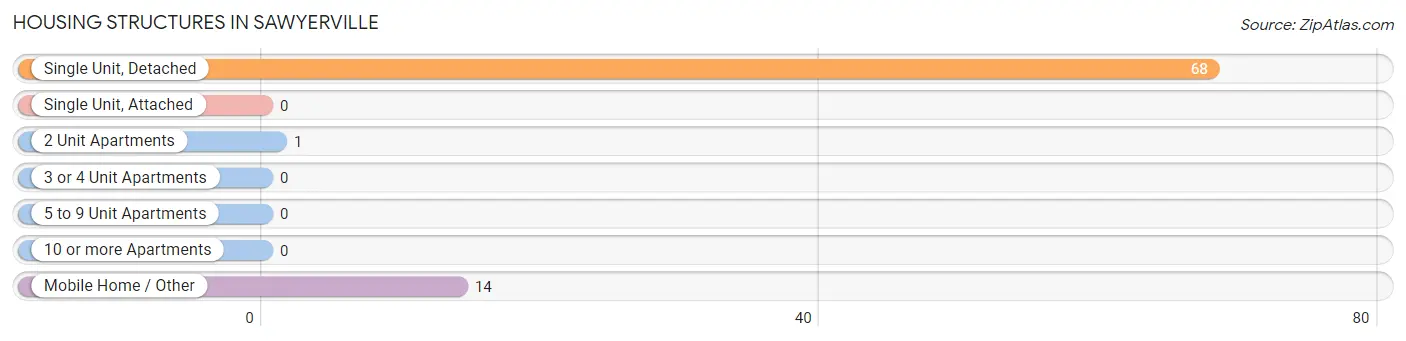
| Structure Type | # Housing Units | % Housing Units |
| Single Unit, Detached | 68 | 81.9% |
| Single Unit, Attached | 0 | 0.0% |
| 2 Unit Apartments | 1 | 1.2% |
| 3 or 4 Unit Apartments | 0 | 0.0% |
| 5 to 9 Unit Apartments | 0 | 0.0% |
| 10 or more Apartments | 0 | 0.0% |
| Mobile Home / Other | 14 | 16.9% |
| Total | 83 | 100.0% |
Housing Structures by Occupancy in Sawyerville
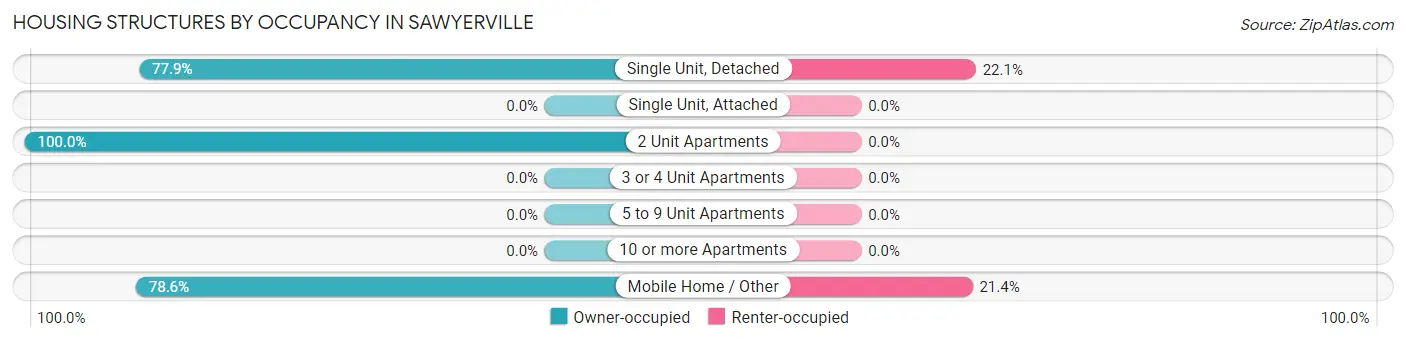
| Structure Type | Owner-occupied | Renter-occupied |
| Single Unit, Detached | 53 (77.9%) | 15 (22.1%) |
| Single Unit, Attached | 0 (0.0%) | 0 (0.0%) |
| 2 Unit Apartments | 1 (100.0%) | 0 (0.0%) |
| 3 or 4 Unit Apartments | 0 (0.0%) | 0 (0.0%) |
| 5 to 9 Unit Apartments | 0 (0.0%) | 0 (0.0%) |
| 10 or more Apartments | 0 (0.0%) | 0 (0.0%) |
| Mobile Home / Other | 11 (78.6%) | 3 (21.4%) |
| Total | 65 (78.3%) | 18 (21.7%) |
Housing Structures by Number of Rooms in Sawyerville
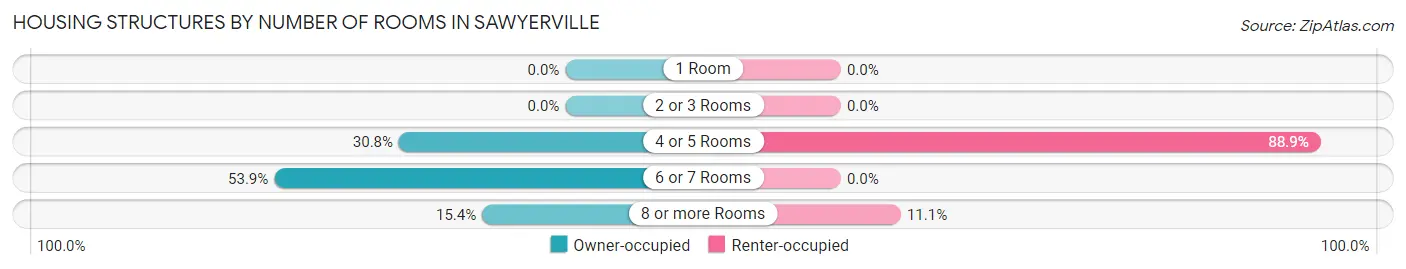
| Number of Rooms | Owner-occupied | Renter-occupied |
| 1 Room | 0 (0.0%) | 0 (0.0%) |
| 2 or 3 Rooms | 0 (0.0%) | 0 (0.0%) |
| 4 or 5 Rooms | 20 (30.8%) | 16 (88.9%) |
| 6 or 7 Rooms | 35 (53.8%) | 0 (0.0%) |
| 8 or more Rooms | 10 (15.4%) | 2 (11.1%) |
| Total | 65 (100.0%) | 18 (100.0%) |
Housing Structure by Heating Type in Sawyerville
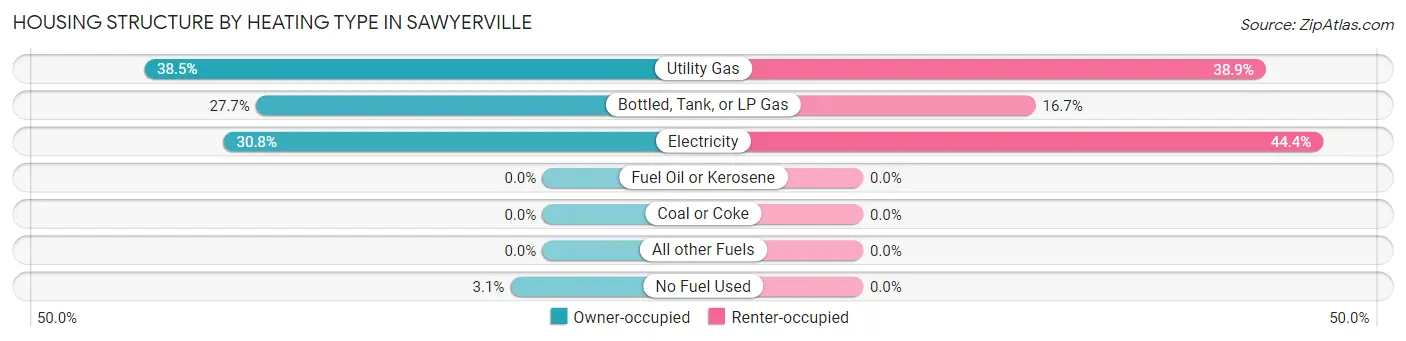
| Heating Type | Owner-occupied | Renter-occupied |
| Utility Gas | 25 (38.5%) | 7 (38.9%) |
| Bottled, Tank, or LP Gas | 18 (27.7%) | 3 (16.7%) |
| Electricity | 20 (30.8%) | 8 (44.4%) |
| Fuel Oil or Kerosene | 0 (0.0%) | 0 (0.0%) |
| Coal or Coke | 0 (0.0%) | 0 (0.0%) |
| All other Fuels | 0 (0.0%) | 0 (0.0%) |
| No Fuel Used | 2 (3.1%) | 0 (0.0%) |
| Total | 65 (100.0%) | 18 (100.0%) |
Household Vehicle Usage in Sawyerville
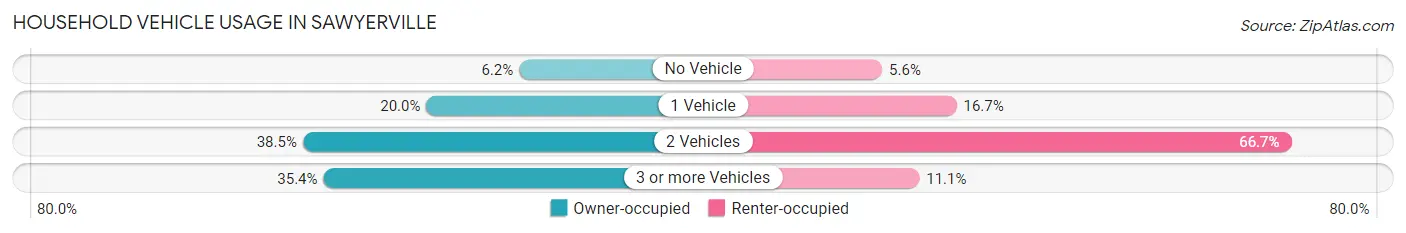
| Vehicles per Household | Owner-occupied | Renter-occupied |
| No Vehicle | 4 (6.1%) | 1 (5.6%) |
| 1 Vehicle | 13 (20.0%) | 3 (16.7%) |
| 2 Vehicles | 25 (38.5%) | 12 (66.7%) |
| 3 or more Vehicles | 23 (35.4%) | 2 (11.1%) |
| Total | 65 (100.0%) | 18 (100.0%) |
Real Estate & Mortgages in Sawyerville
Real Estate and Mortgage Overview in Sawyerville
| Characteristic | Without Mortgage | With Mortgage |
| Housing Units | 35 | 30 |
| Median Property Value | $123,400 | $80,000 |
| Median Household Income | $39,750 | $4 |
| Monthly Housing Costs | $531 | $1 |
| Real Estate Taxes | $1,438 | $3 |
Property Value by Mortgage Status in Sawyerville
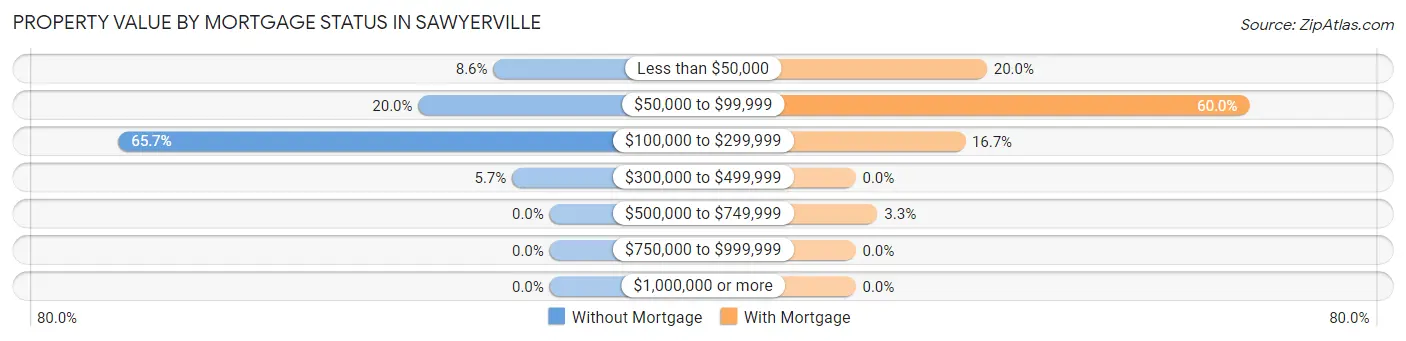
| Property Value | Without Mortgage | With Mortgage |
| Less than $50,000 | 3 (8.6%) | 6 (20.0%) |
| $50,000 to $99,999 | 7 (20.0%) | 18 (60.0%) |
| $100,000 to $299,999 | 23 (65.7%) | 5 (16.7%) |
| $300,000 to $499,999 | 2 (5.7%) | 0 (0.0%) |
| $500,000 to $749,999 | 0 (0.0%) | 1 (3.3%) |
| $750,000 to $999,999 | 0 (0.0%) | 0 (0.0%) |
| $1,000,000 or more | 0 (0.0%) | 0 (0.0%) |
| Total | 35 (100.0%) | 30 (100.0%) |
Household Income by Mortgage Status in Sawyerville
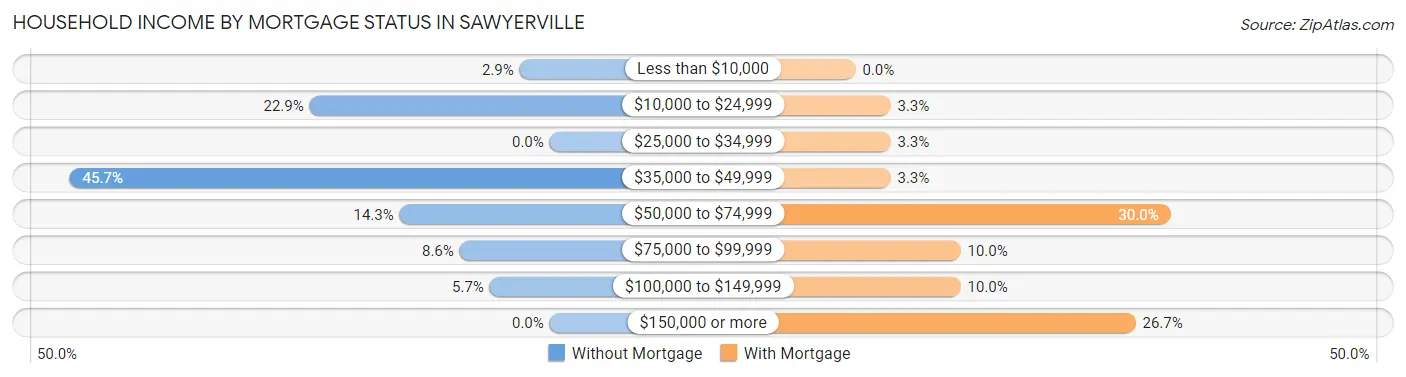
| Household Income | Without Mortgage | With Mortgage |
| Less than $10,000 | 1 (2.9%) | 0 (0.0%) |
| $10,000 to $24,999 | 8 (22.9%) | 1 (3.3%) |
| $25,000 to $34,999 | 0 (0.0%) | 1 (3.3%) |
| $35,000 to $49,999 | 16 (45.7%) | 1 (3.3%) |
| $50,000 to $74,999 | 5 (14.3%) | 9 (30.0%) |
| $75,000 to $99,999 | 3 (8.6%) | 3 (10.0%) |
| $100,000 to $149,999 | 2 (5.7%) | 3 (10.0%) |
| $150,000 or more | 0 (0.0%) | 8 (26.7%) |
| Total | 35 (100.0%) | 30 (100.0%) |
Property Value to Household Income Ratio in Sawyerville
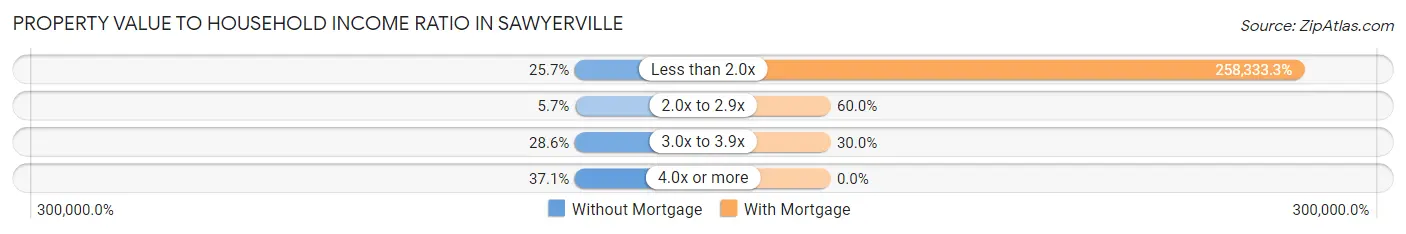
| Value-to-Income Ratio | Without Mortgage | With Mortgage |
| Less than 2.0x | 9 (25.7%) | 77,500 (258,333.3%) |
| 2.0x to 2.9x | 2 (5.7%) | 18 (60.0%) |
| 3.0x to 3.9x | 10 (28.6%) | 9 (30.0%) |
| 4.0x or more | 13 (37.1%) | 0 (0.0%) |
| Total | 35 (100.0%) | 30 (100.0%) |
Real Estate Taxes by Mortgage Status in Sawyerville
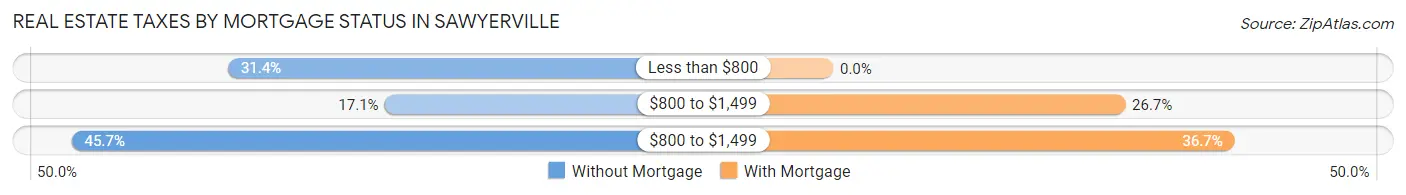
| Property Taxes | Without Mortgage | With Mortgage |
| Less than $800 | 11 (31.4%) | 0 (0.0%) |
| $800 to $1,499 | 6 (17.1%) | 8 (26.7%) |
| $800 to $1,499 | 16 (45.7%) | 11 (36.7%) |
| Total | 35 (100.0%) | 30 (100.0%) |
Health & Disability in Sawyerville
Health Insurance Coverage by Age in Sawyerville
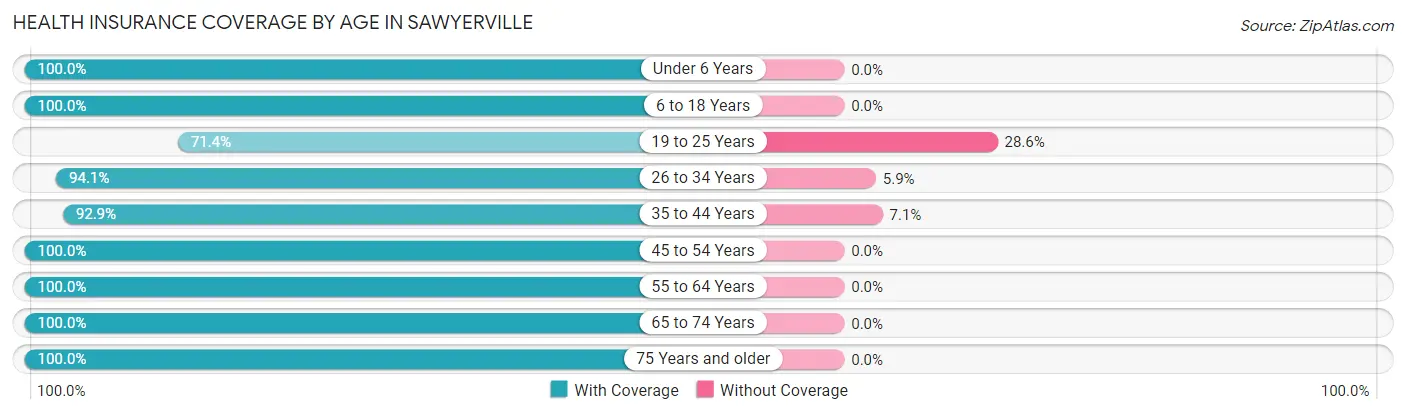
| Age Bracket | With Coverage | Without Coverage |
| Under 6 Years | 12 (100.0%) | 0 (0.0%) |
| 6 to 18 Years | 21 (100.0%) | 0 (0.0%) |
| 19 to 25 Years | 10 (71.4%) | 4 (28.6%) |
| 26 to 34 Years | 32 (94.1%) | 2 (5.9%) |
| 35 to 44 Years | 13 (92.9%) | 1 (7.1%) |
| 45 to 54 Years | 8 (100.0%) | 0 (0.0%) |
| 55 to 64 Years | 39 (100.0%) | 0 (0.0%) |
| 65 to 74 Years | 37 (100.0%) | 0 (0.0%) |
| 75 Years and older | 20 (100.0%) | 0 (0.0%) |
| Total | 192 (96.5%) | 7 (3.5%) |
Health Insurance Coverage by Citizenship Status in Sawyerville
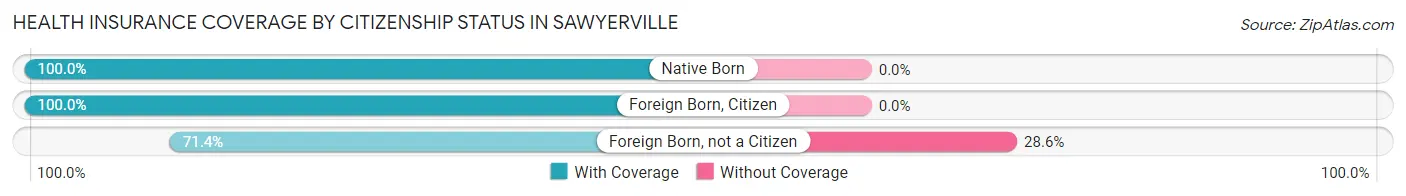
| Citizenship Status | With Coverage | Without Coverage |
| Native Born | 12 (100.0%) | 0 (0.0%) |
| Foreign Born, Citizen | 21 (100.0%) | 0 (0.0%) |
| Foreign Born, not a Citizen | 10 (71.4%) | 4 (28.6%) |
Health Insurance Coverage by Household Income in Sawyerville
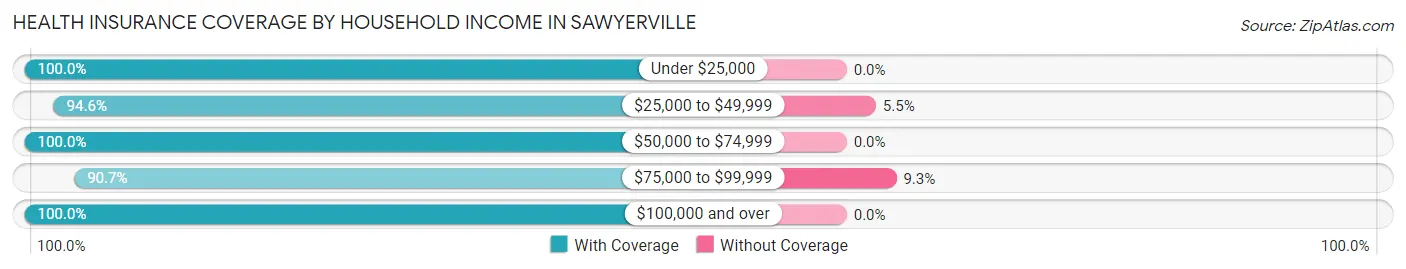
| Household Income | With Coverage | Without Coverage |
| Under $25,000 | 17 (100.0%) | 0 (0.0%) |
| $25,000 to $49,999 | 52 (94.6%) | 3 (5.4%) |
| $50,000 to $74,999 | 23 (100.0%) | 0 (0.0%) |
| $75,000 to $99,999 | 39 (90.7%) | 4 (9.3%) |
| $100,000 and over | 61 (100.0%) | 0 (0.0%) |
Public vs Private Health Insurance Coverage by Age in Sawyerville
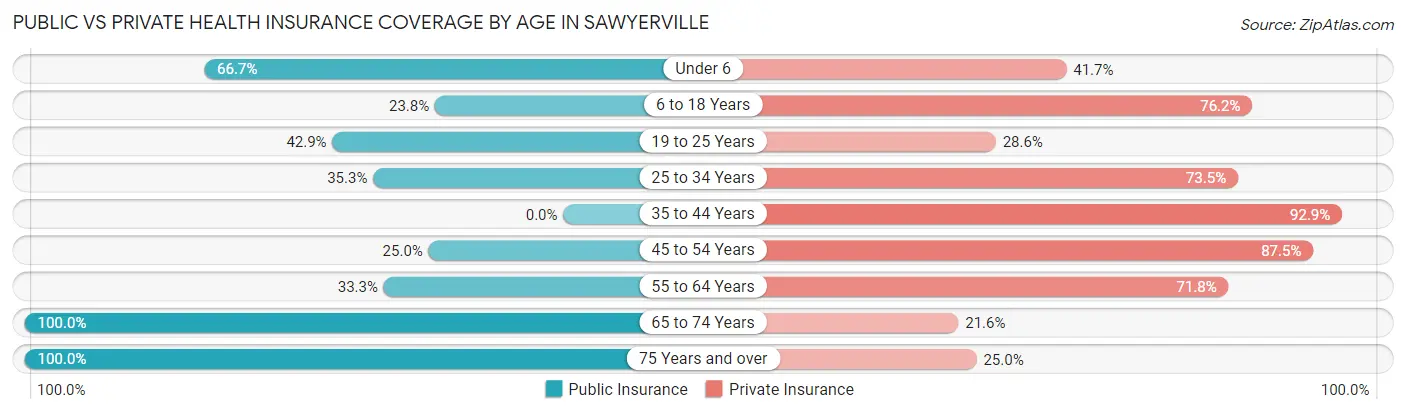
| Age Bracket | Public Insurance | Private Insurance |
| Under 6 | 8 (66.7%) | 5 (41.7%) |
| 6 to 18 Years | 5 (23.8%) | 16 (76.2%) |
| 19 to 25 Years | 6 (42.9%) | 4 (28.6%) |
| 25 to 34 Years | 12 (35.3%) | 25 (73.5%) |
| 35 to 44 Years | 0 (0.0%) | 13 (92.9%) |
| 45 to 54 Years | 2 (25.0%) | 7 (87.5%) |
| 55 to 64 Years | 13 (33.3%) | 28 (71.8%) |
| 65 to 74 Years | 37 (100.0%) | 8 (21.6%) |
| 75 Years and over | 20 (100.0%) | 5 (25.0%) |
| Total | 103 (51.8%) | 111 (55.8%) |
Disability Status by Sex by Age in Sawyerville
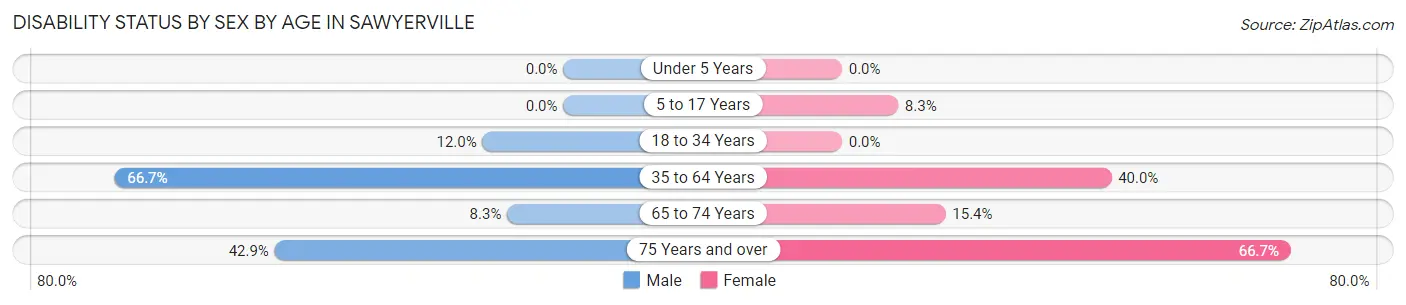
| Age Bracket | Male | Female |
| Under 5 Years | 0 (0.0%) | 0 (0.0%) |
| 5 to 17 Years | 0 (0.0%) | 1 (8.3%) |
| 18 to 34 Years | 3 (12.0%) | 0 (0.0%) |
| 35 to 64 Years | 14 (66.7%) | 16 (40.0%) |
| 65 to 74 Years | 2 (8.3%) | 2 (15.4%) |
| 75 Years and over | 6 (42.9%) | 4 (66.7%) |
Disability Class by Sex by Age in Sawyerville
Disability Class: Hearing Difficulty
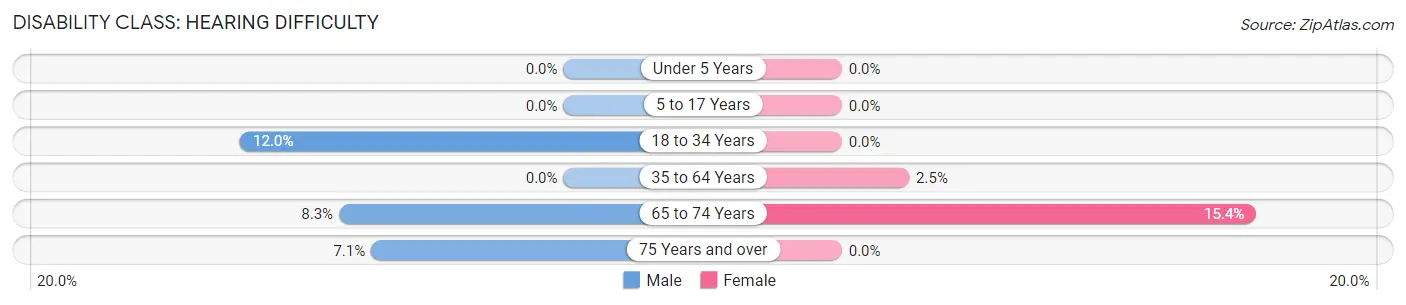
| Age Bracket | Male | Female |
| Under 5 Years | 0 (0.0%) | 0 (0.0%) |
| 5 to 17 Years | 0 (0.0%) | 0 (0.0%) |
| 18 to 34 Years | 3 (12.0%) | 0 (0.0%) |
| 35 to 64 Years | 0 (0.0%) | 1 (2.5%) |
| 65 to 74 Years | 2 (8.3%) | 2 (15.4%) |
| 75 Years and over | 1 (7.1%) | 0 (0.0%) |
Disability Class: Vision Difficulty
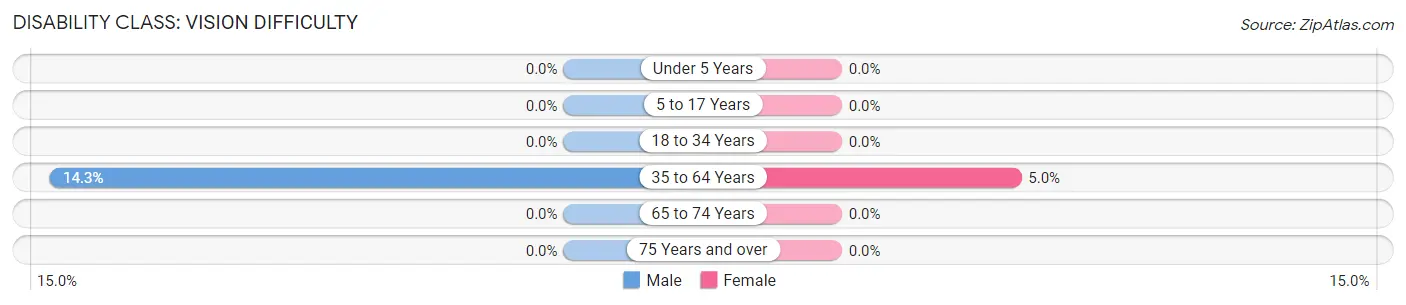
| Age Bracket | Male | Female |
| Under 5 Years | 0 (0.0%) | 0 (0.0%) |
| 5 to 17 Years | 0 (0.0%) | 0 (0.0%) |
| 18 to 34 Years | 0 (0.0%) | 0 (0.0%) |
| 35 to 64 Years | 3 (14.3%) | 2 (5.0%) |
| 65 to 74 Years | 0 (0.0%) | 0 (0.0%) |
| 75 Years and over | 0 (0.0%) | 0 (0.0%) |
Disability Class: Cognitive Difficulty
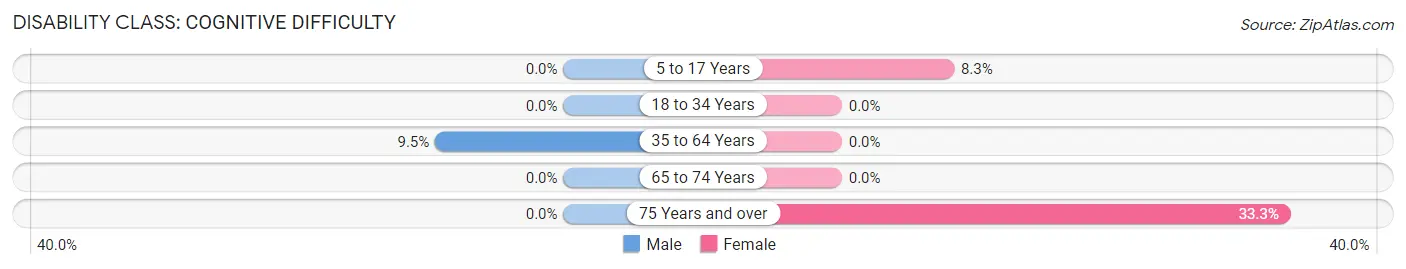
| Age Bracket | Male | Female |
| 5 to 17 Years | 0 (0.0%) | 1 (8.3%) |
| 18 to 34 Years | 0 (0.0%) | 0 (0.0%) |
| 35 to 64 Years | 2 (9.5%) | 0 (0.0%) |
| 65 to 74 Years | 0 (0.0%) | 0 (0.0%) |
| 75 Years and over | 0 (0.0%) | 2 (33.3%) |
Disability Class: Ambulatory Difficulty
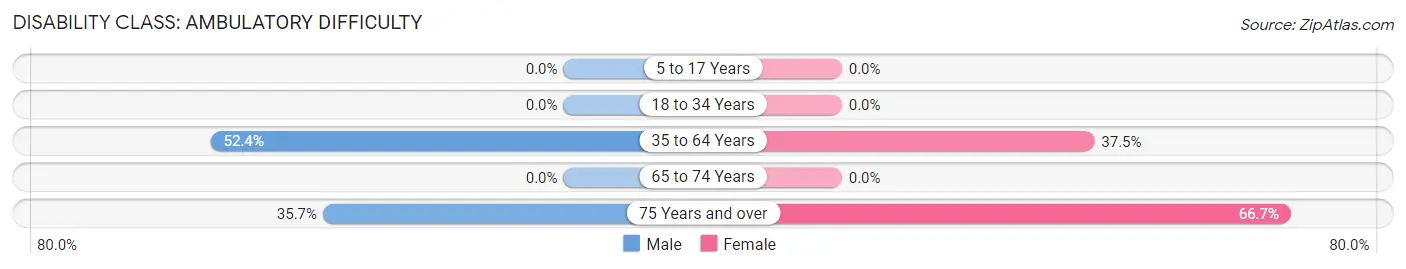
| Age Bracket | Male | Female |
| 5 to 17 Years | 0 (0.0%) | 0 (0.0%) |
| 18 to 34 Years | 0 (0.0%) | 0 (0.0%) |
| 35 to 64 Years | 11 (52.4%) | 15 (37.5%) |
| 65 to 74 Years | 0 (0.0%) | 0 (0.0%) |
| 75 Years and over | 5 (35.7%) | 4 (66.7%) |
Disability Class: Self-Care Difficulty
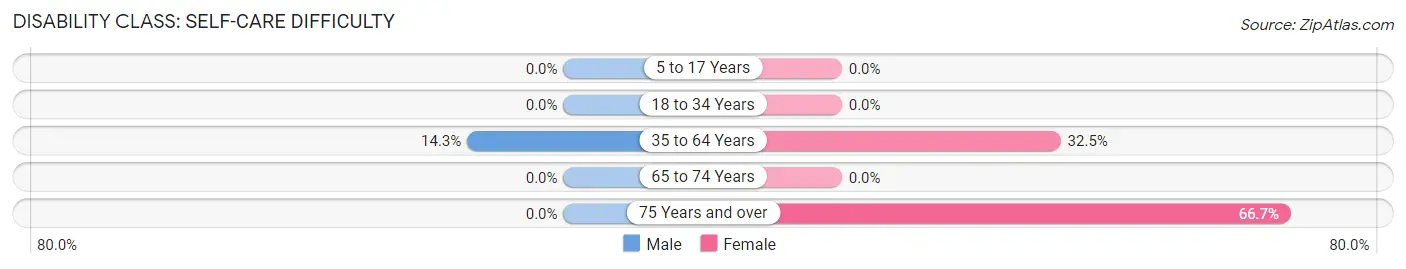
| Age Bracket | Male | Female |
| 5 to 17 Years | 0 (0.0%) | 0 (0.0%) |
| 18 to 34 Years | 0 (0.0%) | 0 (0.0%) |
| 35 to 64 Years | 3 (14.3%) | 13 (32.5%) |
| 65 to 74 Years | 0 (0.0%) | 0 (0.0%) |
| 75 Years and over | 0 (0.0%) | 4 (66.7%) |
Technology Access in Sawyerville
Computing Device Access in Sawyerville
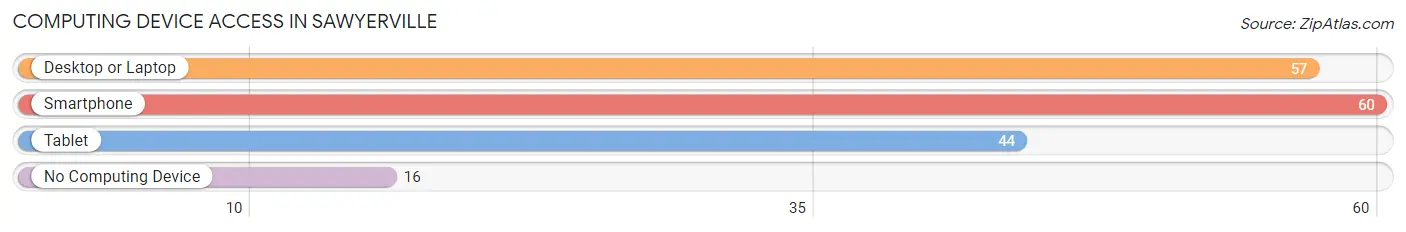
| Device Type | # Households | % Households |
| Desktop or Laptop | 57 | 68.7% |
| Smartphone | 60 | 72.3% |
| Tablet | 44 | 53.0% |
| No Computing Device | 16 | 19.3% |
| Total | 83 | 100.0% |
Internet Access in Sawyerville
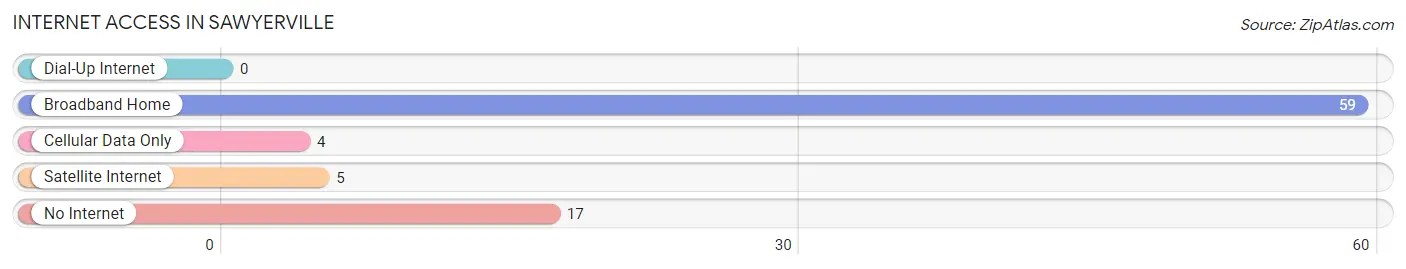
| Internet Type | # Households | % Households |
| Dial-Up Internet | 0 | 0.0% |
| Broadband Home | 59 | 71.1% |
| Cellular Data Only | 4 | 4.8% |
| Satellite Internet | 5 | 6.0% |
| No Internet | 17 | 20.5% |
| Total | 83 | 100.0% |
Sawyerville Summary
Sawyerville is a small village located in Macoupin County, Illinois, United States. The population was estimated to be around 545 in the year 2000. The village is located in the central part of the county, about 10 miles south of Carlinville, the county seat.
History
Sawyerville was founded in 1854 by William Sawyer, a local farmer. The village was named after him and was originally known as Sawyer's Grove. The village was incorporated in 1872 and the name was changed to Sawyerville.
The village was a small farming community for many years, but in the late 19th century, it began to grow and develop. The first post office was established in 1876 and the first school was built in 1877. The village also had a general store, a blacksmith shop, and a few other businesses.
Geography
Sawyerville is located at 39°17'N 89°45'W (39.2833, -89.7500). The village is situated in the central part of Macoupin County, about 10 miles south of Carlinville, the county seat. The village is located in the Central Till Plains region of Illinois, which is characterized by flat terrain and fertile soils.
The village is surrounded by agricultural land, with corn and soybeans being the main crops. The village is also located near several small lakes and ponds, which provide recreational opportunities for the residents.
Economy
The economy of Sawyerville is largely based on agriculture. Corn and soybeans are the main crops grown in the area, and the village is home to several grain elevators. The village also has a few small businesses, including a general store, a hardware store, and a few restaurants.
Demographics
As of the 2000 census, there were 545 people, 206 households, and 149 families living in the village. The population density was 1,092.2 people per square mile (422.3/km2). There were 221 housing units at an average density of 441.3 per square mile (170.2/km2). The racial makeup of the village was 98.9% White, 0.2% African American, 0.2% Native American, 0.2% Asian, and 0.5% from two or more races.
The median income for a household in the village was $37,500, and the median income for a family was $45,000. Males had a median income of $30,000 versus $21,250 for females. The per capita income for the village was $17,845. About 8.2% of families and 10.2% of the population were below the poverty line, including 14.3% of those under age 18 and 6.3% of those age 65 or over.
Common Questions
What is the Total Population of Sawyerville?
Total Population of Sawyerville is 199.
What is the Total Male Population of Sawyerville?
Total Male Population of Sawyerville is 98.
What is the Total Female Population of Sawyerville?
Total Female Population of Sawyerville is 101.
What is the Ratio of Males per 100 Females in Sawyerville?
There are 97.03 Males per 100 Females in Sawyerville.
What is the Ratio of Females per 100 Males in Sawyerville?
There are 103.06 Females per 100 Males in Sawyerville.
What is the Median Population Age in Sawyerville?
Median Population Age in Sawyerville is 48.3 Years.
What is the Average Family Size in Sawyerville
Average Family Size in Sawyerville is 3.5 People.
What is the Average Household Size in Sawyerville
Average Household Size in Sawyerville is 2.4 People.
What is Per Capita Income in Sawyerville?
Per Capita income in Sawyerville is $29,805.
What is the Median Family Income in Sawyerville?
Median Family Income in Sawyerville is $72,500.
What is the Median Household income in Sawyerville?
Median Household Income in Sawyerville is $46,161.
What is Income or Wage Gap in Sawyerville?
Income or Wage Gap in Sawyerville is 46.7%.
Women in Sawyerville earn 53.3 cents for every dollar earned by a man.
What is Inequality or Gini Index in Sawyerville?
Inequality or Gini Index in Sawyerville is 0.40.
How Large is the Labor Force in Sawyerville?
There are 88 People in the Labor Forcein in Sawyerville.
What is the Percentage of People in the Labor Force in Sawyerville?
52.4% of People are in the Labor Force in Sawyerville.
What is the Unemployment Rate in Sawyerville?
Unemployment Rate in Sawyerville is 5.7%.