North Henderson, IL
North Henderson Map
North Henderson Overview
199
TOTAL POPULATION
131
MALE POPULATION
68
FEMALE POPULATION
192.65
MALES / 100 FEMALES
51.91
FEMALES / 100 MALES
34.6
MEDIAN AGE
3.4
AVG FAMILY SIZE
2.5
AVG HOUSEHOLD SIZE
$44,112
PER CAPITA INCOME
$111,250
AVG FAMILY INCOME
$77,500
AVG HOUSEHOLD INCOME
26.5%
WAGE / INCOME GAP [ % ]
73.5¢/ $1
WAGE / INCOME GAP [ $ ]
0.42
INEQUALITY / GINI INDEX
108
LABOR FORCE [ PEOPLE ]
66.3%
PERCENT IN LABOR FORCE
3.7%
UNEMPLOYMENT RATE
North Henderson Zip Codes
North Henderson Area Codes
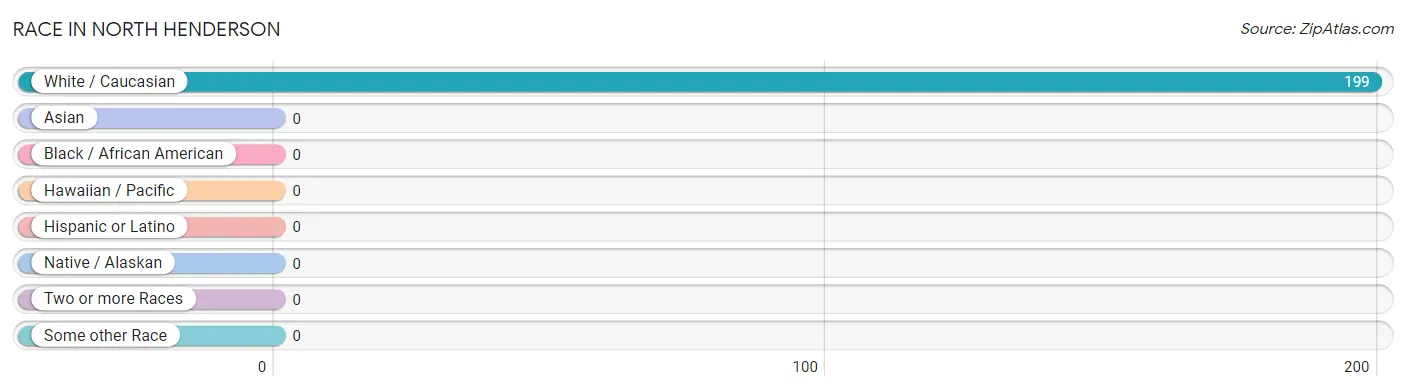
Race in North Henderson
The most populous races in North Henderson are , and White / Caucasian (199 | 100.0%).
| Race | # Population | % Population |
| Asian | 0 | 0.0% |
| Black / African American | 0 | 0.0% |
| Hawaiian / Pacific | 0 | 0.0% |
| Hispanic or Latino | 0 | 0.0% |
| Native / Alaskan | 0 | 0.0% |
| White / Caucasian | 199 | 100.0% |
| Two or more Races | 0 | 0.0% |
| Some other Race | 0 | 0.0% |
| Total | 199 | 100.0% |
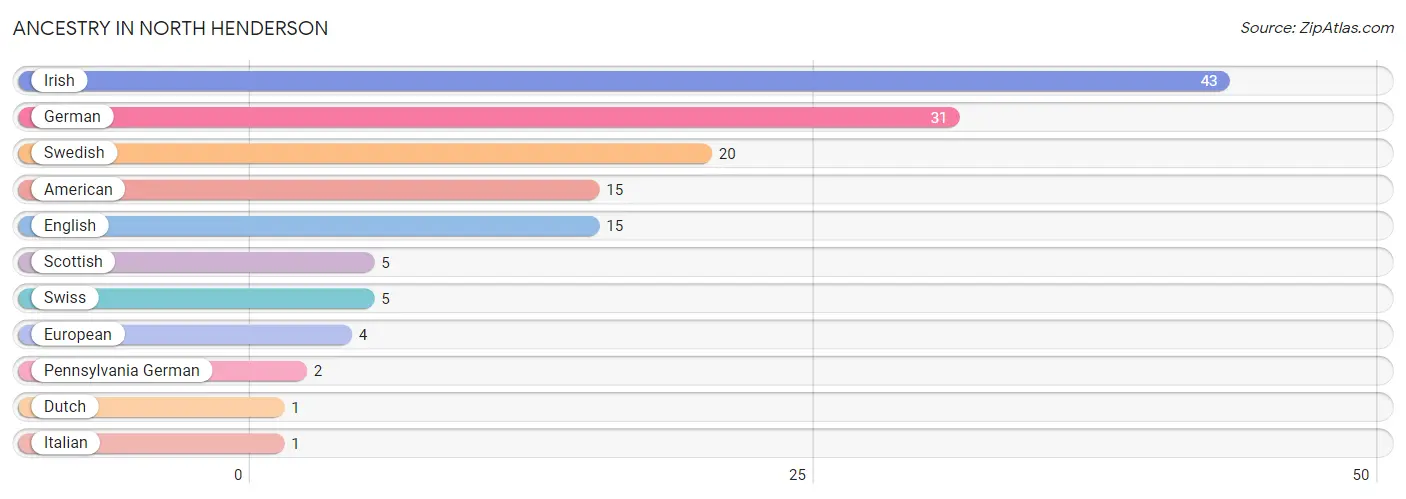
Ancestry in North Henderson
The most populous ancestries reported in North Henderson are Irish (43 | 21.6%), German (31 | 15.6%), Swedish (20 | 10.1%), American (15 | 7.5%), and English (15 | 7.5%), together accounting for 62.3% of all North Henderson residents.
| Ancestry | # Population | % Population |
| American | 15 | 7.5% |
| Dutch | 1 | 0.5% |
| English | 15 | 7.5% |
| European | 4 | 2.0% |
| German | 31 | 15.6% |
| Irish | 43 | 21.6% |
| Italian | 1 | 0.5% |
| Pennsylvania German | 2 | 1.0% |
| Scottish | 5 | 2.5% |
| Swedish | 20 | 10.1% |
| Swiss | 5 | 2.5% | View All 11 Rows |
Immigrants in North Henderson

| Immigration Origin | # Population | % Population | View All 0 Rows |
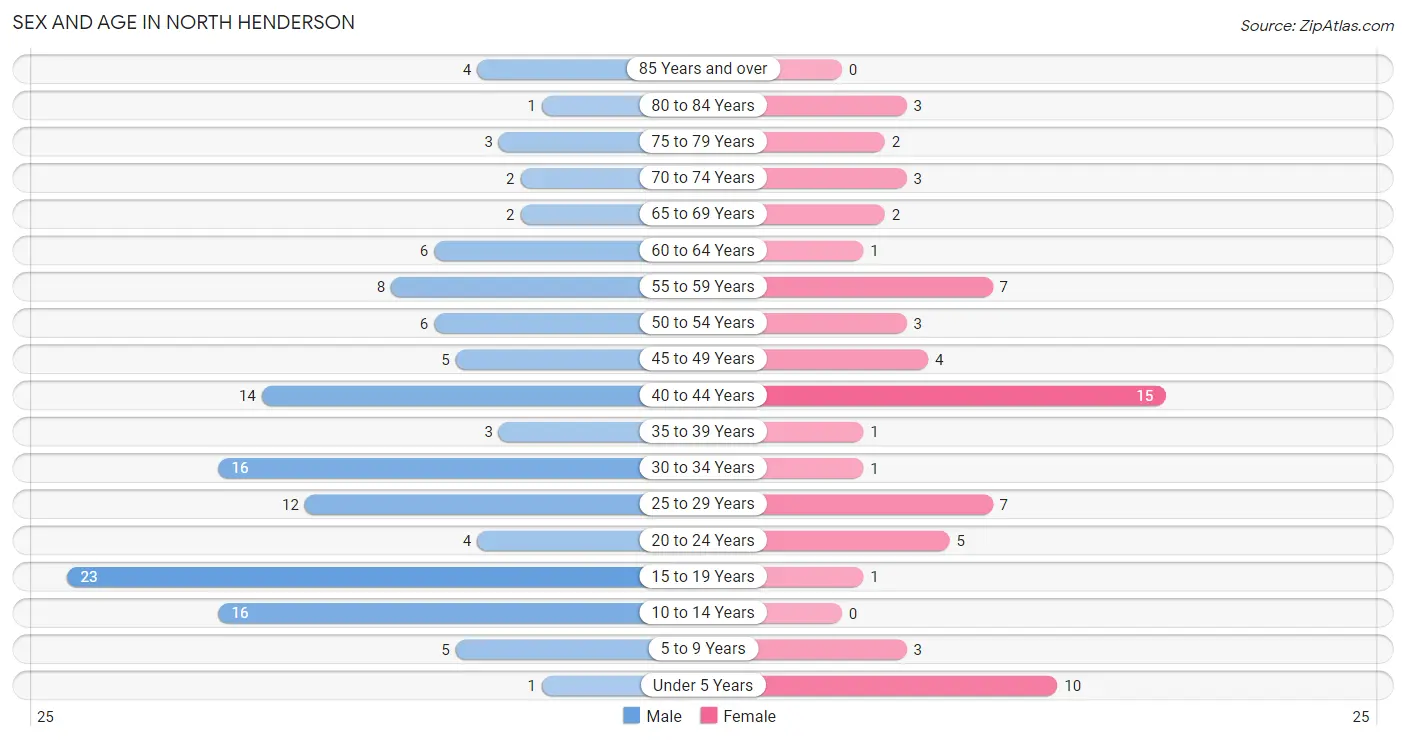
Sex and Age in North Henderson
Sex and Age in North Henderson
The most populous age groups in North Henderson are 15 to 19 Years (23 | 17.6%) for men and 40 to 44 Years (15 | 22.1%) for women.
| Age Bracket | Male | Female |
| Under 5 Years | 1 (0.8%) | 10 (14.7%) |
| 5 to 9 Years | 5 (3.8%) | 3 (4.4%) |
| 10 to 14 Years | 16 (12.2%) | 0 (0.0%) |
| 15 to 19 Years | 23 (17.6%) | 1 (1.5%) |
| 20 to 24 Years | 4 (3.0%) | 5 (7.3%) |
| 25 to 29 Years | 12 (9.2%) | 7 (10.3%) |
| 30 to 34 Years | 16 (12.2%) | 1 (1.5%) |
| 35 to 39 Years | 3 (2.3%) | 1 (1.5%) |
| 40 to 44 Years | 14 (10.7%) | 15 (22.1%) |
| 45 to 49 Years | 5 (3.8%) | 4 (5.9%) |
| 50 to 54 Years | 6 (4.6%) | 3 (4.4%) |
| 55 to 59 Years | 8 (6.1%) | 7 (10.3%) |
| 60 to 64 Years | 6 (4.6%) | 1 (1.5%) |
| 65 to 69 Years | 2 (1.5%) | 2 (2.9%) |
| 70 to 74 Years | 2 (1.5%) | 3 (4.4%) |
| 75 to 79 Years | 3 (2.3%) | 2 (2.9%) |
| 80 to 84 Years | 1 (0.8%) | 3 (4.4%) |
| 85 Years and over | 4 (3.0%) | 0 (0.0%) |
| Total | 131 (100.0%) | 68 (100.0%) |
Families and Households in North Henderson
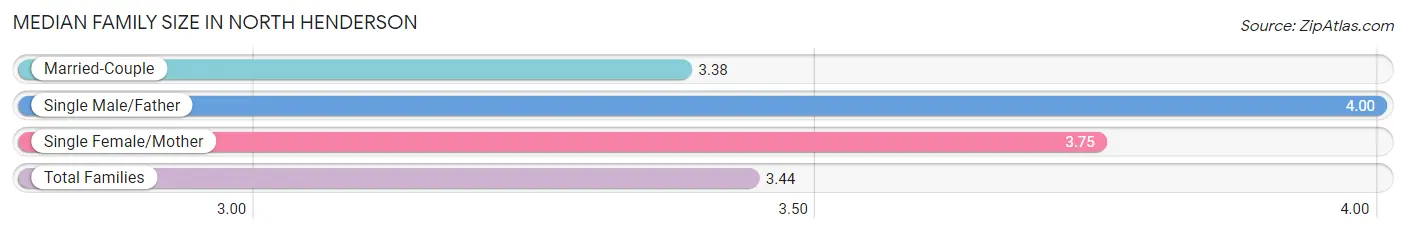
Median Family Size in North Henderson
The median family size in North Henderson is 3.44 persons per family, with single male/father families (2 | 4.2%) accounting for the largest median family size of 4 persons per family. On the other hand, married-couple families (42 | 87.5%) represent the smallest median family size with 3.38 persons per family.
| Family Type | # Families | Family Size |
| Married-Couple | 42 (87.5%) | 3.38 |
| Single Male/Father | 2 (4.2%) | 4.00 |
| Single Female/Mother | 4 (8.3%) | 3.75 |
| Total Families | 48 (100.0%) | 3.44 |
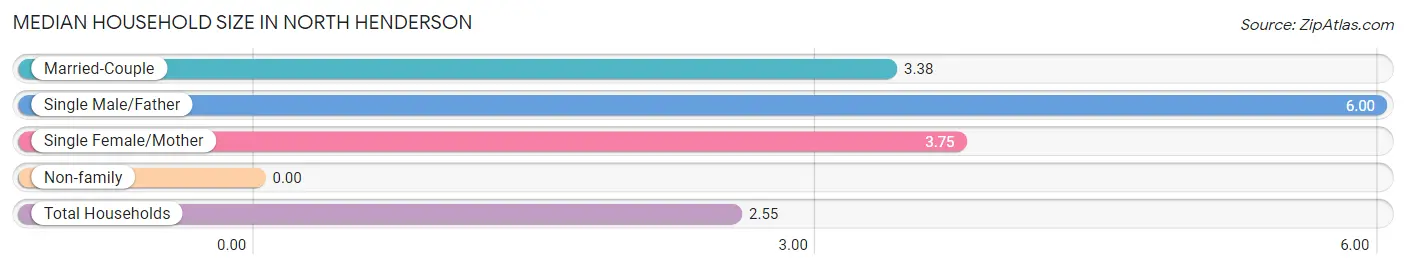
Median Household Size in North Henderson
| Household Type | # Households | Household Size |
| Married-Couple | 42 (53.8%) | 3.38 |
| Single Male/Father | 2 (2.6%) | 6.00 |
| Single Female/Mother | 4 (5.1%) | 3.75 |
| Non-family | 30 (38.5%) | - |
| Total Households | 78 (100.0%) | 2.55 |
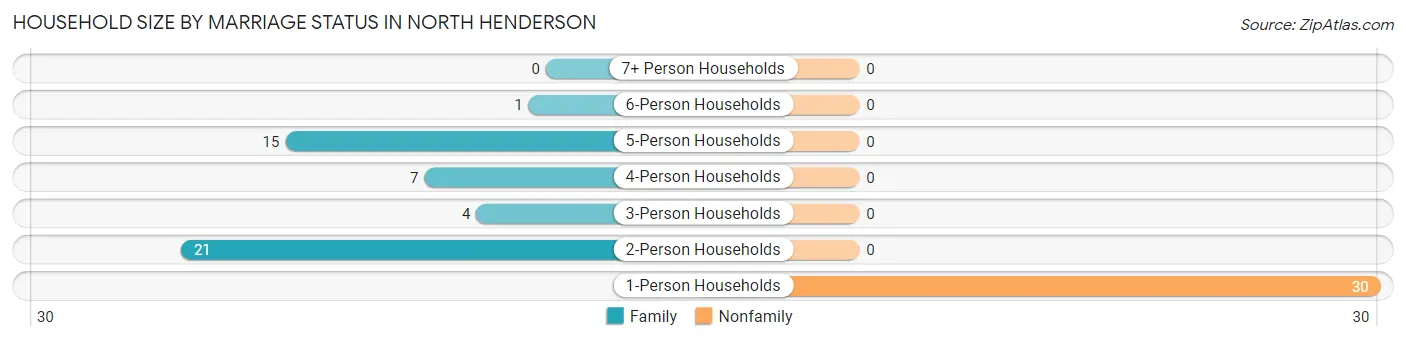
Household Size by Marriage Status in North Henderson
Out of a total of 78 households in North Henderson, 48 (61.5%) are family households, while 30 (38.5%) are nonfamily households. The most numerous type of family households are 2-person households, comprising 21, and the most common type of nonfamily households are 1-person households, comprising 30.
| Household Size | Family Households | Nonfamily Households |
| 1-Person Households | - | 30 (38.5%) |
| 2-Person Households | 21 (26.9%) | 0 (0.0%) |
| 3-Person Households | 4 (5.1%) | 0 (0.0%) |
| 4-Person Households | 7 (9.0%) | 0 (0.0%) |
| 5-Person Households | 15 (19.2%) | 0 (0.0%) |
| 6-Person Households | 1 (1.3%) | 0 (0.0%) |
| 7+ Person Households | 0 (0.0%) | 0 (0.0%) |
| Total | 48 (61.5%) | 30 (38.5%) |
Female Fertility in North Henderson
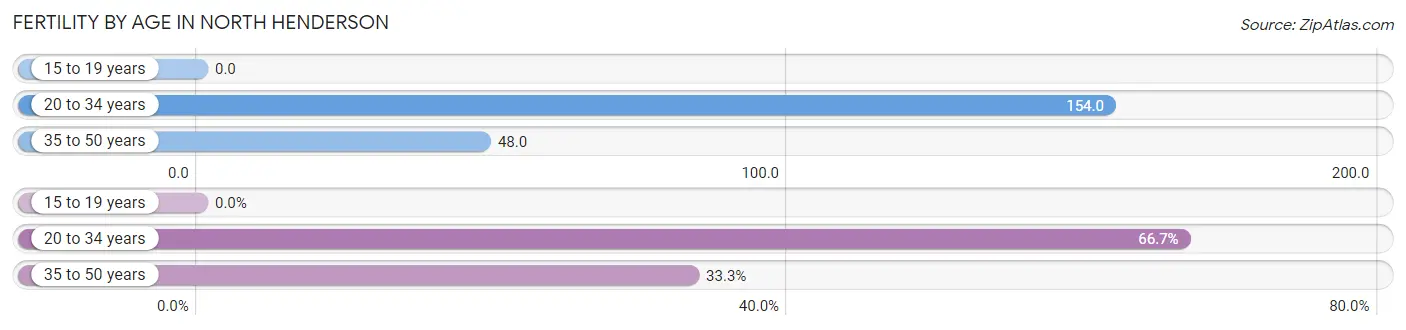
Fertility by Age in North Henderson
Average fertility rate in North Henderson is 86.0 births per 1,000 women. Women in the age bracket of 20 to 34 years have the highest fertility rate with 154.0 births per 1,000 women. Women in the age bracket of 20 to 34 years acount for 66.7% of all women with births.
| Age Bracket | Women with Births | Births / 1,000 Women |
| 15 to 19 years | 0 (0.0%) | 0.0 |
| 20 to 34 years | 2 (66.7%) | 154.0 |
| 35 to 50 years | 1 (33.3%) | 48.0 |
| Total | 3 (100.0%) | 86.0 |
Fertility by Age by Marriage Status in North Henderson
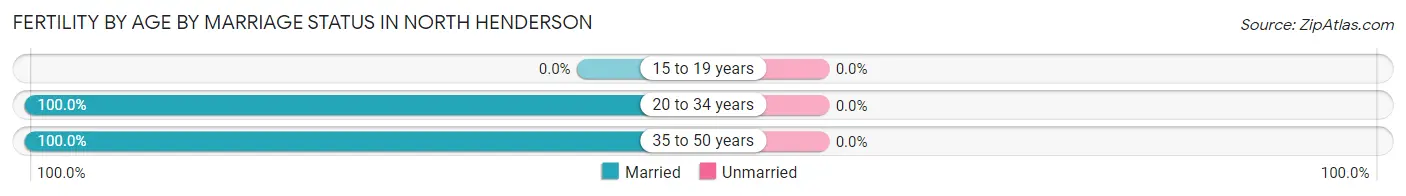
| Age Bracket | Married | Unmarried |
| 15 to 19 years | 0 (0.0%) | 0 (0.0%) |
| 20 to 34 years | 2 (100.0%) | 0 (0.0%) |
| 35 to 50 years | 1 (100.0%) | 0 (0.0%) |
| Total | 3 (100.0%) | 0 (0.0%) |
Fertility by Education in North Henderson
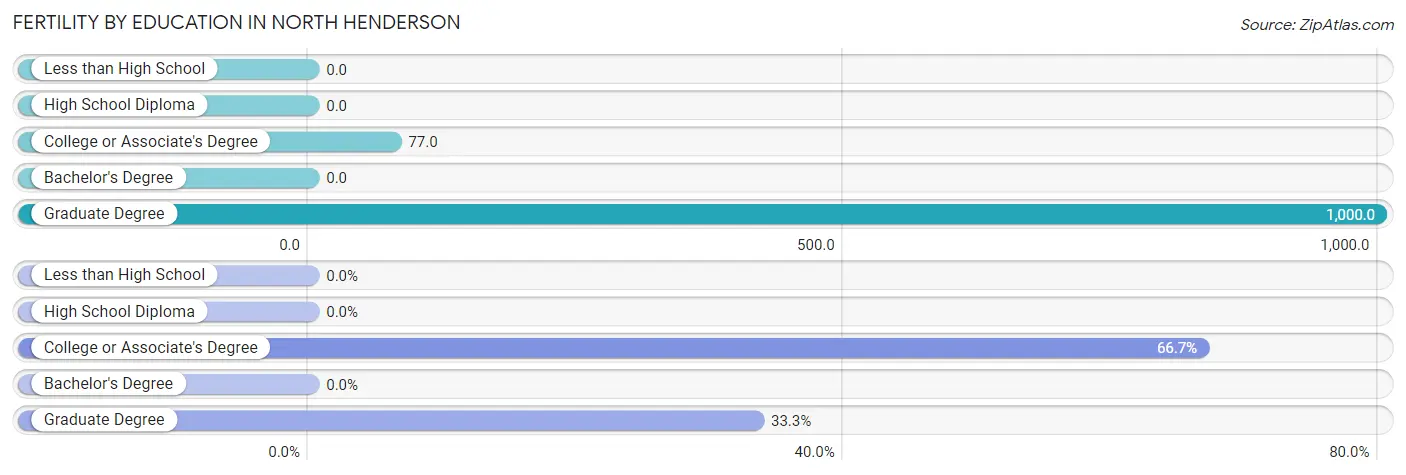
| Educational Attainment | Women with Births | Births / 1,000 Women |
| Less than High School | 0 (0.0%) | 0.0 |
| High School Diploma | 0 (0.0%) | 0.0 |
| College or Associate's Degree | 2 (66.7%) | 77.0 |
| Bachelor's Degree | 0 (0.0%) | 0.0 |
| Graduate Degree | 1 (33.3%) | 1,000.0 |
| Total | 3 (100.0%) | 86.0 |
Fertility by Education by Marriage Status in North Henderson
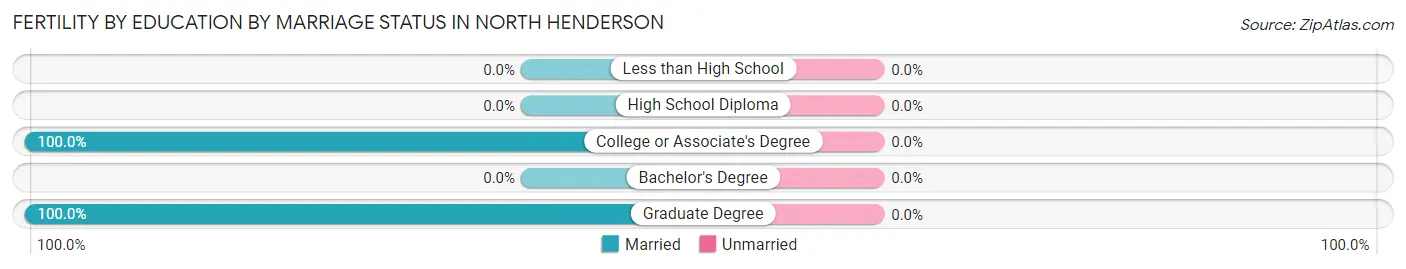
| Educational Attainment | Married | Unmarried |
| Less than High School | 0 (0.0%) | 0 (0.0%) |
| High School Diploma | 0 (0.0%) | 0 (0.0%) |
| College or Associate's Degree | 2 (100.0%) | 0 (0.0%) |
| Bachelor's Degree | 0 (0.0%) | 0 (0.0%) |
| Graduate Degree | 1 (100.0%) | 0 (0.0%) |
| Total | 3 (100.0%) | 0 (0.0%) |
Income in North Henderson
Income Overview in North Henderson
Per Capita Income in North Henderson is $44,112, while median incomes of families and households are $111,250 and $77,500 respectively.
| Characteristic | Number | Measure |
| Per Capita Income | 199 | $44,112 |
| Median Family Income | 48 | $111,250 |
| Mean Family Income | 48 | $150,913 |
| Median Household Income | 78 | $77,500 |
| Mean Household Income | 78 | $114,595 |
| Income Deficit | 48 | $0 |
| Wage / Income Gap (%) | 199 | 26.45% |
| Wage / Income Gap ($) | 199 | 73.55¢ per $1 |
| Gini / Inequality Index | 199 | 0.42 |
Earnings by Sex in North Henderson
Average Earnings in North Henderson are $54,018, $67,981 for men and $50,000 for women, a difference of 26.5%.
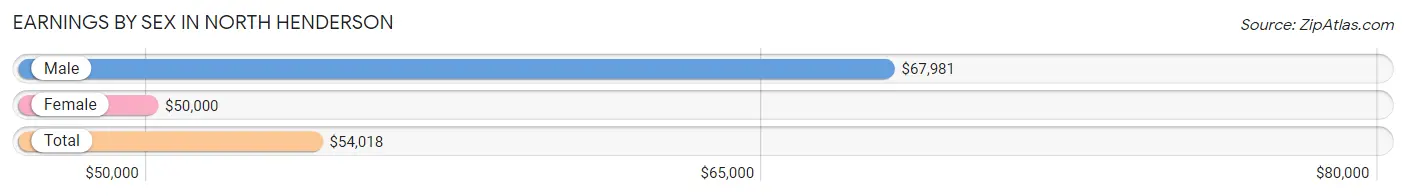
| Sex | Number | Average Earnings |
| Male | 67 (62.6%) | $67,981 |
| Female | 40 (37.4%) | $50,000 |
| Total | 107 (100.0%) | $54,018 |
Earnings by Sex by Income Bracket in North Henderson
The most common earnings brackets in North Henderson are $75,000 to $99,999 for men (19 | 28.4%) and $50,000 to $54,999 for women (14 | 35.0%).
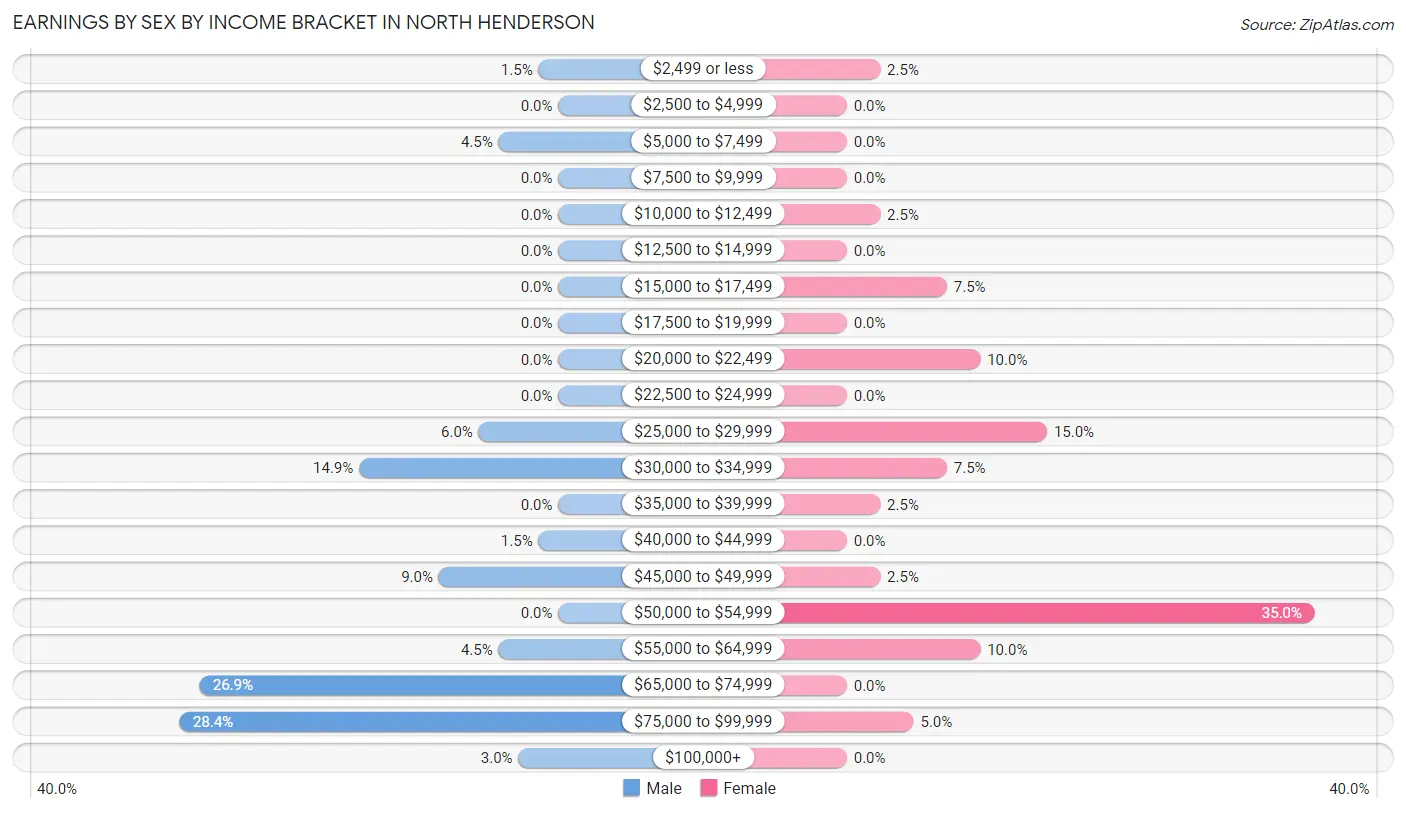
| Income | Male | Female |
| $2,499 or less | 1 (1.5%) | 1 (2.5%) |
| $2,500 to $4,999 | 0 (0.0%) | 0 (0.0%) |
| $5,000 to $7,499 | 3 (4.5%) | 0 (0.0%) |
| $7,500 to $9,999 | 0 (0.0%) | 0 (0.0%) |
| $10,000 to $12,499 | 0 (0.0%) | 1 (2.5%) |
| $12,500 to $14,999 | 0 (0.0%) | 0 (0.0%) |
| $15,000 to $17,499 | 0 (0.0%) | 3 (7.5%) |
| $17,500 to $19,999 | 0 (0.0%) | 0 (0.0%) |
| $20,000 to $22,499 | 0 (0.0%) | 4 (10.0%) |
| $22,500 to $24,999 | 0 (0.0%) | 0 (0.0%) |
| $25,000 to $29,999 | 4 (6.0%) | 6 (15.0%) |
| $30,000 to $34,999 | 10 (14.9%) | 3 (7.5%) |
| $35,000 to $39,999 | 0 (0.0%) | 1 (2.5%) |
| $40,000 to $44,999 | 1 (1.5%) | 0 (0.0%) |
| $45,000 to $49,999 | 6 (9.0%) | 1 (2.5%) |
| $50,000 to $54,999 | 0 (0.0%) | 14 (35.0%) |
| $55,000 to $64,999 | 3 (4.5%) | 4 (10.0%) |
| $65,000 to $74,999 | 18 (26.9%) | 0 (0.0%) |
| $75,000 to $99,999 | 19 (28.4%) | 2 (5.0%) |
| $100,000+ | 2 (3.0%) | 0 (0.0%) |
| Total | 67 (100.0%) | 40 (100.0%) |
Earnings by Sex by Educational Attainment in North Henderson
Average earnings in North Henderson are $68,462 for men and $53,036 for women, a difference of 22.5%. Men with an educational attainment of high school diploma enjoy the highest average annual earnings of $90,000, while those with bachelor's degree education earn the least with $60,833. Women with an educational attainment of college or associate's degree earn the most with the average annual earnings of $53,125, while those with college or associate's degree education have the smallest earnings of $53,125.
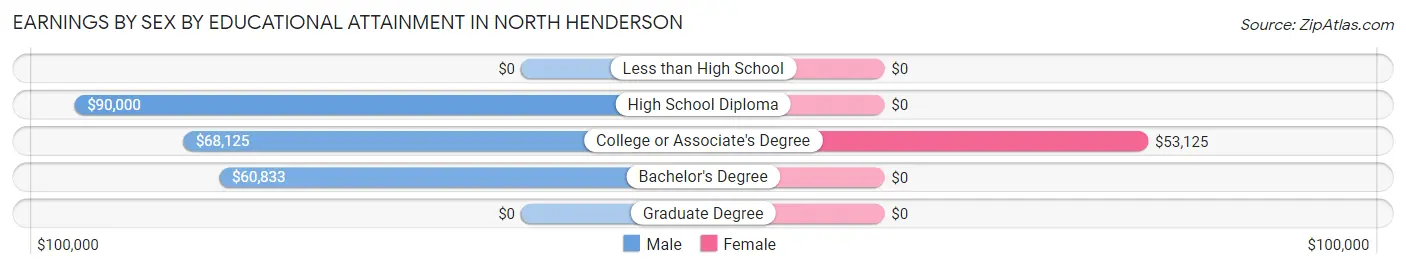
| Educational Attainment | Male Income | Female Income |
| Less than High School | - | - |
| High School Diploma | $90,000 | $0 |
| College or Associate's Degree | $68,125 | $53,125 |
| Bachelor's Degree | $60,833 | $0 |
| Graduate Degree | - | - |
| Total | $68,462 | $53,036 |
Family Income in North Henderson
Family Income Brackets in North Henderson
According to the North Henderson family income data, there are 15 families falling into the $150,000 to $199,999 income range, which is the most common income bracket and makes up 31.2% of all families.
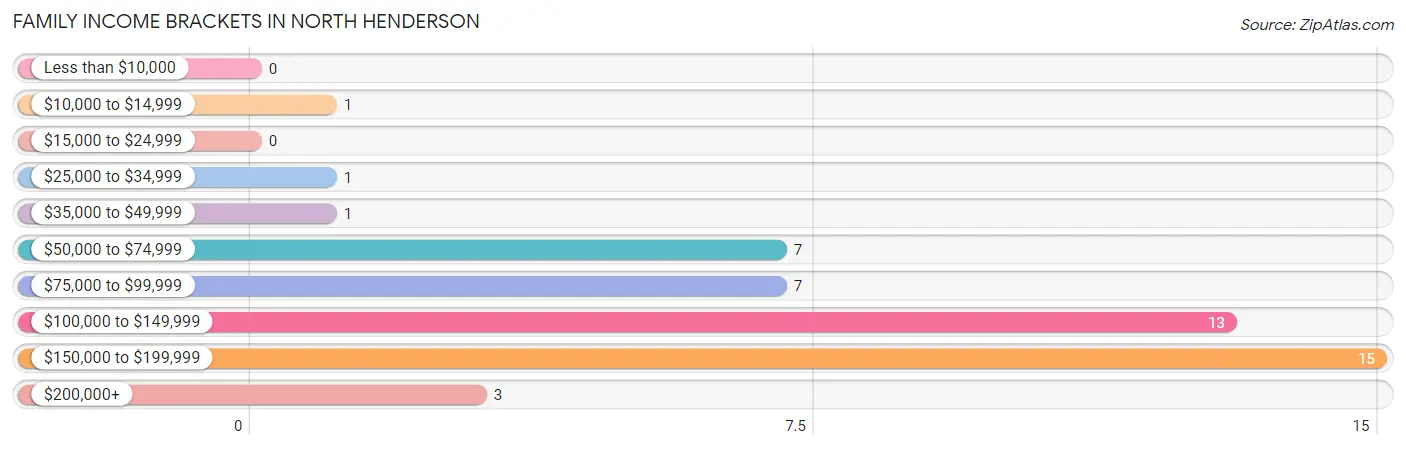
| Income Bracket | # Families | % Families |
| Less than $10,000 | 0 | 0.0% |
| $10,000 to $14,999 | 1 | 2.1% |
| $15,000 to $24,999 | 0 | 0.0% |
| $25,000 to $34,999 | 1 | 2.1% |
| $35,000 to $49,999 | 1 | 2.1% |
| $50,000 to $74,999 | 7 | 14.6% |
| $75,000 to $99,999 | 7 | 14.6% |
| $100,000 to $149,999 | 13 | 27.1% |
| $150,000 to $199,999 | 15 | 31.3% |
| $200,000+ | 3 | 6.3% |
Family Income by Famaliy Size in North Henderson
3-person families (5 | 10.4%) account for the highest median family income in North Henderson with $113,125 per family, while 2-person families (21 | 43.8%) have the highest median income of $50,312 per family member.
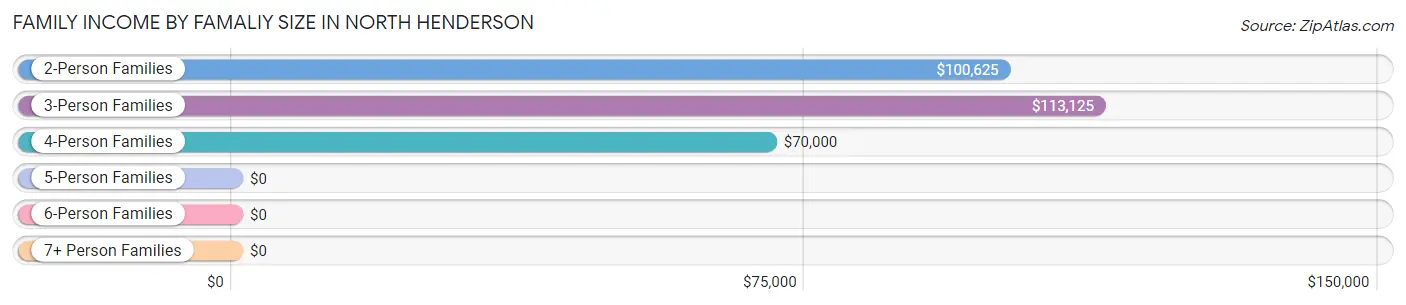
| Income Bracket | # Families | Median Income |
| 2-Person Families | 21 (43.8%) | $100,625 |
| 3-Person Families | 5 (10.4%) | $113,125 |
| 4-Person Families | 6 (12.5%) | $70,000 |
| 5-Person Families | 15 (31.2%) | $0 |
| 6-Person Families | 1 (2.1%) | $0 |
| 7+ Person Families | 0 (0.0%) | $0 |
| Total | 48 (100.0%) | $111,250 |
Family Income by Number of Earners in North Henderson
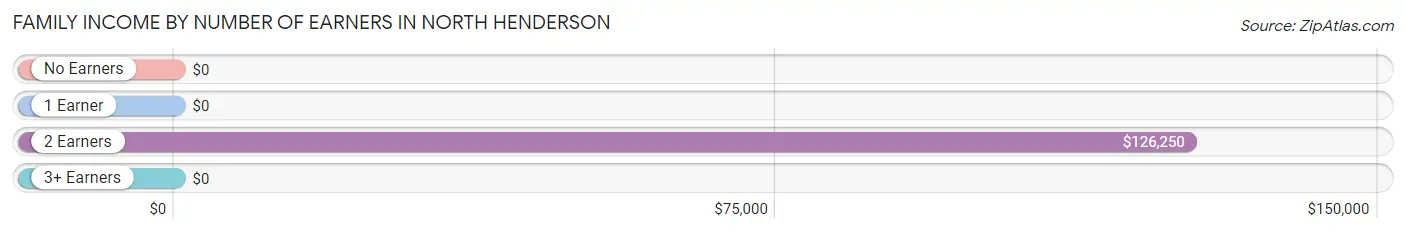
| Number of Earners | # Families | Median Income |
| No Earners | 3 (6.2%) | $0 |
| 1 Earner | 12 (25.0%) | $0 |
| 2 Earners | 32 (66.7%) | $126,250 |
| 3+ Earners | 1 (2.1%) | $0 |
| Total | 48 (100.0%) | $111,250 |
Household Income in North Henderson
Household Income Brackets in North Henderson
With 23 households falling in the category, the $50,000 to $74,999 income range is the most frequent in North Henderson, accounting for 29.5% of all households.
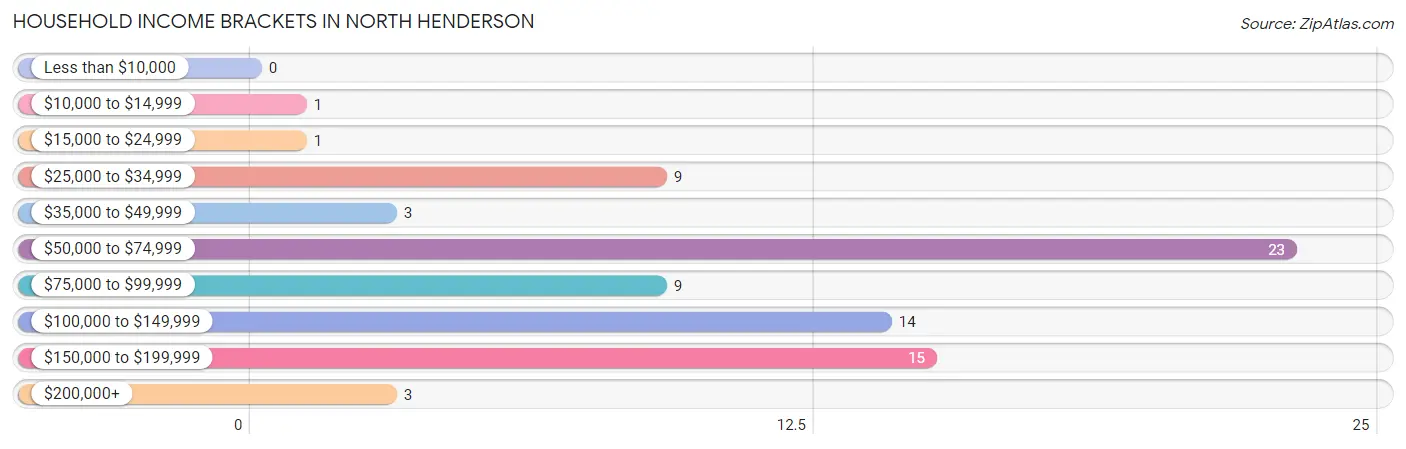
| Income Bracket | # Households | % Households |
| Less than $10,000 | 0 | 0.0% |
| $10,000 to $14,999 | 1 | 1.3% |
| $15,000 to $24,999 | 1 | 1.3% |
| $25,000 to $34,999 | 9 | 11.5% |
| $35,000 to $49,999 | 3 | 3.8% |
| $50,000 to $74,999 | 23 | 29.5% |
| $75,000 to $99,999 | 9 | 11.5% |
| $100,000 to $149,999 | 14 | 17.9% |
| $150,000 to $199,999 | 15 | 19.2% |
| $200,000+ | 3 | 3.8% |
Household Income by Householder Age in North Henderson
The median household income in North Henderson is $77,500, with the highest median household income of $104,375 found in the 25 to 44 years age bracket for the primary householder. A total of 40 households (51.3%) fall into this category.
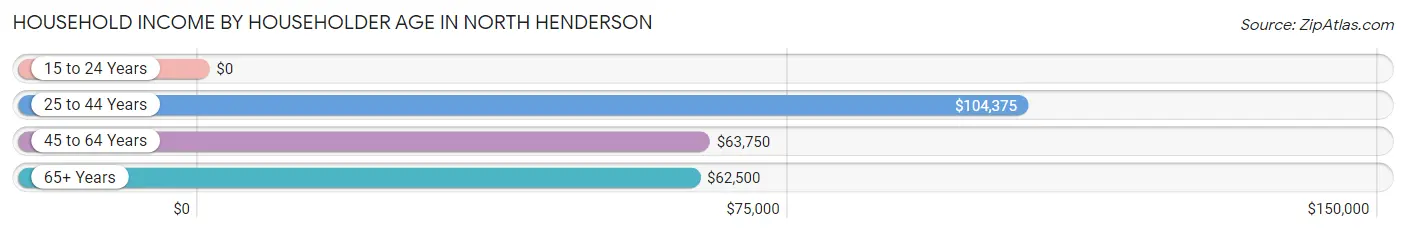
| Income Bracket | # Households | Median Income |
| 15 to 24 Years | 0 (0.0%) | $0 |
| 25 to 44 Years | 40 (51.3%) | $104,375 |
| 45 to 64 Years | 24 (30.8%) | $63,750 |
| 65+ Years | 14 (17.9%) | $62,500 |
| Total | 78 (100.0%) | $77,500 |
Poverty in North Henderson
Income Below Poverty by Sex and Age in North Henderson
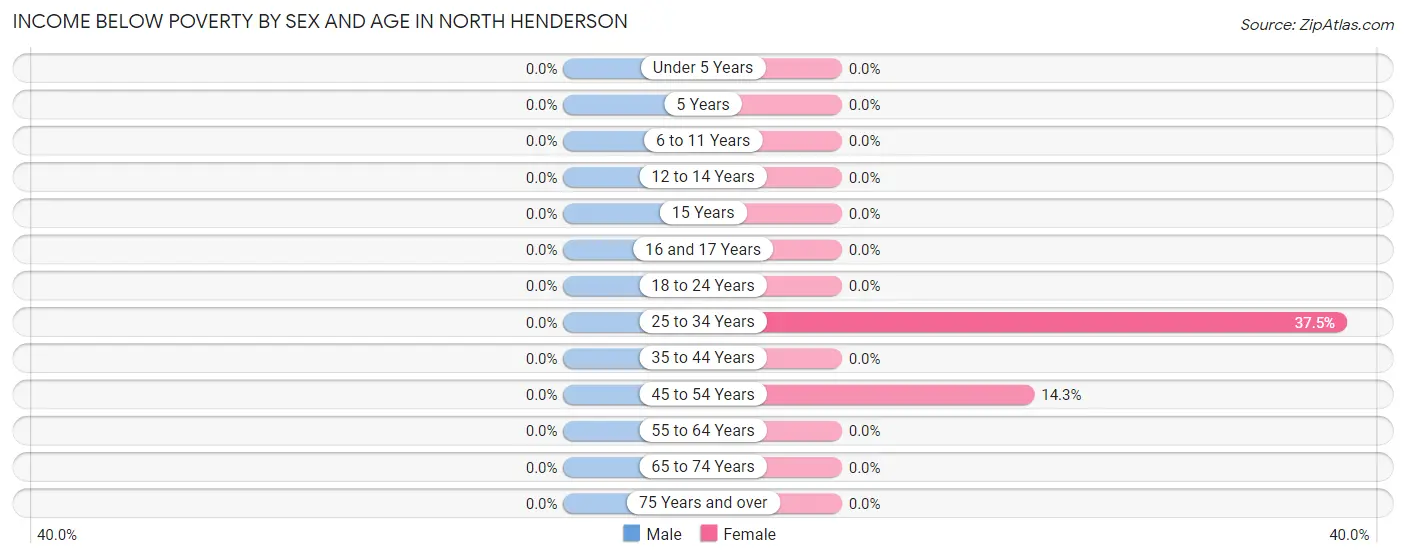
| Age Bracket | Male | Female |
| Under 5 Years | 0 (0.0%) | 0 (0.0%) |
| 5 Years | 0 (0.0%) | 0 (0.0%) |
| 6 to 11 Years | 0 (0.0%) | 0 (0.0%) |
| 12 to 14 Years | 0 (0.0%) | 0 (0.0%) |
| 15 Years | 0 (0.0%) | 0 (0.0%) |
| 16 and 17 Years | 0 (0.0%) | 0 (0.0%) |
| 18 to 24 Years | 0 (0.0%) | 0 (0.0%) |
| 25 to 34 Years | 0 (0.0%) | 3 (37.5%) |
| 35 to 44 Years | 0 (0.0%) | 0 (0.0%) |
| 45 to 54 Years | 0 (0.0%) | 1 (14.3%) |
| 55 to 64 Years | 0 (0.0%) | 0 (0.0%) |
| 65 to 74 Years | 0 (0.0%) | 0 (0.0%) |
| 75 Years and over | 0 (0.0%) | 0 (0.0%) |
| Total | 0 (0.0%) | 4 (5.9%) |
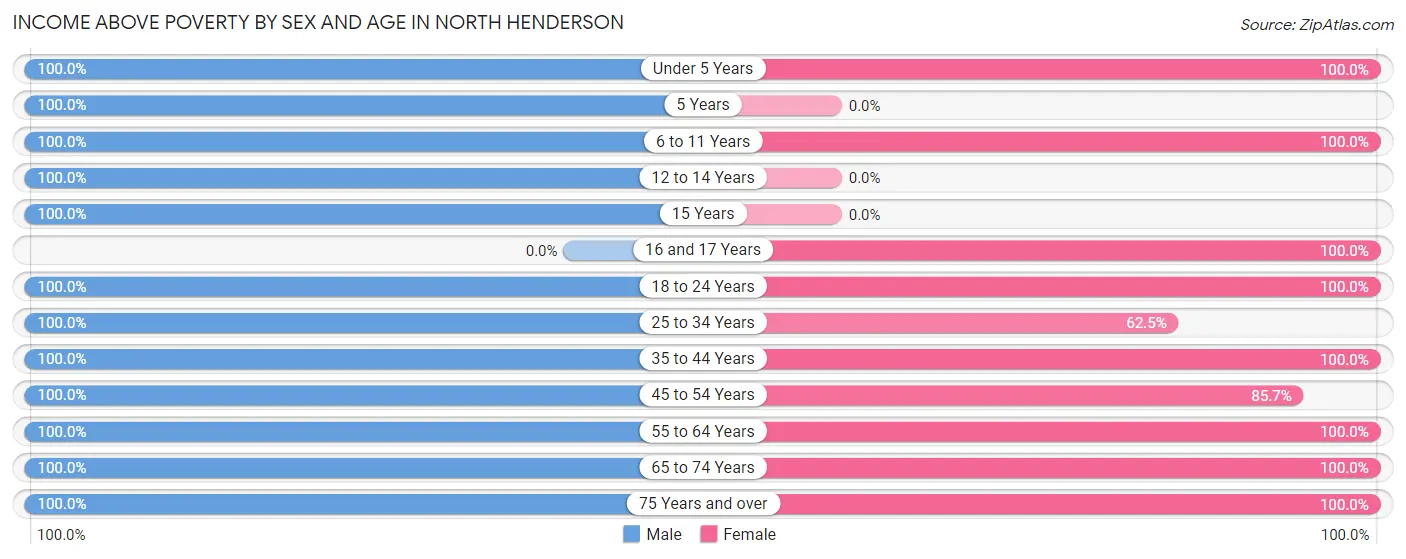
Income Above Poverty by Sex and Age in North Henderson
According to the poverty statistics in North Henderson, males aged under 5 years and females aged under 5 years are the age groups that are most secure financially, with 100.0% of males and 100.0% of females in these age groups living above the poverty line.
| Age Bracket | Male | Female |
| Under 5 Years | 1 (100.0%) | 10 (100.0%) |
| 5 Years | 1 (100.0%) | 0 (0.0%) |
| 6 to 11 Years | 12 (100.0%) | 3 (100.0%) |
| 12 to 14 Years | 8 (100.0%) | 0 (0.0%) |
| 15 Years | 1 (100.0%) | 0 (0.0%) |
| 16 and 17 Years | 0 (0.0%) | 1 (100.0%) |
| 18 to 24 Years | 26 (100.0%) | 5 (100.0%) |
| 25 to 34 Years | 28 (100.0%) | 5 (62.5%) |
| 35 to 44 Years | 17 (100.0%) | 16 (100.0%) |
| 45 to 54 Years | 11 (100.0%) | 6 (85.7%) |
| 55 to 64 Years | 14 (100.0%) | 8 (100.0%) |
| 65 to 74 Years | 4 (100.0%) | 5 (100.0%) |
| 75 Years and over | 8 (100.0%) | 5 (100.0%) |
| Total | 131 (100.0%) | 64 (94.1%) |
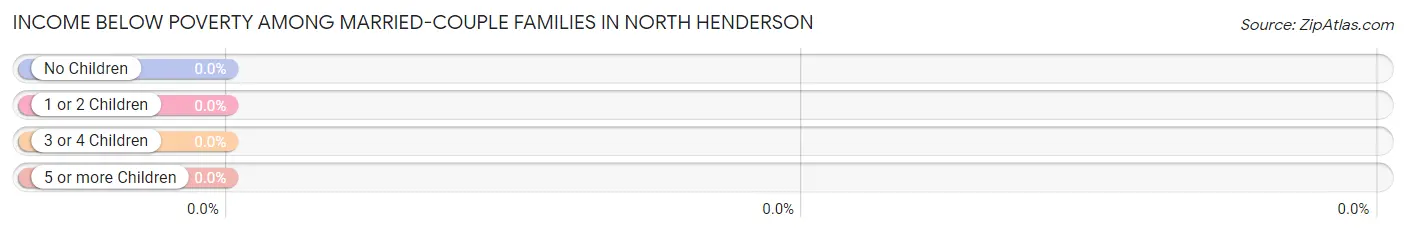
Income Below Poverty Among Married-Couple Families in North Henderson
| Children | Above Poverty | Below Poverty |
| No Children | 19 (100.0%) | 0 (0.0%) |
| 1 or 2 Children | 22 (100.0%) | 0 (0.0%) |
| 3 or 4 Children | 1 (100.0%) | 0 (0.0%) |
| 5 or more Children | 0 (0.0%) | 0 (0.0%) |
| Total | 42 (100.0%) | 0 (0.0%) |
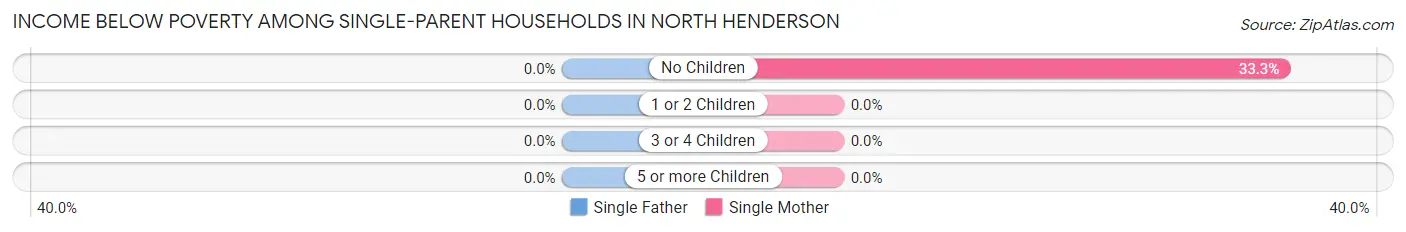
Income Below Poverty Among Single-Parent Households in North Henderson
| Children | Single Father | Single Mother |
| No Children | 0 (0.0%) | 1 (33.3%) |
| 1 or 2 Children | 0 (0.0%) | 0 (0.0%) |
| 3 or 4 Children | 0 (0.0%) | 0 (0.0%) |
| 5 or more Children | 0 (0.0%) | 0 (0.0%) |
| Total | 0 (0.0%) | 1 (25.0%) |
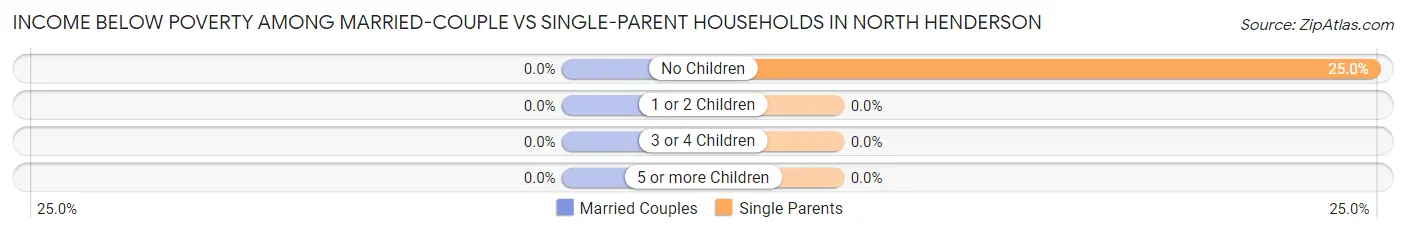
Income Below Poverty Among Married-Couple vs Single-Parent Households in North Henderson
| Children | Married-Couple Families | Single-Parent Households |
| No Children | 0 (0.0%) | 1 (25.0%) |
| 1 or 2 Children | 0 (0.0%) | 0 (0.0%) |
| 3 or 4 Children | 0 (0.0%) | 0 (0.0%) |
| 5 or more Children | 0 (0.0%) | 0 (0.0%) |
| Total | 0 (0.0%) | 1 (16.7%) |
Employment Characteristics in North Henderson
Employment by Class of Employer in North Henderson
Among the 104 employed individuals in North Henderson, private company employees (72 | 69.2%), federal government employees (20 | 19.2%), and not-for-profit organizations (4 | 3.8%) make up the most common classes of employment.
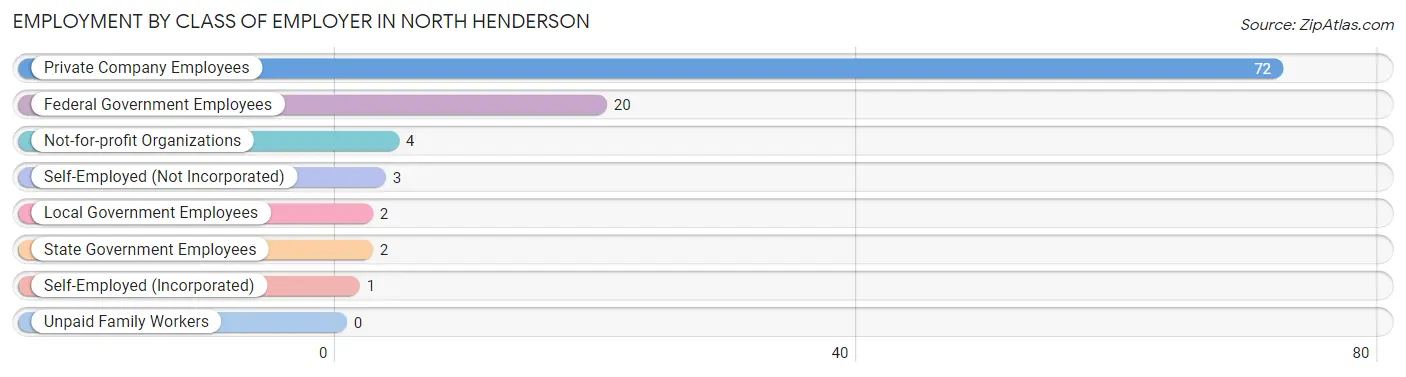
| Employer Class | # Employees | % Employees |
| Private Company Employees | 72 | 69.2% |
| Self-Employed (Incorporated) | 1 | 1.0% |
| Self-Employed (Not Incorporated) | 3 | 2.9% |
| Not-for-profit Organizations | 4 | 3.8% |
| Local Government Employees | 2 | 1.9% |
| State Government Employees | 2 | 1.9% |
| Federal Government Employees | 20 | 19.2% |
| Unpaid Family Workers | 0 | 0.0% |
| Total | 104 | 100.0% |
Employment Status by Age in North Henderson
According to the labor force statistics for North Henderson, out of the total population over 16 years of age (163), 66.3% or 108 individuals are in the labor force, with 3.7% or 4 of them unemployed. The age group with the highest labor force participation rate is 20 to 24 years, with 100.0% or 9 individuals in the labor force. Within the labor force, the 16 to 19 years age range has the highest percentage of unemployed individuals, with 50.0% or 1 of them being unemployed.
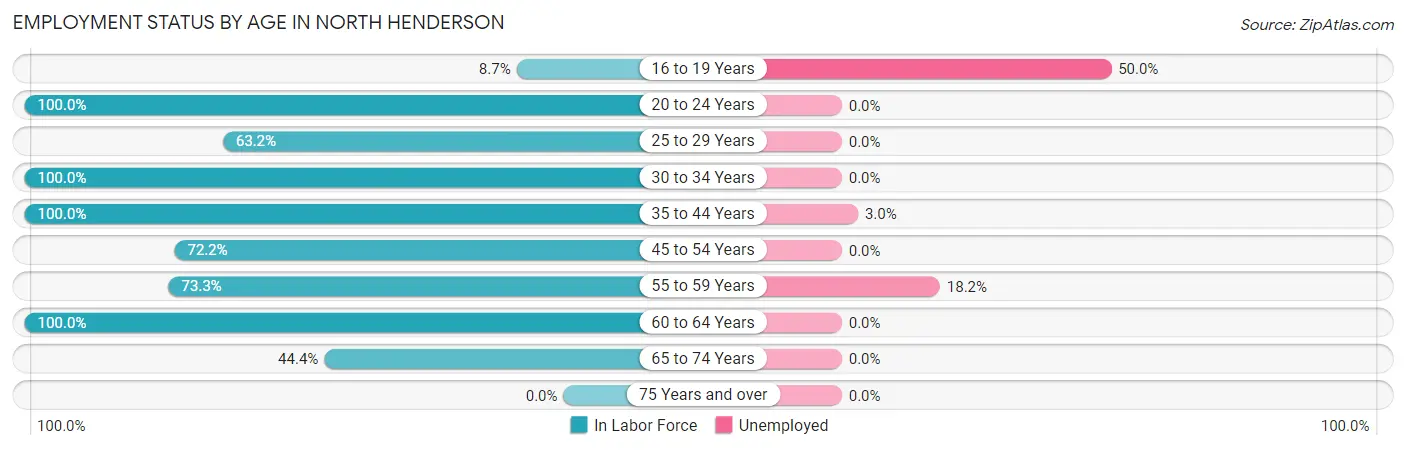
| Age Bracket | In Labor Force | Unemployed |
| 16 to 19 Years | 2 (8.7%) | 1 (50.0%) |
| 20 to 24 Years | 9 (100.0%) | 0 (0.0%) |
| 25 to 29 Years | 12 (63.2%) | 0 (0.0%) |
| 30 to 34 Years | 17 (100.0%) | 0 (0.0%) |
| 35 to 44 Years | 33 (100.0%) | 1 (3.0%) |
| 45 to 54 Years | 13 (72.2%) | 0 (0.0%) |
| 55 to 59 Years | 11 (73.3%) | 2 (18.2%) |
| 60 to 64 Years | 7 (100.0%) | 0 (0.0%) |
| 65 to 74 Years | 4 (44.4%) | 0 (0.0%) |
| 75 Years and over | 0 (0.0%) | 0 (0.0%) |
| Total | 108 (66.3%) | 4 (3.7%) |
Employment Status by Educational Attainment in North Henderson
According to labor force statistics for North Henderson, 85.3% of individuals (93) out of the total population between 25 and 64 years of age (109) are in the labor force, with 3.2% or 3 of them being unemployed. The group with the highest labor force participation rate are those with the educational attainment of college / associate degree, with 91.1% or 51 individuals in the labor force. Within the labor force, individuals with college / associate degree education have the highest percentage of unemployment, with 5.9% or 3 of them being unemployed.
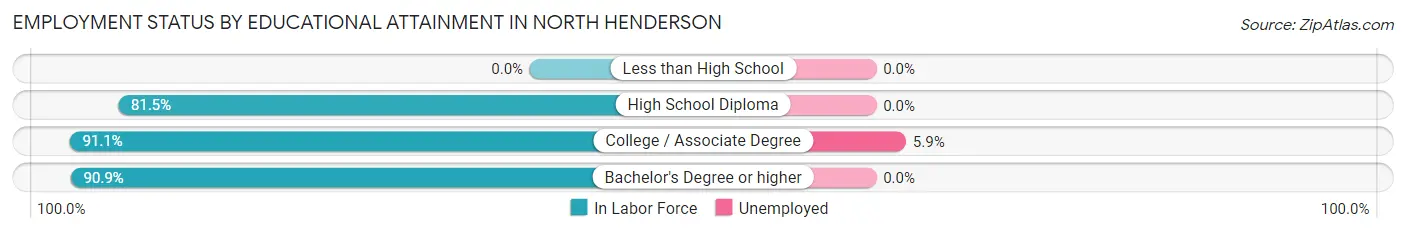
| Educational Attainment | In Labor Force | Unemployed |
| Less than High School | 0 (0.0%) | 0 (0.0%) |
| High School Diploma | 22 (81.5%) | 0 (0.0%) |
| College / Associate Degree | 51 (91.1%) | 3 (5.9%) |
| Bachelor's Degree or higher | 20 (90.9%) | 0 (0.0%) |
| Total | 93 (85.3%) | 3 (3.2%) |
Employment Occupations by Sex in North Henderson
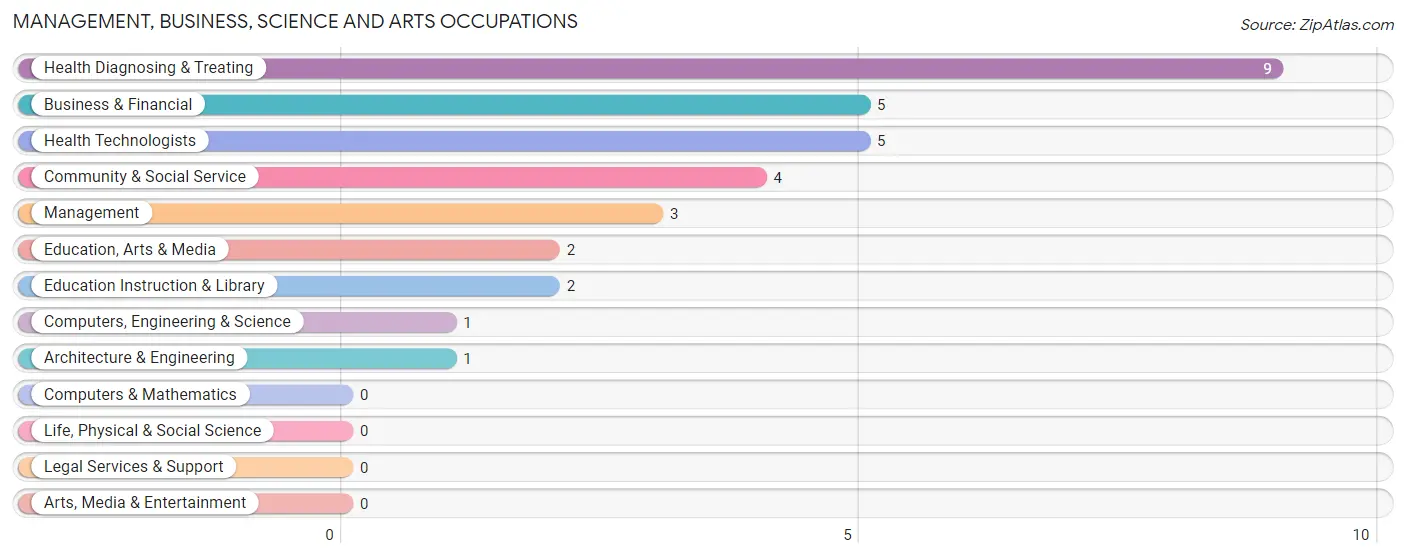
Management, Business, Science and Arts Occupations
The most common Management, Business, Science and Arts occupations in North Henderson are Health Diagnosing & Treating (9 | 8.6%), Business & Financial (5 | 4.8%), Health Technologists (5 | 4.8%), Community & Social Service (4 | 3.8%), and Management (3 | 2.9%).
Management, Business, Science and Arts Occupations by Sex
Within the Management, Business, Science and Arts occupations in North Henderson, the most male-oriented occupations are Management (100.0%), Computers, Engineering & Science (100.0%), and Architecture & Engineering (100.0%), while the most female-oriented occupations are Community & Social Service (100.0%), Education, Arts & Media (100.0%), and Education Instruction & Library (100.0%).

| Occupation | Male | Female |
| Management | 3 (100.0%) | 0 (0.0%) |
| Business & Financial | 2 (40.0%) | 3 (60.0%) |
| Computers, Engineering & Science | 1 (100.0%) | 0 (0.0%) |
| Computers & Mathematics | 0 (0.0%) | 0 (0.0%) |
| Architecture & Engineering | 1 (100.0%) | 0 (0.0%) |
| Life, Physical & Social Science | 0 (0.0%) | 0 (0.0%) |
| Community & Social Service | 0 (0.0%) | 4 (100.0%) |
| Education, Arts & Media | 0 (0.0%) | 2 (100.0%) |
| Legal Services & Support | 0 (0.0%) | 0 (0.0%) |
| Education Instruction & Library | 0 (0.0%) | 2 (100.0%) |
| Arts, Media & Entertainment | 0 (0.0%) | 0 (0.0%) |
| Health Diagnosing & Treating | 2 (22.2%) | 7 (77.8%) |
| Health Technologists | 2 (40.0%) | 3 (60.0%) |
| Total (Category) | 8 (36.4%) | 14 (63.6%) |
| Total (Overall) | 67 (64.4%) | 37 (35.6%) |
Services Occupations
The most common Services occupations in North Henderson are Healthcare Support (1 | 1.0%), and Cleaning & Maintenance (1 | 1.0%).
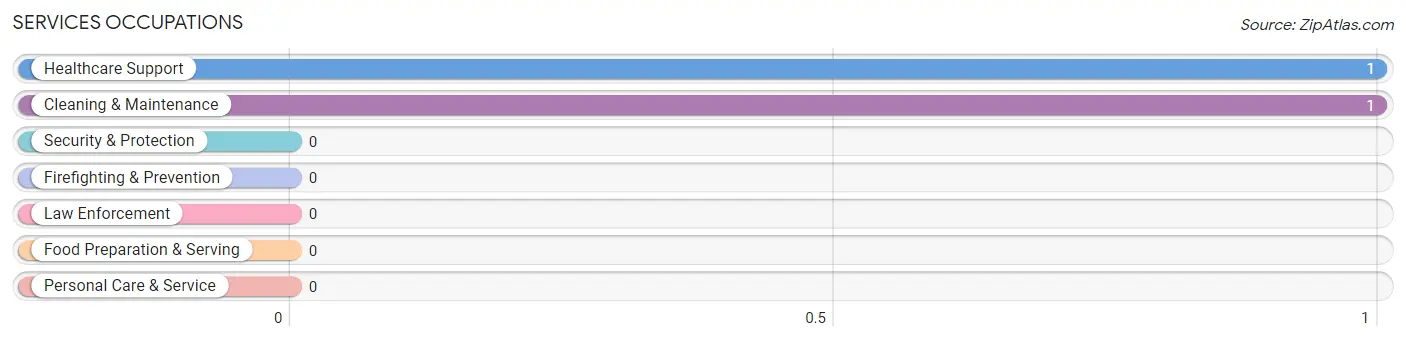
Services Occupations by Sex
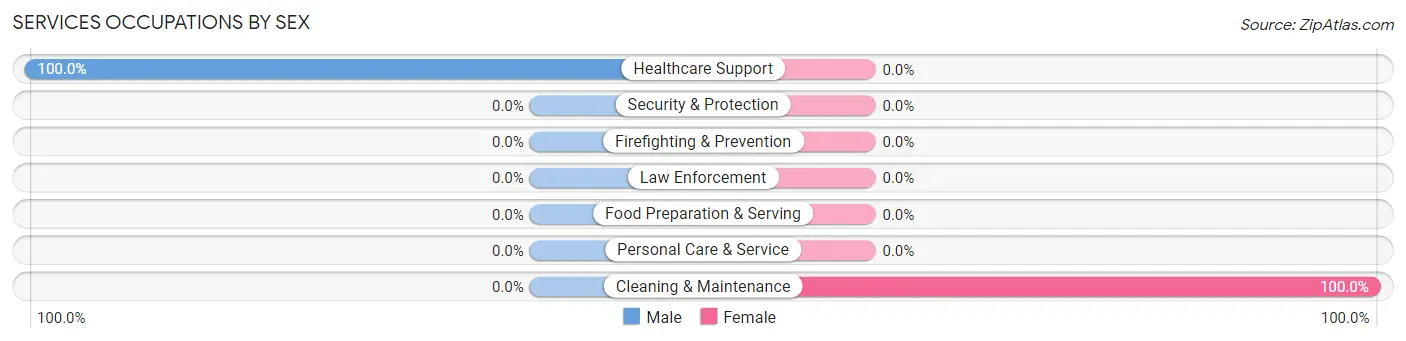
| Occupation | Male | Female |
| Healthcare Support | 1 (100.0%) | 0 (0.0%) |
| Security & Protection | 0 (0.0%) | 0 (0.0%) |
| Firefighting & Prevention | 0 (0.0%) | 0 (0.0%) |
| Law Enforcement | 0 (0.0%) | 0 (0.0%) |
| Food Preparation & Serving | 0 (0.0%) | 0 (0.0%) |
| Cleaning & Maintenance | 0 (0.0%) | 1 (100.0%) |
| Personal Care & Service | 0 (0.0%) | 0 (0.0%) |
| Total (Category) | 1 (50.0%) | 1 (50.0%) |
| Total (Overall) | 67 (64.4%) | 37 (35.6%) |
Sales and Office Occupations
The most common Sales and Office occupations in North Henderson are Office & Administration (7 | 6.7%), and Sales & Related (4 | 3.8%).
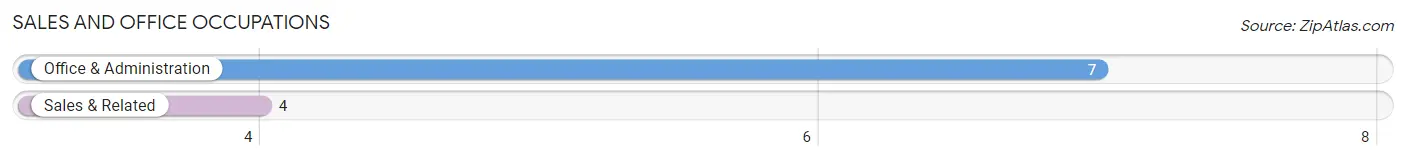
Sales and Office Occupations by Sex
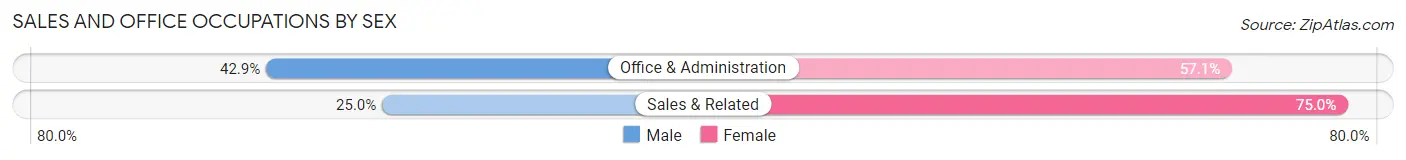
| Occupation | Male | Female |
| Sales & Related | 1 (25.0%) | 3 (75.0%) |
| Office & Administration | 3 (42.9%) | 4 (57.1%) |
| Total (Category) | 4 (36.4%) | 7 (63.6%) |
| Total (Overall) | 67 (64.4%) | 37 (35.6%) |
Natural Resources, Construction and Maintenance Occupations
The most common Natural Resources, Construction and Maintenance occupations in North Henderson are Construction & Extraction (22 | 21.1%), and Installation, Maintenance & Repair (11 | 10.6%).
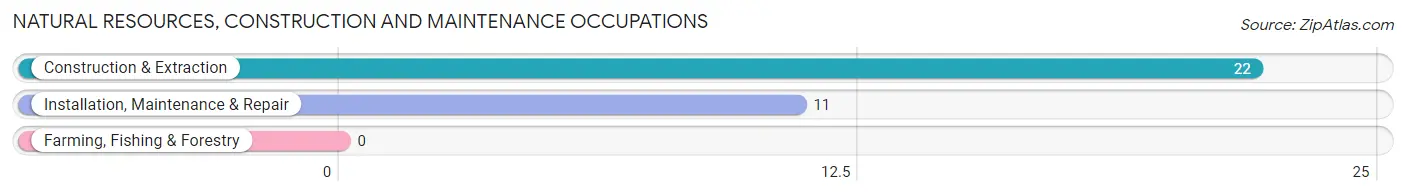
Natural Resources, Construction and Maintenance Occupations by Sex
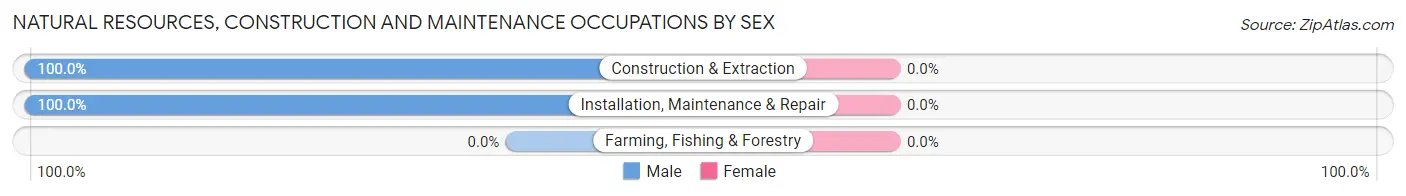
| Occupation | Male | Female |
| Farming, Fishing & Forestry | 0 (0.0%) | 0 (0.0%) |
| Construction & Extraction | 22 (100.0%) | 0 (0.0%) |
| Installation, Maintenance & Repair | 11 (100.0%) | 0 (0.0%) |
| Total (Category) | 33 (100.0%) | 0 (0.0%) |
| Total (Overall) | 67 (64.4%) | 37 (35.6%) |
Production, Transportation and Moving Occupations
The most common Production, Transportation and Moving occupations in North Henderson are Production (17 | 16.4%), Material Moving (14 | 13.5%), and Transportation (5 | 4.8%).
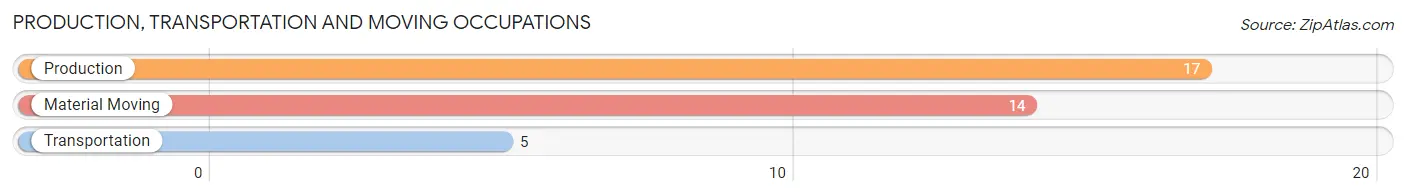
Production, Transportation and Moving Occupations by Sex
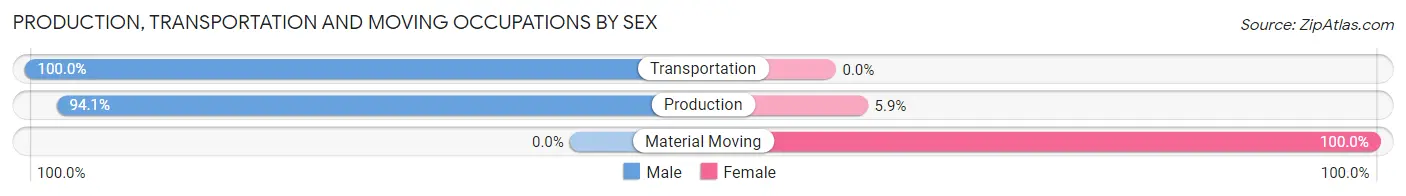
| Occupation | Male | Female |
| Production | 16 (94.1%) | 1 (5.9%) |
| Transportation | 5 (100.0%) | 0 (0.0%) |
| Material Moving | 0 (0.0%) | 14 (100.0%) |
| Total (Category) | 21 (58.3%) | 15 (41.7%) |
| Total (Overall) | 67 (64.4%) | 37 (35.6%) |
Employment Industries by Sex in North Henderson
Employment Industries in North Henderson
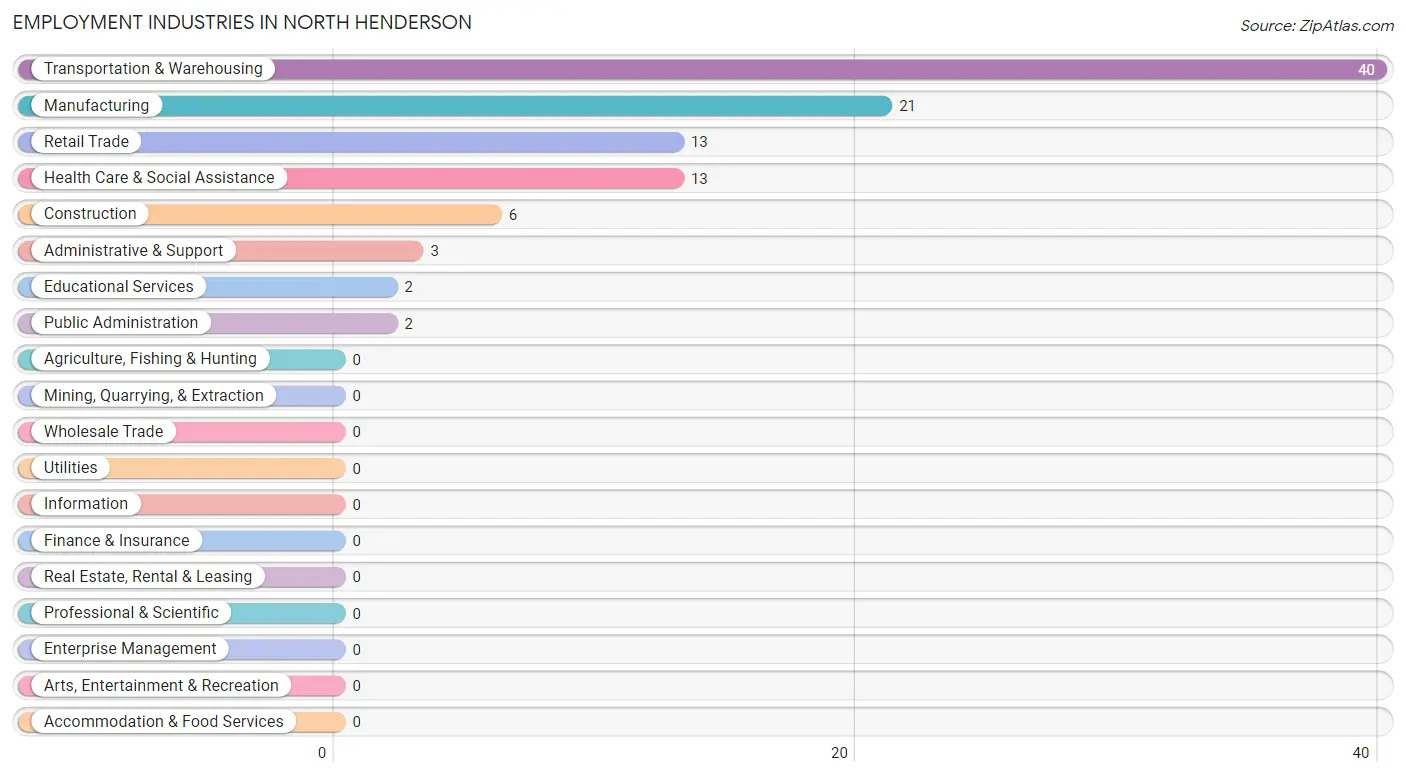
The major employment industries in North Henderson include Transportation & Warehousing (40 | 38.5%), Manufacturing (21 | 20.2%), Retail Trade (13 | 12.5%), Health Care & Social Assistance (13 | 12.5%), and Construction (6 | 5.8%).
Employment Industries by Sex in North Henderson
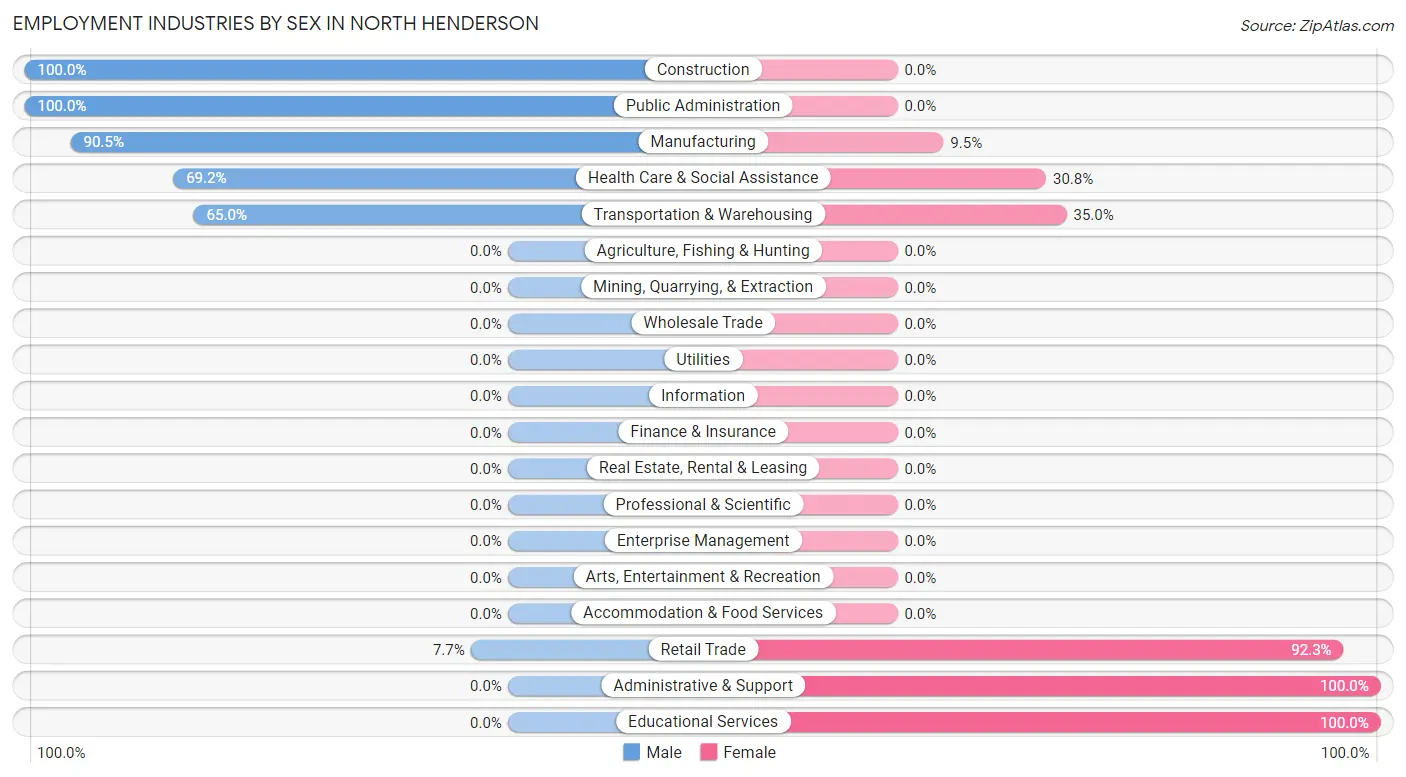
The North Henderson industries that see more men than women are Construction (100.0%), Public Administration (100.0%), and Manufacturing (90.5%), whereas the industries that tend to have a higher number of women are Administrative & Support (100.0%), Educational Services (100.0%), and Retail Trade (92.3%).
| Industry | Male | Female |
| Agriculture, Fishing & Hunting | 0 (0.0%) | 0 (0.0%) |
| Mining, Quarrying, & Extraction | 0 (0.0%) | 0 (0.0%) |
| Construction | 6 (100.0%) | 0 (0.0%) |
| Manufacturing | 19 (90.5%) | 2 (9.5%) |
| Wholesale Trade | 0 (0.0%) | 0 (0.0%) |
| Retail Trade | 1 (7.7%) | 12 (92.3%) |
| Transportation & Warehousing | 26 (65.0%) | 14 (35.0%) |
| Utilities | 0 (0.0%) | 0 (0.0%) |
| Information | 0 (0.0%) | 0 (0.0%) |
| Finance & Insurance | 0 (0.0%) | 0 (0.0%) |
| Real Estate, Rental & Leasing | 0 (0.0%) | 0 (0.0%) |
| Professional & Scientific | 0 (0.0%) | 0 (0.0%) |
| Enterprise Management | 0 (0.0%) | 0 (0.0%) |
| Administrative & Support | 0 (0.0%) | 3 (100.0%) |
| Educational Services | 0 (0.0%) | 2 (100.0%) |
| Health Care & Social Assistance | 9 (69.2%) | 4 (30.8%) |
| Arts, Entertainment & Recreation | 0 (0.0%) | 0 (0.0%) |
| Accommodation & Food Services | 0 (0.0%) | 0 (0.0%) |
| Public Administration | 2 (100.0%) | 0 (0.0%) |
| Total | 67 (64.4%) | 37 (35.6%) |
Education in North Henderson
School Enrollment in North Henderson
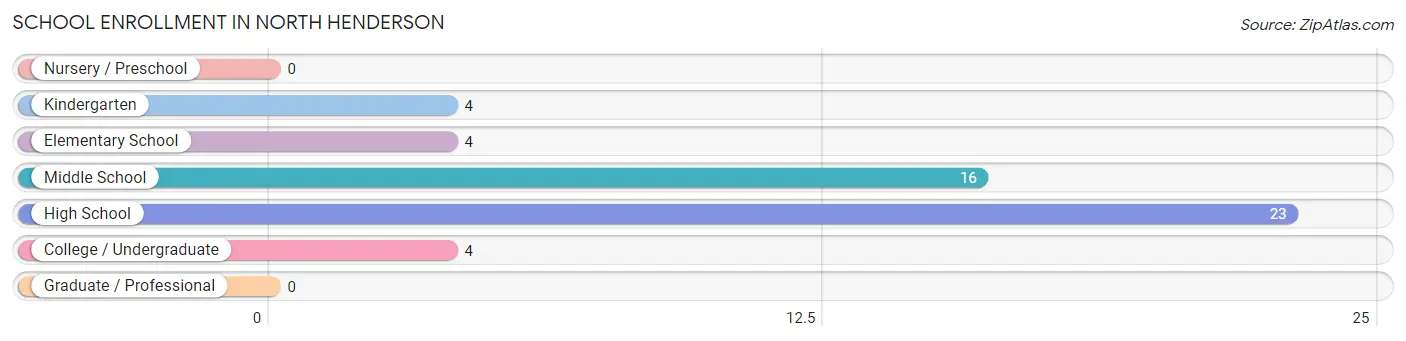
The most common levels of schooling among the 51 students in North Henderson are high school (23 | 45.1%), middle school (16 | 31.4%), and kindergarten (4 | 7.8%).
| School Level | # Students | % Students |
| Nursery / Preschool | 0 | 0.0% |
| Kindergarten | 4 | 7.8% |
| Elementary School | 4 | 7.8% |
| Middle School | 16 | 31.4% |
| High School | 23 | 45.1% |
| College / Undergraduate | 4 | 7.8% |
| Graduate / Professional | 0 | 0.0% |
| Total | 51 | 100.0% |
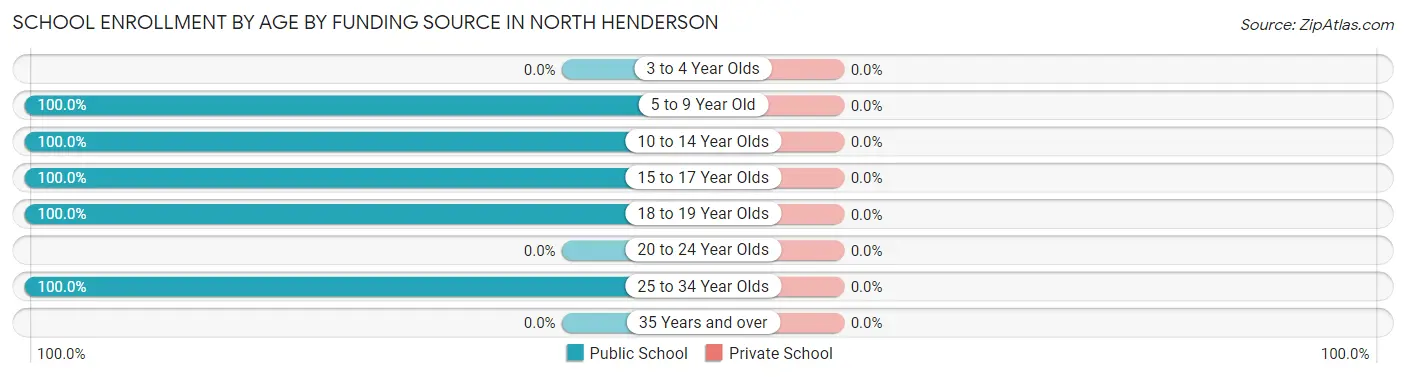
School Enrollment by Age by Funding Source in North Henderson
| Age Bracket | Public School | Private School |
| 3 to 4 Year Olds | 0 (0.0%) | 0 (0.0%) |
| 5 to 9 Year Old | 8 (100.0%) | 0 (0.0%) |
| 10 to 14 Year Olds | 16 (100.0%) | 0 (0.0%) |
| 15 to 17 Year Olds | 2 (100.0%) | 0 (0.0%) |
| 18 to 19 Year Olds | 22 (100.0%) | 0 (0.0%) |
| 20 to 24 Year Olds | 0 (0.0%) | 0 (0.0%) |
| 25 to 34 Year Olds | 3 (100.0%) | 0 (0.0%) |
| 35 Years and over | 0 (0.0%) | 0 (0.0%) |
| Total | 51 (100.0%) | 0 (0.0%) |
Educational Attainment by Field of Study in North Henderson
Business (7 | 23.3%), science & technology (5 | 16.7%), education (4 | 13.3%), social sciences (3 | 10.0%), and liberal arts & history (3 | 10.0%) are the most common fields of study among 30 individuals in North Henderson who have obtained a bachelor's degree or higher.
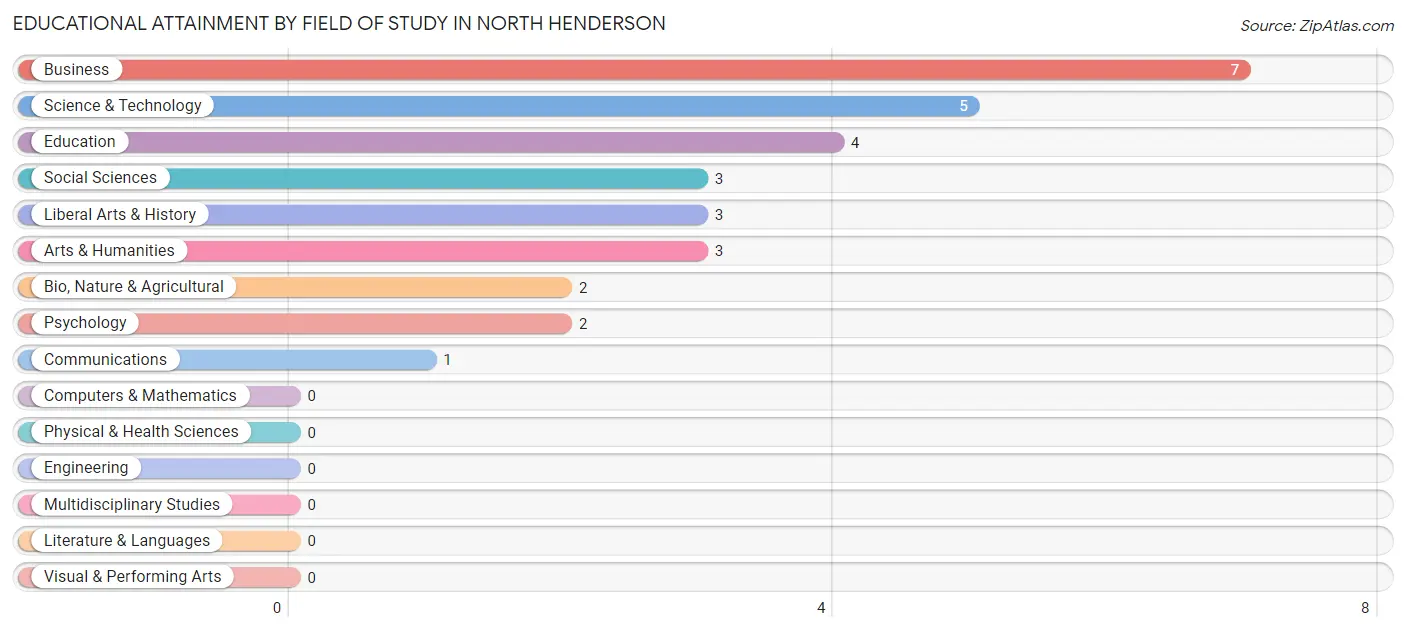
| Field of Study | # Graduates | % Graduates |
| Computers & Mathematics | 0 | 0.0% |
| Bio, Nature & Agricultural | 2 | 6.7% |
| Physical & Health Sciences | 0 | 0.0% |
| Psychology | 2 | 6.7% |
| Social Sciences | 3 | 10.0% |
| Engineering | 0 | 0.0% |
| Multidisciplinary Studies | 0 | 0.0% |
| Science & Technology | 5 | 16.7% |
| Business | 7 | 23.3% |
| Education | 4 | 13.3% |
| Literature & Languages | 0 | 0.0% |
| Liberal Arts & History | 3 | 10.0% |
| Visual & Performing Arts | 0 | 0.0% |
| Communications | 1 | 3.3% |
| Arts & Humanities | 3 | 10.0% |
| Total | 30 | 100.0% |
Transportation & Commute in North Henderson
Vehicle Availability by Sex in North Henderson
The most prevalent vehicle ownership categories in North Henderson are males with 2 vehicles (35, accounting for 52.2%) and females with 2 vehicles (24, making up 94.6%).
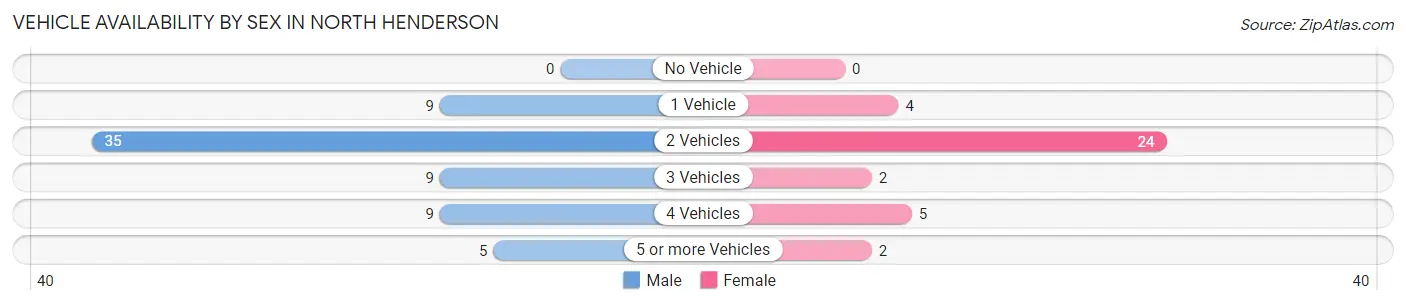
| Vehicles Available | Male | Female |
| No Vehicle | 0 (0.0%) | 0 (0.0%) |
| 1 Vehicle | 9 (13.4%) | 4 (10.8%) |
| 2 Vehicles | 35 (52.2%) | 24 (64.9%) |
| 3 Vehicles | 9 (13.4%) | 2 (5.4%) |
| 4 Vehicles | 9 (13.4%) | 5 (13.5%) |
| 5 or more Vehicles | 5 (7.5%) | 2 (5.4%) |
| Total | 67 (100.0%) | 37 (100.0%) |
Commute Time in North Henderson
The most frequently occuring commute durations in North Henderson are 25 to 29 minutes (28 commuters, 27.7%), 30 to 34 minutes (19 commuters, 18.8%), and 15 to 19 minutes (15 commuters, 14.8%).
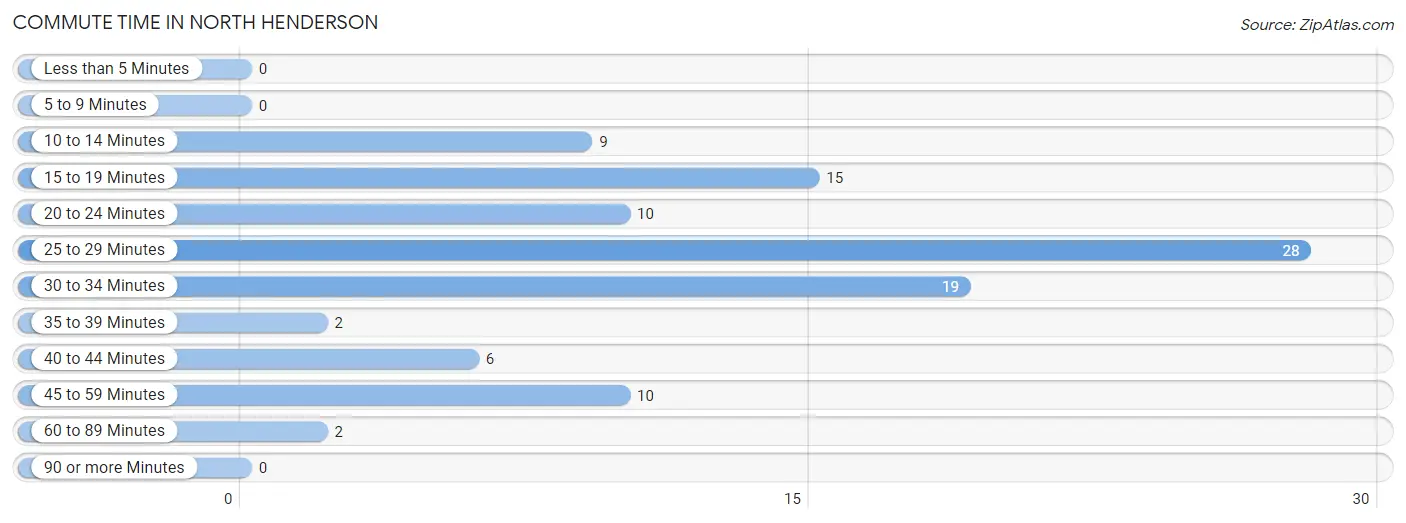
| Commute Time | # Commuters | % Commuters |
| Less than 5 Minutes | 0 | 0.0% |
| 5 to 9 Minutes | 0 | 0.0% |
| 10 to 14 Minutes | 9 | 8.9% |
| 15 to 19 Minutes | 15 | 14.8% |
| 20 to 24 Minutes | 10 | 9.9% |
| 25 to 29 Minutes | 28 | 27.7% |
| 30 to 34 Minutes | 19 | 18.8% |
| 35 to 39 Minutes | 2 | 2.0% |
| 40 to 44 Minutes | 6 | 5.9% |
| 45 to 59 Minutes | 10 | 9.9% |
| 60 to 89 Minutes | 2 | 2.0% |
| 90 or more Minutes | 0 | 0.0% |
Commute Time by Sex in North Henderson
The most common commute times in North Henderson are 25 to 29 minutes (23 commuters, 34.8%) for males and 30 to 34 minutes (19 commuters, 54.3%) for females.
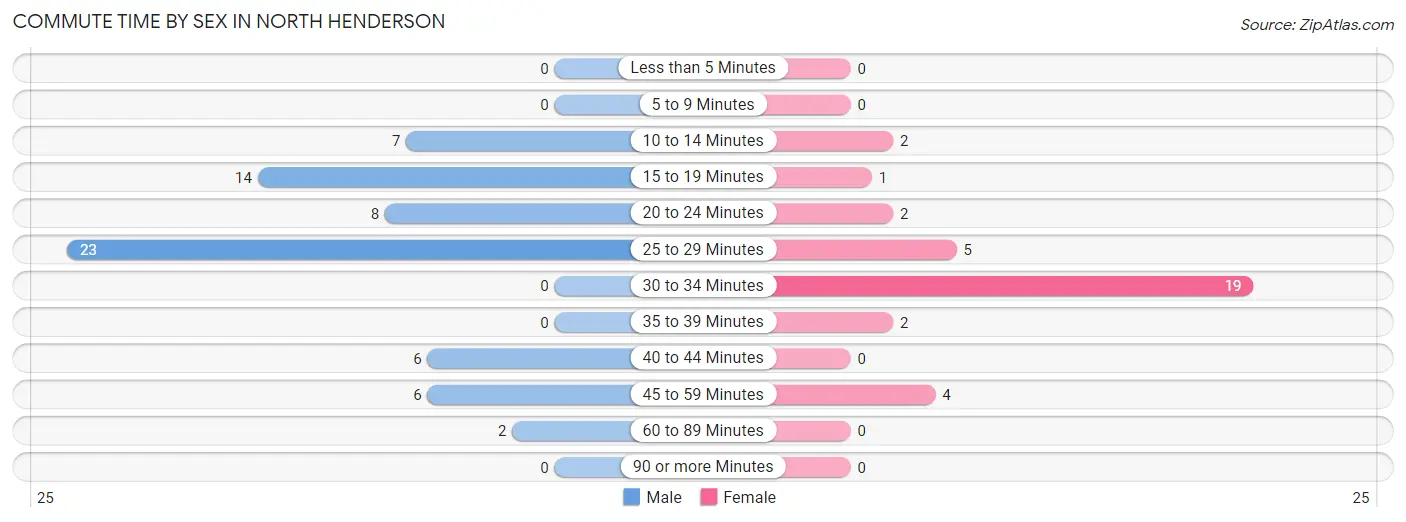
| Commute Time | Male | Female |
| Less than 5 Minutes | 0 (0.0%) | 0 (0.0%) |
| 5 to 9 Minutes | 0 (0.0%) | 0 (0.0%) |
| 10 to 14 Minutes | 7 (10.6%) | 2 (5.7%) |
| 15 to 19 Minutes | 14 (21.2%) | 1 (2.9%) |
| 20 to 24 Minutes | 8 (12.1%) | 2 (5.7%) |
| 25 to 29 Minutes | 23 (34.8%) | 5 (14.3%) |
| 30 to 34 Minutes | 0 (0.0%) | 19 (54.3%) |
| 35 to 39 Minutes | 0 (0.0%) | 2 (5.7%) |
| 40 to 44 Minutes | 6 (9.1%) | 0 (0.0%) |
| 45 to 59 Minutes | 6 (9.1%) | 4 (11.4%) |
| 60 to 89 Minutes | 2 (3.0%) | 0 (0.0%) |
| 90 or more Minutes | 0 (0.0%) | 0 (0.0%) |
Time of Departure to Work by Sex in North Henderson
The most frequent times of departure to work in North Henderson are 6:00 AM to 6:29 AM (16, 24.2%) for males and 6:00 AM to 6:29 AM (17, 48.6%) for females.
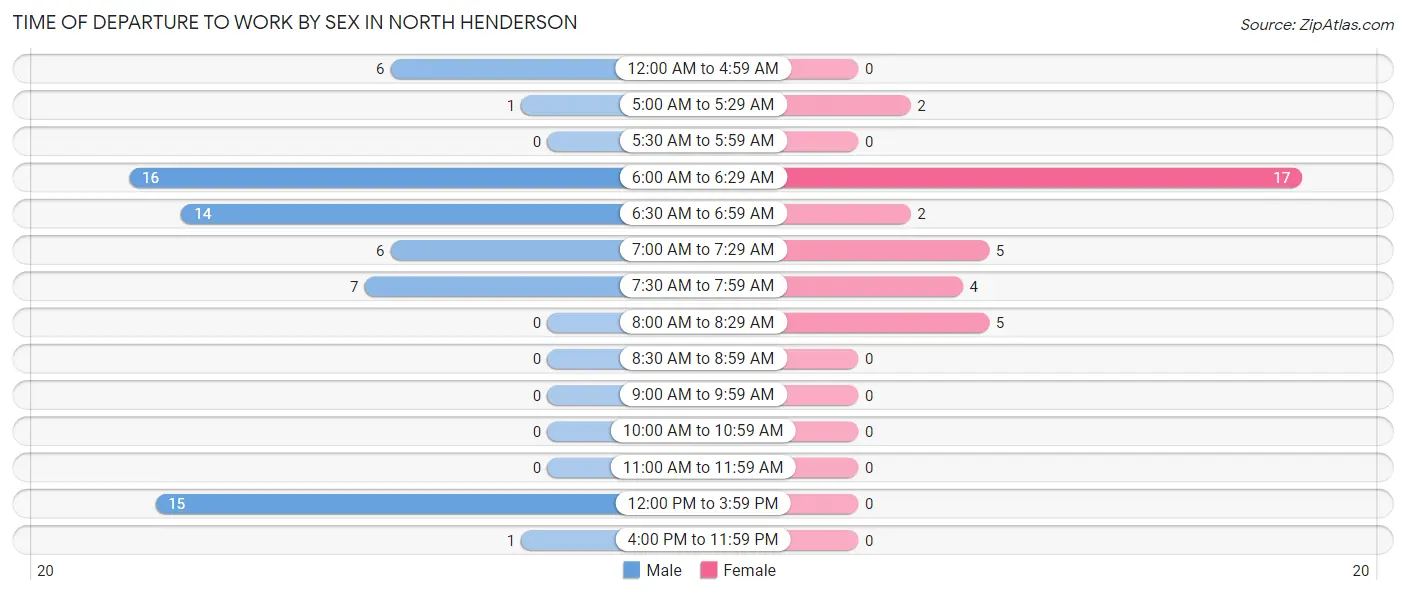
| Time of Departure | Male | Female |
| 12:00 AM to 4:59 AM | 6 (9.1%) | 0 (0.0%) |
| 5:00 AM to 5:29 AM | 1 (1.5%) | 2 (5.7%) |
| 5:30 AM to 5:59 AM | 0 (0.0%) | 0 (0.0%) |
| 6:00 AM to 6:29 AM | 16 (24.2%) | 17 (48.6%) |
| 6:30 AM to 6:59 AM | 14 (21.2%) | 2 (5.7%) |
| 7:00 AM to 7:29 AM | 6 (9.1%) | 5 (14.3%) |
| 7:30 AM to 7:59 AM | 7 (10.6%) | 4 (11.4%) |
| 8:00 AM to 8:29 AM | 0 (0.0%) | 5 (14.3%) |
| 8:30 AM to 8:59 AM | 0 (0.0%) | 0 (0.0%) |
| 9:00 AM to 9:59 AM | 0 (0.0%) | 0 (0.0%) |
| 10:00 AM to 10:59 AM | 0 (0.0%) | 0 (0.0%) |
| 11:00 AM to 11:59 AM | 0 (0.0%) | 0 (0.0%) |
| 12:00 PM to 3:59 PM | 15 (22.7%) | 0 (0.0%) |
| 4:00 PM to 11:59 PM | 1 (1.5%) | 0 (0.0%) |
| Total | 66 (100.0%) | 35 (100.0%) |
Housing Occupancy in North Henderson
Occupancy by Ownership in North Henderson
Of the total 78 dwellings in North Henderson, owner-occupied units account for 74 (94.9%), while renter-occupied units make up 4 (5.1%).
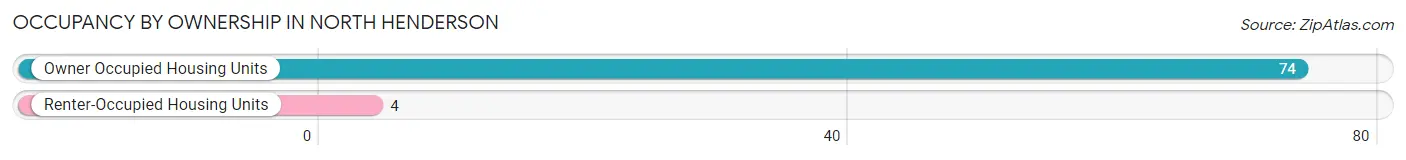
| Occupancy | # Housing Units | % Housing Units |
| Owner Occupied Housing Units | 74 | 94.9% |
| Renter-Occupied Housing Units | 4 | 5.1% |
| Total Occupied Housing Units | 78 | 100.0% |
Occupancy by Household Size in North Henderson
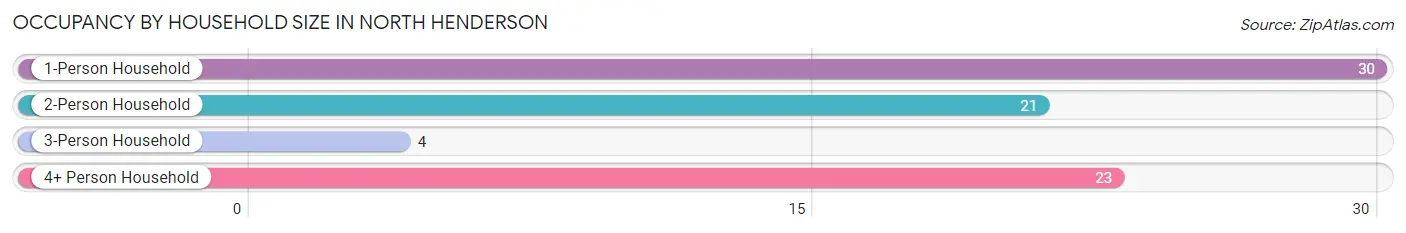
| Household Size | # Housing Units | % Housing Units |
| 1-Person Household | 30 | 38.5% |
| 2-Person Household | 21 | 26.9% |
| 3-Person Household | 4 | 5.1% |
| 4+ Person Household | 23 | 29.5% |
| Total Housing Units | 78 | 100.0% |
Occupancy by Ownership by Household Size in North Henderson
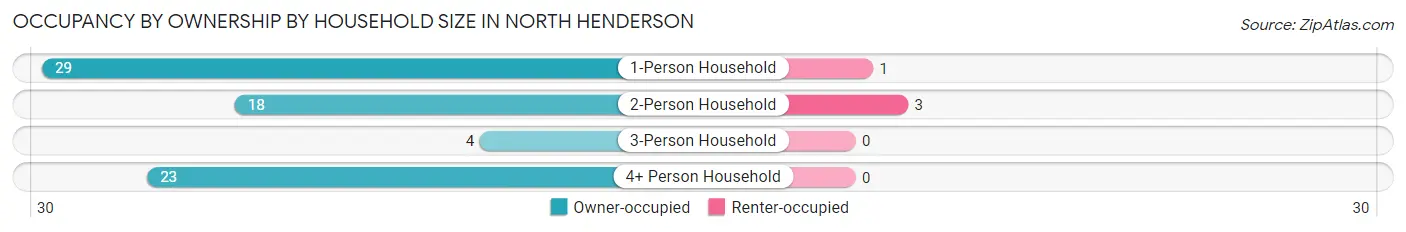
| Household Size | Owner-occupied | Renter-occupied |
| 1-Person Household | 29 (96.7%) | 1 (3.3%) |
| 2-Person Household | 18 (85.7%) | 3 (14.3%) |
| 3-Person Household | 4 (100.0%) | 0 (0.0%) |
| 4+ Person Household | 23 (100.0%) | 0 (0.0%) |
| Total Housing Units | 74 (94.9%) | 4 (5.1%) |
Occupancy by Educational Attainment in North Henderson
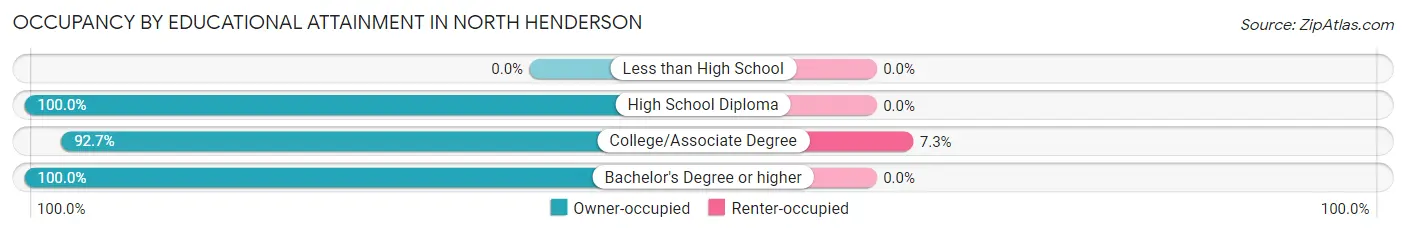
| Household Size | Owner-occupied | Renter-occupied |
| Less than High School | 0 (0.0%) | 0 (0.0%) |
| High School Diploma | 11 (100.0%) | 0 (0.0%) |
| College/Associate Degree | 51 (92.7%) | 4 (7.3%) |
| Bachelor's Degree or higher | 12 (100.0%) | 0 (0.0%) |
Occupancy by Age of Householder in North Henderson
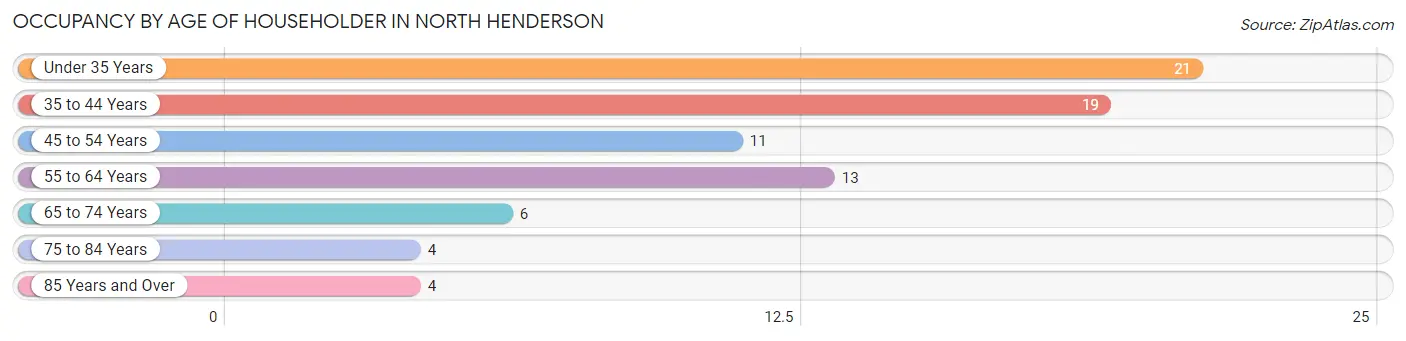
| Age Bracket | # Households | % Households |
| Under 35 Years | 21 | 26.9% |
| 35 to 44 Years | 19 | 24.4% |
| 45 to 54 Years | 11 | 14.1% |
| 55 to 64 Years | 13 | 16.7% |
| 65 to 74 Years | 6 | 7.7% |
| 75 to 84 Years | 4 | 5.1% |
| 85 Years and Over | 4 | 5.1% |
| Total | 78 | 100.0% |
Housing Finances in North Henderson
Median Income by Occupancy in North Henderson
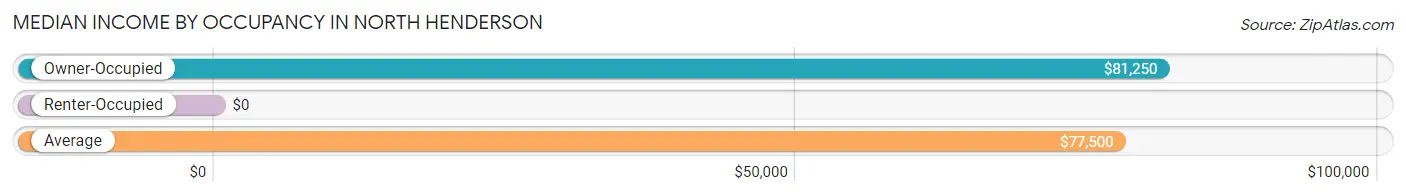
| Occupancy Type | # Households | Median Income |
| Owner-Occupied | 74 (94.9%) | $81,250 |
| Renter-Occupied | 4 (5.1%) | $0 |
| Average | 78 (100.0%) | $77,500 |
Occupancy by Householder Income Bracket in North Henderson
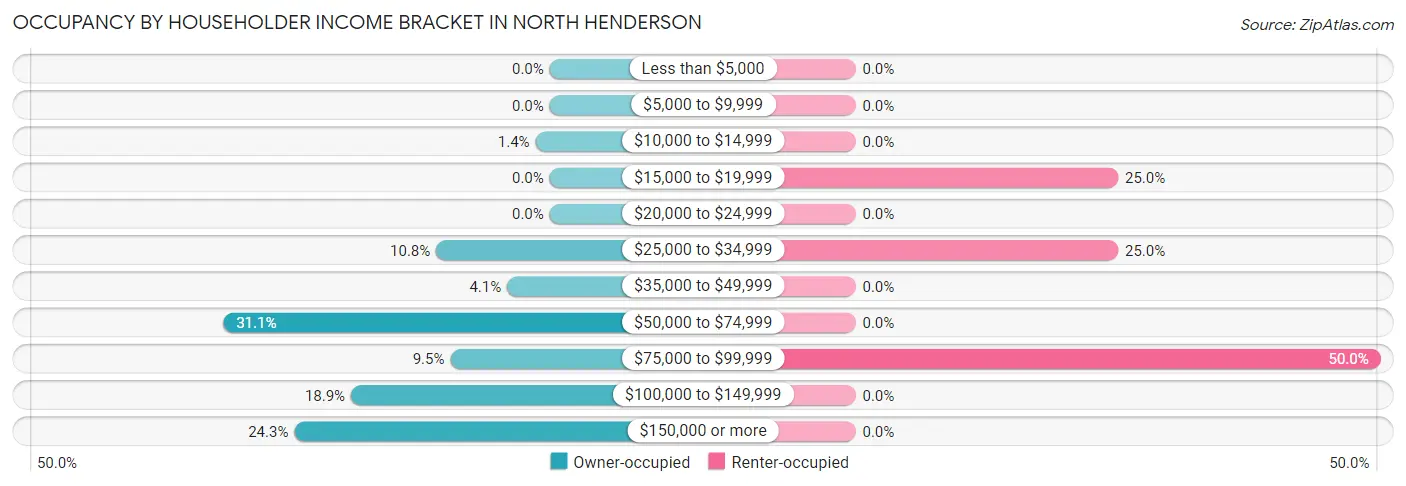
| Income Bracket | Owner-occupied | Renter-occupied |
| Less than $5,000 | 0 (0.0%) | 0 (0.0%) |
| $5,000 to $9,999 | 0 (0.0%) | 0 (0.0%) |
| $10,000 to $14,999 | 1 (1.3%) | 0 (0.0%) |
| $15,000 to $19,999 | 0 (0.0%) | 1 (25.0%) |
| $20,000 to $24,999 | 0 (0.0%) | 0 (0.0%) |
| $25,000 to $34,999 | 8 (10.8%) | 1 (25.0%) |
| $35,000 to $49,999 | 3 (4.1%) | 0 (0.0%) |
| $50,000 to $74,999 | 23 (31.1%) | 0 (0.0%) |
| $75,000 to $99,999 | 7 (9.5%) | 2 (50.0%) |
| $100,000 to $149,999 | 14 (18.9%) | 0 (0.0%) |
| $150,000 or more | 18 (24.3%) | 0 (0.0%) |
| Total | 74 (100.0%) | 4 (100.0%) |
Monthly Housing Cost Tiers in North Henderson
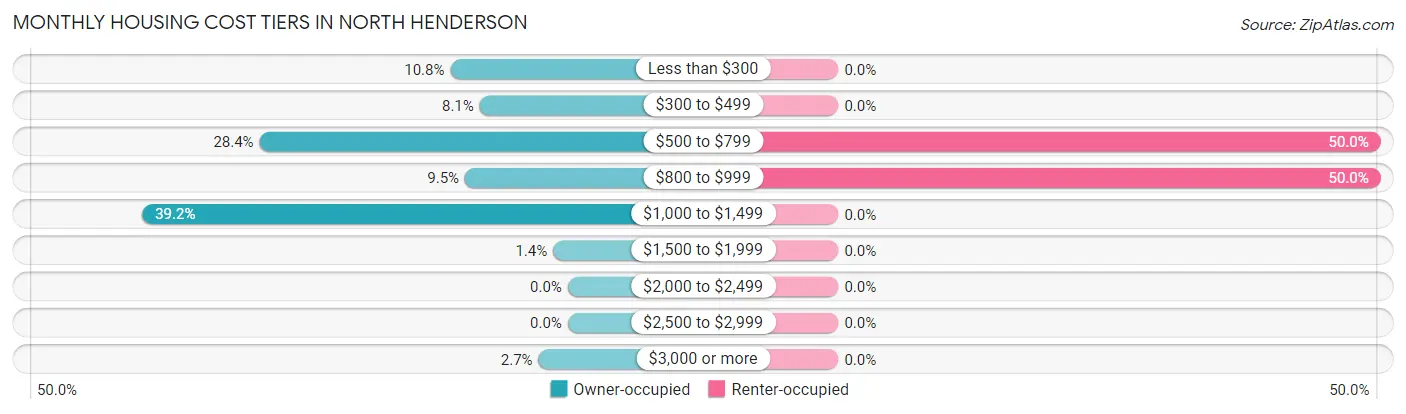
| Monthly Cost | Owner-occupied | Renter-occupied |
| Less than $300 | 8 (10.8%) | 0 (0.0%) |
| $300 to $499 | 6 (8.1%) | 0 (0.0%) |
| $500 to $799 | 21 (28.4%) | 2 (50.0%) |
| $800 to $999 | 7 (9.5%) | 2 (50.0%) |
| $1,000 to $1,499 | 29 (39.2%) | 0 (0.0%) |
| $1,500 to $1,999 | 1 (1.3%) | 0 (0.0%) |
| $2,000 to $2,499 | 0 (0.0%) | 0 (0.0%) |
| $2,500 to $2,999 | 0 (0.0%) | 0 (0.0%) |
| $3,000 or more | 2 (2.7%) | 0 (0.0%) |
| Total | 74 (100.0%) | 4 (100.0%) |
Physical Housing Characteristics in North Henderson
Housing Structures in North Henderson
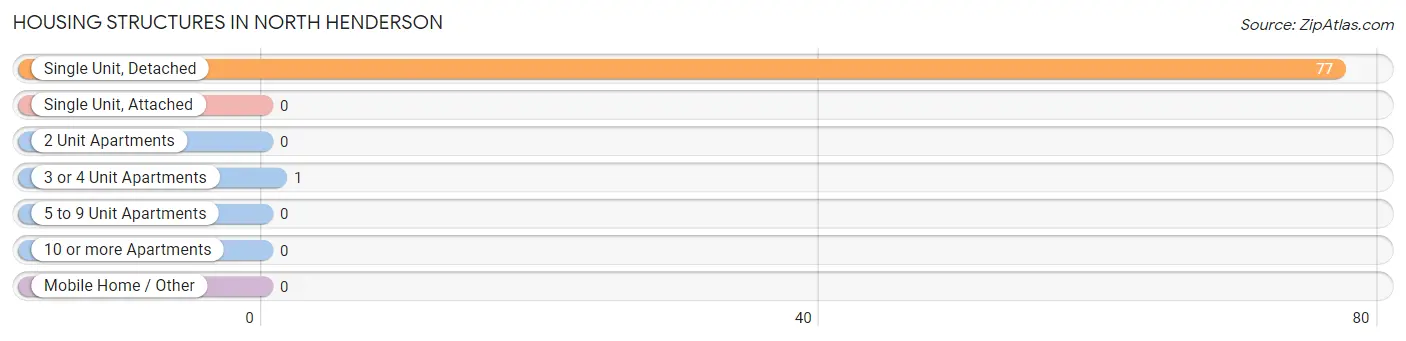
| Structure Type | # Housing Units | % Housing Units |
| Single Unit, Detached | 77 | 98.7% |
| Single Unit, Attached | 0 | 0.0% |
| 2 Unit Apartments | 0 | 0.0% |
| 3 or 4 Unit Apartments | 1 | 1.3% |
| 5 to 9 Unit Apartments | 0 | 0.0% |
| 10 or more Apartments | 0 | 0.0% |
| Mobile Home / Other | 0 | 0.0% |
| Total | 78 | 100.0% |
Housing Structures by Occupancy in North Henderson
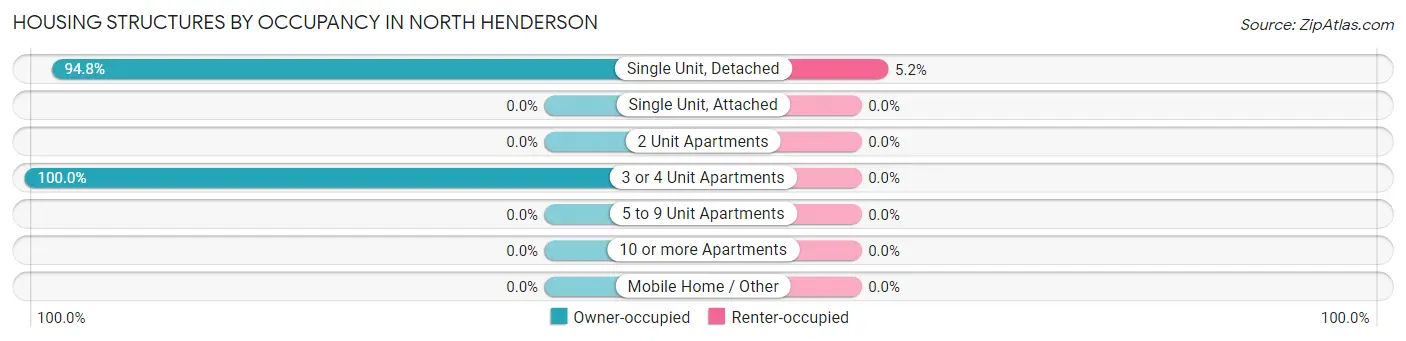
| Structure Type | Owner-occupied | Renter-occupied |
| Single Unit, Detached | 73 (94.8%) | 4 (5.2%) |
| Single Unit, Attached | 0 (0.0%) | 0 (0.0%) |
| 2 Unit Apartments | 0 (0.0%) | 0 (0.0%) |
| 3 or 4 Unit Apartments | 1 (100.0%) | 0 (0.0%) |
| 5 to 9 Unit Apartments | 0 (0.0%) | 0 (0.0%) |
| 10 or more Apartments | 0 (0.0%) | 0 (0.0%) |
| Mobile Home / Other | 0 (0.0%) | 0 (0.0%) |
| Total | 74 (94.9%) | 4 (5.1%) |
Housing Structures by Number of Rooms in North Henderson
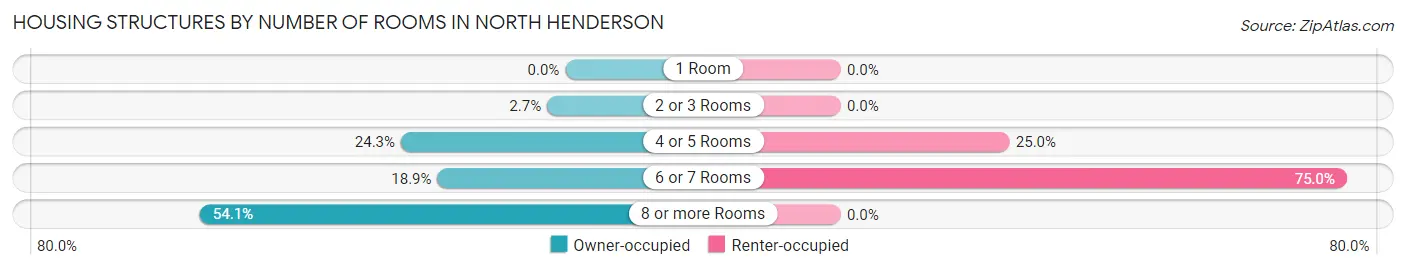
| Number of Rooms | Owner-occupied | Renter-occupied |
| 1 Room | 0 (0.0%) | 0 (0.0%) |
| 2 or 3 Rooms | 2 (2.7%) | 0 (0.0%) |
| 4 or 5 Rooms | 18 (24.3%) | 1 (25.0%) |
| 6 or 7 Rooms | 14 (18.9%) | 3 (75.0%) |
| 8 or more Rooms | 40 (54.0%) | 0 (0.0%) |
| Total | 74 (100.0%) | 4 (100.0%) |
Housing Structure by Heating Type in North Henderson
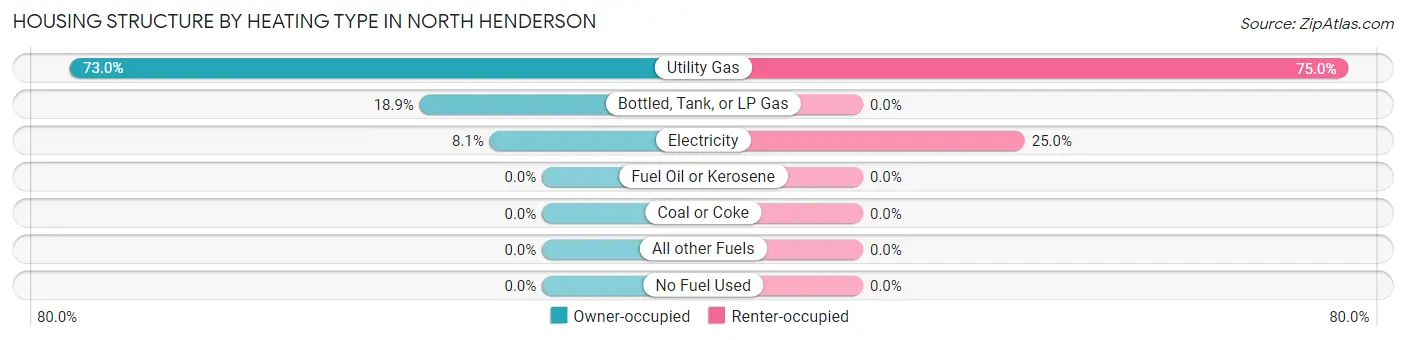
| Heating Type | Owner-occupied | Renter-occupied |
| Utility Gas | 54 (73.0%) | 3 (75.0%) |
| Bottled, Tank, or LP Gas | 14 (18.9%) | 0 (0.0%) |
| Electricity | 6 (8.1%) | 1 (25.0%) |
| Fuel Oil or Kerosene | 0 (0.0%) | 0 (0.0%) |
| Coal or Coke | 0 (0.0%) | 0 (0.0%) |
| All other Fuels | 0 (0.0%) | 0 (0.0%) |
| No Fuel Used | 0 (0.0%) | 0 (0.0%) |
| Total | 74 (100.0%) | 4 (100.0%) |
Household Vehicle Usage in North Henderson
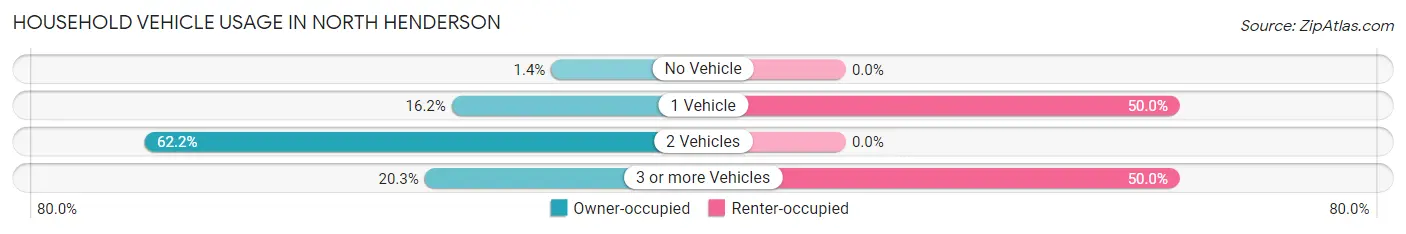
| Vehicles per Household | Owner-occupied | Renter-occupied |
| No Vehicle | 1 (1.3%) | 0 (0.0%) |
| 1 Vehicle | 12 (16.2%) | 2 (50.0%) |
| 2 Vehicles | 46 (62.2%) | 0 (0.0%) |
| 3 or more Vehicles | 15 (20.3%) | 2 (50.0%) |
| Total | 74 (100.0%) | 4 (100.0%) |
Real Estate & Mortgages in North Henderson
Real Estate and Mortgage Overview in North Henderson
| Characteristic | Without Mortgage | With Mortgage |
| Housing Units | 19 | 55 |
| Median Property Value | $53,800 | $94,600 |
| Median Household Income | $68,750 | $17 |
| Monthly Housing Costs | $355 | $2 |
| Real Estate Taxes | - | - |
Property Value by Mortgage Status in North Henderson
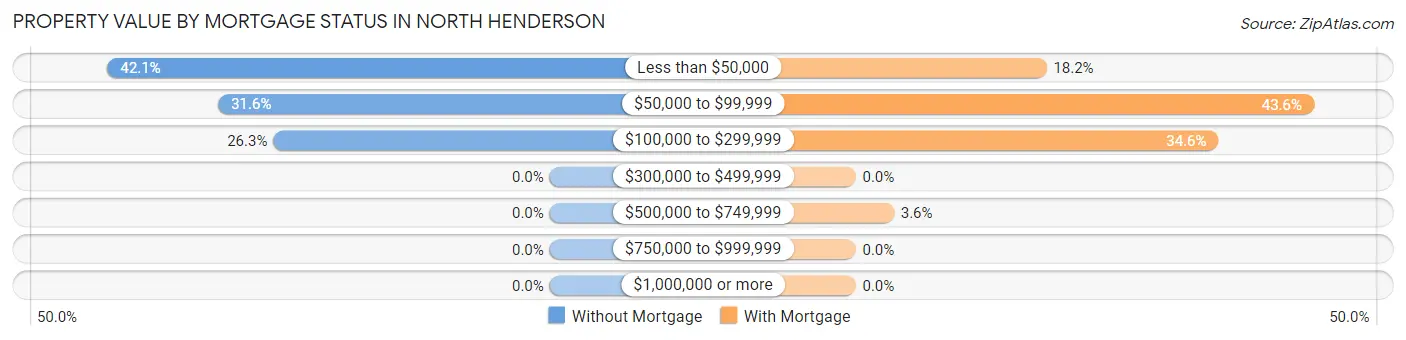
| Property Value | Without Mortgage | With Mortgage |
| Less than $50,000 | 8 (42.1%) | 10 (18.2%) |
| $50,000 to $99,999 | 6 (31.6%) | 24 (43.6%) |
| $100,000 to $299,999 | 5 (26.3%) | 19 (34.5%) |
| $300,000 to $499,999 | 0 (0.0%) | 0 (0.0%) |
| $500,000 to $749,999 | 0 (0.0%) | 2 (3.6%) |
| $750,000 to $999,999 | 0 (0.0%) | 0 (0.0%) |
| $1,000,000 or more | 0 (0.0%) | 0 (0.0%) |
| Total | 19 (100.0%) | 55 (100.0%) |
Household Income by Mortgage Status in North Henderson
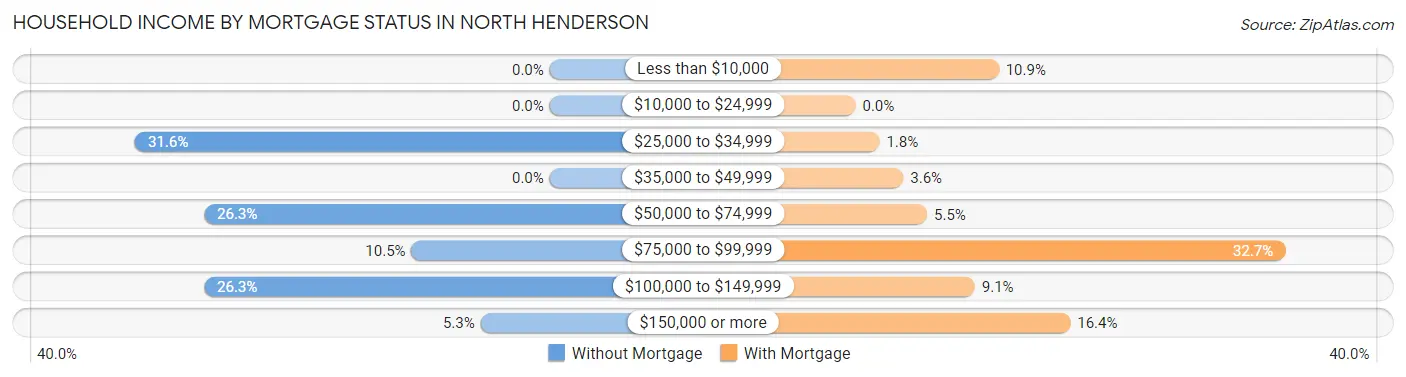
| Household Income | Without Mortgage | With Mortgage |
| Less than $10,000 | 0 (0.0%) | 6 (10.9%) |
| $10,000 to $24,999 | 0 (0.0%) | 0 (0.0%) |
| $25,000 to $34,999 | 6 (31.6%) | 1 (1.8%) |
| $35,000 to $49,999 | 0 (0.0%) | 2 (3.6%) |
| $50,000 to $74,999 | 5 (26.3%) | 3 (5.4%) |
| $75,000 to $99,999 | 2 (10.5%) | 18 (32.7%) |
| $100,000 to $149,999 | 5 (26.3%) | 5 (9.1%) |
| $150,000 or more | 1 (5.3%) | 9 (16.4%) |
| Total | 19 (100.0%) | 55 (100.0%) |
Property Value to Household Income Ratio in North Henderson
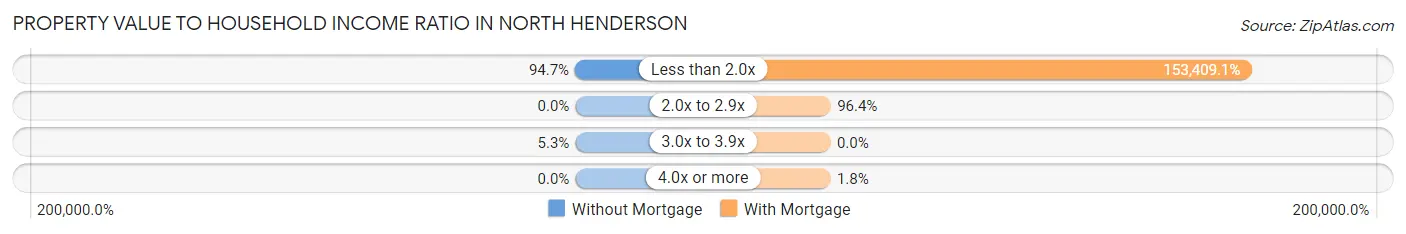
| Value-to-Income Ratio | Without Mortgage | With Mortgage |
| Less than 2.0x | 18 (94.7%) | 84,375 (153,409.1%) |
| 2.0x to 2.9x | 0 (0.0%) | 53 (96.4%) |
| 3.0x to 3.9x | 1 (5.3%) | 0 (0.0%) |
| 4.0x or more | 0 (0.0%) | 1 (1.8%) |
| Total | 19 (100.0%) | 55 (100.0%) |
Real Estate Taxes by Mortgage Status in North Henderson
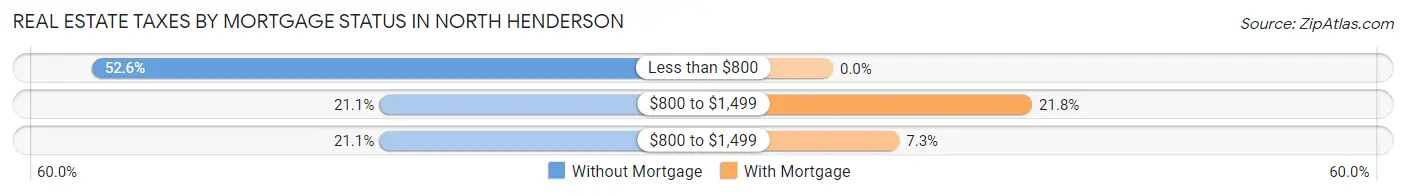
| Property Taxes | Without Mortgage | With Mortgage |
| Less than $800 | 10 (52.6%) | 0 (0.0%) |
| $800 to $1,499 | 4 (21.0%) | 12 (21.8%) |
| $800 to $1,499 | 4 (21.0%) | 4 (7.3%) |
| Total | 19 (100.0%) | 55 (100.0%) |
Health & Disability in North Henderson
Health Insurance Coverage by Age in North Henderson
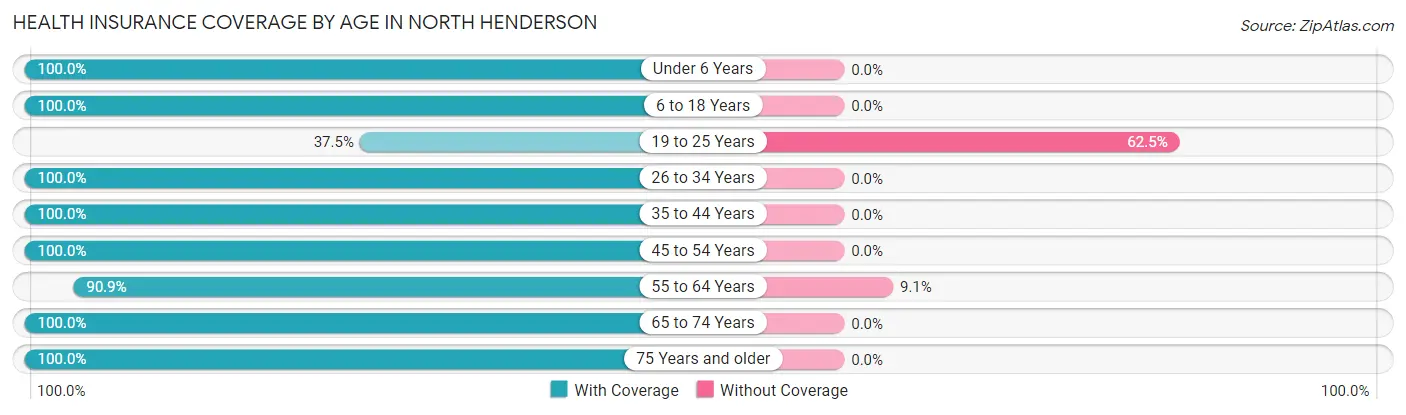
| Age Bracket | With Coverage | Without Coverage |
| Under 6 Years | 12 (100.0%) | 0 (0.0%) |
| 6 to 18 Years | 25 (100.0%) | 0 (0.0%) |
| 19 to 25 Years | 15 (37.5%) | 25 (62.5%) |
| 26 to 34 Years | 27 (100.0%) | 0 (0.0%) |
| 35 to 44 Years | 33 (100.0%) | 0 (0.0%) |
| 45 to 54 Years | 18 (100.0%) | 0 (0.0%) |
| 55 to 64 Years | 20 (90.9%) | 2 (9.1%) |
| 65 to 74 Years | 9 (100.0%) | 0 (0.0%) |
| 75 Years and older | 13 (100.0%) | 0 (0.0%) |
| Total | 172 (86.4%) | 27 (13.6%) |
Health Insurance Coverage by Citizenship Status in North Henderson
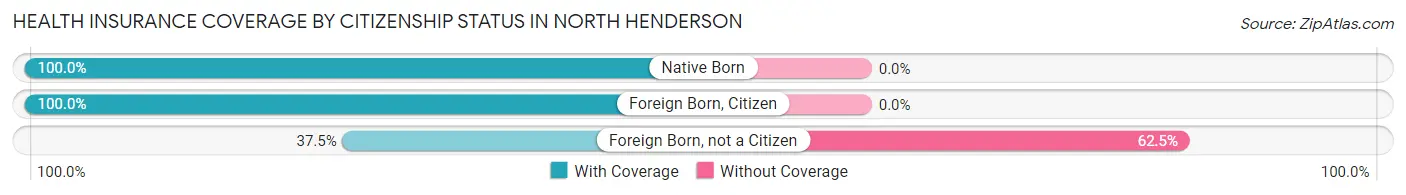
| Citizenship Status | With Coverage | Without Coverage |
| Native Born | 12 (100.0%) | 0 (0.0%) |
| Foreign Born, Citizen | 25 (100.0%) | 0 (0.0%) |
| Foreign Born, not a Citizen | 15 (37.5%) | 25 (62.5%) |
Health Insurance Coverage by Household Income in North Henderson
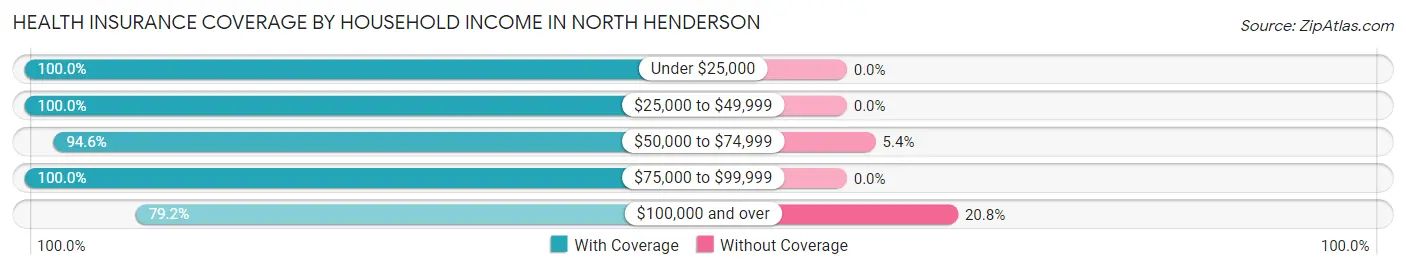
| Household Income | With Coverage | Without Coverage |
| Under $25,000 | 5 (100.0%) | 0 (0.0%) |
| $25,000 to $49,999 | 18 (100.0%) | 0 (0.0%) |
| $50,000 to $74,999 | 35 (94.6%) | 2 (5.4%) |
| $75,000 to $99,999 | 19 (100.0%) | 0 (0.0%) |
| $100,000 and over | 95 (79.2%) | 25 (20.8%) |
Public vs Private Health Insurance Coverage by Age in North Henderson
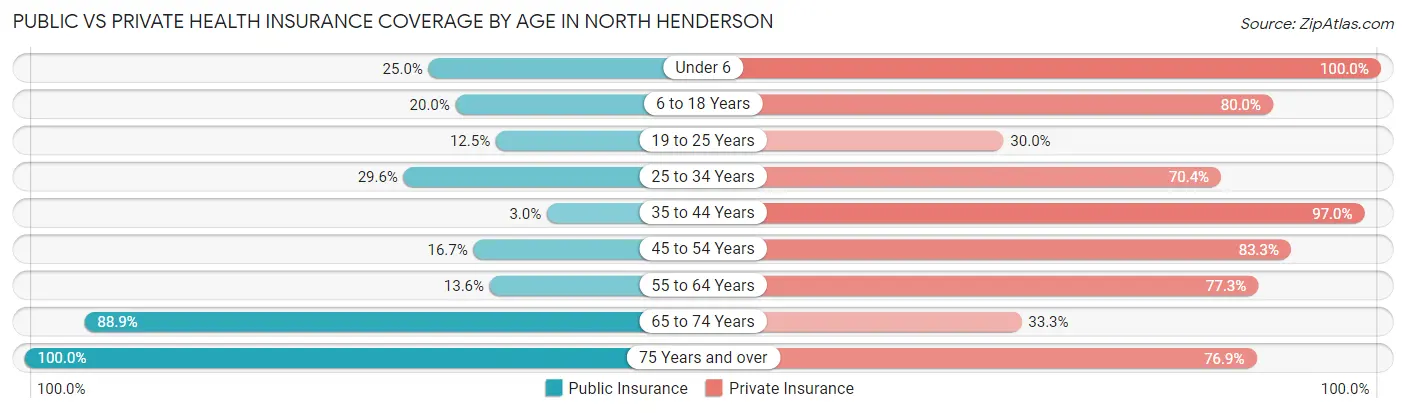
| Age Bracket | Public Insurance | Private Insurance |
| Under 6 | 3 (25.0%) | 12 (100.0%) |
| 6 to 18 Years | 5 (20.0%) | 20 (80.0%) |
| 19 to 25 Years | 5 (12.5%) | 12 (30.0%) |
| 25 to 34 Years | 8 (29.6%) | 19 (70.4%) |
| 35 to 44 Years | 1 (3.0%) | 32 (97.0%) |
| 45 to 54 Years | 3 (16.7%) | 15 (83.3%) |
| 55 to 64 Years | 3 (13.6%) | 17 (77.3%) |
| 65 to 74 Years | 8 (88.9%) | 3 (33.3%) |
| 75 Years and over | 13 (100.0%) | 10 (76.9%) |
| Total | 49 (24.6%) | 140 (70.4%) |
Disability Status by Sex by Age in North Henderson
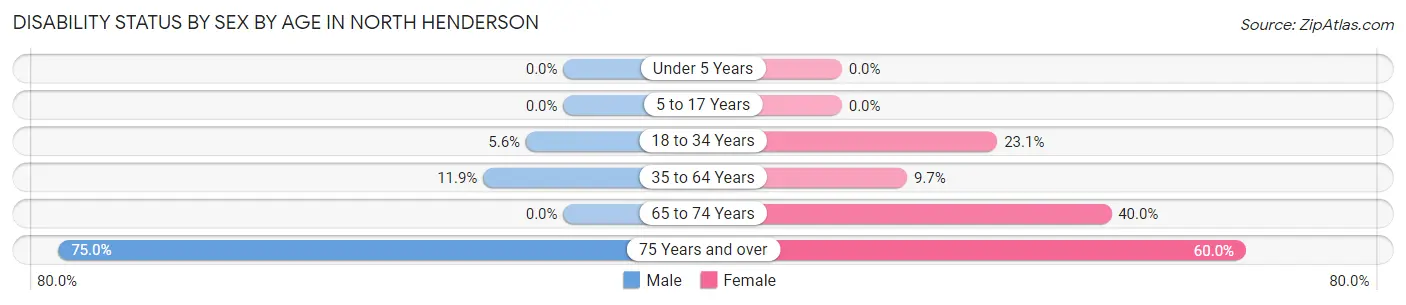
| Age Bracket | Male | Female |
| Under 5 Years | 0 (0.0%) | 0 (0.0%) |
| 5 to 17 Years | 0 (0.0%) | 0 (0.0%) |
| 18 to 34 Years | 3 (5.6%) | 3 (23.1%) |
| 35 to 64 Years | 5 (11.9%) | 3 (9.7%) |
| 65 to 74 Years | 0 (0.0%) | 2 (40.0%) |
| 75 Years and over | 6 (75.0%) | 3 (60.0%) |
Disability Class by Sex by Age in North Henderson
Disability Class: Hearing Difficulty
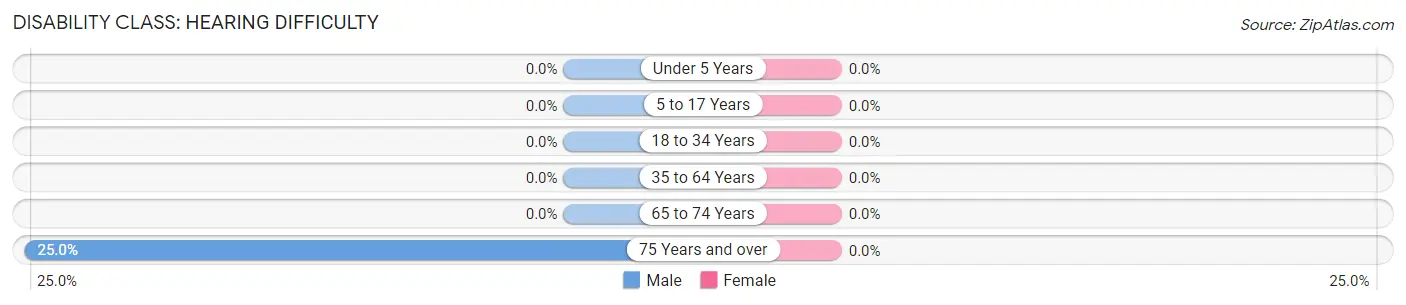
| Age Bracket | Male | Female |
| Under 5 Years | 0 (0.0%) | 0 (0.0%) |
| 5 to 17 Years | 0 (0.0%) | 0 (0.0%) |
| 18 to 34 Years | 0 (0.0%) | 0 (0.0%) |
| 35 to 64 Years | 0 (0.0%) | 0 (0.0%) |
| 65 to 74 Years | 0 (0.0%) | 0 (0.0%) |
| 75 Years and over | 2 (25.0%) | 0 (0.0%) |
Disability Class: Vision Difficulty
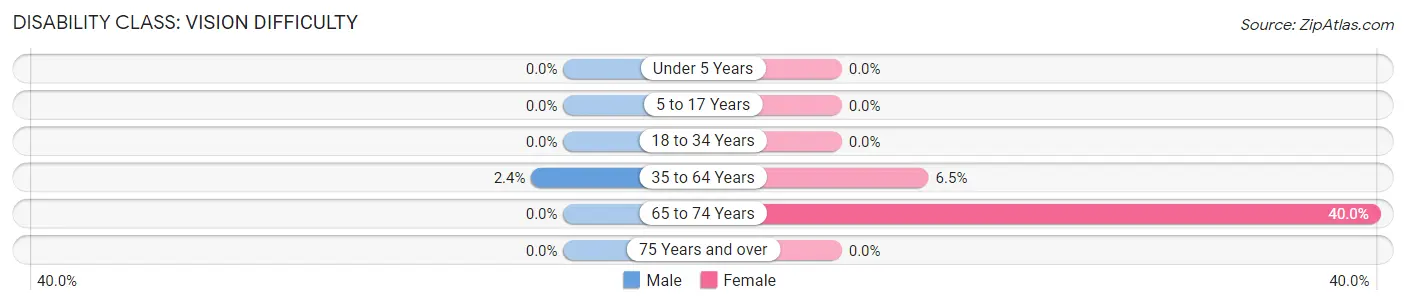
| Age Bracket | Male | Female |
| Under 5 Years | 0 (0.0%) | 0 (0.0%) |
| 5 to 17 Years | 0 (0.0%) | 0 (0.0%) |
| 18 to 34 Years | 0 (0.0%) | 0 (0.0%) |
| 35 to 64 Years | 1 (2.4%) | 2 (6.5%) |
| 65 to 74 Years | 0 (0.0%) | 2 (40.0%) |
| 75 Years and over | 0 (0.0%) | 0 (0.0%) |
Disability Class: Cognitive Difficulty
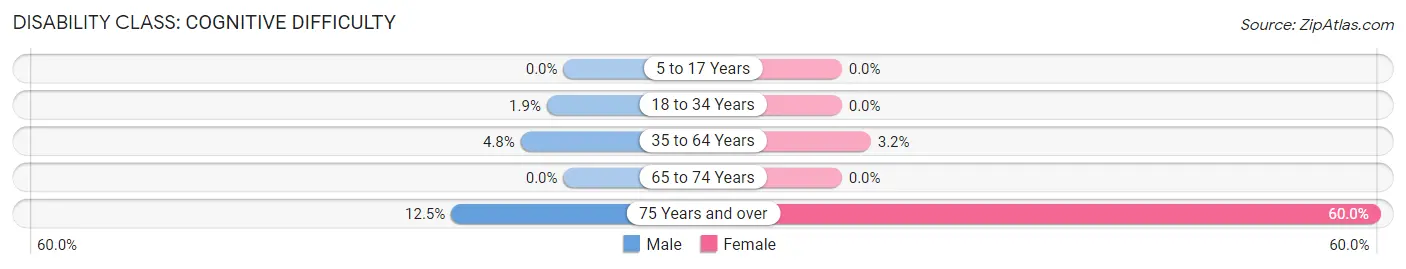
| Age Bracket | Male | Female |
| 5 to 17 Years | 0 (0.0%) | 0 (0.0%) |
| 18 to 34 Years | 1 (1.8%) | 0 (0.0%) |
| 35 to 64 Years | 2 (4.8%) | 1 (3.2%) |
| 65 to 74 Years | 0 (0.0%) | 0 (0.0%) |
| 75 Years and over | 1 (12.5%) | 3 (60.0%) |
Disability Class: Ambulatory Difficulty
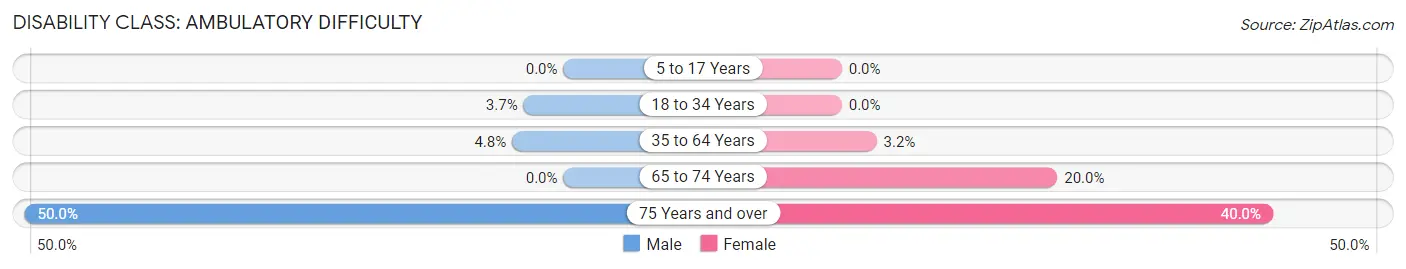
| Age Bracket | Male | Female |
| 5 to 17 Years | 0 (0.0%) | 0 (0.0%) |
| 18 to 34 Years | 2 (3.7%) | 0 (0.0%) |
| 35 to 64 Years | 2 (4.8%) | 1 (3.2%) |
| 65 to 74 Years | 0 (0.0%) | 1 (20.0%) |
| 75 Years and over | 4 (50.0%) | 2 (40.0%) |
Disability Class: Self-Care Difficulty
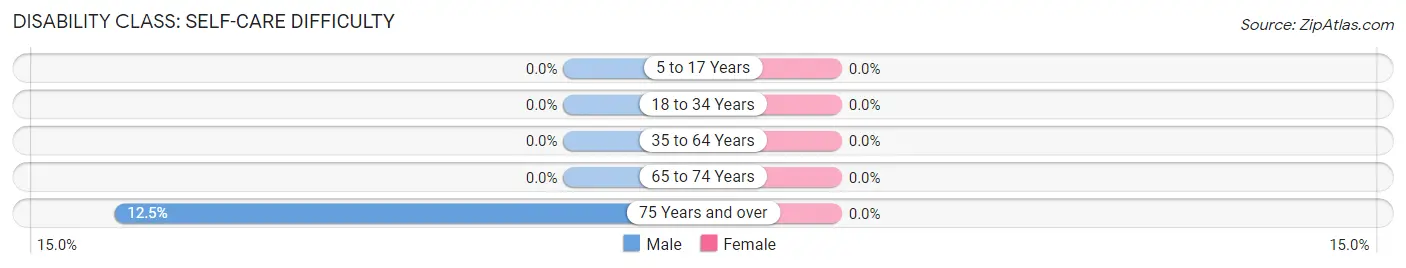
| Age Bracket | Male | Female |
| 5 to 17 Years | 0 (0.0%) | 0 (0.0%) |
| 18 to 34 Years | 0 (0.0%) | 0 (0.0%) |
| 35 to 64 Years | 0 (0.0%) | 0 (0.0%) |
| 65 to 74 Years | 0 (0.0%) | 0 (0.0%) |
| 75 Years and over | 1 (12.5%) | 0 (0.0%) |
Technology Access in North Henderson
Computing Device Access in North Henderson
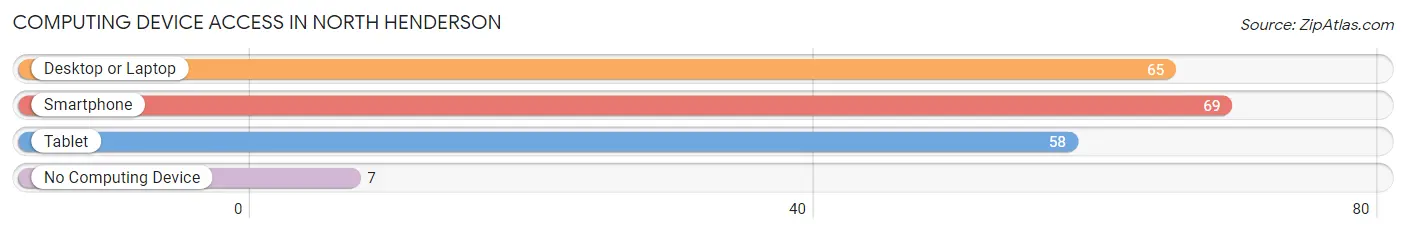
| Device Type | # Households | % Households |
| Desktop or Laptop | 65 | 83.3% |
| Smartphone | 69 | 88.5% |
| Tablet | 58 | 74.4% |
| No Computing Device | 7 | 9.0% |
| Total | 78 | 100.0% |
Internet Access in North Henderson
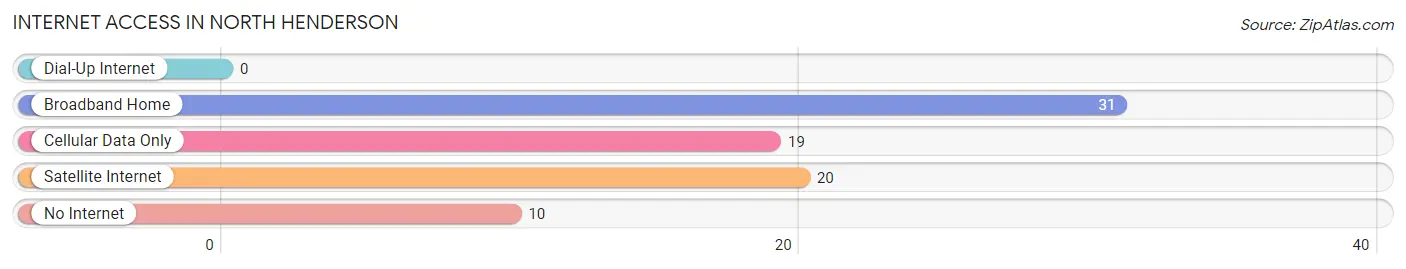
| Internet Type | # Households | % Households |
| Dial-Up Internet | 0 | 0.0% |
| Broadband Home | 31 | 39.7% |
| Cellular Data Only | 19 | 24.4% |
| Satellite Internet | 20 | 25.6% |
| No Internet | 10 | 12.8% |
| Total | 78 | 100.0% |
North Henderson Summary
Henderson County, Illinois is located in the western part of the state, and is bordered by Warren County to the north, McDonough County to the east, Hancock County to the south, and Mercer County to the west. The county seat is Oquawka, and the largest city is Stronghurst. The county was established in 1841 and is named for Richard Henderson, a pioneer settler.
History
The area that is now Henderson County was first settled by Native Americans, including the Sauk, Fox, and Kickapoo tribes. The first European settlers arrived in the early 1800s, and the county was officially established in 1841. The county was named for Richard Henderson, a pioneer settler who had arrived in the area in 1820.
The county was largely agricultural in its early years, with corn, wheat, and oats being the main crops. The county also had a thriving timber industry, with lumber being used to build homes and other structures.
In the late 1800s, the county began to develop its transportation infrastructure, with the construction of the Burlington and Quincy Railroad in 1871. This allowed for the transportation of goods and people to and from the county.
Geography
Henderson County is located in the western part of Illinois, and is bordered by Warren County to the north, McDonough County to the east, Hancock County to the south, and Mercer County to the west. The county has a total area of 545 square miles, of which 544 square miles is land and 1 square mile is water.
The county is mostly flat, with some rolling hills in the northern and western parts. The highest point in the county is located in the northwest corner, at an elevation of 890 feet. The county is drained by the Henderson River, which flows through the center of the county.
Economy
Henderson County has a diverse economy, with agriculture, manufacturing, and tourism being the main industries. The county is home to several large agricultural operations, including corn, soybeans, wheat, and oats. The county also has a thriving timber industry, with lumber being used to build homes and other structures.
Manufacturing is also an important part of the county’s economy, with several factories producing a variety of products, including furniture, clothing, and automotive parts. Tourism is also an important part of the county’s economy, with several attractions, including the Henderson County Historical Museum, the Henderson County Fairgrounds, and the Henderson County Nature Preserve.
Demographics
As of the 2010 census, Henderson County had a population of 7,845. The population was spread out, with 36.2% under the age of 18, 8.2% from 18 to 24, 25.2% from 25 to 44, 22.2% from 45 to 64, and 8.2% who were 65 years of age or older. The median age was 36.3 years.
The racial makeup of the county was 97.2% White, 0.7% African American, 0.2% Native American, 0.2% Asian, 0.1% Pacific Islander, 0.7% from other races, and 0.9% from two or more races. Hispanic or Latino of any race were 1.7% of the population.
The median income for a household in the county was $41,944, and the median income for a family was $50,938. The per capita income for the county was $20,945. About 11.2% of families and 14.2% of the population were below the poverty line, including 19.2% of those under age 18 and 8.2% of those age 65 or over.
Common Questions
What is the Total Population of North Henderson?
Total Population of North Henderson is 199.
What is the Total Male Population of North Henderson?
Total Male Population of North Henderson is 131.
What is the Total Female Population of North Henderson?
Total Female Population of North Henderson is 68.
What is the Ratio of Males per 100 Females in North Henderson?
There are 192.65 Males per 100 Females in North Henderson.
What is the Ratio of Females per 100 Males in North Henderson?
There are 51.91 Females per 100 Males in North Henderson.
What is the Median Population Age in North Henderson?
Median Population Age in North Henderson is 34.6 Years.
What is the Average Family Size in North Henderson
Average Family Size in North Henderson is 3.4 People.
What is the Average Household Size in North Henderson
Average Household Size in North Henderson is 2.5 People.
What is Per Capita Income in North Henderson?
Per Capita income in North Henderson is $44,112.
What is the Median Family Income in North Henderson?
Median Family Income in North Henderson is $111,250.
What is the Median Household income in North Henderson?
Median Household Income in North Henderson is $77,500.
What is Income or Wage Gap in North Henderson?
Income or Wage Gap in North Henderson is 26.5%.
Women in North Henderson earn 73.5 cents for every dollar earned by a man.
What is Inequality or Gini Index in North Henderson?
Inequality or Gini Index in North Henderson is 0.42.
How Large is the Labor Force in North Henderson?
There are 108 People in the Labor Forcein in North Henderson.
What is the Percentage of People in the Labor Force in North Henderson?
66.3% of People are in the Labor Force in North Henderson.
What is the Unemployment Rate in North Henderson?
Unemployment Rate in North Henderson is 3.7%.