New Boston, IL
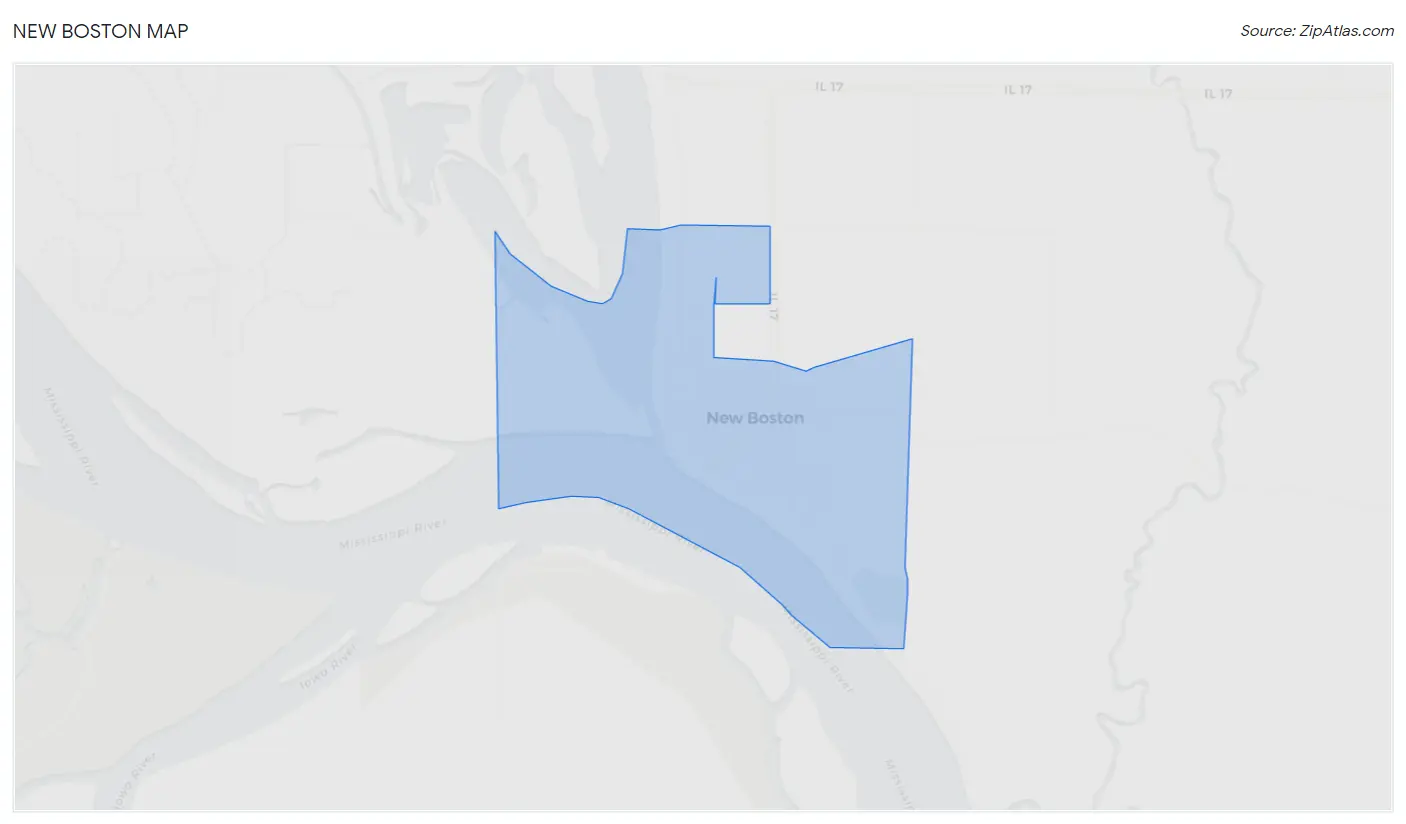
New Boston Map
New Boston Overview
579
TOTAL POPULATION
265
MALE POPULATION
314
FEMALE POPULATION
84.39
MALES / 100 FEMALES
118.49
FEMALES / 100 MALES
39.1
MEDIAN AGE
2.6
AVG FAMILY SIZE
2.2
AVG HOUSEHOLD SIZE
$29,034
PER CAPITA INCOME
$68,125
AVG FAMILY INCOME
$54,821
AVG HOUSEHOLD INCOME
57.1%
WAGE / INCOME GAP [ % ]
42.9¢/ $1
WAGE / INCOME GAP [ $ ]
0.41
INEQUALITY / GINI INDEX
287
LABOR FORCE [ PEOPLE ]
62.3%
PERCENT IN LABOR FORCE
7.0%
UNEMPLOYMENT RATE
New Boston Zip Codes
New Boston Area Codes
Race in New Boston
The most populous races in New Boston are White / Caucasian (562 | 97.1%), Two or more Races (11 | 1.9%), and Asian (6 | 1.0%).
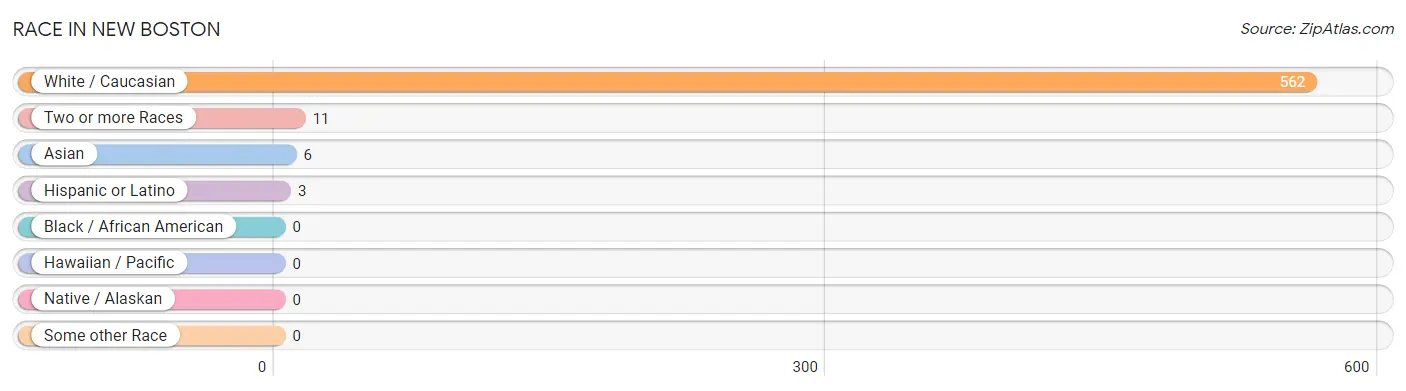
| Race | # Population | % Population |
| Asian | 6 | 1.0% |
| Black / African American | 0 | 0.0% |
| Hawaiian / Pacific | 0 | 0.0% |
| Hispanic or Latino | 3 | 0.5% |
| Native / Alaskan | 0 | 0.0% |
| White / Caucasian | 562 | 97.1% |
| Two or more Races | 11 | 1.9% |
| Some other Race | 0 | 0.0% |
| Total | 579 | 100.0% |
Ancestry in New Boston
The most populous ancestries reported in New Boston are Irish (83 | 14.3%), English (79 | 13.6%), German (75 | 13.0%), American (50 | 8.6%), and French (16 | 2.8%), together accounting for 52.3% of all New Boston residents.
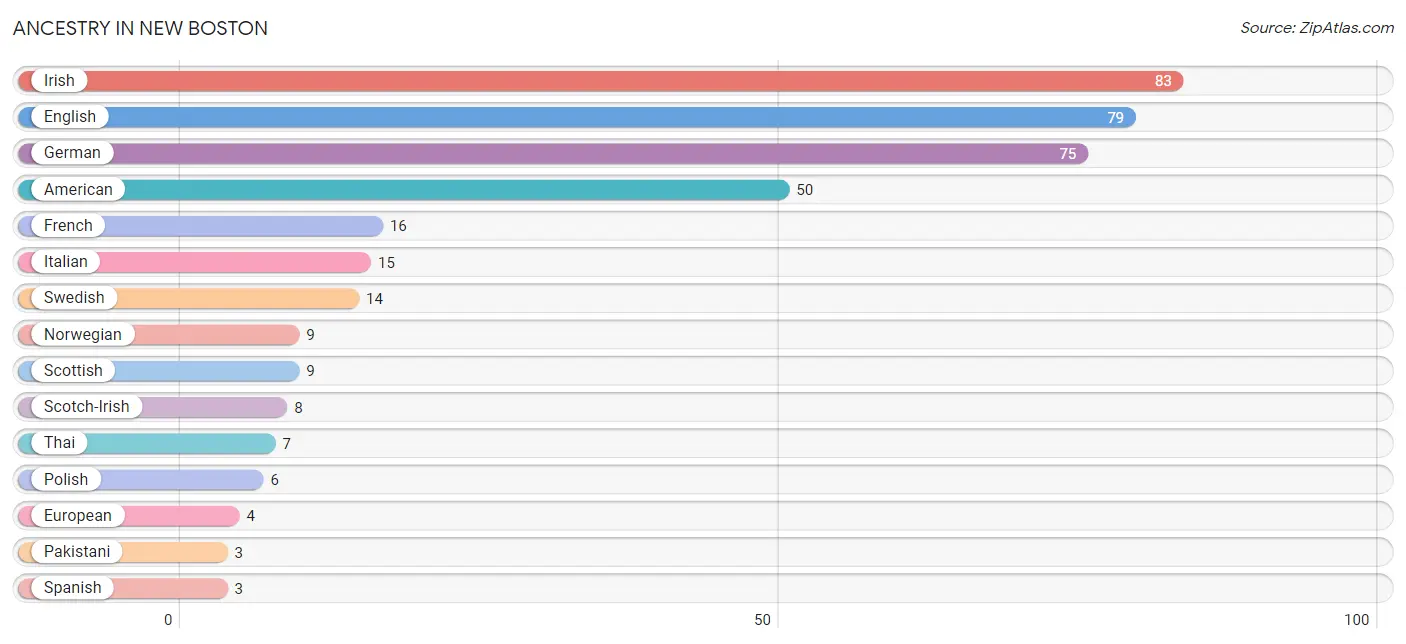
| Ancestry | # Population | % Population |
| American | 50 | 8.6% |
| Belgian | 2 | 0.4% |
| Burmese | 2 | 0.4% |
| Dutch | 2 | 0.4% |
| English | 79 | 13.6% |
| European | 4 | 0.7% |
| French | 16 | 2.8% |
| German | 75 | 13.0% |
| Irish | 83 | 14.3% |
| Italian | 15 | 2.6% |
| Norwegian | 9 | 1.5% |
| Pakistani | 3 | 0.5% |
| Polish | 6 | 1.0% |
| Scotch-Irish | 8 | 1.4% |
| Scottish | 9 | 1.5% |
| Spanish | 3 | 0.5% |
| Swedish | 14 | 2.4% |
| Thai | 7 | 1.2% |
| Welsh | 2 | 0.4% | View All 19 Rows |
Immigrants in New Boston
The most numerous immigrant groups reported in New Boston came from Asia (6 | 1.0%), India (3 | 0.5%), South Central Asia (3 | 0.5%), South Eastern Asia (3 | 0.5%), and Thailand (3 | 0.5%), together accounting for 3.1% of all New Boston residents.
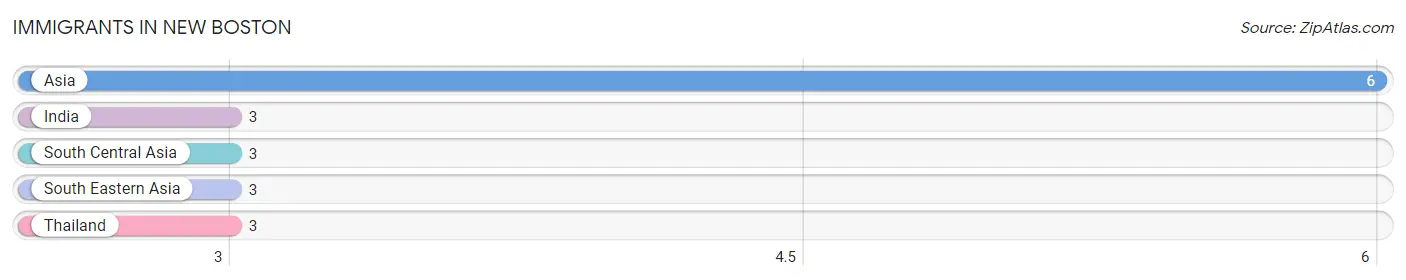
| Immigration Origin | # Population | % Population |
| Asia | 6 | 1.0% |
| India | 3 | 0.5% |
| South Central Asia | 3 | 0.5% |
| South Eastern Asia | 3 | 0.5% |
| Thailand | 3 | 0.5% | View All 5 Rows |
Sex and Age in New Boston
Sex and Age in New Boston
The most populous age groups in New Boston are 60 to 64 Years (29 | 10.9%) for men and 30 to 34 Years (48 | 15.3%) for women.
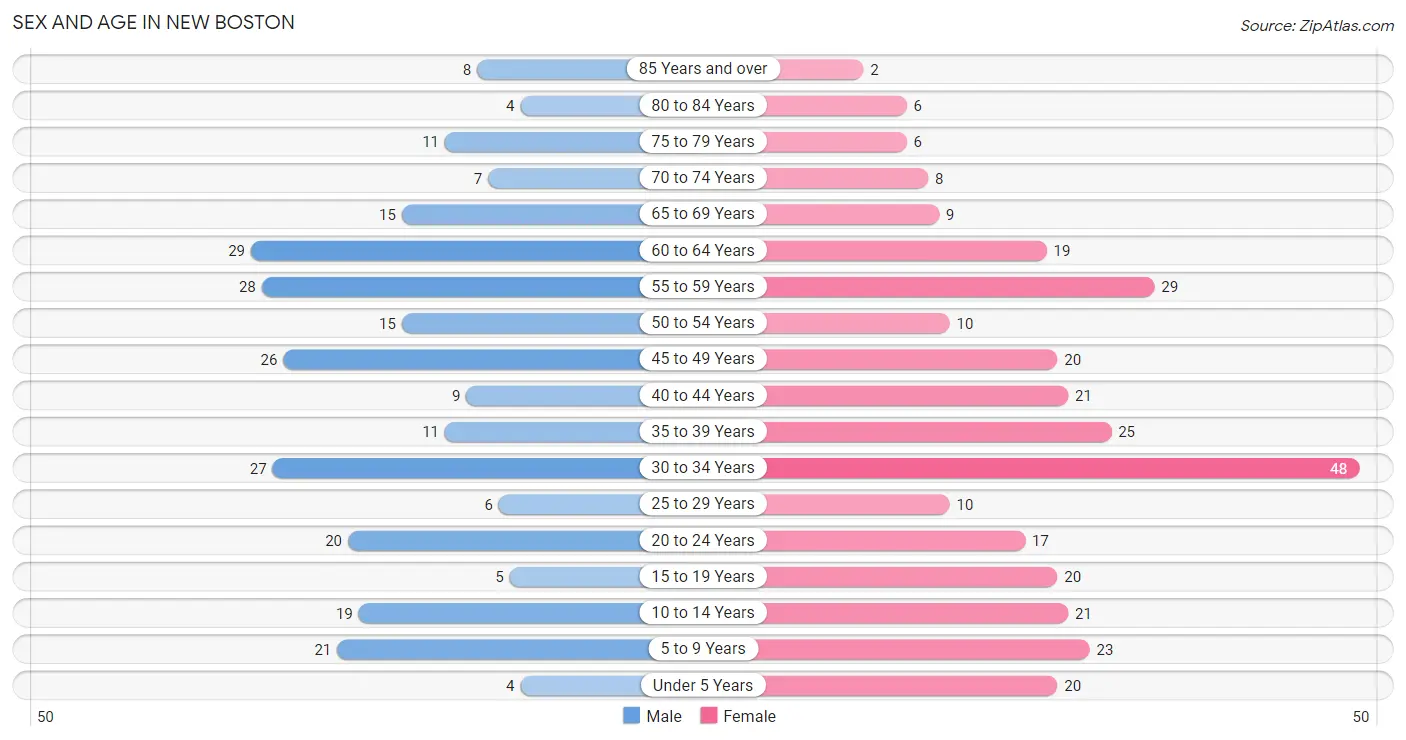
| Age Bracket | Male | Female |
| Under 5 Years | 4 (1.5%) | 20 (6.4%) |
| 5 to 9 Years | 21 (7.9%) | 23 (7.3%) |
| 10 to 14 Years | 19 (7.2%) | 21 (6.7%) |
| 15 to 19 Years | 5 (1.9%) | 20 (6.4%) |
| 20 to 24 Years | 20 (7.5%) | 17 (5.4%) |
| 25 to 29 Years | 6 (2.3%) | 10 (3.2%) |
| 30 to 34 Years | 27 (10.2%) | 48 (15.3%) |
| 35 to 39 Years | 11 (4.2%) | 25 (8.0%) |
| 40 to 44 Years | 9 (3.4%) | 21 (6.7%) |
| 45 to 49 Years | 26 (9.8%) | 20 (6.4%) |
| 50 to 54 Years | 15 (5.7%) | 10 (3.2%) |
| 55 to 59 Years | 28 (10.6%) | 29 (9.2%) |
| 60 to 64 Years | 29 (10.9%) | 19 (6.0%) |
| 65 to 69 Years | 15 (5.7%) | 9 (2.9%) |
| 70 to 74 Years | 7 (2.6%) | 8 (2.5%) |
| 75 to 79 Years | 11 (4.2%) | 6 (1.9%) |
| 80 to 84 Years | 4 (1.5%) | 6 (1.9%) |
| 85 Years and over | 8 (3.0%) | 2 (0.6%) |
| Total | 265 (100.0%) | 314 (100.0%) |
Families and Households in New Boston
Median Family Size in New Boston
The median family size in New Boston is 2.56 persons per family, with single male/father families (4 | 2.0%) accounting for the largest median family size of 3.5 persons per family. On the other hand, single female/mother families (56 | 28.6%) represent the smallest median family size with 1.95 persons per family.
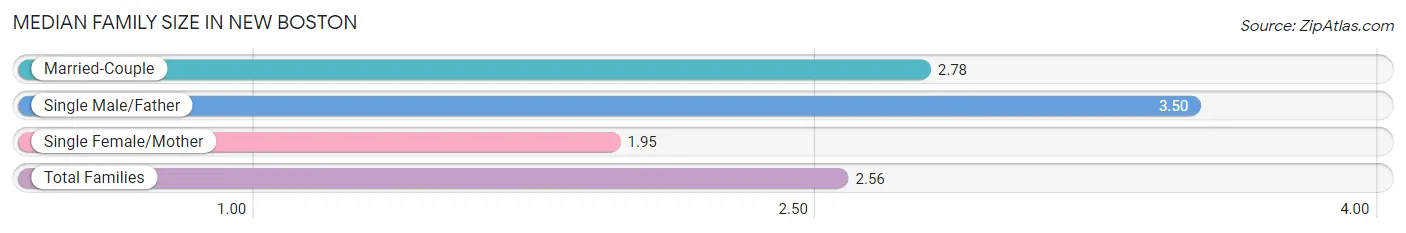
| Family Type | # Families | Family Size |
| Married-Couple | 136 (69.4%) | 2.78 |
| Single Male/Father | 4 (2.0%) | 3.50 |
| Single Female/Mother | 56 (28.6%) | 1.95 |
| Total Families | 196 (100.0%) | 2.56 |
Median Household Size in New Boston
The median household size in New Boston is 2.18 persons per household, with single male/father households (4 | 1.5%) accounting for the largest median household size of 4.75 persons per household. non-family households (69 | 26.0%) represent the smallest median household size with 1.06 persons per household.
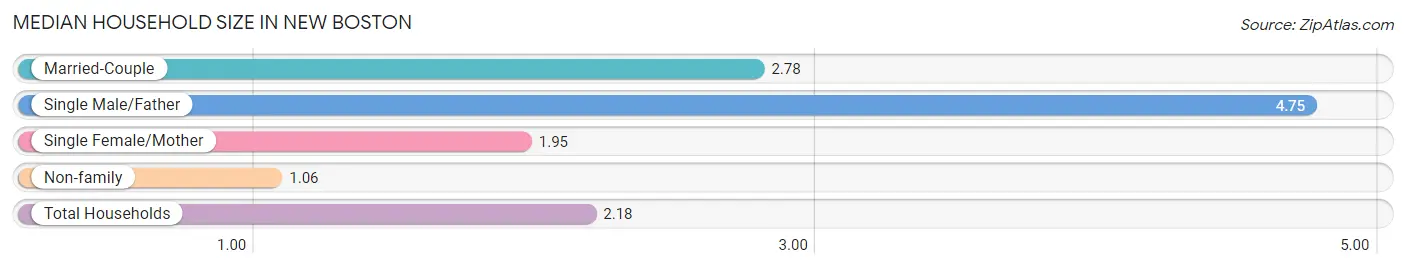
| Household Type | # Households | Household Size |
| Married-Couple | 136 (51.3%) | 2.78 |
| Single Male/Father | 4 (1.5%) | 4.75 |
| Single Female/Mother | 56 (21.1%) | 1.95 |
| Non-family | 69 (26.0%) | 1.06 |
| Total Households | 265 (100.0%) | 2.18 |
Household Size by Marriage Status in New Boston
Out of a total of 265 households in New Boston, 196 (74.0%) are family households, while 69 (26.0%) are nonfamily households. The most numerous type of family households are 2-person households, comprising 103, and the most common type of nonfamily households are 1-person households, comprising 66.
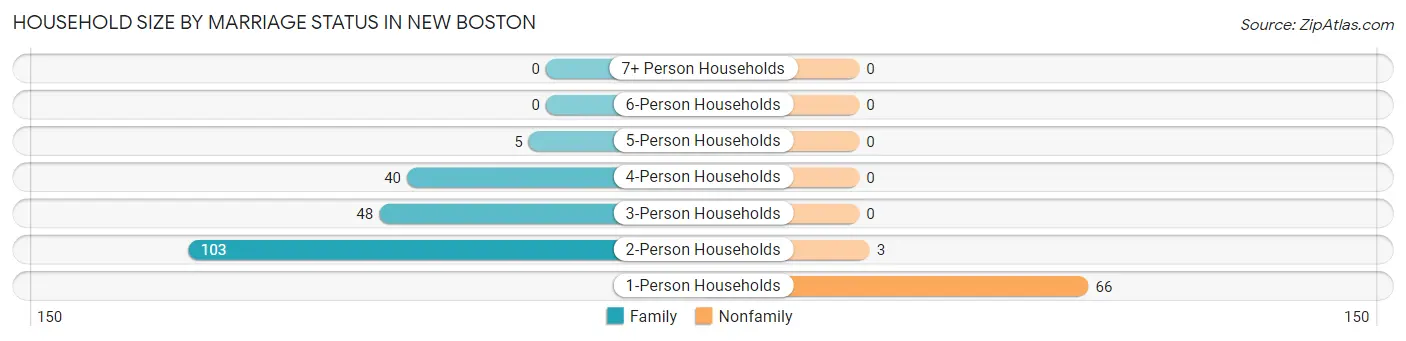
| Household Size | Family Households | Nonfamily Households |
| 1-Person Households | - | 66 (24.9%) |
| 2-Person Households | 103 (38.9%) | 3 (1.1%) |
| 3-Person Households | 48 (18.1%) | 0 (0.0%) |
| 4-Person Households | 40 (15.1%) | 0 (0.0%) |
| 5-Person Households | 5 (1.9%) | 0 (0.0%) |
| 6-Person Households | 0 (0.0%) | 0 (0.0%) |
| 7+ Person Households | 0 (0.0%) | 0 (0.0%) |
| Total | 196 (74.0%) | 69 (26.0%) |
Female Fertility in New Boston
Fertility by Age in New Boston
Average fertility rate in New Boston is 49.0 births per 1,000 women. Women in the age bracket of 35 to 50 years have the highest fertility rate with 119.0 births per 1,000 women. Women in the age bracket of 35 to 50 years acount for 100.0% of all women with births.
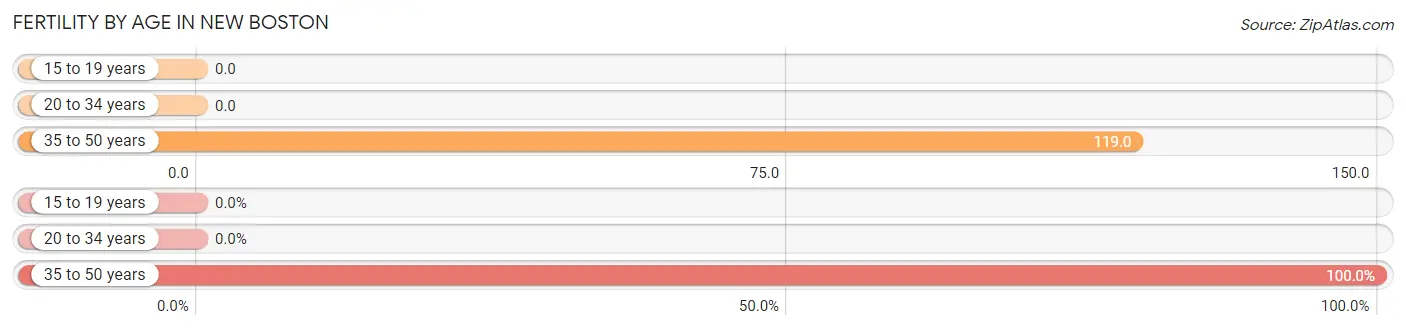
| Age Bracket | Women with Births | Births / 1,000 Women |
| 15 to 19 years | 0 (0.0%) | 0.0 |
| 20 to 34 years | 0 (0.0%) | 0.0 |
| 35 to 50 years | 8 (100.0%) | 119.0 |
| Total | 8 (100.0%) | 49.0 |
Fertility by Age by Marriage Status in New Boston
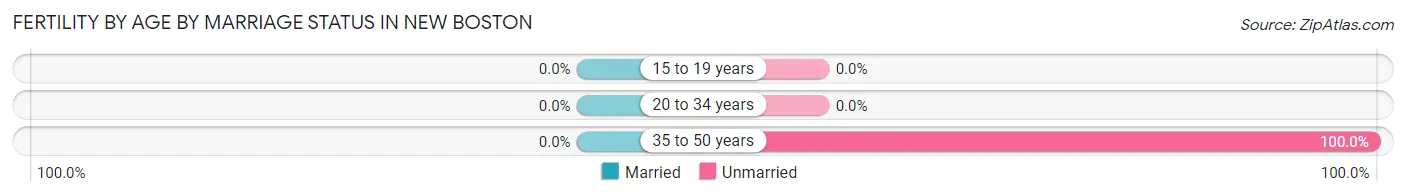
| Age Bracket | Married | Unmarried |
| 15 to 19 years | 0 (0.0%) | 0 (0.0%) |
| 20 to 34 years | 0 (0.0%) | 0 (0.0%) |
| 35 to 50 years | 0 (0.0%) | 8 (100.0%) |
| Total | 0 (0.0%) | 8 (100.0%) |
Fertility by Education in New Boston
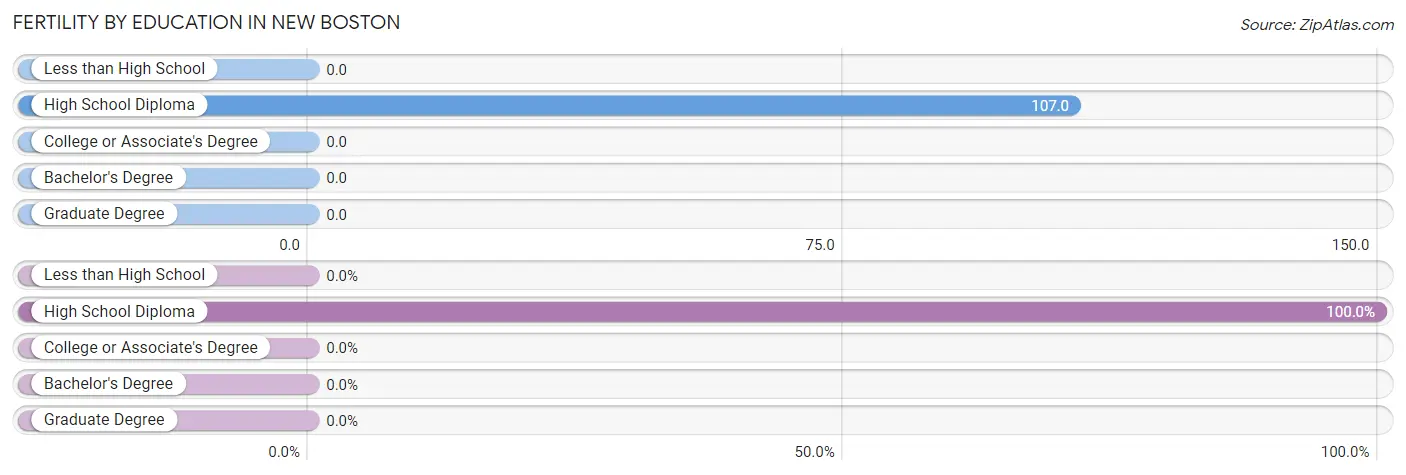
| Educational Attainment | Women with Births | Births / 1,000 Women |
| Less than High School | 0 (0.0%) | 0.0 |
| High School Diploma | 8 (100.0%) | 107.0 |
| College or Associate's Degree | 0 (0.0%) | 0.0 |
| Bachelor's Degree | 0 (0.0%) | 0.0 |
| Graduate Degree | 0 (0.0%) | 0.0 |
| Total | 8 (100.0%) | 49.0 |
Fertility by Education by Marriage Status in New Boston
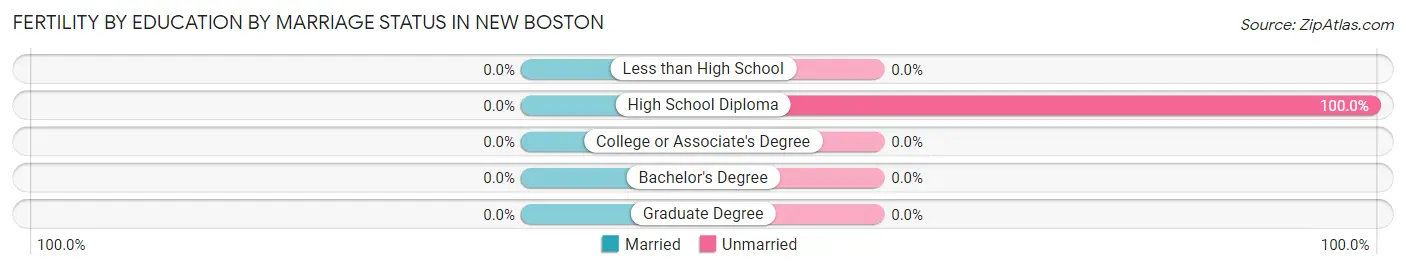
| Educational Attainment | Married | Unmarried |
| Less than High School | 0 (0.0%) | 0 (0.0%) |
| High School Diploma | 0 (0.0%) | 8 (100.0%) |
| College or Associate's Degree | 0 (0.0%) | 0 (0.0%) |
| Bachelor's Degree | 0 (0.0%) | 0 (0.0%) |
| Graduate Degree | 0 (0.0%) | 0 (0.0%) |
| Total | 0 (0.0%) | 8 (100.0%) |
Income in New Boston
Income Overview in New Boston
Per Capita Income in New Boston is $29,034, while median incomes of families and households are $68,125 and $54,821 respectively.
| Characteristic | Number | Measure |
| Per Capita Income | 579 | $29,034 |
| Median Family Income | 196 | $68,125 |
| Mean Family Income | 196 | $73,542 |
| Median Household Income | 265 | $54,821 |
| Mean Household Income | 265 | $64,525 |
| Income Deficit | 196 | $0 |
| Wage / Income Gap (%) | 579 | 57.09% |
| Wage / Income Gap ($) | 579 | 42.91¢ per $1 |
| Gini / Inequality Index | 579 | 0.41 |
Earnings by Sex in New Boston
Average Earnings in New Boston are $34,250, $59,875 for men and $25,694 for women, a difference of 57.1%.
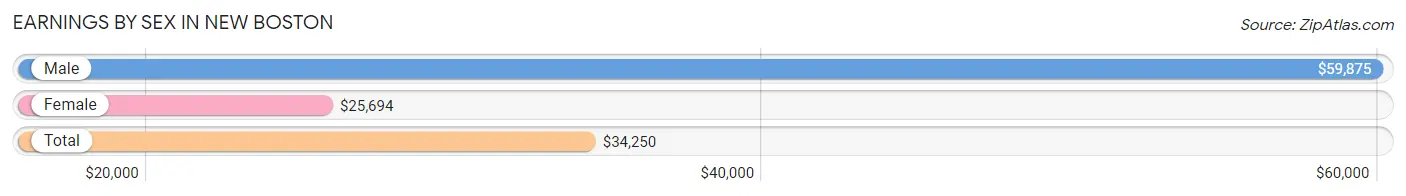
| Sex | Number | Average Earnings |
| Male | 147 (47.4%) | $59,875 |
| Female | 163 (52.6%) | $25,694 |
| Total | 310 (100.0%) | $34,250 |
Earnings by Sex by Income Bracket in New Boston
The most common earnings brackets in New Boston are $75,000 to $99,999 for men (27 | 18.4%) and $35,000 to $39,999 for women (22 | 13.5%).
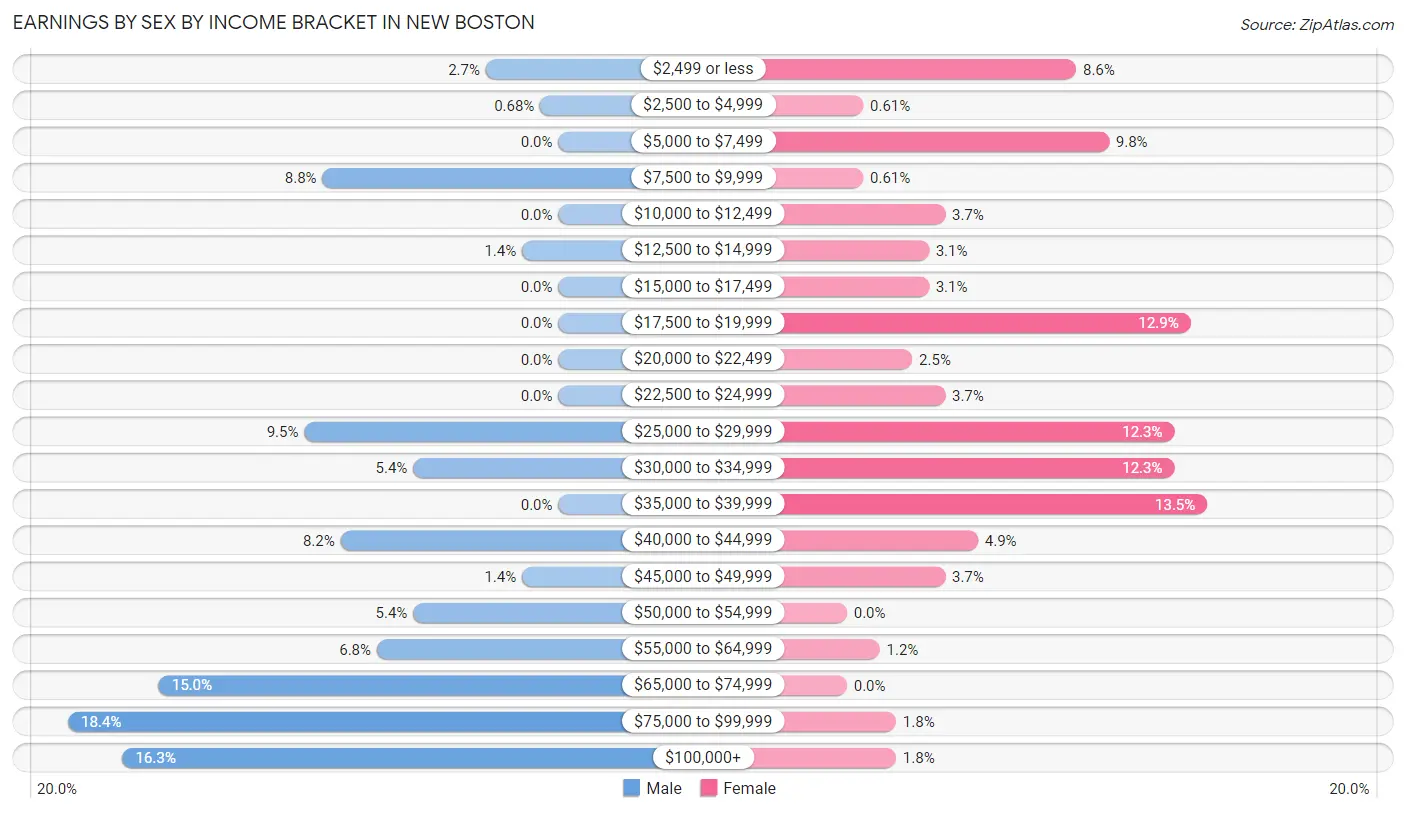
| Income | Male | Female |
| $2,499 or less | 4 (2.7%) | 14 (8.6%) |
| $2,500 to $4,999 | 1 (0.7%) | 1 (0.6%) |
| $5,000 to $7,499 | 0 (0.0%) | 16 (9.8%) |
| $7,500 to $9,999 | 13 (8.8%) | 1 (0.6%) |
| $10,000 to $12,499 | 0 (0.0%) | 6 (3.7%) |
| $12,500 to $14,999 | 2 (1.4%) | 5 (3.1%) |
| $15,000 to $17,499 | 0 (0.0%) | 5 (3.1%) |
| $17,500 to $19,999 | 0 (0.0%) | 21 (12.9%) |
| $20,000 to $22,499 | 0 (0.0%) | 4 (2.5%) |
| $22,500 to $24,999 | 0 (0.0%) | 6 (3.7%) |
| $25,000 to $29,999 | 14 (9.5%) | 20 (12.3%) |
| $30,000 to $34,999 | 8 (5.4%) | 20 (12.3%) |
| $35,000 to $39,999 | 0 (0.0%) | 22 (13.5%) |
| $40,000 to $44,999 | 12 (8.2%) | 8 (4.9%) |
| $45,000 to $49,999 | 2 (1.4%) | 6 (3.7%) |
| $50,000 to $54,999 | 8 (5.4%) | 0 (0.0%) |
| $55,000 to $64,999 | 10 (6.8%) | 2 (1.2%) |
| $65,000 to $74,999 | 22 (15.0%) | 0 (0.0%) |
| $75,000 to $99,999 | 27 (18.4%) | 3 (1.8%) |
| $100,000+ | 24 (16.3%) | 3 (1.8%) |
| Total | 147 (100.0%) | 163 (100.0%) |
Earnings by Sex by Educational Attainment in New Boston
Average earnings in New Boston are $66,094 for men and $26,389 for women, a difference of 60.1%. Men with an educational attainment of graduate degree enjoy the highest average annual earnings of $107,708, while those with high school diploma education earn the least with $58,594. Women with an educational attainment of bachelor's degree earn the most with the average annual earnings of $33,333, while those with high school diploma education have the smallest earnings of $18,690.
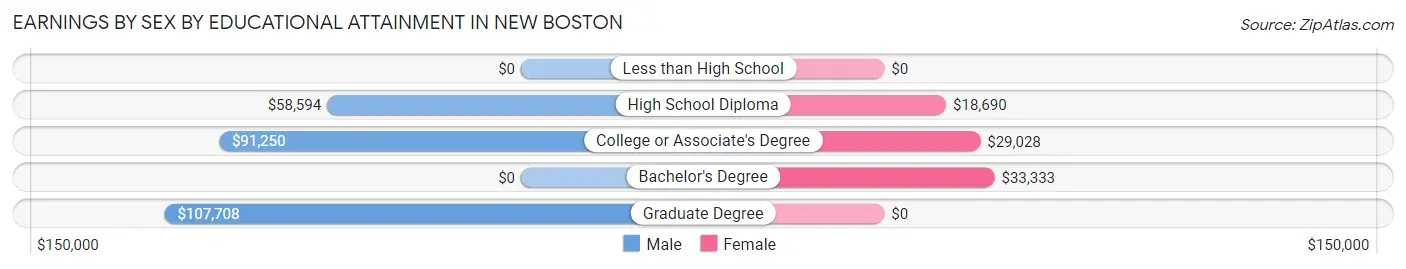
| Educational Attainment | Male Income | Female Income |
| Less than High School | - | - |
| High School Diploma | $58,594 | $18,690 |
| College or Associate's Degree | $91,250 | $29,028 |
| Bachelor's Degree | - | - |
| Graduate Degree | $107,708 | $0 |
| Total | $66,094 | $26,389 |
Family Income in New Boston
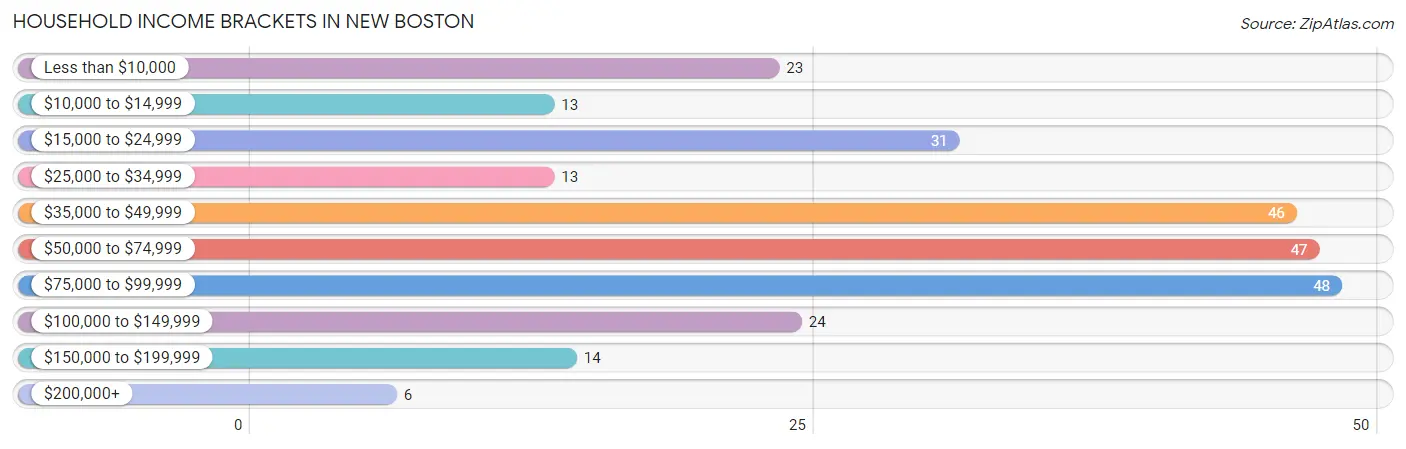
Family Income Brackets in New Boston
According to the New Boston family income data, there are 42 families falling into the $75,000 to $99,999 income range, which is the most common income bracket and makes up 21.4% of all families. Conversely, the $25,000 to $34,999 income bracket is the least frequent group with only 5 families (2.5%) belonging to this category.
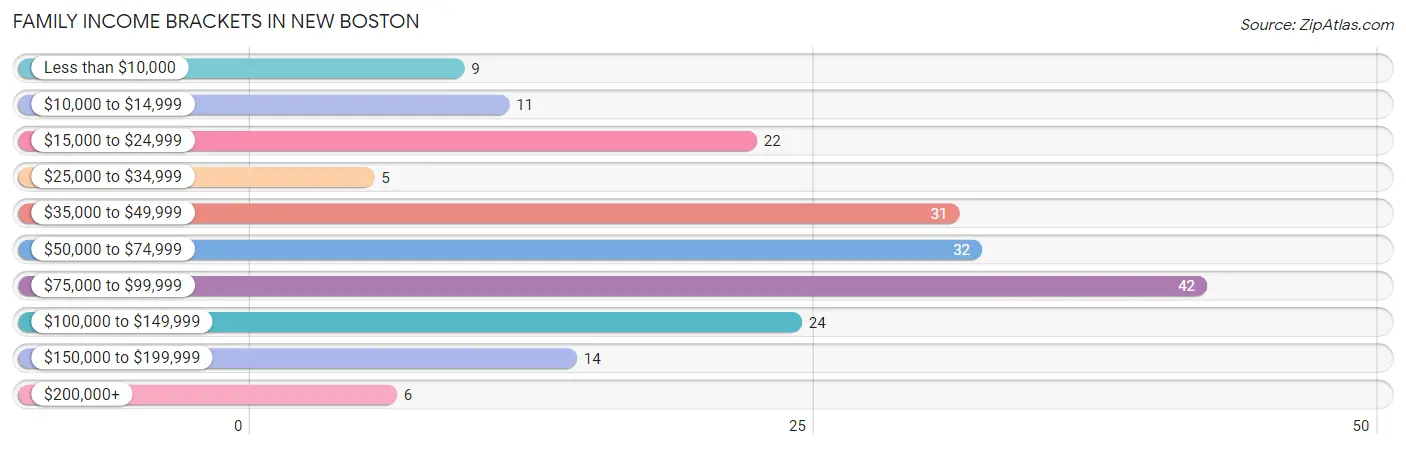
| Income Bracket | # Families | % Families |
| Less than $10,000 | 9 | 4.6% |
| $10,000 to $14,999 | 11 | 5.6% |
| $15,000 to $24,999 | 22 | 11.2% |
| $25,000 to $34,999 | 5 | 2.6% |
| $35,000 to $49,999 | 31 | 15.8% |
| $50,000 to $74,999 | 32 | 16.3% |
| $75,000 to $99,999 | 42 | 21.4% |
| $100,000 to $149,999 | 24 | 12.2% |
| $150,000 to $199,999 | 14 | 7.1% |
| $200,000+ | 6 | 3.1% |
Family Income by Famaliy Size in New Boston
4-person families (37 | 18.9%) account for the highest median family income in New Boston with $98,750 per family, while 4-person families (37 | 18.9%) have the highest median income of $24,688 per family member.
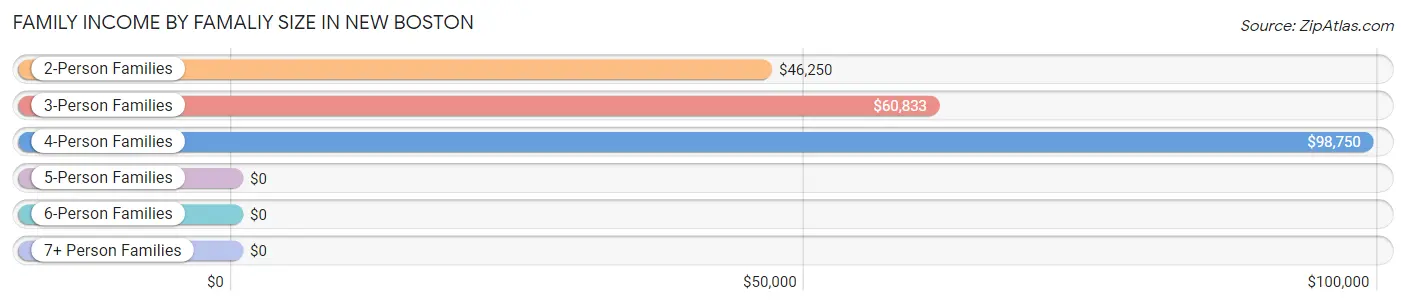
| Income Bracket | # Families | Median Income |
| 2-Person Families | 104 (53.1%) | $46,250 |
| 3-Person Families | 50 (25.5%) | $60,833 |
| 4-Person Families | 37 (18.9%) | $98,750 |
| 5-Person Families | 5 (2.5%) | $0 |
| 6-Person Families | 0 (0.0%) | $0 |
| 7+ Person Families | 0 (0.0%) | $0 |
| Total | 196 (100.0%) | $68,125 |
Family Income by Number of Earners in New Boston
The median family income in New Boston is $68,125, with families comprising 2 earners (80) having the highest median family income of $98,182, while families with 1 earner (89) have the lowest median family income of $35,865, accounting for 40.8% and 45.4% of families, respectively.
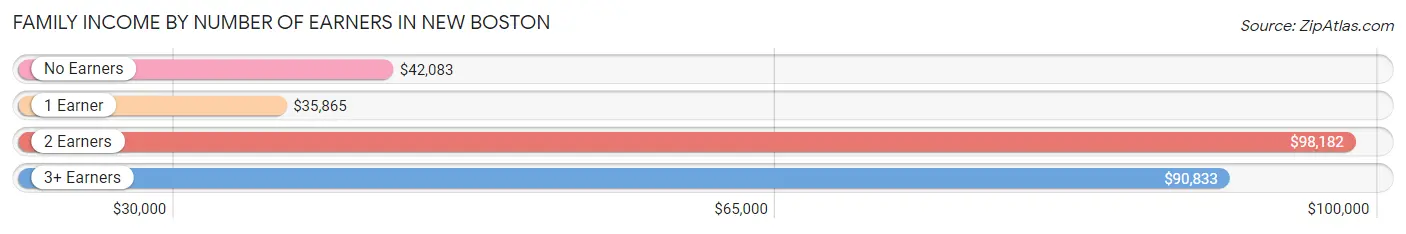
| Number of Earners | # Families | Median Income |
| No Earners | 15 (7.6%) | $42,083 |
| 1 Earner | 89 (45.4%) | $35,865 |
| 2 Earners | 80 (40.8%) | $98,182 |
| 3+ Earners | 12 (6.1%) | $90,833 |
| Total | 196 (100.0%) | $68,125 |
Household Income in New Boston
Household Income Brackets in New Boston
With 48 households falling in the category, the $75,000 to $99,999 income range is the most frequent in New Boston, accounting for 18.1% of all households. In contrast, only 6 households (2.3%) fall into the $200,000+ income bracket, making it the least populous group.
| Income Bracket | # Households | % Households |
| Less than $10,000 | 23 | 8.7% |
| $10,000 to $14,999 | 13 | 4.9% |
| $15,000 to $24,999 | 31 | 11.7% |
| $25,000 to $34,999 | 13 | 4.9% |
| $35,000 to $49,999 | 46 | 17.4% |
| $50,000 to $74,999 | 47 | 17.7% |
| $75,000 to $99,999 | 48 | 18.1% |
| $100,000 to $149,999 | 24 | 9.1% |
| $150,000 to $199,999 | 14 | 5.3% |
| $200,000+ | 6 | 2.3% |
Household Income by Householder Age in New Boston
The median household income in New Boston is $54,821, with the highest median household income of $69,000 found in the 45 to 64 years age bracket for the primary householder. A total of 100 households (37.7%) fall into this category. Meanwhile, the 15 to 24 years age bracket for the primary householder has the lowest median household income of $0, with 4 households (1.5%) in this group.
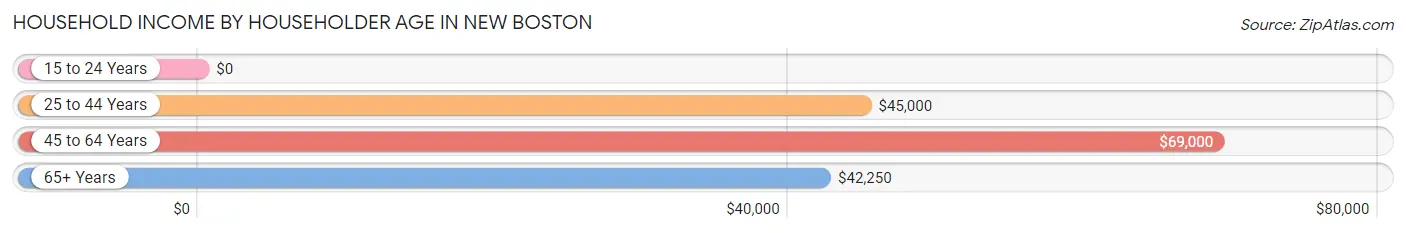
| Income Bracket | # Households | Median Income |
| 15 to 24 Years | 4 (1.5%) | $0 |
| 25 to 44 Years | 108 (40.7%) | $45,000 |
| 45 to 64 Years | 100 (37.7%) | $69,000 |
| 65+ Years | 53 (20.0%) | $42,250 |
| Total | 265 (100.0%) | $54,821 |
Poverty in New Boston
Income Below Poverty by Sex and Age in New Boston
With 6.4% poverty level for males and 23.6% for females among the residents of New Boston, 65 to 74 year old males and 15 year old females are the most vulnerable to poverty, with 9 males (40.9%) and 7 females (100.0%) in their respective age groups living below the poverty level.
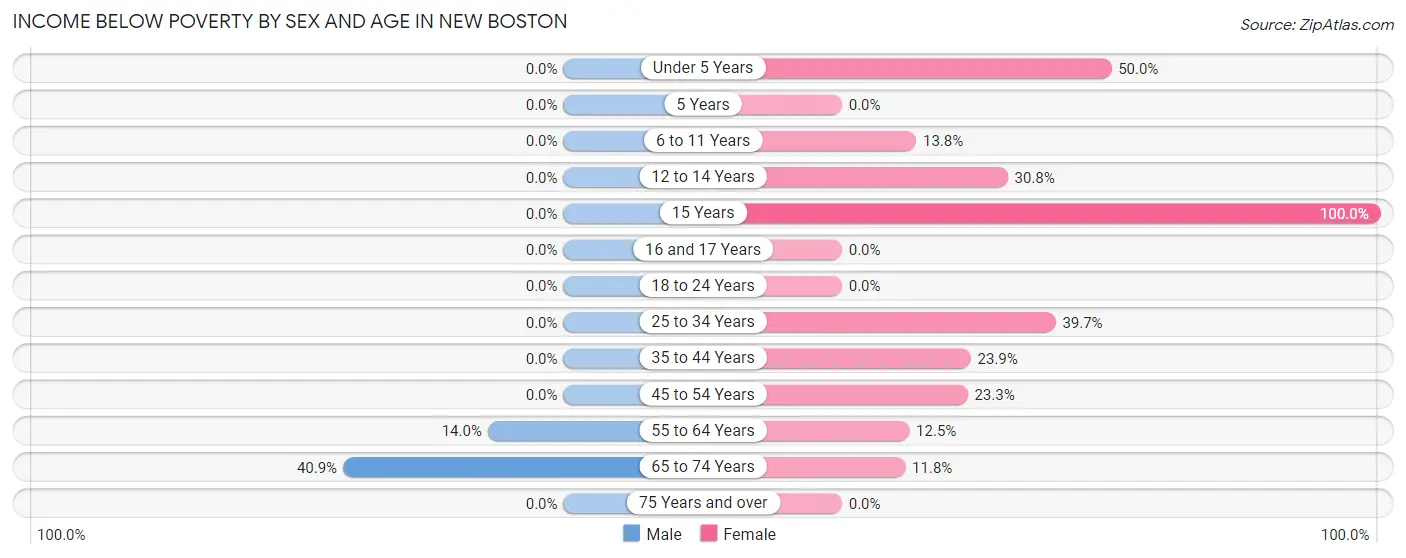
| Age Bracket | Male | Female |
| Under 5 Years | 0 (0.0%) | 10 (50.0%) |
| 5 Years | 0 (0.0%) | 0 (0.0%) |
| 6 to 11 Years | 0 (0.0%) | 4 (13.8%) |
| 12 to 14 Years | 0 (0.0%) | 4 (30.8%) |
| 15 Years | 0 (0.0%) | 7 (100.0%) |
| 16 and 17 Years | 0 (0.0%) | 0 (0.0%) |
| 18 to 24 Years | 0 (0.0%) | 0 (0.0%) |
| 25 to 34 Years | 0 (0.0%) | 23 (39.7%) |
| 35 to 44 Years | 0 (0.0%) | 11 (23.9%) |
| 45 to 54 Years | 0 (0.0%) | 7 (23.3%) |
| 55 to 64 Years | 8 (14.0%) | 6 (12.5%) |
| 65 to 74 Years | 9 (40.9%) | 2 (11.8%) |
| 75 Years and over | 0 (0.0%) | 0 (0.0%) |
| Total | 17 (6.4%) | 74 (23.6%) |
Income Above Poverty by Sex and Age in New Boston
According to the poverty statistics in New Boston, males aged under 5 years and females aged 5 years are the age groups that are most secure financially, with 100.0% of males and 100.0% of females in these age groups living above the poverty line.
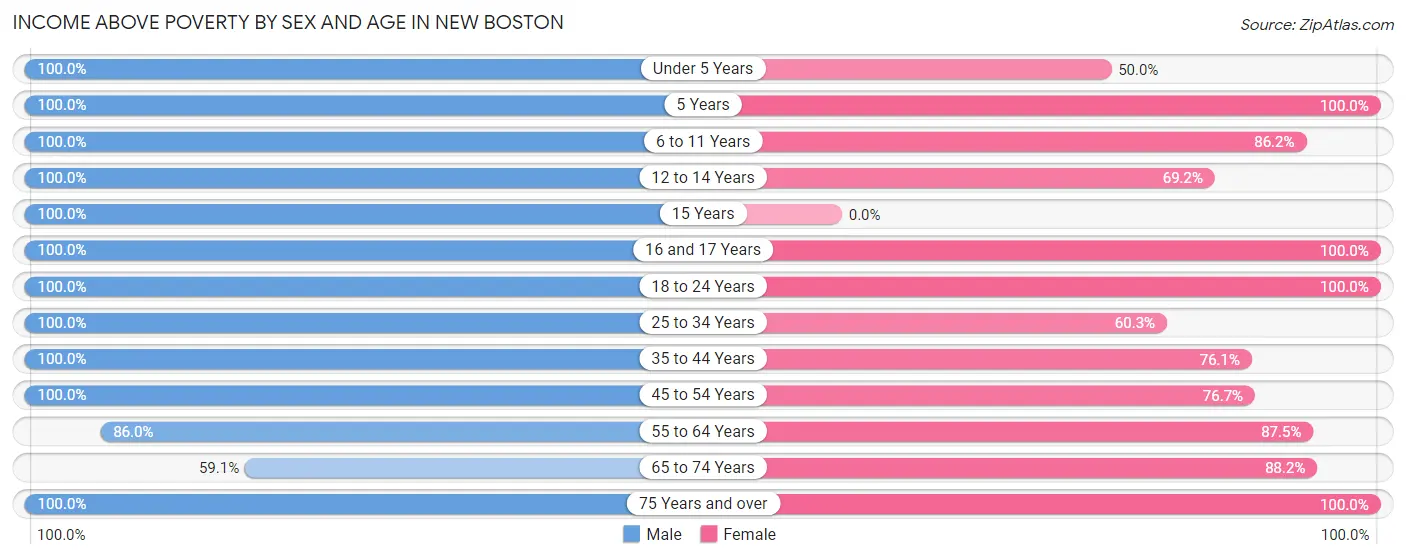
| Age Bracket | Male | Female |
| Under 5 Years | 4 (100.0%) | 10 (50.0%) |
| 5 Years | 1 (100.0%) | 2 (100.0%) |
| 6 to 11 Years | 35 (100.0%) | 25 (86.2%) |
| 12 to 14 Years | 4 (100.0%) | 9 (69.2%) |
| 15 Years | 3 (100.0%) | 0 (0.0%) |
| 16 and 17 Years | 2 (100.0%) | 6 (100.0%) |
| 18 to 24 Years | 20 (100.0%) | 24 (100.0%) |
| 25 to 34 Years | 33 (100.0%) | 35 (60.3%) |
| 35 to 44 Years | 20 (100.0%) | 35 (76.1%) |
| 45 to 54 Years | 41 (100.0%) | 23 (76.7%) |
| 55 to 64 Years | 49 (86.0%) | 42 (87.5%) |
| 65 to 74 Years | 13 (59.1%) | 15 (88.2%) |
| 75 Years and over | 23 (100.0%) | 14 (100.0%) |
| Total | 248 (93.6%) | 240 (76.4%) |
Income Below Poverty Among Married-Couple Families in New Boston
The poverty statistics for married-couple families in New Boston show that 2.9% or 4 of the total 136 families live below the poverty line. Families with no children have the highest poverty rate of 5.1%, comprising of 4 families. On the other hand, families with 1 or 2 children have the lowest poverty rate of 0.0%, which includes 0 families.
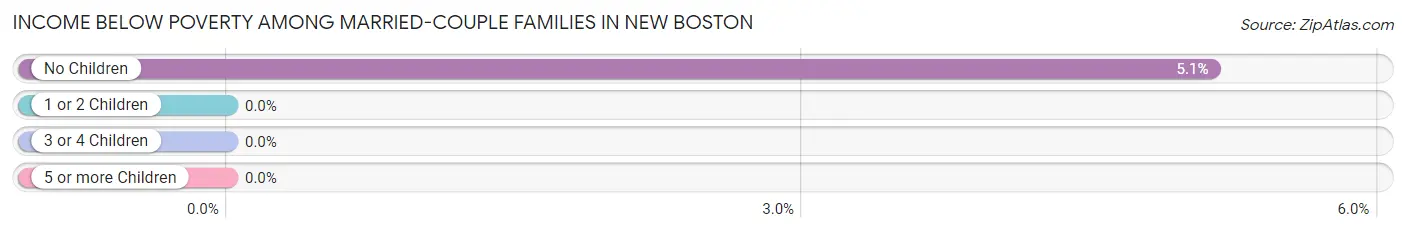
| Children | Above Poverty | Below Poverty |
| No Children | 74 (94.9%) | 4 (5.1%) |
| 1 or 2 Children | 58 (100.0%) | 0 (0.0%) |
| 3 or 4 Children | 0 (0.0%) | 0 (0.0%) |
| 5 or more Children | 0 (0.0%) | 0 (0.0%) |
| Total | 132 (97.1%) | 4 (2.9%) |
Income Below Poverty Among Single-Parent Households in New Boston
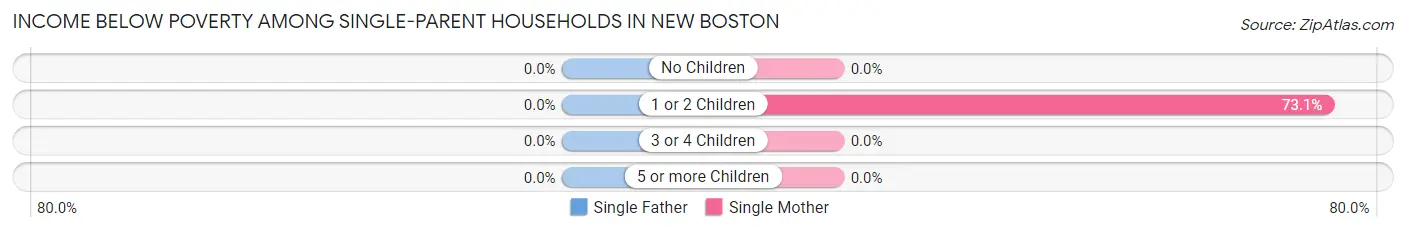
| Children | Single Father | Single Mother |
| No Children | 0 (0.0%) | 0 (0.0%) |
| 1 or 2 Children | 0 (0.0%) | 38 (73.1%) |
| 3 or 4 Children | 0 (0.0%) | 0 (0.0%) |
| 5 or more Children | 0 (0.0%) | 0 (0.0%) |
| Total | 0 (0.0%) | 38 (67.9%) |
Income Below Poverty Among Married-Couple vs Single-Parent Households in New Boston
The poverty data for New Boston shows that 4 of the married-couple family households (2.9%) and 38 of the single-parent households (63.3%) are living below the poverty level. Within the married-couple family households, those with no children have the highest poverty rate, with 4 households (5.1%) falling below the poverty line. Among the single-parent households, those with 1 or 2 children have the highest poverty rate, with 38 household (69.1%) living below poverty.
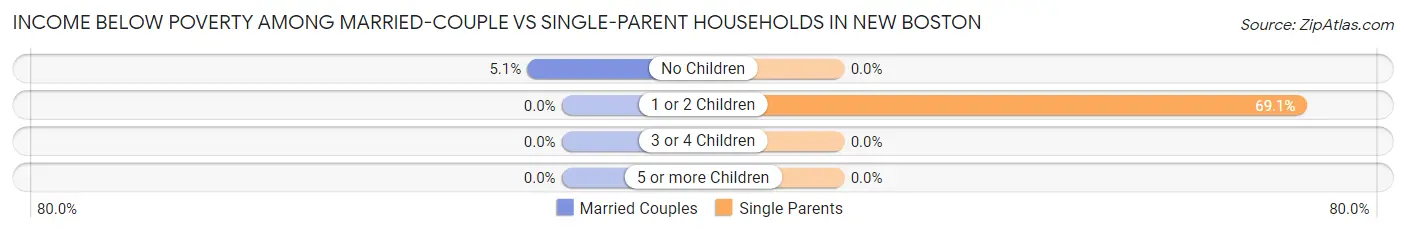
| Children | Married-Couple Families | Single-Parent Households |
| No Children | 4 (5.1%) | 0 (0.0%) |
| 1 or 2 Children | 0 (0.0%) | 38 (69.1%) |
| 3 or 4 Children | 0 (0.0%) | 0 (0.0%) |
| 5 or more Children | 0 (0.0%) | 0 (0.0%) |
| Total | 4 (2.9%) | 38 (63.3%) |
Employment Characteristics in New Boston
Employment by Class of Employer in New Boston
Among the 267 employed individuals in New Boston, private company employees (225 | 84.3%), self-employed (not incorporated) (12 | 4.5%), and not-for-profit organizations (11 | 4.1%) make up the most common classes of employment.
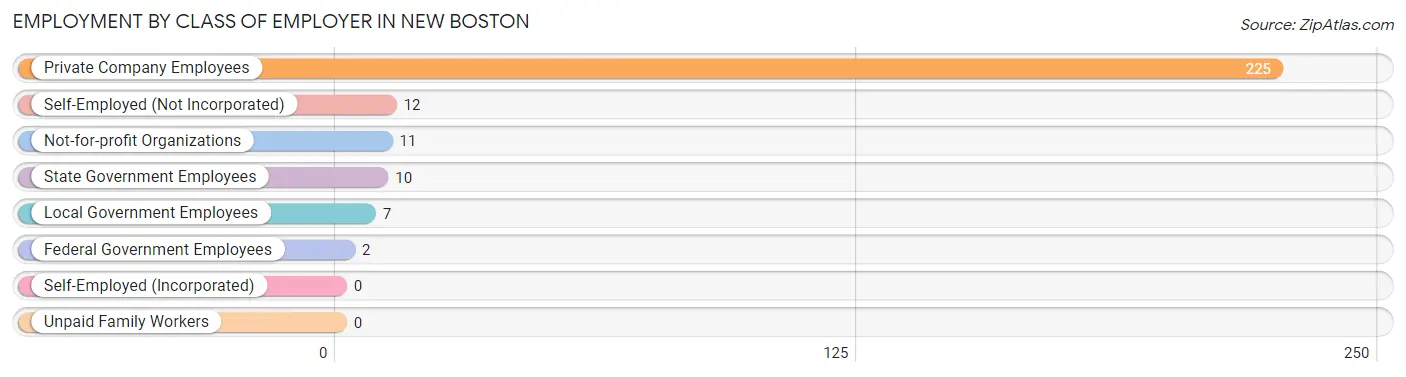
| Employer Class | # Employees | % Employees |
| Private Company Employees | 225 | 84.3% |
| Self-Employed (Incorporated) | 0 | 0.0% |
| Self-Employed (Not Incorporated) | 12 | 4.5% |
| Not-for-profit Organizations | 11 | 4.1% |
| Local Government Employees | 7 | 2.6% |
| State Government Employees | 10 | 3.7% |
| Federal Government Employees | 2 | 0.7% |
| Unpaid Family Workers | 0 | 0.0% |
| Total | 267 | 100.0% |
Employment Status by Age in New Boston
According to the labor force statistics for New Boston, out of the total population over 16 years of age (461), 62.3% or 287 individuals are in the labor force, with 7.0% or 20 of them unemployed. The age group with the highest labor force participation rate is 30 to 34 years, with 92.0% or 69 individuals in the labor force. Within the labor force, the 16 to 19 years age range has the highest percentage of unemployed individuals, with 25.0% or 2 of them being unemployed.
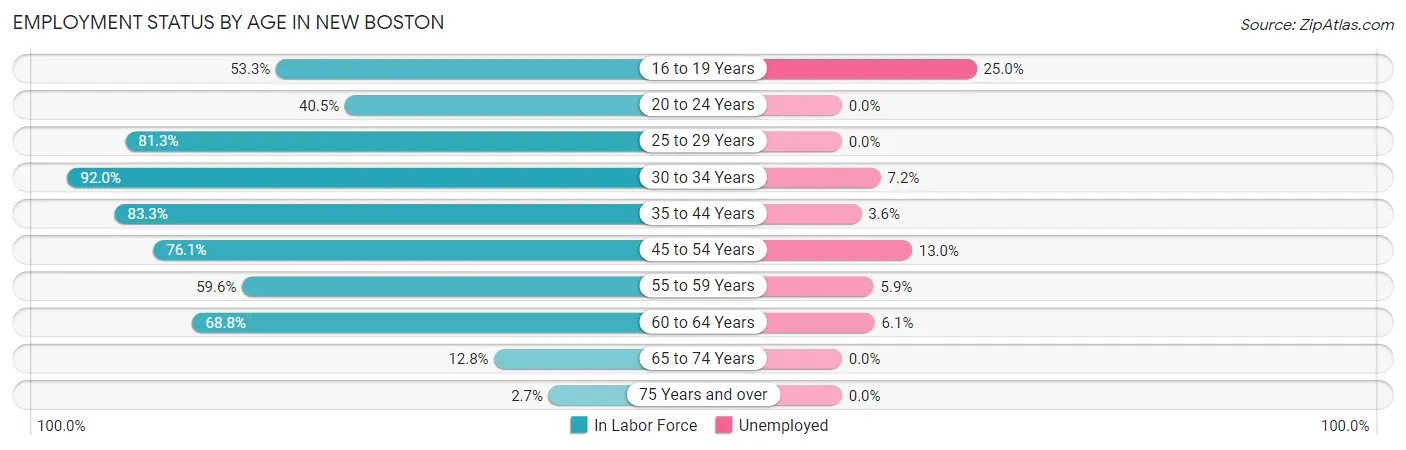
| Age Bracket | In Labor Force | Unemployed |
| 16 to 19 Years | 8 (53.3%) | 2 (25.0%) |
| 20 to 24 Years | 15 (40.5%) | 0 (0.0%) |
| 25 to 29 Years | 13 (81.3%) | 0 (0.0%) |
| 30 to 34 Years | 69 (92.0%) | 5 (7.2%) |
| 35 to 44 Years | 55 (83.3%) | 2 (3.6%) |
| 45 to 54 Years | 54 (76.1%) | 7 (13.0%) |
| 55 to 59 Years | 34 (59.6%) | 2 (5.9%) |
| 60 to 64 Years | 33 (68.8%) | 2 (6.1%) |
| 65 to 74 Years | 5 (12.8%) | 0 (0.0%) |
| 75 Years and over | 1 (2.7%) | 0 (0.0%) |
| Total | 287 (62.3%) | 20 (7.0%) |
Employment Status by Educational Attainment in New Boston
According to labor force statistics for New Boston, 77.5% of individuals (258) out of the total population between 25 and 64 years of age (333) are in the labor force, with 7.0% or 18 of them being unemployed. The group with the highest labor force participation rate are those with the educational attainment of bachelor's degree or higher, with 100.0% or 25 individuals in the labor force. Within the labor force, individuals with college / associate degree education have the highest percentage of unemployment, with 10.5% or 10 of them being unemployed.
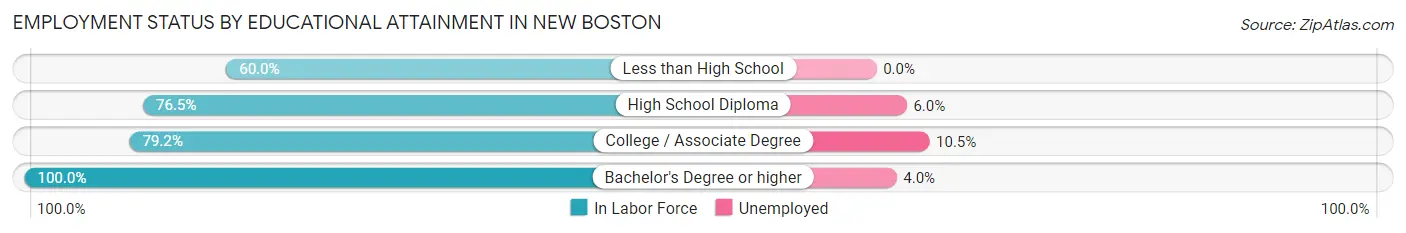
| Educational Attainment | In Labor Force | Unemployed |
| Less than High School | 21 (60.0%) | 0 (0.0%) |
| High School Diploma | 117 (76.5%) | 9 (6.0%) |
| College / Associate Degree | 95 (79.2%) | 13 (10.5%) |
| Bachelor's Degree or higher | 25 (100.0%) | 1 (4.0%) |
| Total | 258 (77.5%) | 23 (7.0%) |
Employment Occupations by Sex in New Boston
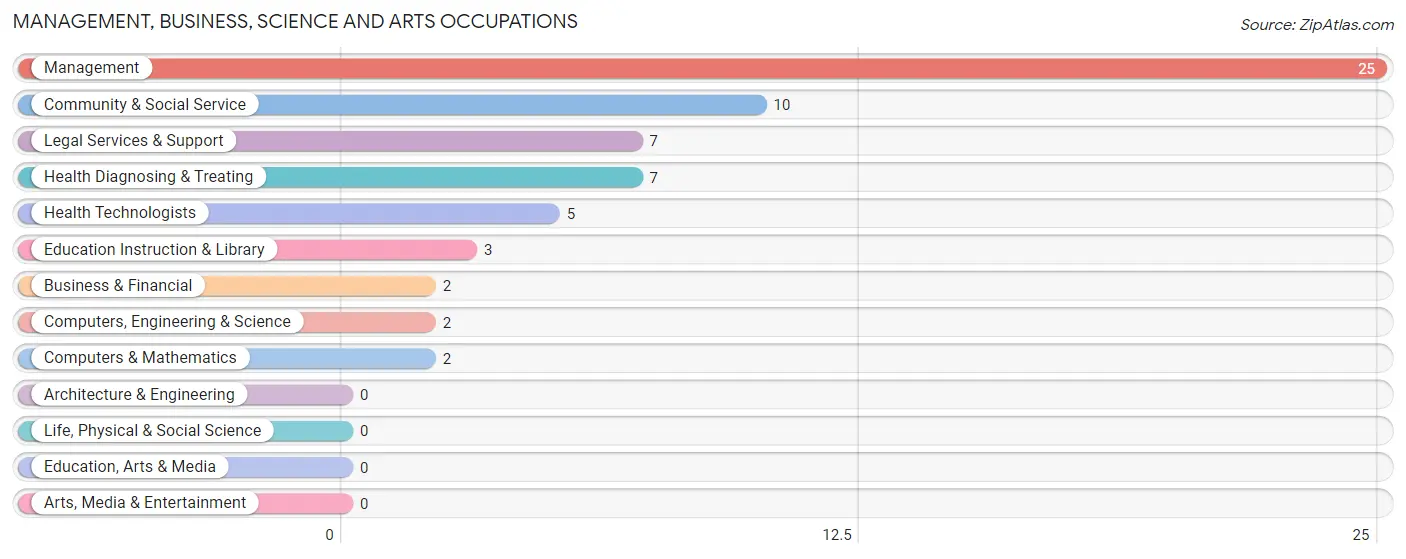
Management, Business, Science and Arts Occupations
The most common Management, Business, Science and Arts occupations in New Boston are Management (25 | 9.4%), Community & Social Service (10 | 3.7%), Legal Services & Support (7 | 2.6%), Health Diagnosing & Treating (7 | 2.6%), and Health Technologists (5 | 1.9%).
Management, Business, Science and Arts Occupations by Sex
Within the Management, Business, Science and Arts occupations in New Boston, the most male-oriented occupations are Business & Financial (100.0%), Computers, Engineering & Science (100.0%), and Computers & Mathematics (100.0%), while the most female-oriented occupations are Health Technologists (100.0%), Management (88.0%), and Health Diagnosing & Treating (71.4%).
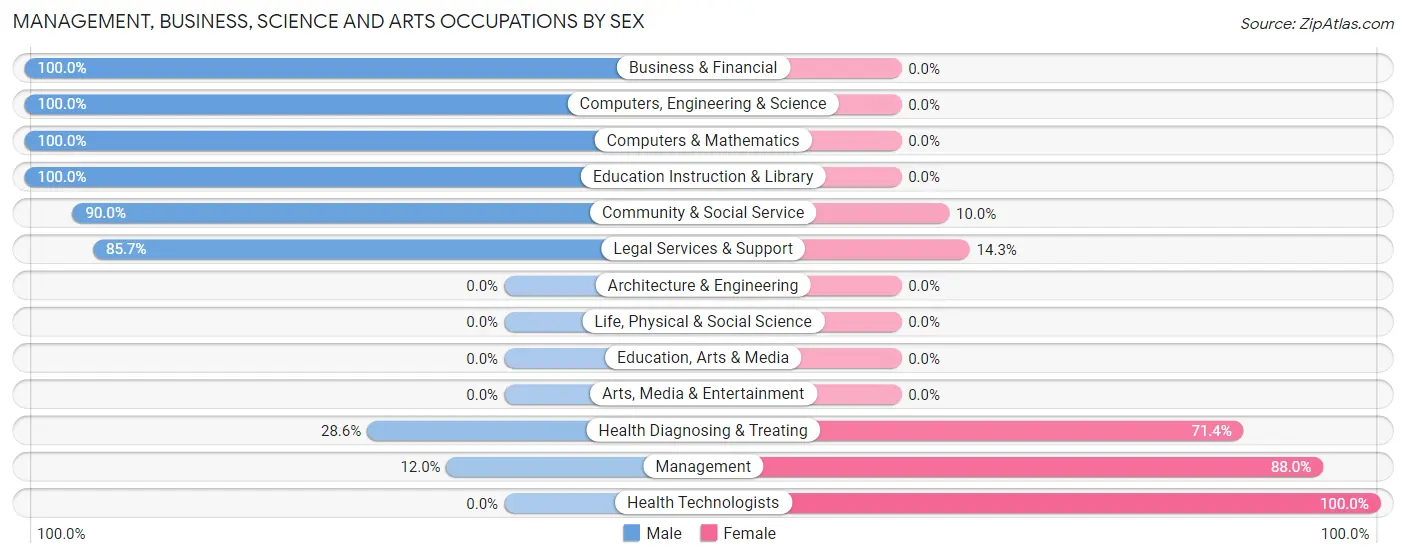
| Occupation | Male | Female |
| Management | 3 (12.0%) | 22 (88.0%) |
| Business & Financial | 2 (100.0%) | 0 (0.0%) |
| Computers, Engineering & Science | 2 (100.0%) | 0 (0.0%) |
| Computers & Mathematics | 2 (100.0%) | 0 (0.0%) |
| Architecture & Engineering | 0 (0.0%) | 0 (0.0%) |
| Life, Physical & Social Science | 0 (0.0%) | 0 (0.0%) |
| Community & Social Service | 9 (90.0%) | 1 (10.0%) |
| Education, Arts & Media | 0 (0.0%) | 0 (0.0%) |
| Legal Services & Support | 6 (85.7%) | 1 (14.3%) |
| Education Instruction & Library | 3 (100.0%) | 0 (0.0%) |
| Arts, Media & Entertainment | 0 (0.0%) | 0 (0.0%) |
| Health Diagnosing & Treating | 2 (28.6%) | 5 (71.4%) |
| Health Technologists | 0 (0.0%) | 5 (100.0%) |
| Total (Category) | 18 (39.1%) | 28 (60.9%) |
| Total (Overall) | 126 (47.2%) | 141 (52.8%) |
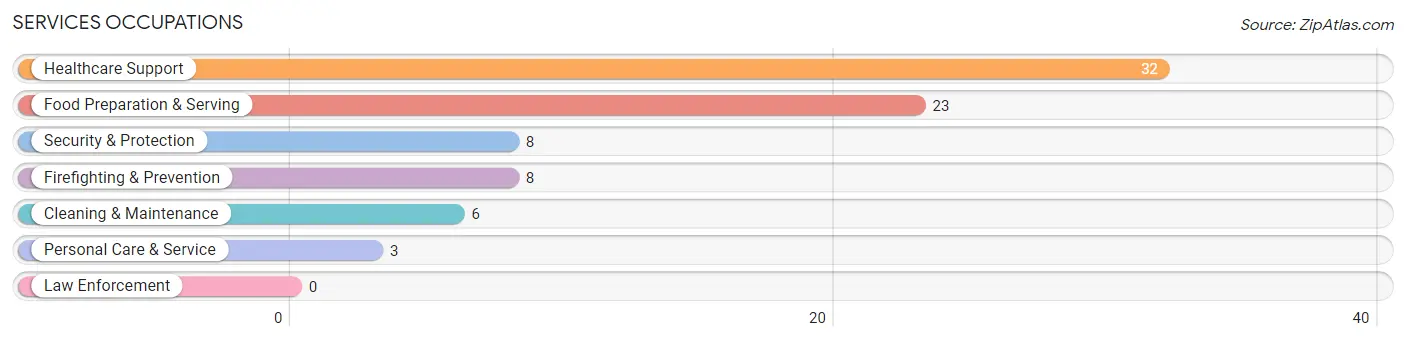
Services Occupations
The most common Services occupations in New Boston are Healthcare Support (32 | 12.0%), Food Preparation & Serving (23 | 8.6%), Security & Protection (8 | 3.0%), Firefighting & Prevention (8 | 3.0%), and Cleaning & Maintenance (6 | 2.2%).
Services Occupations by Sex
Within the Services occupations in New Boston, the most male-oriented occupations are Cleaning & Maintenance (66.7%), and Healthcare Support (21.9%), while the most female-oriented occupations are Security & Protection (100.0%), Firefighting & Prevention (100.0%), and Food Preparation & Serving (100.0%).
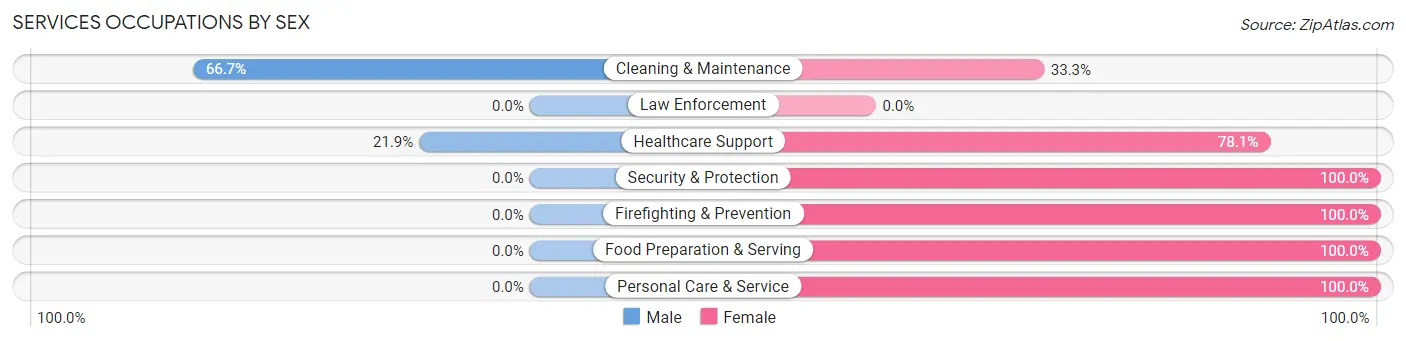
| Occupation | Male | Female |
| Healthcare Support | 7 (21.9%) | 25 (78.1%) |
| Security & Protection | 0 (0.0%) | 8 (100.0%) |
| Firefighting & Prevention | 0 (0.0%) | 8 (100.0%) |
| Law Enforcement | 0 (0.0%) | 0 (0.0%) |
| Food Preparation & Serving | 0 (0.0%) | 23 (100.0%) |
| Cleaning & Maintenance | 4 (66.7%) | 2 (33.3%) |
| Personal Care & Service | 0 (0.0%) | 3 (100.0%) |
| Total (Category) | 11 (15.3%) | 61 (84.7%) |
| Total (Overall) | 126 (47.2%) | 141 (52.8%) |
Sales and Office Occupations
The most common Sales and Office occupations in New Boston are Office & Administration (28 | 10.5%), and Sales & Related (19 | 7.1%).
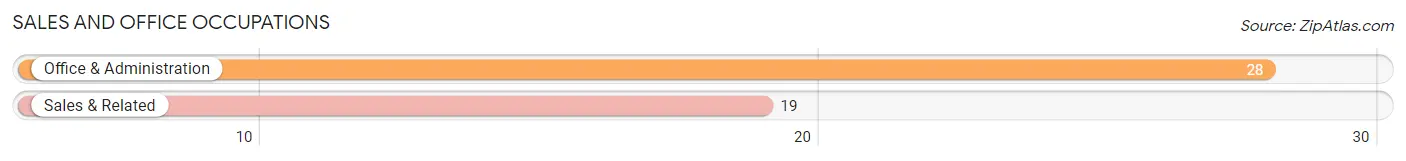
Sales and Office Occupations by Sex
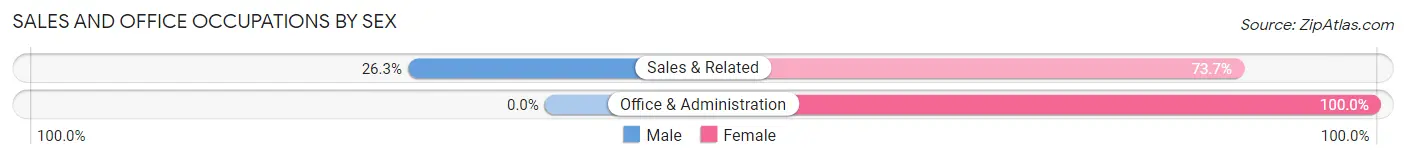
| Occupation | Male | Female |
| Sales & Related | 5 (26.3%) | 14 (73.7%) |
| Office & Administration | 0 (0.0%) | 28 (100.0%) |
| Total (Category) | 5 (10.6%) | 42 (89.4%) |
| Total (Overall) | 126 (47.2%) | 141 (52.8%) |
Natural Resources, Construction and Maintenance Occupations
The most common Natural Resources, Construction and Maintenance occupations in New Boston are Construction & Extraction (20 | 7.5%), Installation, Maintenance & Repair (6 | 2.2%), and Farming, Fishing & Forestry (3 | 1.1%).
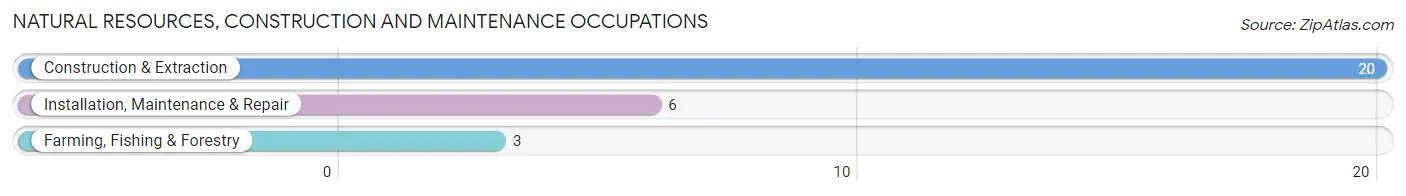
Natural Resources, Construction and Maintenance Occupations by Sex
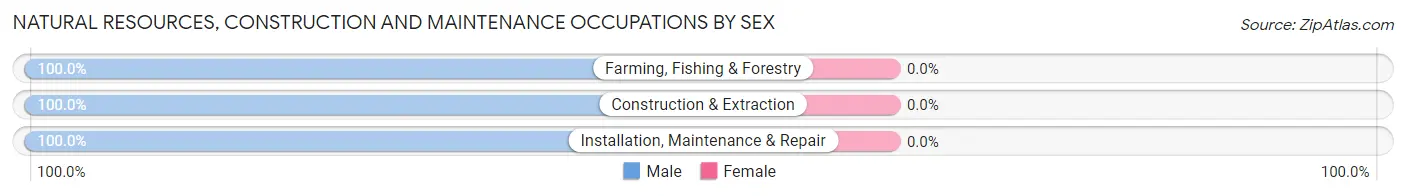
| Occupation | Male | Female |
| Farming, Fishing & Forestry | 3 (100.0%) | 0 (0.0%) |
| Construction & Extraction | 20 (100.0%) | 0 (0.0%) |
| Installation, Maintenance & Repair | 6 (100.0%) | 0 (0.0%) |
| Total (Category) | 29 (100.0%) | 0 (0.0%) |
| Total (Overall) | 126 (47.2%) | 141 (52.8%) |
Production, Transportation and Moving Occupations
The most common Production, Transportation and Moving occupations in New Boston are Transportation (37 | 13.9%), Production (22 | 8.2%), and Material Moving (14 | 5.2%).
Production, Transportation and Moving Occupations by Sex
| Occupation | Male | Female |
| Production | 15 (68.2%) | 7 (31.8%) |
| Transportation | 37 (100.0%) | 0 (0.0%) |
| Material Moving | 11 (78.6%) | 3 (21.4%) |
| Total (Category) | 63 (86.3%) | 10 (13.7%) |
| Total (Overall) | 126 (47.2%) | 141 (52.8%) |
Employment Industries by Sex in New Boston
Employment Industries in New Boston
The major employment industries in New Boston include Retail Trade (50 | 18.7%), Manufacturing (48 | 18.0%), Transportation & Warehousing (44 | 16.5%), Health Care & Social Assistance (35 | 13.1%), and Construction (24 | 9.0%).
Employment Industries by Sex in New Boston
The New Boston industries that see more men than women are Agriculture, Fishing & Hunting (100.0%), Construction (100.0%), and Wholesale Trade (100.0%), whereas the industries that tend to have a higher number of women are Finance & Insurance (100.0%), Accommodation & Food Services (100.0%), and Health Care & Social Assistance (94.3%).
| Industry | Male | Female |
| Agriculture, Fishing & Hunting | 4 (100.0%) | 0 (0.0%) |
| Mining, Quarrying, & Extraction | 0 (0.0%) | 0 (0.0%) |
| Construction | 24 (100.0%) | 0 (0.0%) |
| Manufacturing | 25 (52.1%) | 23 (47.9%) |
| Wholesale Trade | 6 (100.0%) | 0 (0.0%) |
| Retail Trade | 3 (6.0%) | 47 (94.0%) |
| Transportation & Warehousing | 34 (77.3%) | 10 (22.7%) |
| Utilities | 0 (0.0%) | 0 (0.0%) |
| Information | 3 (100.0%) | 0 (0.0%) |
| Finance & Insurance | 0 (0.0%) | 14 (100.0%) |
| Real Estate, Rental & Leasing | 0 (0.0%) | 0 (0.0%) |
| Professional & Scientific | 10 (100.0%) | 0 (0.0%) |
| Enterprise Management | 0 (0.0%) | 0 (0.0%) |
| Administrative & Support | 3 (42.9%) | 4 (57.1%) |
| Educational Services | 3 (37.5%) | 5 (62.5%) |
| Health Care & Social Assistance | 2 (5.7%) | 33 (94.3%) |
| Arts, Entertainment & Recreation | 0 (0.0%) | 0 (0.0%) |
| Accommodation & Food Services | 0 (0.0%) | 2 (100.0%) |
| Public Administration | 8 (72.7%) | 3 (27.3%) |
| Total | 126 (47.2%) | 141 (52.8%) |
Education in New Boston
School Enrollment in New Boston
The most common levels of schooling among the 118 students in New Boston are elementary school (35 | 29.7%), middle school (31 | 26.3%), and high school (27 | 22.9%).
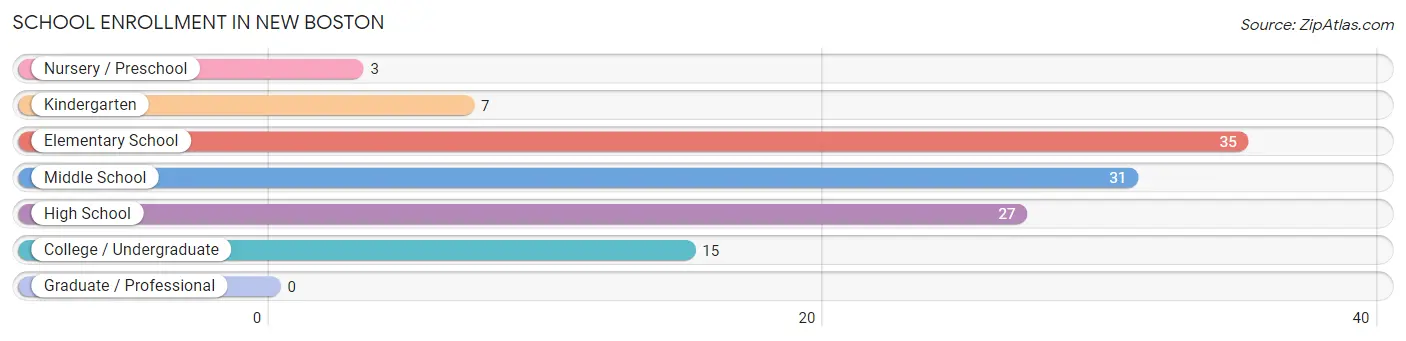
| School Level | # Students | % Students |
| Nursery / Preschool | 3 | 2.5% |
| Kindergarten | 7 | 5.9% |
| Elementary School | 35 | 29.7% |
| Middle School | 31 | 26.3% |
| High School | 27 | 22.9% |
| College / Undergraduate | 15 | 12.7% |
| Graduate / Professional | 0 | 0.0% |
| Total | 118 | 100.0% |
School Enrollment by Age by Funding Source in New Boston
Out of a total of 118 students who are enrolled in schools in New Boston, 6 (5.1%) attend a private institution, while the remaining 112 (94.9%) are enrolled in public schools. The age group of 15 to 17 year olds has the highest likelihood of being enrolled in private schools, with 3 (16.7% in the age bracket) enrolled. Conversely, the age group of 3 to 4 year olds has the lowest likelihood of being enrolled in a private school, with 3 (100.0% in the age bracket) attending a public institution.
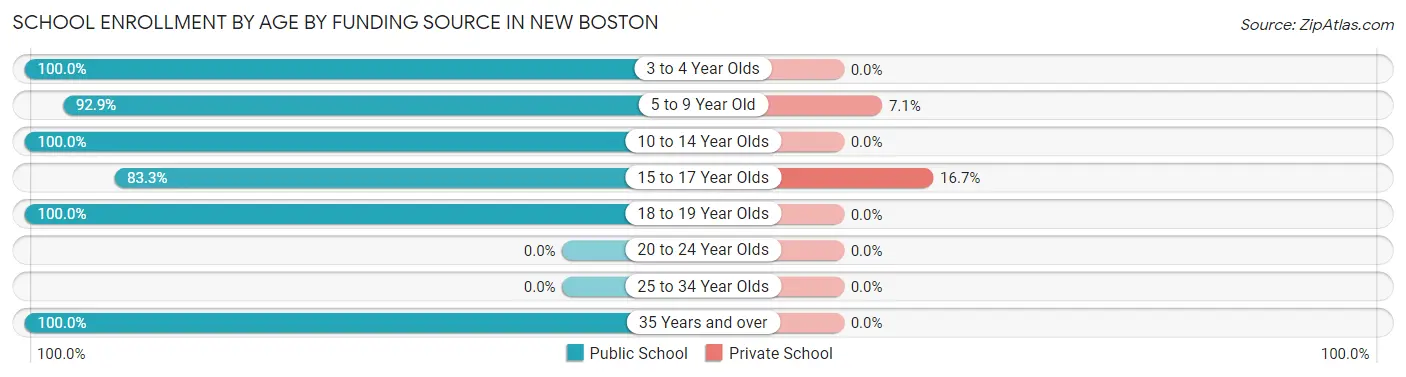
| Age Bracket | Public School | Private School |
| 3 to 4 Year Olds | 3 (100.0%) | 0 (0.0%) |
| 5 to 9 Year Old | 39 (92.9%) | 3 (7.1%) |
| 10 to 14 Year Olds | 40 (100.0%) | 0 (0.0%) |
| 15 to 17 Year Olds | 15 (83.3%) | 3 (16.7%) |
| 18 to 19 Year Olds | 3 (100.0%) | 0 (0.0%) |
| 20 to 24 Year Olds | 0 (0.0%) | 0 (0.0%) |
| 25 to 34 Year Olds | 0 (0.0%) | 0 (0.0%) |
| 35 Years and over | 12 (100.0%) | 0 (0.0%) |
| Total | 112 (94.9%) | 6 (5.1%) |
Educational Attainment by Field of Study in New Boston
Arts & humanities (11 | 26.8%), liberal arts & history (6 | 14.6%), communications (6 | 14.6%), science & technology (5 | 12.2%), and education (4 | 9.8%) are the most common fields of study among 41 individuals in New Boston who have obtained a bachelor's degree or higher.
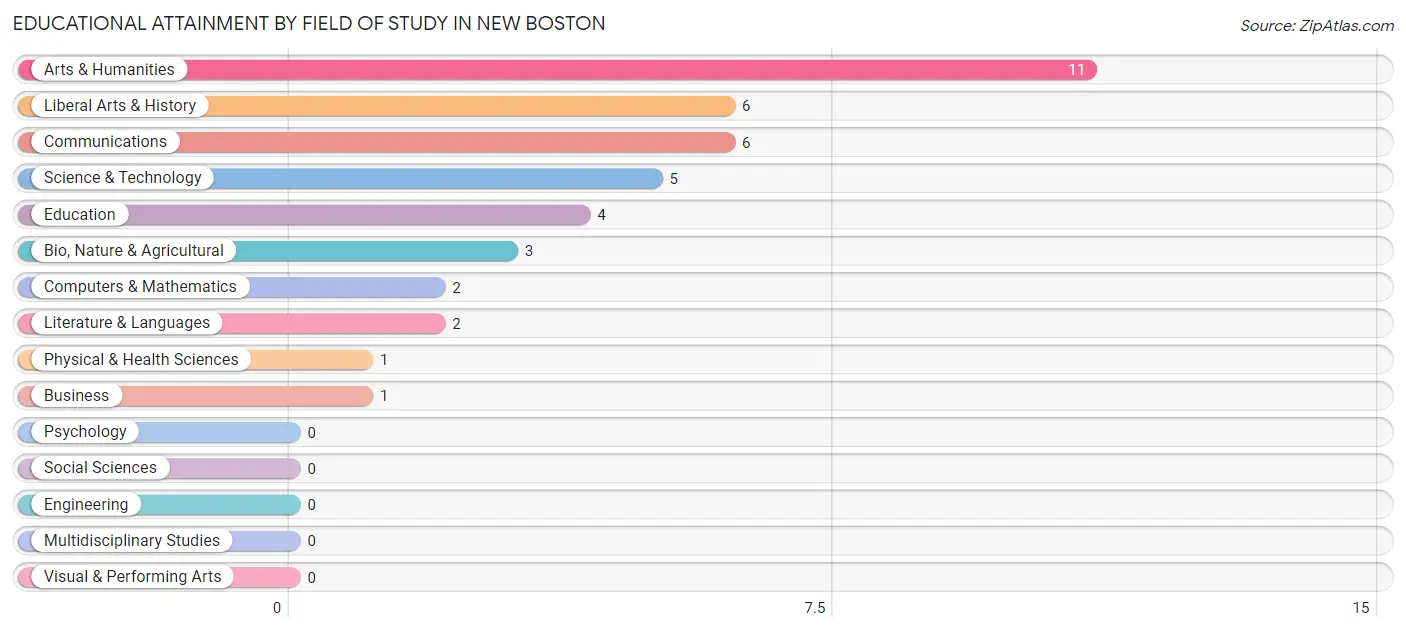
| Field of Study | # Graduates | % Graduates |
| Computers & Mathematics | 2 | 4.9% |
| Bio, Nature & Agricultural | 3 | 7.3% |
| Physical & Health Sciences | 1 | 2.4% |
| Psychology | 0 | 0.0% |
| Social Sciences | 0 | 0.0% |
| Engineering | 0 | 0.0% |
| Multidisciplinary Studies | 0 | 0.0% |
| Science & Technology | 5 | 12.2% |
| Business | 1 | 2.4% |
| Education | 4 | 9.8% |
| Literature & Languages | 2 | 4.9% |
| Liberal Arts & History | 6 | 14.6% |
| Visual & Performing Arts | 0 | 0.0% |
| Communications | 6 | 14.6% |
| Arts & Humanities | 11 | 26.8% |
| Total | 41 | 100.0% |
Transportation & Commute in New Boston
Vehicle Availability by Sex in New Boston
The most prevalent vehicle ownership categories in New Boston are males with 3 vehicles (42, accounting for 33.3%) and females with 3 vehicles (34, making up 29.8%).
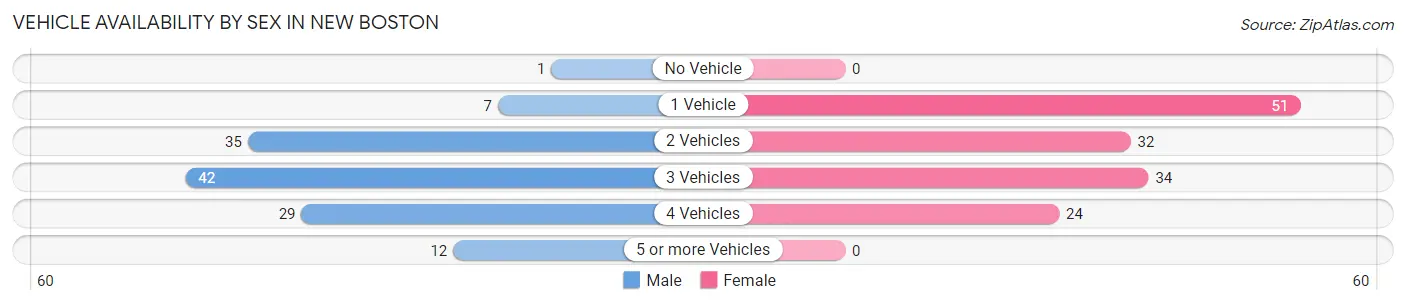
| Vehicles Available | Male | Female |
| No Vehicle | 1 (0.8%) | 0 (0.0%) |
| 1 Vehicle | 7 (5.6%) | 51 (36.2%) |
| 2 Vehicles | 35 (27.8%) | 32 (22.7%) |
| 3 Vehicles | 42 (33.3%) | 34 (24.1%) |
| 4 Vehicles | 29 (23.0%) | 24 (17.0%) |
| 5 or more Vehicles | 12 (9.5%) | 0 (0.0%) |
| Total | 126 (100.0%) | 141 (100.0%) |
Commute Time in New Boston
The most frequently occuring commute durations in New Boston are 30 to 34 minutes (39 commuters, 14.9%), 60 to 89 minutes (35 commuters, 13.4%), and 90 or more minutes (31 commuters, 11.9%).
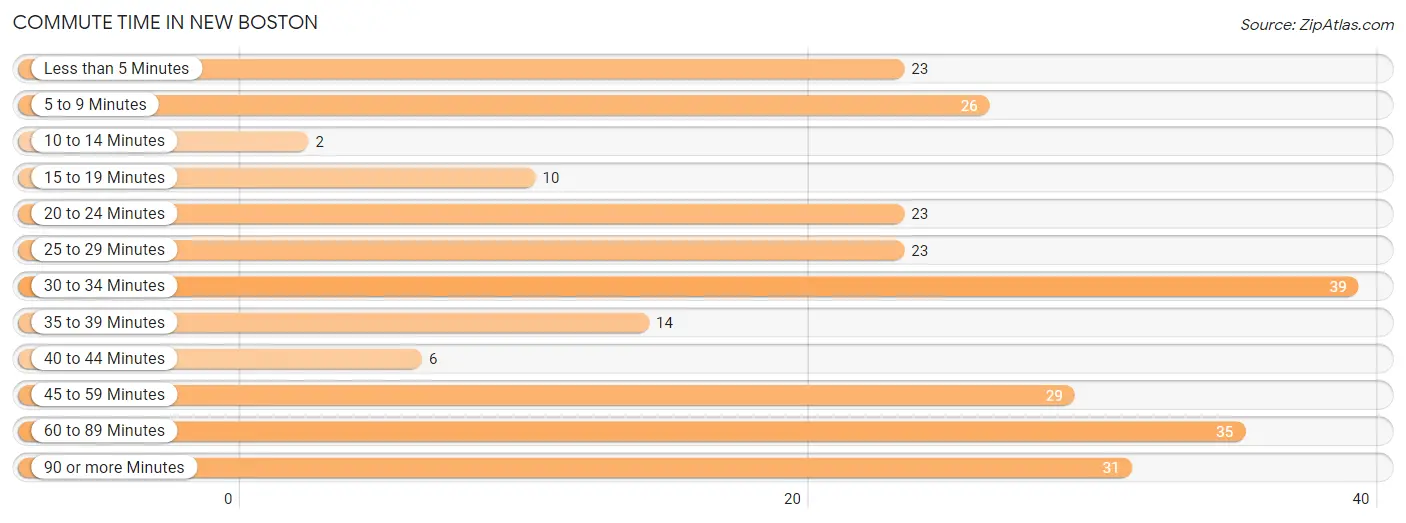
| Commute Time | # Commuters | % Commuters |
| Less than 5 Minutes | 23 | 8.8% |
| 5 to 9 Minutes | 26 | 10.0% |
| 10 to 14 Minutes | 2 | 0.8% |
| 15 to 19 Minutes | 10 | 3.8% |
| 20 to 24 Minutes | 23 | 8.8% |
| 25 to 29 Minutes | 23 | 8.8% |
| 30 to 34 Minutes | 39 | 14.9% |
| 35 to 39 Minutes | 14 | 5.4% |
| 40 to 44 Minutes | 6 | 2.3% |
| 45 to 59 Minutes | 29 | 11.1% |
| 60 to 89 Minutes | 35 | 13.4% |
| 90 or more Minutes | 31 | 11.9% |
Commute Time by Sex in New Boston
The most common commute times in New Boston are 30 to 34 minutes (24 commuters, 19.1%) for males and 5 to 9 minutes (26 commuters, 19.3%) for females.
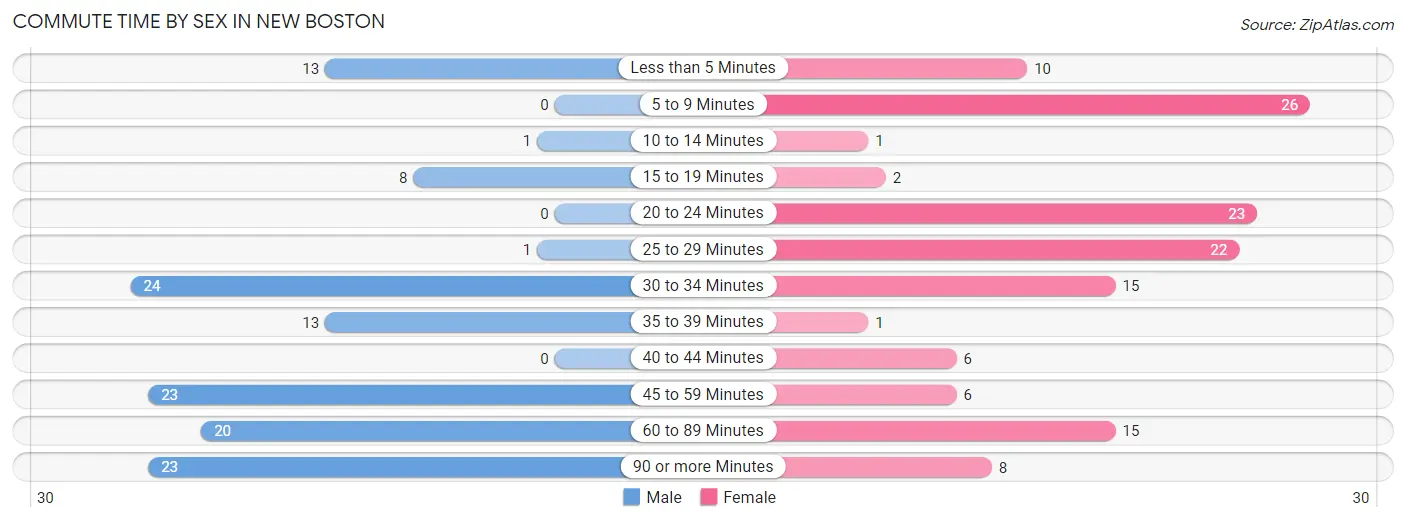
| Commute Time | Male | Female |
| Less than 5 Minutes | 13 (10.3%) | 10 (7.4%) |
| 5 to 9 Minutes | 0 (0.0%) | 26 (19.3%) |
| 10 to 14 Minutes | 1 (0.8%) | 1 (0.7%) |
| 15 to 19 Minutes | 8 (6.4%) | 2 (1.5%) |
| 20 to 24 Minutes | 0 (0.0%) | 23 (17.0%) |
| 25 to 29 Minutes | 1 (0.8%) | 22 (16.3%) |
| 30 to 34 Minutes | 24 (19.1%) | 15 (11.1%) |
| 35 to 39 Minutes | 13 (10.3%) | 1 (0.7%) |
| 40 to 44 Minutes | 0 (0.0%) | 6 (4.4%) |
| 45 to 59 Minutes | 23 (18.2%) | 6 (4.4%) |
| 60 to 89 Minutes | 20 (15.9%) | 15 (11.1%) |
| 90 or more Minutes | 23 (18.2%) | 8 (5.9%) |
Time of Departure to Work by Sex in New Boston
The most frequent times of departure to work in New Boston are 5:00 AM to 5:29 AM (27, 21.4%) for males and 12:00 PM to 3:59 PM (27, 20.0%) for females.
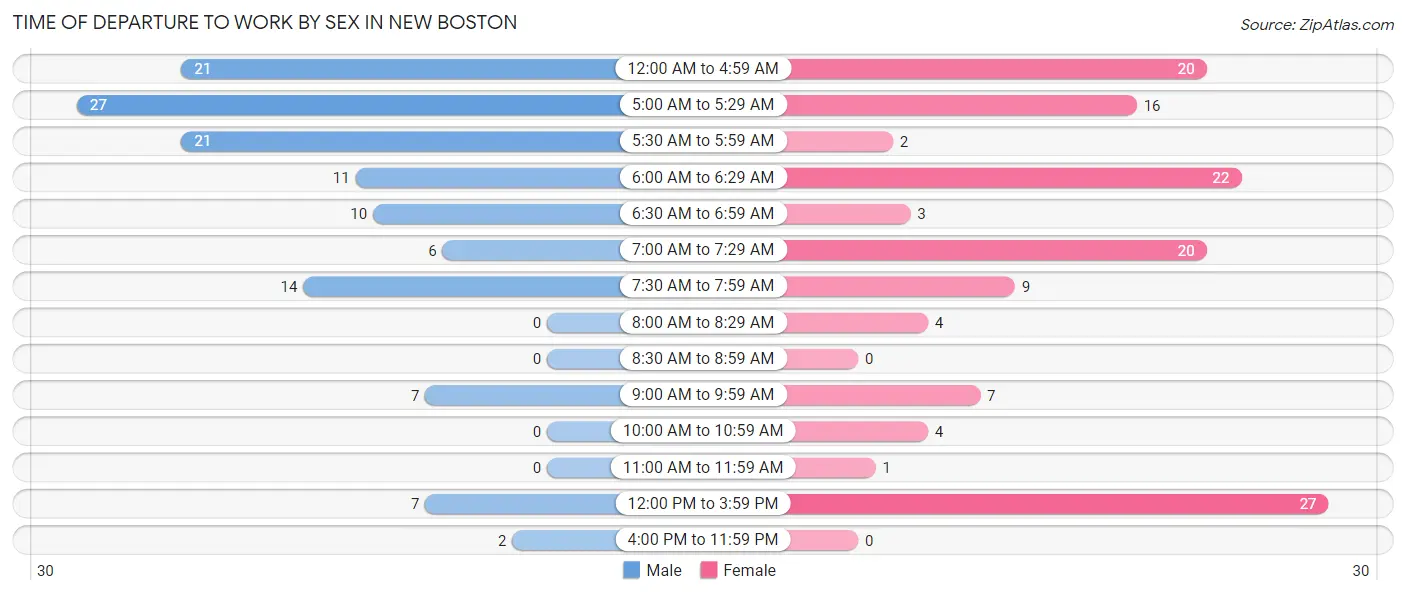
| Time of Departure | Male | Female |
| 12:00 AM to 4:59 AM | 21 (16.7%) | 20 (14.8%) |
| 5:00 AM to 5:29 AM | 27 (21.4%) | 16 (11.8%) |
| 5:30 AM to 5:59 AM | 21 (16.7%) | 2 (1.5%) |
| 6:00 AM to 6:29 AM | 11 (8.7%) | 22 (16.3%) |
| 6:30 AM to 6:59 AM | 10 (7.9%) | 3 (2.2%) |
| 7:00 AM to 7:29 AM | 6 (4.8%) | 20 (14.8%) |
| 7:30 AM to 7:59 AM | 14 (11.1%) | 9 (6.7%) |
| 8:00 AM to 8:29 AM | 0 (0.0%) | 4 (3.0%) |
| 8:30 AM to 8:59 AM | 0 (0.0%) | 0 (0.0%) |
| 9:00 AM to 9:59 AM | 7 (5.6%) | 7 (5.2%) |
| 10:00 AM to 10:59 AM | 0 (0.0%) | 4 (3.0%) |
| 11:00 AM to 11:59 AM | 0 (0.0%) | 1 (0.7%) |
| 12:00 PM to 3:59 PM | 7 (5.6%) | 27 (20.0%) |
| 4:00 PM to 11:59 PM | 2 (1.6%) | 0 (0.0%) |
| Total | 126 (100.0%) | 135 (100.0%) |
Housing Occupancy in New Boston
Occupancy by Ownership in New Boston
Of the total 265 dwellings in New Boston, owner-occupied units account for 210 (79.2%), while renter-occupied units make up 55 (20.7%).
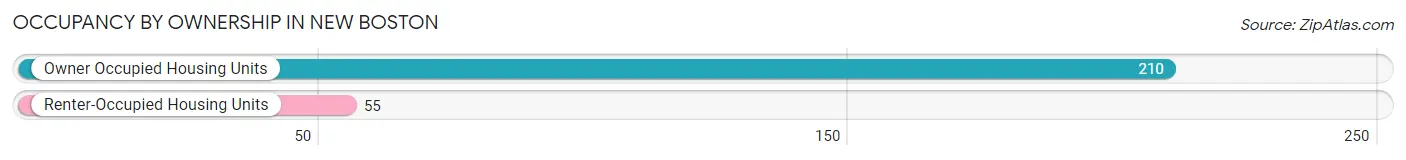
| Occupancy | # Housing Units | % Housing Units |
| Owner Occupied Housing Units | 210 | 79.2% |
| Renter-Occupied Housing Units | 55 | 20.7% |
| Total Occupied Housing Units | 265 | 100.0% |
Occupancy by Household Size in New Boston
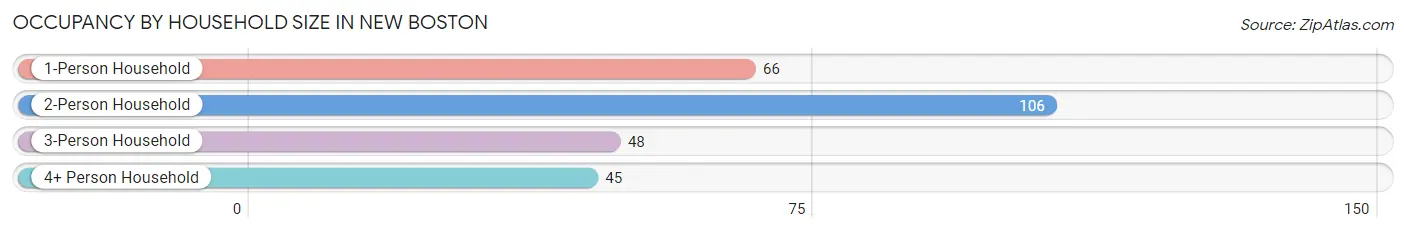
| Household Size | # Housing Units | % Housing Units |
| 1-Person Household | 66 | 24.9% |
| 2-Person Household | 106 | 40.0% |
| 3-Person Household | 48 | 18.1% |
| 4+ Person Household | 45 | 17.0% |
| Total Housing Units | 265 | 100.0% |
Occupancy by Ownership by Household Size in New Boston
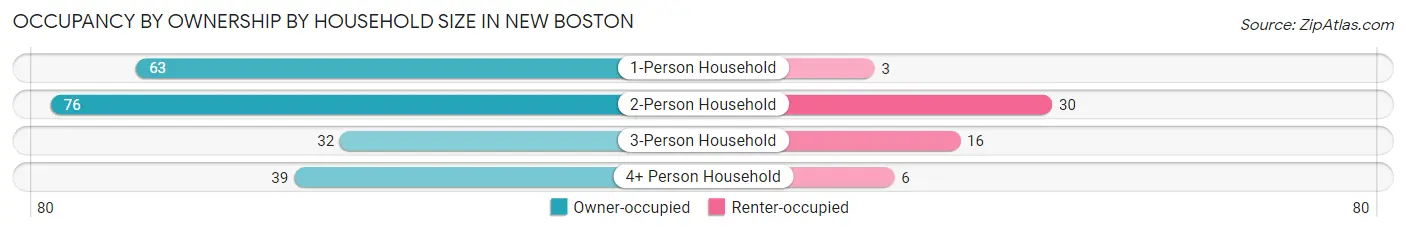
| Household Size | Owner-occupied | Renter-occupied |
| 1-Person Household | 63 (95.5%) | 3 (4.5%) |
| 2-Person Household | 76 (71.7%) | 30 (28.3%) |
| 3-Person Household | 32 (66.7%) | 16 (33.3%) |
| 4+ Person Household | 39 (86.7%) | 6 (13.3%) |
| Total Housing Units | 210 (79.2%) | 55 (20.7%) |
Occupancy by Educational Attainment in New Boston
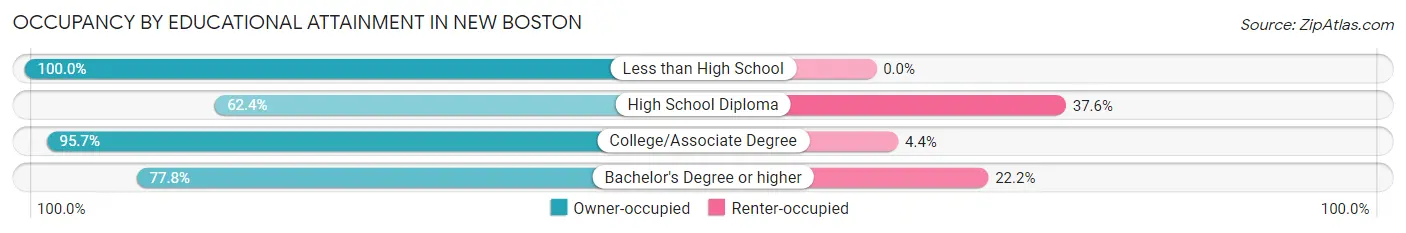
| Household Size | Owner-occupied | Renter-occupied |
| Less than High School | 30 (100.0%) | 0 (0.0%) |
| High School Diploma | 78 (62.4%) | 47 (37.6%) |
| College/Associate Degree | 88 (95.7%) | 4 (4.3%) |
| Bachelor's Degree or higher | 14 (77.8%) | 4 (22.2%) |
Occupancy by Age of Householder in New Boston
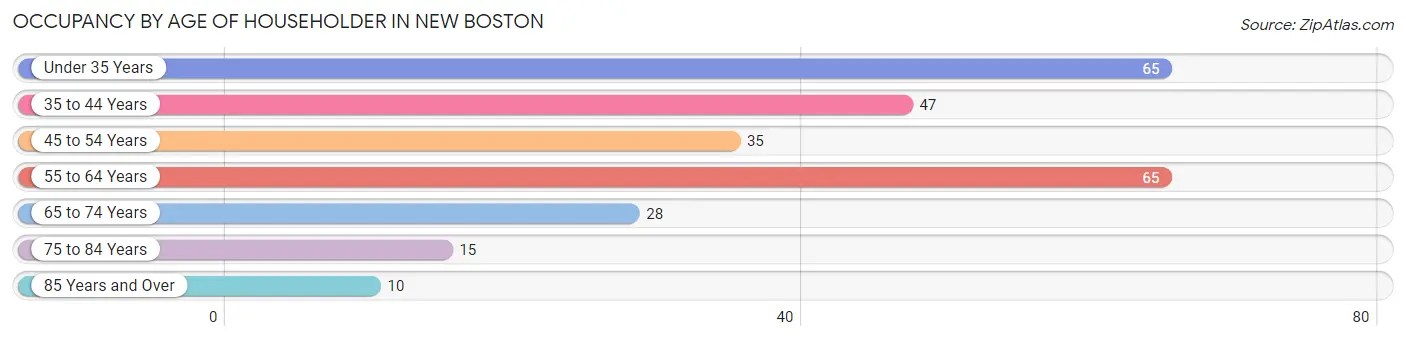
| Age Bracket | # Households | % Households |
| Under 35 Years | 65 | 24.5% |
| 35 to 44 Years | 47 | 17.7% |
| 45 to 54 Years | 35 | 13.2% |
| 55 to 64 Years | 65 | 24.5% |
| 65 to 74 Years | 28 | 10.6% |
| 75 to 84 Years | 15 | 5.7% |
| 85 Years and Over | 10 | 3.8% |
| Total | 265 | 100.0% |
Housing Finances in New Boston
Median Income by Occupancy in New Boston
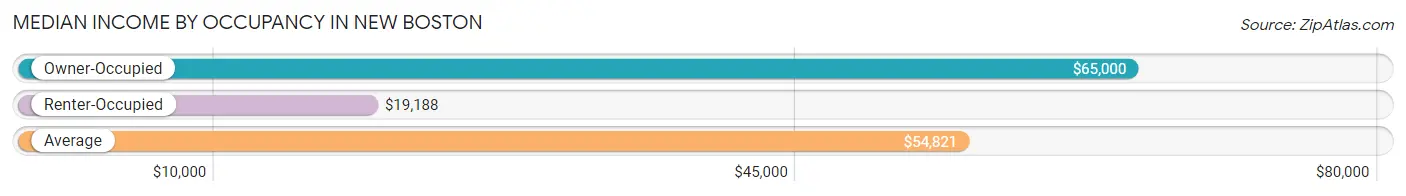
| Occupancy Type | # Households | Median Income |
| Owner-Occupied | 210 (79.2%) | $65,000 |
| Renter-Occupied | 55 (20.7%) | $19,188 |
| Average | 265 (100.0%) | $54,821 |
Occupancy by Householder Income Bracket in New Boston
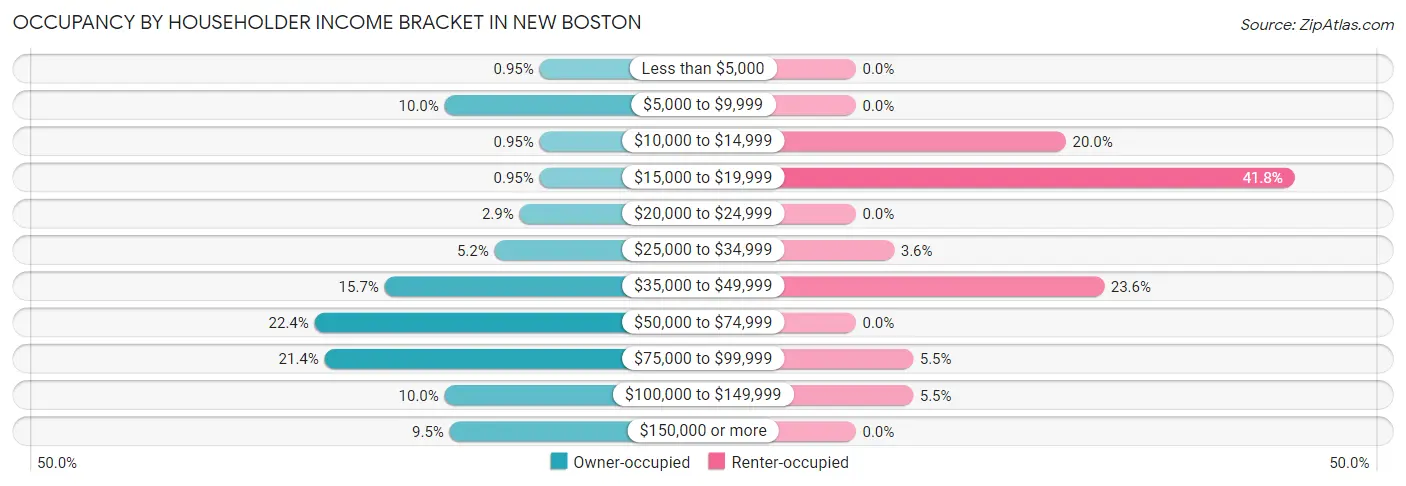
| Income Bracket | Owner-occupied | Renter-occupied |
| Less than $5,000 | 2 (0.9%) | 0 (0.0%) |
| $5,000 to $9,999 | 21 (10.0%) | 0 (0.0%) |
| $10,000 to $14,999 | 2 (0.9%) | 11 (20.0%) |
| $15,000 to $19,999 | 2 (0.9%) | 23 (41.8%) |
| $20,000 to $24,999 | 6 (2.9%) | 0 (0.0%) |
| $25,000 to $34,999 | 11 (5.2%) | 2 (3.6%) |
| $35,000 to $49,999 | 33 (15.7%) | 13 (23.6%) |
| $50,000 to $74,999 | 47 (22.4%) | 0 (0.0%) |
| $75,000 to $99,999 | 45 (21.4%) | 3 (5.4%) |
| $100,000 to $149,999 | 21 (10.0%) | 3 (5.4%) |
| $150,000 or more | 20 (9.5%) | 0 (0.0%) |
| Total | 210 (100.0%) | 55 (100.0%) |
Monthly Housing Cost Tiers in New Boston
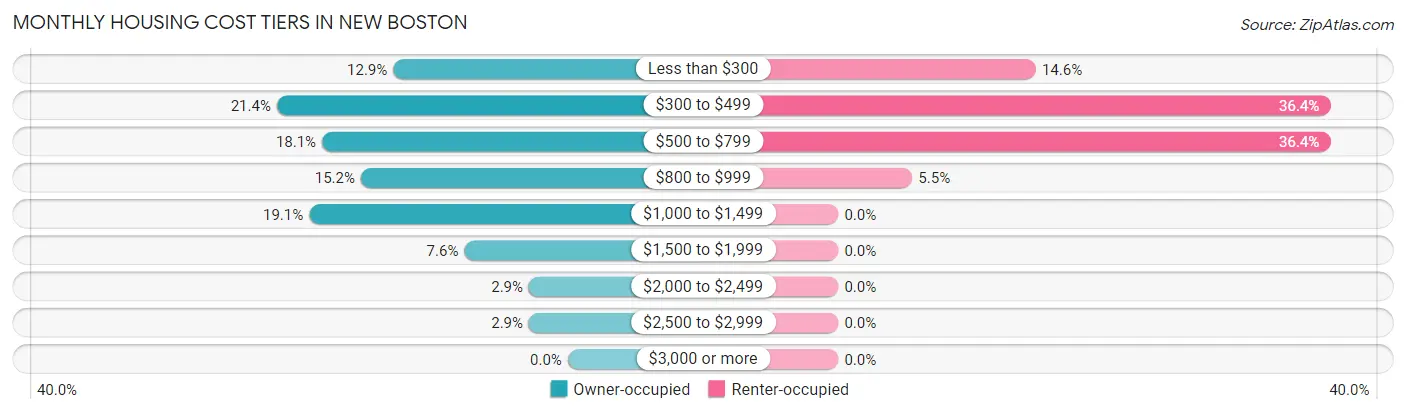
| Monthly Cost | Owner-occupied | Renter-occupied |
| Less than $300 | 27 (12.9%) | 8 (14.5%) |
| $300 to $499 | 45 (21.4%) | 20 (36.4%) |
| $500 to $799 | 38 (18.1%) | 20 (36.4%) |
| $800 to $999 | 32 (15.2%) | 3 (5.4%) |
| $1,000 to $1,499 | 40 (19.1%) | 0 (0.0%) |
| $1,500 to $1,999 | 16 (7.6%) | 0 (0.0%) |
| $2,000 to $2,499 | 6 (2.9%) | 0 (0.0%) |
| $2,500 to $2,999 | 6 (2.9%) | 0 (0.0%) |
| $3,000 or more | 0 (0.0%) | 0 (0.0%) |
| Total | 210 (100.0%) | 55 (100.0%) |
Physical Housing Characteristics in New Boston
Housing Structures in New Boston
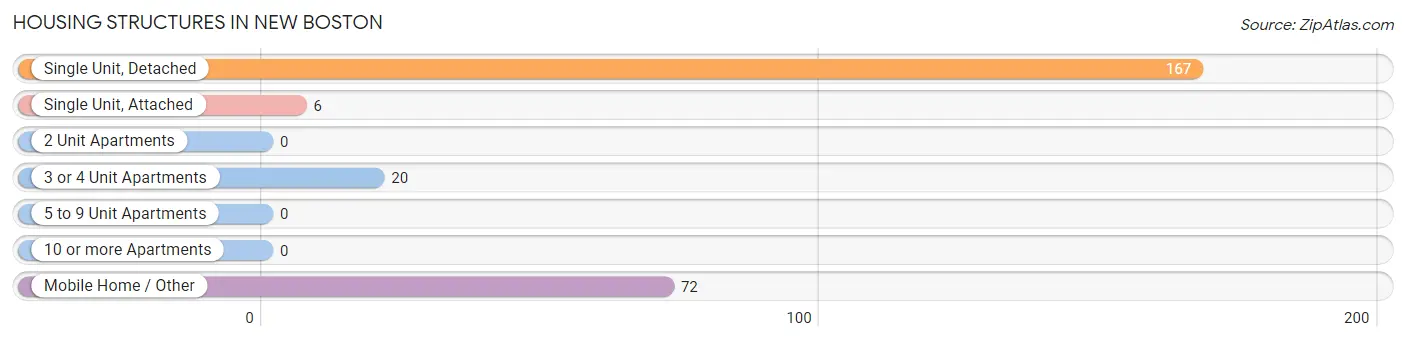
| Structure Type | # Housing Units | % Housing Units |
| Single Unit, Detached | 167 | 63.0% |
| Single Unit, Attached | 6 | 2.3% |
| 2 Unit Apartments | 0 | 0.0% |
| 3 or 4 Unit Apartments | 20 | 7.5% |
| 5 to 9 Unit Apartments | 0 | 0.0% |
| 10 or more Apartments | 0 | 0.0% |
| Mobile Home / Other | 72 | 27.2% |
| Total | 265 | 100.0% |
Housing Structures by Occupancy in New Boston
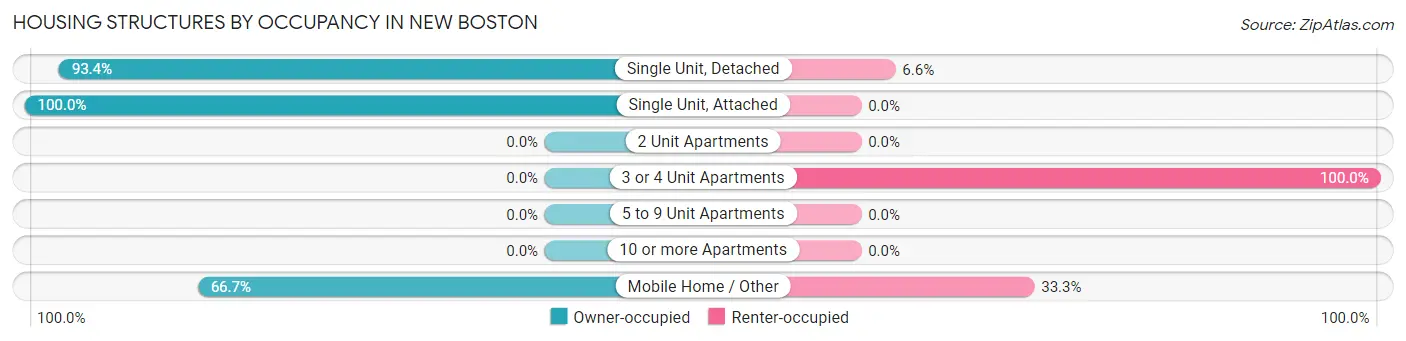
| Structure Type | Owner-occupied | Renter-occupied |
| Single Unit, Detached | 156 (93.4%) | 11 (6.6%) |
| Single Unit, Attached | 6 (100.0%) | 0 (0.0%) |
| 2 Unit Apartments | 0 (0.0%) | 0 (0.0%) |
| 3 or 4 Unit Apartments | 0 (0.0%) | 20 (100.0%) |
| 5 to 9 Unit Apartments | 0 (0.0%) | 0 (0.0%) |
| 10 or more Apartments | 0 (0.0%) | 0 (0.0%) |
| Mobile Home / Other | 48 (66.7%) | 24 (33.3%) |
| Total | 210 (79.2%) | 55 (20.7%) |
Housing Structures by Number of Rooms in New Boston
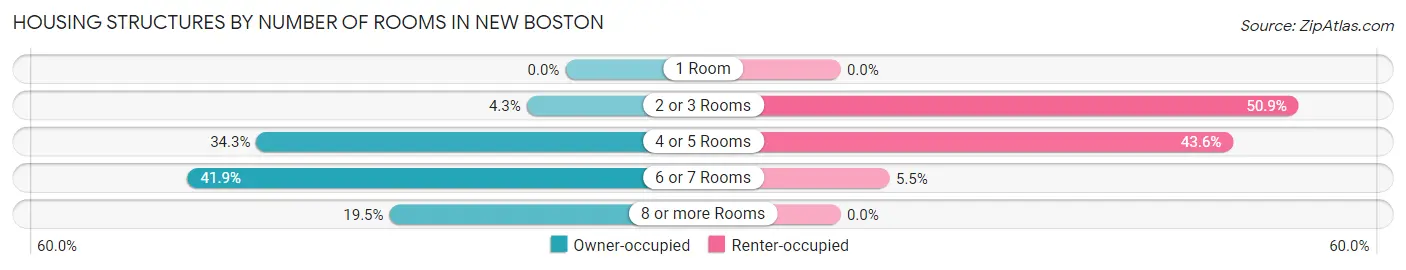
| Number of Rooms | Owner-occupied | Renter-occupied |
| 1 Room | 0 (0.0%) | 0 (0.0%) |
| 2 or 3 Rooms | 9 (4.3%) | 28 (50.9%) |
| 4 or 5 Rooms | 72 (34.3%) | 24 (43.6%) |
| 6 or 7 Rooms | 88 (41.9%) | 3 (5.4%) |
| 8 or more Rooms | 41 (19.5%) | 0 (0.0%) |
| Total | 210 (100.0%) | 55 (100.0%) |
Housing Structure by Heating Type in New Boston
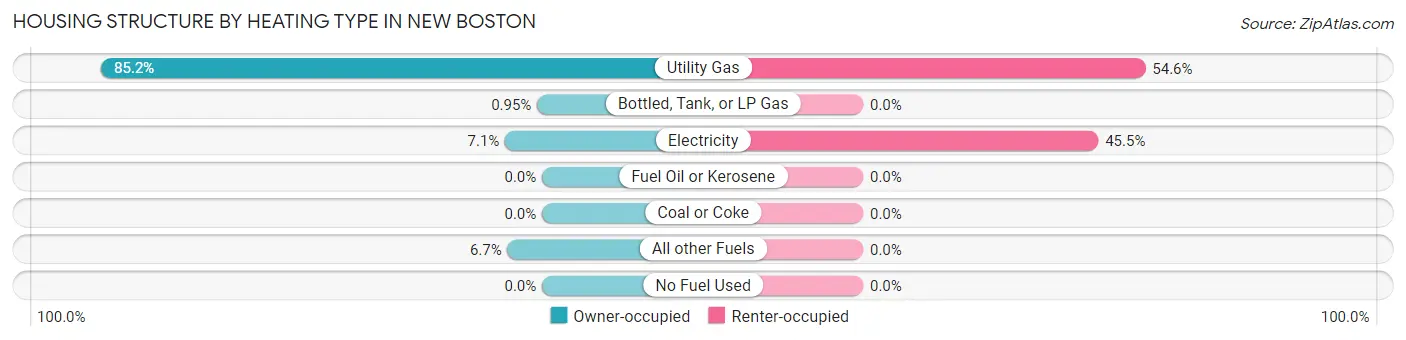
| Heating Type | Owner-occupied | Renter-occupied |
| Utility Gas | 179 (85.2%) | 30 (54.5%) |
| Bottled, Tank, or LP Gas | 2 (0.9%) | 0 (0.0%) |
| Electricity | 15 (7.1%) | 25 (45.5%) |
| Fuel Oil or Kerosene | 0 (0.0%) | 0 (0.0%) |
| Coal or Coke | 0 (0.0%) | 0 (0.0%) |
| All other Fuels | 14 (6.7%) | 0 (0.0%) |
| No Fuel Used | 0 (0.0%) | 0 (0.0%) |
| Total | 210 (100.0%) | 55 (100.0%) |
Household Vehicle Usage in New Boston
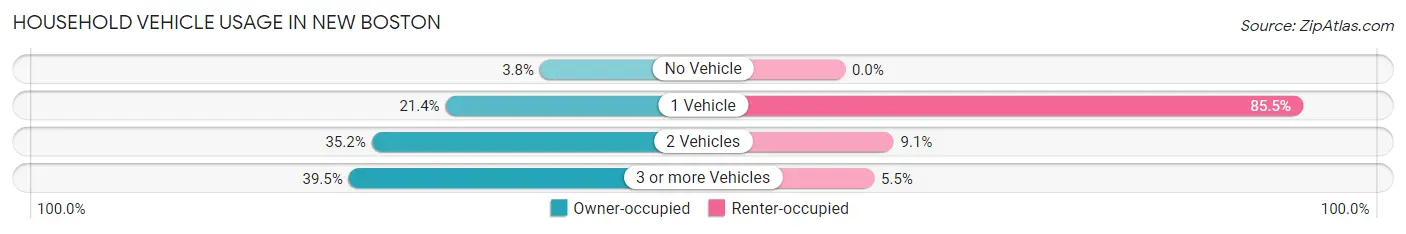
| Vehicles per Household | Owner-occupied | Renter-occupied |
| No Vehicle | 8 (3.8%) | 0 (0.0%) |
| 1 Vehicle | 45 (21.4%) | 47 (85.5%) |
| 2 Vehicles | 74 (35.2%) | 5 (9.1%) |
| 3 or more Vehicles | 83 (39.5%) | 3 (5.4%) |
| Total | 210 (100.0%) | 55 (100.0%) |
Real Estate & Mortgages in New Boston
Real Estate and Mortgage Overview in New Boston
| Characteristic | Without Mortgage | With Mortgage |
| Housing Units | 92 | 118 |
| Median Property Value | $56,500 | $106,700 |
| Median Household Income | $42,917 | $19 |
| Monthly Housing Costs | $365 | $0 |
| Real Estate Taxes | $800 | $10 |
Property Value by Mortgage Status in New Boston
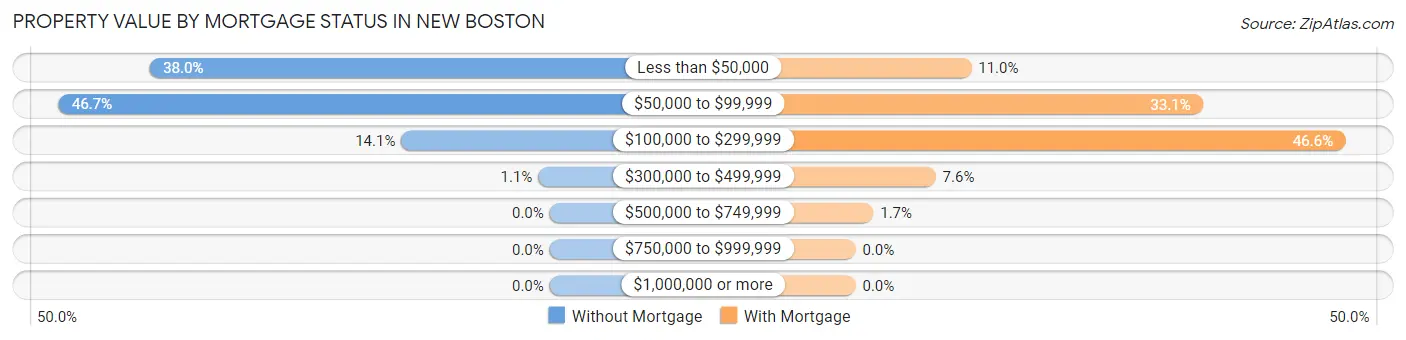
| Property Value | Without Mortgage | With Mortgage |
| Less than $50,000 | 35 (38.0%) | 13 (11.0%) |
| $50,000 to $99,999 | 43 (46.7%) | 39 (33.1%) |
| $100,000 to $299,999 | 13 (14.1%) | 55 (46.6%) |
| $300,000 to $499,999 | 1 (1.1%) | 9 (7.6%) |
| $500,000 to $749,999 | 0 (0.0%) | 2 (1.7%) |
| $750,000 to $999,999 | 0 (0.0%) | 0 (0.0%) |
| $1,000,000 or more | 0 (0.0%) | 0 (0.0%) |
| Total | 92 (100.0%) | 118 (100.0%) |
Household Income by Mortgage Status in New Boston
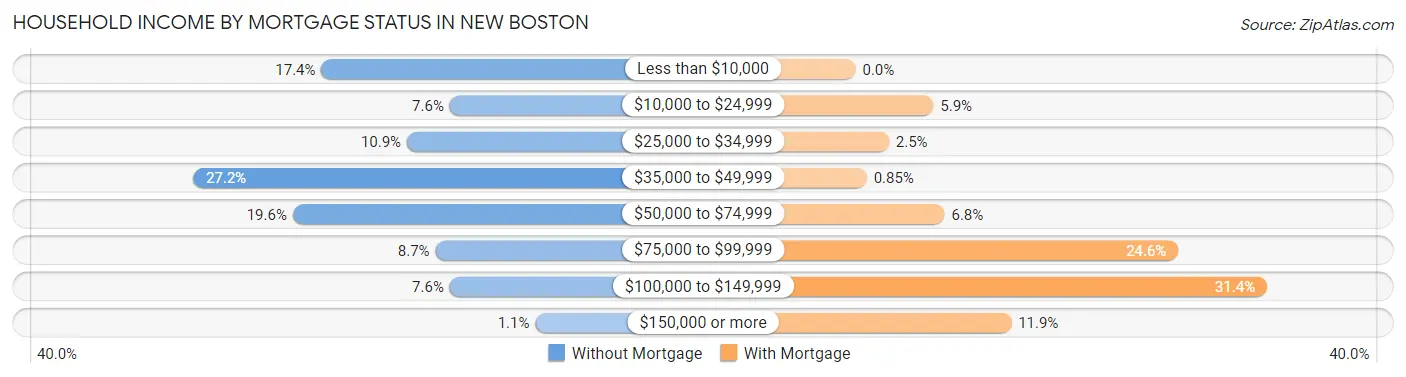
| Household Income | Without Mortgage | With Mortgage |
| Less than $10,000 | 16 (17.4%) | 0 (0.0%) |
| $10,000 to $24,999 | 7 (7.6%) | 7 (5.9%) |
| $25,000 to $34,999 | 10 (10.9%) | 3 (2.5%) |
| $35,000 to $49,999 | 25 (27.2%) | 1 (0.9%) |
| $50,000 to $74,999 | 18 (19.6%) | 8 (6.8%) |
| $75,000 to $99,999 | 8 (8.7%) | 29 (24.6%) |
| $100,000 to $149,999 | 7 (7.6%) | 37 (31.4%) |
| $150,000 or more | 1 (1.1%) | 14 (11.9%) |
| Total | 92 (100.0%) | 118 (100.0%) |
Property Value to Household Income Ratio in New Boston
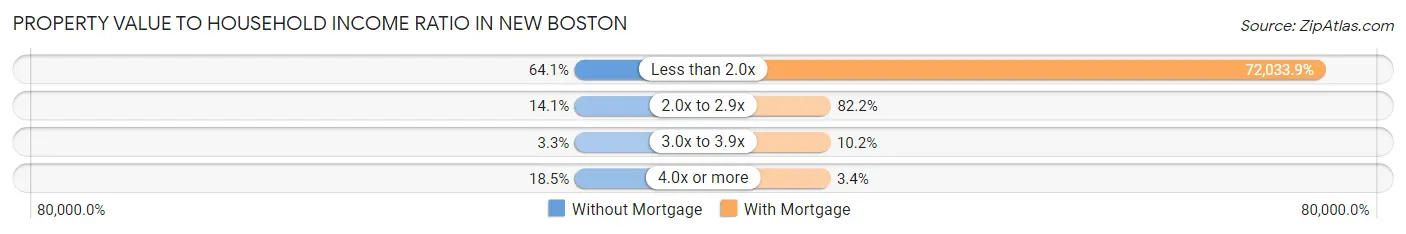
| Value-to-Income Ratio | Without Mortgage | With Mortgage |
| Less than 2.0x | 59 (64.1%) | 85,000 (72,033.9%) |
| 2.0x to 2.9x | 13 (14.1%) | 97 (82.2%) |
| 3.0x to 3.9x | 3 (3.3%) | 12 (10.2%) |
| 4.0x or more | 17 (18.5%) | 4 (3.4%) |
| Total | 92 (100.0%) | 118 (100.0%) |
Real Estate Taxes by Mortgage Status in New Boston
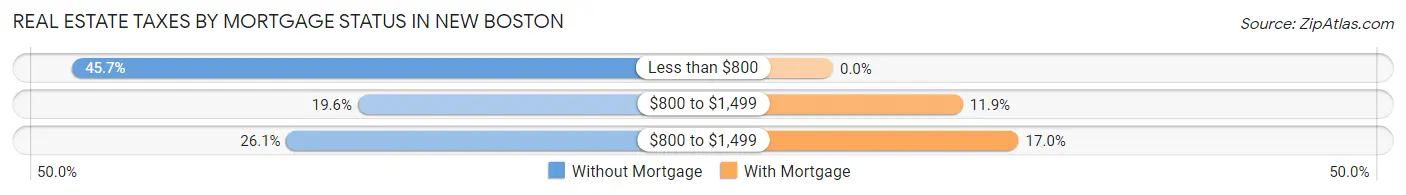
| Property Taxes | Without Mortgage | With Mortgage |
| Less than $800 | 42 (45.7%) | 0 (0.0%) |
| $800 to $1,499 | 18 (19.6%) | 14 (11.9%) |
| $800 to $1,499 | 24 (26.1%) | 20 (17.0%) |
| Total | 92 (100.0%) | 118 (100.0%) |
Health & Disability in New Boston
Health Insurance Coverage by Age in New Boston
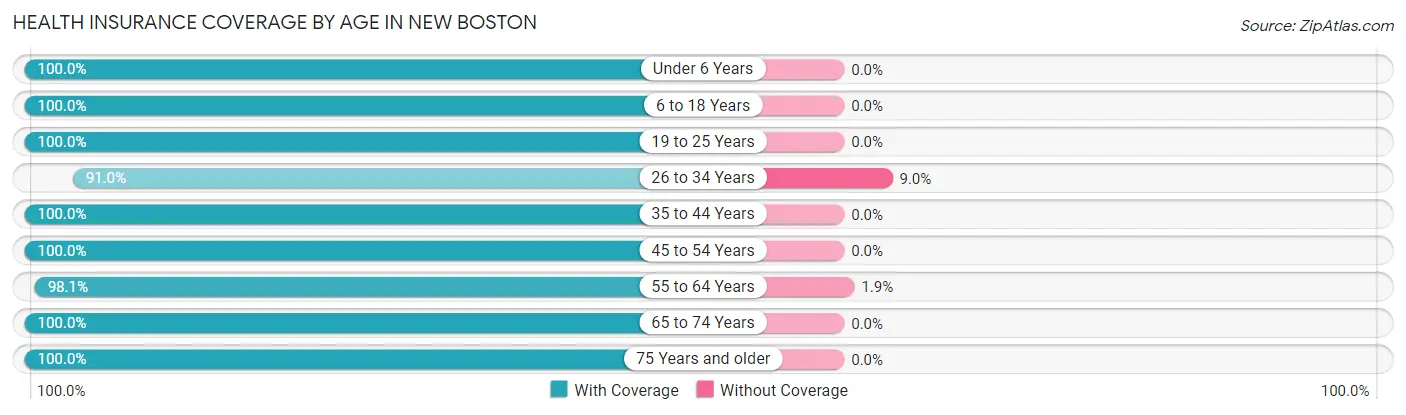
| Age Bracket | With Coverage | Without Coverage |
| Under 6 Years | 27 (100.0%) | 0 (0.0%) |
| 6 to 18 Years | 101 (100.0%) | 0 (0.0%) |
| 19 to 25 Years | 44 (100.0%) | 0 (0.0%) |
| 26 to 34 Years | 81 (91.0%) | 8 (9.0%) |
| 35 to 44 Years | 66 (100.0%) | 0 (0.0%) |
| 45 to 54 Years | 71 (100.0%) | 0 (0.0%) |
| 55 to 64 Years | 103 (98.1%) | 2 (1.9%) |
| 65 to 74 Years | 39 (100.0%) | 0 (0.0%) |
| 75 Years and older | 37 (100.0%) | 0 (0.0%) |
| Total | 569 (98.3%) | 10 (1.7%) |
Health Insurance Coverage by Citizenship Status in New Boston
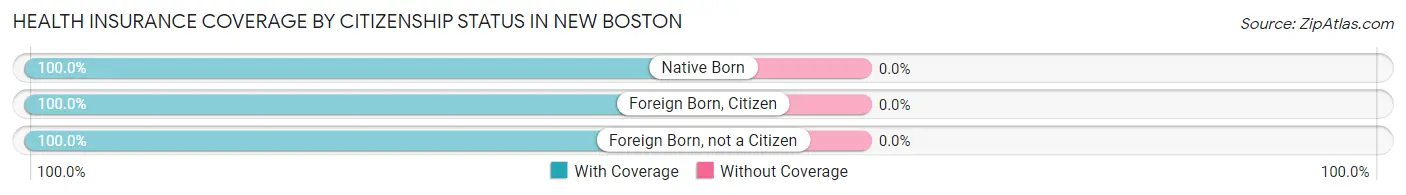
| Citizenship Status | With Coverage | Without Coverage |
| Native Born | 27 (100.0%) | 0 (0.0%) |
| Foreign Born, Citizen | 101 (100.0%) | 0 (0.0%) |
| Foreign Born, not a Citizen | 44 (100.0%) | 0 (0.0%) |
Health Insurance Coverage by Household Income in New Boston
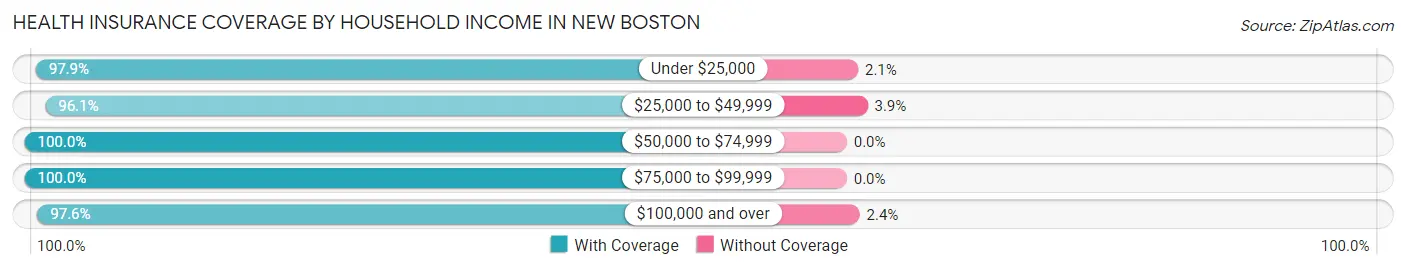
| Household Income | With Coverage | Without Coverage |
| Under $25,000 | 93 (97.9%) | 2 (2.1%) |
| $25,000 to $49,999 | 124 (96.1%) | 5 (3.9%) |
| $50,000 to $74,999 | 88 (100.0%) | 0 (0.0%) |
| $75,000 to $99,999 | 142 (100.0%) | 0 (0.0%) |
| $100,000 and over | 122 (97.6%) | 3 (2.4%) |
Public vs Private Health Insurance Coverage by Age in New Boston
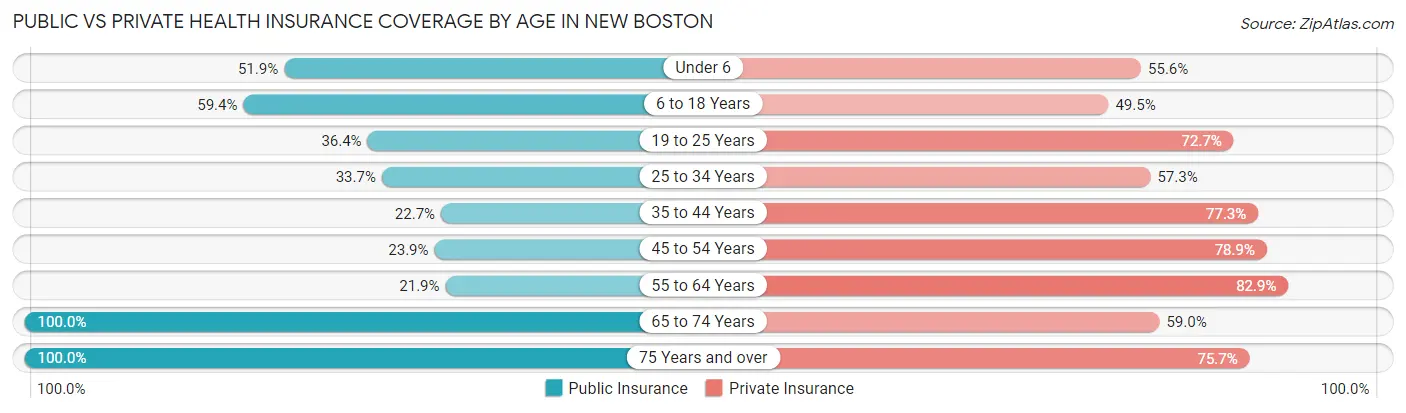
| Age Bracket | Public Insurance | Private Insurance |
| Under 6 | 14 (51.8%) | 15 (55.6%) |
| 6 to 18 Years | 60 (59.4%) | 50 (49.5%) |
| 19 to 25 Years | 16 (36.4%) | 32 (72.7%) |
| 25 to 34 Years | 30 (33.7%) | 51 (57.3%) |
| 35 to 44 Years | 15 (22.7%) | 51 (77.3%) |
| 45 to 54 Years | 17 (23.9%) | 56 (78.9%) |
| 55 to 64 Years | 23 (21.9%) | 87 (82.9%) |
| 65 to 74 Years | 39 (100.0%) | 23 (59.0%) |
| 75 Years and over | 37 (100.0%) | 28 (75.7%) |
| Total | 251 (43.3%) | 393 (67.9%) |
Disability Status by Sex by Age in New Boston
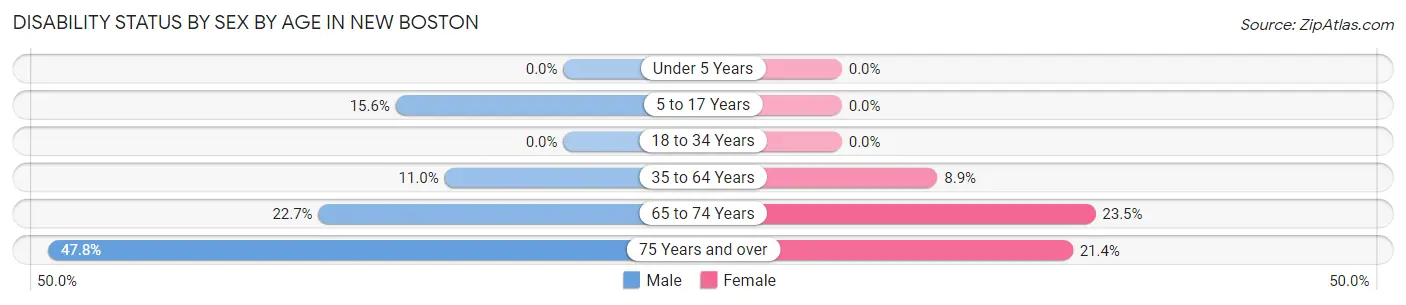
| Age Bracket | Male | Female |
| Under 5 Years | 0 (0.0%) | 0 (0.0%) |
| 5 to 17 Years | 7 (15.6%) | 0 (0.0%) |
| 18 to 34 Years | 0 (0.0%) | 0 (0.0%) |
| 35 to 64 Years | 13 (11.0%) | 11 (8.9%) |
| 65 to 74 Years | 5 (22.7%) | 4 (23.5%) |
| 75 Years and over | 11 (47.8%) | 3 (21.4%) |
Disability Class by Sex by Age in New Boston
Disability Class: Hearing Difficulty
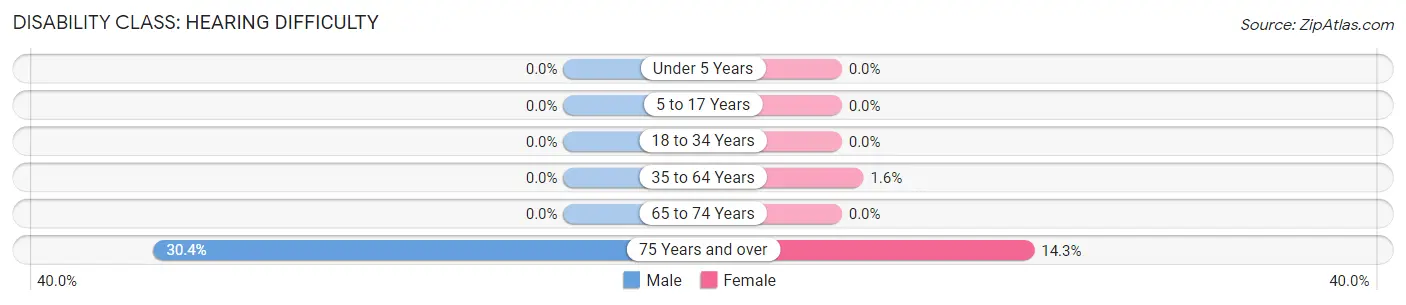
| Age Bracket | Male | Female |
| Under 5 Years | 0 (0.0%) | 0 (0.0%) |
| 5 to 17 Years | 0 (0.0%) | 0 (0.0%) |
| 18 to 34 Years | 0 (0.0%) | 0 (0.0%) |
| 35 to 64 Years | 0 (0.0%) | 2 (1.6%) |
| 65 to 74 Years | 0 (0.0%) | 0 (0.0%) |
| 75 Years and over | 7 (30.4%) | 2 (14.3%) |
Disability Class: Vision Difficulty
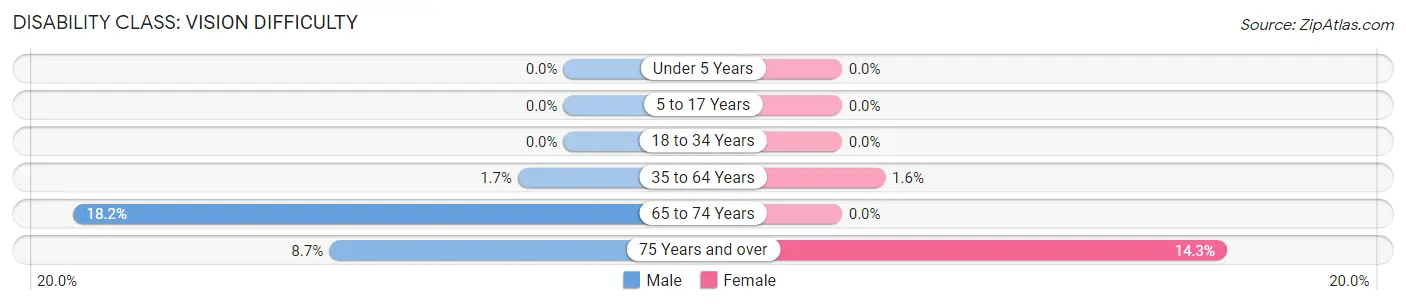
| Age Bracket | Male | Female |
| Under 5 Years | 0 (0.0%) | 0 (0.0%) |
| 5 to 17 Years | 0 (0.0%) | 0 (0.0%) |
| 18 to 34 Years | 0 (0.0%) | 0 (0.0%) |
| 35 to 64 Years | 2 (1.7%) | 2 (1.6%) |
| 65 to 74 Years | 4 (18.2%) | 0 (0.0%) |
| 75 Years and over | 2 (8.7%) | 2 (14.3%) |
Disability Class: Cognitive Difficulty
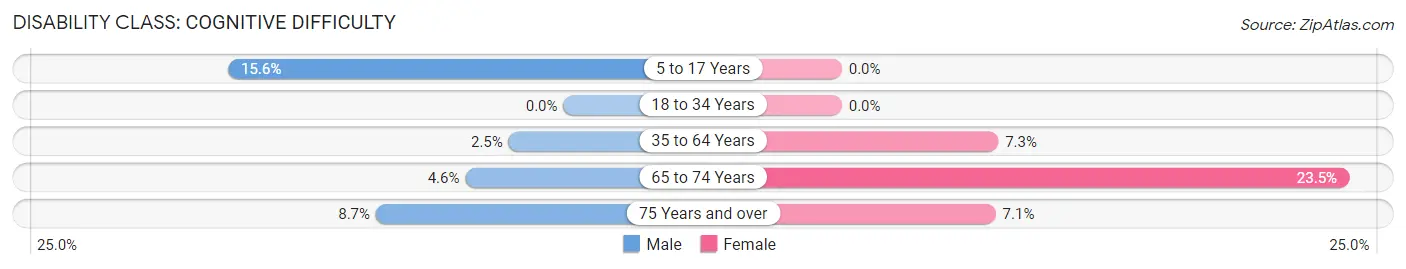
| Age Bracket | Male | Female |
| 5 to 17 Years | 7 (15.6%) | 0 (0.0%) |
| 18 to 34 Years | 0 (0.0%) | 0 (0.0%) |
| 35 to 64 Years | 3 (2.5%) | 9 (7.3%) |
| 65 to 74 Years | 1 (4.5%) | 4 (23.5%) |
| 75 Years and over | 2 (8.7%) | 1 (7.1%) |
Disability Class: Ambulatory Difficulty
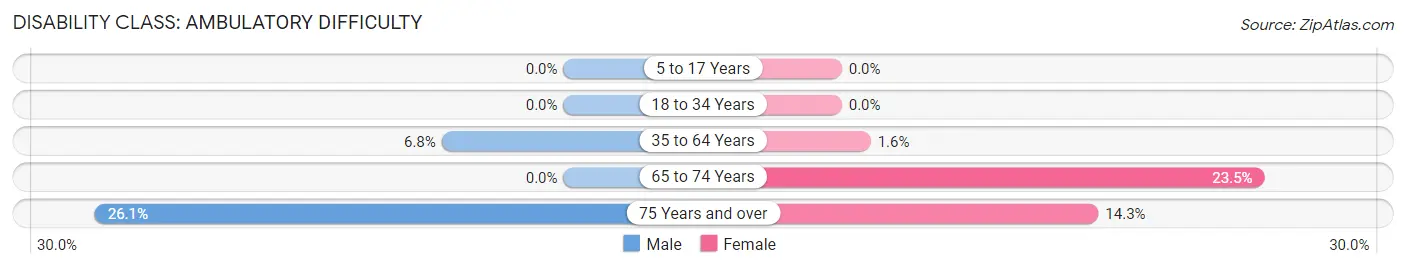
| Age Bracket | Male | Female |
| 5 to 17 Years | 0 (0.0%) | 0 (0.0%) |
| 18 to 34 Years | 0 (0.0%) | 0 (0.0%) |
| 35 to 64 Years | 8 (6.8%) | 2 (1.6%) |
| 65 to 74 Years | 0 (0.0%) | 4 (23.5%) |
| 75 Years and over | 6 (26.1%) | 2 (14.3%) |
Disability Class: Self-Care Difficulty
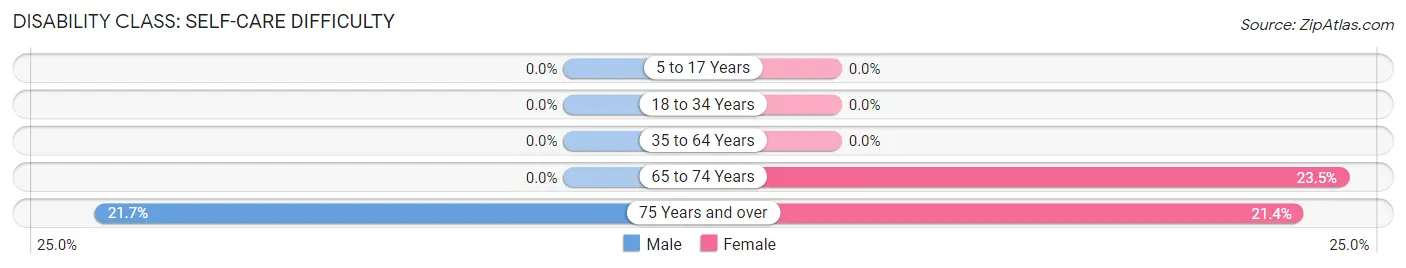
| Age Bracket | Male | Female |
| 5 to 17 Years | 0 (0.0%) | 0 (0.0%) |
| 18 to 34 Years | 0 (0.0%) | 0 (0.0%) |
| 35 to 64 Years | 0 (0.0%) | 0 (0.0%) |
| 65 to 74 Years | 0 (0.0%) | 4 (23.5%) |
| 75 Years and over | 5 (21.7%) | 3 (21.4%) |
Technology Access in New Boston
Computing Device Access in New Boston
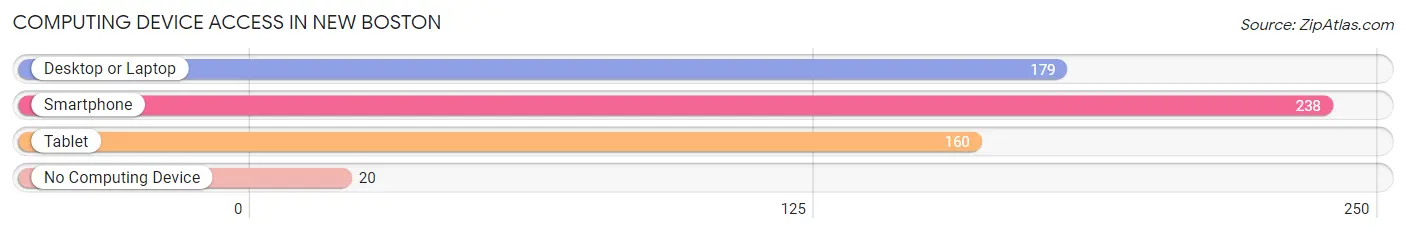
| Device Type | # Households | % Households |
| Desktop or Laptop | 179 | 67.5% |
| Smartphone | 238 | 89.8% |
| Tablet | 160 | 60.4% |
| No Computing Device | 20 | 7.5% |
| Total | 265 | 100.0% |
Internet Access in New Boston
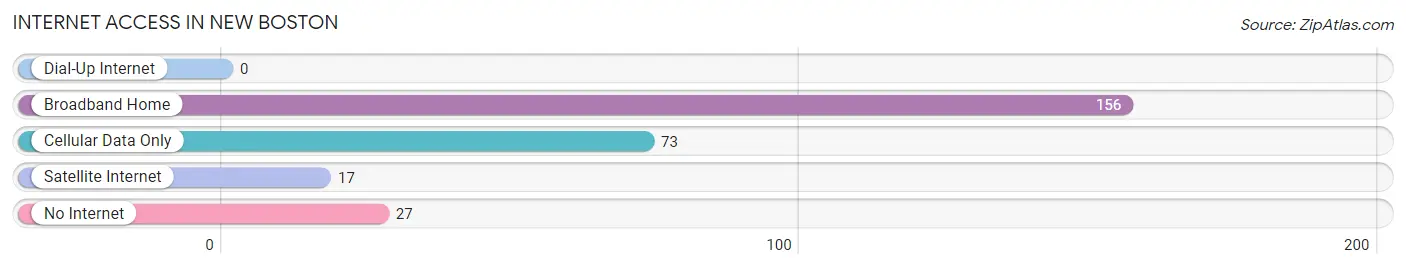
| Internet Type | # Households | % Households |
| Dial-Up Internet | 0 | 0.0% |
| Broadband Home | 156 | 58.9% |
| Cellular Data Only | 73 | 27.6% |
| Satellite Internet | 17 | 6.4% |
| No Internet | 27 | 10.2% |
| Total | 265 | 100.0% |
New Boston Summary
New Boston, Illinois is a small village located in Mercer County, Illinois. It is situated on the banks of the Mississippi River, approximately 25 miles south of the Quad Cities. The village has a population of approximately 1,000 people and is part of the Quad Cities Metropolitan Statistical Area.
History
New Boston was founded in 1836 by a group of settlers from New England. The village was named after the city of Boston, Massachusetts, and was originally intended to be a utopian community. The settlers built a grist mill, saw mill, and a blacksmith shop, and the village quickly grew. By the mid-1800s, New Boston had become a thriving agricultural community, with a population of over 1,000 people.
In the late 1800s, the village began to decline as the railroad bypassed it and the population began to move away. By the early 1900s, the population had dropped to just over 500 people. In the 1950s, the village was revitalized with the construction of a new bridge over the Mississippi River. This allowed for increased trade and commerce, and the population began to grow again.
Geography
New Boston is located in Mercer County, Illinois, on the banks of the Mississippi River. The village is situated on the western edge of the Quad Cities Metropolitan Statistical Area, approximately 25 miles south of the Quad Cities. The village is bordered by the cities of Keithsburg and Viola to the north, and the towns of Joy and Seaton to the south. The village is located in a rural area, with the nearest major city being Moline, Illinois, approximately 25 miles to the north.
The village is situated on a flat plain, with the Mississippi River to the east and the Rock River to the west. The climate in New Boston is humid continental, with hot summers and cold winters. The average annual temperature is around 50 degrees Fahrenheit, and the average annual precipitation is around 40 inches.
Economy
The economy of New Boston is largely based on agriculture. The village is home to several farms, which produce a variety of crops, including corn, soybeans, and wheat. The village also has a small manufacturing sector, which produces a variety of products, including furniture, clothing, and automotive parts.
The village also has a small tourism industry, with several bed and breakfasts, restaurants, and antique shops. The village is also home to a small airport, which serves the Quad Cities area.
Demographics
As of the 2010 census, the population of New Boston was 1,000 people. The racial makeup of the village was 97.2% White, 0.7% African American, 0.3% Native American, 0.2% Asian, and 1.6% from other races. The median household income was $41,250, and the median family income was $50,000. The per capita income was $20,000.
Conclusion
New Boston, Illinois is a small village located in Mercer County, Illinois. It is situated on the banks of the Mississippi River, approximately 25 miles south of the Quad Cities. The village has a population of approximately 1,000 people and is part of the Quad Cities Metropolitan Statistical Area. The economy of New Boston is largely based on agriculture, with a small manufacturing and tourism sector. The racial makeup of the village is predominantly White, with a small percentage of African American, Native American, and Asian residents. The median household income is $41,250, and the median family income is $50,000.
Common Questions
What is the Total Population of New Boston?
Total Population of New Boston is 579.
What is the Total Male Population of New Boston?
Total Male Population of New Boston is 265.
What is the Total Female Population of New Boston?
Total Female Population of New Boston is 314.
What is the Ratio of Males per 100 Females in New Boston?
There are 84.39 Males per 100 Females in New Boston.
What is the Ratio of Females per 100 Males in New Boston?
There are 118.49 Females per 100 Males in New Boston.
What is the Median Population Age in New Boston?
Median Population Age in New Boston is 39.1 Years.
What is the Average Family Size in New Boston
Average Family Size in New Boston is 2.6 People.
What is the Average Household Size in New Boston
Average Household Size in New Boston is 2.2 People.
What is Per Capita Income in New Boston?
Per Capita income in New Boston is $29,034.
What is the Median Family Income in New Boston?
Median Family Income in New Boston is $68,125.
What is the Median Household income in New Boston?
Median Household Income in New Boston is $54,821.
What is Income or Wage Gap in New Boston?
Income or Wage Gap in New Boston is 57.1%.
Women in New Boston earn 42.9 cents for every dollar earned by a man.
What is Inequality or Gini Index in New Boston?
Inequality or Gini Index in New Boston is 0.41.
How Large is the Labor Force in New Boston?
There are 287 People in the Labor Forcein in New Boston.
What is the Percentage of People in the Labor Force in New Boston?
62.3% of People are in the Labor Force in New Boston.
What is the Unemployment Rate in New Boston?
Unemployment Rate in New Boston is 7.0%.