Limestone, IL
Limestone Map
Limestone Overview
1,479
TOTAL POPULATION
759
MALE POPULATION
720
FEMALE POPULATION
105.42
MALES / 100 FEMALES
94.86
FEMALES / 100 MALES
39.4
MEDIAN AGE
2.7
AVG FAMILY SIZE
2.5
AVG HOUSEHOLD SIZE
$49,629
PER CAPITA INCOME
$115,781
AVG FAMILY INCOME
$105,750
AVG HOUSEHOLD INCOME
47.7%
WAGE / INCOME GAP [ % ]
52.3¢/ $1
WAGE / INCOME GAP [ $ ]
0.44
INEQUALITY / GINI INDEX
816
LABOR FORCE [ PEOPLE ]
68.9%
PERCENT IN LABOR FORCE
5.8%
UNEMPLOYMENT RATE
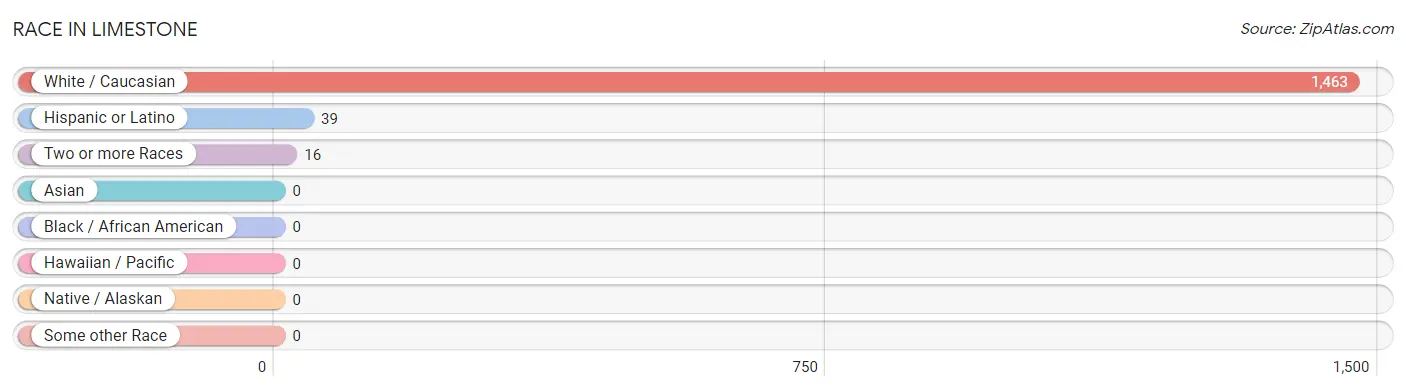
Race in Limestone
The most populous races in Limestone are White / Caucasian (1,463 | 98.9%), Hispanic or Latino (39 | 2.6%), and Two or more Races (16 | 1.1%).
| Race | # Population | % Population |
| Asian | 0 | 0.0% |
| Black / African American | 0 | 0.0% |
| Hawaiian / Pacific | 0 | 0.0% |
| Hispanic or Latino | 39 | 2.6% |
| Native / Alaskan | 0 | 0.0% |
| White / Caucasian | 1,463 | 98.9% |
| Two or more Races | 16 | 1.1% |
| Some other Race | 0 | 0.0% |
| Total | 1,479 | 100.0% |
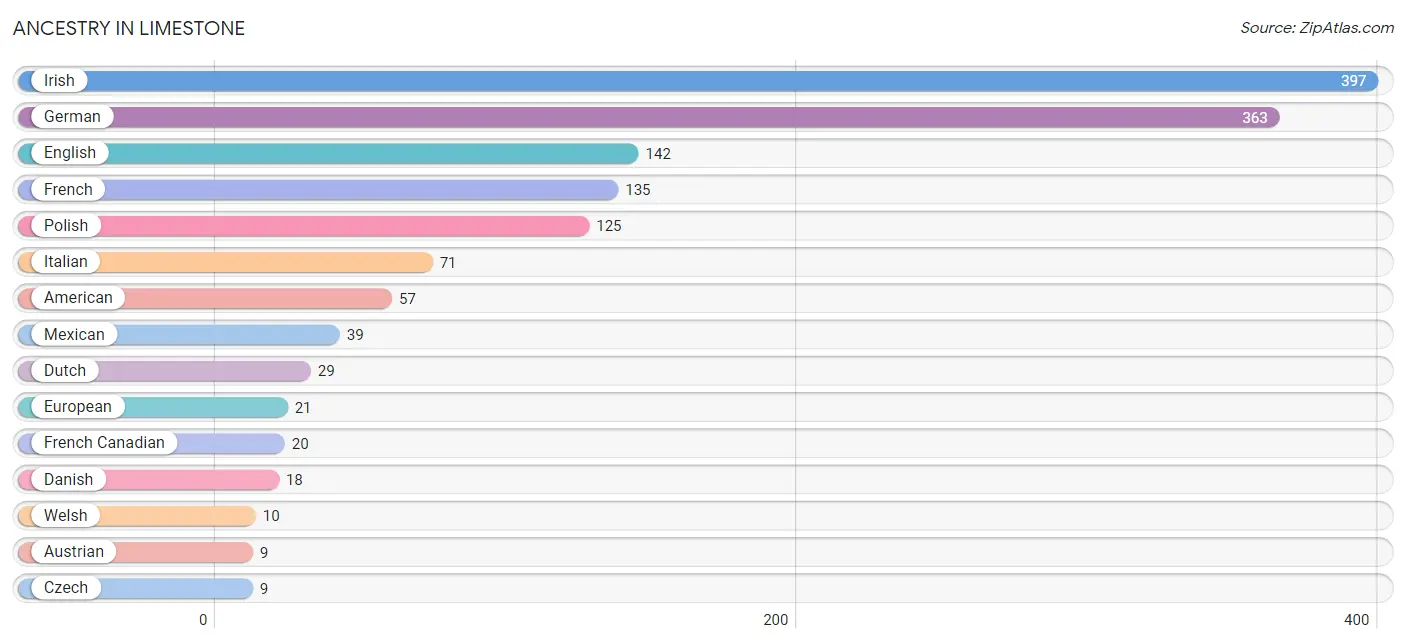
Ancestry in Limestone
The most populous ancestries reported in Limestone are Irish (397 | 26.8%), German (363 | 24.5%), English (142 | 9.6%), French (135 | 9.1%), and Polish (125 | 8.5%), together accounting for 78.6% of all Limestone residents.
| Ancestry | # Population | % Population |
| American | 57 | 3.8% |
| Austrian | 9 | 0.6% |
| Czech | 9 | 0.6% |
| Czechoslovakian | 3 | 0.2% |
| Danish | 18 | 1.2% |
| Dutch | 29 | 2.0% |
| English | 142 | 9.6% |
| European | 21 | 1.4% |
| French | 135 | 9.1% |
| French Canadian | 20 | 1.3% |
| German | 363 | 24.5% |
| Hungarian | 3 | 0.2% |
| Indian (Asian) | 5 | 0.3% |
| Irish | 397 | 26.8% |
| Italian | 71 | 4.8% |
| Lithuanian | 9 | 0.6% |
| Mexican | 39 | 2.6% |
| Northern European | 6 | 0.4% |
| Norwegian | 7 | 0.5% |
| Polish | 125 | 8.5% |
| Scandinavian | 3 | 0.2% |
| Scottish | 6 | 0.4% |
| Slovak | 7 | 0.5% |
| Slovene | 6 | 0.4% |
| Sri Lankan | 5 | 0.3% |
| Swedish | 5 | 0.3% |
| Swiss | 3 | 0.2% |
| Welsh | 10 | 0.7% | View All 28 Rows |
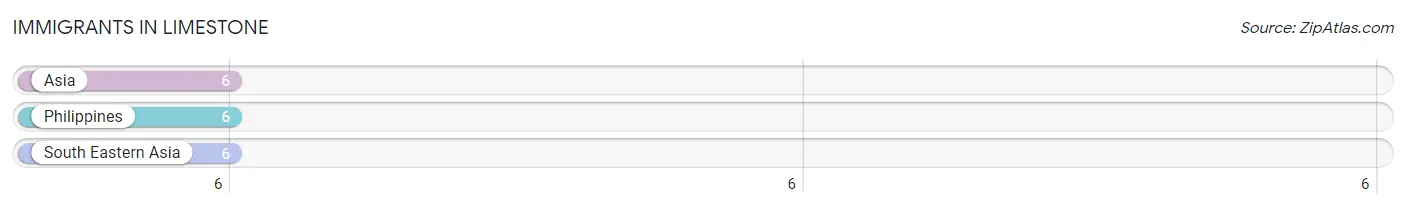
Immigrants in Limestone
The most numerous immigrant groups reported in Limestone came from Asia (6 | 0.4%), Philippines (6 | 0.4%), and South Eastern Asia (6 | 0.4%), together accounting for 1.2% of all Limestone residents.
| Immigration Origin | # Population | % Population |
| Asia | 6 | 0.4% |
| Philippines | 6 | 0.4% |
| South Eastern Asia | 6 | 0.4% | View All 3 Rows |
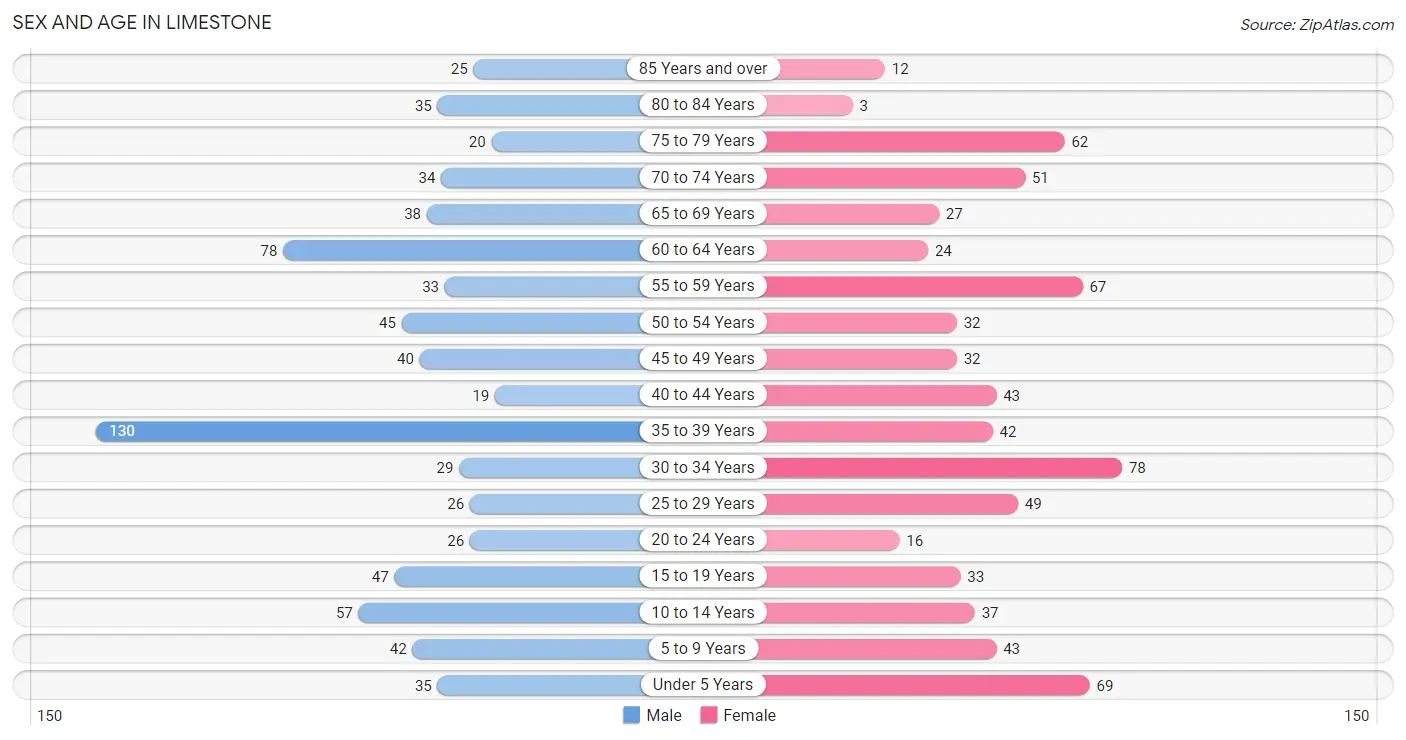
Sex and Age in Limestone
Sex and Age in Limestone
The most populous age groups in Limestone are 35 to 39 Years (130 | 17.1%) for men and 30 to 34 Years (78 | 10.8%) for women.
| Age Bracket | Male | Female |
| Under 5 Years | 35 (4.6%) | 69 (9.6%) |
| 5 to 9 Years | 42 (5.5%) | 43 (6.0%) |
| 10 to 14 Years | 57 (7.5%) | 37 (5.1%) |
| 15 to 19 Years | 47 (6.2%) | 33 (4.6%) |
| 20 to 24 Years | 26 (3.4%) | 16 (2.2%) |
| 25 to 29 Years | 26 (3.4%) | 49 (6.8%) |
| 30 to 34 Years | 29 (3.8%) | 78 (10.8%) |
| 35 to 39 Years | 130 (17.1%) | 42 (5.8%) |
| 40 to 44 Years | 19 (2.5%) | 43 (6.0%) |
| 45 to 49 Years | 40 (5.3%) | 32 (4.4%) |
| 50 to 54 Years | 45 (5.9%) | 32 (4.4%) |
| 55 to 59 Years | 33 (4.3%) | 67 (9.3%) |
| 60 to 64 Years | 78 (10.3%) | 24 (3.3%) |
| 65 to 69 Years | 38 (5.0%) | 27 (3.7%) |
| 70 to 74 Years | 34 (4.5%) | 51 (7.1%) |
| 75 to 79 Years | 20 (2.6%) | 62 (8.6%) |
| 80 to 84 Years | 35 (4.6%) | 3 (0.4%) |
| 85 Years and over | 25 (3.3%) | 12 (1.7%) |
| Total | 759 (100.0%) | 720 (100.0%) |
Families and Households in Limestone
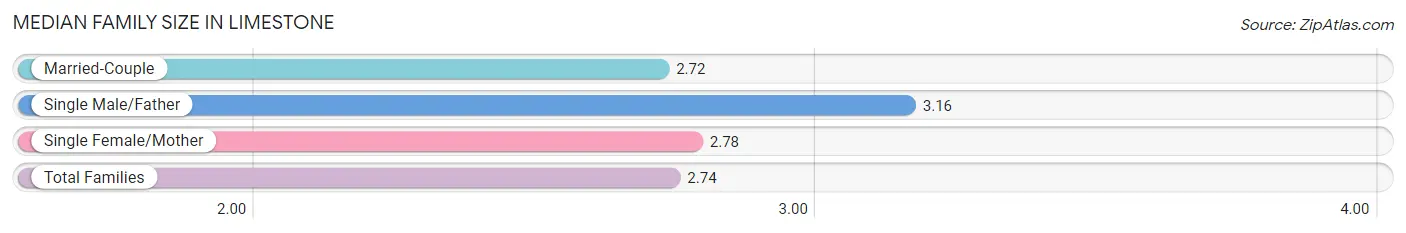
Median Family Size in Limestone
The median family size in Limestone is 2.74 persons per family, with single male/father families (19 | 3.9%) accounting for the largest median family size of 3.16 persons per family. On the other hand, married-couple families (429 | 88.4%) represent the smallest median family size with 2.72 persons per family.
| Family Type | # Families | Family Size |
| Married-Couple | 429 (88.4%) | 2.72 |
| Single Male/Father | 19 (3.9%) | 3.16 |
| Single Female/Mother | 37 (7.6%) | 2.78 |
| Total Families | 485 (100.0%) | 2.74 |
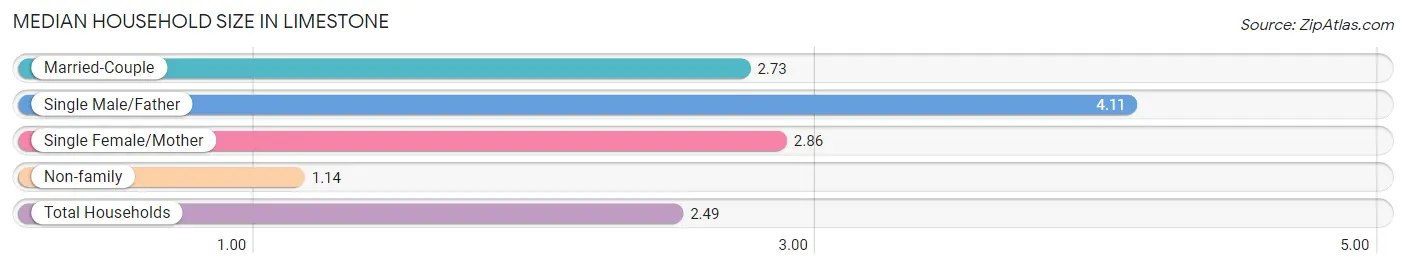
Median Household Size in Limestone
The median household size in Limestone is 2.49 persons per household, with single male/father households (19 | 3.2%) accounting for the largest median household size of 4.11 persons per household. non-family households (108 | 18.2%) represent the smallest median household size with 1.14 persons per household.
| Household Type | # Households | Household Size |
| Married-Couple | 429 (72.3%) | 2.73 |
| Single Male/Father | 19 (3.2%) | 4.11 |
| Single Female/Mother | 37 (6.2%) | 2.86 |
| Non-family | 108 (18.2%) | 1.14 |
| Total Households | 593 (100.0%) | 2.49 |
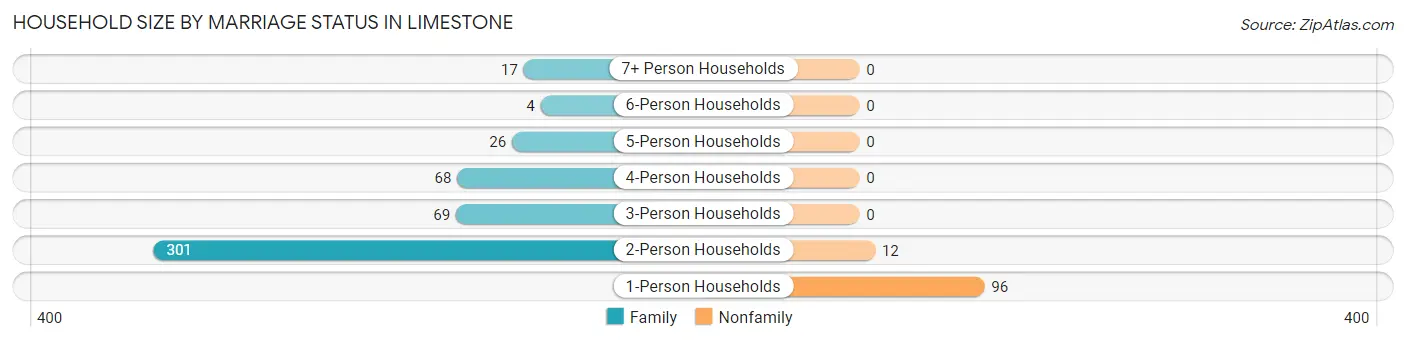
Household Size by Marriage Status in Limestone
Out of a total of 593 households in Limestone, 485 (81.8%) are family households, while 108 (18.2%) are nonfamily households. The most numerous type of family households are 2-person households, comprising 301, and the most common type of nonfamily households are 1-person households, comprising 96.
| Household Size | Family Households | Nonfamily Households |
| 1-Person Households | - | 96 (16.2%) |
| 2-Person Households | 301 (50.8%) | 12 (2.0%) |
| 3-Person Households | 69 (11.6%) | 0 (0.0%) |
| 4-Person Households | 68 (11.5%) | 0 (0.0%) |
| 5-Person Households | 26 (4.4%) | 0 (0.0%) |
| 6-Person Households | 4 (0.7%) | 0 (0.0%) |
| 7+ Person Households | 17 (2.9%) | 0 (0.0%) |
| Total | 485 (81.8%) | 108 (18.2%) |
Female Fertility in Limestone
Fertility by Age in Limestone
Average fertility rate in Limestone is 127.0 births per 1,000 women. Women in the age bracket of 20 to 34 years have the highest fertility rate with 182.0 births per 1,000 women. Women in the age bracket of 20 to 34 years acount for 66.7% of all women with births.
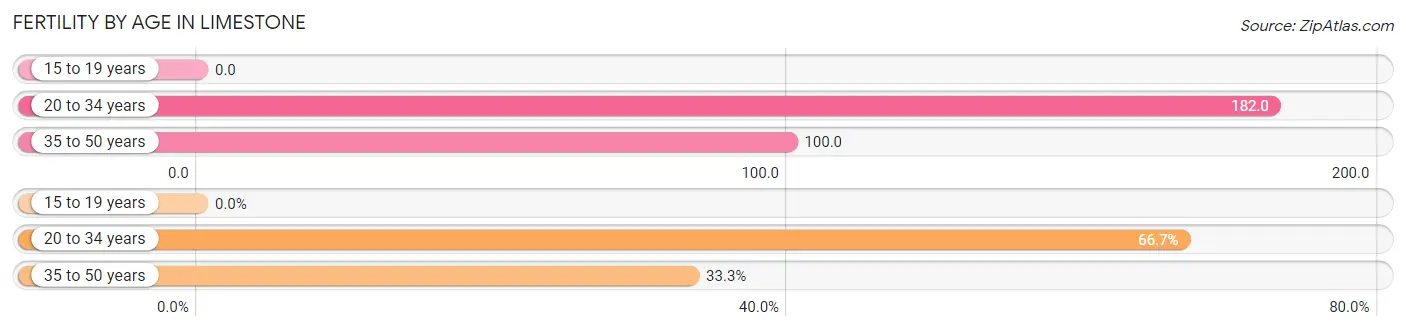
| Age Bracket | Women with Births | Births / 1,000 Women |
| 15 to 19 years | 0 (0.0%) | 0.0 |
| 20 to 34 years | 26 (66.7%) | 182.0 |
| 35 to 50 years | 13 (33.3%) | 100.0 |
| Total | 39 (100.0%) | 127.0 |
Fertility by Age by Marriage Status in Limestone
59.0% of women with births (39) in Limestone are married. The highest percentage of unmarried women with births falls into 20 to 34 years age bracket with 61.5% of them unmarried at the time of birth, while the lowest percentage of unmarried women with births belong to 35 to 50 years age bracket with 0.0% of them unmarried.
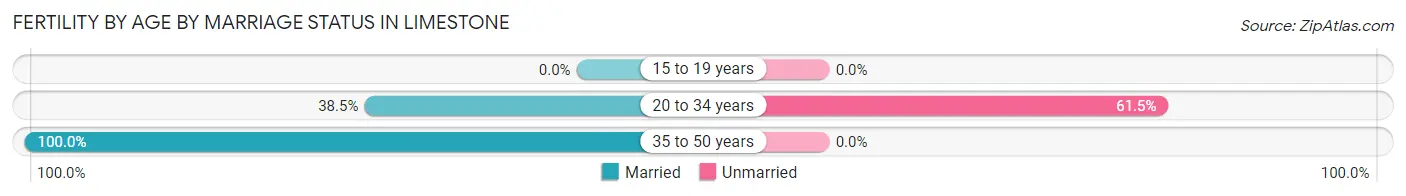
| Age Bracket | Married | Unmarried |
| 15 to 19 years | 0 (0.0%) | 0 (0.0%) |
| 20 to 34 years | 10 (38.5%) | 16 (61.5%) |
| 35 to 50 years | 13 (100.0%) | 0 (0.0%) |
| Total | 23 (59.0%) | 16 (41.0%) |
Fertility by Education in Limestone
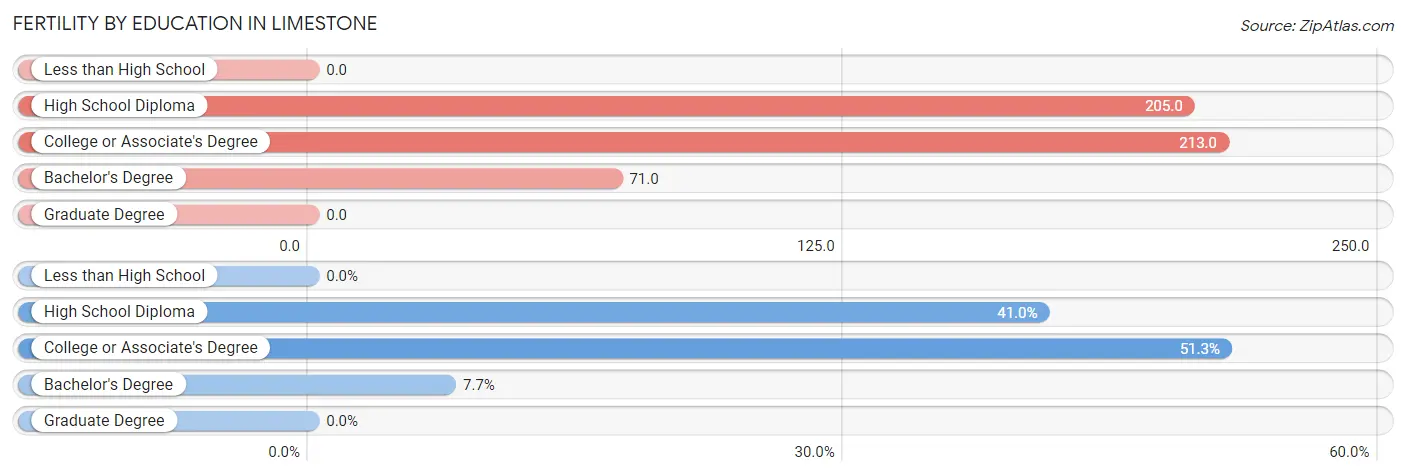
| Educational Attainment | Women with Births | Births / 1,000 Women |
| Less than High School | 0 (0.0%) | 0.0 |
| High School Diploma | 16 (41.0%) | 205.0 |
| College or Associate's Degree | 20 (51.3%) | 213.0 |
| Bachelor's Degree | 3 (7.7%) | 71.0 |
| Graduate Degree | 0 (0.0%) | 0.0 |
| Total | 39 (100.0%) | 127.0 |
Fertility by Education by Marriage Status in Limestone
41.0% of women with births in Limestone are unmarried. Women with the educational attainment of high school diploma are most likely to be married with 100.0% of them married at childbirth, while women with the educational attainment of college or associate's degree are least likely to be married with 80.0% of them unmarried at childbirth.
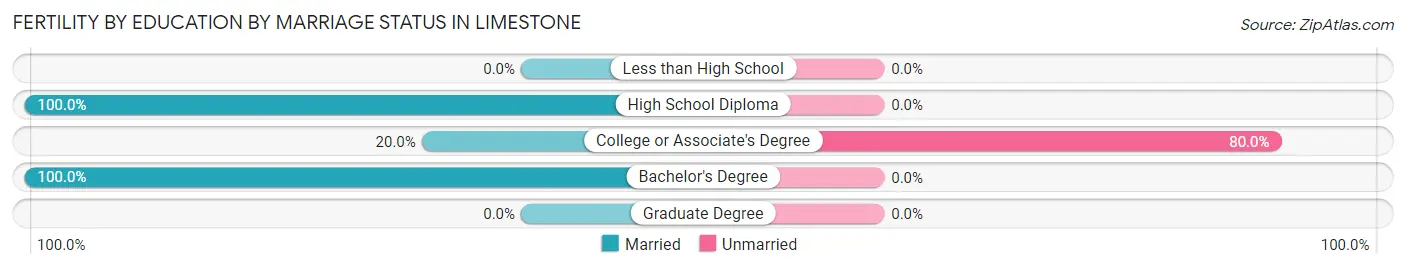
| Educational Attainment | Married | Unmarried |
| Less than High School | 0 (0.0%) | 0 (0.0%) |
| High School Diploma | 16 (100.0%) | 0 (0.0%) |
| College or Associate's Degree | 4 (20.0%) | 16 (80.0%) |
| Bachelor's Degree | 3 (100.0%) | 0 (0.0%) |
| Graduate Degree | 0 (0.0%) | 0 (0.0%) |
| Total | 23 (59.0%) | 16 (41.0%) |
Income in Limestone
Income Overview in Limestone
Per Capita Income in Limestone is $49,629, while median incomes of families and households are $115,781 and $105,750 respectively.
| Characteristic | Number | Measure |
| Per Capita Income | 1,479 | $49,629 |
| Median Family Income | 485 | $115,781 |
| Mean Family Income | 485 | $168,072 |
| Median Household Income | 593 | $105,750 |
| Mean Household Income | 593 | $147,133 |
| Income Deficit | 485 | $0 |
| Wage / Income Gap (%) | 1,479 | 47.72% |
| Wage / Income Gap ($) | 1,479 | 52.28¢ per $1 |
| Gini / Inequality Index | 1,479 | 0.44 |
Earnings by Sex in Limestone
Average Earnings in Limestone are $55,526, $71,500 for men and $37,381 for women, a difference of 47.7%.
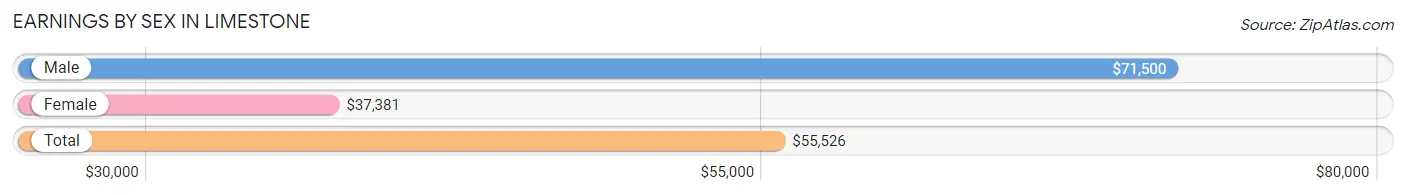
| Sex | Number | Average Earnings |
| Male | 442 (53.2%) | $71,500 |
| Female | 388 (46.8%) | $37,381 |
| Total | 830 (100.0%) | $55,526 |
Earnings by Sex by Income Bracket in Limestone
The most common earnings brackets in Limestone are $100,000+ for men (167 | 37.8%) and $100,000+ for women (62 | 16.0%).
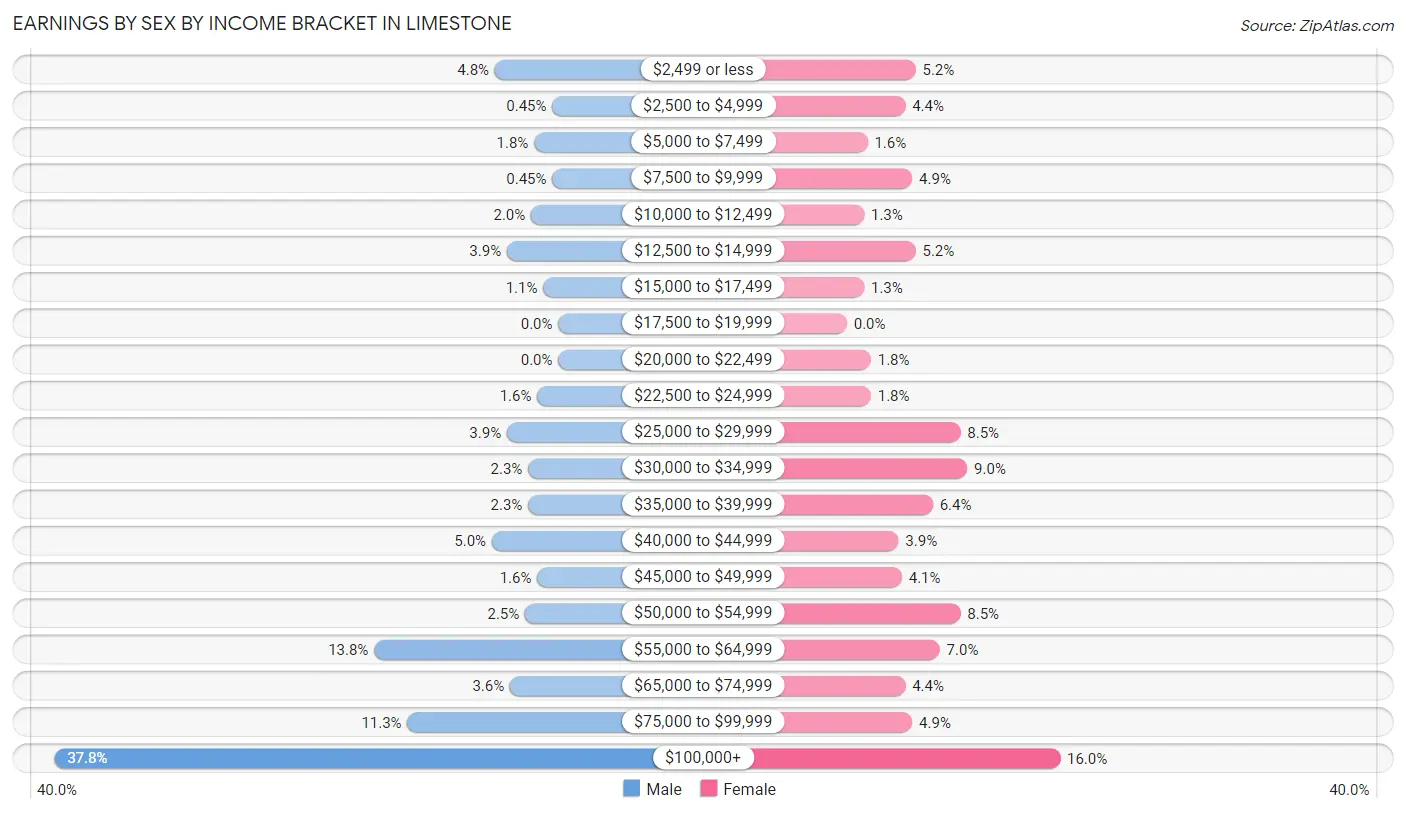
| Income | Male | Female |
| $2,499 or less | 21 (4.8%) | 20 (5.1%) |
| $2,500 to $4,999 | 2 (0.4%) | 17 (4.4%) |
| $5,000 to $7,499 | 8 (1.8%) | 6 (1.5%) |
| $7,500 to $9,999 | 2 (0.4%) | 19 (4.9%) |
| $10,000 to $12,499 | 9 (2.0%) | 5 (1.3%) |
| $12,500 to $14,999 | 17 (3.8%) | 20 (5.1%) |
| $15,000 to $17,499 | 5 (1.1%) | 5 (1.3%) |
| $17,500 to $19,999 | 0 (0.0%) | 0 (0.0%) |
| $20,000 to $22,499 | 0 (0.0%) | 7 (1.8%) |
| $22,500 to $24,999 | 7 (1.6%) | 7 (1.8%) |
| $25,000 to $29,999 | 17 (3.8%) | 33 (8.5%) |
| $30,000 to $34,999 | 10 (2.3%) | 35 (9.0%) |
| $35,000 to $39,999 | 10 (2.3%) | 25 (6.4%) |
| $40,000 to $44,999 | 22 (5.0%) | 15 (3.9%) |
| $45,000 to $49,999 | 7 (1.6%) | 16 (4.1%) |
| $50,000 to $54,999 | 11 (2.5%) | 33 (8.5%) |
| $55,000 to $64,999 | 61 (13.8%) | 27 (7.0%) |
| $65,000 to $74,999 | 16 (3.6%) | 17 (4.4%) |
| $75,000 to $99,999 | 50 (11.3%) | 19 (4.9%) |
| $100,000+ | 167 (37.8%) | 62 (16.0%) |
| Total | 442 (100.0%) | 388 (100.0%) |
Earnings by Sex by Educational Attainment in Limestone
Average earnings in Limestone are $78,750 for men and $44,750 for women, a difference of 43.2%. Men with an educational attainment of college or associate's degree enjoy the highest average annual earnings of $102,672, while those with high school diploma education earn the least with $52,500. Women with an educational attainment of graduate degree earn the most with the average annual earnings of $250,001, while those with high school diploma education have the smallest earnings of $29,853.
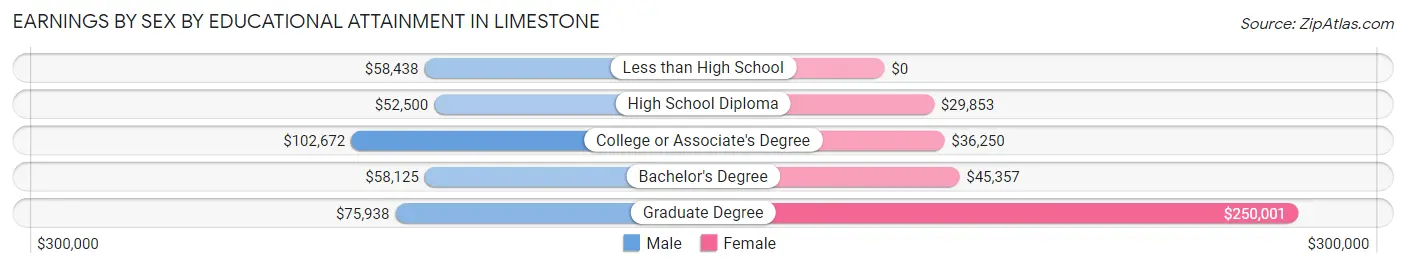
| Educational Attainment | Male Income | Female Income |
| Less than High School | $58,438 | $0 |
| High School Diploma | $52,500 | $29,853 |
| College or Associate's Degree | $102,672 | $36,250 |
| Bachelor's Degree | $58,125 | $45,357 |
| Graduate Degree | $75,938 | $250,001 |
| Total | $78,750 | $44,750 |
Family Income in Limestone
Family Income Brackets in Limestone
According to the Limestone family income data, there are 139 families falling into the $100,000 to $149,999 income range, which is the most common income bracket and makes up 28.7% of all families.
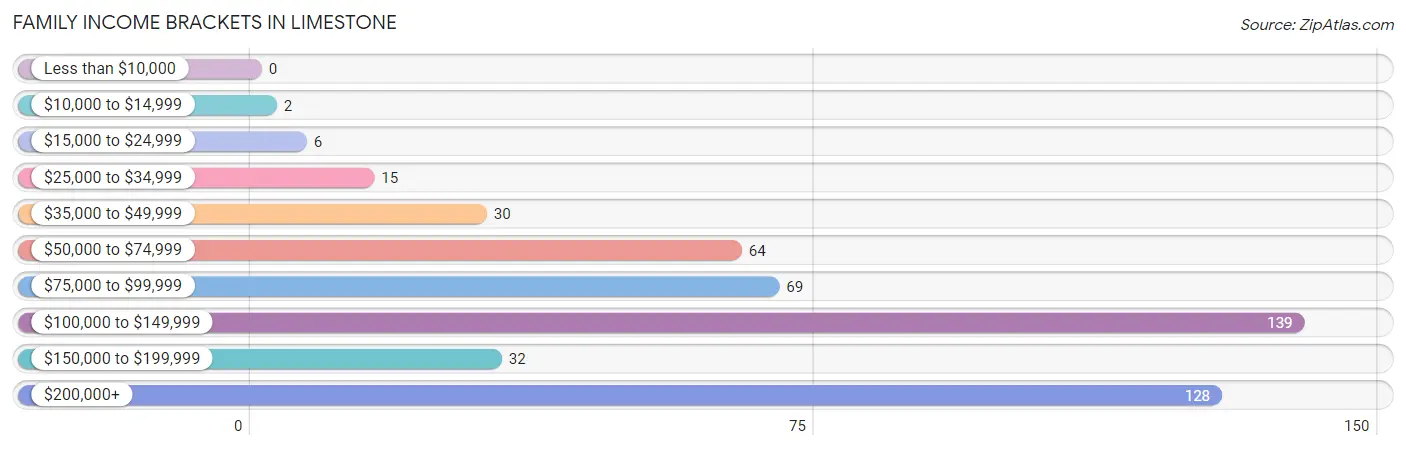
| Income Bracket | # Families | % Families |
| Less than $10,000 | 0 | 0.0% |
| $10,000 to $14,999 | 2 | 0.4% |
| $15,000 to $24,999 | 6 | 1.2% |
| $25,000 to $34,999 | 15 | 3.1% |
| $35,000 to $49,999 | 30 | 6.2% |
| $50,000 to $74,999 | 64 | 13.2% |
| $75,000 to $99,999 | 69 | 14.2% |
| $100,000 to $149,999 | 139 | 28.7% |
| $150,000 to $199,999 | 32 | 6.6% |
| $200,000+ | 128 | 26.4% |
Family Income by Famaliy Size in Limestone
4-person families (51 | 10.5%) account for the highest median family income in Limestone with $137,917 per family, while 2-person families (304 | 62.7%) have the highest median income of $58,125 per family member.
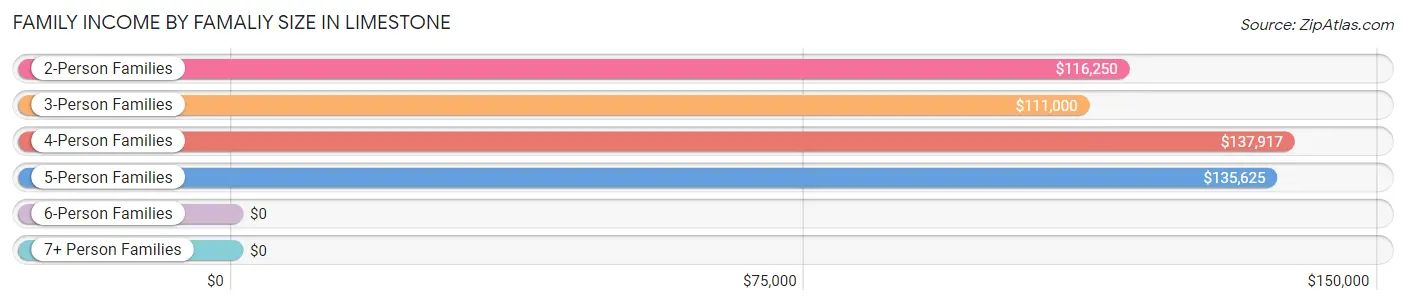
| Income Bracket | # Families | Median Income |
| 2-Person Families | 304 (62.7%) | $116,250 |
| 3-Person Families | 86 (17.7%) | $111,000 |
| 4-Person Families | 51 (10.5%) | $137,917 |
| 5-Person Families | 23 (4.7%) | $135,625 |
| 6-Person Families | 4 (0.8%) | $0 |
| 7+ Person Families | 17 (3.5%) | $0 |
| Total | 485 (100.0%) | $115,781 |
Family Income by Number of Earners in Limestone
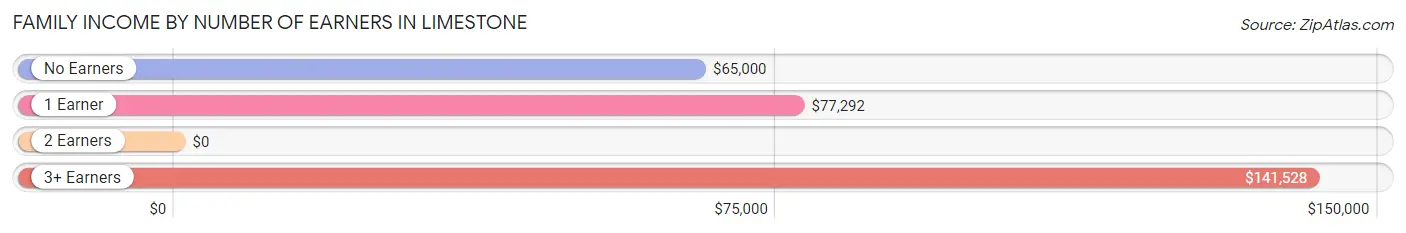
| Number of Earners | # Families | Median Income |
| No Earners | 72 (14.8%) | $65,000 |
| 1 Earner | 100 (20.6%) | $77,292 |
| 2 Earners | 270 (55.7%) | $0 |
| 3+ Earners | 43 (8.9%) | $141,528 |
| Total | 485 (100.0%) | $115,781 |
Household Income in Limestone
Household Income Brackets in Limestone
With 146 households falling in the category, the $100,000 to $149,999 income range is the most frequent in Limestone, accounting for 24.6% of all households. In contrast, only 4 households (0.7%) fall into the less than $10,000 income bracket, making it the least populous group.
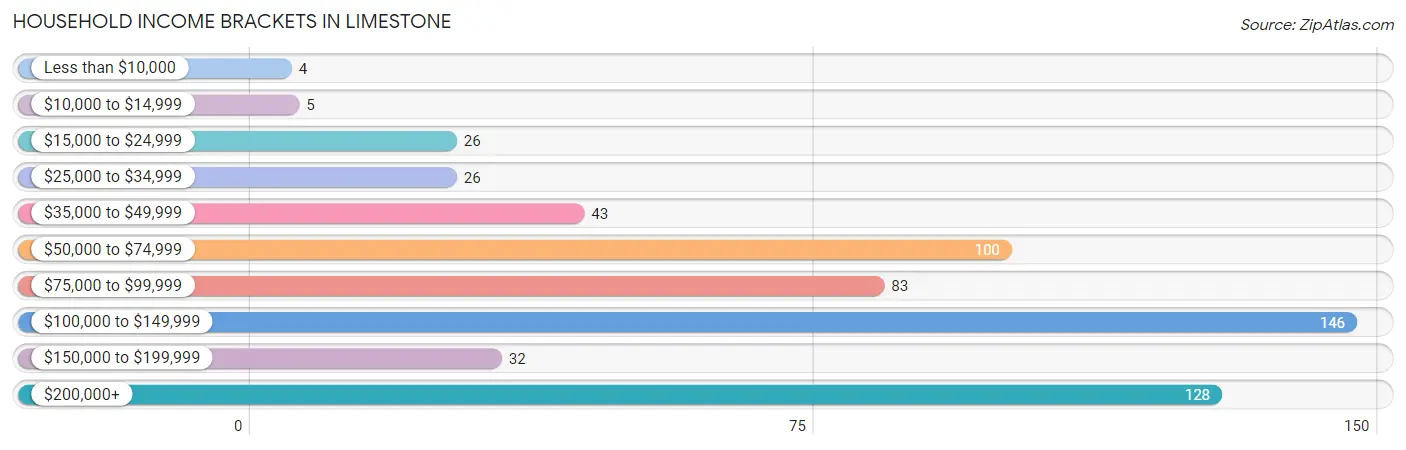
| Income Bracket | # Households | % Households |
| Less than $10,000 | 4 | 0.7% |
| $10,000 to $14,999 | 5 | 0.8% |
| $15,000 to $24,999 | 26 | 4.4% |
| $25,000 to $34,999 | 26 | 4.4% |
| $35,000 to $49,999 | 43 | 7.3% |
| $50,000 to $74,999 | 100 | 16.9% |
| $75,000 to $99,999 | 83 | 14.0% |
| $100,000 to $149,999 | 146 | 24.6% |
| $150,000 to $199,999 | 32 | 5.4% |
| $200,000+ | 128 | 21.6% |
Household Income by Householder Age in Limestone
The median household income in Limestone is $105,750, with the highest median household income of $236,667 found in the 25 to 44 years age bracket for the primary householder. A total of 206 households (34.7%) fall into this category. Meanwhile, the 15 to 24 years age bracket for the primary householder has the lowest median household income of $0, with 9 households (1.5%) in this group.
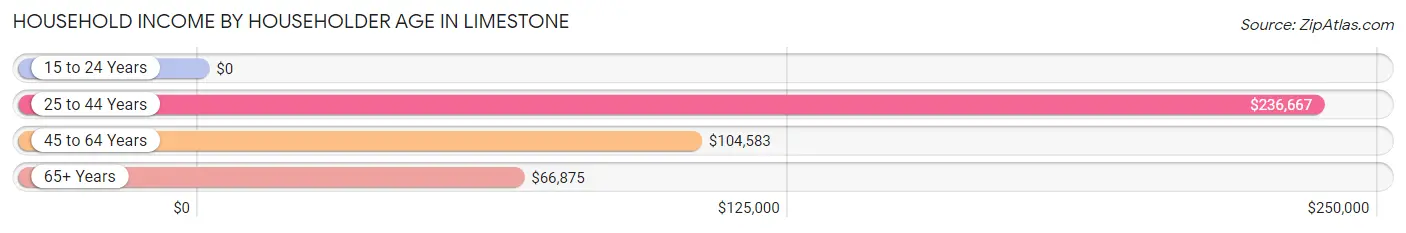
| Income Bracket | # Households | Median Income |
| 15 to 24 Years | 9 (1.5%) | $0 |
| 25 to 44 Years | 206 (34.7%) | $236,667 |
| 45 to 64 Years | 199 (33.6%) | $104,583 |
| 65+ Years | 179 (30.2%) | $66,875 |
| Total | 593 (100.0%) | $105,750 |
Poverty in Limestone
Income Below Poverty by Sex and Age in Limestone
With 2.9% poverty level for males and 7.0% for females among the residents of Limestone, 75 year old and over males and 16 and 17 year old females are the most vulnerable to poverty, with 8 males (10.0%) and 8 females (27.6%) in their respective age groups living below the poverty level.
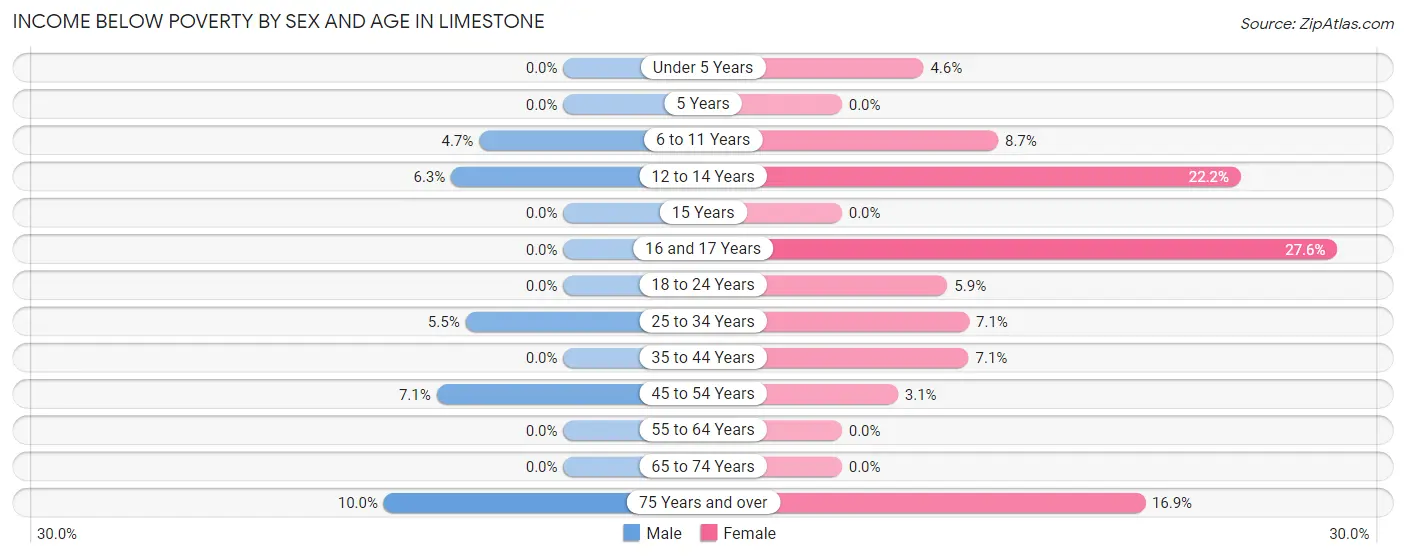
| Age Bracket | Male | Female |
| Under 5 Years | 0 (0.0%) | 3 (4.5%) |
| 5 Years | 0 (0.0%) | 0 (0.0%) |
| 6 to 11 Years | 3 (4.7%) | 4 (8.7%) |
| 12 to 14 Years | 2 (6.2%) | 4 (22.2%) |
| 15 Years | 0 (0.0%) | 0 (0.0%) |
| 16 and 17 Years | 0 (0.0%) | 8 (27.6%) |
| 18 to 24 Years | 0 (0.0%) | 1 (5.9%) |
| 25 to 34 Years | 3 (5.4%) | 9 (7.1%) |
| 35 to 44 Years | 0 (0.0%) | 6 (7.1%) |
| 45 to 54 Years | 6 (7.1%) | 2 (3.1%) |
| 55 to 64 Years | 0 (0.0%) | 0 (0.0%) |
| 65 to 74 Years | 0 (0.0%) | 0 (0.0%) |
| 75 Years and over | 8 (10.0%) | 13 (16.9%) |
| Total | 22 (2.9%) | 50 (7.0%) |
Income Above Poverty by Sex and Age in Limestone
According to the poverty statistics in Limestone, males aged under 5 years and females aged 5 years are the age groups that are most secure financially, with 100.0% of males and 100.0% of females in these age groups living above the poverty line.
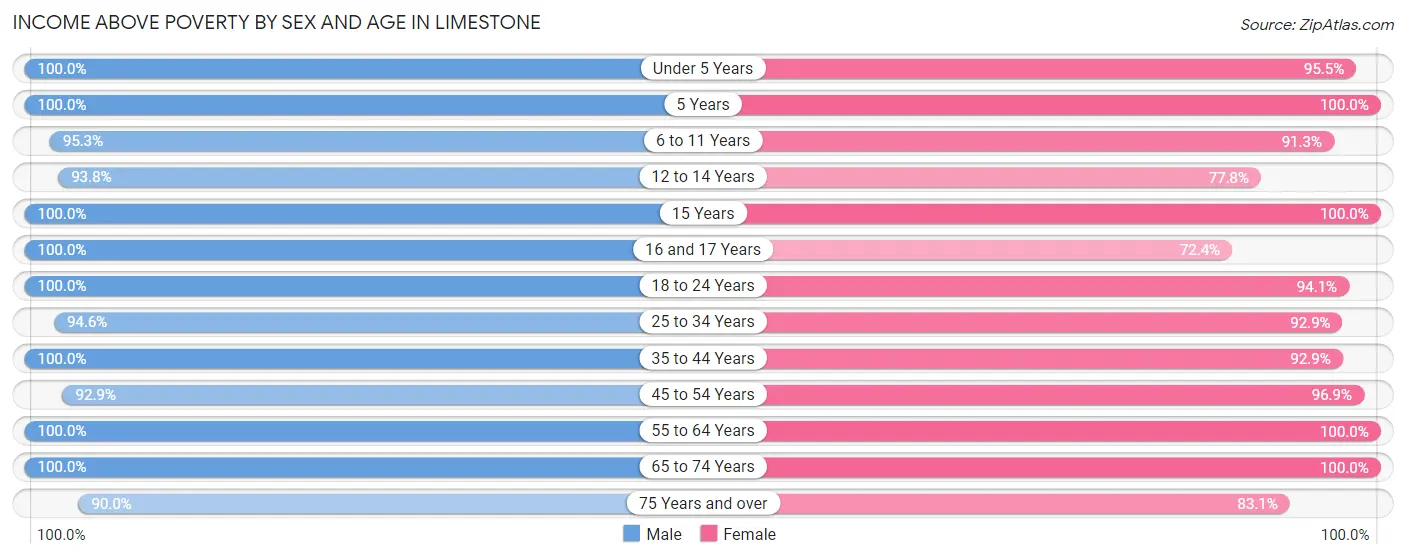
| Age Bracket | Male | Female |
| Under 5 Years | 32 (100.0%) | 63 (95.5%) |
| 5 Years | 3 (100.0%) | 13 (100.0%) |
| 6 to 11 Years | 61 (95.3%) | 42 (91.3%) |
| 12 to 14 Years | 30 (93.8%) | 14 (77.8%) |
| 15 Years | 8 (100.0%) | 3 (100.0%) |
| 16 and 17 Years | 29 (100.0%) | 21 (72.4%) |
| 18 to 24 Years | 36 (100.0%) | 16 (94.1%) |
| 25 to 34 Years | 52 (94.6%) | 118 (92.9%) |
| 35 to 44 Years | 149 (100.0%) | 79 (92.9%) |
| 45 to 54 Years | 79 (92.9%) | 62 (96.9%) |
| 55 to 64 Years | 111 (100.0%) | 91 (100.0%) |
| 65 to 74 Years | 72 (100.0%) | 78 (100.0%) |
| 75 Years and over | 72 (90.0%) | 64 (83.1%) |
| Total | 734 (97.1%) | 664 (93.0%) |
Income Below Poverty Among Married-Couple Families in Limestone
The poverty statistics for married-couple families in Limestone show that 2.3% or 10 of the total 429 families live below the poverty line. Families with 1 or 2 children have the highest poverty rate of 5.1%, comprising of 4 families. On the other hand, families with 3 or 4 children have the lowest poverty rate of 0.0%, which includes 0 families.
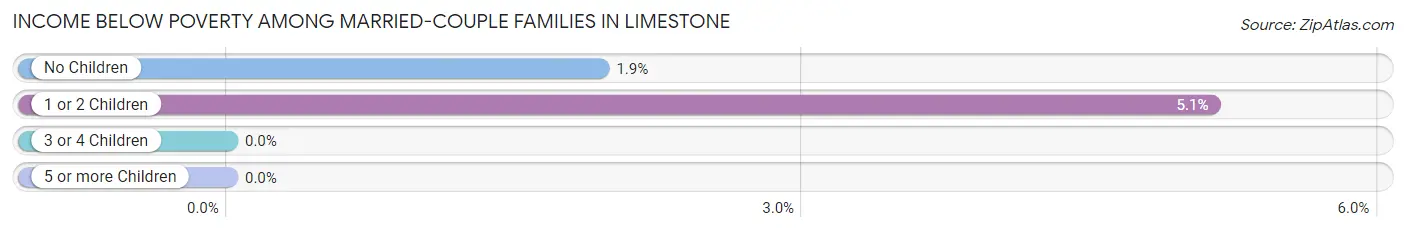
| Children | Above Poverty | Below Poverty |
| No Children | 304 (98.1%) | 6 (1.9%) |
| 1 or 2 Children | 74 (94.9%) | 4 (5.1%) |
| 3 or 4 Children | 28 (100.0%) | 0 (0.0%) |
| 5 or more Children | 13 (100.0%) | 0 (0.0%) |
| Total | 419 (97.7%) | 10 (2.3%) |
Income Below Poverty Among Single-Parent Households in Limestone
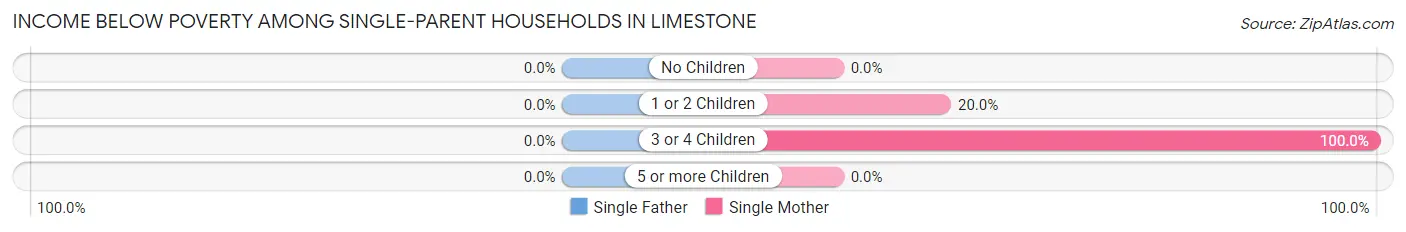
| Children | Single Father | Single Mother |
| No Children | 0 (0.0%) | 0 (0.0%) |
| 1 or 2 Children | 0 (0.0%) | 4 (20.0%) |
| 3 or 4 Children | 0 (0.0%) | 2 (100.0%) |
| 5 or more Children | 0 (0.0%) | 0 (0.0%) |
| Total | 0 (0.0%) | 6 (16.2%) |
Income Below Poverty Among Married-Couple vs Single-Parent Households in Limestone
The poverty data for Limestone shows that 10 of the married-couple family households (2.3%) and 6 of the single-parent households (10.7%) are living below the poverty level. Within the married-couple family households, those with 1 or 2 children have the highest poverty rate, with 4 households (5.1%) falling below the poverty line. Among the single-parent households, those with 3 or 4 children have the highest poverty rate, with 2 household (100.0%) living below poverty.
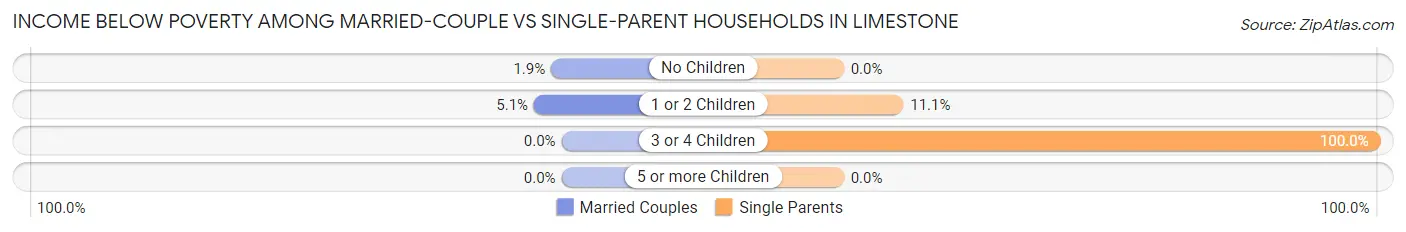
| Children | Married-Couple Families | Single-Parent Households |
| No Children | 6 (1.9%) | 0 (0.0%) |
| 1 or 2 Children | 4 (5.1%) | 4 (11.1%) |
| 3 or 4 Children | 0 (0.0%) | 2 (100.0%) |
| 5 or more Children | 0 (0.0%) | 0 (0.0%) |
| Total | 10 (2.3%) | 6 (10.7%) |
Employment Characteristics in Limestone
Employment by Class of Employer in Limestone
Among the 764 employed individuals in Limestone, private company employees (538 | 70.4%), self-employed (incorporated) (71 | 9.3%), and not-for-profit organizations (64 | 8.4%) make up the most common classes of employment.
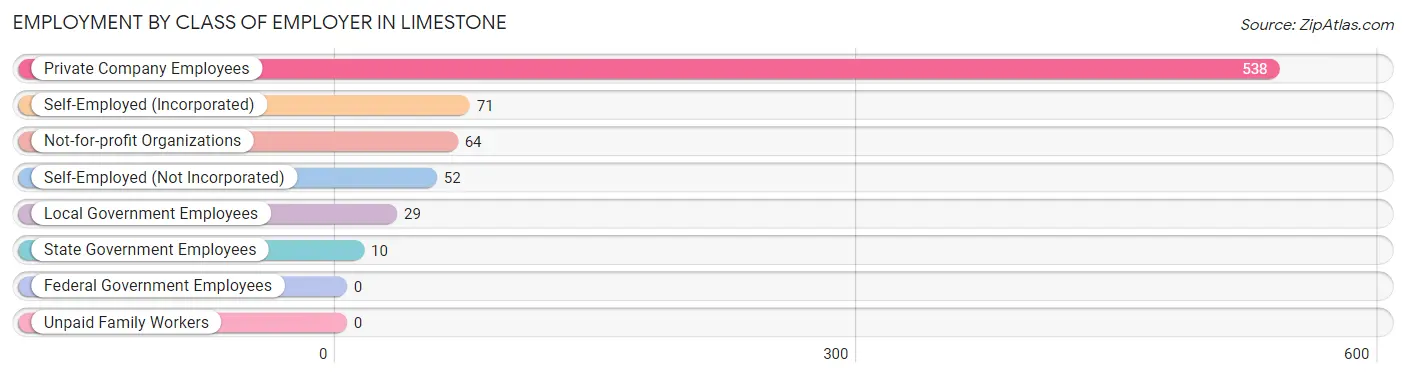
| Employer Class | # Employees | % Employees |
| Private Company Employees | 538 | 70.4% |
| Self-Employed (Incorporated) | 71 | 9.3% |
| Self-Employed (Not Incorporated) | 52 | 6.8% |
| Not-for-profit Organizations | 64 | 8.4% |
| Local Government Employees | 29 | 3.8% |
| State Government Employees | 10 | 1.3% |
| Federal Government Employees | 0 | 0.0% |
| Unpaid Family Workers | 0 | 0.0% |
| Total | 764 | 100.0% |
Employment Status by Age in Limestone
According to the labor force statistics for Limestone, out of the total population over 16 years of age (1,185), 68.9% or 816 individuals are in the labor force, with 5.8% or 47 of them unemployed. The age group with the highest labor force participation rate is 35 to 44 years, with 98.7% or 231 individuals in the labor force. Within the labor force, the 16 to 19 years age range has the highest percentage of unemployed individuals, with 32.4% or 12 of them being unemployed.
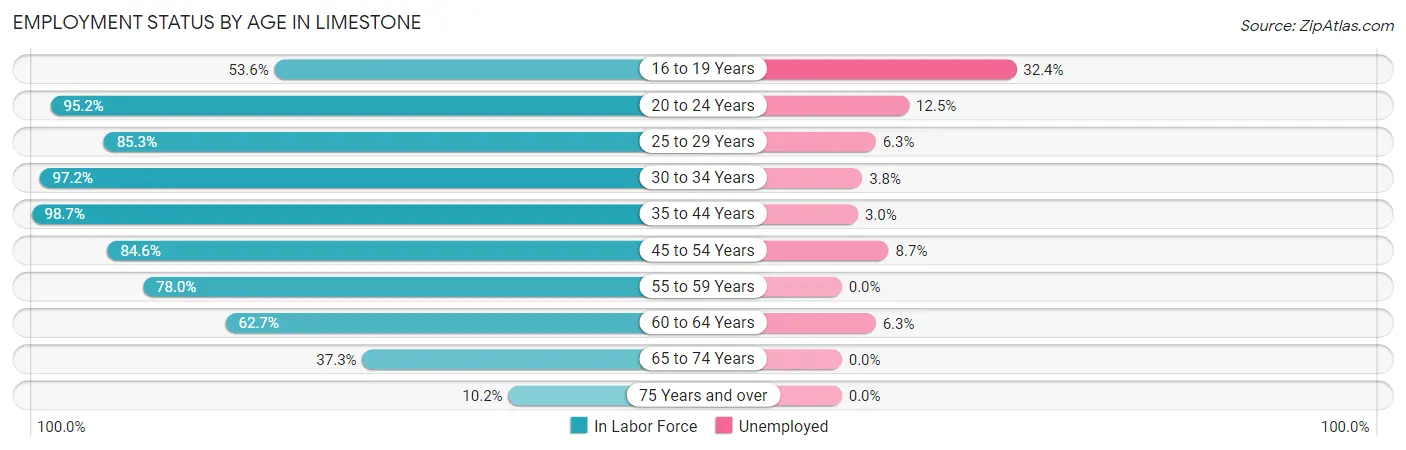
| Age Bracket | In Labor Force | Unemployed |
| 16 to 19 Years | 37 (53.6%) | 12 (32.4%) |
| 20 to 24 Years | 40 (95.2%) | 5 (12.5%) |
| 25 to 29 Years | 64 (85.3%) | 4 (6.3%) |
| 30 to 34 Years | 104 (97.2%) | 4 (3.8%) |
| 35 to 44 Years | 231 (98.7%) | 7 (3.0%) |
| 45 to 54 Years | 126 (84.6%) | 11 (8.7%) |
| 55 to 59 Years | 78 (78.0%) | 0 (0.0%) |
| 60 to 64 Years | 64 (62.7%) | 4 (6.3%) |
| 65 to 74 Years | 56 (37.3%) | 0 (0.0%) |
| 75 Years and over | 16 (10.2%) | 0 (0.0%) |
| Total | 816 (68.9%) | 47 (5.8%) |
Employment Status by Educational Attainment in Limestone
According to labor force statistics for Limestone, 87.0% of individuals (667) out of the total population between 25 and 64 years of age (767) are in the labor force, with 4.5% or 30 of them being unemployed. The group with the highest labor force participation rate are those with the educational attainment of less than high school, with 100.0% or 12 individuals in the labor force. Within the labor force, individuals with less than high school education have the highest percentage of unemployment, with 25.0% or 3 of them being unemployed.
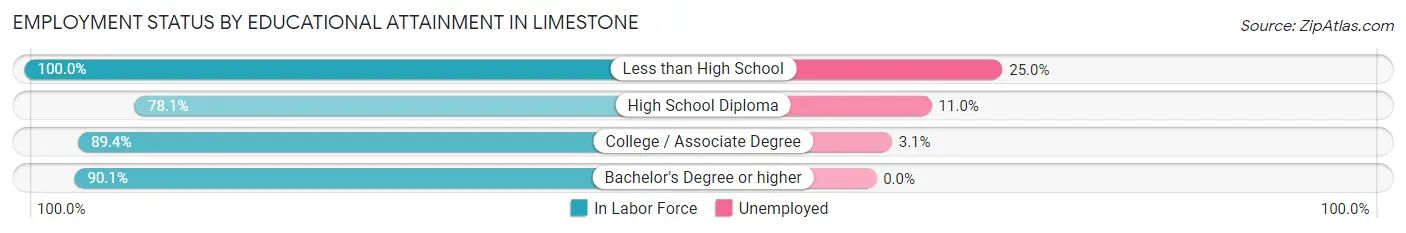
| Educational Attainment | In Labor Force | Unemployed |
| Less than High School | 12 (100.0%) | 3 (25.0%) |
| High School Diploma | 146 (78.1%) | 21 (11.0%) |
| College / Associate Degree | 355 (89.4%) | 12 (3.1%) |
| Bachelor's Degree or higher | 154 (90.1%) | 0 (0.0%) |
| Total | 667 (87.0%) | 35 (4.5%) |
Employment Occupations by Sex in Limestone
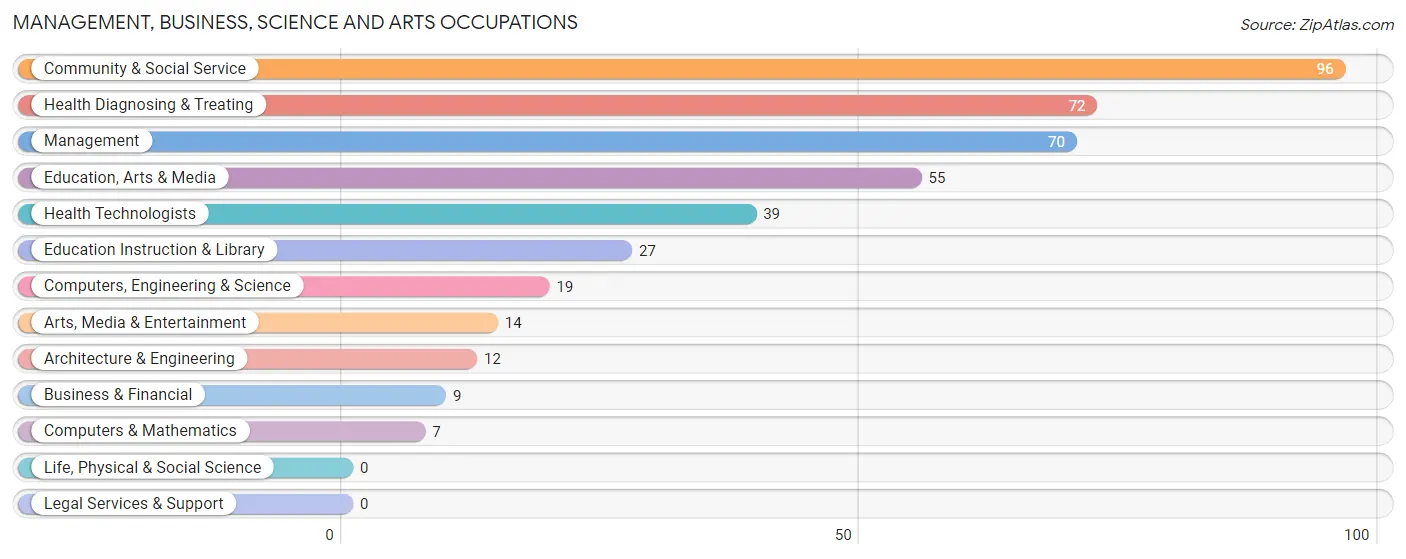
Management, Business, Science and Arts Occupations
The most common Management, Business, Science and Arts occupations in Limestone are Community & Social Service (96 | 12.5%), Health Diagnosing & Treating (72 | 9.4%), Management (70 | 9.1%), Education, Arts & Media (55 | 7.1%), and Health Technologists (39 | 5.1%).
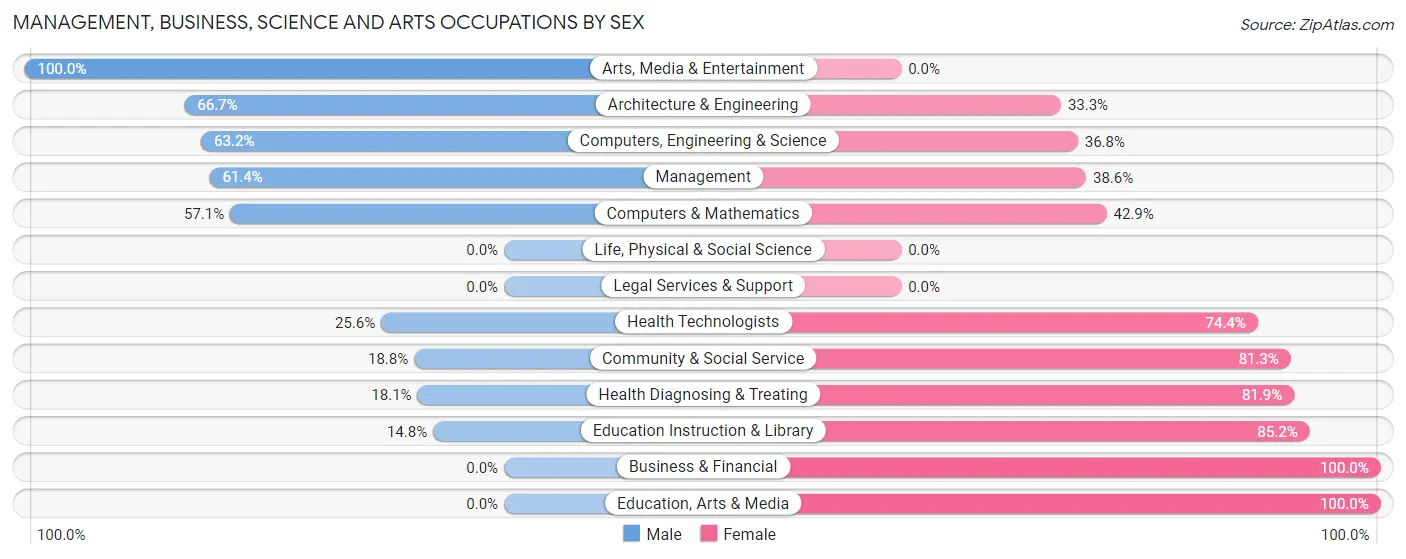
Management, Business, Science and Arts Occupations by Sex
Within the Management, Business, Science and Arts occupations in Limestone, the most male-oriented occupations are Arts, Media & Entertainment (100.0%), Architecture & Engineering (66.7%), and Computers, Engineering & Science (63.2%), while the most female-oriented occupations are Business & Financial (100.0%), Education, Arts & Media (100.0%), and Education Instruction & Library (85.2%).
| Occupation | Male | Female |
| Management | 43 (61.4%) | 27 (38.6%) |
| Business & Financial | 0 (0.0%) | 9 (100.0%) |
| Computers, Engineering & Science | 12 (63.2%) | 7 (36.8%) |
| Computers & Mathematics | 4 (57.1%) | 3 (42.9%) |
| Architecture & Engineering | 8 (66.7%) | 4 (33.3%) |
| Life, Physical & Social Science | 0 (0.0%) | 0 (0.0%) |
| Community & Social Service | 18 (18.8%) | 78 (81.2%) |
| Education, Arts & Media | 0 (0.0%) | 55 (100.0%) |
| Legal Services & Support | 0 (0.0%) | 0 (0.0%) |
| Education Instruction & Library | 4 (14.8%) | 23 (85.2%) |
| Arts, Media & Entertainment | 14 (100.0%) | 0 (0.0%) |
| Health Diagnosing & Treating | 13 (18.1%) | 59 (81.9%) |
| Health Technologists | 10 (25.6%) | 29 (74.4%) |
| Total (Category) | 86 (32.3%) | 180 (67.7%) |
| Total (Overall) | 404 (52.5%) | 365 (47.5%) |
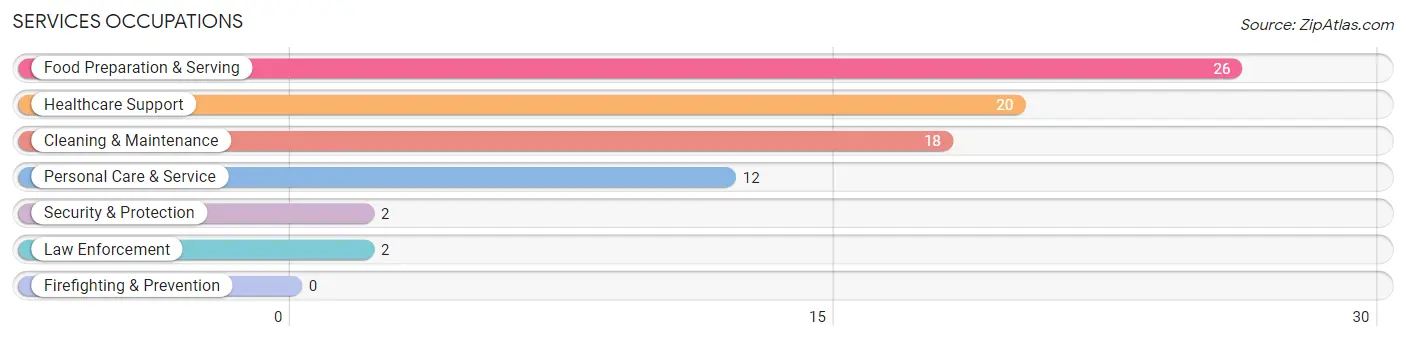
Services Occupations
The most common Services occupations in Limestone are Food Preparation & Serving (26 | 3.4%), Healthcare Support (20 | 2.6%), Cleaning & Maintenance (18 | 2.3%), Personal Care & Service (12 | 1.6%), and Security & Protection (2 | 0.3%).
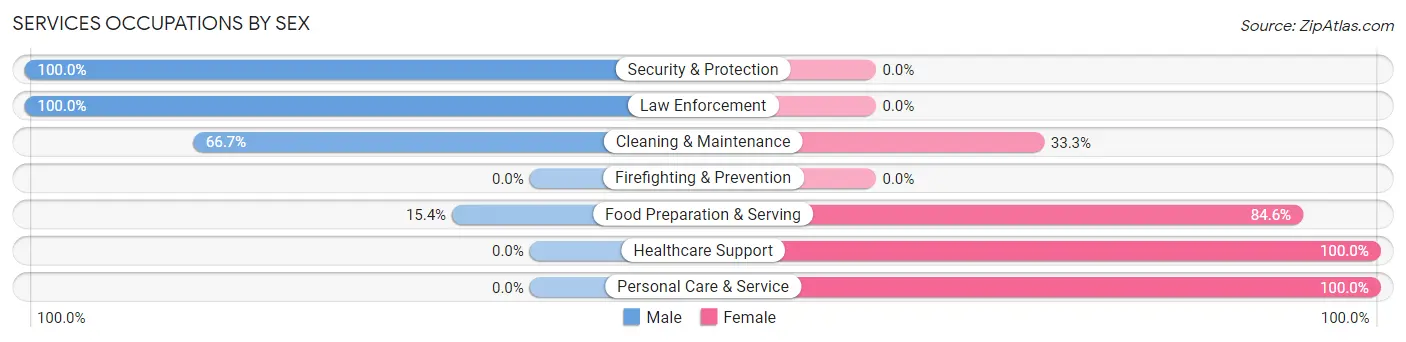
Services Occupations by Sex
Within the Services occupations in Limestone, the most male-oriented occupations are Security & Protection (100.0%), Law Enforcement (100.0%), and Cleaning & Maintenance (66.7%), while the most female-oriented occupations are Healthcare Support (100.0%), Personal Care & Service (100.0%), and Food Preparation & Serving (84.6%).
| Occupation | Male | Female |
| Healthcare Support | 0 (0.0%) | 20 (100.0%) |
| Security & Protection | 2 (100.0%) | 0 (0.0%) |
| Firefighting & Prevention | 0 (0.0%) | 0 (0.0%) |
| Law Enforcement | 2 (100.0%) | 0 (0.0%) |
| Food Preparation & Serving | 4 (15.4%) | 22 (84.6%) |
| Cleaning & Maintenance | 12 (66.7%) | 6 (33.3%) |
| Personal Care & Service | 0 (0.0%) | 12 (100.0%) |
| Total (Category) | 18 (23.1%) | 60 (76.9%) |
| Total (Overall) | 404 (52.5%) | 365 (47.5%) |
Sales and Office Occupations
The most common Sales and Office occupations in Limestone are Office & Administration (89 | 11.6%), and Sales & Related (33 | 4.3%).
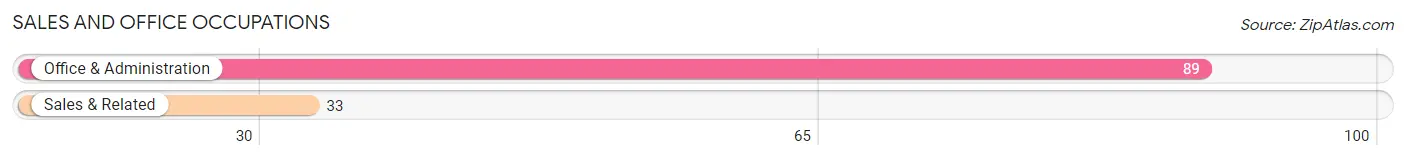
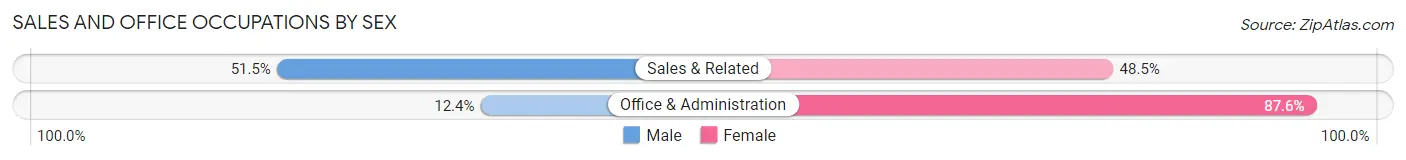
Sales and Office Occupations by Sex
| Occupation | Male | Female |
| Sales & Related | 17 (51.5%) | 16 (48.5%) |
| Office & Administration | 11 (12.4%) | 78 (87.6%) |
| Total (Category) | 28 (23.0%) | 94 (77.0%) |
| Total (Overall) | 404 (52.5%) | 365 (47.5%) |
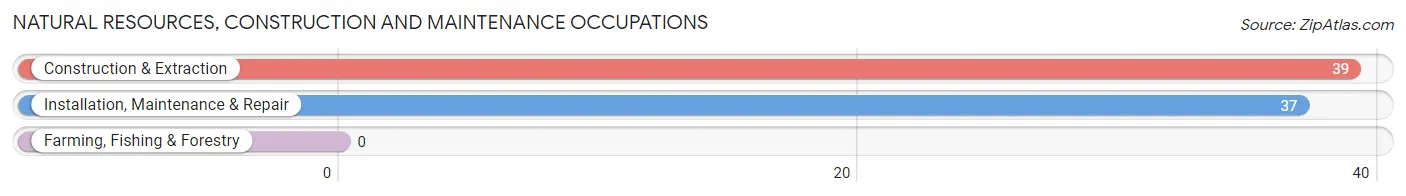
Natural Resources, Construction and Maintenance Occupations
The most common Natural Resources, Construction and Maintenance occupations in Limestone are Construction & Extraction (39 | 5.1%), and Installation, Maintenance & Repair (37 | 4.8%).
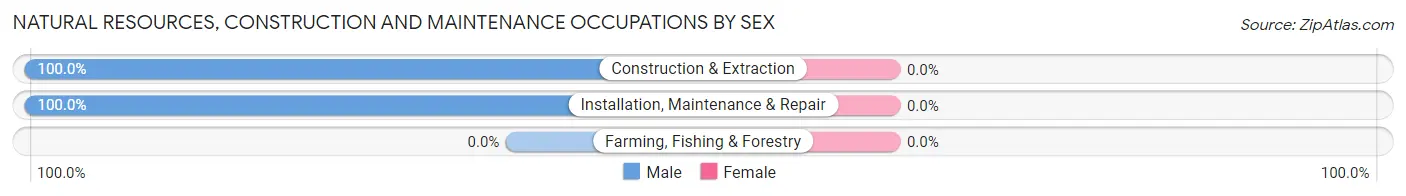
Natural Resources, Construction and Maintenance Occupations by Sex
| Occupation | Male | Female |
| Farming, Fishing & Forestry | 0 (0.0%) | 0 (0.0%) |
| Construction & Extraction | 39 (100.0%) | 0 (0.0%) |
| Installation, Maintenance & Repair | 37 (100.0%) | 0 (0.0%) |
| Total (Category) | 76 (100.0%) | 0 (0.0%) |
| Total (Overall) | 404 (52.5%) | 365 (47.5%) |
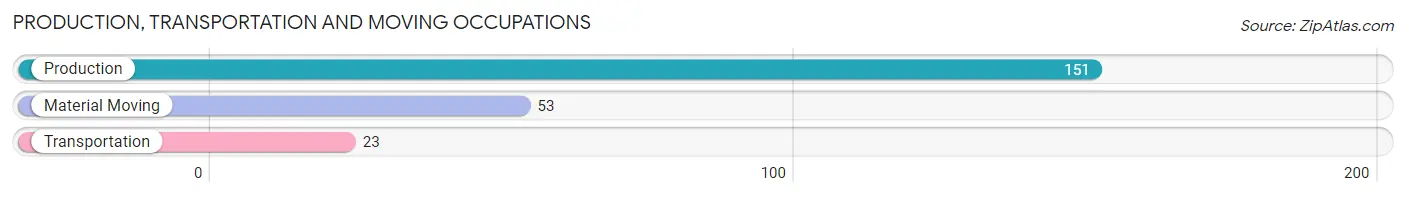
Production, Transportation and Moving Occupations
The most common Production, Transportation and Moving occupations in Limestone are Production (151 | 19.6%), Material Moving (53 | 6.9%), and Transportation (23 | 3.0%).
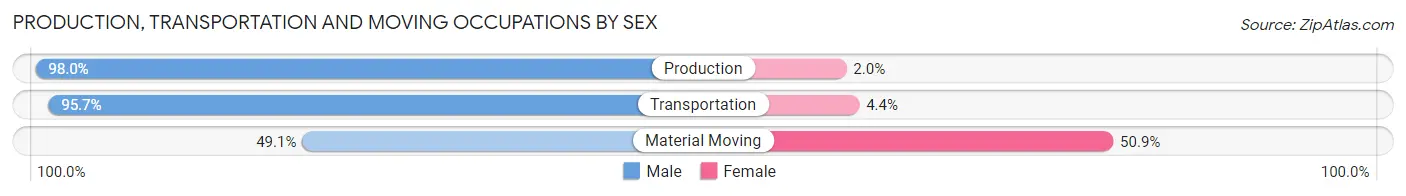
Production, Transportation and Moving Occupations by Sex
| Occupation | Male | Female |
| Production | 148 (98.0%) | 3 (2.0%) |
| Transportation | 22 (95.7%) | 1 (4.3%) |
| Material Moving | 26 (49.1%) | 27 (50.9%) |
| Total (Category) | 196 (86.3%) | 31 (13.7%) |
| Total (Overall) | 404 (52.5%) | 365 (47.5%) |
Employment Industries by Sex in Limestone
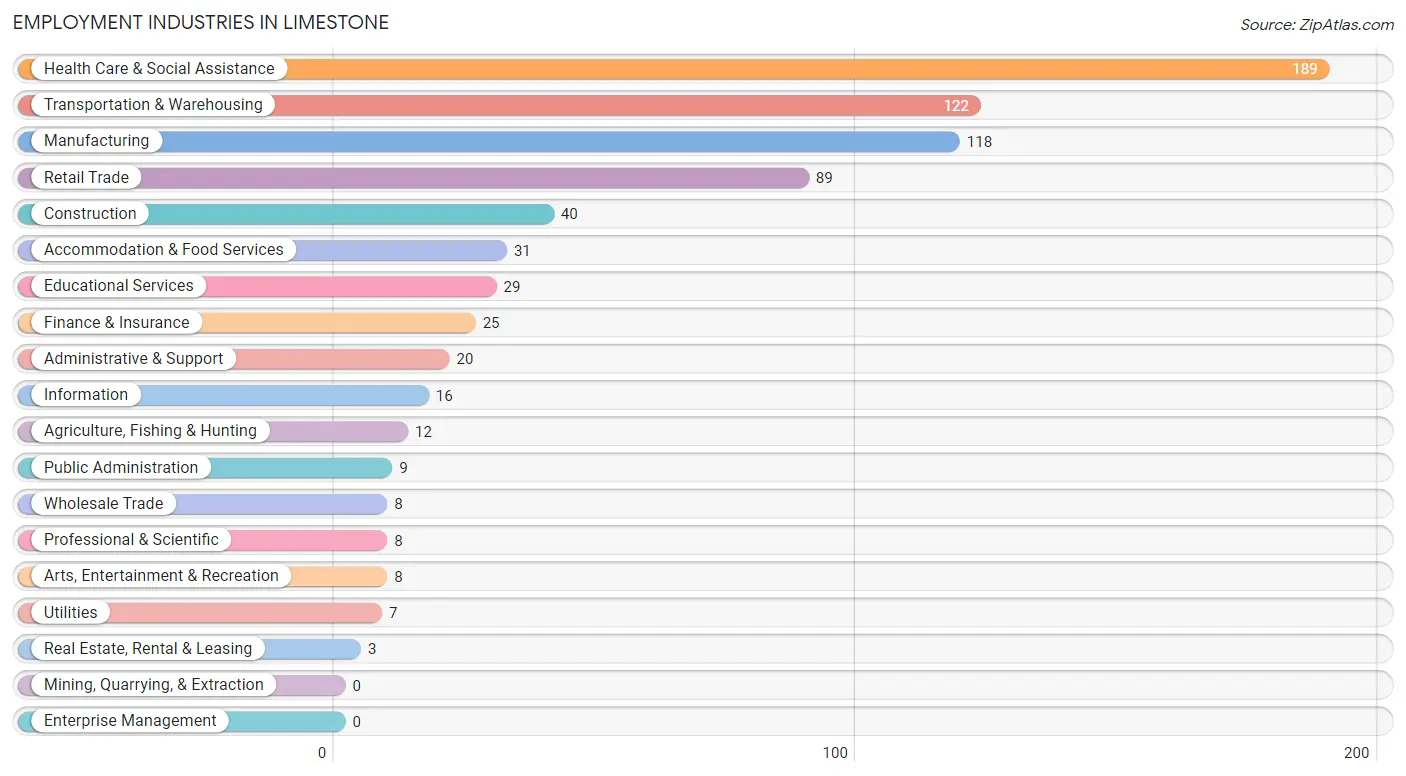
Employment Industries in Limestone
The major employment industries in Limestone include Health Care & Social Assistance (189 | 24.6%), Transportation & Warehousing (122 | 15.9%), Manufacturing (118 | 15.3%), Retail Trade (89 | 11.6%), and Construction (40 | 5.2%).
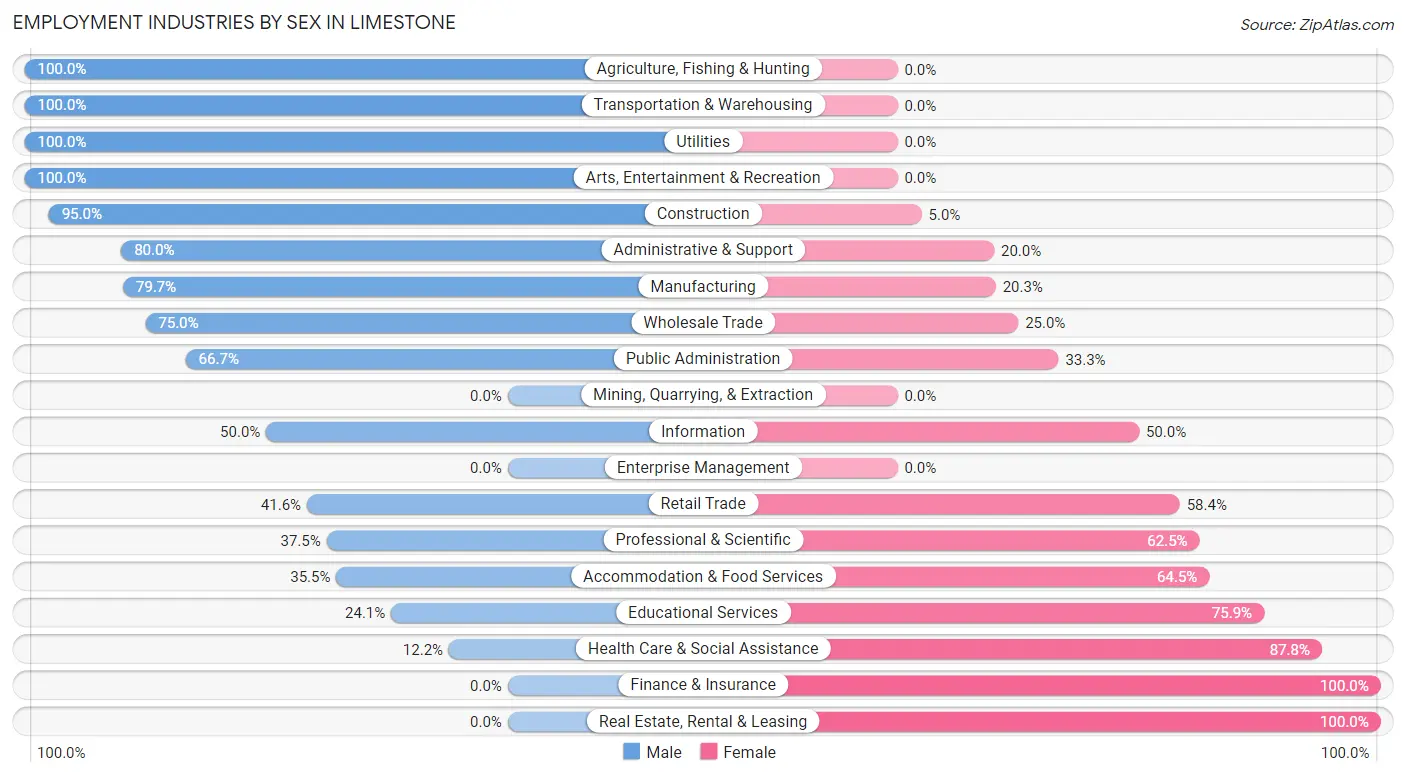
Employment Industries by Sex in Limestone
The Limestone industries that see more men than women are Agriculture, Fishing & Hunting (100.0%), Transportation & Warehousing (100.0%), and Utilities (100.0%), whereas the industries that tend to have a higher number of women are Finance & Insurance (100.0%), Real Estate, Rental & Leasing (100.0%), and Health Care & Social Assistance (87.8%).
| Industry | Male | Female |
| Agriculture, Fishing & Hunting | 12 (100.0%) | 0 (0.0%) |
| Mining, Quarrying, & Extraction | 0 (0.0%) | 0 (0.0%) |
| Construction | 38 (95.0%) | 2 (5.0%) |
| Manufacturing | 94 (79.7%) | 24 (20.3%) |
| Wholesale Trade | 6 (75.0%) | 2 (25.0%) |
| Retail Trade | 37 (41.6%) | 52 (58.4%) |
| Transportation & Warehousing | 122 (100.0%) | 0 (0.0%) |
| Utilities | 7 (100.0%) | 0 (0.0%) |
| Information | 8 (50.0%) | 8 (50.0%) |
| Finance & Insurance | 0 (0.0%) | 25 (100.0%) |
| Real Estate, Rental & Leasing | 0 (0.0%) | 3 (100.0%) |
| Professional & Scientific | 3 (37.5%) | 5 (62.5%) |
| Enterprise Management | 0 (0.0%) | 0 (0.0%) |
| Administrative & Support | 16 (80.0%) | 4 (20.0%) |
| Educational Services | 7 (24.1%) | 22 (75.9%) |
| Health Care & Social Assistance | 23 (12.2%) | 166 (87.8%) |
| Arts, Entertainment & Recreation | 8 (100.0%) | 0 (0.0%) |
| Accommodation & Food Services | 11 (35.5%) | 20 (64.5%) |
| Public Administration | 6 (66.7%) | 3 (33.3%) |
| Total | 404 (52.5%) | 365 (47.5%) |
Education in Limestone
School Enrollment in Limestone
The most common levels of schooling among the 298 students in Limestone are elementary school (76 | 25.5%), high school (75 | 25.2%), and middle school (73 | 24.5%).
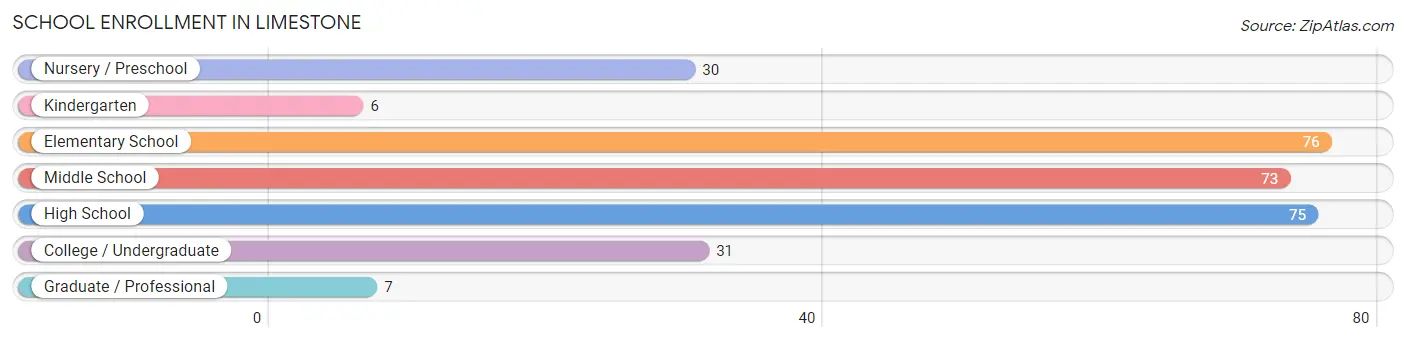
| School Level | # Students | % Students |
| Nursery / Preschool | 30 | 10.1% |
| Kindergarten | 6 | 2.0% |
| Elementary School | 76 | 25.5% |
| Middle School | 73 | 24.5% |
| High School | 75 | 25.2% |
| College / Undergraduate | 31 | 10.4% |
| Graduate / Professional | 7 | 2.4% |
| Total | 298 | 100.0% |
School Enrollment by Age by Funding Source in Limestone
Out of a total of 298 students who are enrolled in schools in Limestone, 44 (14.8%) attend a private institution, while the remaining 254 (85.2%) are enrolled in public schools. The age group of 18 to 19 year olds has the highest likelihood of being enrolled in private schools, with 4 (80.0% in the age bracket) enrolled. Conversely, the age group of 5 to 9 year old has the lowest likelihood of being enrolled in a private school, with 70 (100.0% in the age bracket) attending a public institution.
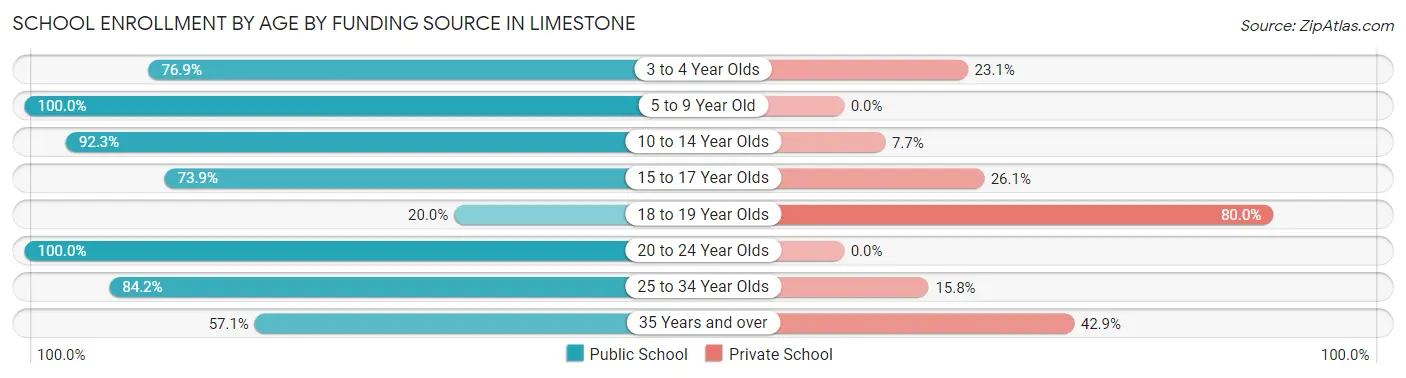
| Age Bracket | Public School | Private School |
| 3 to 4 Year Olds | 20 (76.9%) | 6 (23.1%) |
| 5 to 9 Year Old | 70 (100.0%) | 0 (0.0%) |
| 10 to 14 Year Olds | 84 (92.3%) | 7 (7.7%) |
| 15 to 17 Year Olds | 51 (73.9%) | 18 (26.1%) |
| 18 to 19 Year Olds | 1 (20.0%) | 4 (80.0%) |
| 20 to 24 Year Olds | 4 (100.0%) | 0 (0.0%) |
| 25 to 34 Year Olds | 16 (84.2%) | 3 (15.8%) |
| 35 Years and over | 8 (57.1%) | 6 (42.9%) |
| Total | 254 (85.2%) | 44 (14.8%) |
Educational Attainment by Field of Study in Limestone
Psychology (58 | 30.0%), science & technology (28 | 14.5%), business (25 | 13.0%), education (24 | 12.4%), and communications (17 | 8.8%) are the most common fields of study among 193 individuals in Limestone who have obtained a bachelor's degree or higher.
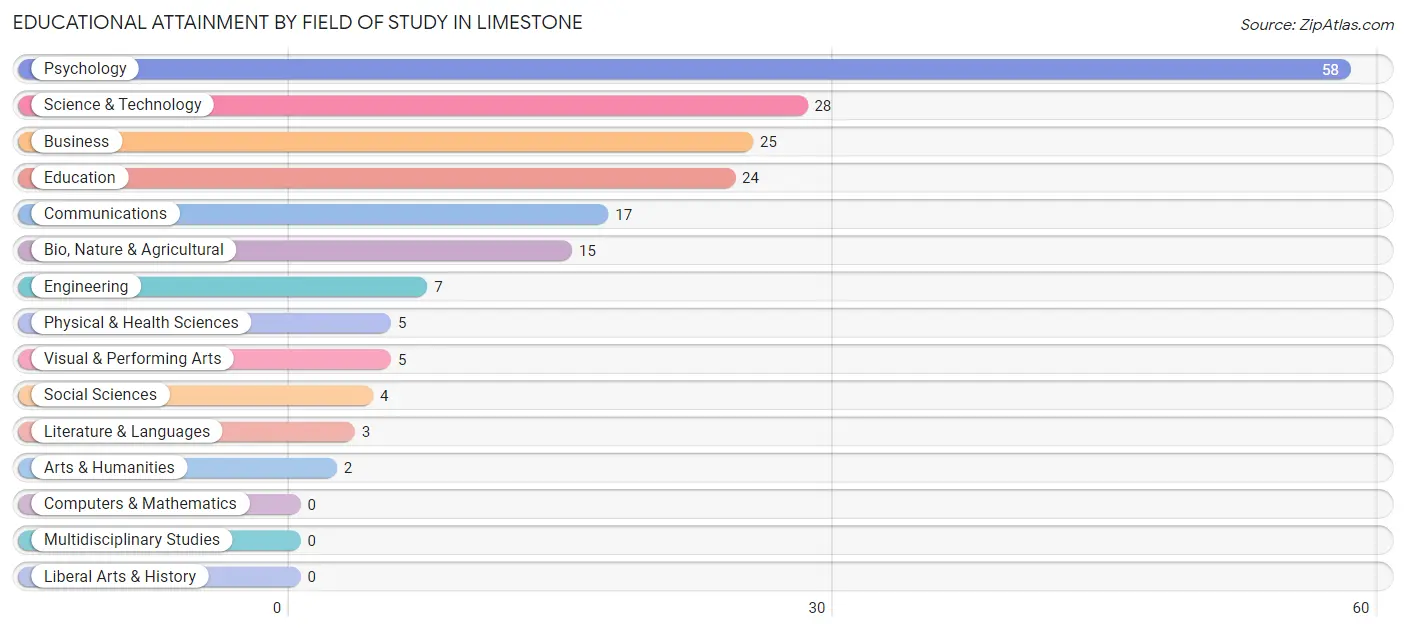
| Field of Study | # Graduates | % Graduates |
| Computers & Mathematics | 0 | 0.0% |
| Bio, Nature & Agricultural | 15 | 7.8% |
| Physical & Health Sciences | 5 | 2.6% |
| Psychology | 58 | 30.0% |
| Social Sciences | 4 | 2.1% |
| Engineering | 7 | 3.6% |
| Multidisciplinary Studies | 0 | 0.0% |
| Science & Technology | 28 | 14.5% |
| Business | 25 | 13.0% |
| Education | 24 | 12.4% |
| Literature & Languages | 3 | 1.5% |
| Liberal Arts & History | 0 | 0.0% |
| Visual & Performing Arts | 5 | 2.6% |
| Communications | 17 | 8.8% |
| Arts & Humanities | 2 | 1.0% |
| Total | 193 | 100.0% |
Transportation & Commute in Limestone
Vehicle Availability by Sex in Limestone
The most prevalent vehicle ownership categories in Limestone are males with 3 vehicles (180, accounting for 44.9%) and females with 3 vehicles (152, making up 49.6%).
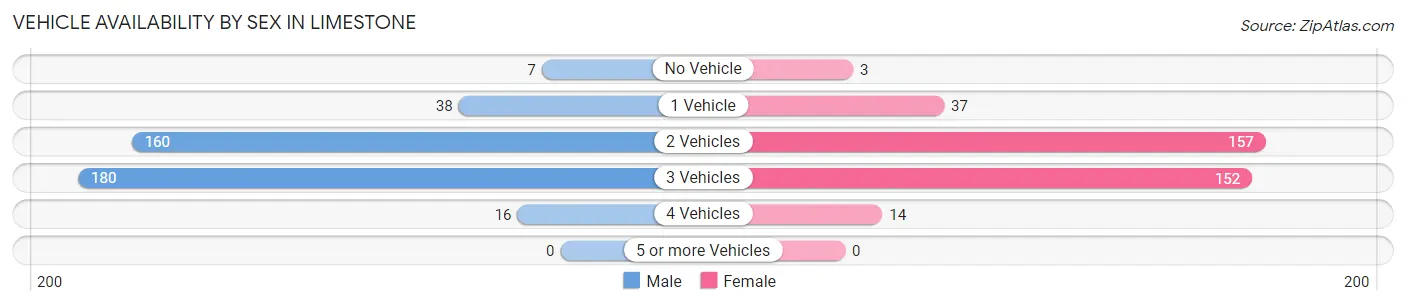
| Vehicles Available | Male | Female |
| No Vehicle | 7 (1.8%) | 3 (0.8%) |
| 1 Vehicle | 38 (9.5%) | 37 (10.2%) |
| 2 Vehicles | 160 (39.9%) | 157 (43.2%) |
| 3 Vehicles | 180 (44.9%) | 152 (41.9%) |
| 4 Vehicles | 16 (4.0%) | 14 (3.9%) |
| 5 or more Vehicles | 0 (0.0%) | 0 (0.0%) |
| Total | 401 (100.0%) | 363 (100.0%) |
Commute Time in Limestone
The most frequently occuring commute durations in Limestone are 20 to 24 minutes (209 commuters, 30.1%), 10 to 14 minutes (101 commuters, 14.5%), and 5 to 9 minutes (90 commuters, 13.0%).
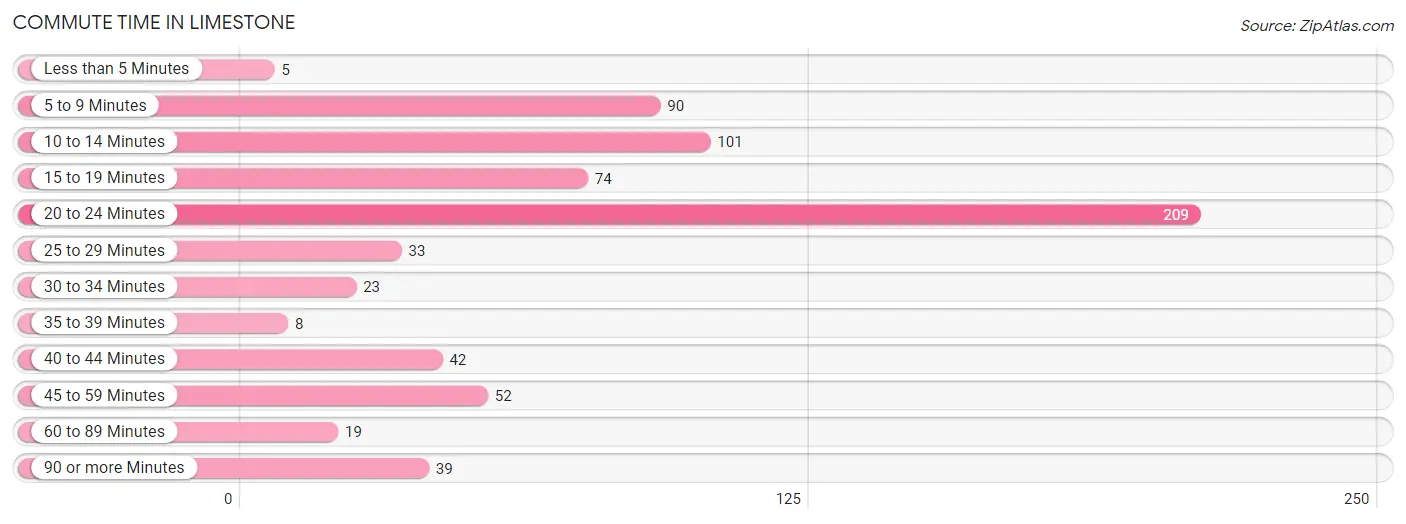
| Commute Time | # Commuters | % Commuters |
| Less than 5 Minutes | 5 | 0.7% |
| 5 to 9 Minutes | 90 | 13.0% |
| 10 to 14 Minutes | 101 | 14.5% |
| 15 to 19 Minutes | 74 | 10.6% |
| 20 to 24 Minutes | 209 | 30.1% |
| 25 to 29 Minutes | 33 | 4.8% |
| 30 to 34 Minutes | 23 | 3.3% |
| 35 to 39 Minutes | 8 | 1.1% |
| 40 to 44 Minutes | 42 | 6.0% |
| 45 to 59 Minutes | 52 | 7.5% |
| 60 to 89 Minutes | 19 | 2.7% |
| 90 or more Minutes | 39 | 5.6% |
Commute Time by Sex in Limestone
The most common commute times in Limestone are 20 to 24 minutes (160 commuters, 40.3%) for males and 10 to 14 minutes (67 commuters, 22.5%) for females.
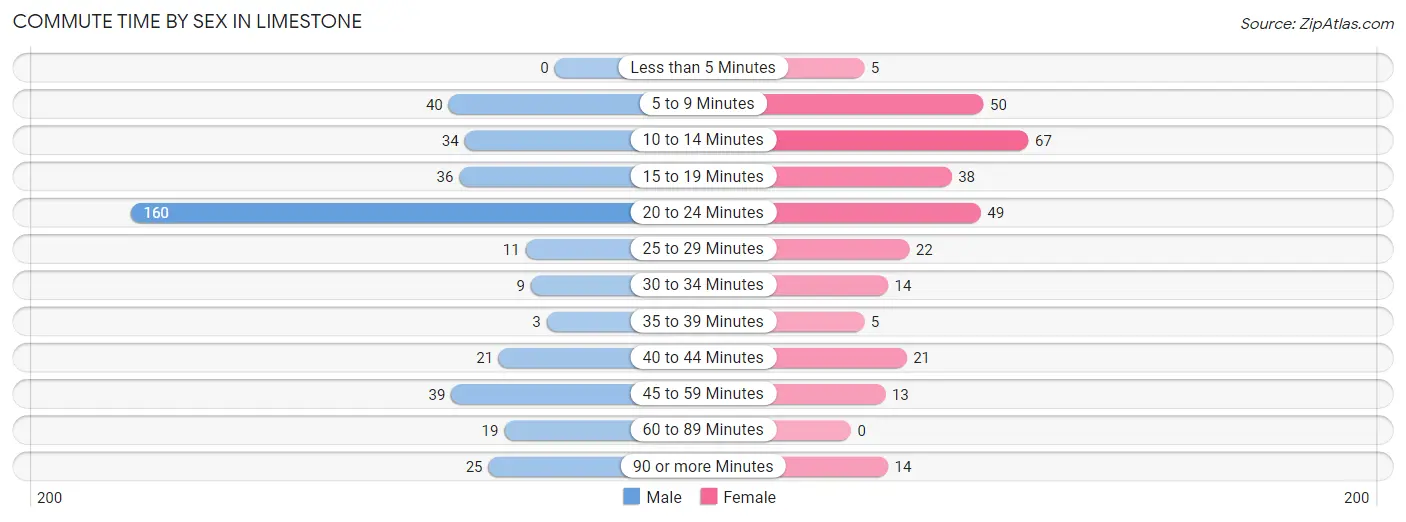
| Commute Time | Male | Female |
| Less than 5 Minutes | 0 (0.0%) | 5 (1.7%) |
| 5 to 9 Minutes | 40 (10.1%) | 50 (16.8%) |
| 10 to 14 Minutes | 34 (8.6%) | 67 (22.5%) |
| 15 to 19 Minutes | 36 (9.1%) | 38 (12.8%) |
| 20 to 24 Minutes | 160 (40.3%) | 49 (16.4%) |
| 25 to 29 Minutes | 11 (2.8%) | 22 (7.4%) |
| 30 to 34 Minutes | 9 (2.3%) | 14 (4.7%) |
| 35 to 39 Minutes | 3 (0.8%) | 5 (1.7%) |
| 40 to 44 Minutes | 21 (5.3%) | 21 (7.0%) |
| 45 to 59 Minutes | 39 (9.8%) | 13 (4.4%) |
| 60 to 89 Minutes | 19 (4.8%) | 0 (0.0%) |
| 90 or more Minutes | 25 (6.3%) | 14 (4.7%) |
Time of Departure to Work by Sex in Limestone
The most frequent times of departure to work in Limestone are 5:00 AM to 5:29 AM (117, 29.5%) for males and 7:30 AM to 7:59 AM (50, 16.8%) for females.
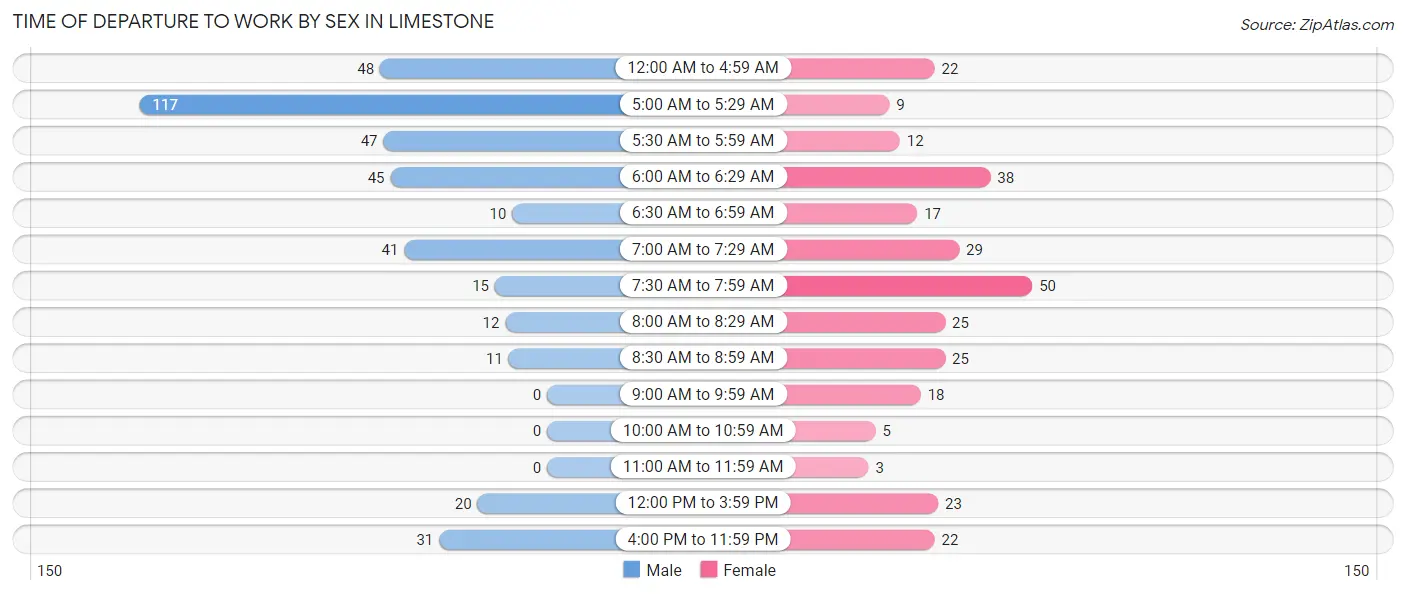
| Time of Departure | Male | Female |
| 12:00 AM to 4:59 AM | 48 (12.1%) | 22 (7.4%) |
| 5:00 AM to 5:29 AM | 117 (29.5%) | 9 (3.0%) |
| 5:30 AM to 5:59 AM | 47 (11.8%) | 12 (4.0%) |
| 6:00 AM to 6:29 AM | 45 (11.3%) | 38 (12.8%) |
| 6:30 AM to 6:59 AM | 10 (2.5%) | 17 (5.7%) |
| 7:00 AM to 7:29 AM | 41 (10.3%) | 29 (9.7%) |
| 7:30 AM to 7:59 AM | 15 (3.8%) | 50 (16.8%) |
| 8:00 AM to 8:29 AM | 12 (3.0%) | 25 (8.4%) |
| 8:30 AM to 8:59 AM | 11 (2.8%) | 25 (8.4%) |
| 9:00 AM to 9:59 AM | 0 (0.0%) | 18 (6.0%) |
| 10:00 AM to 10:59 AM | 0 (0.0%) | 5 (1.7%) |
| 11:00 AM to 11:59 AM | 0 (0.0%) | 3 (1.0%) |
| 12:00 PM to 3:59 PM | 20 (5.0%) | 23 (7.7%) |
| 4:00 PM to 11:59 PM | 31 (7.8%) | 22 (7.4%) |
| Total | 397 (100.0%) | 298 (100.0%) |
Housing Occupancy in Limestone
Occupancy by Ownership in Limestone
Of the total 593 dwellings in Limestone, owner-occupied units account for 568 (95.8%), while renter-occupied units make up 25 (4.2%).
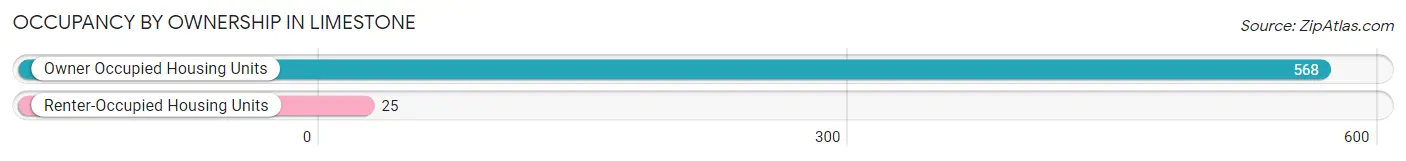
| Occupancy | # Housing Units | % Housing Units |
| Owner Occupied Housing Units | 568 | 95.8% |
| Renter-Occupied Housing Units | 25 | 4.2% |
| Total Occupied Housing Units | 593 | 100.0% |
Occupancy by Household Size in Limestone
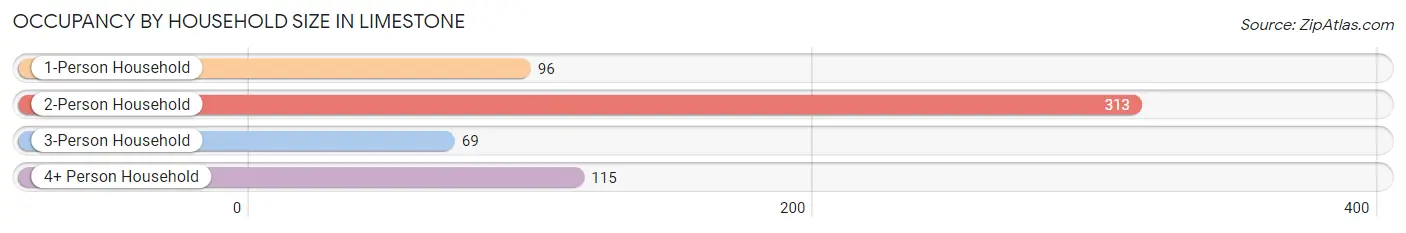
| Household Size | # Housing Units | % Housing Units |
| 1-Person Household | 96 | 16.2% |
| 2-Person Household | 313 | 52.8% |
| 3-Person Household | 69 | 11.6% |
| 4+ Person Household | 115 | 19.4% |
| Total Housing Units | 593 | 100.0% |
Occupancy by Ownership by Household Size in Limestone
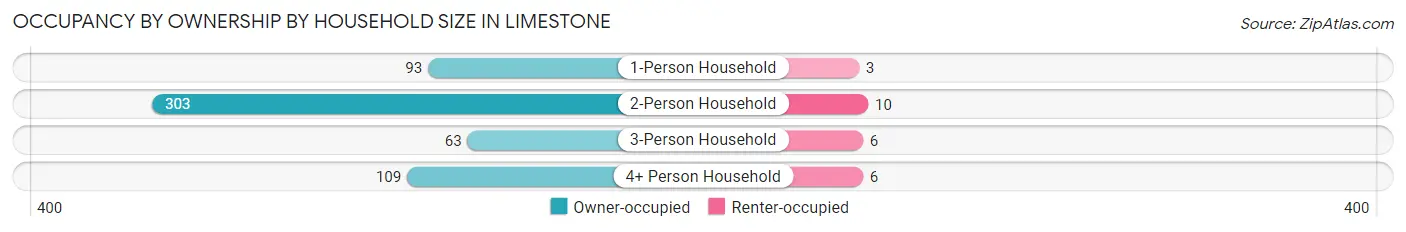
| Household Size | Owner-occupied | Renter-occupied |
| 1-Person Household | 93 (96.9%) | 3 (3.1%) |
| 2-Person Household | 303 (96.8%) | 10 (3.2%) |
| 3-Person Household | 63 (91.3%) | 6 (8.7%) |
| 4+ Person Household | 109 (94.8%) | 6 (5.2%) |
| Total Housing Units | 568 (95.8%) | 25 (4.2%) |
Occupancy by Educational Attainment in Limestone
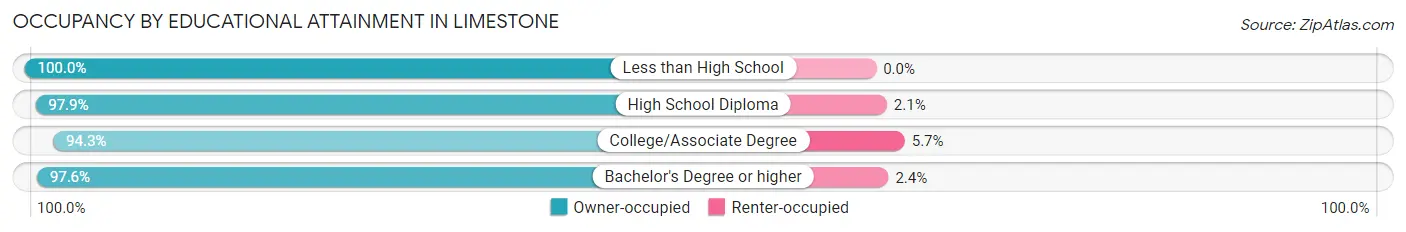
| Household Size | Owner-occupied | Renter-occupied |
| Less than High School | 17 (100.0%) | 0 (0.0%) |
| High School Diploma | 138 (97.9%) | 3 (2.1%) |
| College/Associate Degree | 333 (94.3%) | 20 (5.7%) |
| Bachelor's Degree or higher | 80 (97.6%) | 2 (2.4%) |
Occupancy by Age of Householder in Limestone
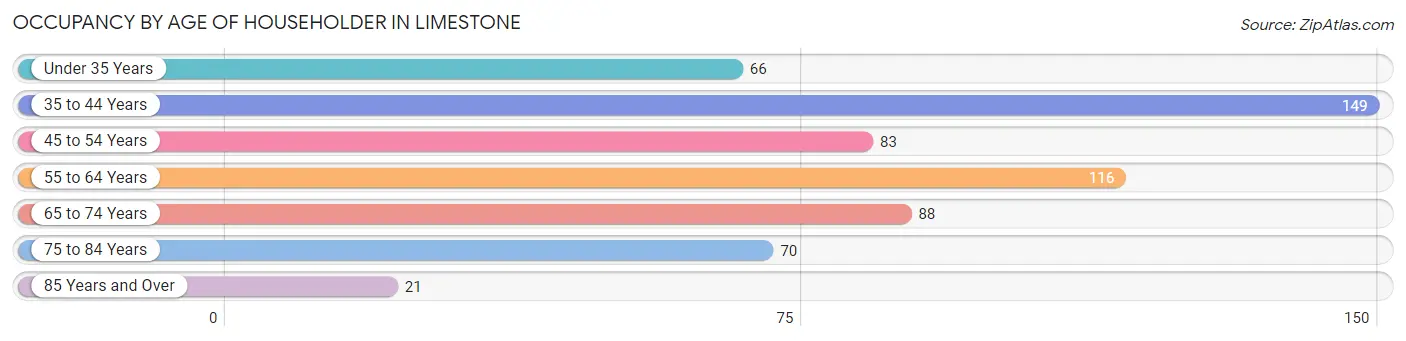
| Age Bracket | # Households | % Households |
| Under 35 Years | 66 | 11.1% |
| 35 to 44 Years | 149 | 25.1% |
| 45 to 54 Years | 83 | 14.0% |
| 55 to 64 Years | 116 | 19.6% |
| 65 to 74 Years | 88 | 14.8% |
| 75 to 84 Years | 70 | 11.8% |
| 85 Years and Over | 21 | 3.5% |
| Total | 593 | 100.0% |
Housing Finances in Limestone
Median Income by Occupancy in Limestone
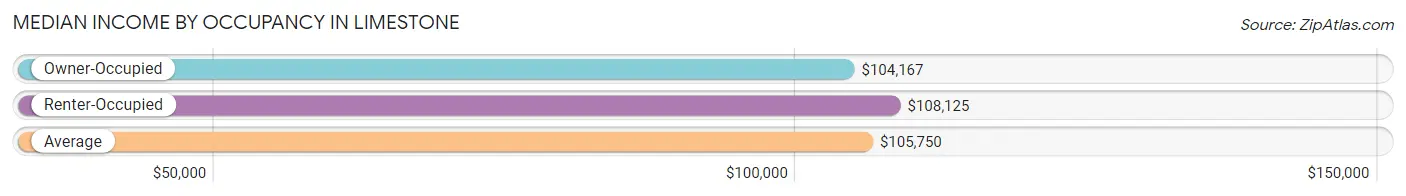
| Occupancy Type | # Households | Median Income |
| Owner-Occupied | 568 (95.8%) | $104,167 |
| Renter-Occupied | 25 (4.2%) | $108,125 |
| Average | 593 (100.0%) | $105,750 |
Occupancy by Householder Income Bracket in Limestone
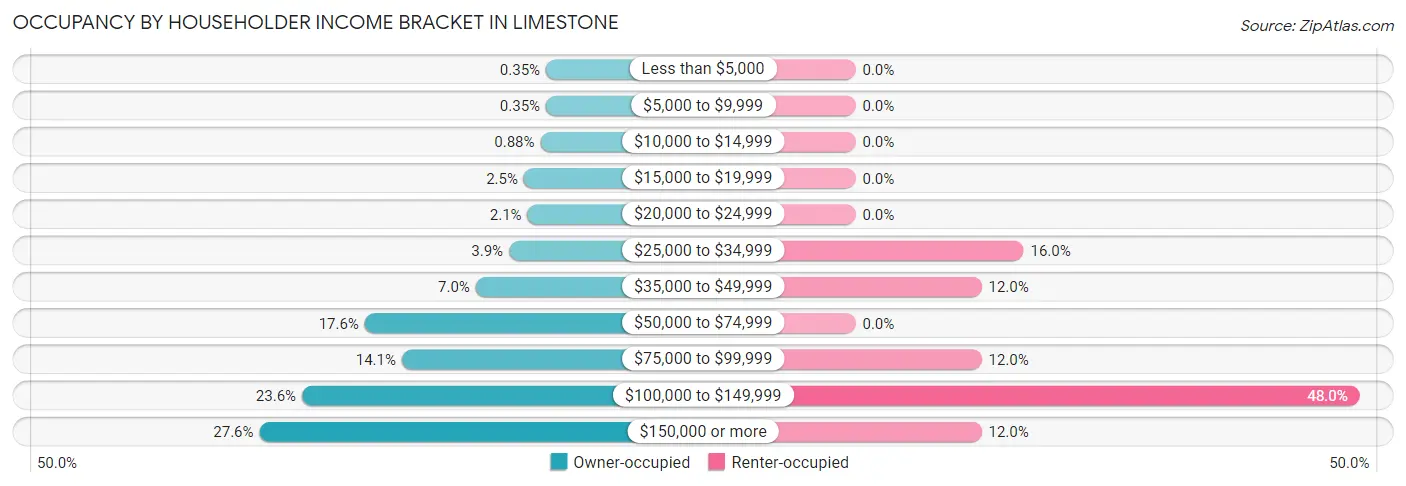
| Income Bracket | Owner-occupied | Renter-occupied |
| Less than $5,000 | 2 (0.4%) | 0 (0.0%) |
| $5,000 to $9,999 | 2 (0.4%) | 0 (0.0%) |
| $10,000 to $14,999 | 5 (0.9%) | 0 (0.0%) |
| $15,000 to $19,999 | 14 (2.5%) | 0 (0.0%) |
| $20,000 to $24,999 | 12 (2.1%) | 0 (0.0%) |
| $25,000 to $34,999 | 22 (3.9%) | 4 (16.0%) |
| $35,000 to $49,999 | 40 (7.0%) | 3 (12.0%) |
| $50,000 to $74,999 | 100 (17.6%) | 0 (0.0%) |
| $75,000 to $99,999 | 80 (14.1%) | 3 (12.0%) |
| $100,000 to $149,999 | 134 (23.6%) | 12 (48.0%) |
| $150,000 or more | 157 (27.6%) | 3 (12.0%) |
| Total | 568 (100.0%) | 25 (100.0%) |
Monthly Housing Cost Tiers in Limestone
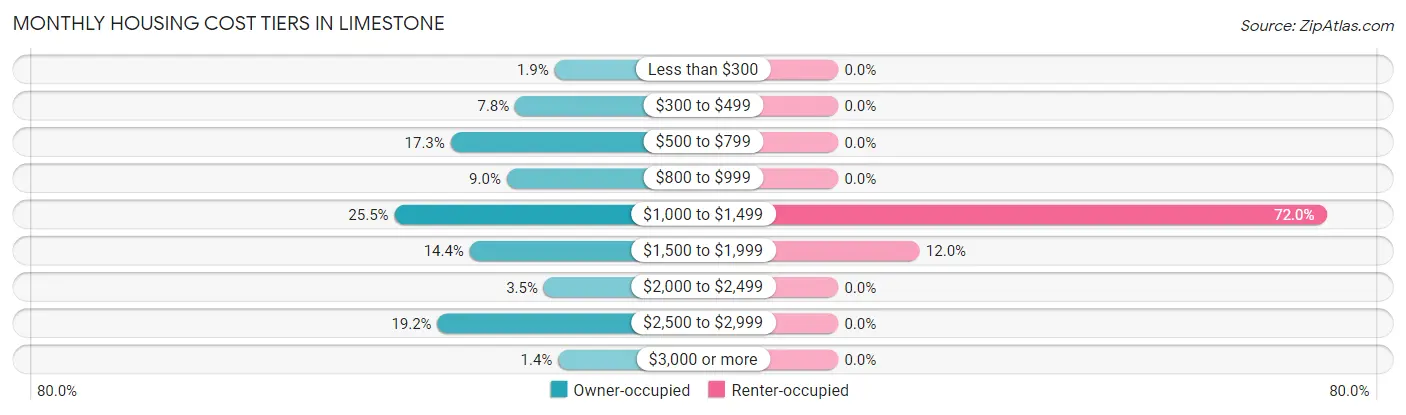
| Monthly Cost | Owner-occupied | Renter-occupied |
| Less than $300 | 11 (1.9%) | 0 (0.0%) |
| $300 to $499 | 44 (7.7%) | 0 (0.0%) |
| $500 to $799 | 98 (17.2%) | 0 (0.0%) |
| $800 to $999 | 51 (9.0%) | 0 (0.0%) |
| $1,000 to $1,499 | 145 (25.5%) | 18 (72.0%) |
| $1,500 to $1,999 | 82 (14.4%) | 3 (12.0%) |
| $2,000 to $2,499 | 20 (3.5%) | 0 (0.0%) |
| $2,500 to $2,999 | 109 (19.2%) | 0 (0.0%) |
| $3,000 or more | 8 (1.4%) | 0 (0.0%) |
| Total | 568 (100.0%) | 25 (100.0%) |
Physical Housing Characteristics in Limestone
Housing Structures in Limestone
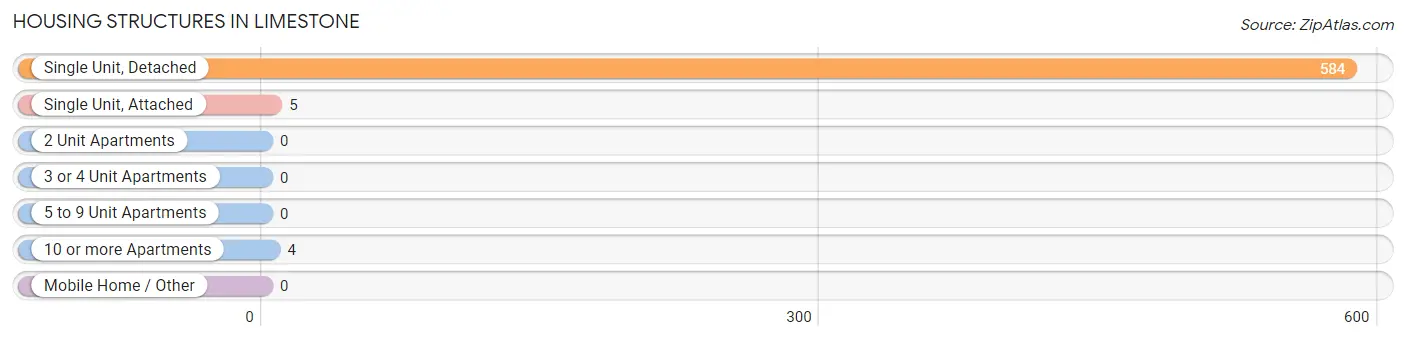
| Structure Type | # Housing Units | % Housing Units |
| Single Unit, Detached | 584 | 98.5% |
| Single Unit, Attached | 5 | 0.8% |
| 2 Unit Apartments | 0 | 0.0% |
| 3 or 4 Unit Apartments | 0 | 0.0% |
| 5 to 9 Unit Apartments | 0 | 0.0% |
| 10 or more Apartments | 4 | 0.7% |
| Mobile Home / Other | 0 | 0.0% |
| Total | 593 | 100.0% |
Housing Structures by Occupancy in Limestone
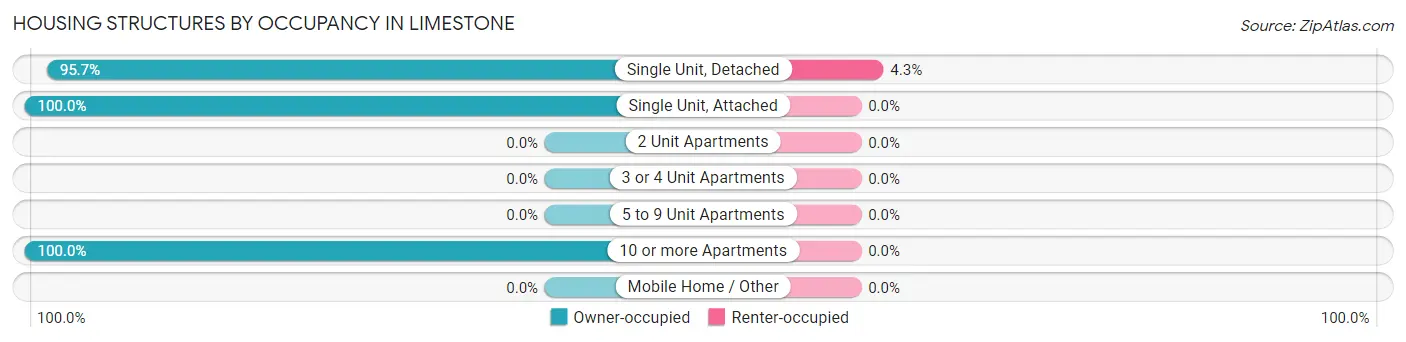
| Structure Type | Owner-occupied | Renter-occupied |
| Single Unit, Detached | 559 (95.7%) | 25 (4.3%) |
| Single Unit, Attached | 5 (100.0%) | 0 (0.0%) |
| 2 Unit Apartments | 0 (0.0%) | 0 (0.0%) |
| 3 or 4 Unit Apartments | 0 (0.0%) | 0 (0.0%) |
| 5 to 9 Unit Apartments | 0 (0.0%) | 0 (0.0%) |
| 10 or more Apartments | 4 (100.0%) | 0 (0.0%) |
| Mobile Home / Other | 0 (0.0%) | 0 (0.0%) |
| Total | 568 (95.8%) | 25 (4.2%) |
Housing Structures by Number of Rooms in Limestone
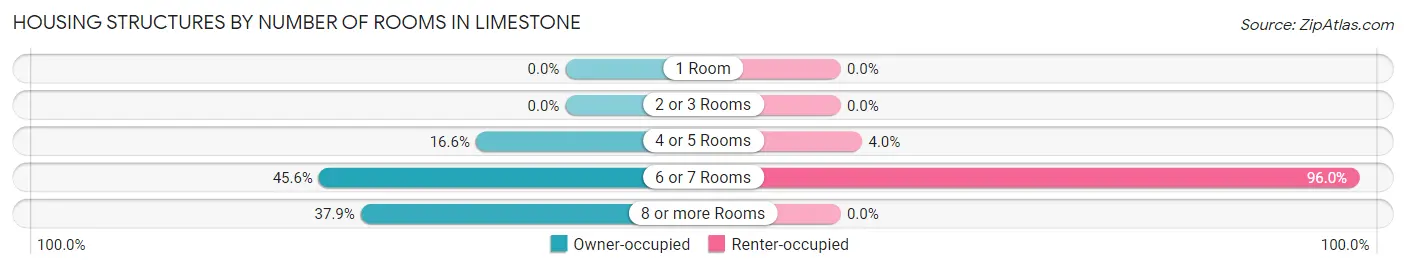
| Number of Rooms | Owner-occupied | Renter-occupied |
| 1 Room | 0 (0.0%) | 0 (0.0%) |
| 2 or 3 Rooms | 0 (0.0%) | 0 (0.0%) |
| 4 or 5 Rooms | 94 (16.6%) | 1 (4.0%) |
| 6 or 7 Rooms | 259 (45.6%) | 24 (96.0%) |
| 8 or more Rooms | 215 (37.9%) | 0 (0.0%) |
| Total | 568 (100.0%) | 25 (100.0%) |
Housing Structure by Heating Type in Limestone
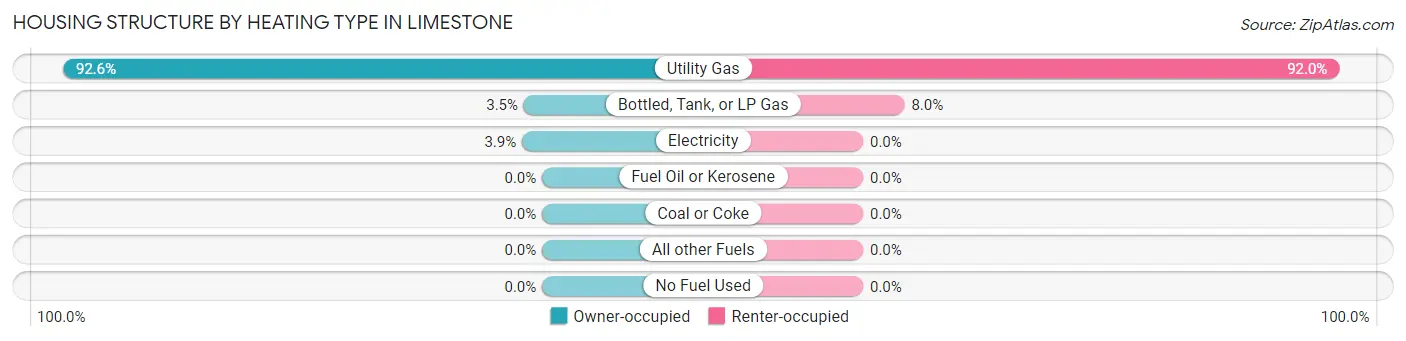
| Heating Type | Owner-occupied | Renter-occupied |
| Utility Gas | 526 (92.6%) | 23 (92.0%) |
| Bottled, Tank, or LP Gas | 20 (3.5%) | 2 (8.0%) |
| Electricity | 22 (3.9%) | 0 (0.0%) |
| Fuel Oil or Kerosene | 0 (0.0%) | 0 (0.0%) |
| Coal or Coke | 0 (0.0%) | 0 (0.0%) |
| All other Fuels | 0 (0.0%) | 0 (0.0%) |
| No Fuel Used | 0 (0.0%) | 0 (0.0%) |
| Total | 568 (100.0%) | 25 (100.0%) |
Household Vehicle Usage in Limestone
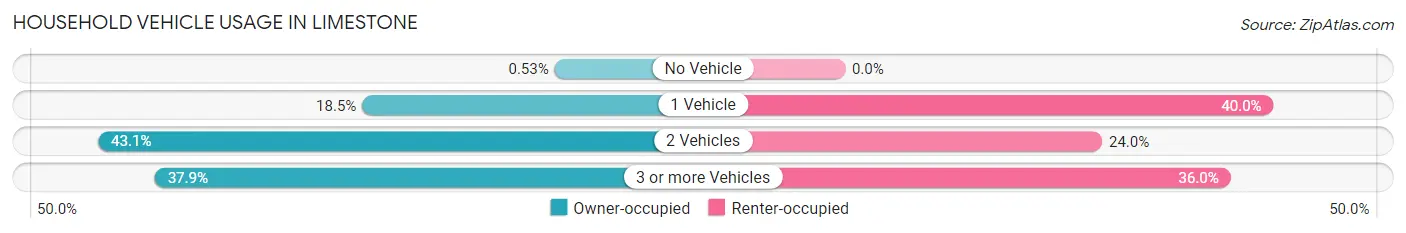
| Vehicles per Household | Owner-occupied | Renter-occupied |
| No Vehicle | 3 (0.5%) | 0 (0.0%) |
| 1 Vehicle | 105 (18.5%) | 10 (40.0%) |
| 2 Vehicles | 245 (43.1%) | 6 (24.0%) |
| 3 or more Vehicles | 215 (37.9%) | 9 (36.0%) |
| Total | 568 (100.0%) | 25 (100.0%) |
Real Estate & Mortgages in Limestone
Real Estate and Mortgage Overview in Limestone
| Characteristic | Without Mortgage | With Mortgage |
| Housing Units | 187 | 381 |
| Median Property Value | $213,900 | $192,900 |
| Median Household Income | $67,708 | $141 |
| Monthly Housing Costs | $634 | $8 |
| Real Estate Taxes | $3,574 | $3 |
Property Value by Mortgage Status in Limestone
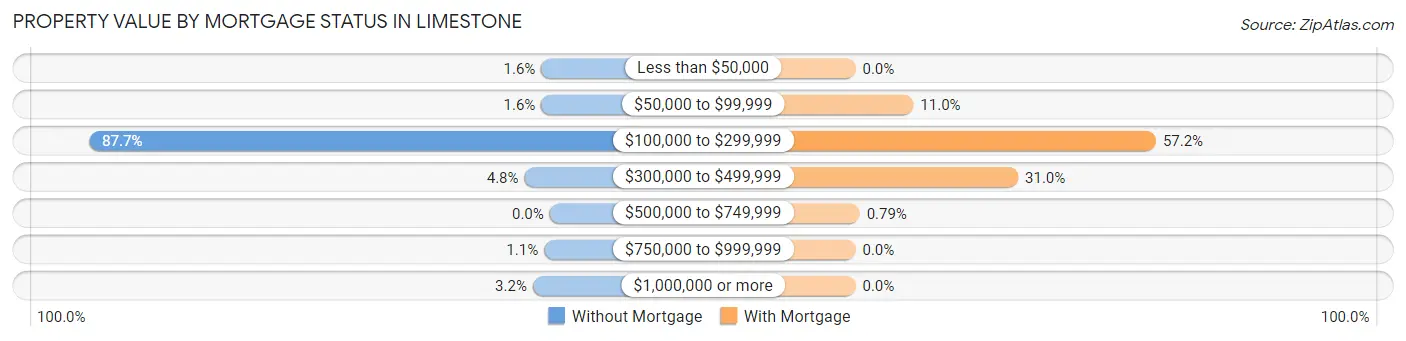
| Property Value | Without Mortgage | With Mortgage |
| Less than $50,000 | 3 (1.6%) | 0 (0.0%) |
| $50,000 to $99,999 | 3 (1.6%) | 42 (11.0%) |
| $100,000 to $299,999 | 164 (87.7%) | 218 (57.2%) |
| $300,000 to $499,999 | 9 (4.8%) | 118 (31.0%) |
| $500,000 to $749,999 | 0 (0.0%) | 3 (0.8%) |
| $750,000 to $999,999 | 2 (1.1%) | 0 (0.0%) |
| $1,000,000 or more | 6 (3.2%) | 0 (0.0%) |
| Total | 187 (100.0%) | 381 (100.0%) |
Household Income by Mortgage Status in Limestone
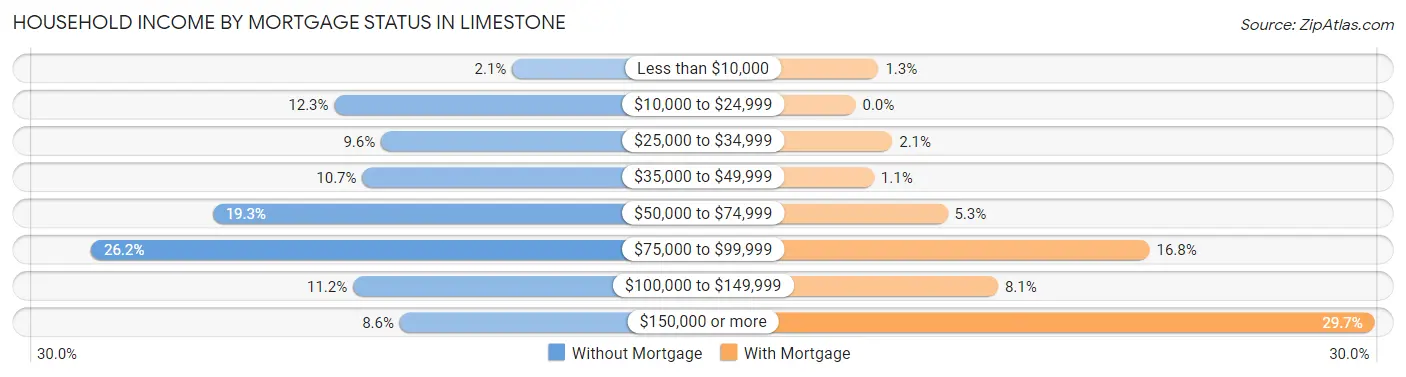
| Household Income | Without Mortgage | With Mortgage |
| Less than $10,000 | 4 (2.1%) | 5 (1.3%) |
| $10,000 to $24,999 | 23 (12.3%) | 0 (0.0%) |
| $25,000 to $34,999 | 18 (9.6%) | 8 (2.1%) |
| $35,000 to $49,999 | 20 (10.7%) | 4 (1.1%) |
| $50,000 to $74,999 | 36 (19.3%) | 20 (5.2%) |
| $75,000 to $99,999 | 49 (26.2%) | 64 (16.8%) |
| $100,000 to $149,999 | 21 (11.2%) | 31 (8.1%) |
| $150,000 or more | 16 (8.6%) | 113 (29.7%) |
| Total | 187 (100.0%) | 381 (100.0%) |
Property Value to Household Income Ratio in Limestone
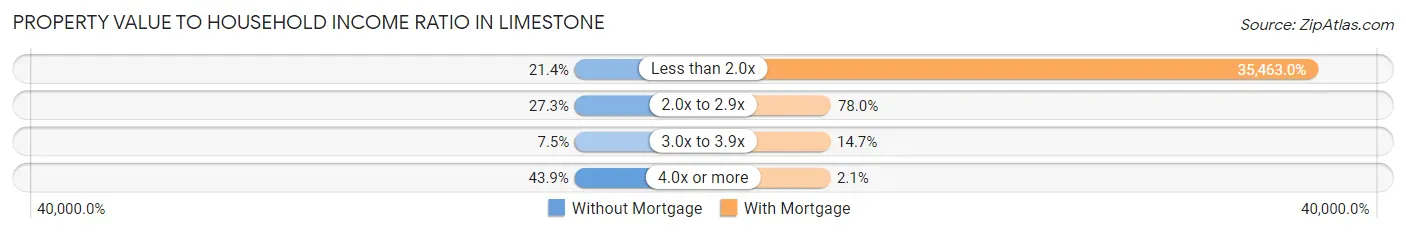
| Value-to-Income Ratio | Without Mortgage | With Mortgage |
| Less than 2.0x | 40 (21.4%) | 135,114 (35,463.0%) |
| 2.0x to 2.9x | 51 (27.3%) | 297 (77.9%) |
| 3.0x to 3.9x | 14 (7.5%) | 56 (14.7%) |
| 4.0x or more | 82 (43.9%) | 8 (2.1%) |
| Total | 187 (100.0%) | 381 (100.0%) |
Real Estate Taxes by Mortgage Status in Limestone
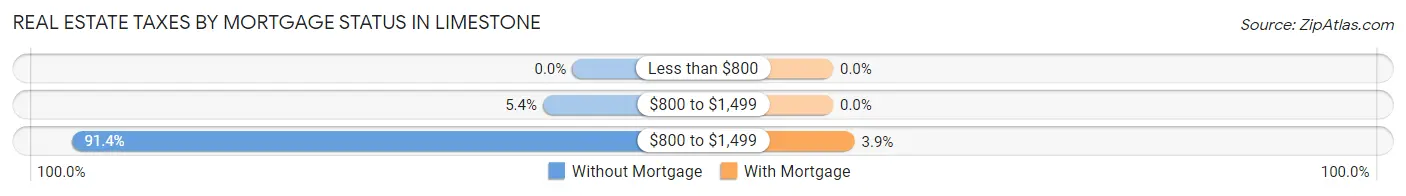
| Property Taxes | Without Mortgage | With Mortgage |
| Less than $800 | 0 (0.0%) | 0 (0.0%) |
| $800 to $1,499 | 10 (5.3%) | 0 (0.0%) |
| $800 to $1,499 | 171 (91.4%) | 15 (3.9%) |
| Total | 187 (100.0%) | 381 (100.0%) |
Health & Disability in Limestone
Health Insurance Coverage by Age in Limestone
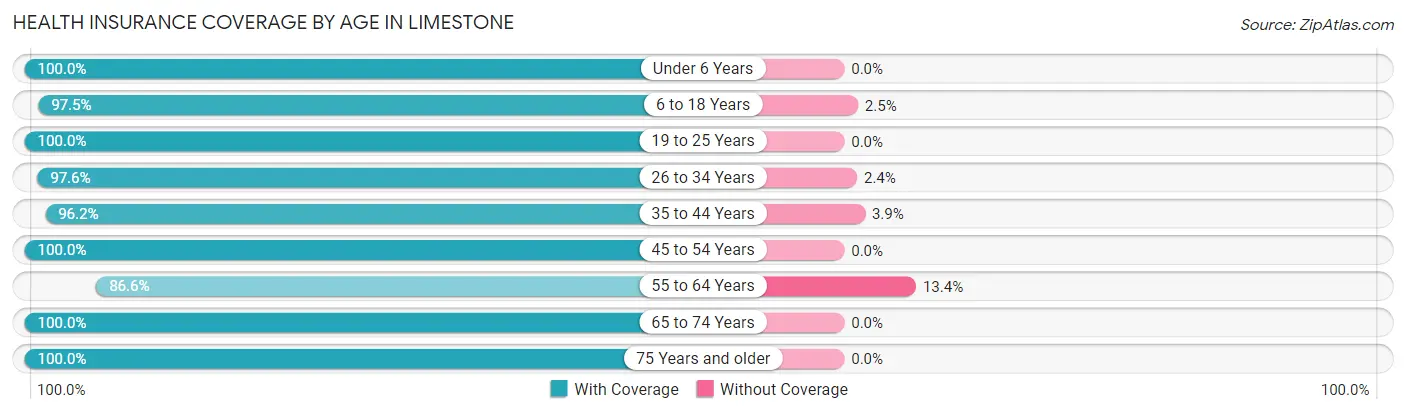
| Age Bracket | With Coverage | Without Coverage |
| Under 6 Years | 120 (100.0%) | 0 (0.0%) |
| 6 to 18 Years | 230 (97.5%) | 6 (2.5%) |
| 19 to 25 Years | 63 (100.0%) | 0 (0.0%) |
| 26 to 34 Years | 164 (97.6%) | 4 (2.4%) |
| 35 to 44 Years | 225 (96.2%) | 9 (3.8%) |
| 45 to 54 Years | 149 (100.0%) | 0 (0.0%) |
| 55 to 64 Years | 175 (86.6%) | 27 (13.4%) |
| 65 to 74 Years | 150 (100.0%) | 0 (0.0%) |
| 75 Years and older | 157 (100.0%) | 0 (0.0%) |
| Total | 1,433 (96.9%) | 46 (3.1%) |
Health Insurance Coverage by Citizenship Status in Limestone
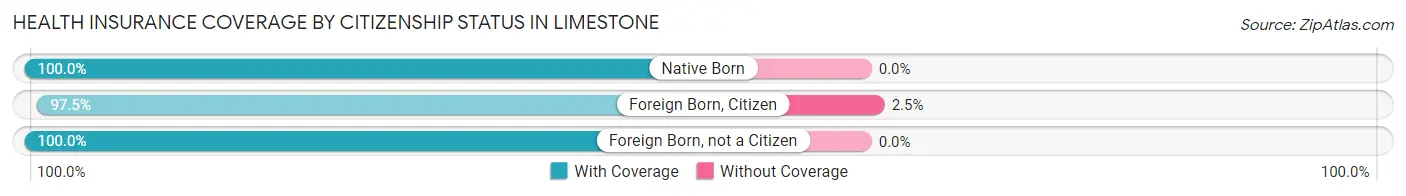
| Citizenship Status | With Coverage | Without Coverage |
| Native Born | 120 (100.0%) | 0 (0.0%) |
| Foreign Born, Citizen | 230 (97.5%) | 6 (2.5%) |
| Foreign Born, not a Citizen | 63 (100.0%) | 0 (0.0%) |
Health Insurance Coverage by Household Income in Limestone
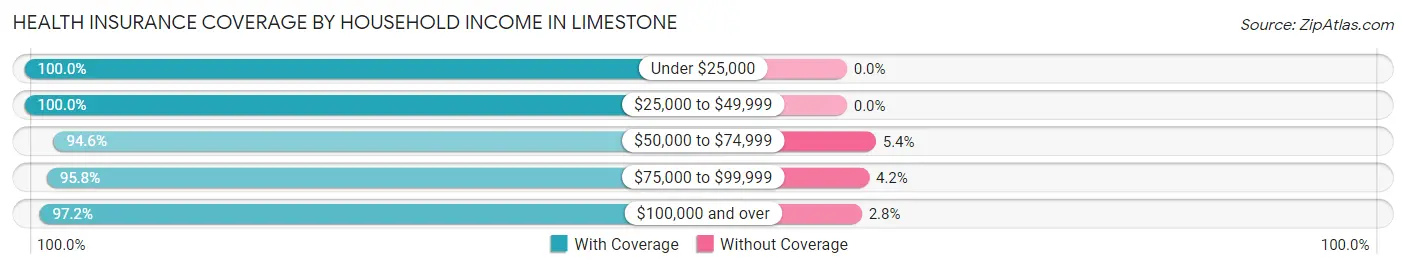
| Household Income | With Coverage | Without Coverage |
| Under $25,000 | 44 (100.0%) | 0 (0.0%) |
| $25,000 to $49,999 | 129 (100.0%) | 0 (0.0%) |
| $50,000 to $74,999 | 209 (94.6%) | 12 (5.4%) |
| $75,000 to $99,999 | 253 (95.8%) | 11 (4.2%) |
| $100,000 and over | 798 (97.2%) | 23 (2.8%) |
Public vs Private Health Insurance Coverage by Age in Limestone
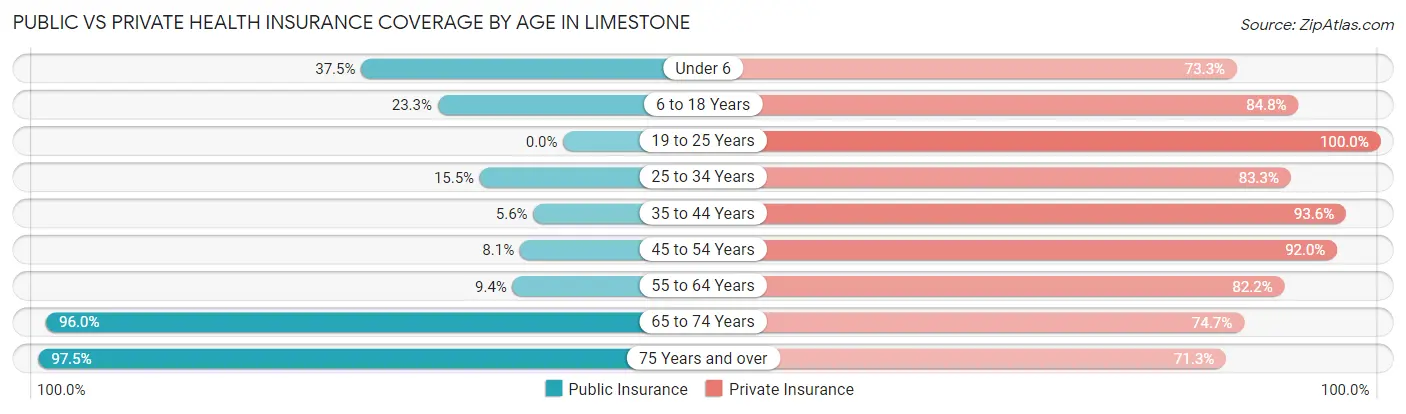
| Age Bracket | Public Insurance | Private Insurance |
| Under 6 | 45 (37.5%) | 88 (73.3%) |
| 6 to 18 Years | 55 (23.3%) | 200 (84.8%) |
| 19 to 25 Years | 0 (0.0%) | 63 (100.0%) |
| 25 to 34 Years | 26 (15.5%) | 140 (83.3%) |
| 35 to 44 Years | 13 (5.6%) | 219 (93.6%) |
| 45 to 54 Years | 12 (8.1%) | 137 (91.9%) |
| 55 to 64 Years | 19 (9.4%) | 166 (82.2%) |
| 65 to 74 Years | 144 (96.0%) | 112 (74.7%) |
| 75 Years and over | 153 (97.5%) | 112 (71.3%) |
| Total | 467 (31.6%) | 1,237 (83.6%) |
Disability Status by Sex by Age in Limestone
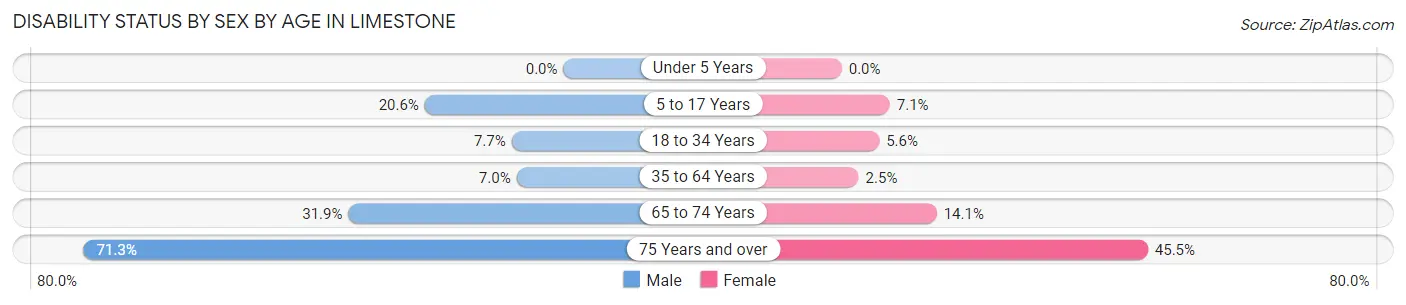
| Age Bracket | Male | Female |
| Under 5 Years | 0 (0.0%) | 0 (0.0%) |
| 5 to 17 Years | 28 (20.6%) | 8 (7.1%) |
| 18 to 34 Years | 7 (7.7%) | 8 (5.6%) |
| 35 to 64 Years | 24 (7.0%) | 6 (2.5%) |
| 65 to 74 Years | 23 (31.9%) | 11 (14.1%) |
| 75 Years and over | 57 (71.3%) | 35 (45.5%) |
Disability Class by Sex by Age in Limestone
Disability Class: Hearing Difficulty
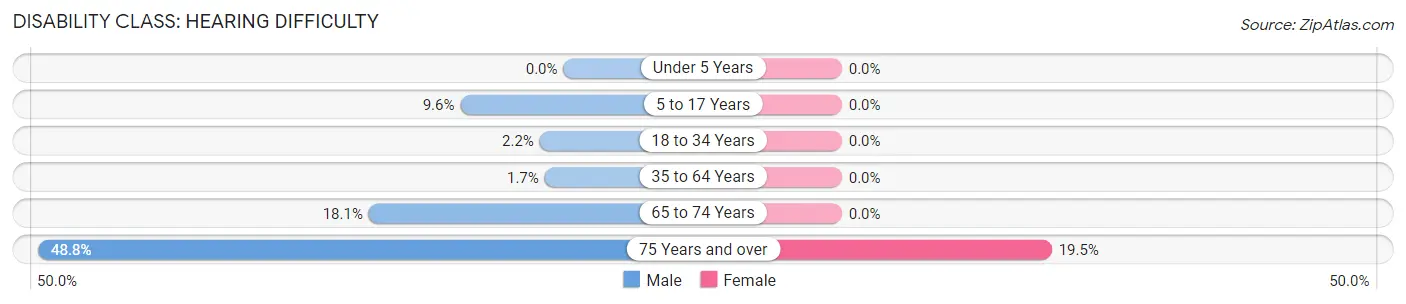
| Age Bracket | Male | Female |
| Under 5 Years | 0 (0.0%) | 0 (0.0%) |
| 5 to 17 Years | 13 (9.6%) | 0 (0.0%) |
| 18 to 34 Years | 2 (2.2%) | 0 (0.0%) |
| 35 to 64 Years | 6 (1.7%) | 0 (0.0%) |
| 65 to 74 Years | 13 (18.1%) | 0 (0.0%) |
| 75 Years and over | 39 (48.7%) | 15 (19.5%) |
Disability Class: Vision Difficulty
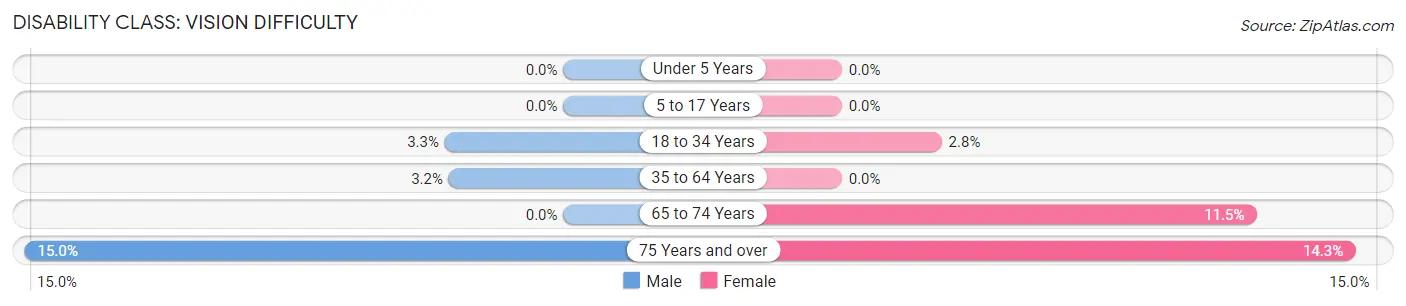
| Age Bracket | Male | Female |
| Under 5 Years | 0 (0.0%) | 0 (0.0%) |
| 5 to 17 Years | 0 (0.0%) | 0 (0.0%) |
| 18 to 34 Years | 3 (3.3%) | 4 (2.8%) |
| 35 to 64 Years | 11 (3.2%) | 0 (0.0%) |
| 65 to 74 Years | 0 (0.0%) | 9 (11.5%) |
| 75 Years and over | 12 (15.0%) | 11 (14.3%) |
Disability Class: Cognitive Difficulty
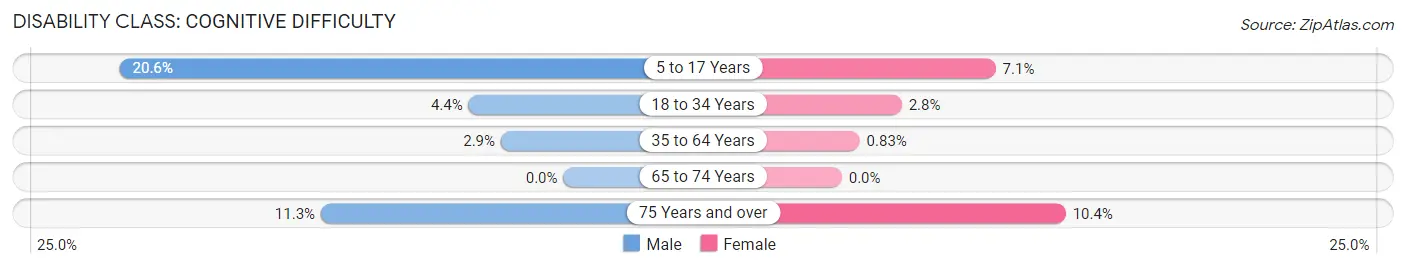
| Age Bracket | Male | Female |
| 5 to 17 Years | 28 (20.6%) | 8 (7.1%) |
| 18 to 34 Years | 4 (4.4%) | 4 (2.8%) |
| 35 to 64 Years | 10 (2.9%) | 2 (0.8%) |
| 65 to 74 Years | 0 (0.0%) | 0 (0.0%) |
| 75 Years and over | 9 (11.3%) | 8 (10.4%) |
Disability Class: Ambulatory Difficulty
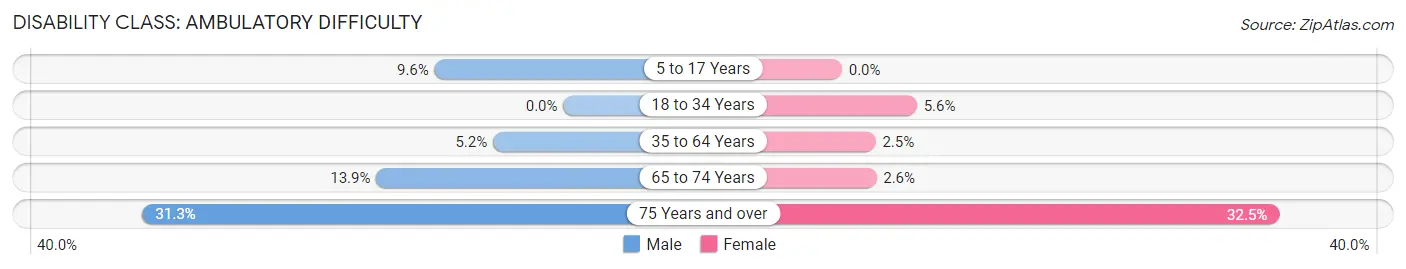
| Age Bracket | Male | Female |
| 5 to 17 Years | 13 (9.6%) | 0 (0.0%) |
| 18 to 34 Years | 0 (0.0%) | 8 (5.6%) |
| 35 to 64 Years | 18 (5.2%) | 6 (2.5%) |
| 65 to 74 Years | 10 (13.9%) | 2 (2.6%) |
| 75 Years and over | 25 (31.2%) | 25 (32.5%) |
Disability Class: Self-Care Difficulty
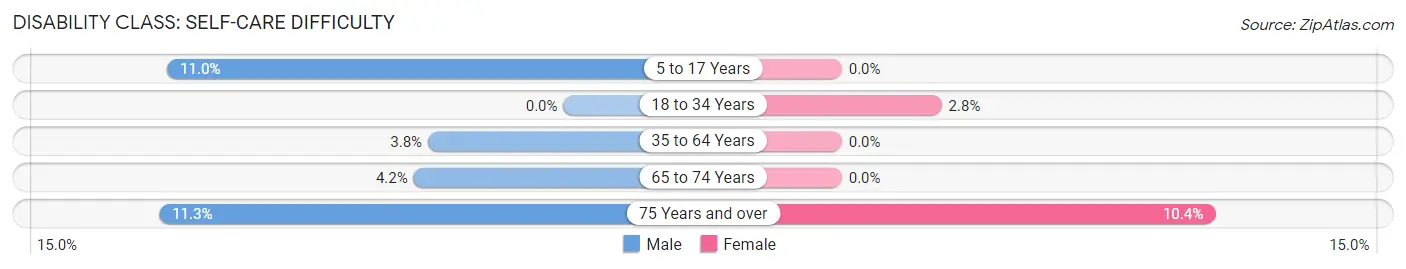
| Age Bracket | Male | Female |
| 5 to 17 Years | 15 (11.0%) | 0 (0.0%) |
| 18 to 34 Years | 0 (0.0%) | 4 (2.8%) |
| 35 to 64 Years | 13 (3.8%) | 0 (0.0%) |
| 65 to 74 Years | 3 (4.2%) | 0 (0.0%) |
| 75 Years and over | 9 (11.3%) | 8 (10.4%) |
Technology Access in Limestone
Computing Device Access in Limestone
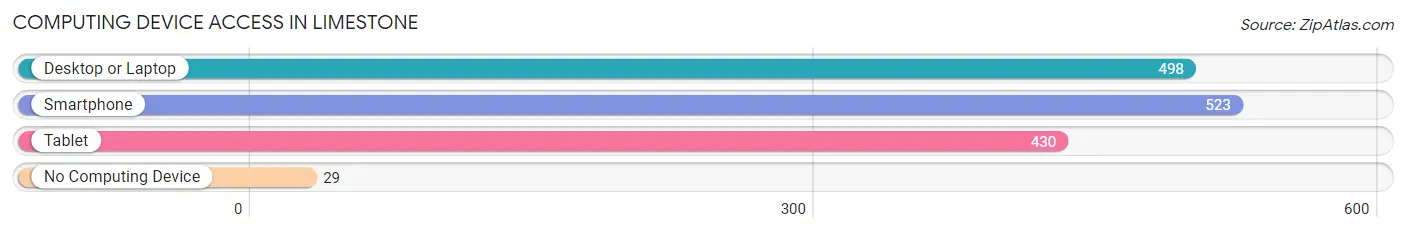
| Device Type | # Households | % Households |
| Desktop or Laptop | 498 | 84.0% |
| Smartphone | 523 | 88.2% |
| Tablet | 430 | 72.5% |
| No Computing Device | 29 | 4.9% |
| Total | 593 | 100.0% |
Internet Access in Limestone
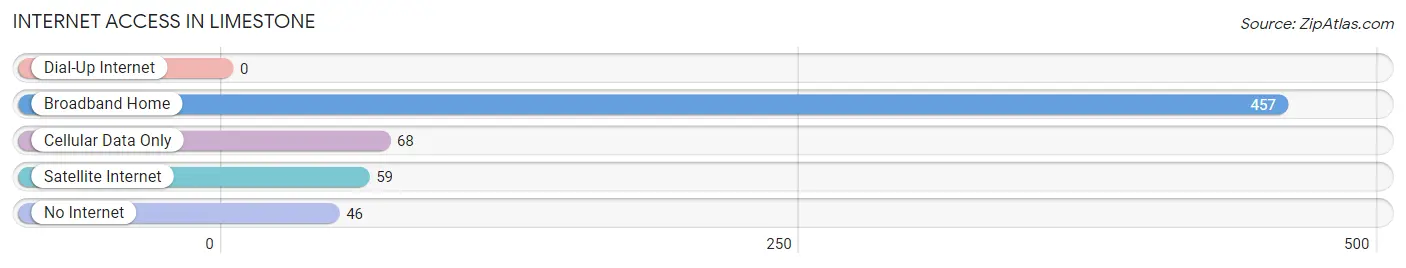
| Internet Type | # Households | % Households |
| Dial-Up Internet | 0 | 0.0% |
| Broadband Home | 457 | 77.1% |
| Cellular Data Only | 68 | 11.5% |
| Satellite Internet | 59 | 10.0% |
| No Internet | 46 | 7.8% |
| Total | 593 | 100.0% |
Limestone Summary
Limestone, Illinois is a small village located in LaSalle County, Illinois. It is situated on the banks of the Vermilion River, approximately 25 miles south of the city of Chicago. The village has a population of approximately 1,000 people and is part of the Ottawa-Streator Micropolitan Statistical Area.
History
The area that is now Limestone was first settled in the early 1800s by French-Canadian fur traders. The village was originally known as “La Prairie” and was later renamed “Limestone” in 1837. The name was chosen to reflect the abundance of limestone in the area, which was used to build many of the early homes and businesses.
In 1845, the first post office was established in Limestone and the village was officially incorporated in 1856. During the late 19th century, the village experienced a period of growth and development, with the construction of a railroad line and the opening of several businesses.
In the early 20th century, Limestone was a thriving agricultural community, with many of the residents working in the local farms and orchards. The village also had a thriving brick-making industry, which provided employment for many of the local residents.
Geography
Limestone is located in LaSalle County, Illinois, approximately 25 miles south of the city of Chicago. The village is situated on the banks of the Vermilion River and is surrounded by rolling hills and farmland. The village has a total area of 0.7 square miles, all of which is land.
Economy
The economy of Limestone is largely based on agriculture and tourism. The village is home to several farms and orchards, which produce a variety of fruits and vegetables. The village also has a thriving tourism industry, with many visitors coming to the area to enjoy the natural beauty of the Vermilion River and the surrounding countryside.
In addition to agriculture and tourism, Limestone also has a small manufacturing sector. The village is home to several small businesses, including a furniture factory, a printing company, and a metal fabrication shop.
Demographics
As of the 2010 census, the population of Limestone was 1,000 people. The racial makeup of the village was 97.2% White, 0.7% African American, 0.3% Native American, 0.2% Asian, and 1.6% from other races. The median household income was $45,000 and the median family income was $50,000.
Conclusion
Limestone, Illinois is a small village located in LaSalle County, Illinois. It is situated on the banks of the Vermilion River and has a population of approximately 1,000 people. The village has a long history, dating back to the early 1800s, and has a thriving economy based on agriculture and tourism. The village is also home to several small businesses and has a diverse population.
Common Questions
What is the Total Population of Limestone?
Total Population of Limestone is 1,479.
What is the Total Male Population of Limestone?
Total Male Population of Limestone is 759.
What is the Total Female Population of Limestone?
Total Female Population of Limestone is 720.
What is the Ratio of Males per 100 Females in Limestone?
There are 105.42 Males per 100 Females in Limestone.
What is the Ratio of Females per 100 Males in Limestone?
There are 94.86 Females per 100 Males in Limestone.
What is the Median Population Age in Limestone?
Median Population Age in Limestone is 39.4 Years.
What is the Average Family Size in Limestone
Average Family Size in Limestone is 2.7 People.
What is the Average Household Size in Limestone
Average Household Size in Limestone is 2.5 People.
What is Per Capita Income in Limestone?
Per Capita income in Limestone is $49,629.
What is the Median Family Income in Limestone?
Median Family Income in Limestone is $115,781.
What is the Median Household income in Limestone?
Median Household Income in Limestone is $105,750.
What is Income or Wage Gap in Limestone?
Income or Wage Gap in Limestone is 47.7%.
Women in Limestone earn 52.3 cents for every dollar earned by a man.
What is Inequality or Gini Index in Limestone?
Inequality or Gini Index in Limestone is 0.44.
How Large is the Labor Force in Limestone?
There are 816 People in the Labor Forcein in Limestone.
What is the Percentage of People in the Labor Force in Limestone?
68.9% of People are in the Labor Force in Limestone.
What is the Unemployment Rate in Limestone?
Unemployment Rate in Limestone is 5.8%.