Cities with the Most Immigrants from Bolivia in Florida
RELATED REPORTS & OPTIONS
Bolivia
Florida
Compare Cities
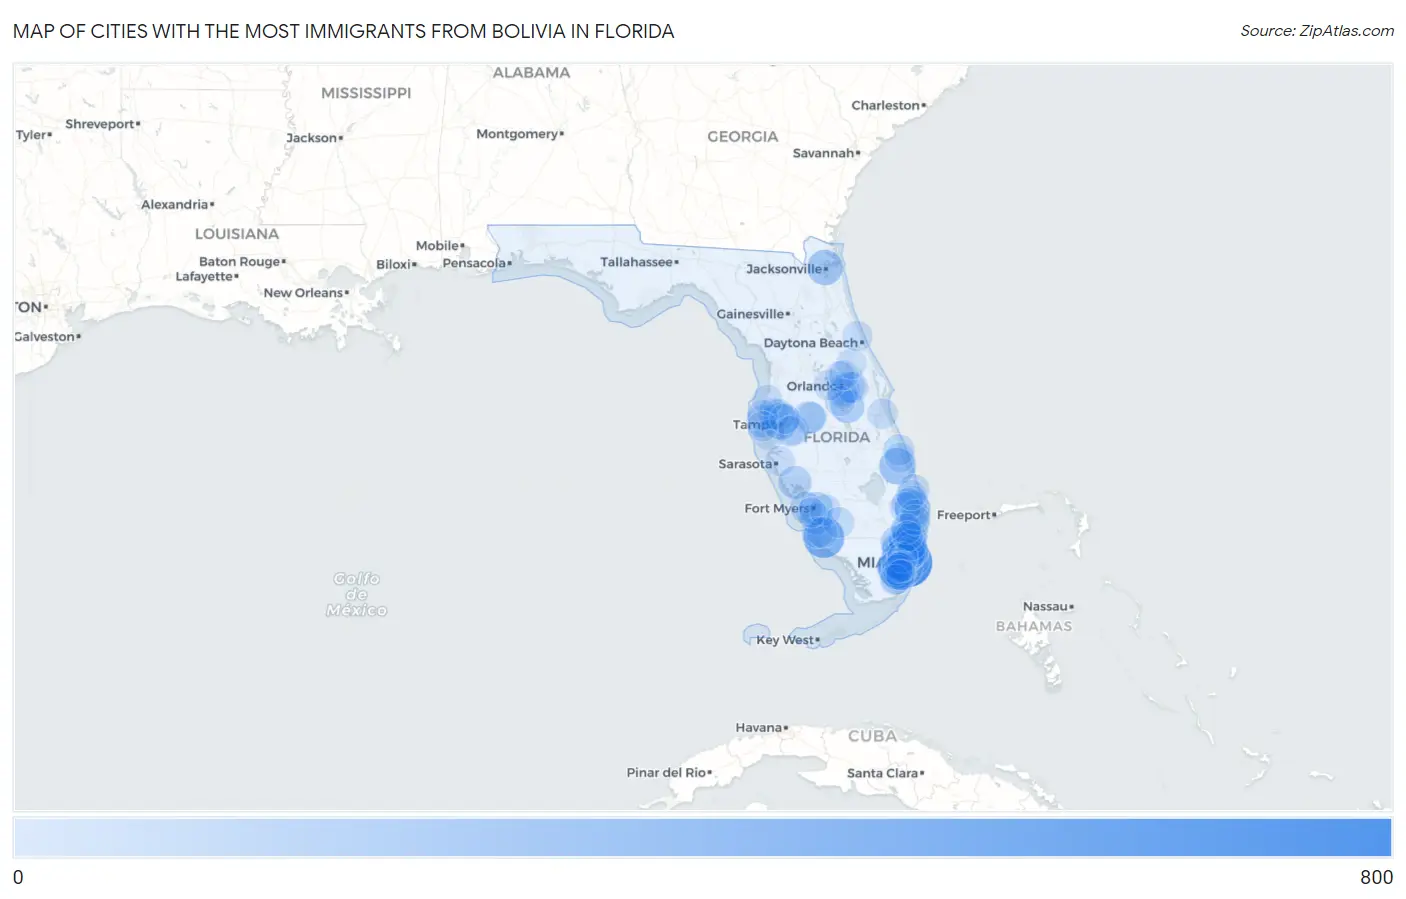
Map of Cities with the Most Immigrants from Bolivia in Florida
0
800
Cities with the Most Immigrants from Bolivia in Florida
| City | Bolivia | vs State | vs National | |
| 1. | Miami | 785 | 10,861(7.23%)#1 | 80,173(0.98%)#12 |
| 2. | Kendall | 452 | 10,861(4.16%)#2 | 80,173(0.56%)#21 |
| 3. | Golden Gate | 436 | 10,861(4.01%)#3 | 80,173(0.54%)#22 |
| 4. | Miramar | 333 | 10,861(3.07%)#4 | 80,173(0.42%)#31 |
| 5. | Doral | 321 | 10,861(2.96%)#5 | 80,173(0.40%)#33 |
| 6. | Port St Lucie | 261 | 10,861(2.40%)#6 | 80,173(0.33%)#47 |
| 7. | Tampa | 254 | 10,861(2.34%)#7 | 80,173(0.32%)#48 |
| 8. | Greenacres | 246 | 10,861(2.26%)#8 | 80,173(0.31%)#50 |
| 9. | Fountainebleau | 241 | 10,861(2.22%)#9 | 80,173(0.30%)#53 |
| 10. | Jacksonville | 222 | 10,861(2.04%)#10 | 80,173(0.28%)#59 |
| 11. | The Hammocks | 213 | 10,861(1.96%)#11 | 80,173(0.27%)#61 |
| 12. | Kendall West | 180 | 10,861(1.66%)#12 | 80,173(0.22%)#78 |
| 13. | St Cloud | 151 | 10,861(1.39%)#13 | 80,173(0.19%)#95 |
| 14. | Weston | 150 | 10,861(1.38%)#14 | 80,173(0.19%)#97 |
| 15. | Fort Myers | 144 | 10,861(1.33%)#15 | 80,173(0.18%)#103 |
| 16. | Miami Beach | 144 | 10,861(1.33%)#16 | 80,173(0.18%)#104 |
| 17. | Hollywood | 140 | 10,861(1.29%)#17 | 80,173(0.17%)#107 |
| 18. | North Port | 131 | 10,861(1.21%)#18 | 80,173(0.16%)#115 |
| 19. | Princeton | 117 | 10,861(1.08%)#19 | 80,173(0.15%)#125 |
| 20. | North Bay Village | 116 | 10,861(1.07%)#20 | 80,173(0.14%)#127 |
| 21. | Lakeland | 111 | 10,861(1.02%)#21 | 80,173(0.14%)#131 |
| 22. | Coral Gables | 107 | 10,861(0.99%)#22 | 80,173(0.13%)#142 |
| 23. | Fort Lauderdale | 106 | 10,861(0.98%)#23 | 80,173(0.13%)#143 |
| 24. | Clearwater | 104 | 10,861(0.96%)#24 | 80,173(0.13%)#147 |
| 25. | Aventura | 97 | 10,861(0.89%)#25 | 80,173(0.12%)#156 |
| 26. | Margate | 88 | 10,861(0.81%)#26 | 80,173(0.11%)#165 |
| 27. | Davie | 86 | 10,861(0.79%)#27 | 80,173(0.11%)#173 |
| 28. | San Carlos Park | 85 | 10,861(0.78%)#28 | 80,173(0.11%)#178 |
| 29. | Cape Coral | 83 | 10,861(0.76%)#29 | 80,173(0.10%)#185 |
| 30. | Orlando | 81 | 10,861(0.75%)#30 | 80,173(0.10%)#192 |
| 31. | Golden Glades | 76 | 10,861(0.70%)#31 | 80,173(0.09%)#202 |
| 32. | Rio Pinar | 76 | 10,861(0.70%)#32 | 80,173(0.09%)#204 |
| 33. | Pembroke Pines | 66 | 10,861(0.61%)#33 | 80,173(0.08%)#230 |
| 34. | Alafaya | 64 | 10,861(0.59%)#34 | 80,173(0.08%)#240 |
| 35. | Jupiter | 60 | 10,861(0.55%)#35 | 80,173(0.07%)#251 |
| 36. | Lake Magdalene | 58 | 10,861(0.53%)#36 | 80,173(0.07%)#261 |
| 37. | Lakewood Park | 58 | 10,861(0.53%)#37 | 80,173(0.07%)#262 |
| 38. | Pompano Beach | 57 | 10,861(0.52%)#38 | 80,173(0.07%)#264 |
| 39. | Coral Springs | 56 | 10,861(0.52%)#39 | 80,173(0.07%)#272 |
| 40. | South Miami | 55 | 10,861(0.51%)#40 | 80,173(0.07%)#278 |
| 41. | Naples Park | 55 | 10,861(0.51%)#41 | 80,173(0.07%)#279 |
| 42. | West Little River | 54 | 10,861(0.50%)#42 | 80,173(0.07%)#282 |
| 43. | Keystone | 53 | 10,861(0.49%)#43 | 80,173(0.07%)#285 |
| 44. | Ives Estates | 52 | 10,861(0.48%)#44 | 80,173(0.06%)#290 |
| 45. | Sunrise | 51 | 10,861(0.47%)#45 | 80,173(0.06%)#292 |
| 46. | Goulds | 51 | 10,861(0.47%)#46 | 80,173(0.06%)#294 |
| 47. | Lehigh Acres | 50 | 10,861(0.46%)#47 | 80,173(0.06%)#298 |
| 48. | Boca Raton | 49 | 10,861(0.45%)#48 | 80,173(0.06%)#303 |
| 49. | Royal Palm Beach | 48 | 10,861(0.44%)#49 | 80,173(0.06%)#312 |
| 50. | West Palm Beach | 47 | 10,861(0.43%)#50 | 80,173(0.06%)#316 |
| 51. | Country Club | 44 | 10,861(0.41%)#51 | 80,173(0.05%)#329 |
| 52. | Hallandale Beach | 42 | 10,861(0.39%)#52 | 80,173(0.05%)#338 |
| 53. | Immokalee | 42 | 10,861(0.39%)#53 | 80,173(0.05%)#339 |
| 54. | Palmetto Estates | 42 | 10,861(0.39%)#54 | 80,173(0.05%)#340 |
| 55. | Ave Maria | 40 | 10,861(0.37%)#55 | 80,173(0.05%)#351 |
| 56. | Oakland Park | 39 | 10,861(0.36%)#56 | 80,173(0.05%)#356 |
| 57. | Glenvar Heights | 39 | 10,861(0.36%)#57 | 80,173(0.05%)#357 |
| 58. | St Petersburg | 38 | 10,861(0.35%)#58 | 80,173(0.05%)#360 |
| 59. | North Miami | 38 | 10,861(0.35%)#59 | 80,173(0.05%)#366 |
| 60. | Richmond West | 38 | 10,861(0.35%)#60 | 80,173(0.05%)#367 |
| 61. | Wellington | 36 | 10,861(0.33%)#61 | 80,173(0.04%)#386 |
| 62. | Westchester | 36 | 10,861(0.33%)#62 | 80,173(0.04%)#387 |
| 63. | Sunny Isles Beach | 36 | 10,861(0.33%)#63 | 80,173(0.04%)#389 |
| 64. | Tamiami | 35 | 10,861(0.32%)#64 | 80,173(0.04%)#392 |
| 65. | Fish Hawk | 35 | 10,861(0.32%)#65 | 80,173(0.04%)#395 |
| 66. | University Cdp Hillsborough County | 34 | 10,861(0.31%)#66 | 80,173(0.04%)#399 |
| 67. | Olympia Heights | 34 | 10,861(0.31%)#67 | 80,173(0.04%)#402 |
| 68. | Combee Settlement | 34 | 10,861(0.31%)#68 | 80,173(0.04%)#403 |
| 69. | Dania Beach | 33 | 10,861(0.30%)#69 | 80,173(0.04%)#407 |
| 70. | Palm Harbor | 31 | 10,861(0.29%)#70 | 80,173(0.04%)#421 |
| 71. | Kendale Lakes | 31 | 10,861(0.29%)#71 | 80,173(0.04%)#422 |
| 72. | South Miami Heights | 31 | 10,861(0.29%)#72 | 80,173(0.04%)#424 |
| 73. | Deltona | 30 | 10,861(0.28%)#73 | 80,173(0.04%)#429 |
| 74. | The Crossings | 30 | 10,861(0.28%)#74 | 80,173(0.04%)#434 |
| 75. | Bayonet Point | 29 | 10,861(0.27%)#75 | 80,173(0.04%)#441 |
| 76. | Palmer Ranch | 29 | 10,861(0.27%)#76 | 80,173(0.04%)#444 |
| 77. | Taft | 29 | 10,861(0.27%)#77 | 80,173(0.04%)#447 |
| 78. | Melbourne | 28 | 10,861(0.26%)#78 | 80,173(0.03%)#449 |
| 79. | Winter Garden | 28 | 10,861(0.26%)#79 | 80,173(0.03%)#452 |
| 80. | Boynton Beach | 27 | 10,861(0.25%)#80 | 80,173(0.03%)#458 |
| 81. | Delray Beach | 25 | 10,861(0.23%)#81 | 80,173(0.03%)#488 |
| 82. | Parkland | 25 | 10,861(0.23%)#82 | 80,173(0.03%)#489 |
| 83. | Wekiwa Springs | 25 | 10,861(0.23%)#83 | 80,173(0.03%)#491 |
| 84. | Hialeah | 24 | 10,861(0.22%)#84 | 80,173(0.03%)#499 |
| 85. | Ormond Beach | 24 | 10,861(0.22%)#85 | 80,173(0.03%)#505 |
| 86. | Riverview | 23 | 10,861(0.21%)#86 | 80,173(0.03%)#517 |
| 87. | Temple Terrace | 23 | 10,861(0.21%)#87 | 80,173(0.03%)#525 |
| 88. | Leisure City | 22 | 10,861(0.20%)#88 | 80,173(0.03%)#542 |
| 89. | Island Walk | 22 | 10,861(0.20%)#89 | 80,173(0.03%)#546 |
| 90. | Largo | 19 | 10,861(0.17%)#90 | 80,173(0.02%)#582 |
| 91. | Kissimmee | 19 | 10,861(0.17%)#91 | 80,173(0.02%)#583 |
| 92. | Longwood | 19 | 10,861(0.17%)#92 | 80,173(0.02%)#595 |
| 93. | Sunset | 19 | 10,861(0.17%)#93 | 80,173(0.02%)#596 |
| 94. | The Meadows | 19 | 10,861(0.17%)#94 | 80,173(0.02%)#602 |
| 95. | Palm Beach Gardens | 18 | 10,861(0.17%)#95 | 80,173(0.02%)#609 |
| 96. | Cutler Bay | 18 | 10,861(0.17%)#96 | 80,173(0.02%)#610 |
| 97. | Liberty Triangle | 18 | 10,861(0.17%)#97 | 80,173(0.02%)#613 |
| 98. | Mcgregor | 18 | 10,861(0.17%)#98 | 80,173(0.02%)#617 |
| 99. | Tamarac | 16 | 10,861(0.15%)#99 | 80,173(0.02%)#641 |
| 100. | Fort Pierce | 15 | 10,861(0.14%)#100 | 80,173(0.02%)#665 |
Common Questions
What are the Top 10 Cities with the Most Immigrants from Bolivia in Florida?
Top 10 Cities with the Most Immigrants from Bolivia in Florida are:
#1
785
#2
452
#3
436
#4
333
#5
321
#6
261
#7
254
#8
246
#9
241
#10
222
What city has the Most Immigrants from Bolivia in Florida?
Miami has the Most Immigrants from Bolivia in Florida with 785.
What is the Total Immigrants from Bolivia in the State of Florida?
Total Immigrants from Bolivia in Florida is 10,861.
What is the Total Immigrants from Bolivia in the United States?
Total Immigrants from Bolivia in the United States is 80,173.