Winnebago County, IL
Winnebago County Map
Winnebago County Overview
284,591
TOTAL POPULATION
139,697
MALE POPULATION
144,894
FEMALE POPULATION
96.41
MALES / 100 FEMALES
103.72
FEMALES / 100 MALES
39.5
MEDIAN AGE
3.0
AVG FAMILY SIZE
2.4
AVG HOUSEHOLD SIZE
$33,474
PER CAPITA INCOME
$78,158
AVG FAMILY INCOME
$61,738
AVG HOUSEHOLD INCOME
31.1%
WAGE / INCOME GAP [ % ]
68.9¢/ $1
WAGE / INCOME GAP [ $ ]
$11,951
FAMILY INCOME DEFICIT
0.45
INEQUALITY / GINI INDEX
140,441
LABOR FORCE [ PEOPLE ]
62.2%
PERCENT IN LABOR FORCE
7.5%
UNEMPLOYMENT RATE
Race in Winnebago County
The most populous races in Winnebago County are White / Caucasian (204,108 | 71.7%), Hispanic or Latino (40,052 | 14.1%), and Black / African American (38,111 | 13.4%).

| Race | # Population | % Population |
| Asian | 8,163 | 2.9% |
| Black / African American | 38,111 | 13.4% |
| Hawaiian / Pacific | 102 | 0.0% |
| Hispanic or Latino | 40,052 | 14.1% |
| Native / Alaskan | 834 | 0.3% |
| White / Caucasian | 204,108 | 71.7% |
| Two or more Races | 21,720 | 7.6% |
| Some other Race | 11,553 | 4.1% |
| Total | 284,591 | 100.0% |
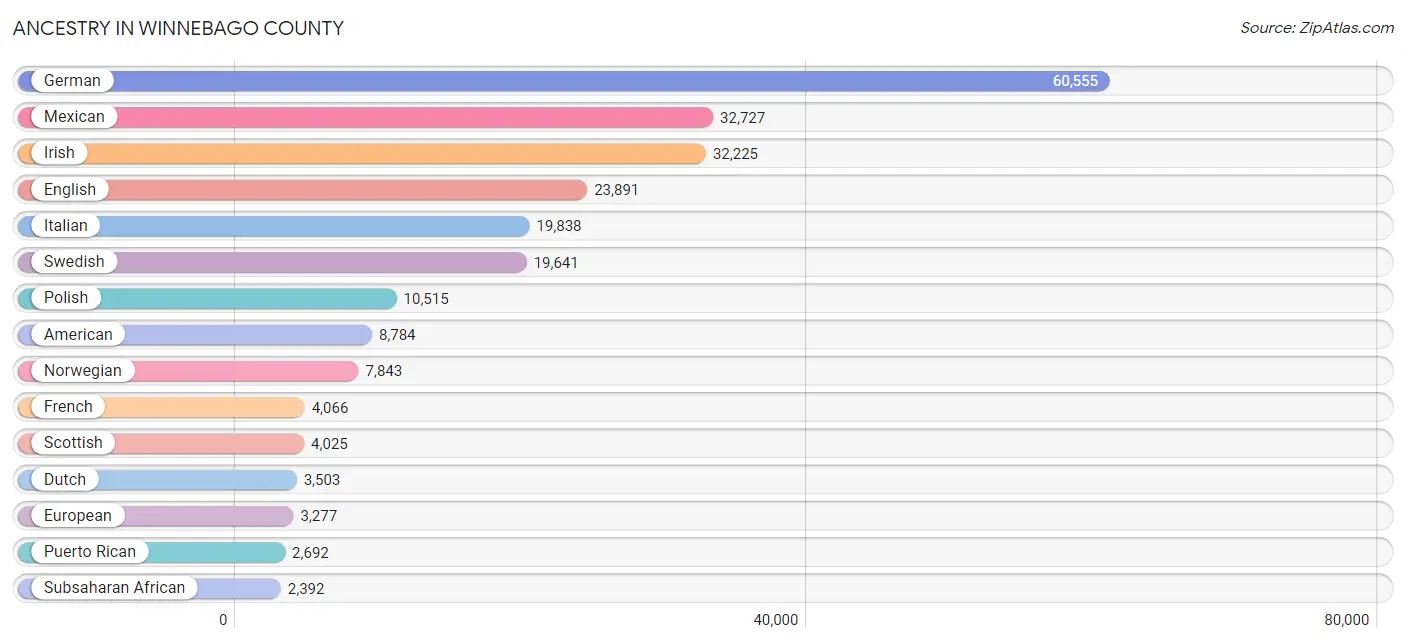
Ancestry in Winnebago County
The most populous ancestries reported in Winnebago County are German (60,555 | 21.3%), Mexican (32,727 | 11.5%), Irish (32,225 | 11.3%), English (23,891 | 8.4%), and Italian (19,838 | 7.0%), together accounting for 59.5% of all Winnebago County residents.
| Ancestry | # Population | % Population |
| African | 858 | 0.3% |
| Albanian | 367 | 0.1% |
| Alsatian | 40 | 0.0% |
| American | 8,784 | 3.1% |
| Apache | 3 | 0.0% |
| Arab | 1,981 | 0.7% |
| Argentinean | 58 | 0.0% |
| Armenian | 67 | 0.0% |
| Assyrian / Chaldean / Syriac | 6 | 0.0% |
| Australian | 18 | 0.0% |
| Austrian | 242 | 0.1% |
| Barbadian | 67 | 0.0% |
| Belgian | 385 | 0.1% |
| Belizean | 37 | 0.0% |
| Bhutanese | 177 | 0.1% |
| Blackfeet | 93 | 0.0% |
| Brazilian | 29 | 0.0% |
| British | 1,312 | 0.5% |
| British West Indian | 64 | 0.0% |
| Bulgarian | 59 | 0.0% |
| Burmese | 580 | 0.2% |
| Cajun | 14 | 0.0% |
| Cambodian | 261 | 0.1% |
| Canadian | 98 | 0.0% |
| Celtic | 50 | 0.0% |
| Central American | 1,249 | 0.4% |
| Central American Indian | 22 | 0.0% |
| Cherokee | 1,004 | 0.4% |
| Cheyenne | 38 | 0.0% |
| Chickasaw | 6 | 0.0% |
| Chippewa | 73 | 0.0% |
| Choctaw | 70 | 0.0% |
| Colombian | 221 | 0.1% |
| Comanche | 14 | 0.0% |
| Creek | 21 | 0.0% |
| Croatian | 261 | 0.1% |
| Cuban | 826 | 0.3% |
| Cypriot | 35 | 0.0% |
| Czech | 1,121 | 0.4% |
| Czechoslovakian | 156 | 0.1% |
| Danish | 1,812 | 0.6% |
| Dominican | 354 | 0.1% |
| Dutch | 3,503 | 1.2% |
| Eastern European | 354 | 0.1% |
| Ecuadorian | 319 | 0.1% |
| Egyptian | 405 | 0.1% |
| English | 23,891 | 8.4% |
| Ethiopian | 166 | 0.1% |
| European | 3,277 | 1.1% |
| Filipino | 58 | 0.0% |
| Finnish | 443 | 0.2% |
| French | 4,066 | 1.4% |
| French American Indian | 6 | 0.0% |
| French Canadian | 717 | 0.3% |
| German | 60,555 | 21.3% |
| German Russian | 7 | 0.0% |
| Ghanaian | 28 | 0.0% |
| Greek | 844 | 0.3% |
| Guamanian / Chamorro | 35 | 0.0% |
| Guatemalan | 468 | 0.2% |
| Haitian | 202 | 0.1% |
| Honduran | 164 | 0.1% |
| Hopi | 5 | 0.0% |
| Hungarian | 455 | 0.2% |
| Icelander | 22 | 0.0% |
| Indian (Asian) | 1,418 | 0.5% |
| Indonesian | 459 | 0.2% |
| Inupiat | 2 | 0.0% |
| Iranian | 62 | 0.0% |
| Iraqi | 720 | 0.3% |
| Irish | 32,225 | 11.3% |
| Iroquois | 4 | 0.0% |
| Israeli | 6 | 0.0% |
| Italian | 19,838 | 7.0% |
| Jamaican | 287 | 0.1% |
| Japanese | 19 | 0.0% |
| Jordanian | 284 | 0.1% |
| Kenyan | 127 | 0.0% |
| Korean | 1,941 | 0.7% |
| Laotian | 31 | 0.0% |
| Latvian | 52 | 0.0% |
| Lebanese | 119 | 0.0% |
| Lithuanian | 805 | 0.3% |
| Luxembourger | 15 | 0.0% |
| Malaysian | 1,508 | 0.5% |
| Maltese | 75 | 0.0% |
| Menominee | 16 | 0.0% |
| Mexican | 32,727 | 11.5% |
| Mexican American Indian | 784 | 0.3% |
| Mongolian | 69 | 0.0% |
| Moroccan | 47 | 0.0% |
| Native Hawaiian | 23 | 0.0% |
| Navajo | 17 | 0.0% |
| New Zealander | 39 | 0.0% |
| Nicaraguan | 55 | 0.0% |
| Nigerian | 392 | 0.1% |
| Northern European | 414 | 0.2% |
| Norwegian | 7,843 | 2.8% |
| Okinawan | 28 | 0.0% |
| Pakistani | 309 | 0.1% |
| Palestinian | 44 | 0.0% |
| Pennsylvania German | 159 | 0.1% |
| Peruvian | 51 | 0.0% |
| Polish | 10,515 | 3.7% |
| Portuguese | 63 | 0.0% |
| Potawatomi | 17 | 0.0% |
| Pueblo | 6 | 0.0% |
| Puerto Rican | 2,692 | 0.9% |
| Romanian | 85 | 0.0% |
| Russian | 1,459 | 0.5% |
| Salvadoran | 562 | 0.2% |
| Samoan | 48 | 0.0% |
| Scandinavian | 884 | 0.3% |
| Scotch-Irish | 1,652 | 0.6% |
| Scottish | 4,025 | 1.4% |
| Serbian | 411 | 0.1% |
| Sioux | 102 | 0.0% |
| Slavic | 41 | 0.0% |
| Slovak | 271 | 0.1% |
| Slovene | 137 | 0.1% |
| South African | 193 | 0.1% |
| South American | 866 | 0.3% |
| South American Indian | 129 | 0.1% |
| Spaniard | 554 | 0.2% |
| Spanish | 63 | 0.0% |
| Spanish American Indian | 12 | 0.0% |
| Sri Lankan | 798 | 0.3% |
| Subsaharan African | 2,392 | 0.8% |
| Swedish | 19,641 | 6.9% |
| Swiss | 1,133 | 0.4% |
| Syrian | 15 | 0.0% |
| Thai | 2,153 | 0.8% |
| Turkish | 39 | 0.0% |
| Ukrainian | 566 | 0.2% |
| Venezuelan | 217 | 0.1% |
| Vietnamese | 62 | 0.0% |
| Welsh | 1,155 | 0.4% |
| West Indian | 9 | 0.0% |
| Yugoslavian | 376 | 0.1% | View All 139 Rows |
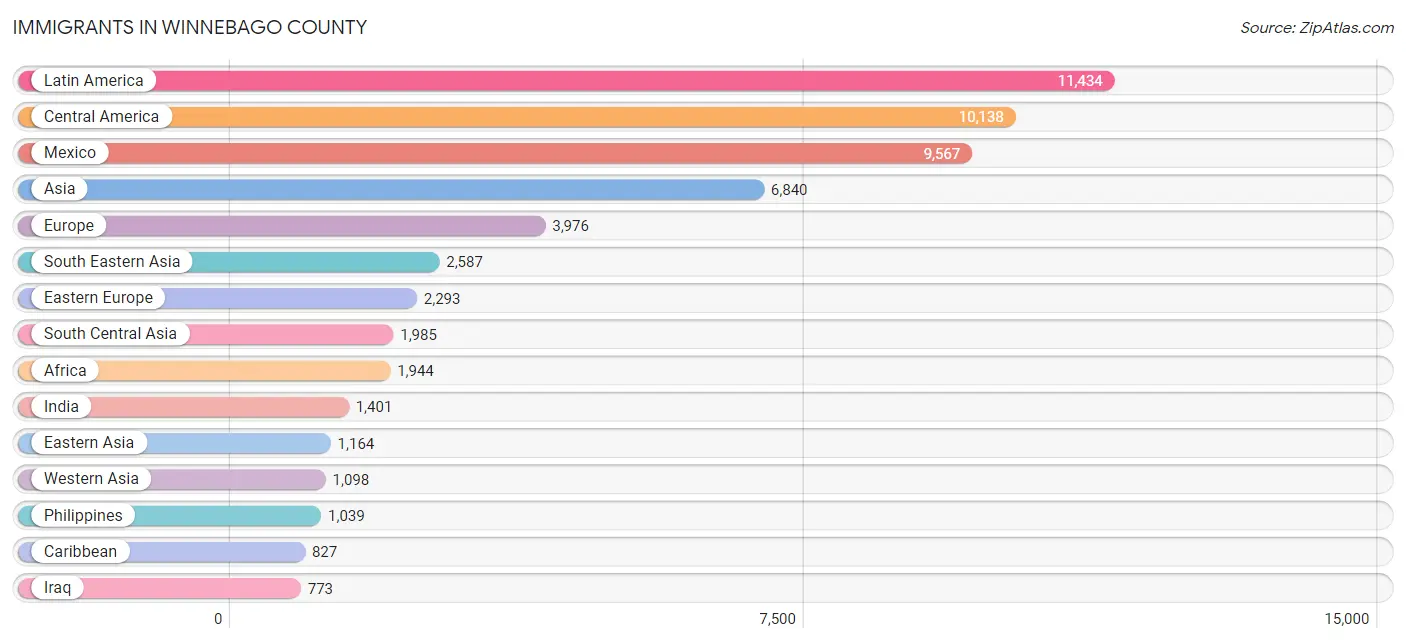
Immigrants in Winnebago County
The most numerous immigrant groups reported in Winnebago County came from Latin America (11,434 | 4.0%), Central America (10,138 | 3.6%), Mexico (9,567 | 3.4%), Asia (6,840 | 2.4%), and Europe (3,976 | 1.4%), together accounting for 14.7% of all Winnebago County residents.
| Immigration Origin | # Population | % Population |
| Africa | 1,944 | 0.7% |
| Argentina | 37 | 0.0% |
| Asia | 6,840 | 2.4% |
| Australia | 13 | 0.0% |
| Austria | 20 | 0.0% |
| Bangladesh | 59 | 0.0% |
| Barbados | 70 | 0.0% |
| Belarus | 50 | 0.0% |
| Belgium | 3 | 0.0% |
| Belize | 4 | 0.0% |
| Bosnia and Herzegovina | 421 | 0.2% |
| Brazil | 49 | 0.0% |
| Bulgaria | 23 | 0.0% |
| Canada | 518 | 0.2% |
| Caribbean | 827 | 0.3% |
| Central America | 10,138 | 3.6% |
| China | 734 | 0.3% |
| Colombia | 195 | 0.1% |
| Congo | 69 | 0.0% |
| Croatia | 45 | 0.0% |
| Cuba | 403 | 0.1% |
| Czechoslovakia | 18 | 0.0% |
| Denmark | 10 | 0.0% |
| Dominican Republic | 162 | 0.1% |
| Eastern Africa | 708 | 0.3% |
| Eastern Asia | 1,164 | 0.4% |
| Eastern Europe | 2,293 | 0.8% |
| Ecuador | 36 | 0.0% |
| Egypt | 230 | 0.1% |
| El Salvador | 218 | 0.1% |
| England | 200 | 0.1% |
| Ethiopia | 51 | 0.0% |
| Europe | 3,976 | 1.4% |
| France | 41 | 0.0% |
| Germany | 476 | 0.2% |
| Ghana | 36 | 0.0% |
| Greece | 76 | 0.0% |
| Guatemala | 192 | 0.1% |
| Haiti | 77 | 0.0% |
| Honduras | 135 | 0.1% |
| Hong Kong | 37 | 0.0% |
| India | 1,401 | 0.5% |
| Indonesia | 7 | 0.0% |
| Iran | 31 | 0.0% |
| Iraq | 773 | 0.3% |
| Ireland | 75 | 0.0% |
| Israel | 14 | 0.0% |
| Italy | 227 | 0.1% |
| Jamaica | 109 | 0.0% |
| Japan | 27 | 0.0% |
| Jordan | 181 | 0.1% |
| Kazakhstan | 252 | 0.1% |
| Kenya | 138 | 0.1% |
| Korea | 266 | 0.1% |
| Kuwait | 16 | 0.0% |
| Laos | 540 | 0.2% |
| Latin America | 11,434 | 4.0% |
| Lebanon | 19 | 0.0% |
| Lithuania | 31 | 0.0% |
| Malaysia | 52 | 0.0% |
| Mexico | 9,567 | 3.4% |
| Middle Africa | 481 | 0.2% |
| Morocco | 23 | 0.0% |
| Netherlands | 42 | 0.0% |
| Nicaragua | 22 | 0.0% |
| Nigeria | 232 | 0.1% |
| North Macedonia | 82 | 0.0% |
| Northern Africa | 253 | 0.1% |
| Northern Europe | 679 | 0.2% |
| Norway | 52 | 0.0% |
| Oceania | 66 | 0.0% |
| Pakistan | 157 | 0.1% |
| Peru | 10 | 0.0% |
| Philippines | 1,039 | 0.4% |
| Poland | 701 | 0.3% |
| Russia | 135 | 0.1% |
| Saudi Arabia | 6 | 0.0% |
| Scotland | 96 | 0.0% |
| Serbia | 199 | 0.1% |
| Singapore | 15 | 0.0% |
| South Africa | 92 | 0.0% |
| South America | 469 | 0.2% |
| South Central Asia | 1,985 | 0.7% |
| South Eastern Asia | 2,587 | 0.9% |
| Southern Europe | 354 | 0.1% |
| Spain | 51 | 0.0% |
| Sri Lanka | 25 | 0.0% |
| Sweden | 11 | 0.0% |
| Switzerland | 47 | 0.0% |
| Syria | 29 | 0.0% |
| Taiwan | 50 | 0.0% |
| Thailand | 339 | 0.1% |
| Uganda | 39 | 0.0% |
| Ukraine | 434 | 0.2% |
| Uzbekistan | 60 | 0.0% |
| Venezuela | 142 | 0.1% |
| Vietnam | 340 | 0.1% |
| Western Africa | 359 | 0.1% |
| Western Asia | 1,098 | 0.4% |
| Western Europe | 629 | 0.2% |
| Yemen | 41 | 0.0% |
| Zaire | 396 | 0.1% | View All 102 Rows |
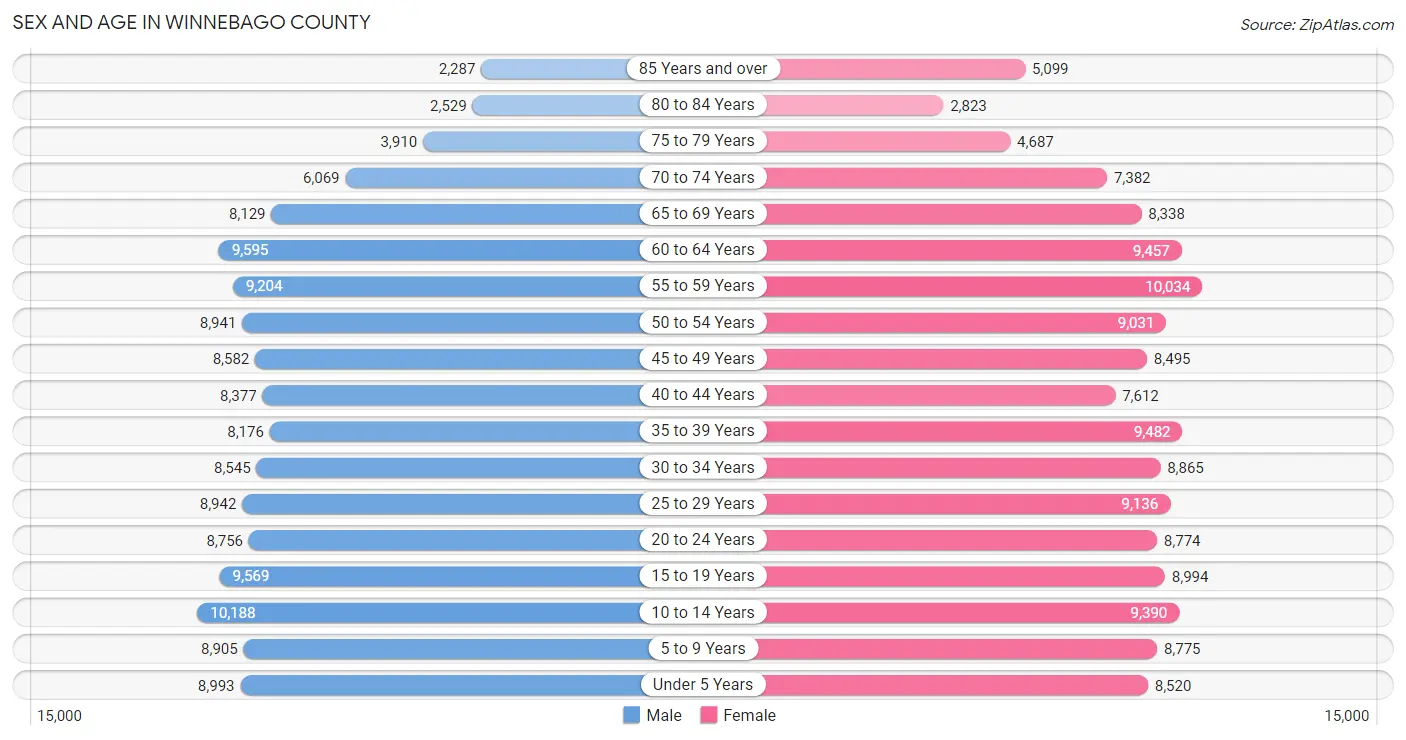
Sex and Age in Winnebago County
Sex and Age in Winnebago County
The most populous age groups in Winnebago County are 10 to 14 Years (10,188 | 7.3%) for men and 55 to 59 Years (10,034 | 6.9%) for women.
| Age Bracket | Male | Female |
| Under 5 Years | 8,993 (6.4%) | 8,520 (5.9%) |
| 5 to 9 Years | 8,905 (6.4%) | 8,775 (6.1%) |
| 10 to 14 Years | 10,188 (7.3%) | 9,390 (6.5%) |
| 15 to 19 Years | 9,569 (6.9%) | 8,994 (6.2%) |
| 20 to 24 Years | 8,756 (6.3%) | 8,774 (6.1%) |
| 25 to 29 Years | 8,942 (6.4%) | 9,136 (6.3%) |
| 30 to 34 Years | 8,545 (6.1%) | 8,865 (6.1%) |
| 35 to 39 Years | 8,176 (5.9%) | 9,482 (6.5%) |
| 40 to 44 Years | 8,377 (6.0%) | 7,612 (5.2%) |
| 45 to 49 Years | 8,582 (6.1%) | 8,495 (5.9%) |
| 50 to 54 Years | 8,941 (6.4%) | 9,031 (6.2%) |
| 55 to 59 Years | 9,204 (6.6%) | 10,034 (6.9%) |
| 60 to 64 Years | 9,595 (6.9%) | 9,457 (6.5%) |
| 65 to 69 Years | 8,129 (5.8%) | 8,338 (5.8%) |
| 70 to 74 Years | 6,069 (4.3%) | 7,382 (5.1%) |
| 75 to 79 Years | 3,910 (2.8%) | 4,687 (3.2%) |
| 80 to 84 Years | 2,529 (1.8%) | 2,823 (1.9%) |
| 85 Years and over | 2,287 (1.6%) | 5,099 (3.5%) |
| Total | 139,697 (100.0%) | 144,894 (100.0%) |
Families and Households in Winnebago County
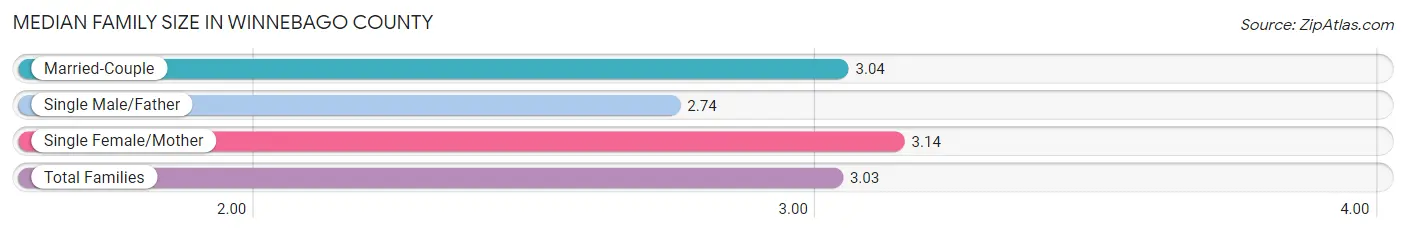
Median Family Size in Winnebago County
The median family size in Winnebago County is 3.03 persons per family, with single female/mother families (16,281 | 22.3%) accounting for the largest median family size of 3.14 persons per family. On the other hand, single male/father families (5,857 | 8.0%) represent the smallest median family size with 2.74 persons per family.
| Family Type | # Families | Family Size |
| Married-Couple | 50,977 (69.7%) | 3.04 |
| Single Male/Father | 5,857 (8.0%) | 2.74 |
| Single Female/Mother | 16,281 (22.3%) | 3.14 |
| Total Families | 73,115 (100.0%) | 3.03 |
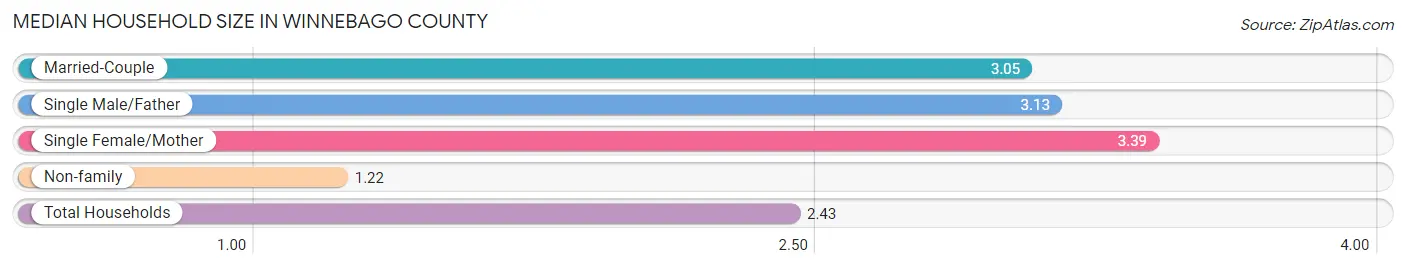
Median Household Size in Winnebago County
The median household size in Winnebago County is 2.43 persons per household, with single female/mother households (16,281 | 14.1%) accounting for the largest median household size of 3.39 persons per household. non-family households (42,099 | 36.5%) represent the smallest median household size with 1.22 persons per household.
| Household Type | # Households | Household Size |
| Married-Couple | 50,977 (44.3%) | 3.05 |
| Single Male/Father | 5,857 (5.1%) | 3.13 |
| Single Female/Mother | 16,281 (14.1%) | 3.39 |
| Non-family | 42,099 (36.5%) | 1.22 |
| Total Households | 115,214 (100.0%) | 2.43 |
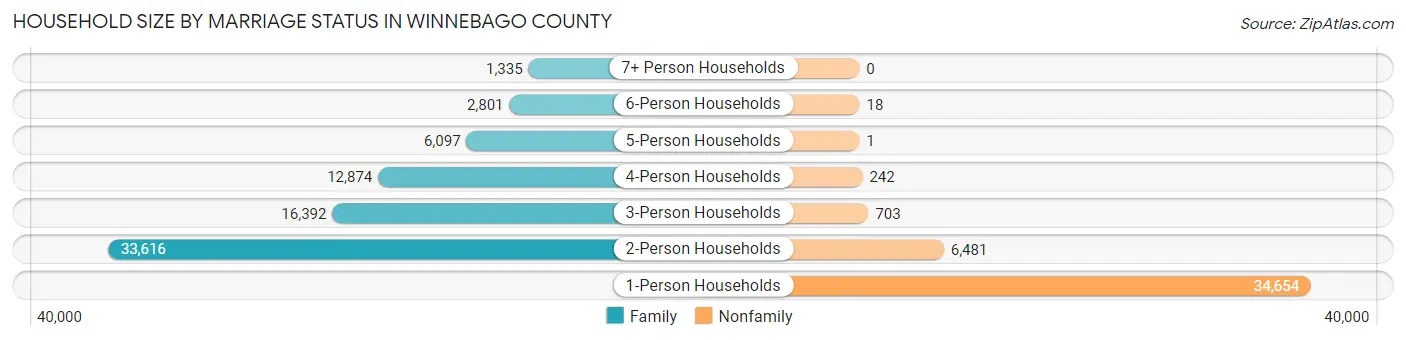
Household Size by Marriage Status in Winnebago County
Out of a total of 115,214 households in Winnebago County, 73,115 (63.5%) are family households, while 42,099 (36.5%) are nonfamily households. The most numerous type of family households are 2-person households, comprising 33,616, and the most common type of nonfamily households are 1-person households, comprising 34,654.
| Household Size | Family Households | Nonfamily Households |
| 1-Person Households | - | 34,654 (30.1%) |
| 2-Person Households | 33,616 (29.2%) | 6,481 (5.6%) |
| 3-Person Households | 16,392 (14.2%) | 703 (0.6%) |
| 4-Person Households | 12,874 (11.2%) | 242 (0.2%) |
| 5-Person Households | 6,097 (5.3%) | 1 (0.0%) |
| 6-Person Households | 2,801 (2.4%) | 18 (0.0%) |
| 7+ Person Households | 1,335 (1.2%) | 0 (0.0%) |
| Total | 73,115 (63.5%) | 42,099 (36.5%) |
Female Fertility in Winnebago County
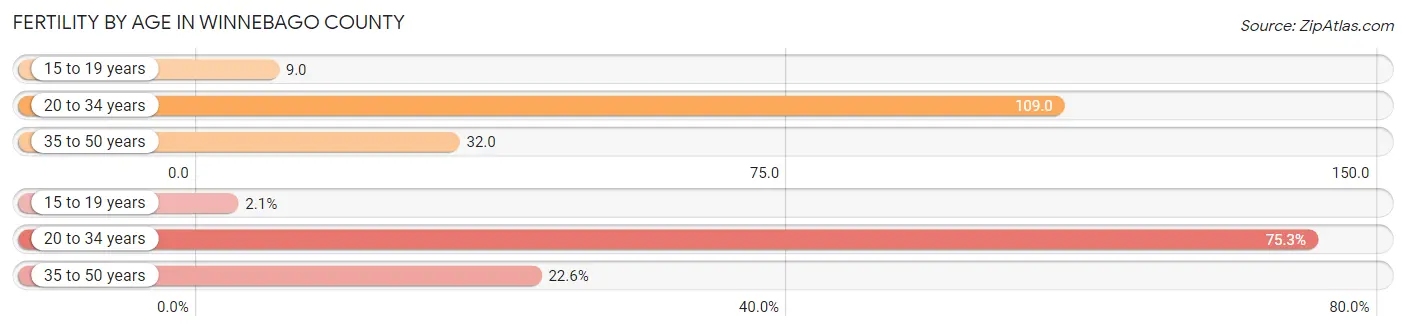
Fertility by Age in Winnebago County
Average fertility rate in Winnebago County is 61.0 births per 1,000 women. Women in the age bracket of 20 to 34 years have the highest fertility rate with 109.0 births per 1,000 women. Women in the age bracket of 20 to 34 years acount for 75.3% of all women with births.
| Age Bracket | Women with Births | Births / 1,000 Women |
| 15 to 19 years | 80 (2.1%) | 9.0 |
| 20 to 34 years | 2,919 (75.3%) | 109.0 |
| 35 to 50 years | 877 (22.6%) | 32.0 |
| Total | 3,876 (100.0%) | 61.0 |
Fertility by Age by Marriage Status in Winnebago County
48.4% of women with births (3,876) in Winnebago County are married. The highest percentage of unmarried women with births falls into 15 to 19 years age bracket with 92.5% of them unmarried at the time of birth, while the lowest percentage of unmarried women with births belong to 35 to 50 years age bracket with 30.4% of them unmarried.
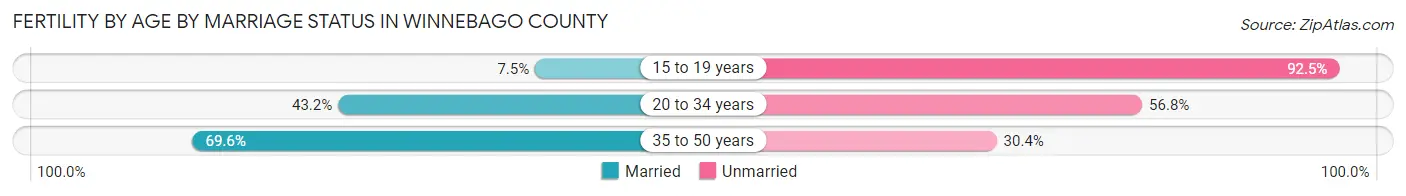
| Age Bracket | Married | Unmarried |
| 15 to 19 years | 6 (7.5%) | 74 (92.5%) |
| 20 to 34 years | 1,261 (43.2%) | 1,658 (56.8%) |
| 35 to 50 years | 610 (69.6%) | 267 (30.4%) |
| Total | 1,876 (48.4%) | 2,000 (51.6%) |
Fertility by Education in Winnebago County
Average fertility rate in Winnebago County is 61.0 births per 1,000 women. Women with the education attainment of high school diploma have the highest fertility rate of 79.0 births per 1,000 women, while women with the education attainment of less than high school have the lowest fertility at 36.0 births per 1,000 women. Women with the education attainment of high school diploma represent 32.3% of all women with births.
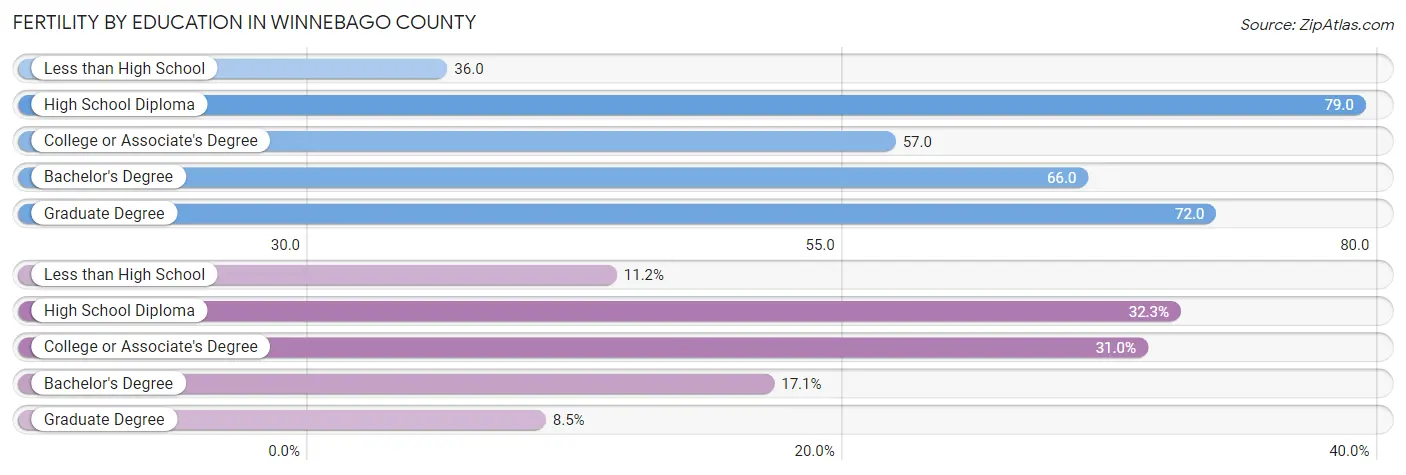
| Educational Attainment | Women with Births | Births / 1,000 Women |
| Less than High School | 432 (11.2%) | 36.0 |
| High School Diploma | 1,251 (32.3%) | 79.0 |
| College or Associate's Degree | 1,203 (31.0%) | 57.0 |
| Bachelor's Degree | 661 (17.1%) | 66.0 |
| Graduate Degree | 329 (8.5%) | 72.0 |
| Total | 3,876 (100.0%) | 61.0 |
Fertility by Education by Marriage Status in Winnebago County
51.6% of women with births in Winnebago County are unmarried. Women with the educational attainment of graduate degree are most likely to be married with 79.9% of them married at childbirth, while women with the educational attainment of less than high school are least likely to be married with 72.9% of them unmarried at childbirth.
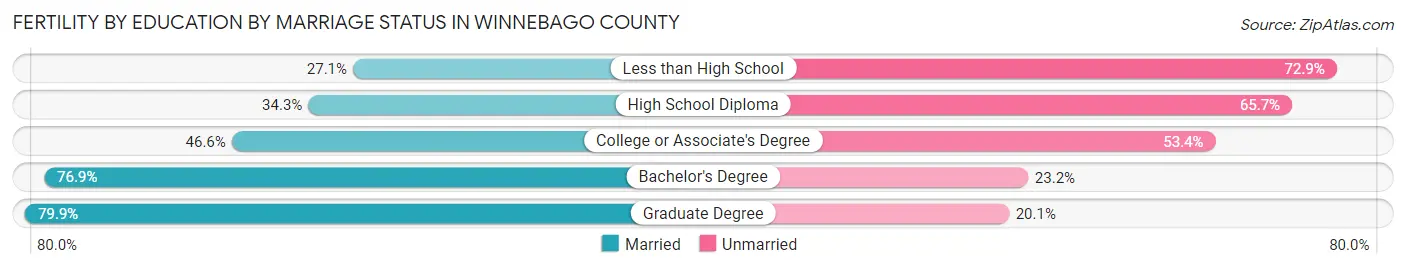
| Educational Attainment | Married | Unmarried |
| Less than High School | 117 (27.1%) | 315 (72.9%) |
| High School Diploma | 429 (34.3%) | 822 (65.7%) |
| College or Associate's Degree | 561 (46.6%) | 642 (53.4%) |
| Bachelor's Degree | 508 (76.8%) | 153 (23.2%) |
| Graduate Degree | 263 (79.9%) | 66 (20.1%) |
| Total | 1,876 (48.4%) | 2,000 (51.6%) |
Income in Winnebago County
Income Overview in Winnebago County
Per Capita Income in Winnebago County is $33,474, while median incomes of families and households are $78,158 and $61,738 respectively.
| Characteristic | Number | Measure |
| Per Capita Income | 284,591 | $33,474 |
| Median Family Income | 73,115 | $78,158 |
| Mean Family Income | 73,115 | $97,303 |
| Median Household Income | 115,214 | $61,738 |
| Mean Household Income | 115,214 | $81,384 |
| Income Deficit | 73,115 | $11,951 |
| Wage / Income Gap (%) | 284,591 | 31.12% |
| Wage / Income Gap ($) | 284,591 | 68.88¢ per $1 |
| Gini / Inequality Index | 284,591 | 0.45 |
Earnings by Sex in Winnebago County
Average Earnings in Winnebago County are $37,265, $44,770 for men and $30,838 for women, a difference of 31.1%.
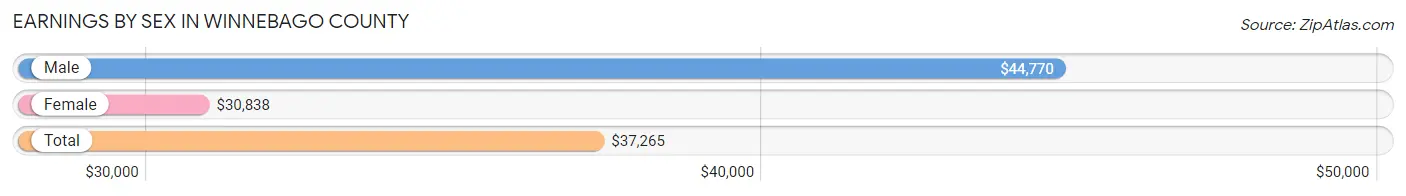
| Sex | Number | Average Earnings |
| Male | 75,830 (52.1%) | $44,770 |
| Female | 69,726 (47.9%) | $30,838 |
| Total | 145,556 (100.0%) | $37,265 |
Earnings by Sex by Income Bracket in Winnebago County
The most common earnings brackets in Winnebago County are $100,000+ for men (10,505 | 13.9%) and $75,000 to $99,999 for women (4,653 | 6.7%).
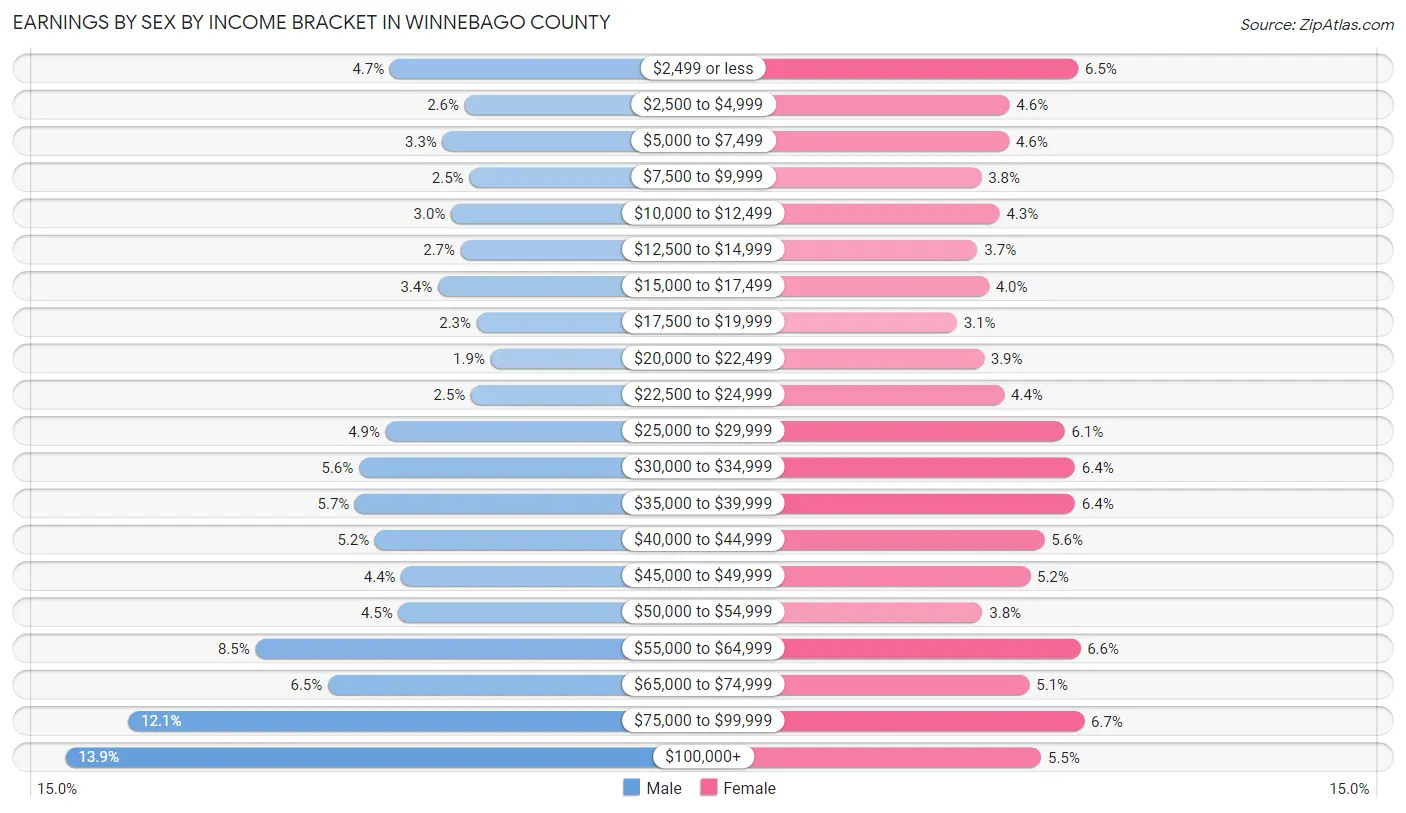
| Income | Male | Female |
| $2,499 or less | 3,586 (4.7%) | 4,534 (6.5%) |
| $2,500 to $4,999 | 1,995 (2.6%) | 3,186 (4.6%) |
| $5,000 to $7,499 | 2,464 (3.3%) | 3,178 (4.6%) |
| $7,500 to $9,999 | 1,897 (2.5%) | 2,638 (3.8%) |
| $10,000 to $12,499 | 2,281 (3.0%) | 2,992 (4.3%) |
| $12,500 to $14,999 | 2,074 (2.7%) | 2,558 (3.7%) |
| $15,000 to $17,499 | 2,562 (3.4%) | 2,782 (4.0%) |
| $17,500 to $19,999 | 1,738 (2.3%) | 2,153 (3.1%) |
| $20,000 to $22,499 | 1,440 (1.9%) | 2,684 (3.8%) |
| $22,500 to $24,999 | 1,858 (2.5%) | 3,082 (4.4%) |
| $25,000 to $29,999 | 3,674 (4.9%) | 4,268 (6.1%) |
| $30,000 to $34,999 | 4,247 (5.6%) | 4,471 (6.4%) |
| $35,000 to $39,999 | 4,329 (5.7%) | 4,472 (6.4%) |
| $40,000 to $44,999 | 3,908 (5.1%) | 3,870 (5.6%) |
| $45,000 to $49,999 | 3,341 (4.4%) | 3,588 (5.1%) |
| $50,000 to $54,999 | 3,403 (4.5%) | 2,658 (3.8%) |
| $55,000 to $64,999 | 6,453 (8.5%) | 4,573 (6.6%) |
| $65,000 to $74,999 | 4,907 (6.5%) | 3,580 (5.1%) |
| $75,000 to $99,999 | 9,168 (12.1%) | 4,653 (6.7%) |
| $100,000+ | 10,505 (13.9%) | 3,806 (5.5%) |
| Total | 75,830 (100.0%) | 69,726 (100.0%) |
Earnings by Sex by Educational Attainment in Winnebago County
Average earnings in Winnebago County are $51,981 for men and $35,738 for women, a difference of 31.2%. Men with an educational attainment of graduate degree enjoy the highest average annual earnings of $91,336, while those with less than high school education earn the least with $32,259. Women with an educational attainment of graduate degree earn the most with the average annual earnings of $70,942, while those with less than high school education have the smallest earnings of $19,943.
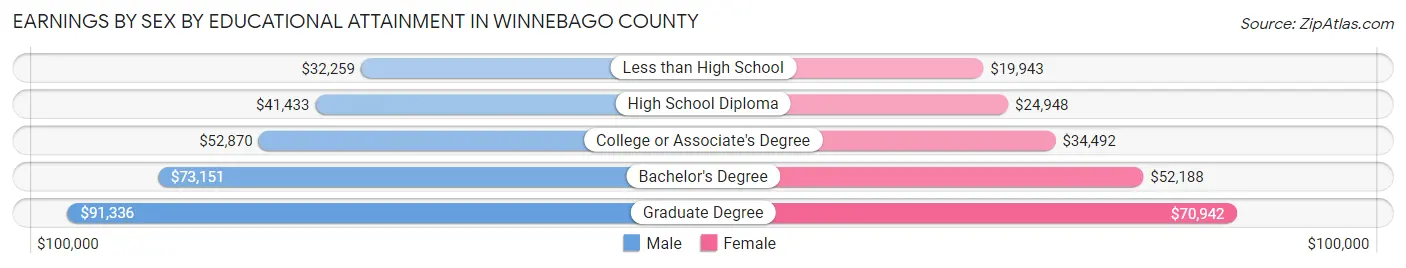
| Educational Attainment | Male Income | Female Income |
| Less than High School | $32,259 | $19,943 |
| High School Diploma | $41,433 | $24,948 |
| College or Associate's Degree | $52,870 | $34,492 |
| Bachelor's Degree | $73,151 | $52,188 |
| Graduate Degree | $91,336 | $70,942 |
| Total | $51,981 | $35,738 |
Family Income in Winnebago County
Family Income Brackets in Winnebago County
According to the Winnebago County family income data, there are 14,184 families falling into the $100,000 to $149,999 income range, which is the most common income bracket and makes up 19.4% of all families. Conversely, the $10,000 to $14,999 income bracket is the least frequent group with only 1,682 families (2.3%) belonging to this category.
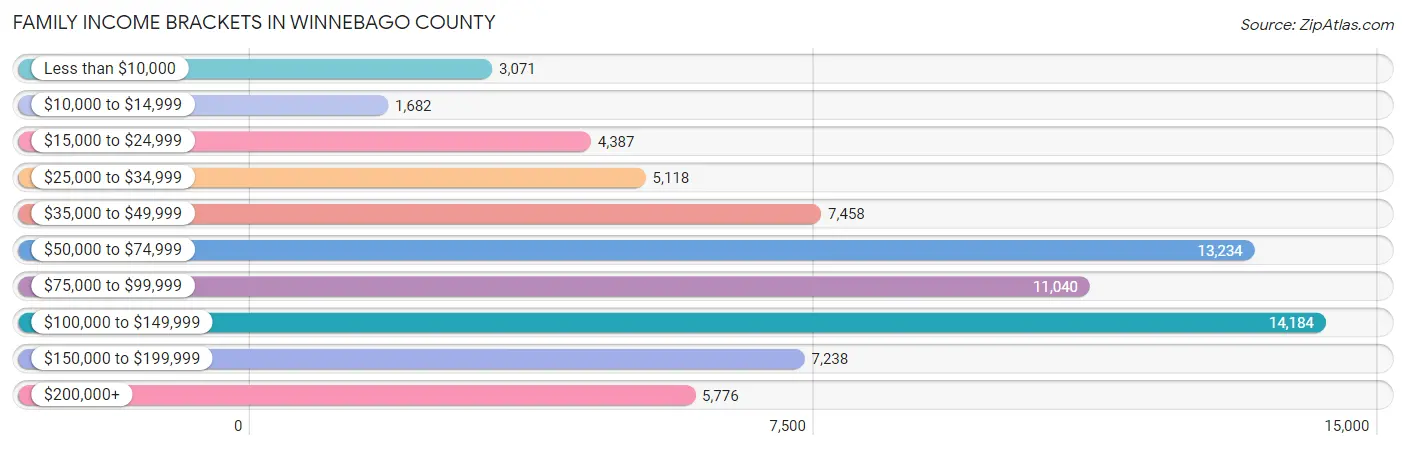
| Income Bracket | # Families | % Families |
| Less than $10,000 | 3,071 | 4.2% |
| $10,000 to $14,999 | 1,682 | 2.3% |
| $15,000 to $24,999 | 4,387 | 6.0% |
| $25,000 to $34,999 | 5,118 | 7.0% |
| $35,000 to $49,999 | 7,458 | 10.2% |
| $50,000 to $74,999 | 13,234 | 18.1% |
| $75,000 to $99,999 | 11,040 | 15.1% |
| $100,000 to $149,999 | 14,184 | 19.4% |
| $150,000 to $199,999 | 7,238 | 9.9% |
| $200,000+ | 5,776 | 7.9% |
Family Income by Famaliy Size in Winnebago County
4-person families (12,598 | 17.2%) account for the highest median family income in Winnebago County with $89,940 per family, while 2-person families (36,191 | 49.5%) have the highest median income of $35,929 per family member.
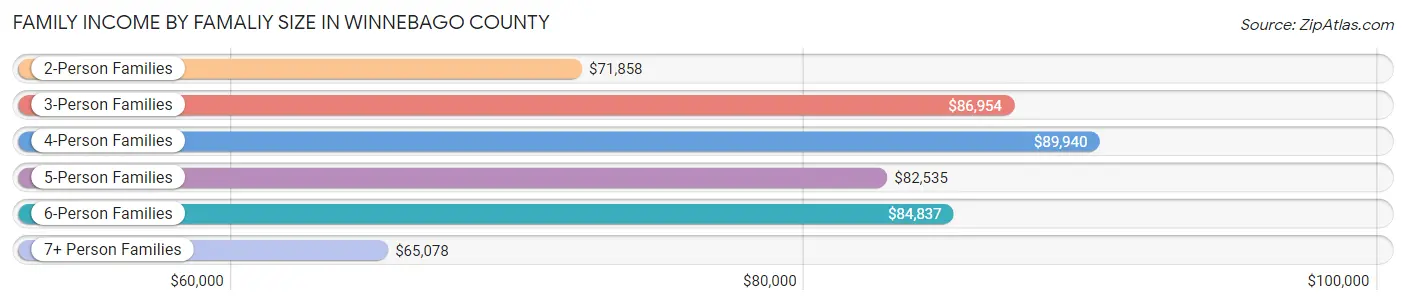
| Income Bracket | # Families | Median Income |
| 2-Person Families | 36,191 (49.5%) | $71,858 |
| 3-Person Families | 15,604 (21.3%) | $86,954 |
| 4-Person Families | 12,598 (17.2%) | $89,940 |
| 5-Person Families | 5,141 (7.0%) | $82,535 |
| 6-Person Families | 2,353 (3.2%) | $84,837 |
| 7+ Person Families | 1,228 (1.7%) | $65,078 |
| Total | 73,115 (100.0%) | $78,158 |
Family Income by Number of Earners in Winnebago County
The median family income in Winnebago County is $78,158, with families comprising 3+ earners (7,857) having the highest median family income of $131,734, while families with no earners (12,004) have the lowest median family income of $47,948, accounting for 10.7% and 16.4% of families, respectively.
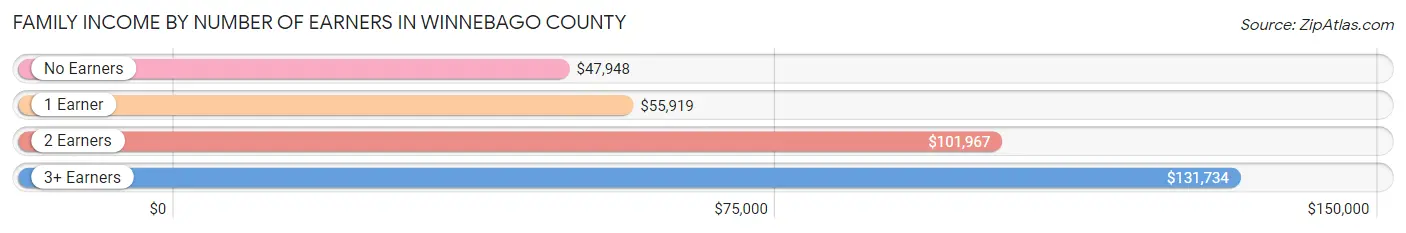
| Number of Earners | # Families | Median Income |
| No Earners | 12,004 (16.4%) | $47,948 |
| 1 Earner | 24,780 (33.9%) | $55,919 |
| 2 Earners | 28,474 (38.9%) | $101,967 |
| 3+ Earners | 7,857 (10.7%) | $131,734 |
| Total | 73,115 (100.0%) | $78,158 |
Household Income in Winnebago County
Household Income Brackets in Winnebago County
With 20,508 households falling in the category, the $50,000 to $74,999 income range is the most frequent in Winnebago County, accounting for 17.8% of all households. In contrast, only 5,300 households (4.6%) fall into the $10,000 to $14,999 income bracket, making it the least populous group.
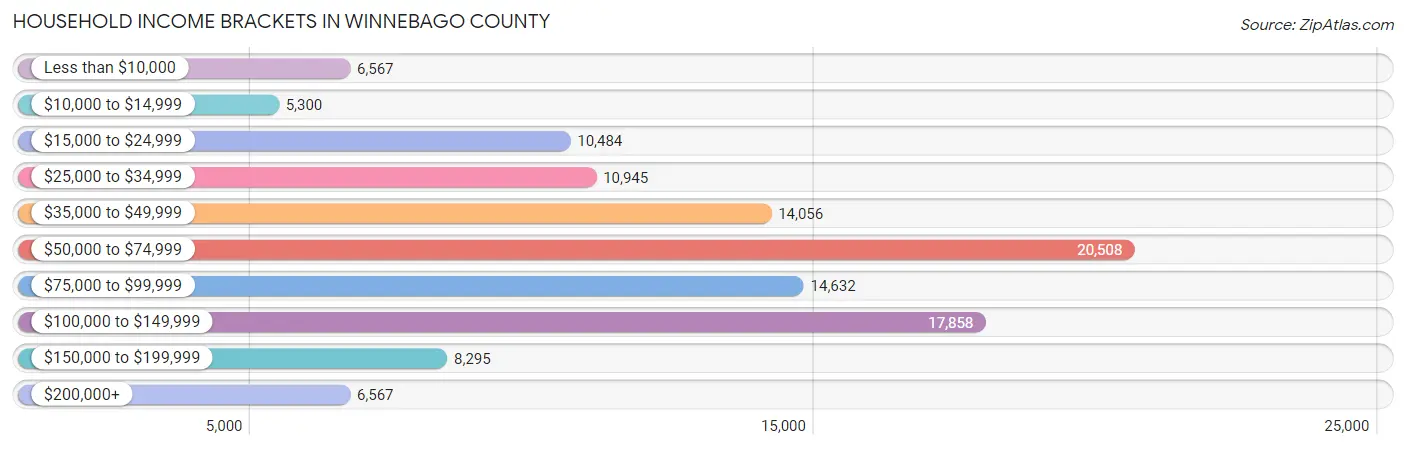
| Income Bracket | # Households | % Households |
| Less than $10,000 | 6,567 | 5.7% |
| $10,000 to $14,999 | 5,300 | 4.6% |
| $15,000 to $24,999 | 10,484 | 9.1% |
| $25,000 to $34,999 | 10,945 | 9.5% |
| $35,000 to $49,999 | 14,056 | 12.2% |
| $50,000 to $74,999 | 20,508 | 17.8% |
| $75,000 to $99,999 | 14,632 | 12.7% |
| $100,000 to $149,999 | 17,858 | 15.5% |
| $150,000 to $199,999 | 8,295 | 7.2% |
| $200,000+ | 6,567 | 5.7% |
Household Income by Householder Age in Winnebago County
The median household income in Winnebago County is $61,738, with the highest median household income of $74,772 found in the 45 to 64 years age bracket for the primary householder. A total of 42,689 households (37.0%) fall into this category. Meanwhile, the 15 to 24 years age bracket for the primary householder has the lowest median household income of $39,750, with 4,332 households (3.8%) in this group.
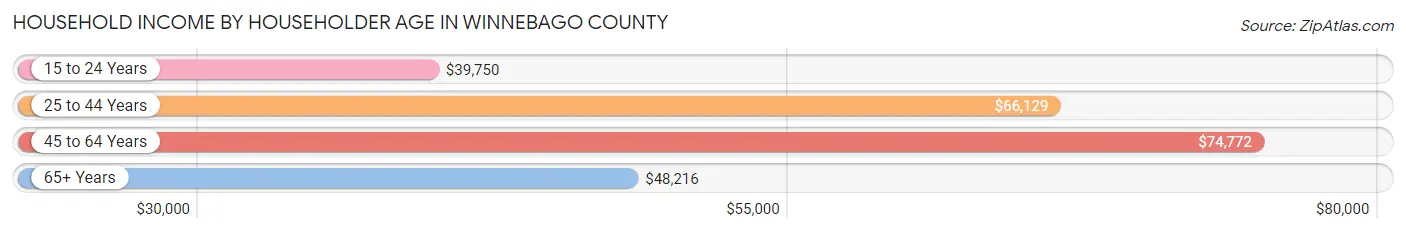
| Income Bracket | # Households | Median Income |
| 15 to 24 Years | 4,332 (3.8%) | $39,750 |
| 25 to 44 Years | 35,112 (30.5%) | $66,129 |
| 45 to 64 Years | 42,689 (37.0%) | $74,772 |
| 65+ Years | 33,081 (28.7%) | $48,216 |
| Total | 115,214 (100.0%) | $61,738 |
Poverty in Winnebago County
Income Below Poverty by Sex and Age in Winnebago County
With 15.4% poverty level for males and 16.7% for females among the residents of Winnebago County, 5 year old males and 5 year old females are the most vulnerable to poverty, with 736 males (40.9%) and 498 females (29.2%) in their respective age groups living below the poverty level.
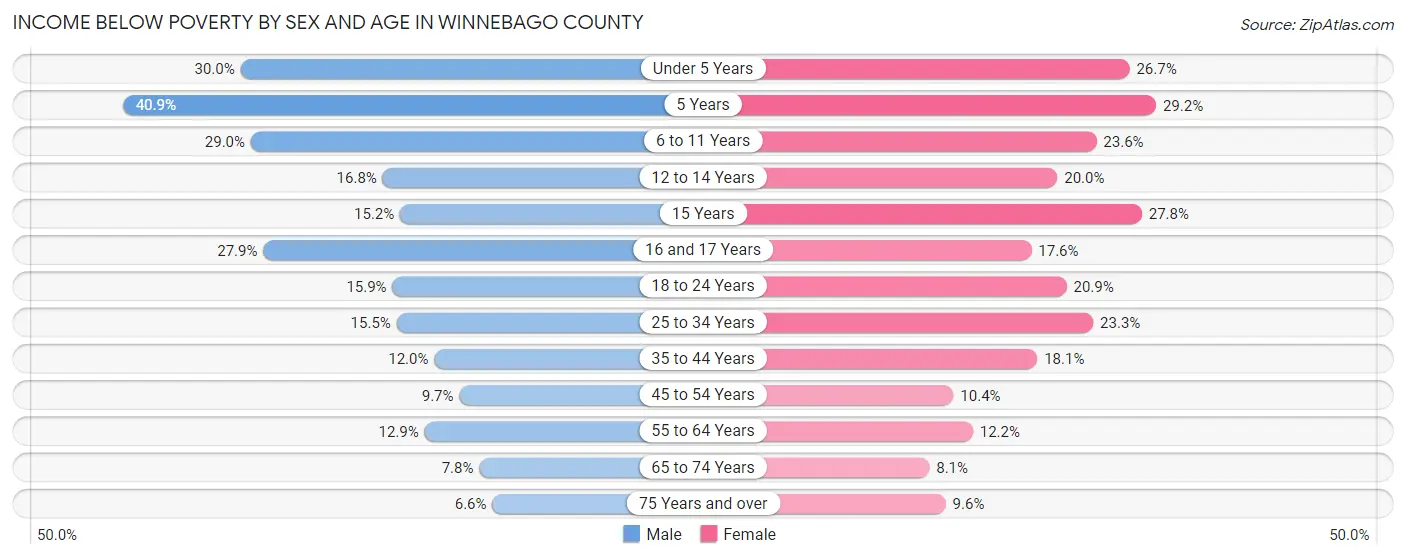
| Age Bracket | Male | Female |
| Under 5 Years | 2,650 (30.0%) | 2,247 (26.7%) |
| 5 Years | 736 (40.9%) | 498 (29.2%) |
| 6 to 11 Years | 3,185 (29.0%) | 2,577 (23.6%) |
| 12 to 14 Years | 990 (16.8%) | 1,015 (20.0%) |
| 15 Years | 310 (15.1%) | 551 (27.8%) |
| 16 and 17 Years | 1,089 (27.9%) | 653 (17.6%) |
| 18 to 24 Years | 1,900 (15.9%) | 2,477 (20.9%) |
| 25 to 34 Years | 2,659 (15.5%) | 4,184 (23.3%) |
| 35 to 44 Years | 1,962 (12.0%) | 3,090 (18.1%) |
| 45 to 54 Years | 1,674 (9.7%) | 1,807 (10.4%) |
| 55 to 64 Years | 2,398 (12.9%) | 2,359 (12.2%) |
| 65 to 74 Years | 1,097 (7.8%) | 1,257 (8.1%) |
| 75 Years and over | 554 (6.6%) | 1,138 (9.6%) |
| Total | 21,204 (15.4%) | 23,853 (16.7%) |
Income Above Poverty by Sex and Age in Winnebago County
According to the poverty statistics in Winnebago County, males aged 75 years and over and females aged 65 to 74 years are the age groups that are most secure financially, with 93.4% of males and 91.9% of females in these age groups living above the poverty line.
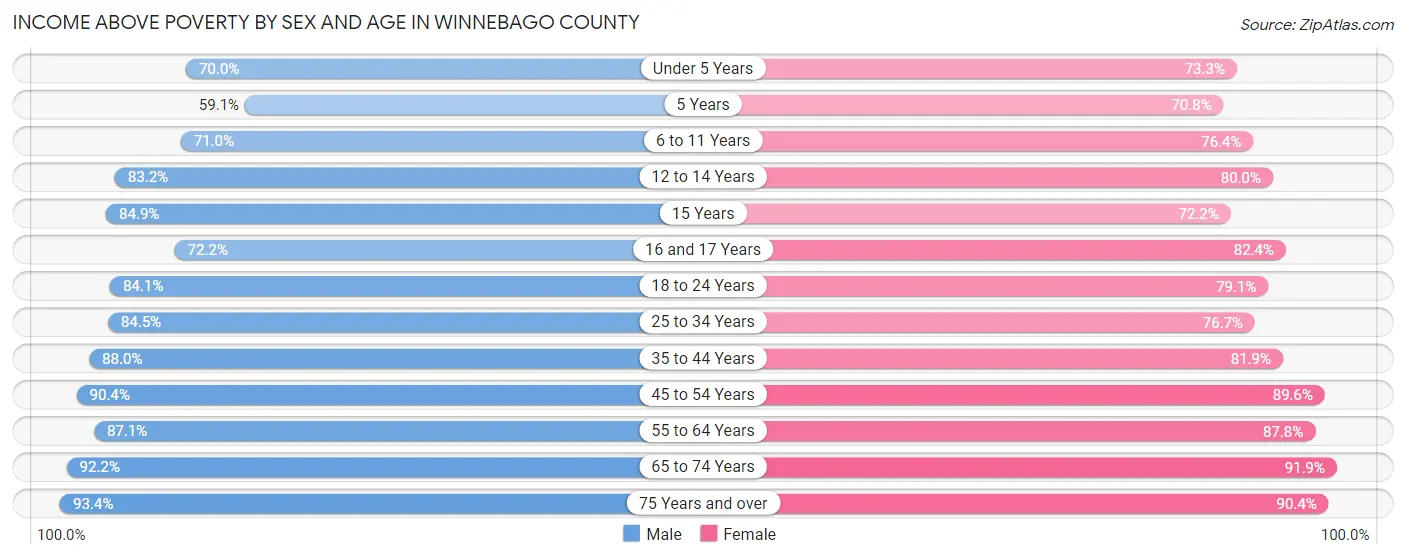
| Age Bracket | Male | Female |
| Under 5 Years | 6,196 (70.0%) | 6,169 (73.3%) |
| 5 Years | 1,064 (59.1%) | 1,210 (70.8%) |
| 6 to 11 Years | 7,796 (71.0%) | 8,329 (76.4%) |
| 12 to 14 Years | 4,915 (83.2%) | 4,060 (80.0%) |
| 15 Years | 1,736 (84.9%) | 1,428 (72.2%) |
| 16 and 17 Years | 2,821 (72.2%) | 3,060 (82.4%) |
| 18 to 24 Years | 10,083 (84.1%) | 9,398 (79.1%) |
| 25 to 34 Years | 14,528 (84.5%) | 13,749 (76.7%) |
| 35 to 44 Years | 14,419 (88.0%) | 13,947 (81.9%) |
| 45 to 54 Years | 15,674 (90.3%) | 15,639 (89.6%) |
| 55 to 64 Years | 16,225 (87.1%) | 17,047 (87.8%) |
| 65 to 74 Years | 12,969 (92.2%) | 14,229 (91.9%) |
| 75 Years and over | 7,852 (93.4%) | 10,666 (90.4%) |
| Total | 116,278 (84.6%) | 118,931 (83.3%) |
Income Below Poverty Among Married-Couple Families in Winnebago County
The poverty statistics for married-couple families in Winnebago County show that 4.2% or 2,121 of the total 50,977 families live below the poverty line. Families with 5 or more children have the highest poverty rate of 22.1%, comprising of 71 families. On the other hand, families with no children have the lowest poverty rate of 2.5%, which includes 820 families.
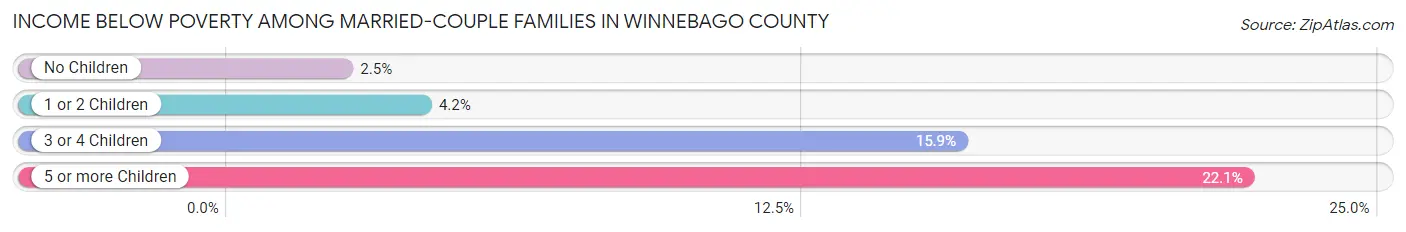
| Children | Above Poverty | Below Poverty |
| No Children | 31,858 (97.5%) | 820 (2.5%) |
| 1 or 2 Children | 13,347 (95.8%) | 588 (4.2%) |
| 3 or 4 Children | 3,401 (84.1%) | 642 (15.9%) |
| 5 or more Children | 250 (77.9%) | 71 (22.1%) |
| Total | 48,856 (95.8%) | 2,121 (4.2%) |
Income Below Poverty Among Single-Parent Households in Winnebago County
According to the poverty data in Winnebago County, 18.0% or 1,056 single-father households and 32.8% or 5,346 single-mother households are living below the poverty line. Among single-father households, those with 5 or more children have the highest poverty rate, with 75 households (86.2%) experiencing poverty. Likewise, among single-mother households, those with 5 or more children have the highest poverty rate, with 303 households (72.5%) falling below the poverty line.
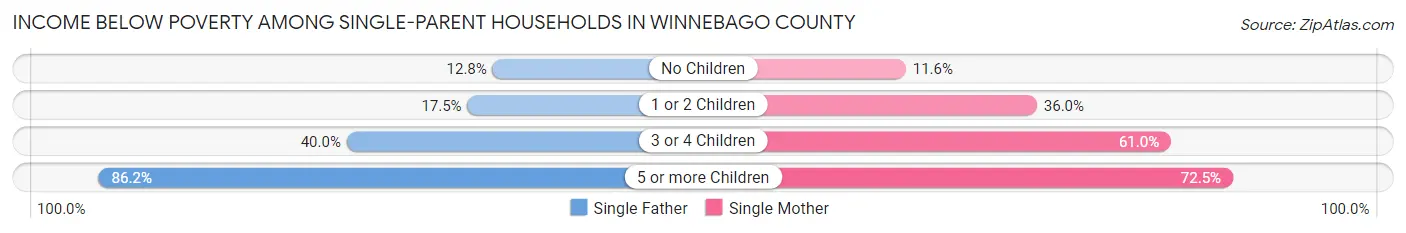
| Children | Single Father | Single Mother |
| No Children | 352 (12.8%) | 574 (11.6%) |
| 1 or 2 Children | 453 (17.5%) | 3,137 (36.0%) |
| 3 or 4 Children | 176 (40.0%) | 1,332 (61.0%) |
| 5 or more Children | 75 (86.2%) | 303 (72.5%) |
| Total | 1,056 (18.0%) | 5,346 (32.8%) |
Income Below Poverty Among Married-Couple vs Single-Parent Households in Winnebago County
The poverty data for Winnebago County shows that 2,121 of the married-couple family households (4.2%) and 6,402 of the single-parent households (28.9%) are living below the poverty level. Within the married-couple family households, those with 5 or more children have the highest poverty rate, with 71 households (22.1%) falling below the poverty line. Among the single-parent households, those with 5 or more children have the highest poverty rate, with 378 household (74.9%) living below poverty.
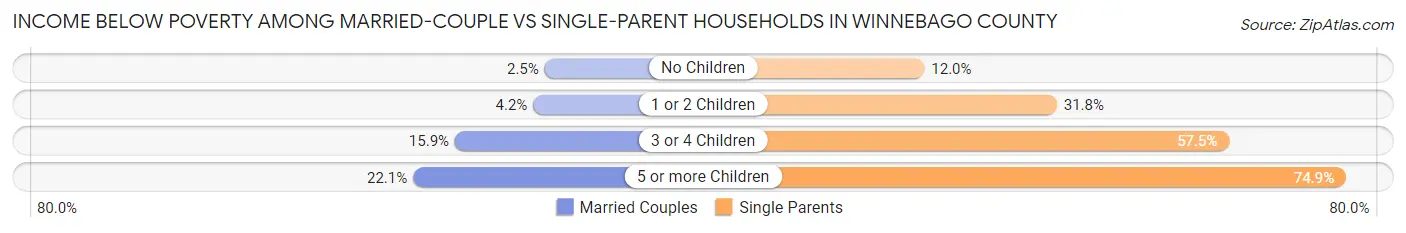
| Children | Married-Couple Families | Single-Parent Households |
| No Children | 820 (2.5%) | 926 (12.0%) |
| 1 or 2 Children | 588 (4.2%) | 3,590 (31.8%) |
| 3 or 4 Children | 642 (15.9%) | 1,508 (57.5%) |
| 5 or more Children | 71 (22.1%) | 378 (74.9%) |
| Total | 2,121 (4.2%) | 6,402 (28.9%) |
Employment Characteristics in Winnebago County
Employment by Class of Employer in Winnebago County
Among the 127,395 employed individuals in Winnebago County, private company employees (92,691 | 72.8%), not-for-profit organizations (11,783 | 9.2%), and local government employees (8,394 | 6.6%) make up the most common classes of employment.

| Employer Class | # Employees | % Employees |
| Private Company Employees | 92,691 | 72.8% |
| Self-Employed (Incorporated) | 4,342 | 3.4% |
| Self-Employed (Not Incorporated) | 5,008 | 3.9% |
| Not-for-profit Organizations | 11,783 | 9.2% |
| Local Government Employees | 8,394 | 6.6% |
| State Government Employees | 2,910 | 2.3% |
| Federal Government Employees | 1,949 | 1.5% |
| Unpaid Family Workers | 318 | 0.3% |
| Total | 127,395 | 100.0% |
Employment Status by Age in Winnebago County
According to the labor force statistics for Winnebago County, out of the total population over 16 years of age (225,789), 62.2% or 140,441 individuals are in the labor force, with 7.5% or 10,533 of them unemployed. The age group with the highest labor force participation rate is 25 to 29 years, with 85.4% or 15,439 individuals in the labor force. Within the labor force, the 16 to 19 years age range has the highest percentage of unemployed individuals, with 18.3% or 1,330 of them being unemployed.
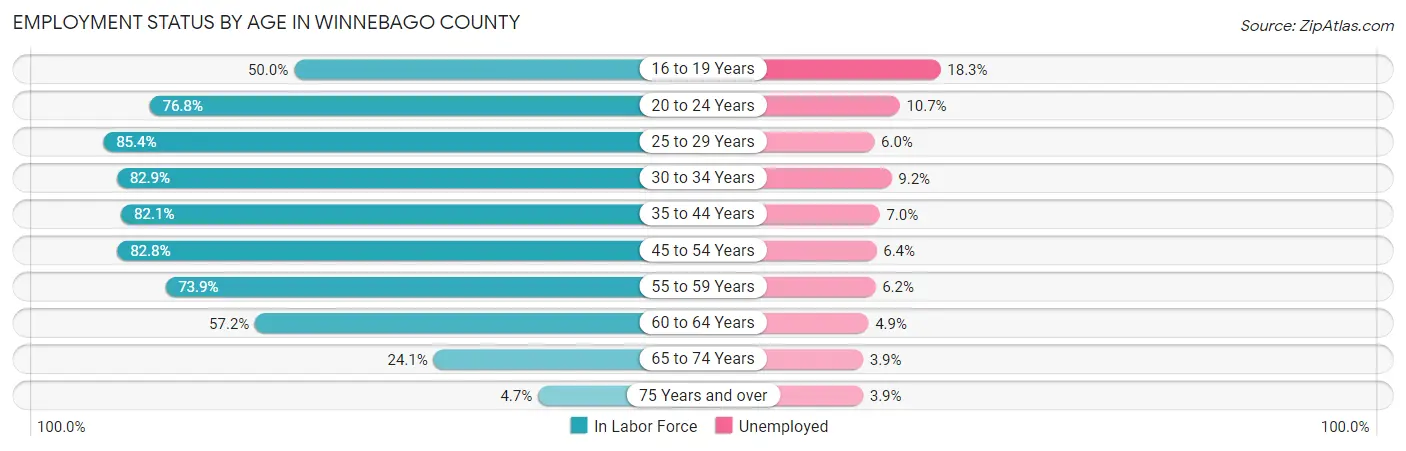
| Age Bracket | In Labor Force | Unemployed |
| 16 to 19 Years | 7,266 (50.0%) | 1,330 (18.3%) |
| 20 to 24 Years | 13,463 (76.8%) | 1,441 (10.7%) |
| 25 to 29 Years | 15,439 (85.4%) | 926 (6.0%) |
| 30 to 34 Years | 14,433 (82.9%) | 1,328 (9.2%) |
| 35 to 44 Years | 27,624 (82.1%) | 1,934 (7.0%) |
| 45 to 54 Years | 29,021 (82.8%) | 1,857 (6.4%) |
| 55 to 59 Years | 14,217 (73.9%) | 881 (6.2%) |
| 60 to 64 Years | 10,898 (57.2%) | 534 (4.9%) |
| 65 to 74 Years | 7,210 (24.1%) | 281 (3.9%) |
| 75 Years and over | 1,003 (4.7%) | 39 (3.9%) |
| Total | 140,441 (62.2%) | 10,533 (7.5%) |
Employment Status by Educational Attainment in Winnebago County
According to labor force statistics for Winnebago County, 78.3% of individuals (111,557) out of the total population between 25 and 64 years of age (142,474) are in the labor force, with 6.7% or 7,474 of them being unemployed. The group with the highest labor force participation rate are those with the educational attainment of bachelor's degree or higher, with 86.8% or 29,979 individuals in the labor force. Within the labor force, individuals with less than high school education have the highest percentage of unemployment, with 10.1% or 972 of them being unemployed.
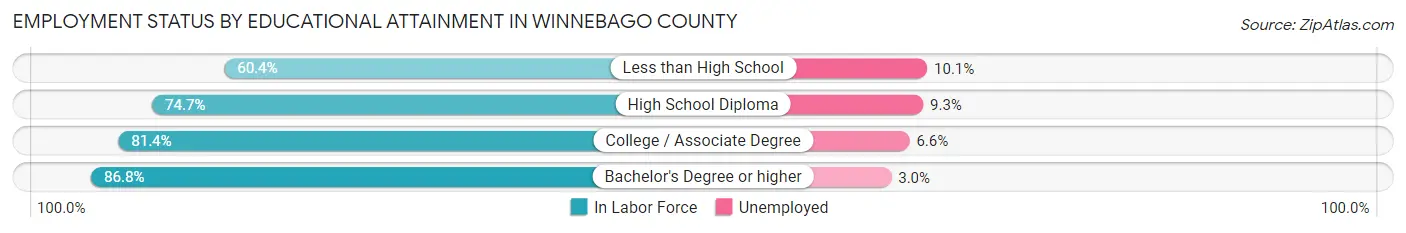
| Educational Attainment | In Labor Force | Unemployed |
| Less than High School | 9,626 (60.4%) | 1,610 (10.1%) |
| High School Diploma | 31,748 (74.7%) | 3,953 (9.3%) |
| College / Associate Degree | 40,291 (81.4%) | 3,267 (6.6%) |
| Bachelor's Degree or higher | 29,979 (86.8%) | 1,036 (3.0%) |
| Total | 111,557 (78.3%) | 9,546 (6.7%) |
Employment Occupations by Sex in Winnebago County
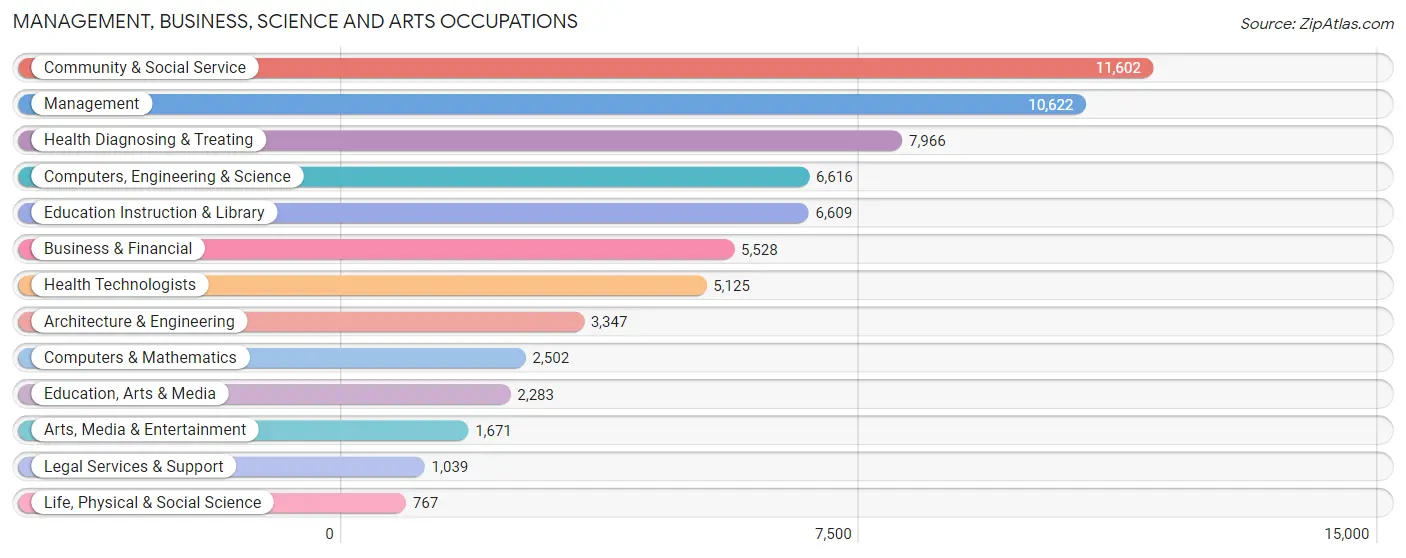
Management, Business, Science and Arts Occupations
The most common Management, Business, Science and Arts occupations in Winnebago County are Community & Social Service (11,602 | 8.9%), Management (10,622 | 8.2%), Health Diagnosing & Treating (7,966 | 6.1%), Computers, Engineering & Science (6,616 | 5.1%), and Education Instruction & Library (6,609 | 5.1%).
Management, Business, Science and Arts Occupations by Sex
Within the Management, Business, Science and Arts occupations in Winnebago County, the most male-oriented occupations are Architecture & Engineering (88.0%), Computers, Engineering & Science (79.9%), and Computers & Mathematics (73.4%), while the most female-oriented occupations are Health Diagnosing & Treating (80.2%), Health Technologists (76.3%), and Education Instruction & Library (73.6%).
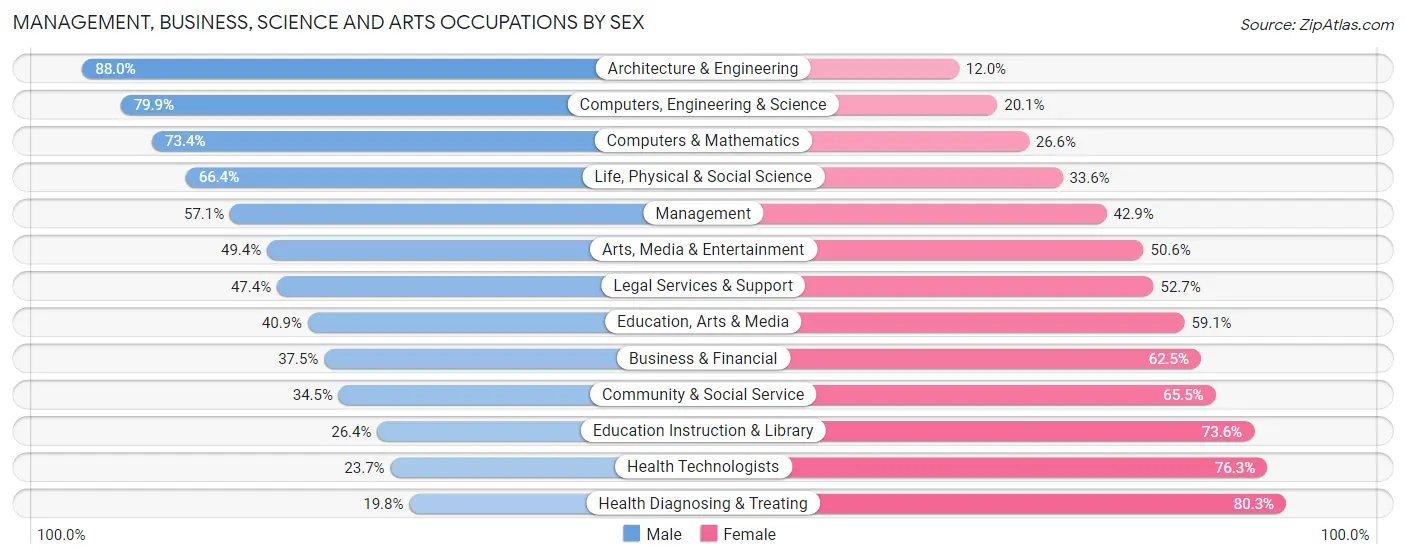
| Occupation | Male | Female |
| Management | 6,069 (57.1%) | 4,553 (42.9%) |
| Business & Financial | 2,073 (37.5%) | 3,455 (62.5%) |
| Computers, Engineering & Science | 5,289 (79.9%) | 1,327 (20.1%) |
| Computers & Mathematics | 1,836 (73.4%) | 666 (26.6%) |
| Architecture & Engineering | 2,944 (88.0%) | 403 (12.0%) |
| Life, Physical & Social Science | 509 (66.4%) | 258 (33.6%) |
| Community & Social Service | 3,998 (34.5%) | 7,604 (65.5%) |
| Education, Arts & Media | 934 (40.9%) | 1,349 (59.1%) |
| Legal Services & Support | 492 (47.3%) | 547 (52.6%) |
| Education Instruction & Library | 1,746 (26.4%) | 4,863 (73.6%) |
| Arts, Media & Entertainment | 826 (49.4%) | 845 (50.6%) |
| Health Diagnosing & Treating | 1,573 (19.8%) | 6,393 (80.2%) |
| Health Technologists | 1,214 (23.7%) | 3,911 (76.3%) |
| Total (Category) | 19,002 (44.9%) | 23,332 (55.1%) |
| Total (Overall) | 67,889 (52.2%) | 62,063 (47.8%) |
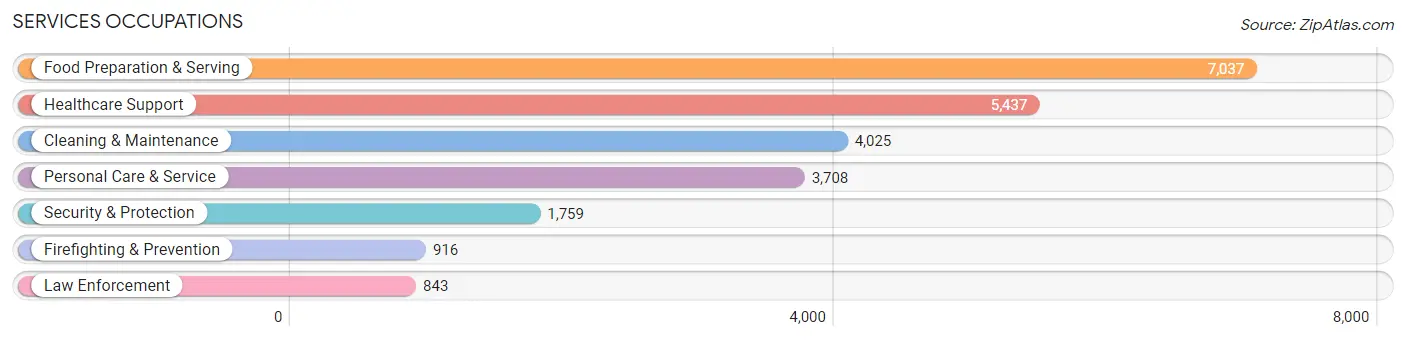
Services Occupations
The most common Services occupations in Winnebago County are Food Preparation & Serving (7,037 | 5.4%), Healthcare Support (5,437 | 4.2%), Cleaning & Maintenance (4,025 | 3.1%), Personal Care & Service (3,708 | 2.9%), and Security & Protection (1,759 | 1.3%).
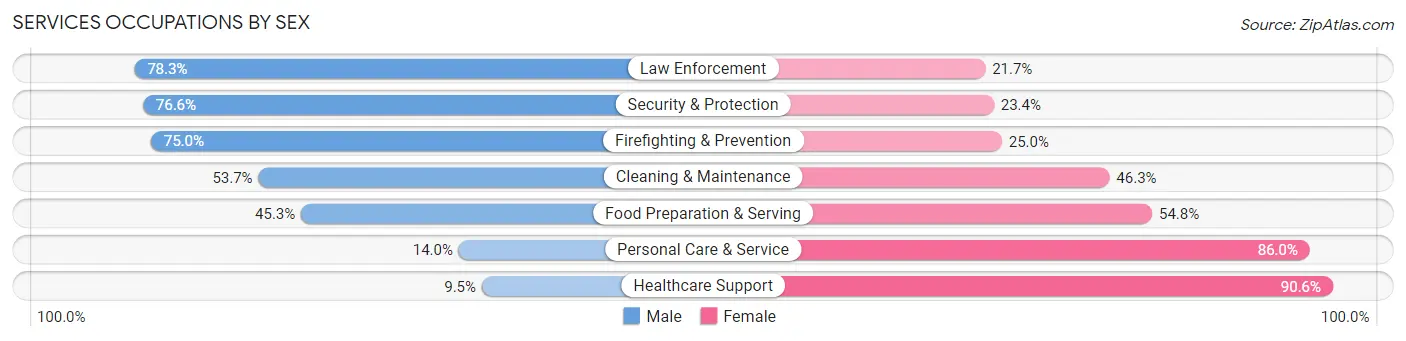
Services Occupations by Sex
Within the Services occupations in Winnebago County, the most male-oriented occupations are Law Enforcement (78.3%), Security & Protection (76.6%), and Firefighting & Prevention (75.0%), while the most female-oriented occupations are Healthcare Support (90.5%), Personal Care & Service (86.0%), and Food Preparation & Serving (54.7%).
| Occupation | Male | Female |
| Healthcare Support | 514 (9.5%) | 4,923 (90.5%) |
| Security & Protection | 1,347 (76.6%) | 412 (23.4%) |
| Firefighting & Prevention | 687 (75.0%) | 229 (25.0%) |
| Law Enforcement | 660 (78.3%) | 183 (21.7%) |
| Food Preparation & Serving | 3,184 (45.3%) | 3,853 (54.7%) |
| Cleaning & Maintenance | 2,161 (53.7%) | 1,864 (46.3%) |
| Personal Care & Service | 520 (14.0%) | 3,188 (86.0%) |
| Total (Category) | 7,726 (35.2%) | 14,240 (64.8%) |
| Total (Overall) | 67,889 (52.2%) | 62,063 (47.8%) |
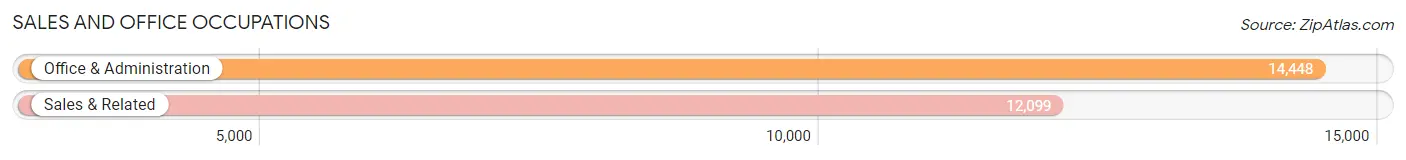
Sales and Office Occupations
The most common Sales and Office occupations in Winnebago County are Office & Administration (14,448 | 11.1%), and Sales & Related (12,099 | 9.3%).
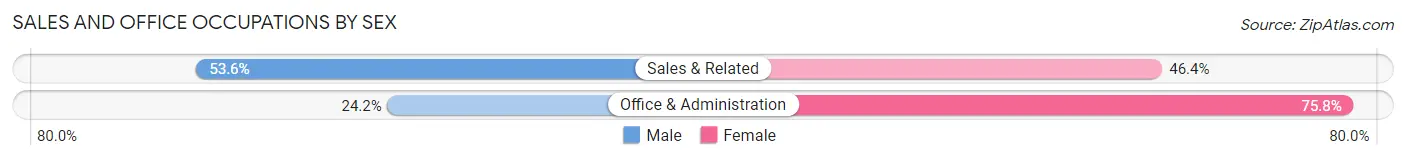
Sales and Office Occupations by Sex
| Occupation | Male | Female |
| Sales & Related | 6,481 (53.6%) | 5,618 (46.4%) |
| Office & Administration | 3,490 (24.2%) | 10,958 (75.8%) |
| Total (Category) | 9,971 (37.6%) | 16,576 (62.4%) |
| Total (Overall) | 67,889 (52.2%) | 62,063 (47.8%) |
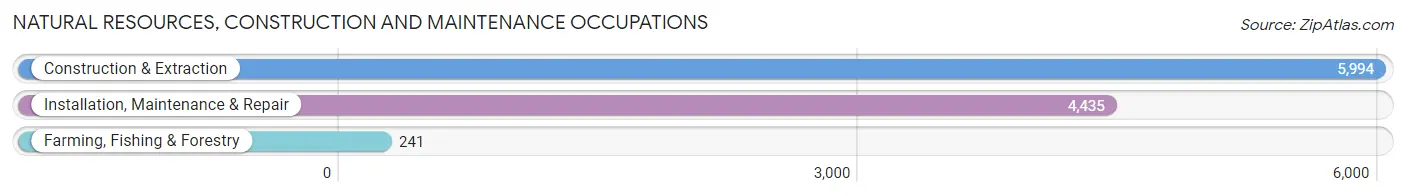
Natural Resources, Construction and Maintenance Occupations
The most common Natural Resources, Construction and Maintenance occupations in Winnebago County are Construction & Extraction (5,994 | 4.6%), Installation, Maintenance & Repair (4,435 | 3.4%), and Farming, Fishing & Forestry (241 | 0.2%).
Natural Resources, Construction and Maintenance Occupations by Sex
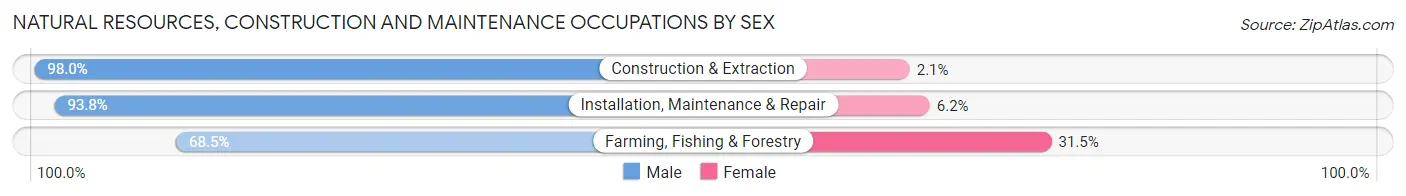
| Occupation | Male | Female |
| Farming, Fishing & Forestry | 165 (68.5%) | 76 (31.5%) |
| Construction & Extraction | 5,871 (98.0%) | 123 (2.1%) |
| Installation, Maintenance & Repair | 4,159 (93.8%) | 276 (6.2%) |
| Total (Category) | 10,195 (95.6%) | 475 (4.4%) |
| Total (Overall) | 67,889 (52.2%) | 62,063 (47.8%) |
Production, Transportation and Moving Occupations
The most common Production, Transportation and Moving occupations in Winnebago County are Production (15,206 | 11.7%), Material Moving (7,849 | 6.0%), and Transportation (5,380 | 4.1%).

Production, Transportation and Moving Occupations by Sex
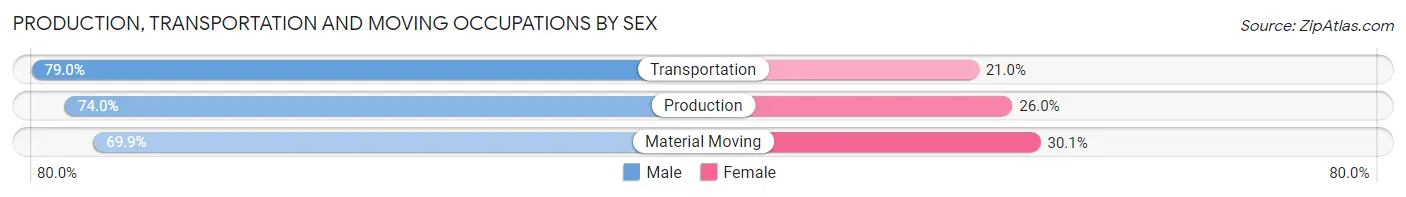
| Occupation | Male | Female |
| Production | 11,259 (74.0%) | 3,947 (26.0%) |
| Transportation | 4,249 (79.0%) | 1,131 (21.0%) |
| Material Moving | 5,487 (69.9%) | 2,362 (30.1%) |
| Total (Category) | 20,995 (73.8%) | 7,440 (26.2%) |
| Total (Overall) | 67,889 (52.2%) | 62,063 (47.8%) |
Employment Industries by Sex in Winnebago County
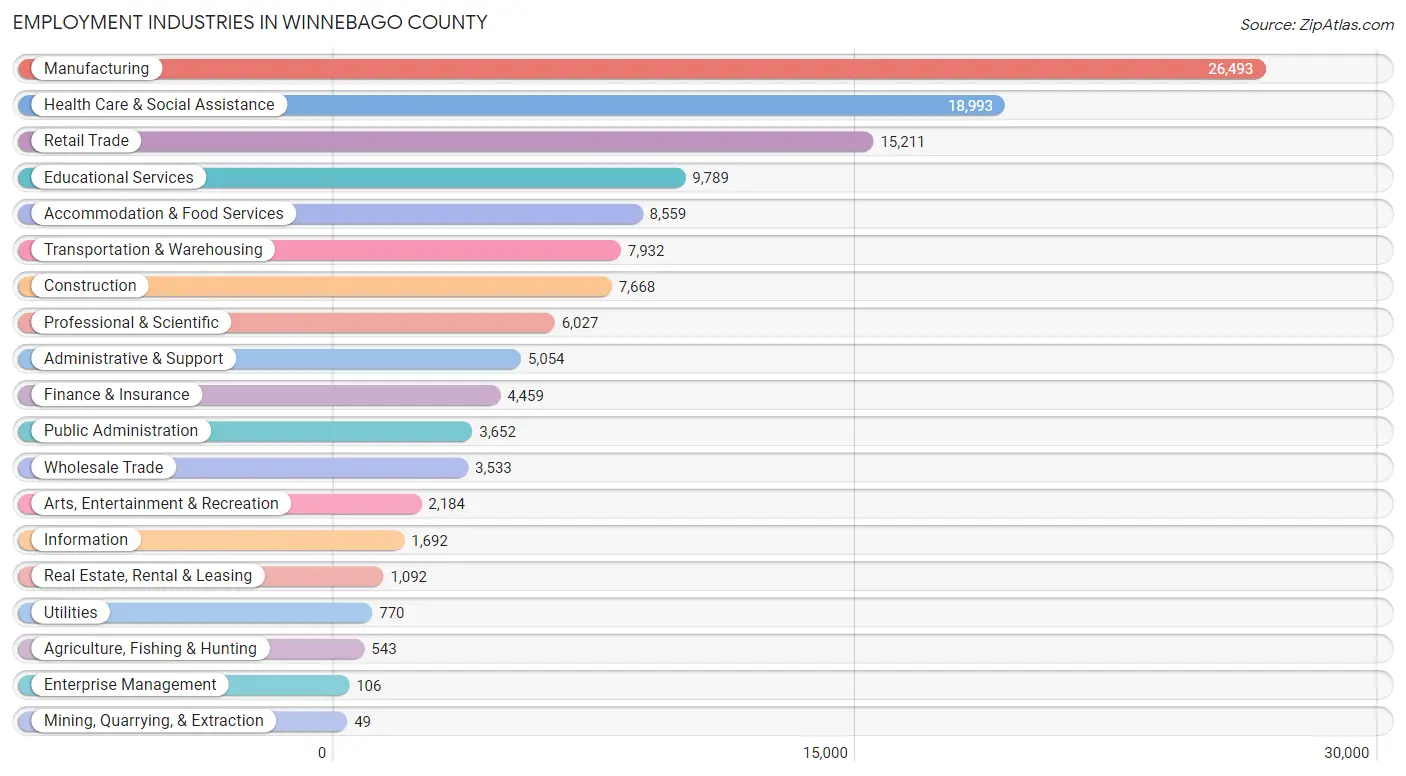
Employment Industries in Winnebago County
The major employment industries in Winnebago County include Manufacturing (26,493 | 20.4%), Health Care & Social Assistance (18,993 | 14.6%), Retail Trade (15,211 | 11.7%), Educational Services (9,789 | 7.5%), and Accommodation & Food Services (8,559 | 6.6%).
Employment Industries by Sex in Winnebago County
The Winnebago County industries that see more men than women are Mining, Quarrying, & Extraction (100.0%), Construction (92.8%), and Utilities (78.3%), whereas the industries that tend to have a higher number of women are Health Care & Social Assistance (84.0%), Finance & Insurance (75.3%), and Educational Services (70.8%).
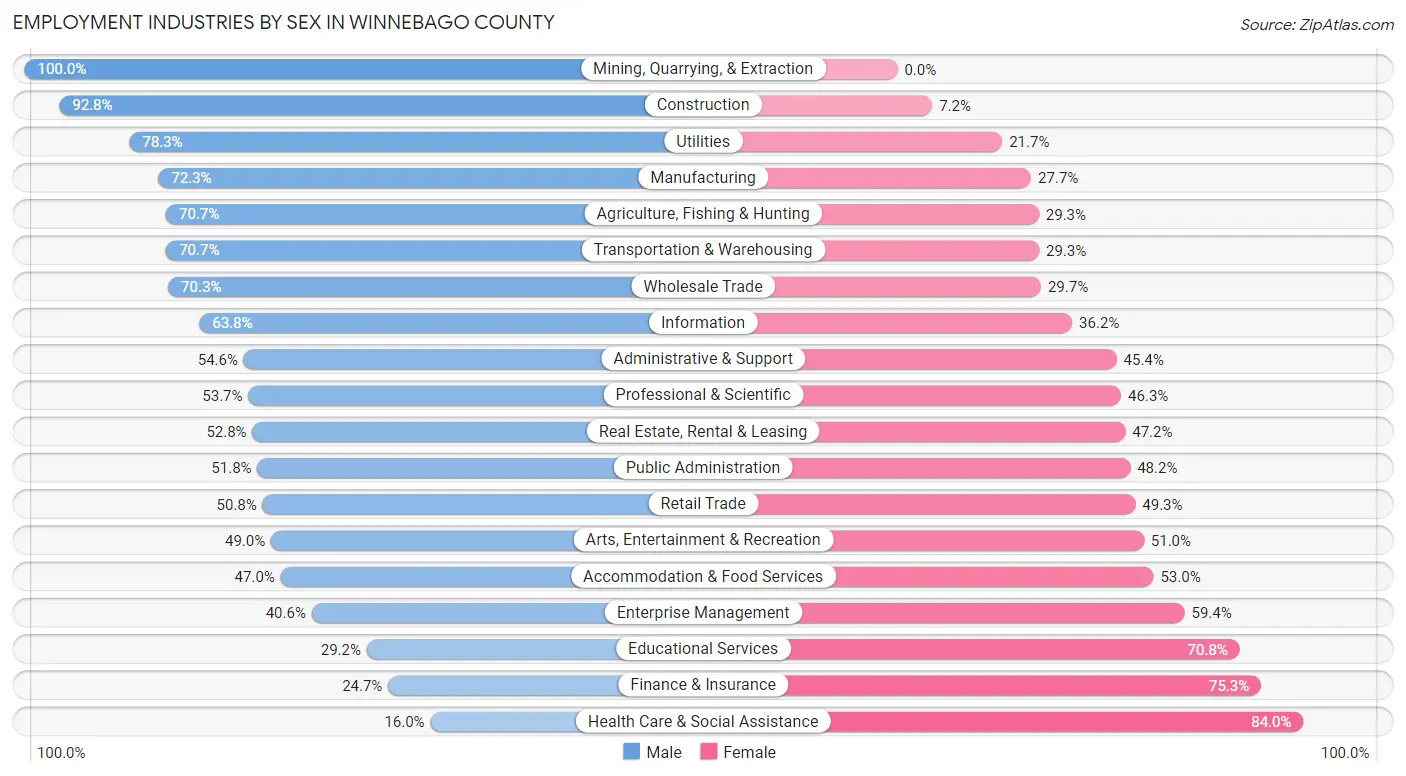
| Industry | Male | Female |
| Agriculture, Fishing & Hunting | 384 (70.7%) | 159 (29.3%) |
| Mining, Quarrying, & Extraction | 49 (100.0%) | 0 (0.0%) |
| Construction | 7,116 (92.8%) | 552 (7.2%) |
| Manufacturing | 19,161 (72.3%) | 7,332 (27.7%) |
| Wholesale Trade | 2,483 (70.3%) | 1,050 (29.7%) |
| Retail Trade | 7,720 (50.7%) | 7,491 (49.2%) |
| Transportation & Warehousing | 5,606 (70.7%) | 2,326 (29.3%) |
| Utilities | 603 (78.3%) | 167 (21.7%) |
| Information | 1,080 (63.8%) | 612 (36.2%) |
| Finance & Insurance | 1,103 (24.7%) | 3,356 (75.3%) |
| Real Estate, Rental & Leasing | 577 (52.8%) | 515 (47.2%) |
| Professional & Scientific | 3,236 (53.7%) | 2,791 (46.3%) |
| Enterprise Management | 43 (40.6%) | 63 (59.4%) |
| Administrative & Support | 2,761 (54.6%) | 2,293 (45.4%) |
| Educational Services | 2,855 (29.2%) | 6,934 (70.8%) |
| Health Care & Social Assistance | 3,038 (16.0%) | 15,955 (84.0%) |
| Arts, Entertainment & Recreation | 1,070 (49.0%) | 1,114 (51.0%) |
| Accommodation & Food Services | 4,023 (47.0%) | 4,536 (53.0%) |
| Public Administration | 1,892 (51.8%) | 1,760 (48.2%) |
| Total | 67,889 (52.2%) | 62,063 (47.8%) |
Education in Winnebago County
School Enrollment in Winnebago County
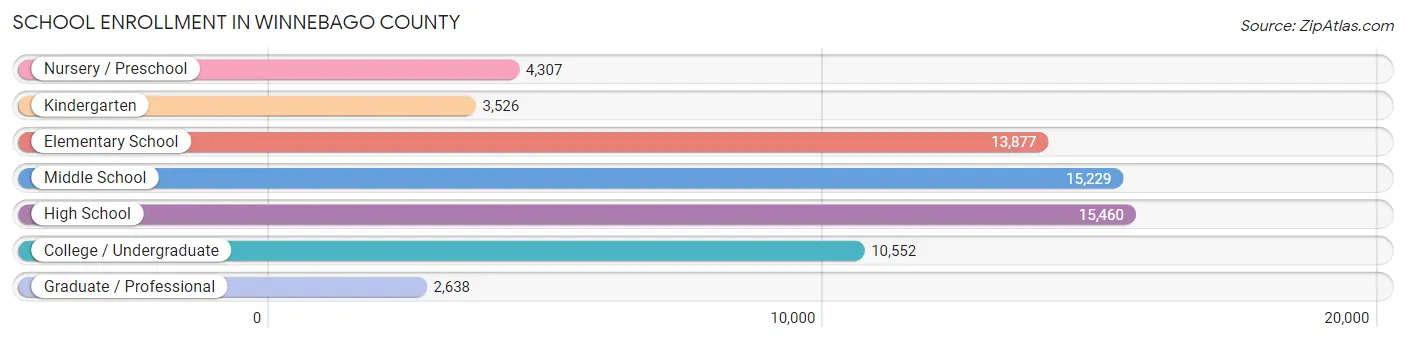
The most common levels of schooling among the 65,589 students in Winnebago County are high school (15,460 | 23.6%), middle school (15,229 | 23.2%), and elementary school (13,877 | 21.2%).
| School Level | # Students | % Students |
| Nursery / Preschool | 4,307 | 6.6% |
| Kindergarten | 3,526 | 5.4% |
| Elementary School | 13,877 | 21.2% |
| Middle School | 15,229 | 23.2% |
| High School | 15,460 | 23.6% |
| College / Undergraduate | 10,552 | 16.1% |
| Graduate / Professional | 2,638 | 4.0% |
| Total | 65,589 | 100.0% |
School Enrollment by Age by Funding Source in Winnebago County
Out of a total of 65,589 students who are enrolled in schools in Winnebago County, 12,003 (18.3%) attend a private institution, while the remaining 53,586 (81.7%) are enrolled in public schools. The age group of 35 years and over has the highest likelihood of being enrolled in private schools, with 1,179 (37.7% in the age bracket) enrolled. Conversely, the age group of 10 to 14 year olds has the lowest likelihood of being enrolled in a private school, with 16,159 (86.0% in the age bracket) attending a public institution.

| Age Bracket | Public School | Private School |
| 3 to 4 Year Olds | 2,613 (75.8%) | 835 (24.2%) |
| 5 to 9 Year Old | 13,794 (84.8%) | 2,474 (15.2%) |
| 10 to 14 Year Olds | 16,159 (86.0%) | 2,633 (14.0%) |
| 15 to 17 Year Olds | 9,400 (85.2%) | 1,637 (14.8%) |
| 18 to 19 Year Olds | 3,539 (85.5%) | 599 (14.5%) |
| 20 to 24 Year Olds | 3,646 (70.6%) | 1,516 (29.4%) |
| 25 to 34 Year Olds | 2,509 (69.4%) | 1,104 (30.6%) |
| 35 Years and over | 1,952 (62.3%) | 1,179 (37.7%) |
| Total | 53,586 (81.7%) | 12,003 (18.3%) |
Educational Attainment by Field of Study in Winnebago County
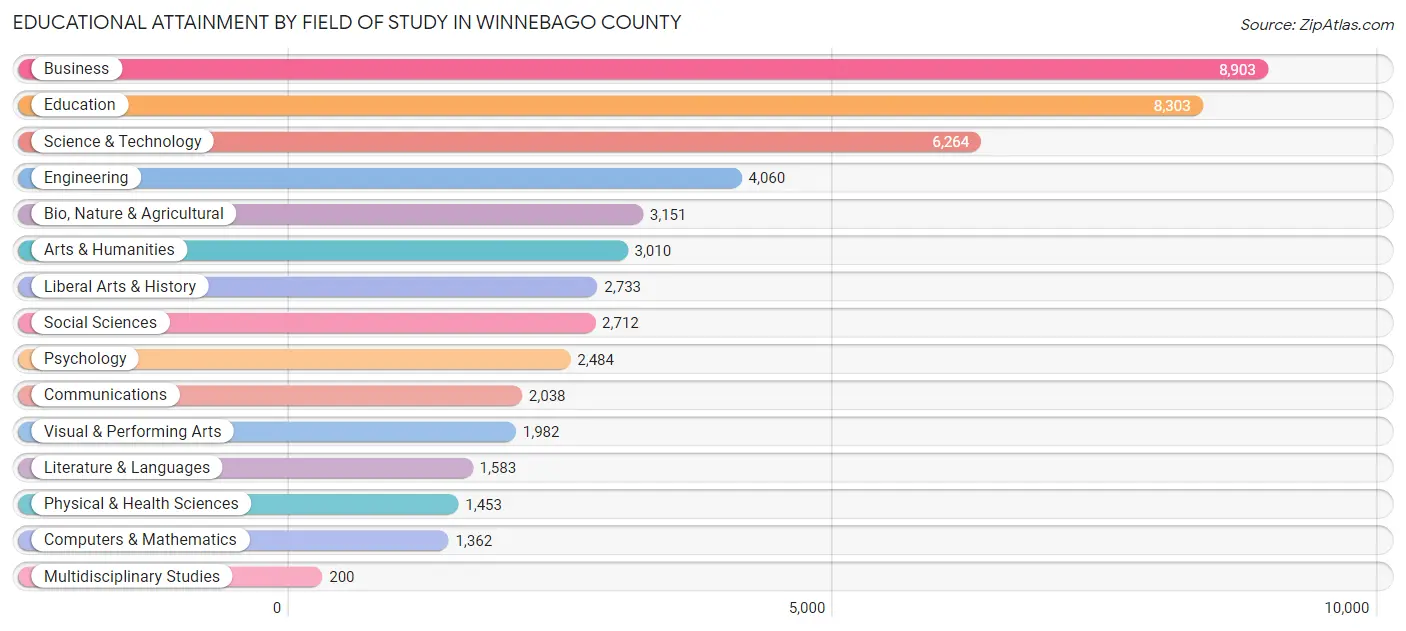
Business (8,903 | 17.7%), education (8,303 | 16.5%), science & technology (6,264 | 12.5%), engineering (4,060 | 8.1%), and bio, nature & agricultural (3,151 | 6.3%) are the most common fields of study among 50,238 individuals in Winnebago County who have obtained a bachelor's degree or higher.
| Field of Study | # Graduates | % Graduates |
| Computers & Mathematics | 1,362 | 2.7% |
| Bio, Nature & Agricultural | 3,151 | 6.3% |
| Physical & Health Sciences | 1,453 | 2.9% |
| Psychology | 2,484 | 4.9% |
| Social Sciences | 2,712 | 5.4% |
| Engineering | 4,060 | 8.1% |
| Multidisciplinary Studies | 200 | 0.4% |
| Science & Technology | 6,264 | 12.5% |
| Business | 8,903 | 17.7% |
| Education | 8,303 | 16.5% |
| Literature & Languages | 1,583 | 3.2% |
| Liberal Arts & History | 2,733 | 5.4% |
| Visual & Performing Arts | 1,982 | 4.0% |
| Communications | 2,038 | 4.1% |
| Arts & Humanities | 3,010 | 6.0% |
| Total | 50,238 | 100.0% |
Transportation & Commute in Winnebago County
Vehicle Availability by Sex in Winnebago County
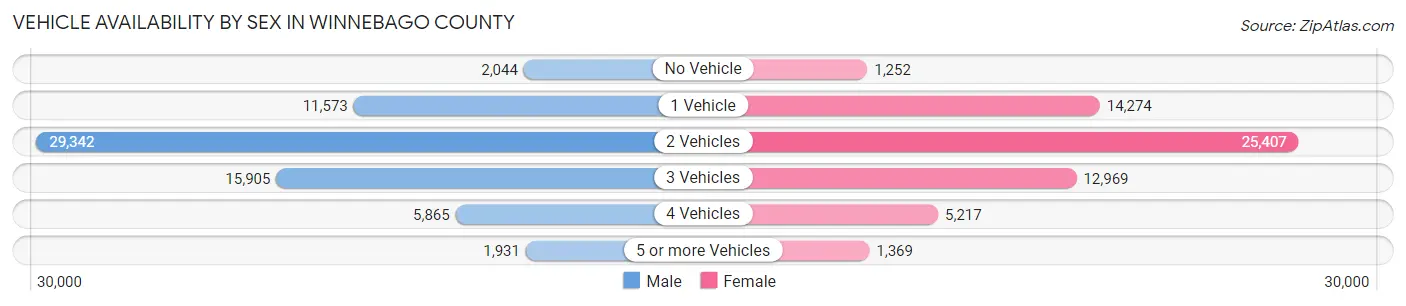
The most prevalent vehicle ownership categories in Winnebago County are males with 2 vehicles (29,342, accounting for 44.0%) and females with 2 vehicles (25,407, making up 48.5%).
| Vehicles Available | Male | Female |
| No Vehicle | 2,044 (3.1%) | 1,252 (2.1%) |
| 1 Vehicle | 11,573 (17.4%) | 14,274 (23.6%) |
| 2 Vehicles | 29,342 (44.0%) | 25,407 (42.0%) |
| 3 Vehicles | 15,905 (23.9%) | 12,969 (21.4%) |
| 4 Vehicles | 5,865 (8.8%) | 5,217 (8.6%) |
| 5 or more Vehicles | 1,931 (2.9%) | 1,369 (2.3%) |
| Total | 66,660 (100.0%) | 60,488 (100.0%) |
Commute Time in Winnebago County
The most frequently occuring commute durations in Winnebago County are 15 to 19 minutes (23,558 commuters, 20.0%), 10 to 14 minutes (21,102 commuters, 17.9%), and 20 to 24 minutes (19,603 commuters, 16.6%).
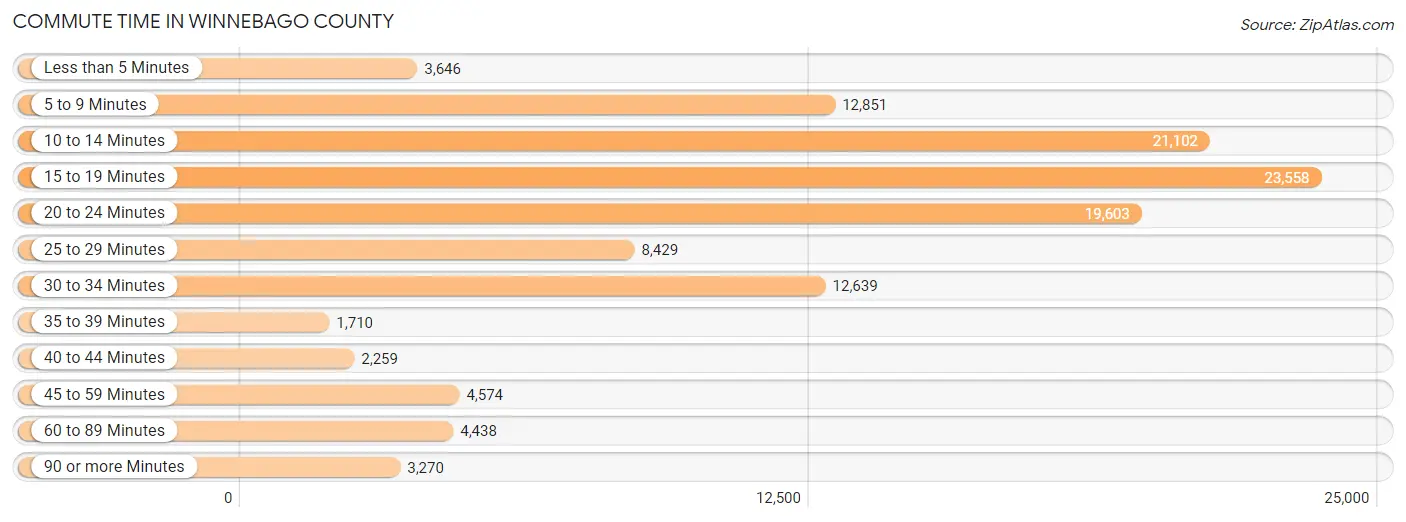
| Commute Time | # Commuters | % Commuters |
| Less than 5 Minutes | 3,646 | 3.1% |
| 5 to 9 Minutes | 12,851 | 10.9% |
| 10 to 14 Minutes | 21,102 | 17.9% |
| 15 to 19 Minutes | 23,558 | 20.0% |
| 20 to 24 Minutes | 19,603 | 16.6% |
| 25 to 29 Minutes | 8,429 | 7.1% |
| 30 to 34 Minutes | 12,639 | 10.7% |
| 35 to 39 Minutes | 1,710 | 1.5% |
| 40 to 44 Minutes | 2,259 | 1.9% |
| 45 to 59 Minutes | 4,574 | 3.9% |
| 60 to 89 Minutes | 4,438 | 3.8% |
| 90 or more Minutes | 3,270 | 2.8% |
Commute Time by Sex in Winnebago County
The most common commute times in Winnebago County are 15 to 19 minutes (11,610 commuters, 18.4%) for males and 15 to 19 minutes (11,948 commuters, 21.8%) for females.
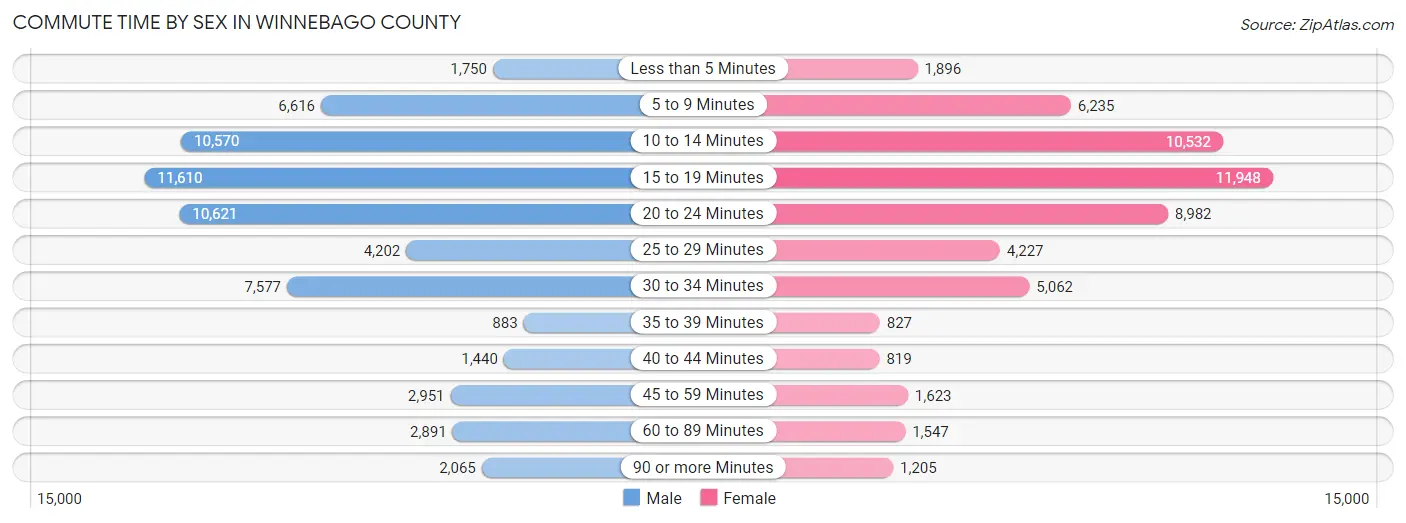
| Commute Time | Male | Female |
| Less than 5 Minutes | 1,750 (2.8%) | 1,896 (3.5%) |
| 5 to 9 Minutes | 6,616 (10.5%) | 6,235 (11.4%) |
| 10 to 14 Minutes | 10,570 (16.7%) | 10,532 (19.2%) |
| 15 to 19 Minutes | 11,610 (18.4%) | 11,948 (21.8%) |
| 20 to 24 Minutes | 10,621 (16.8%) | 8,982 (16.4%) |
| 25 to 29 Minutes | 4,202 (6.7%) | 4,227 (7.7%) |
| 30 to 34 Minutes | 7,577 (12.0%) | 5,062 (9.2%) |
| 35 to 39 Minutes | 883 (1.4%) | 827 (1.5%) |
| 40 to 44 Minutes | 1,440 (2.3%) | 819 (1.5%) |
| 45 to 59 Minutes | 2,951 (4.7%) | 1,623 (3.0%) |
| 60 to 89 Minutes | 2,891 (4.6%) | 1,547 (2.8%) |
| 90 or more Minutes | 2,065 (3.3%) | 1,205 (2.2%) |
Time of Departure to Work by Sex in Winnebago County
The most frequent times of departure to work in Winnebago County are 7:00 AM to 7:29 AM (7,167, 11.3%) for males and 7:00 AM to 7:29 AM (7,978, 14.5%) for females.
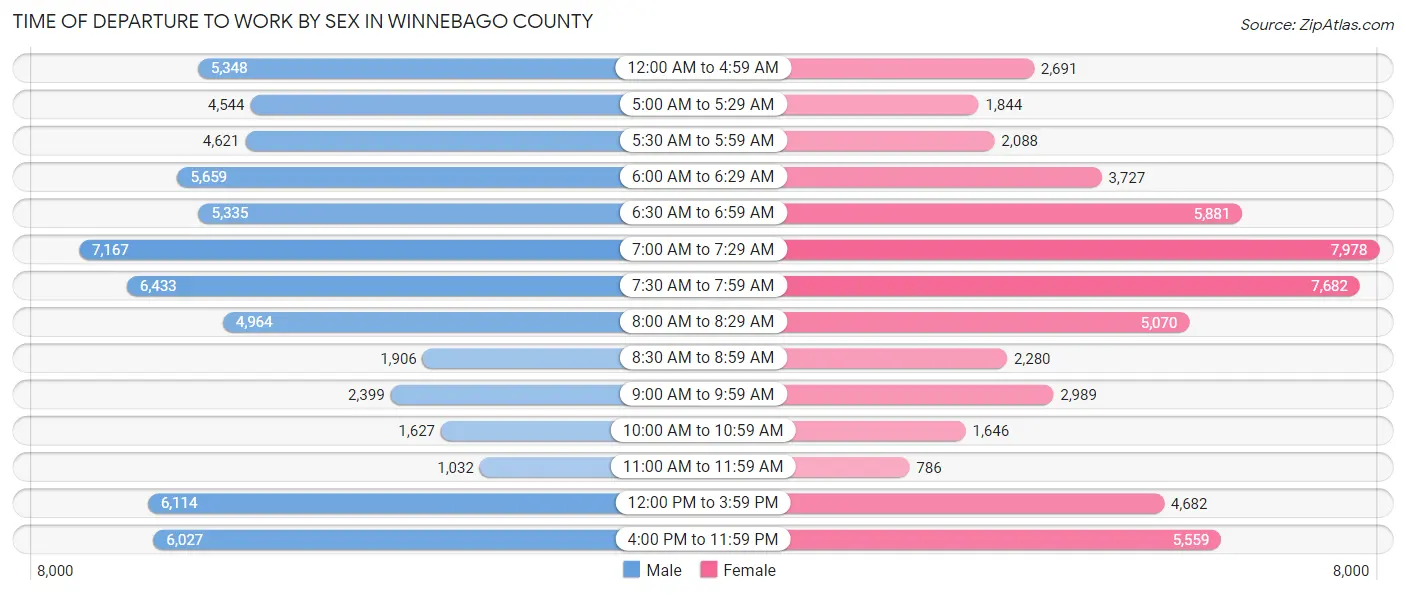
| Time of Departure | Male | Female |
| 12:00 AM to 4:59 AM | 5,348 (8.5%) | 2,691 (4.9%) |
| 5:00 AM to 5:29 AM | 4,544 (7.2%) | 1,844 (3.4%) |
| 5:30 AM to 5:59 AM | 4,621 (7.3%) | 2,088 (3.8%) |
| 6:00 AM to 6:29 AM | 5,659 (9.0%) | 3,727 (6.8%) |
| 6:30 AM to 6:59 AM | 5,335 (8.4%) | 5,881 (10.7%) |
| 7:00 AM to 7:29 AM | 7,167 (11.3%) | 7,978 (14.5%) |
| 7:30 AM to 7:59 AM | 6,433 (10.2%) | 7,682 (14.0%) |
| 8:00 AM to 8:29 AM | 4,964 (7.9%) | 5,070 (9.2%) |
| 8:30 AM to 8:59 AM | 1,906 (3.0%) | 2,280 (4.2%) |
| 9:00 AM to 9:59 AM | 2,399 (3.8%) | 2,989 (5.4%) |
| 10:00 AM to 10:59 AM | 1,627 (2.6%) | 1,646 (3.0%) |
| 11:00 AM to 11:59 AM | 1,032 (1.6%) | 786 (1.4%) |
| 12:00 PM to 3:59 PM | 6,114 (9.7%) | 4,682 (8.5%) |
| 4:00 PM to 11:59 PM | 6,027 (9.5%) | 5,559 (10.1%) |
| Total | 63,176 (100.0%) | 54,903 (100.0%) |
Housing Occupancy in Winnebago County
Occupancy by Ownership in Winnebago County
Of the total 115,214 dwellings in Winnebago County, owner-occupied units account for 75,642 (65.6%), while renter-occupied units make up 39,572 (34.4%).
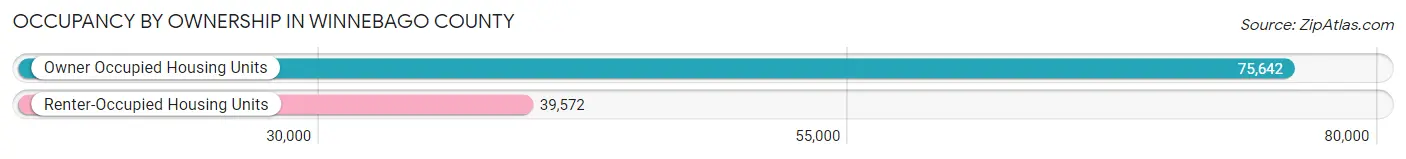
| Occupancy | # Housing Units | % Housing Units |
| Owner Occupied Housing Units | 75,642 | 65.6% |
| Renter-Occupied Housing Units | 39,572 | 34.4% |
| Total Occupied Housing Units | 115,214 | 100.0% |
Occupancy by Household Size in Winnebago County
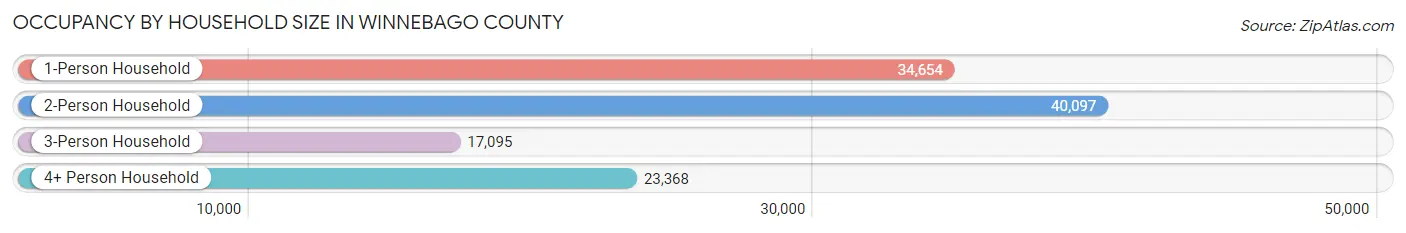
| Household Size | # Housing Units | % Housing Units |
| 1-Person Household | 34,654 | 30.1% |
| 2-Person Household | 40,097 | 34.8% |
| 3-Person Household | 17,095 | 14.8% |
| 4+ Person Household | 23,368 | 20.3% |
| Total Housing Units | 115,214 | 100.0% |
Occupancy by Ownership by Household Size in Winnebago County
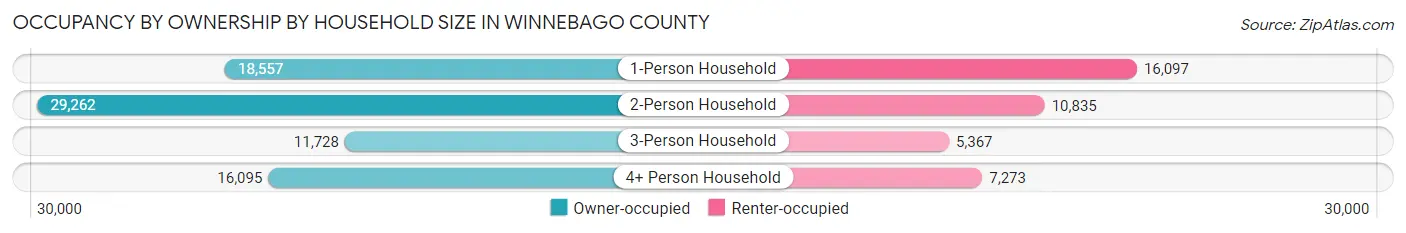
| Household Size | Owner-occupied | Renter-occupied |
| 1-Person Household | 18,557 (53.5%) | 16,097 (46.5%) |
| 2-Person Household | 29,262 (73.0%) | 10,835 (27.0%) |
| 3-Person Household | 11,728 (68.6%) | 5,367 (31.4%) |
| 4+ Person Household | 16,095 (68.9%) | 7,273 (31.1%) |
| Total Housing Units | 75,642 (65.6%) | 39,572 (34.4%) |
Occupancy by Educational Attainment in Winnebago County
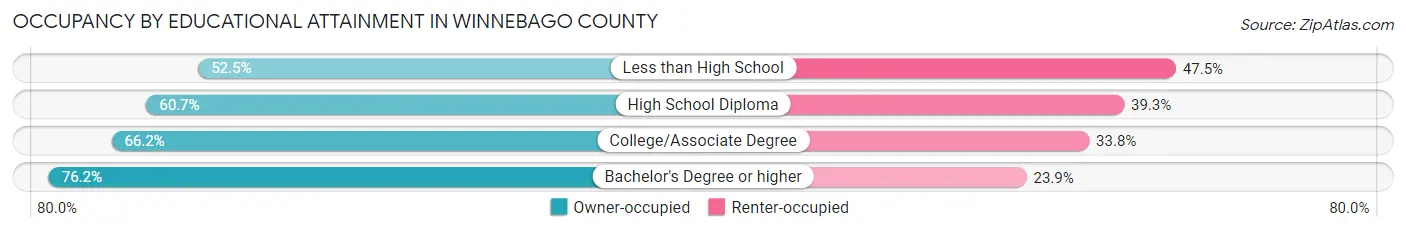
| Household Size | Owner-occupied | Renter-occupied |
| Less than High School | 6,463 (52.5%) | 5,856 (47.5%) |
| High School Diploma | 20,194 (60.7%) | 13,085 (39.3%) |
| College/Associate Degree | 26,856 (66.2%) | 13,702 (33.8%) |
| Bachelor's Degree or higher | 22,129 (76.1%) | 6,929 (23.8%) |
Occupancy by Age of Householder in Winnebago County
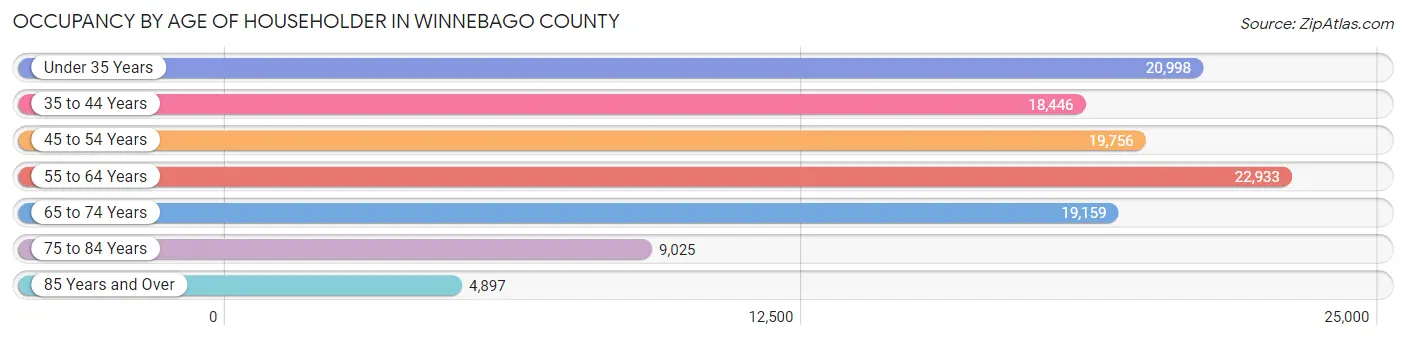
| Age Bracket | # Households | % Households |
| Under 35 Years | 20,998 | 18.2% |
| 35 to 44 Years | 18,446 | 16.0% |
| 45 to 54 Years | 19,756 | 17.2% |
| 55 to 64 Years | 22,933 | 19.9% |
| 65 to 74 Years | 19,159 | 16.6% |
| 75 to 84 Years | 9,025 | 7.8% |
| 85 Years and Over | 4,897 | 4.3% |
| Total | 115,214 | 100.0% |
Housing Finances in Winnebago County
Median Income by Occupancy in Winnebago County
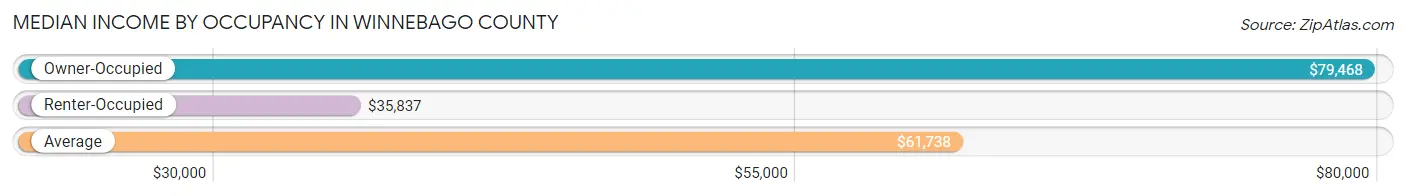
| Occupancy Type | # Households | Median Income |
| Owner-Occupied | 75,642 (65.6%) | $79,468 |
| Renter-Occupied | 39,572 (34.4%) | $35,837 |
| Average | 115,214 (100.0%) | $61,738 |
Occupancy by Householder Income Bracket in Winnebago County
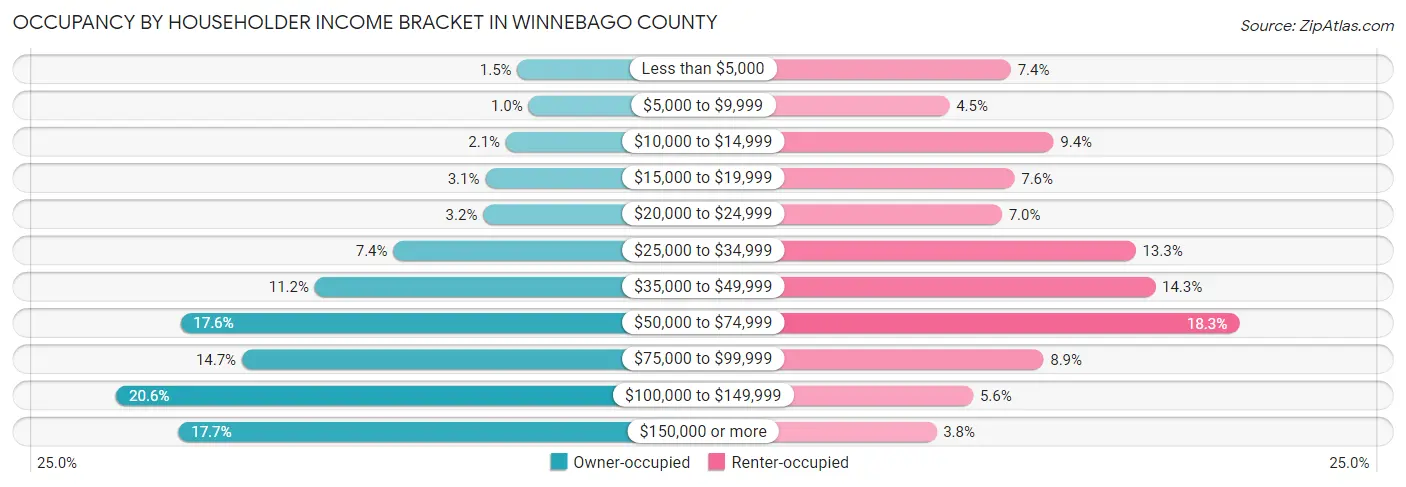
| Income Bracket | Owner-occupied | Renter-occupied |
| Less than $5,000 | 1,155 (1.5%) | 2,923 (7.4%) |
| $5,000 to $9,999 | 756 (1.0%) | 1,766 (4.5%) |
| $10,000 to $14,999 | 1,574 (2.1%) | 3,726 (9.4%) |
| $15,000 to $19,999 | 2,314 (3.1%) | 2,991 (7.6%) |
| $20,000 to $24,999 | 2,389 (3.2%) | 2,753 (7.0%) |
| $25,000 to $34,999 | 5,624 (7.4%) | 5,275 (13.3%) |
| $35,000 to $49,999 | 8,459 (11.2%) | 5,641 (14.3%) |
| $50,000 to $74,999 | 13,301 (17.6%) | 7,227 (18.3%) |
| $75,000 to $99,999 | 11,081 (14.6%) | 3,536 (8.9%) |
| $100,000 to $149,999 | 15,615 (20.6%) | 2,214 (5.6%) |
| $150,000 or more | 13,374 (17.7%) | 1,520 (3.8%) |
| Total | 75,642 (100.0%) | 39,572 (100.0%) |
Monthly Housing Cost Tiers in Winnebago County
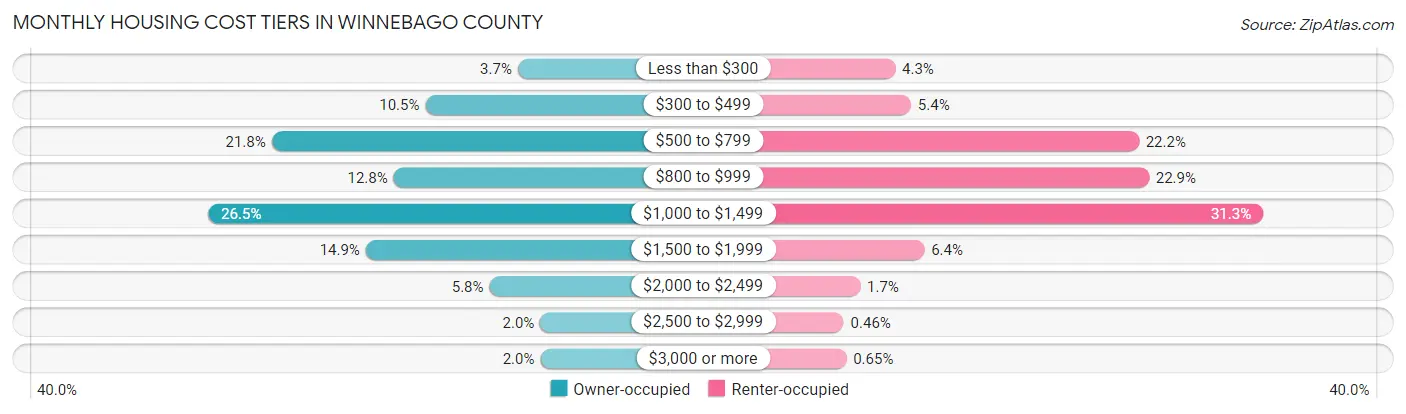
| Monthly Cost | Owner-occupied | Renter-occupied |
| Less than $300 | 2,786 (3.7%) | 1,682 (4.3%) |
| $300 to $499 | 7,932 (10.5%) | 2,142 (5.4%) |
| $500 to $799 | 16,494 (21.8%) | 8,783 (22.2%) |
| $800 to $999 | 9,705 (12.8%) | 9,072 (22.9%) |
| $1,000 to $1,499 | 20,039 (26.5%) | 12,403 (31.3%) |
| $1,500 to $1,999 | 11,253 (14.9%) | 2,529 (6.4%) |
| $2,000 to $2,499 | 4,368 (5.8%) | 660 (1.7%) |
| $2,500 to $2,999 | 1,536 (2.0%) | 182 (0.5%) |
| $3,000 or more | 1,529 (2.0%) | 258 (0.6%) |
| Total | 75,642 (100.0%) | 39,572 (100.0%) |
Physical Housing Characteristics in Winnebago County
Housing Structures in Winnebago County
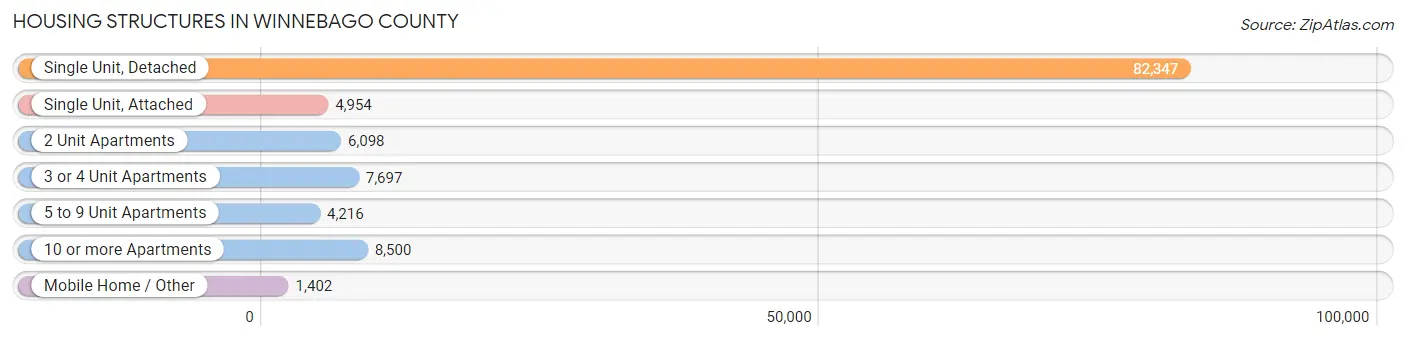
| Structure Type | # Housing Units | % Housing Units |
| Single Unit, Detached | 82,347 | 71.5% |
| Single Unit, Attached | 4,954 | 4.3% |
| 2 Unit Apartments | 6,098 | 5.3% |
| 3 or 4 Unit Apartments | 7,697 | 6.7% |
| 5 to 9 Unit Apartments | 4,216 | 3.7% |
| 10 or more Apartments | 8,500 | 7.4% |
| Mobile Home / Other | 1,402 | 1.2% |
| Total | 115,214 | 100.0% |
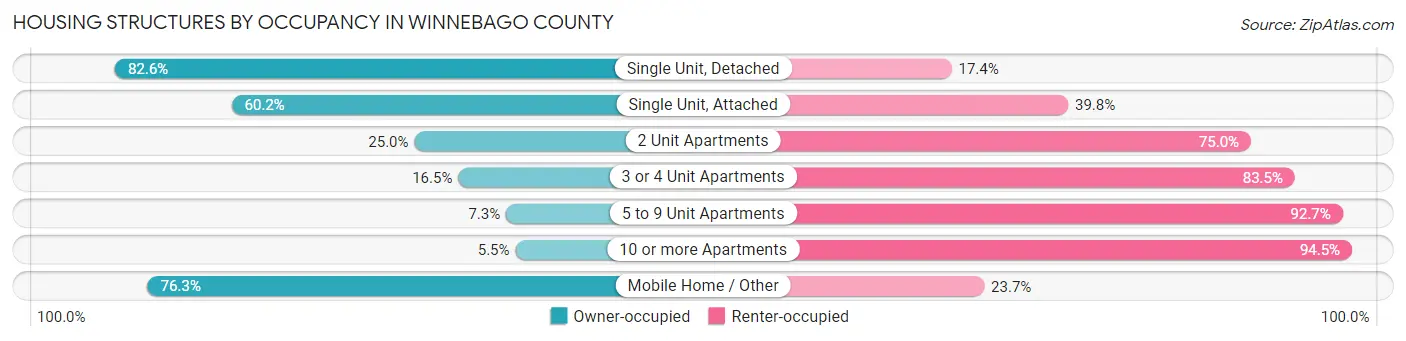
Housing Structures by Occupancy in Winnebago County
| Structure Type | Owner-occupied | Renter-occupied |
| Single Unit, Detached | 68,022 (82.6%) | 14,325 (17.4%) |
| Single Unit, Attached | 2,981 (60.2%) | 1,973 (39.8%) |
| 2 Unit Apartments | 1,522 (25.0%) | 4,576 (75.0%) |
| 3 or 4 Unit Apartments | 1,271 (16.5%) | 6,426 (83.5%) |
| 5 to 9 Unit Apartments | 308 (7.3%) | 3,908 (92.7%) |
| 10 or more Apartments | 468 (5.5%) | 8,032 (94.5%) |
| Mobile Home / Other | 1,070 (76.3%) | 332 (23.7%) |
| Total | 75,642 (65.6%) | 39,572 (34.4%) |
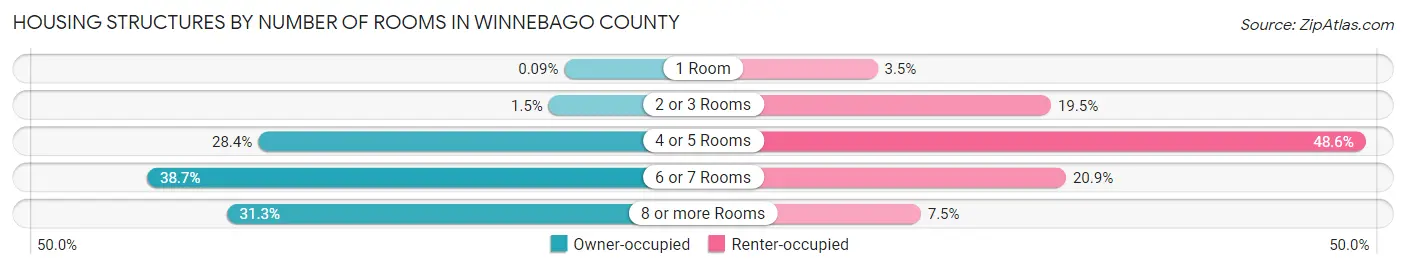
Housing Structures by Number of Rooms in Winnebago County
| Number of Rooms | Owner-occupied | Renter-occupied |
| 1 Room | 66 (0.1%) | 1,377 (3.5%) |
| 2 or 3 Rooms | 1,156 (1.5%) | 7,725 (19.5%) |
| 4 or 5 Rooms | 21,488 (28.4%) | 19,237 (48.6%) |
| 6 or 7 Rooms | 29,249 (38.7%) | 8,273 (20.9%) |
| 8 or more Rooms | 23,683 (31.3%) | 2,960 (7.5%) |
| Total | 75,642 (100.0%) | 39,572 (100.0%) |
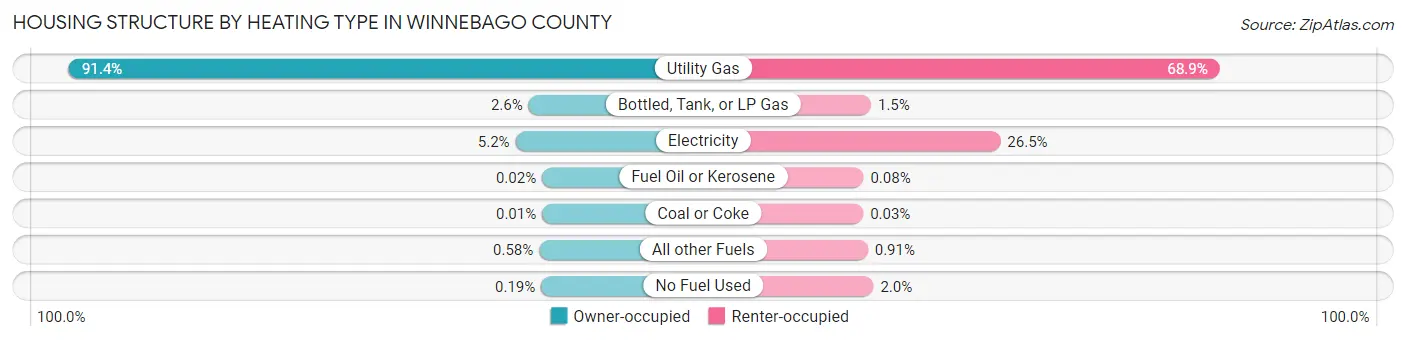
Housing Structure by Heating Type in Winnebago County
| Heating Type | Owner-occupied | Renter-occupied |
| Utility Gas | 69,159 (91.4%) | 27,256 (68.9%) |
| Bottled, Tank, or LP Gas | 1,984 (2.6%) | 610 (1.5%) |
| Electricity | 3,893 (5.1%) | 10,504 (26.5%) |
| Fuel Oil or Kerosene | 17 (0.0%) | 33 (0.1%) |
| Coal or Coke | 4 (0.0%) | 12 (0.0%) |
| All other Fuels | 441 (0.6%) | 360 (0.9%) |
| No Fuel Used | 144 (0.2%) | 797 (2.0%) |
| Total | 75,642 (100.0%) | 39,572 (100.0%) |
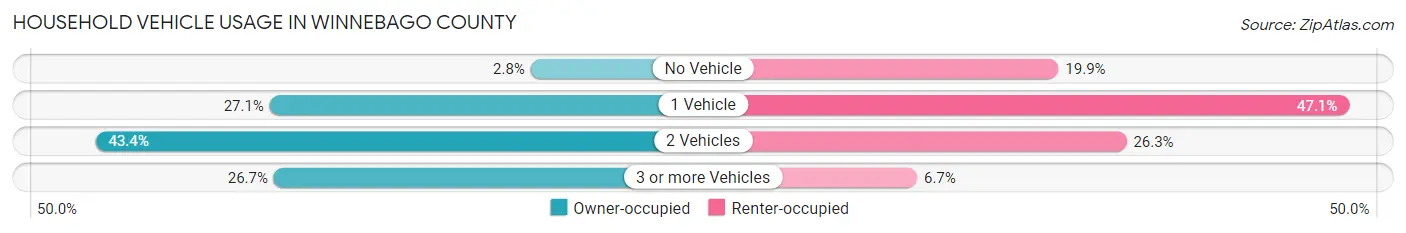
Household Vehicle Usage in Winnebago County
| Vehicles per Household | Owner-occupied | Renter-occupied |
| No Vehicle | 2,086 (2.8%) | 7,888 (19.9%) |
| 1 Vehicle | 20,516 (27.1%) | 18,623 (47.1%) |
| 2 Vehicles | 32,814 (43.4%) | 10,398 (26.3%) |
| 3 or more Vehicles | 20,226 (26.7%) | 2,663 (6.7%) |
| Total | 75,642 (100.0%) | 39,572 (100.0%) |
Real Estate & Mortgages in Winnebago County
Real Estate and Mortgage Overview in Winnebago County
| Characteristic | Without Mortgage | With Mortgage |
| Housing Units | 29,454 | 46,188 |
| Median Property Value | $133,700 | $154,000 |
| Median Household Income | $63,078 | $9,442 |
| Monthly Housing Costs | $598 | $1,439 |
| Real Estate Taxes | $3,386 | $760 |
Property Value by Mortgage Status in Winnebago County
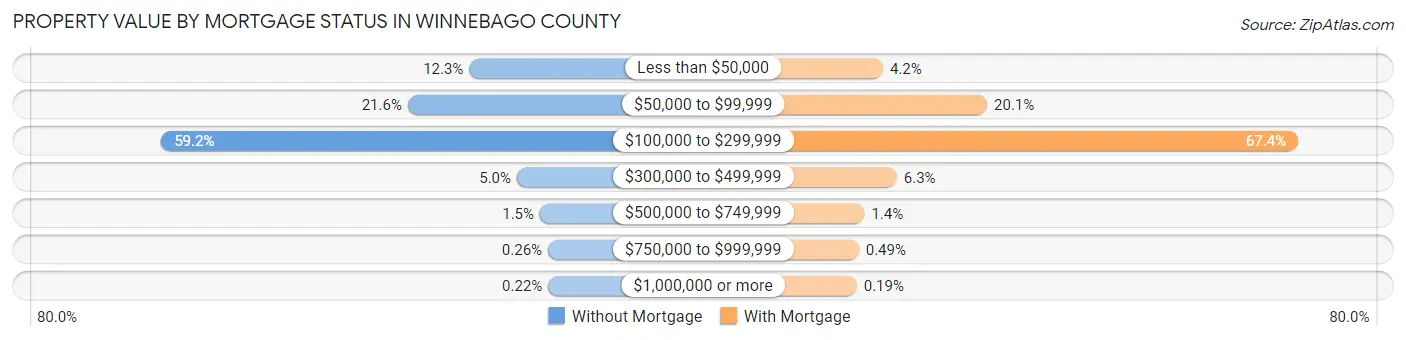
| Property Value | Without Mortgage | With Mortgage |
| Less than $50,000 | 3,608 (12.2%) | 1,933 (4.2%) |
| $50,000 to $99,999 | 6,369 (21.6%) | 9,262 (20.1%) |
| $100,000 to $299,999 | 17,431 (59.2%) | 31,143 (67.4%) |
| $300,000 to $499,999 | 1,470 (5.0%) | 2,908 (6.3%) |
| $500,000 to $749,999 | 435 (1.5%) | 628 (1.4%) |
| $750,000 to $999,999 | 77 (0.3%) | 227 (0.5%) |
| $1,000,000 or more | 64 (0.2%) | 87 (0.2%) |
| Total | 29,454 (100.0%) | 46,188 (100.0%) |
Household Income by Mortgage Status in Winnebago County
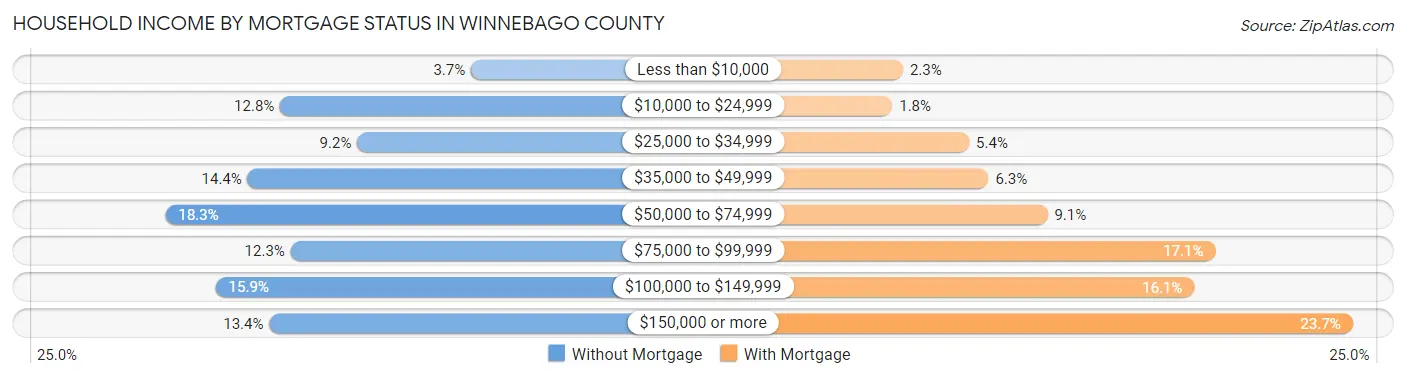
| Household Income | Without Mortgage | With Mortgage |
| Less than $10,000 | 1,102 (3.7%) | 1,045 (2.3%) |
| $10,000 to $24,999 | 3,779 (12.8%) | 809 (1.8%) |
| $25,000 to $34,999 | 2,699 (9.2%) | 2,498 (5.4%) |
| $35,000 to $49,999 | 4,236 (14.4%) | 2,925 (6.3%) |
| $50,000 to $74,999 | 5,391 (18.3%) | 4,223 (9.1%) |
| $75,000 to $99,999 | 3,633 (12.3%) | 7,910 (17.1%) |
| $100,000 to $149,999 | 4,682 (15.9%) | 7,448 (16.1%) |
| $150,000 or more | 3,932 (13.4%) | 10,933 (23.7%) |
| Total | 29,454 (100.0%) | 46,188 (100.0%) |
Property Value to Household Income Ratio in Winnebago County
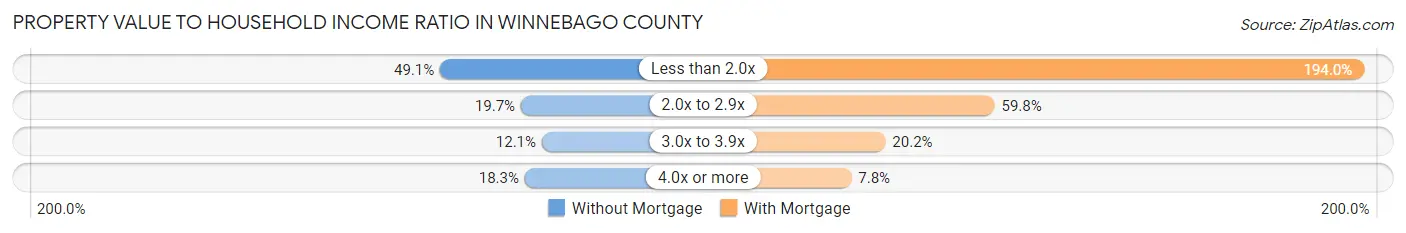
| Value-to-Income Ratio | Without Mortgage | With Mortgage |
| Less than 2.0x | 14,460 (49.1%) | 89,622 (194.0%) |
| 2.0x to 2.9x | 5,805 (19.7%) | 27,624 (59.8%) |
| 3.0x to 3.9x | 3,569 (12.1%) | 9,306 (20.2%) |
| 4.0x or more | 5,393 (18.3%) | 3,590 (7.8%) |
| Total | 29,454 (100.0%) | 46,188 (100.0%) |
Real Estate Taxes by Mortgage Status in Winnebago County
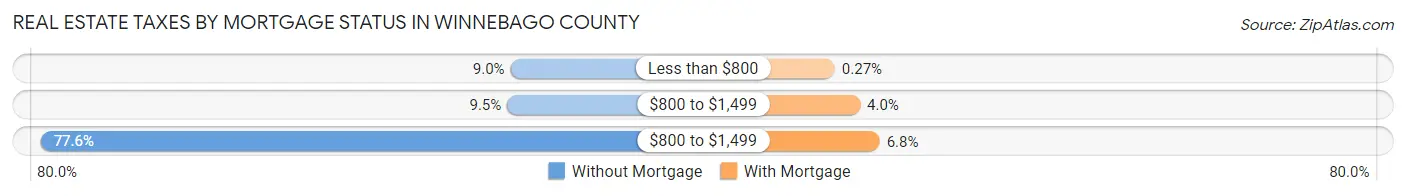
| Property Taxes | Without Mortgage | With Mortgage |
| Less than $800 | 2,654 (9.0%) | 123 (0.3%) |
| $800 to $1,499 | 2,798 (9.5%) | 1,826 (4.0%) |
| $800 to $1,499 | 22,867 (77.6%) | 3,148 (6.8%) |
| Total | 29,454 (100.0%) | 46,188 (100.0%) |
Health & Disability in Winnebago County
Health Insurance Coverage by Age in Winnebago County
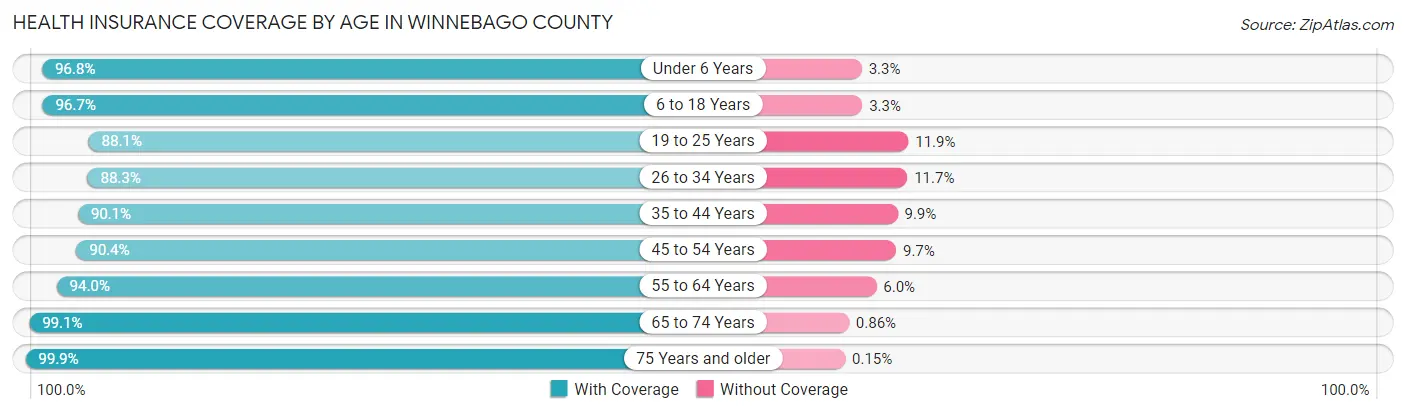
| Age Bracket | With Coverage | Without Coverage |
| Under 6 Years | 20,369 (96.8%) | 685 (3.3%) |
| 6 to 18 Years | 47,049 (96.7%) | 1,628 (3.3%) |
| 19 to 25 Years | 20,934 (88.1%) | 2,839 (11.9%) |
| 26 to 34 Years | 28,308 (88.3%) | 3,767 (11.7%) |
| 35 to 44 Years | 30,099 (90.1%) | 3,319 (9.9%) |
| 45 to 54 Years | 31,432 (90.3%) | 3,357 (9.7%) |
| 55 to 64 Years | 35,748 (94.0%) | 2,275 (6.0%) |
| 65 to 74 Years | 29,297 (99.1%) | 255 (0.9%) |
| 75 Years and older | 20,179 (99.9%) | 31 (0.2%) |
| Total | 263,415 (93.5%) | 18,156 (6.5%) |
Health Insurance Coverage by Citizenship Status in Winnebago County
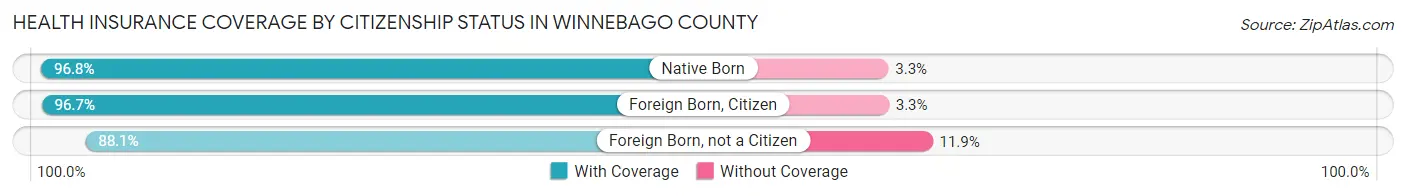
| Citizenship Status | With Coverage | Without Coverage |
| Native Born | 20,369 (96.8%) | 685 (3.3%) |
| Foreign Born, Citizen | 47,049 (96.7%) | 1,628 (3.3%) |
| Foreign Born, not a Citizen | 20,934 (88.1%) | 2,839 (11.9%) |
Health Insurance Coverage by Household Income in Winnebago County
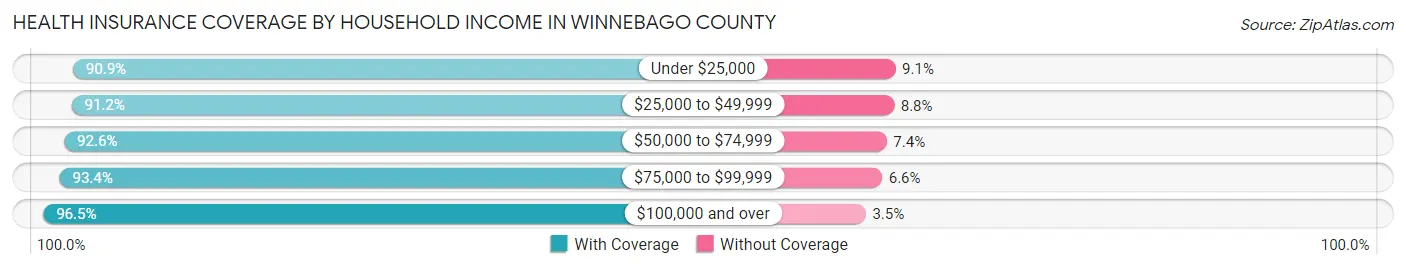
| Household Income | With Coverage | Without Coverage |
| Under $25,000 | 37,303 (90.9%) | 3,715 (9.1%) |
| $25,000 to $49,999 | 48,058 (91.2%) | 4,635 (8.8%) |
| $50,000 to $74,999 | 46,288 (92.6%) | 3,708 (7.4%) |
| $75,000 to $99,999 | 36,102 (93.4%) | 2,536 (6.6%) |
| $100,000 and over | 94,661 (96.5%) | 3,432 (3.5%) |
Public vs Private Health Insurance Coverage by Age in Winnebago County
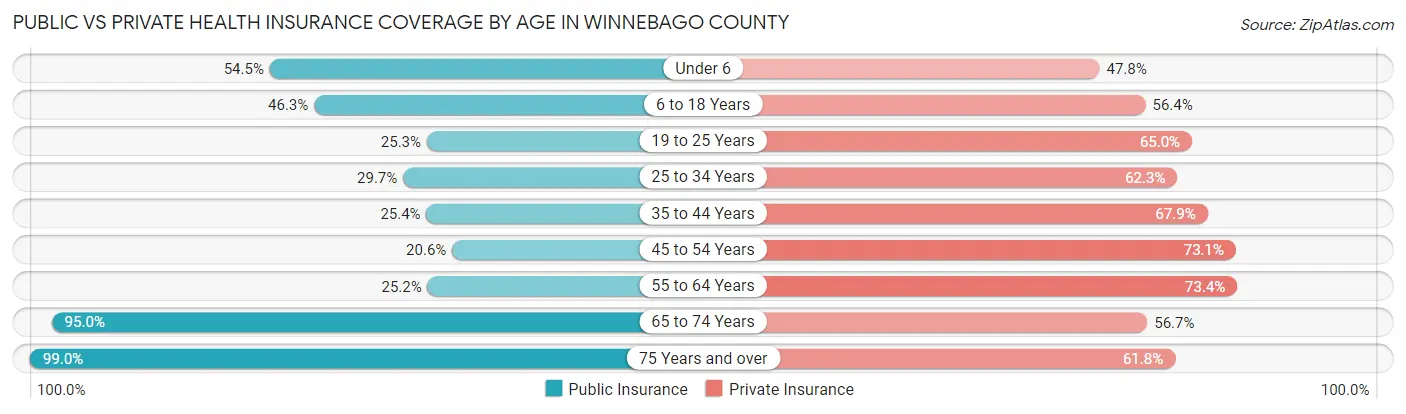
| Age Bracket | Public Insurance | Private Insurance |
| Under 6 | 11,474 (54.5%) | 10,073 (47.8%) |
| 6 to 18 Years | 22,520 (46.3%) | 27,442 (56.4%) |
| 19 to 25 Years | 6,022 (25.3%) | 15,450 (65.0%) |
| 25 to 34 Years | 9,540 (29.7%) | 19,970 (62.3%) |
| 35 to 44 Years | 8,492 (25.4%) | 22,689 (67.9%) |
| 45 to 54 Years | 7,181 (20.6%) | 25,438 (73.1%) |
| 55 to 64 Years | 9,587 (25.2%) | 27,901 (73.4%) |
| 65 to 74 Years | 28,065 (95.0%) | 16,755 (56.7%) |
| 75 Years and over | 20,010 (99.0%) | 12,498 (61.8%) |
| Total | 122,891 (43.6%) | 178,216 (63.3%) |
Disability Status by Sex by Age in Winnebago County
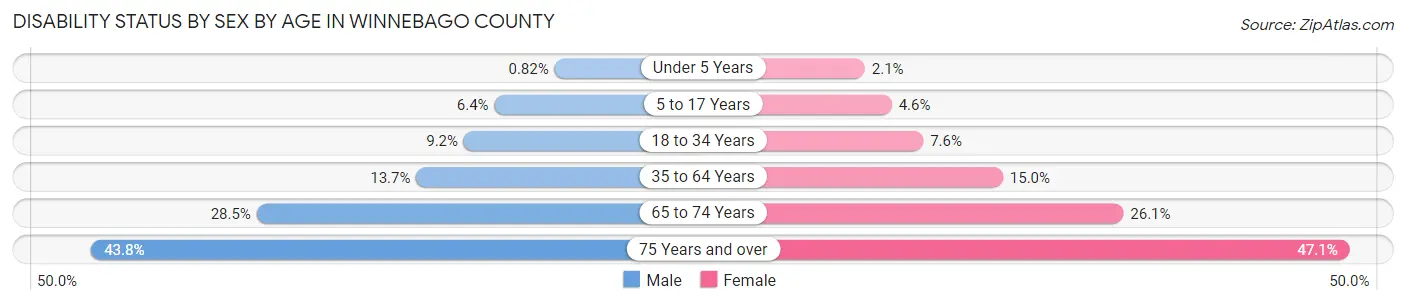
| Age Bracket | Male | Female |
| Under 5 Years | 74 (0.8%) | 182 (2.1%) |
| 5 to 17 Years | 1,602 (6.4%) | 1,103 (4.6%) |
| 18 to 34 Years | 2,700 (9.2%) | 2,264 (7.6%) |
| 35 to 64 Years | 7,145 (13.7%) | 8,057 (14.9%) |
| 65 to 74 Years | 4,003 (28.5%) | 4,047 (26.1%) |
| 75 Years and over | 3,683 (43.8%) | 5,562 (47.1%) |
Disability Class by Sex by Age in Winnebago County
Disability Class: Hearing Difficulty
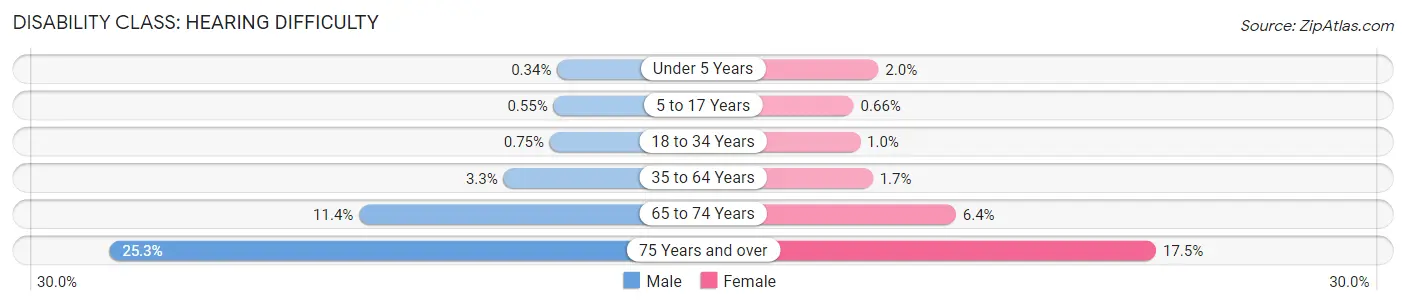
| Age Bracket | Male | Female |
| Under 5 Years | 31 (0.3%) | 174 (2.0%) |
| 5 to 17 Years | 138 (0.5%) | 157 (0.7%) |
| 18 to 34 Years | 220 (0.7%) | 304 (1.0%) |
| 35 to 64 Years | 1,743 (3.3%) | 927 (1.7%) |
| 65 to 74 Years | 1,599 (11.4%) | 984 (6.4%) |
| 75 Years and over | 2,125 (25.3%) | 2,066 (17.5%) |
Disability Class: Vision Difficulty
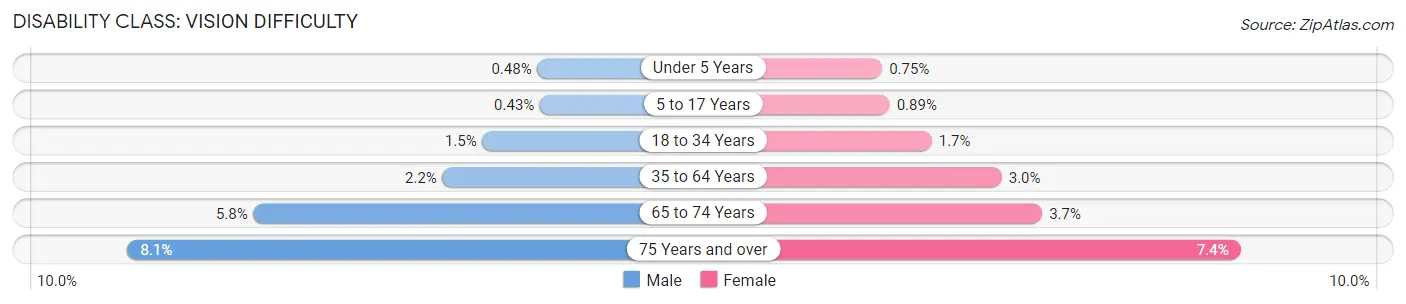
| Age Bracket | Male | Female |
| Under 5 Years | 43 (0.5%) | 64 (0.7%) |
| 5 to 17 Years | 108 (0.4%) | 212 (0.9%) |
| 18 to 34 Years | 438 (1.5%) | 499 (1.7%) |
| 35 to 64 Years | 1,174 (2.2%) | 1,601 (3.0%) |
| 65 to 74 Years | 809 (5.8%) | 576 (3.7%) |
| 75 Years and over | 680 (8.1%) | 874 (7.4%) |
Disability Class: Cognitive Difficulty
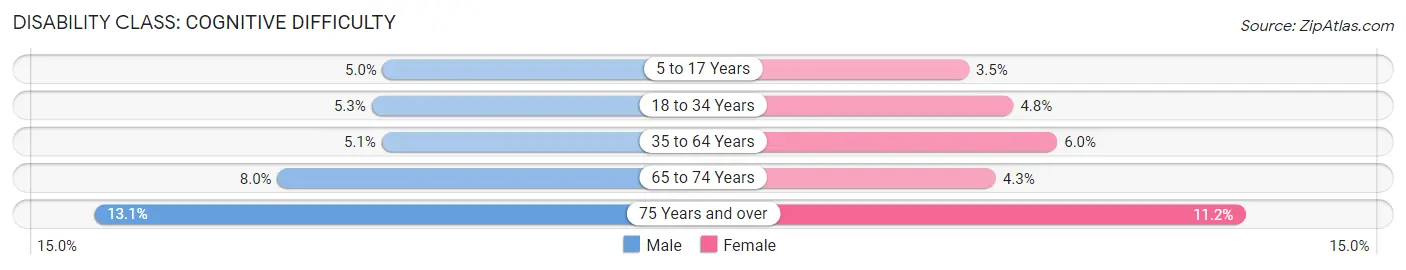
| Age Bracket | Male | Female |
| 5 to 17 Years | 1,260 (5.0%) | 843 (3.5%) |
| 18 to 34 Years | 1,563 (5.3%) | 1,430 (4.8%) |
| 35 to 64 Years | 2,646 (5.1%) | 3,233 (6.0%) |
| 65 to 74 Years | 1,119 (8.0%) | 664 (4.3%) |
| 75 Years and over | 1,098 (13.1%) | 1,325 (11.2%) |
Disability Class: Ambulatory Difficulty
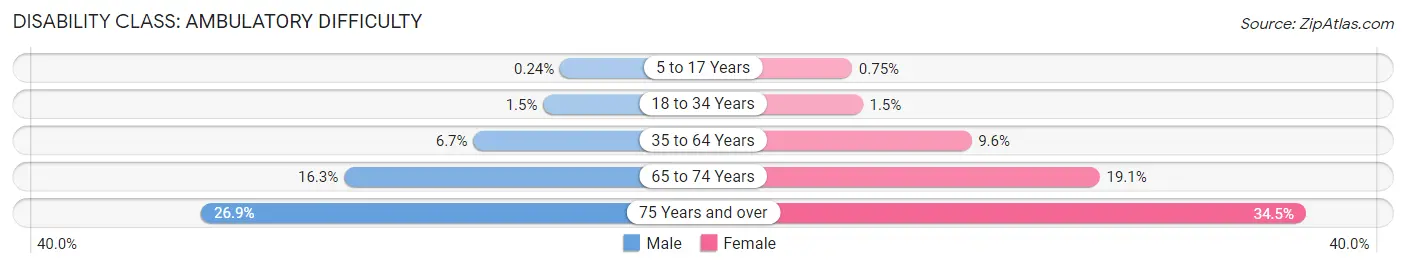
| Age Bracket | Male | Female |
| 5 to 17 Years | 61 (0.2%) | 180 (0.7%) |
| 18 to 34 Years | 435 (1.5%) | 461 (1.5%) |
| 35 to 64 Years | 3,496 (6.7%) | 5,180 (9.6%) |
| 65 to 74 Years | 2,290 (16.3%) | 2,964 (19.1%) |
| 75 Years and over | 2,260 (26.9%) | 4,066 (34.4%) |
Disability Class: Self-Care Difficulty
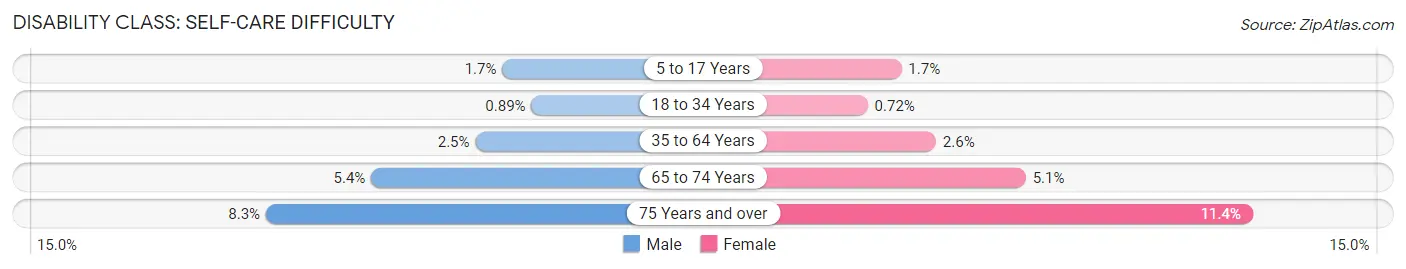
| Age Bracket | Male | Female |
| 5 to 17 Years | 426 (1.7%) | 396 (1.7%) |
| 18 to 34 Years | 260 (0.9%) | 217 (0.7%) |
| 35 to 64 Years | 1,284 (2.5%) | 1,413 (2.6%) |
| 65 to 74 Years | 753 (5.3%) | 793 (5.1%) |
| 75 Years and over | 696 (8.3%) | 1,350 (11.4%) |
Technology Access in Winnebago County
Computing Device Access in Winnebago County
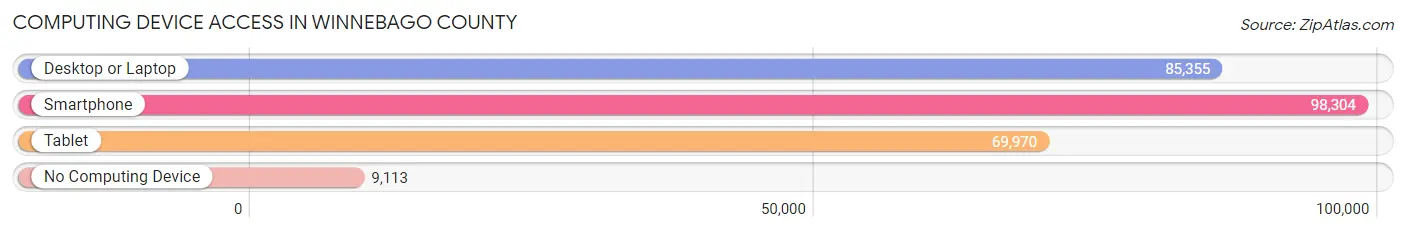
| Device Type | # Households | % Households |
| Desktop or Laptop | 85,355 | 74.1% |
| Smartphone | 98,304 | 85.3% |
| Tablet | 69,970 | 60.7% |
| No Computing Device | 9,113 | 7.9% |
| Total | 115,214 | 100.0% |
Internet Access in Winnebago County
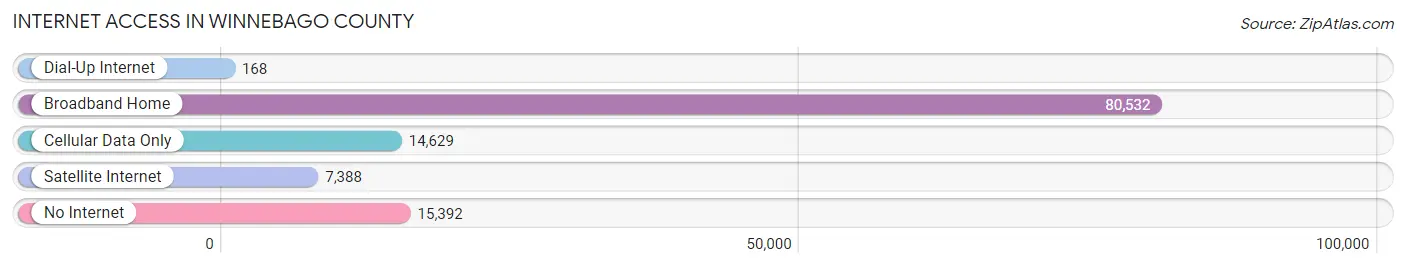
| Internet Type | # Households | % Households |
| Dial-Up Internet | 168 | 0.2% |
| Broadband Home | 80,532 | 69.9% |
| Cellular Data Only | 14,629 | 12.7% |
| Satellite Internet | 7,388 | 6.4% |
| No Internet | 15,392 | 13.4% |
| Total | 115,214 | 100.0% |
Winnebago County Summary
Winnebago County, Illinois is located in the northern part of the state, and is part of the Rockford Metropolitan Statistical Area. It is bordered by Boone County to the north, Ogle County to the east, Stephenson County to the south, and the Wisconsin border to the west. The county seat is Rockford, and the county has a population of 295,266 as of the 2020 census.
History
Winnebago County was established in 1836, and was named after the Winnebago Native American tribe. The county was originally part of the Northwest Territory, and was later part of the Illinois Territory. The county was organized in 1837, and the first county seat was at Pecatonica. In 1839, the county seat was moved to Rockford, which is still the county seat today.
The county has a long history of manufacturing and industry. In the late 19th century, the county was home to several factories, including the Rockford Watch Company, the Rockford Chair Company, and the Rockford Brewing Company. The county also had several railroads, which helped to transport goods and people throughout the region.
In the 20th century, the county continued to be a major manufacturing center. The Rockford area was home to several automotive companies, including the Rockford Automobile Company, the Rockford Motor Car Company, and the Rockford Motor Works. The county also had several aircraft manufacturers, including the Rockford Aircraft Company and the Rockford Airplane Company.
Geography
Winnebago County is located in the northern part of Illinois, and is part of the Rockford Metropolitan Statistical Area. The county is bordered by Boone County to the north, Ogle County to the east, Stephenson County to the south, and the Wisconsin border to the west. The county has a total area of 545 square miles, and is mostly flat with some rolling hills. The county is drained by the Rock River, which flows through the county from east to west.
The county has a humid continental climate, with cold winters and hot, humid summers. The average annual temperature is around 50 degrees Fahrenheit, and the average annual precipitation is around 36 inches.
Economy
Winnebago County has a diverse economy, with a mix of manufacturing, retail, healthcare, and education. The county is home to several major employers, including the Rockford Public Schools, the Rockford Health System, and the Rockford Register Star. The county is also home to several manufacturing companies, including the Rockford Tool Company, the Rockford Manufacturing Company, and the Rockford Machine Company.
The county is also home to several retail businesses, including the CherryVale Mall, the Rockford Plaza, and the Rockford Town Center. The county is also home to several healthcare facilities, including the Rockford Memorial Hospital, the Rockford Health System, and the Rockford Clinic.
Demographics
As of the 2020 census, Winnebago County had a population of 295,266. The population is made up of a diverse mix of races and ethnicities, including White (77.3%), Black or African American (13.2%), Hispanic or Latino (7.2%), Asian (2.2%), and Native American (0.5%). The median household income in the county is $60,945, and the median home value is $150,000. The county has a poverty rate of 13.2%, and the unemployment rate is 4.2%.
Common Questions
What is the Total Population of Winnebago County?
Total Population of Winnebago County is 284,591.
What is the Total Male Population of Winnebago County?
Total Male Population of Winnebago County is 139,697.
What is the Total Female Population of Winnebago County?
Total Female Population of Winnebago County is 144,894.
What is the Ratio of Males per 100 Females in Winnebago County?
There are 96.41 Males per 100 Females in Winnebago County.
What is the Ratio of Females per 100 Males in Winnebago County?
There are 103.72 Females per 100 Males in Winnebago County.
What is the Median Population Age in Winnebago County?
Median Population Age in Winnebago County is 39.5 Years.
What is the Average Family Size in Winnebago County
Average Family Size in Winnebago County is 3.0 People.
What is the Average Household Size in Winnebago County
Average Household Size in Winnebago County is 2.4 People.
What is Per Capita Income in Winnebago County?
Per Capita income in Winnebago County is $33,474.
What is the Median Family Income in Winnebago County?
Median Family Income in Winnebago County is $78,158.
What is the Median Household income in Winnebago County?
Median Household Income in Winnebago County is $61,738.
What is Income or Wage Gap in Winnebago County?
Income or Wage Gap in Winnebago County is 31.1%.
Women in Winnebago County earn 68.9 cents for every dollar earned by a man.
What is Family Income Deficit in Winnebago County?
Family Income Deficit in Winnebago County is $11,951.
Families that are below poverty line in Winnebago County earn $11,951 less on average than the poverty threshold level.
What is Inequality or Gini Index in Winnebago County?
Inequality or Gini Index in Winnebago County is 0.45.
How Large is the Labor Force in Winnebago County?
There are 140,441 People in the Labor Forcein in Winnebago County.
What is the Percentage of People in the Labor Force in Winnebago County?
62.2% of People are in the Labor Force in Winnebago County.
What is the Unemployment Rate in Winnebago County?
Unemployment Rate in Winnebago County is 7.5%.