Williamson County, IL
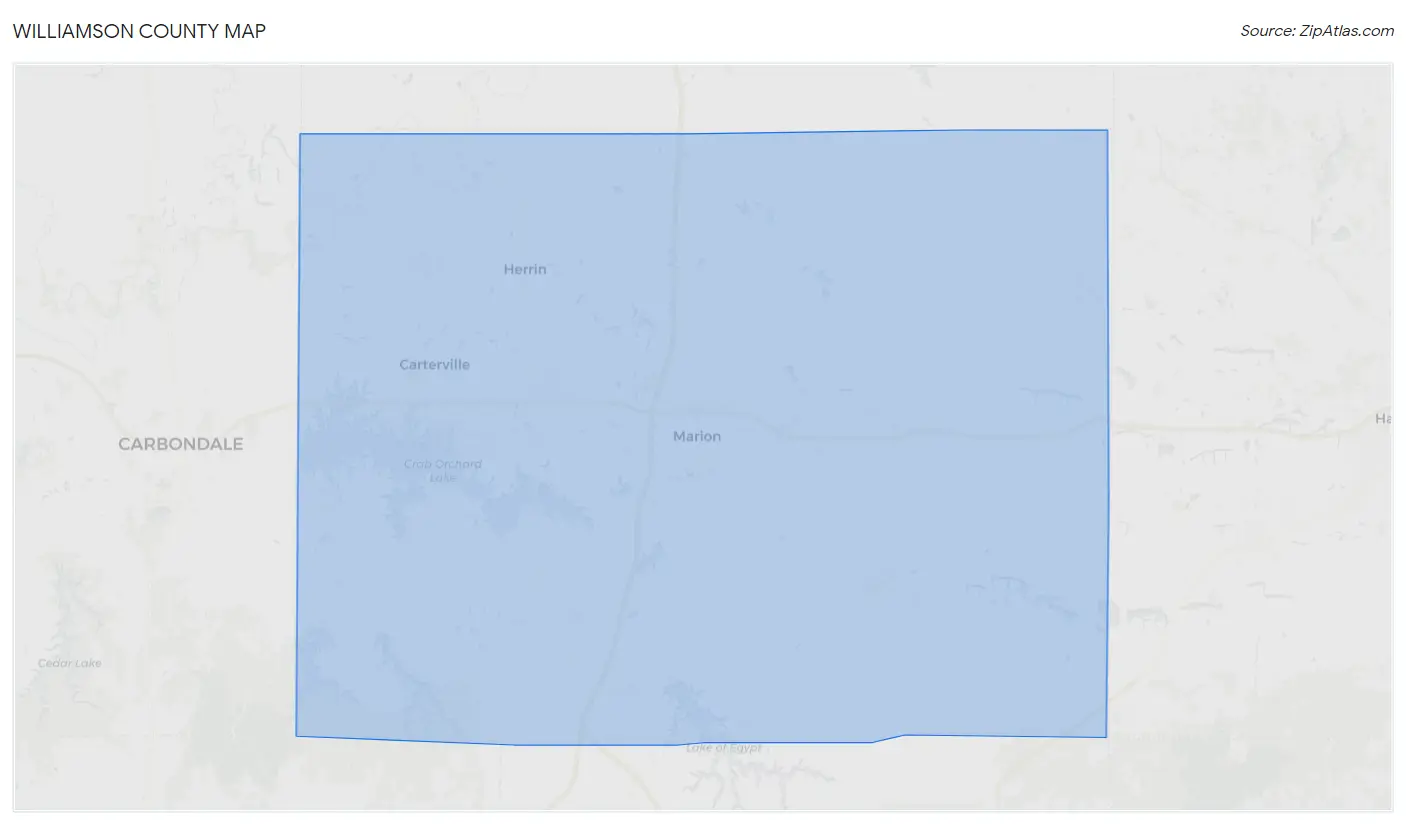
Williamson County Map
Williamson County Overview
67,120
TOTAL POPULATION
33,757
MALE POPULATION
33,363
FEMALE POPULATION
101.18
MALES / 100 FEMALES
98.83
FEMALES / 100 MALES
41.2
MEDIAN AGE
2.8
AVG FAMILY SIZE
2.3
AVG HOUSEHOLD SIZE
$34,810
PER CAPITA INCOME
$79,912
AVG FAMILY INCOME
$60,325
AVG HOUSEHOLD INCOME
23.4%
WAGE / INCOME GAP [ % ]
76.6¢/ $1
WAGE / INCOME GAP [ $ ]
$11,135
FAMILY INCOME DEFICIT
0.45
INEQUALITY / GINI INDEX
31,923
LABOR FORCE [ PEOPLE ]
58.7%
PERCENT IN LABOR FORCE
4.4%
UNEMPLOYMENT RATE
Williamson County Area Codes
Race in Williamson County
The most populous races in Williamson County are White / Caucasian (60,005 | 89.4%), Two or more Races (3,010 | 4.5%), and Black / African American (2,218 | 3.3%).
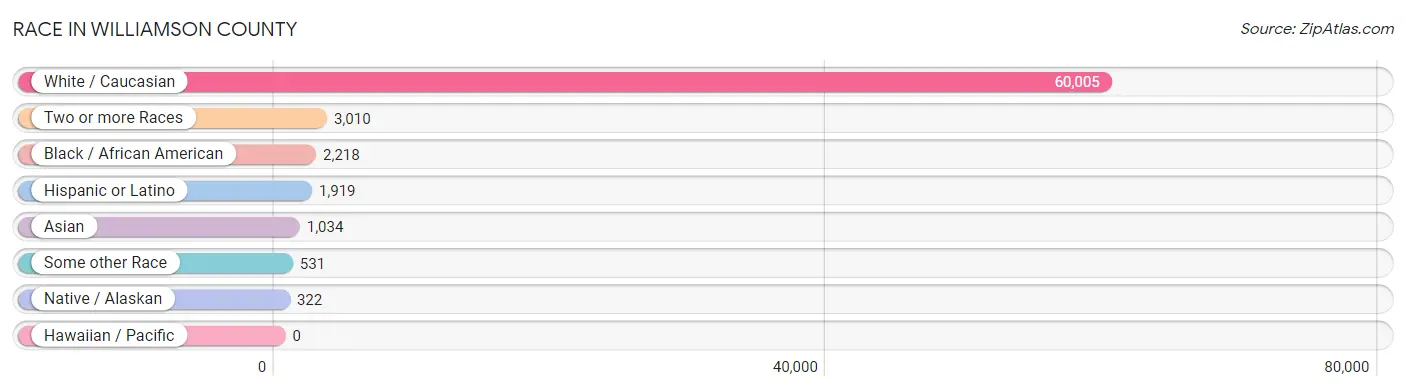
| Race | # Population | % Population |
| Asian | 1,034 | 1.5% |
| Black / African American | 2,218 | 3.3% |
| Hawaiian / Pacific | 0 | 0.0% |
| Hispanic or Latino | 1,919 | 2.9% |
| Native / Alaskan | 322 | 0.5% |
| White / Caucasian | 60,005 | 89.4% |
| Two or more Races | 3,010 | 4.5% |
| Some other Race | 531 | 0.8% |
| Total | 67,120 | 100.0% |
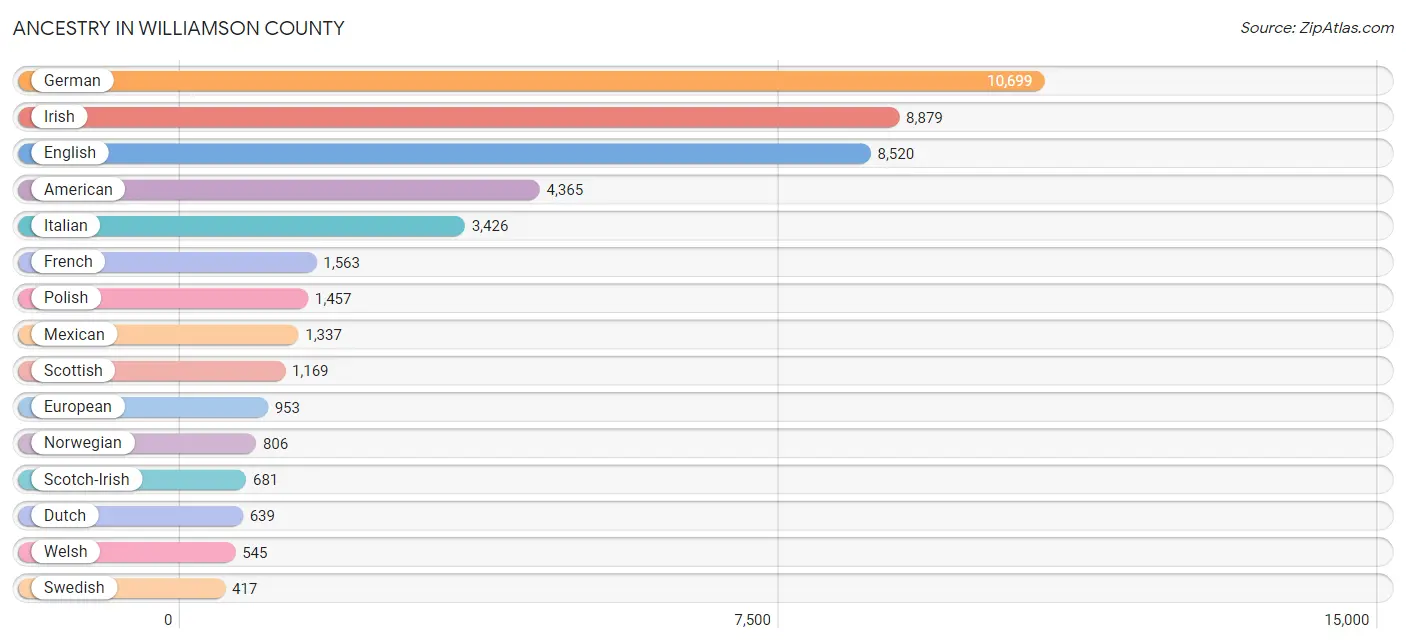
Ancestry in Williamson County
The most populous ancestries reported in Williamson County are German (10,699 | 15.9%), Irish (8,879 | 13.2%), English (8,520 | 12.7%), American (4,365 | 6.5%), and Italian (3,426 | 5.1%), together accounting for 53.5% of all Williamson County residents.
| Ancestry | # Population | % Population |
| African | 21 | 0.0% |
| American | 4,365 | 6.5% |
| Arab | 164 | 0.2% |
| Austrian | 74 | 0.1% |
| Belgian | 213 | 0.3% |
| Bhutanese | 29 | 0.0% |
| Blackfeet | 7 | 0.0% |
| Brazilian | 1 | 0.0% |
| British | 374 | 0.6% |
| Burmese | 36 | 0.1% |
| Canadian | 32 | 0.1% |
| Central American | 166 | 0.3% |
| Central American Indian | 19 | 0.0% |
| Cherokee | 367 | 0.5% |
| Cheyenne | 35 | 0.1% |
| Chippewa | 4 | 0.0% |
| Choctaw | 19 | 0.0% |
| Colombian | 32 | 0.1% |
| Costa Rican | 6 | 0.0% |
| Creek | 8 | 0.0% |
| Croatian | 123 | 0.2% |
| Cuban | 54 | 0.1% |
| Czech | 75 | 0.1% |
| Czechoslovakian | 51 | 0.1% |
| Danish | 187 | 0.3% |
| Dutch | 639 | 0.9% |
| Eastern European | 118 | 0.2% |
| English | 8,520 | 12.7% |
| European | 953 | 1.4% |
| Filipino | 19 | 0.0% |
| Finnish | 35 | 0.1% |
| French | 1,563 | 2.3% |
| French American Indian | 20 | 0.0% |
| French Canadian | 38 | 0.1% |
| German | 10,699 | 15.9% |
| Greek | 61 | 0.1% |
| Guatemalan | 44 | 0.1% |
| Honduran | 40 | 0.1% |
| Hungarian | 121 | 0.2% |
| Icelander | 12 | 0.0% |
| Indian (Asian) | 390 | 0.6% |
| Inupiat | 13 | 0.0% |
| Irish | 8,879 | 13.2% |
| Italian | 3,426 | 5.1% |
| Jamaican | 6 | 0.0% |
| Japanese | 41 | 0.1% |
| Korean | 205 | 0.3% |
| Laotian | 65 | 0.1% |
| Lebanese | 25 | 0.0% |
| Lithuanian | 125 | 0.2% |
| Macedonian | 4 | 0.0% |
| Maltese | 19 | 0.0% |
| Mexican | 1,337 | 2.0% |
| Mexican American Indian | 88 | 0.1% |
| Native Hawaiian | 18 | 0.0% |
| Navajo | 30 | 0.0% |
| Nicaraguan | 49 | 0.1% |
| Nigerian | 29 | 0.0% |
| Northern European | 189 | 0.3% |
| Norwegian | 806 | 1.2% |
| Palestinian | 23 | 0.0% |
| Panamanian | 15 | 0.0% |
| Pennsylvania German | 29 | 0.0% |
| Polish | 1,457 | 2.2% |
| Portuguese | 79 | 0.1% |
| Puerto Rican | 237 | 0.4% |
| Puget Sound Salish | 10 | 0.0% |
| Romanian | 1 | 0.0% |
| Russian | 279 | 0.4% |
| Salvadoran | 12 | 0.0% |
| Samoan | 9 | 0.0% |
| Scandinavian | 108 | 0.2% |
| Scotch-Irish | 681 | 1.0% |
| Scottish | 1,169 | 1.7% |
| Seminole | 7 | 0.0% |
| Serbian | 26 | 0.0% |
| Sioux | 106 | 0.2% |
| Slavic | 48 | 0.1% |
| Slovak | 19 | 0.0% |
| Slovene | 8 | 0.0% |
| South American | 32 | 0.1% |
| Spaniard | 12 | 0.0% |
| Spanish | 12 | 0.0% |
| Sri Lankan | 122 | 0.2% |
| Subsaharan African | 69 | 0.1% |
| Swedish | 417 | 0.6% |
| Swiss | 117 | 0.2% |
| Thai | 215 | 0.3% |
| Ukrainian | 119 | 0.2% |
| Welsh | 545 | 0.8% |
| West Indian | 7 | 0.0% |
| Yugoslavian | 32 | 0.1% | View All 92 Rows |
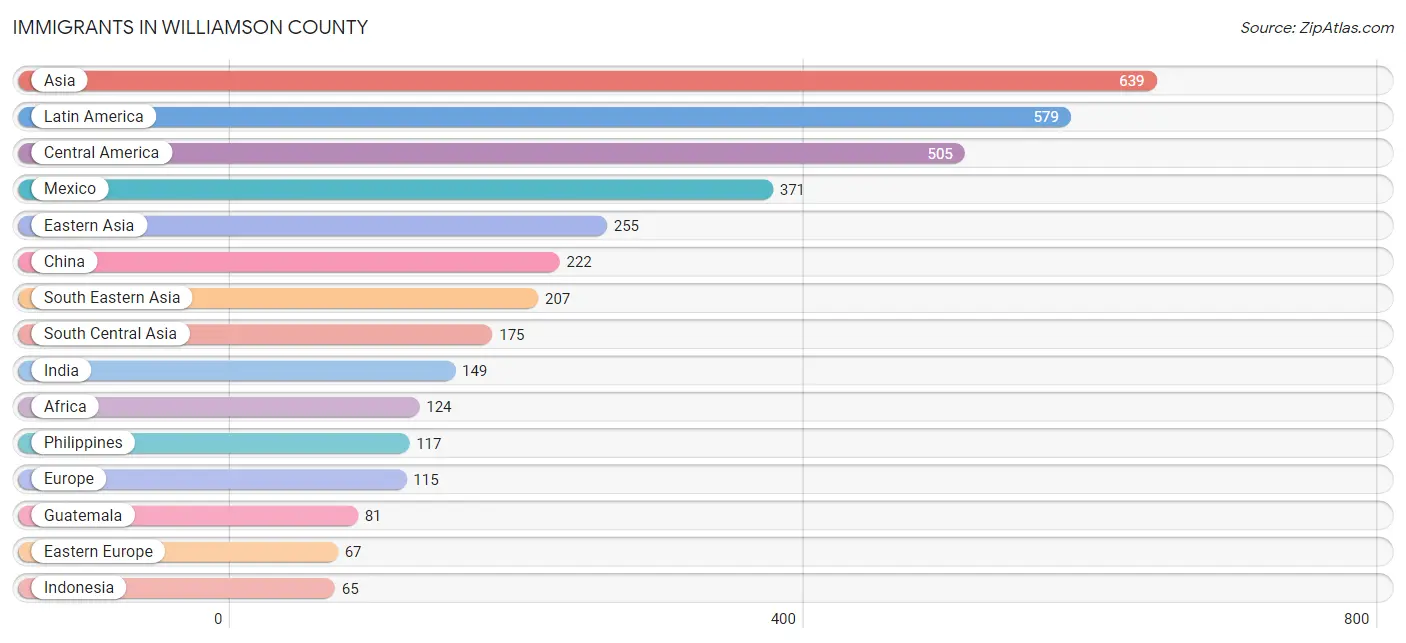
Immigrants in Williamson County
The most numerous immigrant groups reported in Williamson County came from Asia (639 | 0.9%), Latin America (579 | 0.9%), Central America (505 | 0.7%), Mexico (371 | 0.5%), and Eastern Asia (255 | 0.4%), together accounting for 3.5% of all Williamson County residents.
| Immigration Origin | # Population | % Population |
| Africa | 124 | 0.2% |
| Asia | 639 | 0.9% |
| Bahamas | 2 | 0.0% |
| Brazil | 14 | 0.0% |
| Canada | 15 | 0.0% |
| Caribbean | 28 | 0.0% |
| Central America | 505 | 0.7% |
| China | 222 | 0.3% |
| Colombia | 32 | 0.1% |
| Costa Rica | 6 | 0.0% |
| Eastern Asia | 255 | 0.4% |
| Eastern Europe | 67 | 0.1% |
| El Salvador | 12 | 0.0% |
| England | 15 | 0.0% |
| Europe | 115 | 0.2% |
| Germany | 18 | 0.0% |
| Guatemala | 81 | 0.1% |
| Honduras | 20 | 0.0% |
| Hungary | 3 | 0.0% |
| India | 149 | 0.2% |
| Indonesia | 65 | 0.1% |
| Japan | 29 | 0.0% |
| Korea | 4 | 0.0% |
| Latin America | 579 | 0.9% |
| Malaysia | 4 | 0.0% |
| Mexico | 371 | 0.5% |
| Netherlands | 15 | 0.0% |
| Nicaragua | 15 | 0.0% |
| Nigeria | 29 | 0.0% |
| Northern Europe | 15 | 0.0% |
| Pakistan | 5 | 0.0% |
| Philippines | 117 | 0.2% |
| Poland | 53 | 0.1% |
| Russia | 11 | 0.0% |
| Saudi Arabia | 2 | 0.0% |
| South Africa | 64 | 0.1% |
| South America | 46 | 0.1% |
| South Central Asia | 175 | 0.3% |
| South Eastern Asia | 207 | 0.3% |
| Sri Lanka | 21 | 0.0% |
| Taiwan | 19 | 0.0% |
| Vietnam | 21 | 0.0% |
| Western Africa | 39 | 0.1% |
| Western Asia | 2 | 0.0% |
| Western Europe | 33 | 0.1% | View All 45 Rows |
Sex and Age in Williamson County
Sex and Age in Williamson County
The most populous age groups in Williamson County are 60 to 64 Years (2,628 | 7.8%) for men and 35 to 39 Years (2,333 | 7.0%) for women.
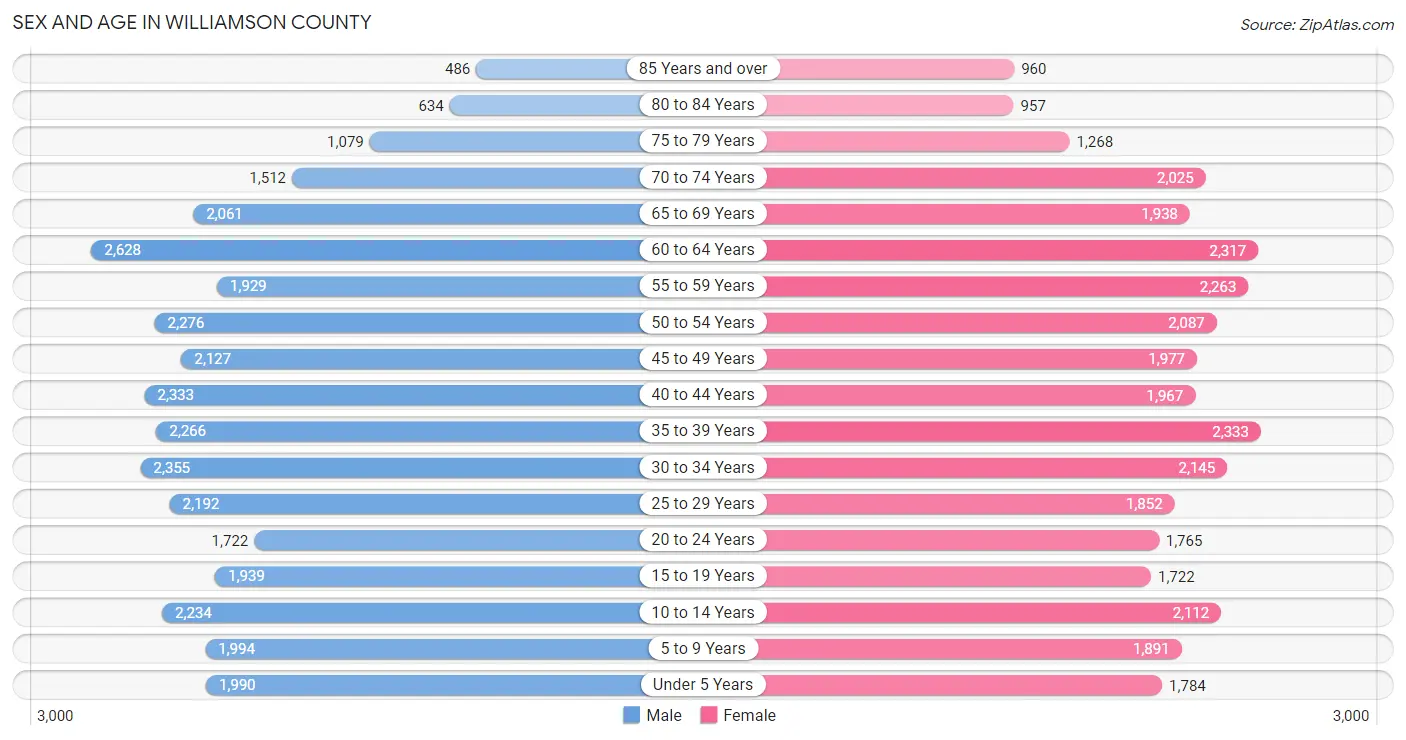
| Age Bracket | Male | Female |
| Under 5 Years | 1,990 (5.9%) | 1,784 (5.3%) |
| 5 to 9 Years | 1,994 (5.9%) | 1,891 (5.7%) |
| 10 to 14 Years | 2,234 (6.6%) | 2,112 (6.3%) |
| 15 to 19 Years | 1,939 (5.7%) | 1,722 (5.2%) |
| 20 to 24 Years | 1,722 (5.1%) | 1,765 (5.3%) |
| 25 to 29 Years | 2,192 (6.5%) | 1,852 (5.6%) |
| 30 to 34 Years | 2,355 (7.0%) | 2,145 (6.4%) |
| 35 to 39 Years | 2,266 (6.7%) | 2,333 (7.0%) |
| 40 to 44 Years | 2,333 (6.9%) | 1,967 (5.9%) |
| 45 to 49 Years | 2,127 (6.3%) | 1,977 (5.9%) |
| 50 to 54 Years | 2,276 (6.7%) | 2,087 (6.3%) |
| 55 to 59 Years | 1,929 (5.7%) | 2,263 (6.8%) |
| 60 to 64 Years | 2,628 (7.8%) | 2,317 (6.9%) |
| 65 to 69 Years | 2,061 (6.1%) | 1,938 (5.8%) |
| 70 to 74 Years | 1,512 (4.5%) | 2,025 (6.1%) |
| 75 to 79 Years | 1,079 (3.2%) | 1,268 (3.8%) |
| 80 to 84 Years | 634 (1.9%) | 957 (2.9%) |
| 85 Years and over | 486 (1.4%) | 960 (2.9%) |
| Total | 33,757 (100.0%) | 33,363 (100.0%) |
Families and Households in Williamson County
Median Family Size in Williamson County
The median family size in Williamson County is 2.84 persons per family, with married-couple families (13,249 | 74.3%) accounting for the largest median family size of 2.89 persons per family. On the other hand, single male/father families (1,811 | 10.2%) represent the smallest median family size with 2.47 persons per family.
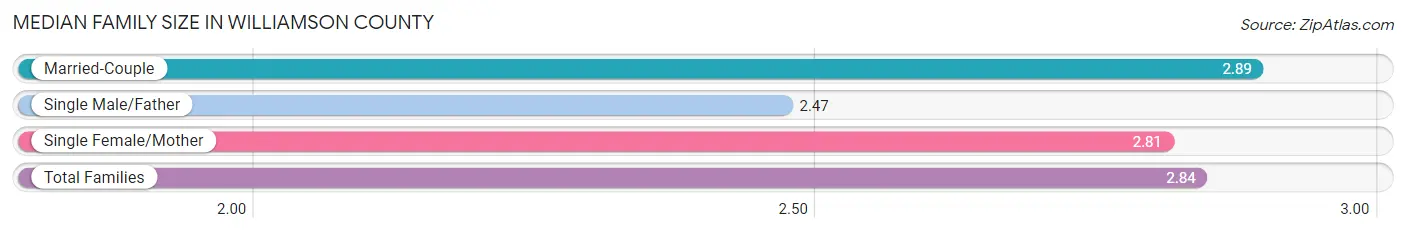
| Family Type | # Families | Family Size |
| Married-Couple | 13,249 (74.3%) | 2.89 |
| Single Male/Father | 1,811 (10.2%) | 2.47 |
| Single Female/Mother | 2,782 (15.6%) | 2.81 |
| Total Families | 17,842 (100.0%) | 2.84 |
Median Household Size in Williamson County
The median household size in Williamson County is 2.28 persons per household, with single female/mother households (2,782 | 9.8%) accounting for the largest median household size of 3.02 persons per household. non-family households (10,679 | 37.4%) represent the smallest median household size with 1.21 persons per household.
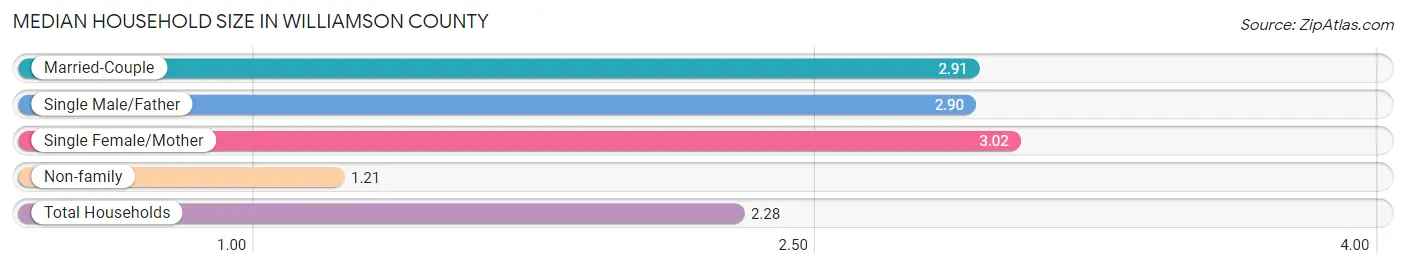
| Household Type | # Households | Household Size |
| Married-Couple | 13,249 (46.5%) | 2.91 |
| Single Male/Father | 1,811 (6.4%) | 2.90 |
| Single Female/Mother | 2,782 (9.8%) | 3.02 |
| Non-family | 10,679 (37.4%) | 1.21 |
| Total Households | 28,521 (100.0%) | 2.28 |
Household Size by Marriage Status in Williamson County
Out of a total of 28,521 households in Williamson County, 17,842 (62.6%) are family households, while 10,679 (37.4%) are nonfamily households. The most numerous type of family households are 2-person households, comprising 9,229, and the most common type of nonfamily households are 1-person households, comprising 8,996.
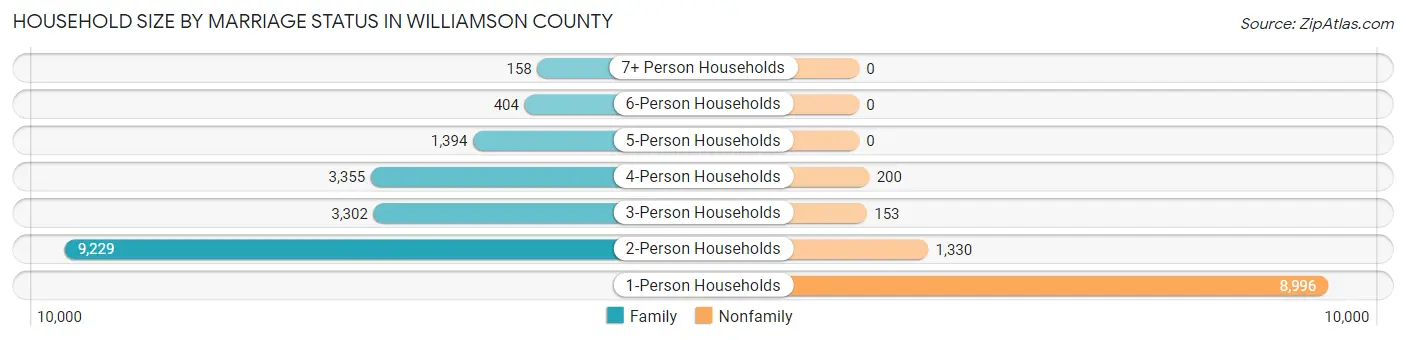
| Household Size | Family Households | Nonfamily Households |
| 1-Person Households | - | 8,996 (31.5%) |
| 2-Person Households | 9,229 (32.4%) | 1,330 (4.7%) |
| 3-Person Households | 3,302 (11.6%) | 153 (0.5%) |
| 4-Person Households | 3,355 (11.8%) | 200 (0.7%) |
| 5-Person Households | 1,394 (4.9%) | 0 (0.0%) |
| 6-Person Households | 404 (1.4%) | 0 (0.0%) |
| 7+ Person Households | 158 (0.5%) | 0 (0.0%) |
| Total | 17,842 (62.6%) | 10,679 (37.4%) |
Female Fertility in Williamson County
Fertility by Age in Williamson County
Average fertility rate in Williamson County is 69.0 births per 1,000 women. Women in the age bracket of 20 to 34 years have the highest fertility rate with 126.0 births per 1,000 women. Women in the age bracket of 20 to 34 years acount for 74.3% of all women with births.
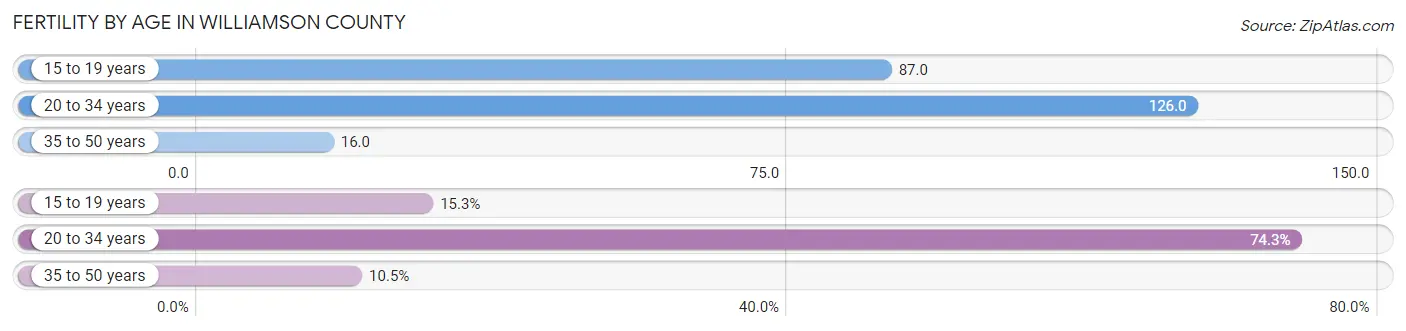
| Age Bracket | Women with Births | Births / 1,000 Women |
| 15 to 19 years | 149 (15.3%) | 87.0 |
| 20 to 34 years | 724 (74.3%) | 126.0 |
| 35 to 50 years | 102 (10.5%) | 16.0 |
| Total | 975 (100.0%) | 69.0 |
Fertility by Age by Marriage Status in Williamson County
71.8% of women with births (975) in Williamson County are married. The highest percentage of unmarried women with births falls into 15 to 19 years age bracket with 62.4% of them unmarried at the time of birth, while the lowest percentage of unmarried women with births belong to 35 to 50 years age bracket with 0.0% of them unmarried.
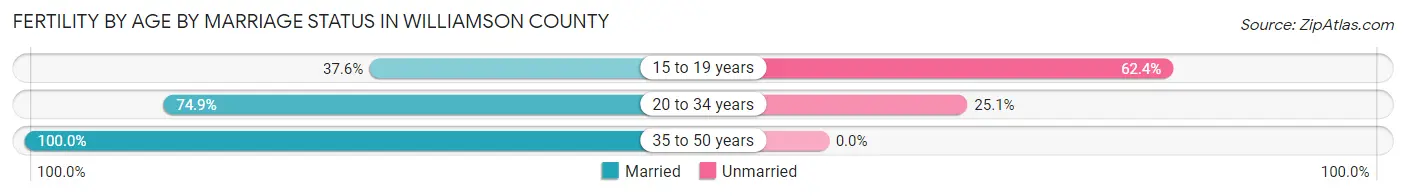
| Age Bracket | Married | Unmarried |
| 15 to 19 years | 56 (37.6%) | 93 (62.4%) |
| 20 to 34 years | 542 (74.9%) | 182 (25.1%) |
| 35 to 50 years | 102 (100.0%) | 0 (0.0%) |
| Total | 700 (71.8%) | 275 (28.2%) |
Fertility by Education in Williamson County
Average fertility rate in Williamson County is 69.0 births per 1,000 women. Women with the education attainment of graduate degree have the highest fertility rate of 114.0 births per 1,000 women, while women with the education attainment of high school diploma have the lowest fertility at 47.0 births per 1,000 women. Women with the education attainment of college or associate's degree represent 41.5% of all women with births.
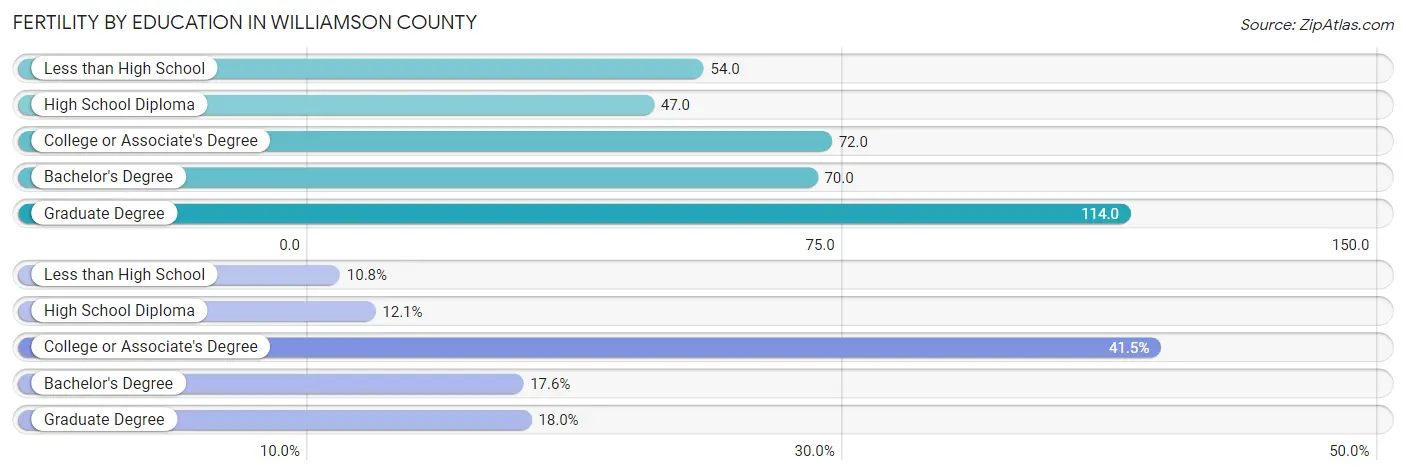
| Educational Attainment | Women with Births | Births / 1,000 Women |
| Less than High School | 105 (10.8%) | 54.0 |
| High School Diploma | 118 (12.1%) | 47.0 |
| College or Associate's Degree | 405 (41.5%) | 72.0 |
| Bachelor's Degree | 172 (17.6%) | 70.0 |
| Graduate Degree | 175 (17.9%) | 114.0 |
| Total | 975 (100.0%) | 69.0 |
Fertility by Education by Marriage Status in Williamson County
28.2% of women with births in Williamson County are unmarried. Women with the educational attainment of bachelor's degree are most likely to be married with 100.0% of them married at childbirth, while women with the educational attainment of college or associate's degree are least likely to be married with 41.7% of them unmarried at childbirth.
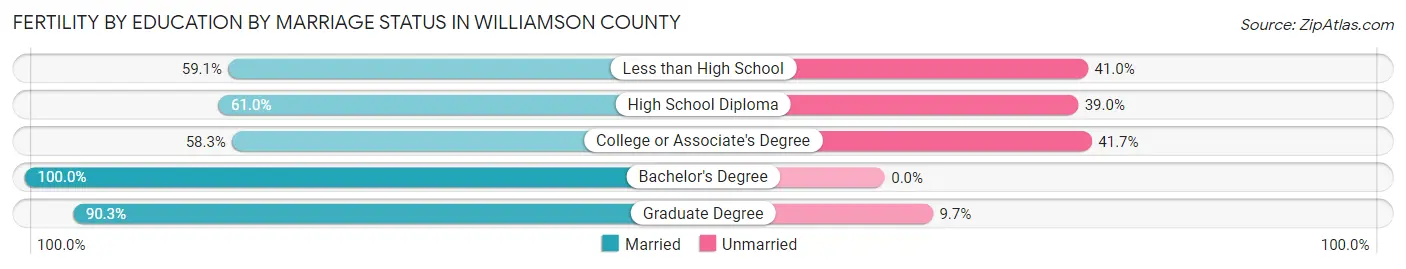
| Educational Attainment | Married | Unmarried |
| Less than High School | 62 (59.1%) | 43 (40.9%) |
| High School Diploma | 72 (61.0%) | 46 (39.0%) |
| College or Associate's Degree | 236 (58.3%) | 169 (41.7%) |
| Bachelor's Degree | 172 (100.0%) | 0 (0.0%) |
| Graduate Degree | 158 (90.3%) | 17 (9.7%) |
| Total | 700 (71.8%) | 275 (28.2%) |
Income in Williamson County
Income Overview in Williamson County
Per Capita Income in Williamson County is $34,810, while median incomes of families and households are $79,912 and $60,325 respectively.
| Characteristic | Number | Measure |
| Per Capita Income | 67,120 | $34,810 |
| Median Family Income | 17,842 | $79,912 |
| Mean Family Income | 17,842 | $98,922 |
| Median Household Income | 28,521 | $60,325 |
| Mean Household Income | 28,521 | $81,280 |
| Income Deficit | 17,842 | $11,135 |
| Wage / Income Gap (%) | 67,120 | 23.45% |
| Wage / Income Gap ($) | 67,120 | 76.55¢ per $1 |
| Gini / Inequality Index | 67,120 | 0.45 |
Earnings by Sex in Williamson County
Average Earnings in Williamson County are $39,708, $45,679 for men and $34,969 for women, a difference of 23.4%.
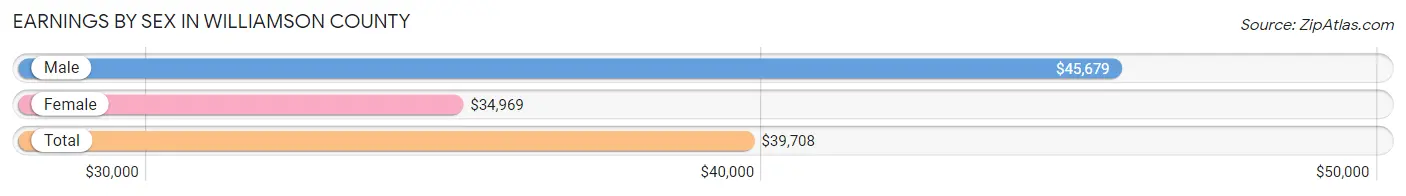
| Sex | Number | Average Earnings |
| Male | 17,505 (51.9%) | $45,679 |
| Female | 16,196 (48.1%) | $34,969 |
| Total | 33,701 (100.0%) | $39,708 |
Earnings by Sex by Income Bracket in Williamson County
The most common earnings brackets in Williamson County are $100,000+ for men (2,325 | 13.3%) and $25,000 to $29,999 for women (1,196 | 7.4%).
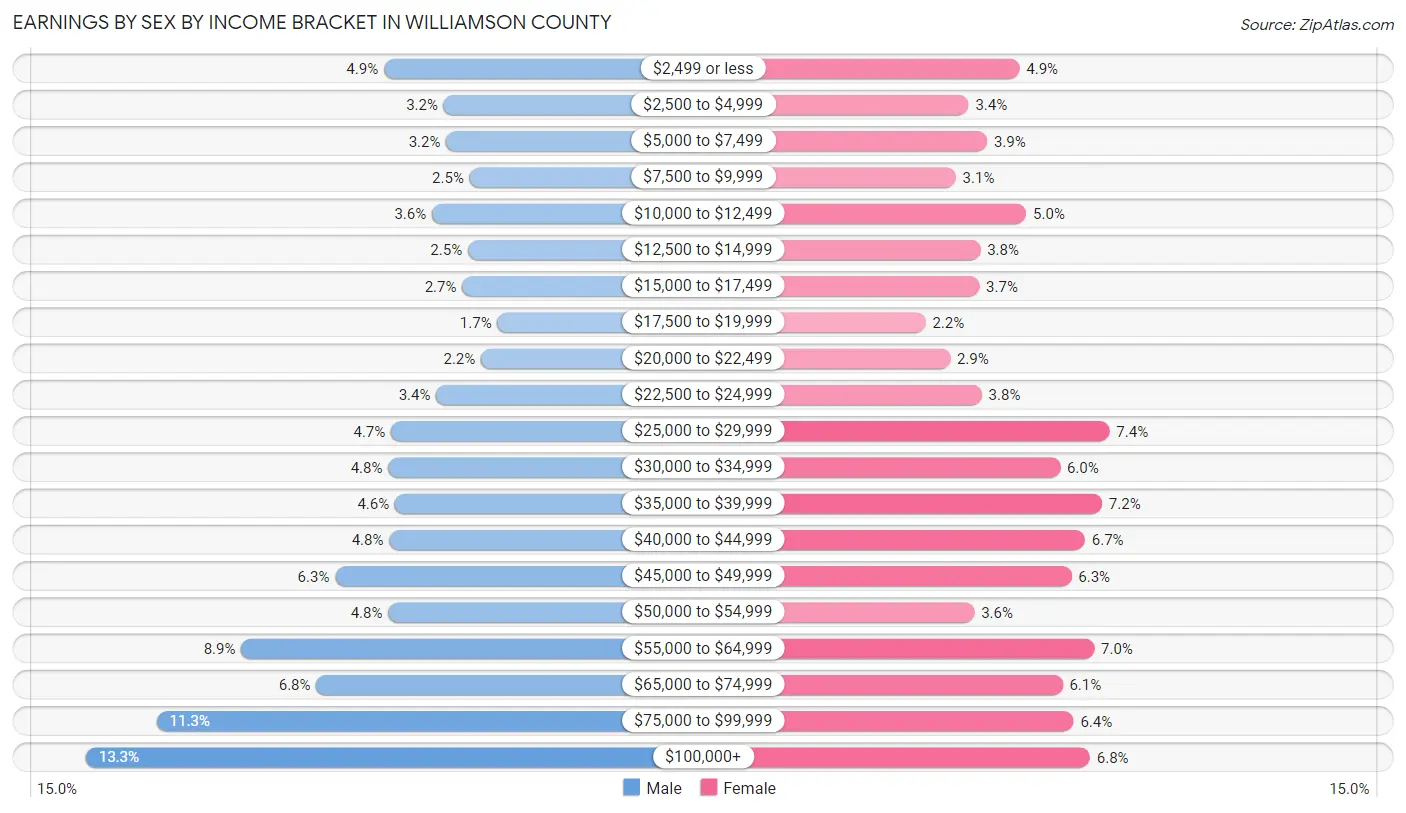
| Income | Male | Female |
| $2,499 or less | 858 (4.9%) | 785 (4.9%) |
| $2,500 to $4,999 | 563 (3.2%) | 554 (3.4%) |
| $5,000 to $7,499 | 552 (3.2%) | 638 (3.9%) |
| $7,500 to $9,999 | 435 (2.5%) | 495 (3.1%) |
| $10,000 to $12,499 | 622 (3.5%) | 816 (5.0%) |
| $12,500 to $14,999 | 444 (2.5%) | 608 (3.7%) |
| $15,000 to $17,499 | 473 (2.7%) | 602 (3.7%) |
| $17,500 to $19,999 | 299 (1.7%) | 358 (2.2%) |
| $20,000 to $22,499 | 380 (2.2%) | 469 (2.9%) |
| $22,500 to $24,999 | 601 (3.4%) | 614 (3.8%) |
| $25,000 to $29,999 | 822 (4.7%) | 1,196 (7.4%) |
| $30,000 to $34,999 | 837 (4.8%) | 970 (6.0%) |
| $35,000 to $39,999 | 804 (4.6%) | 1,161 (7.2%) |
| $40,000 to $44,999 | 831 (4.8%) | 1,083 (6.7%) |
| $45,000 to $49,999 | 1,097 (6.3%) | 1,022 (6.3%) |
| $50,000 to $54,999 | 836 (4.8%) | 580 (3.6%) |
| $55,000 to $64,999 | 1,560 (8.9%) | 1,126 (7.0%) |
| $65,000 to $74,999 | 1,190 (6.8%) | 981 (6.1%) |
| $75,000 to $99,999 | 1,976 (11.3%) | 1,032 (6.4%) |
| $100,000+ | 2,325 (13.3%) | 1,106 (6.8%) |
| Total | 17,505 (100.0%) | 16,196 (100.0%) |
Earnings by Sex by Educational Attainment in Williamson County
Average earnings in Williamson County are $50,302 for men and $38,804 for women, a difference of 22.9%. Men with an educational attainment of graduate degree enjoy the highest average annual earnings of $86,875, while those with less than high school education earn the least with $26,971. Women with an educational attainment of graduate degree earn the most with the average annual earnings of $74,614, while those with less than high school education have the smallest earnings of $16,630.
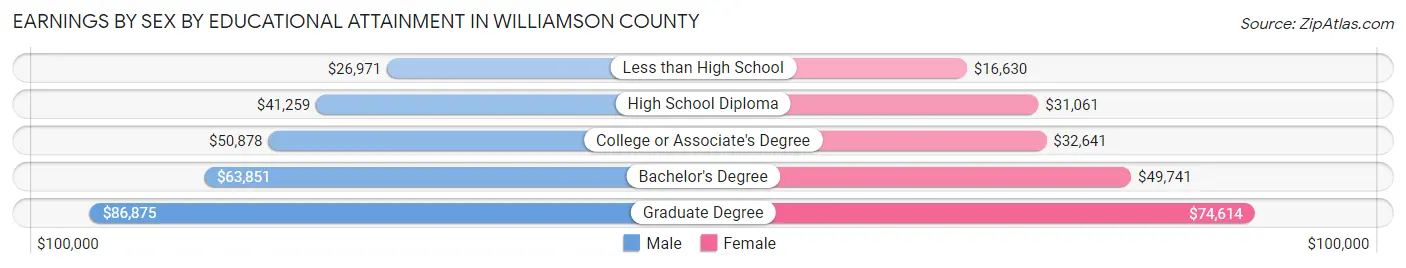
| Educational Attainment | Male Income | Female Income |
| Less than High School | $26,971 | $16,630 |
| High School Diploma | $41,259 | $31,061 |
| College or Associate's Degree | $50,878 | $32,641 |
| Bachelor's Degree | $63,851 | $49,741 |
| Graduate Degree | $86,875 | $74,614 |
| Total | $50,302 | $38,804 |
Family Income in Williamson County
Family Income Brackets in Williamson County
According to the Williamson County family income data, there are 3,907 families falling into the $100,000 to $149,999 income range, which is the most common income bracket and makes up 21.9% of all families. Conversely, the $10,000 to $14,999 income bracket is the least frequent group with only 446 families (2.5%) belonging to this category.
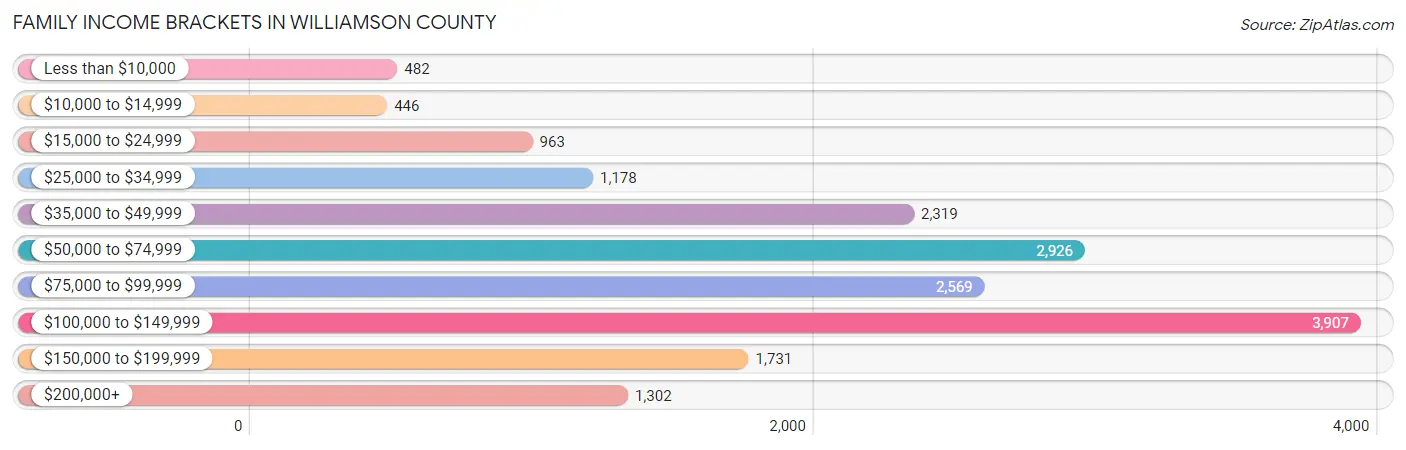
| Income Bracket | # Families | % Families |
| Less than $10,000 | 482 | 2.7% |
| $10,000 to $14,999 | 446 | 2.5% |
| $15,000 to $24,999 | 963 | 5.4% |
| $25,000 to $34,999 | 1,178 | 6.6% |
| $35,000 to $49,999 | 2,319 | 13.0% |
| $50,000 to $74,999 | 2,926 | 16.4% |
| $75,000 to $99,999 | 2,569 | 14.4% |
| $100,000 to $149,999 | 3,907 | 21.9% |
| $150,000 to $199,999 | 1,731 | 9.7% |
| $200,000+ | 1,302 | 7.3% |
Family Income by Famaliy Size in Williamson County
7+ person families (135 | 0.8%) account for the highest median family income in Williamson County with $117,537 per family, while 2-person families (9,870 | 55.3%) have the highest median income of $33,619 per family member.
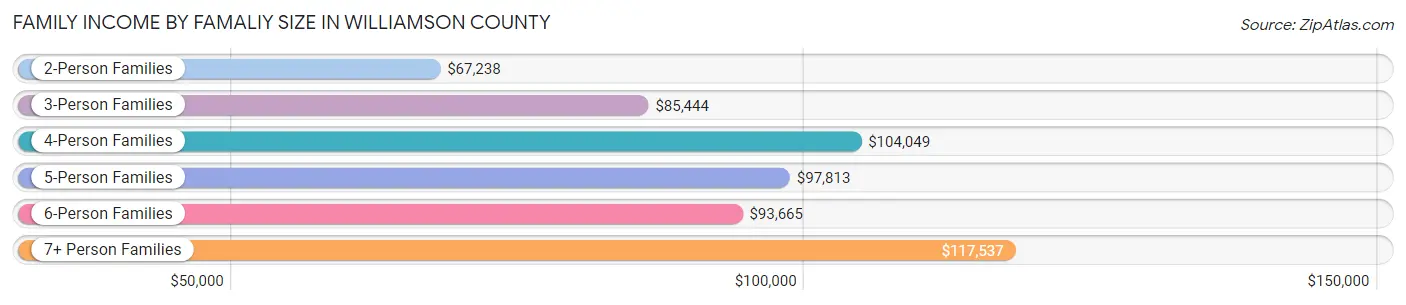
| Income Bracket | # Families | Median Income |
| 2-Person Families | 9,870 (55.3%) | $67,238 |
| 3-Person Families | 3,192 (17.9%) | $85,444 |
| 4-Person Families | 3,206 (18.0%) | $104,049 |
| 5-Person Families | 1,066 (6.0%) | $97,813 |
| 6-Person Families | 373 (2.1%) | $93,665 |
| 7+ Person Families | 135 (0.8%) | $117,537 |
| Total | 17,842 (100.0%) | $79,912 |
Family Income by Number of Earners in Williamson County
The median family income in Williamson County is $79,912, with families comprising 3+ earners (1,439) having the highest median family income of $135,114, while families with no earners (3,395) have the lowest median family income of $49,782, accounting for 8.1% and 19.0% of families, respectively.
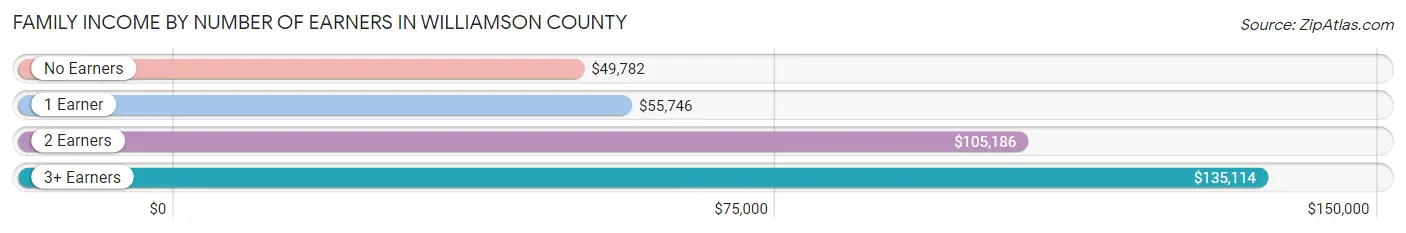
| Number of Earners | # Families | Median Income |
| No Earners | 3,395 (19.0%) | $49,782 |
| 1 Earner | 5,858 (32.8%) | $55,746 |
| 2 Earners | 7,150 (40.1%) | $105,186 |
| 3+ Earners | 1,439 (8.1%) | $135,114 |
| Total | 17,842 (100.0%) | $79,912 |
Household Income in Williamson County
Household Income Brackets in Williamson County
With 4,963 households falling in the category, the $50,000 to $74,999 income range is the most frequent in Williamson County, accounting for 17.4% of all households. In contrast, only 1,283 households (4.5%) fall into the $10,000 to $14,999 income bracket, making it the least populous group.
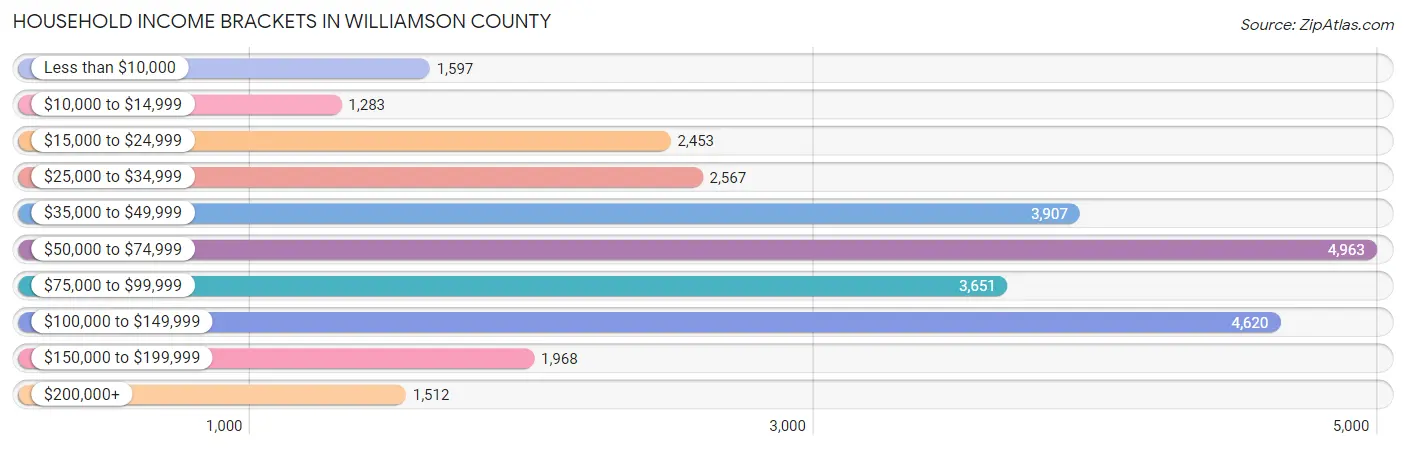
| Income Bracket | # Households | % Households |
| Less than $10,000 | 1,597 | 5.6% |
| $10,000 to $14,999 | 1,283 | 4.5% |
| $15,000 to $24,999 | 2,453 | 8.6% |
| $25,000 to $34,999 | 2,567 | 9.0% |
| $35,000 to $49,999 | 3,907 | 13.7% |
| $50,000 to $74,999 | 4,963 | 17.4% |
| $75,000 to $99,999 | 3,651 | 12.8% |
| $100,000 to $149,999 | 4,620 | 16.2% |
| $150,000 to $199,999 | 1,968 | 6.9% |
| $200,000+ | 1,512 | 5.3% |
Household Income by Householder Age in Williamson County
The median household income in Williamson County is $60,325, with the highest median household income of $77,833 found in the 45 to 64 years age bracket for the primary householder. A total of 10,176 households (35.7%) fall into this category. Meanwhile, the 15 to 24 years age bracket for the primary householder has the lowest median household income of $39,637, with 855 households (3.0%) in this group.
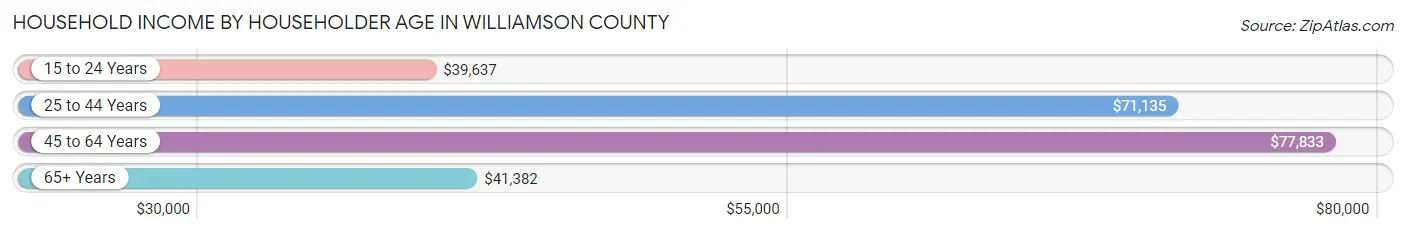
| Income Bracket | # Households | Median Income |
| 15 to 24 Years | 855 (3.0%) | $39,637 |
| 25 to 44 Years | 8,959 (31.4%) | $71,135 |
| 45 to 64 Years | 10,176 (35.7%) | $77,833 |
| 65+ Years | 8,531 (29.9%) | $41,382 |
| Total | 28,521 (100.0%) | $60,325 |
Poverty in Williamson County
Income Below Poverty by Sex and Age in Williamson County
With 12.1% poverty level for males and 14.2% for females among the residents of Williamson County, 5 year old males and 18 to 24 year old females are the most vulnerable to poverty, with 229 males (43.3%) and 559 females (24.1%) in their respective age groups living below the poverty level.
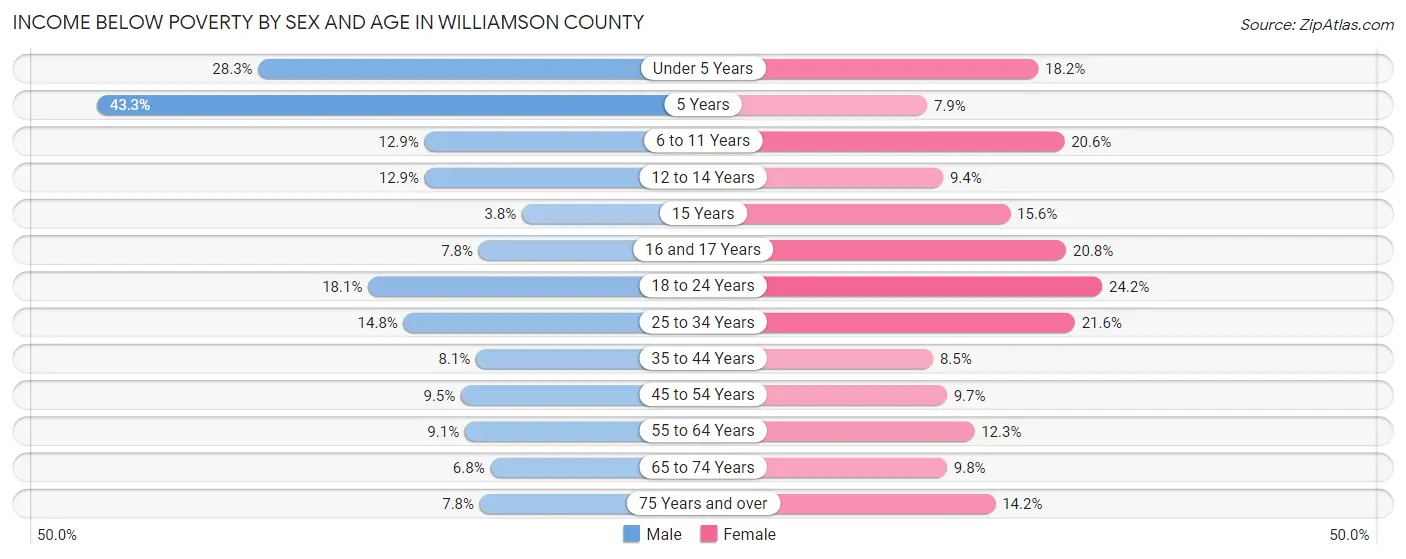
| Age Bracket | Male | Female |
| Under 5 Years | 545 (28.3%) | 314 (18.2%) |
| 5 Years | 229 (43.3%) | 28 (7.9%) |
| 6 to 11 Years | 288 (12.9%) | 429 (20.6%) |
| 12 to 14 Years | 167 (12.9%) | 124 (9.4%) |
| 15 Years | 14 (3.8%) | 57 (15.6%) |
| 16 and 17 Years | 73 (7.8%) | 168 (20.8%) |
| 18 to 24 Years | 411 (18.1%) | 559 (24.1%) |
| 25 to 34 Years | 623 (14.8%) | 864 (21.6%) |
| 35 to 44 Years | 334 (8.1%) | 363 (8.5%) |
| 45 to 54 Years | 389 (9.5%) | 396 (9.7%) |
| 55 to 64 Years | 398 (9.1%) | 561 (12.3%) |
| 65 to 74 Years | 237 (6.8%) | 382 (9.8%) |
| 75 Years and over | 158 (7.7%) | 430 (14.2%) |
| Total | 3,866 (12.1%) | 4,675 (14.2%) |
Income Above Poverty by Sex and Age in Williamson County
According to the poverty statistics in Williamson County, males aged 15 years and females aged 5 years are the age groups that are most secure financially, with 96.2% of males and 92.1% of females in these age groups living above the poverty line.
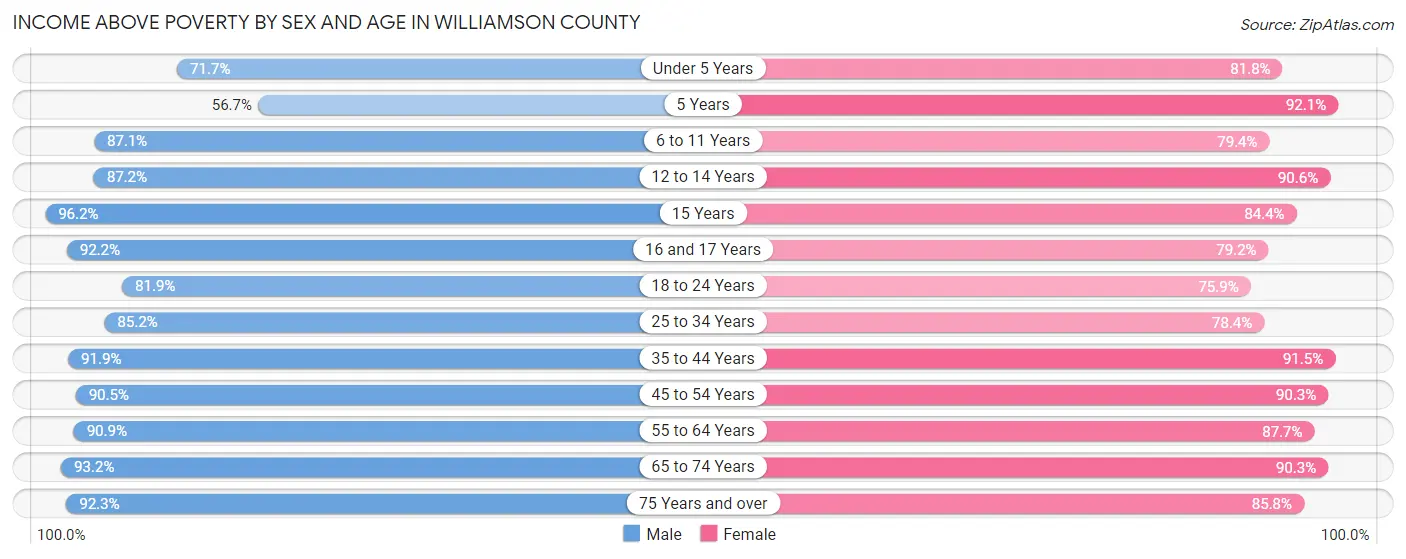
| Age Bracket | Male | Female |
| Under 5 Years | 1,381 (71.7%) | 1,409 (81.8%) |
| 5 Years | 300 (56.7%) | 326 (92.1%) |
| 6 to 11 Years | 1,948 (87.1%) | 1,649 (79.4%) |
| 12 to 14 Years | 1,133 (87.2%) | 1,197 (90.6%) |
| 15 Years | 352 (96.2%) | 308 (84.4%) |
| 16 and 17 Years | 858 (92.2%) | 639 (79.2%) |
| 18 to 24 Years | 1,859 (81.9%) | 1,756 (75.8%) |
| 25 to 34 Years | 3,580 (85.2%) | 3,133 (78.4%) |
| 35 to 44 Years | 3,797 (91.9%) | 3,926 (91.5%) |
| 45 to 54 Years | 3,708 (90.5%) | 3,668 (90.3%) |
| 55 to 64 Years | 3,962 (90.9%) | 4,005 (87.7%) |
| 65 to 74 Years | 3,270 (93.2%) | 3,535 (90.2%) |
| 75 Years and over | 1,882 (92.2%) | 2,589 (85.8%) |
| Total | 28,030 (87.9%) | 28,140 (85.8%) |
Income Below Poverty Among Married-Couple Families in Williamson County
The poverty statistics for married-couple families in Williamson County show that 4.0% or 534 of the total 13,249 families live below the poverty line. Families with 5 or more children have the highest poverty rate of 27.6%, comprising of 8 families. On the other hand, families with no children have the lowest poverty rate of 2.9%, which includes 247 families.
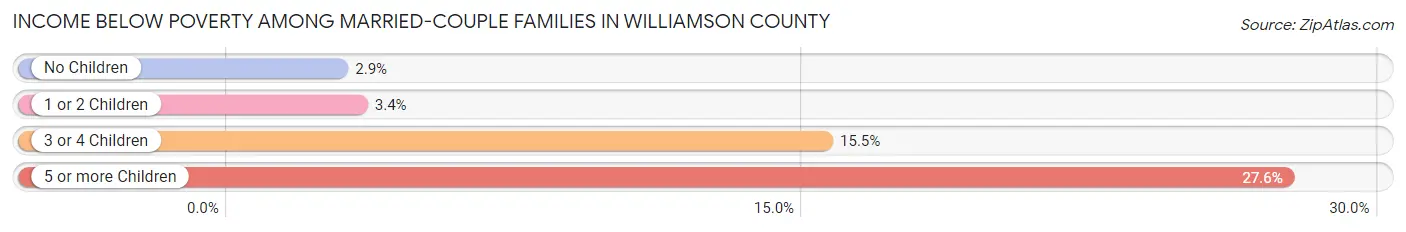
| Children | Above Poverty | Below Poverty |
| No Children | 8,338 (97.1%) | 247 (2.9%) |
| 1 or 2 Children | 3,508 (96.6%) | 123 (3.4%) |
| 3 or 4 Children | 848 (84.5%) | 156 (15.5%) |
| 5 or more Children | 21 (72.4%) | 8 (27.6%) |
| Total | 12,715 (96.0%) | 534 (4.0%) |
Income Below Poverty Among Single-Parent Households in Williamson County
According to the poverty data in Williamson County, 18.5% or 335 single-father households and 26.0% or 722 single-mother households are living below the poverty line. Among single-father households, those with 5 or more children have the highest poverty rate, with 16 households (84.2%) experiencing poverty. Likewise, among single-mother households, those with 3 or 4 children have the highest poverty rate, with 219 households (53.0%) falling below the poverty line.
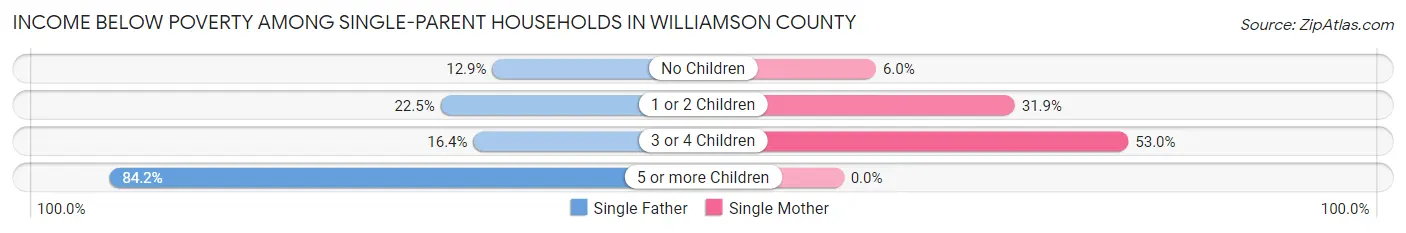
| Children | Single Father | Single Mother |
| No Children | 103 (12.9%) | 58 (6.0%) |
| 1 or 2 Children | 195 (22.5%) | 445 (31.9%) |
| 3 or 4 Children | 21 (16.4%) | 219 (53.0%) |
| 5 or more Children | 16 (84.2%) | 0 (0.0%) |
| Total | 335 (18.5%) | 722 (26.0%) |
Income Below Poverty Among Married-Couple vs Single-Parent Households in Williamson County
The poverty data for Williamson County shows that 534 of the married-couple family households (4.0%) and 1,057 of the single-parent households (23.0%) are living below the poverty level. Within the married-couple family households, those with 5 or more children have the highest poverty rate, with 8 households (27.6%) falling below the poverty line. Among the single-parent households, those with 5 or more children have the highest poverty rate, with 16 household (59.3%) living below poverty.
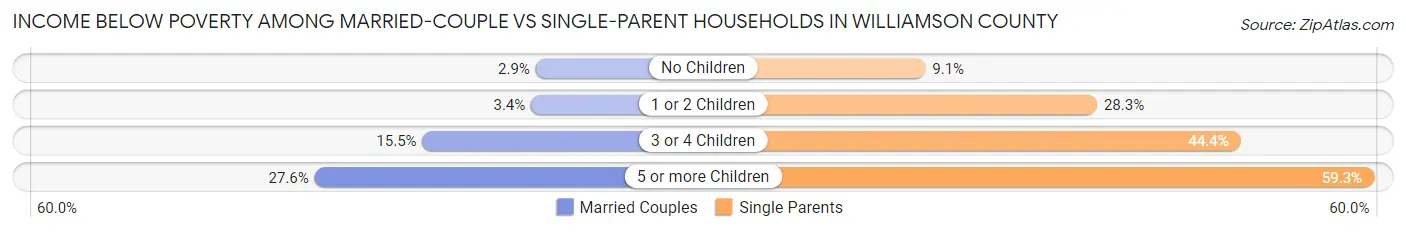
| Children | Married-Couple Families | Single-Parent Households |
| No Children | 247 (2.9%) | 161 (9.1%) |
| 1 or 2 Children | 123 (3.4%) | 640 (28.3%) |
| 3 or 4 Children | 156 (15.5%) | 240 (44.4%) |
| 5 or more Children | 8 (27.6%) | 16 (59.3%) |
| Total | 534 (4.0%) | 1,057 (23.0%) |
Employment Characteristics in Williamson County
Employment by Class of Employer in Williamson County
Among the 29,817 employed individuals in Williamson County, private company employees (17,719 | 59.4%), not-for-profit organizations (3,216 | 10.8%), and local government employees (2,578 | 8.6%) make up the most common classes of employment.
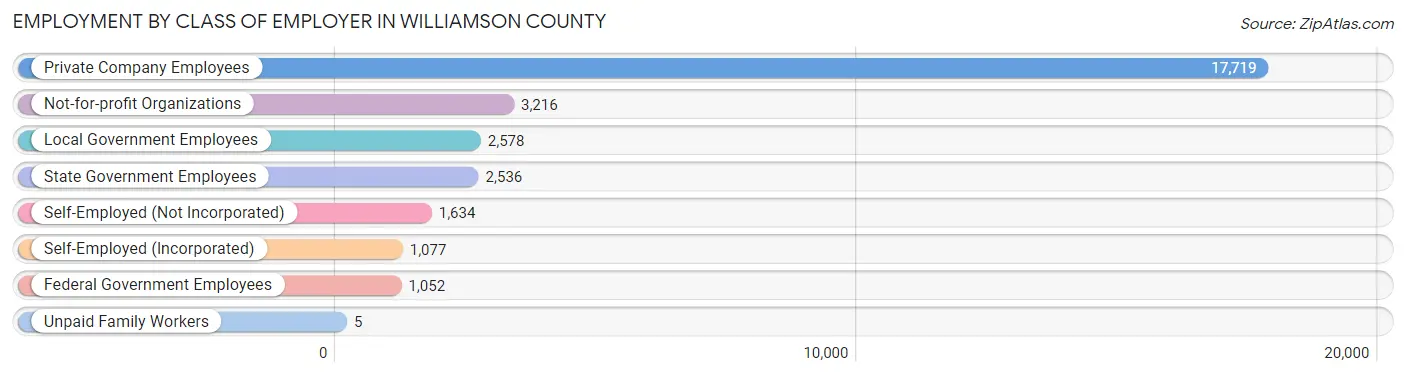
| Employer Class | # Employees | % Employees |
| Private Company Employees | 17,719 | 59.4% |
| Self-Employed (Incorporated) | 1,077 | 3.6% |
| Self-Employed (Not Incorporated) | 1,634 | 5.5% |
| Not-for-profit Organizations | 3,216 | 10.8% |
| Local Government Employees | 2,578 | 8.6% |
| State Government Employees | 2,536 | 8.5% |
| Federal Government Employees | 1,052 | 3.5% |
| Unpaid Family Workers | 5 | 0.0% |
| Total | 29,817 | 100.0% |
Employment Status by Age in Williamson County
According to the labor force statistics for Williamson County, out of the total population over 16 years of age (54,384), 58.7% or 31,923 individuals are in the labor force, with 4.4% or 1,405 of them unemployed. The age group with the highest labor force participation rate is 25 to 29 years, with 85.7% or 3,466 individuals in the labor force. Within the labor force, the 16 to 19 years age range has the highest percentage of unemployed individuals, with 17.3% or 225 of them being unemployed.
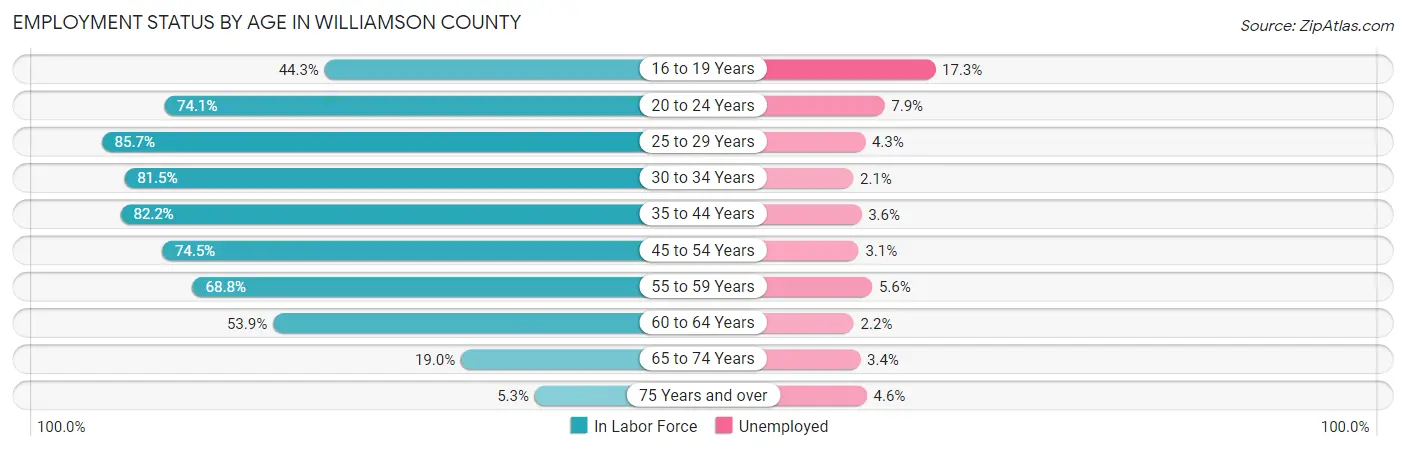
| Age Bracket | In Labor Force | Unemployed |
| 16 to 19 Years | 1,298 (44.3%) | 225 (17.3%) |
| 20 to 24 Years | 2,584 (74.1%) | 204 (7.9%) |
| 25 to 29 Years | 3,466 (85.7%) | 149 (4.3%) |
| 30 to 34 Years | 3,668 (81.5%) | 77 (2.1%) |
| 35 to 44 Years | 7,315 (82.2%) | 263 (3.6%) |
| 45 to 54 Years | 6,308 (74.5%) | 196 (3.1%) |
| 55 to 59 Years | 2,884 (68.8%) | 162 (5.6%) |
| 60 to 64 Years | 2,665 (53.9%) | 59 (2.2%) |
| 65 to 74 Years | 1,432 (19.0%) | 49 (3.4%) |
| 75 Years and over | 285 (5.3%) | 13 (4.6%) |
| Total | 31,923 (58.7%) | 1,405 (4.4%) |
Employment Status by Educational Attainment in Williamson County
According to labor force statistics for Williamson County, 75.1% of individuals (26,320) out of the total population between 25 and 64 years of age (35,047) are in the labor force, with 3.4% or 895 of them being unemployed. The group with the highest labor force participation rate are those with the educational attainment of bachelor's degree or higher, with 85.8% or 8,475 individuals in the labor force. Within the labor force, individuals with less than high school education have the highest percentage of unemployment, with 10.6% or 118 of them being unemployed.
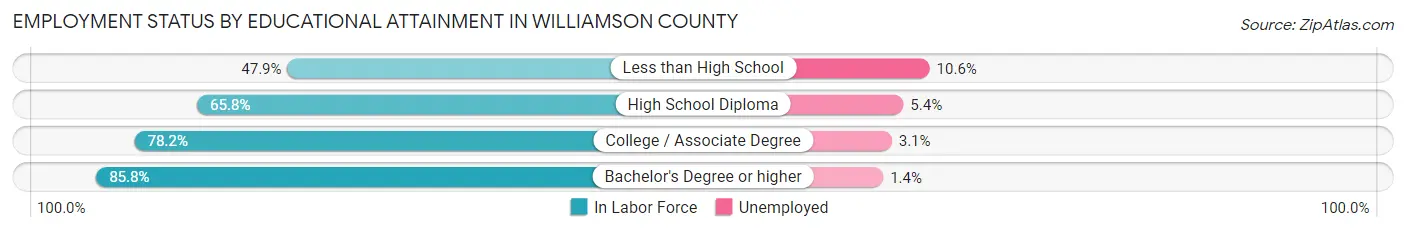
| Educational Attainment | In Labor Force | Unemployed |
| Less than High School | 1,109 (47.9%) | 245 (10.6%) |
| High School Diploma | 6,053 (65.8%) | 497 (5.4%) |
| College / Associate Degree | 10,678 (78.2%) | 423 (3.1%) |
| Bachelor's Degree or higher | 8,475 (85.8%) | 138 (1.4%) |
| Total | 26,320 (75.1%) | 1,192 (3.4%) |
Employment Occupations by Sex in Williamson County
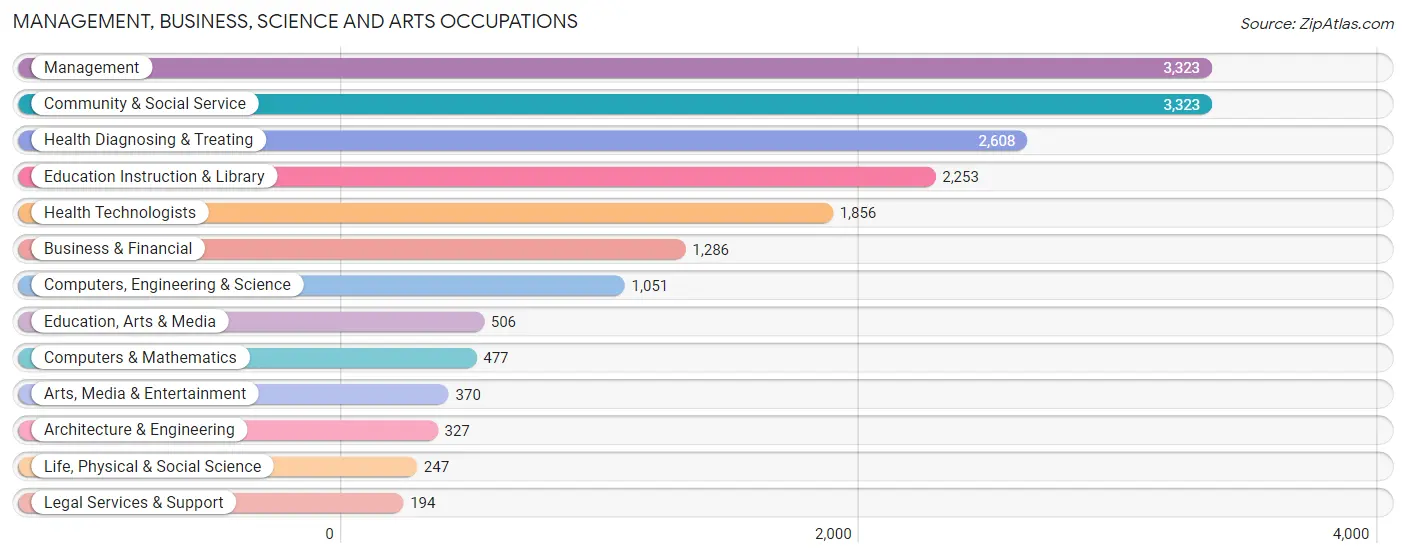
Management, Business, Science and Arts Occupations
The most common Management, Business, Science and Arts occupations in Williamson County are Management (3,323 | 10.9%), Community & Social Service (3,323 | 10.9%), Health Diagnosing & Treating (2,608 | 8.6%), Education Instruction & Library (2,253 | 7.4%), and Health Technologists (1,856 | 6.1%).
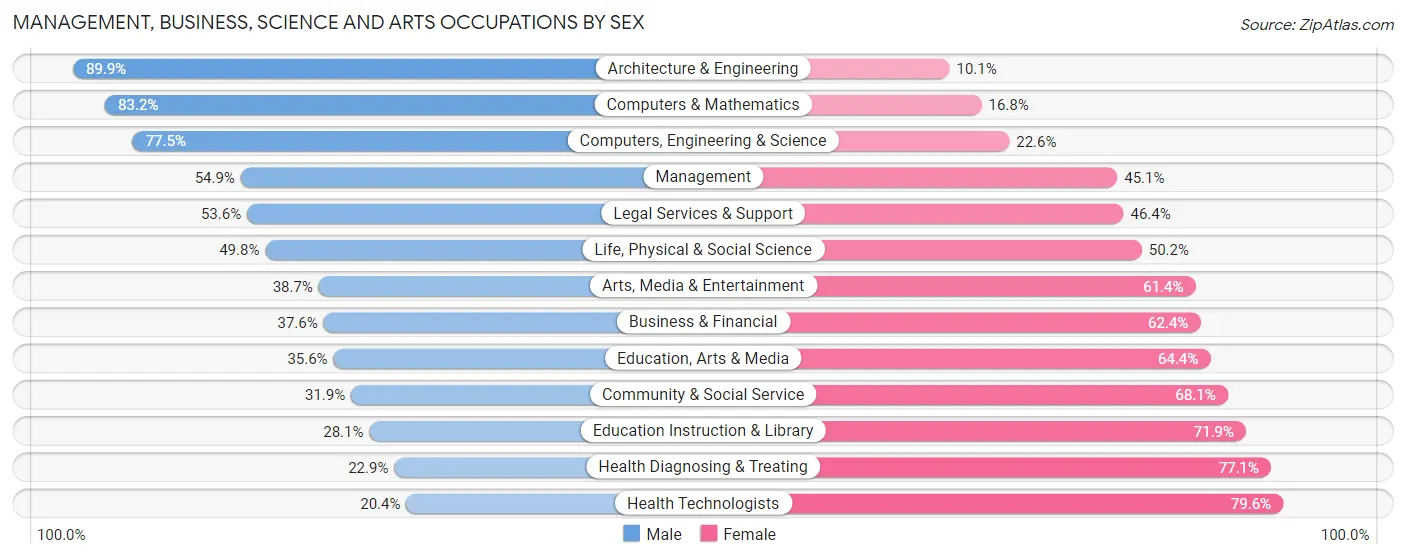
Management, Business, Science and Arts Occupations by Sex
Within the Management, Business, Science and Arts occupations in Williamson County, the most male-oriented occupations are Architecture & Engineering (89.9%), Computers & Mathematics (83.2%), and Computers, Engineering & Science (77.4%), while the most female-oriented occupations are Health Technologists (79.6%), Health Diagnosing & Treating (77.1%), and Education Instruction & Library (71.9%).
| Occupation | Male | Female |
| Management | 1,825 (54.9%) | 1,498 (45.1%) |
| Business & Financial | 484 (37.6%) | 802 (62.4%) |
| Computers, Engineering & Science | 814 (77.4%) | 237 (22.6%) |
| Computers & Mathematics | 397 (83.2%) | 80 (16.8%) |
| Architecture & Engineering | 294 (89.9%) | 33 (10.1%) |
| Life, Physical & Social Science | 123 (49.8%) | 124 (50.2%) |
| Community & Social Service | 1,060 (31.9%) | 2,263 (68.1%) |
| Education, Arts & Media | 180 (35.6%) | 326 (64.4%) |
| Legal Services & Support | 104 (53.6%) | 90 (46.4%) |
| Education Instruction & Library | 633 (28.1%) | 1,620 (71.9%) |
| Arts, Media & Entertainment | 143 (38.7%) | 227 (61.4%) |
| Health Diagnosing & Treating | 597 (22.9%) | 2,011 (77.1%) |
| Health Technologists | 378 (20.4%) | 1,478 (79.6%) |
| Total (Category) | 4,780 (41.2%) | 6,811 (58.8%) |
| Total (Overall) | 15,803 (52.0%) | 14,584 (48.0%) |
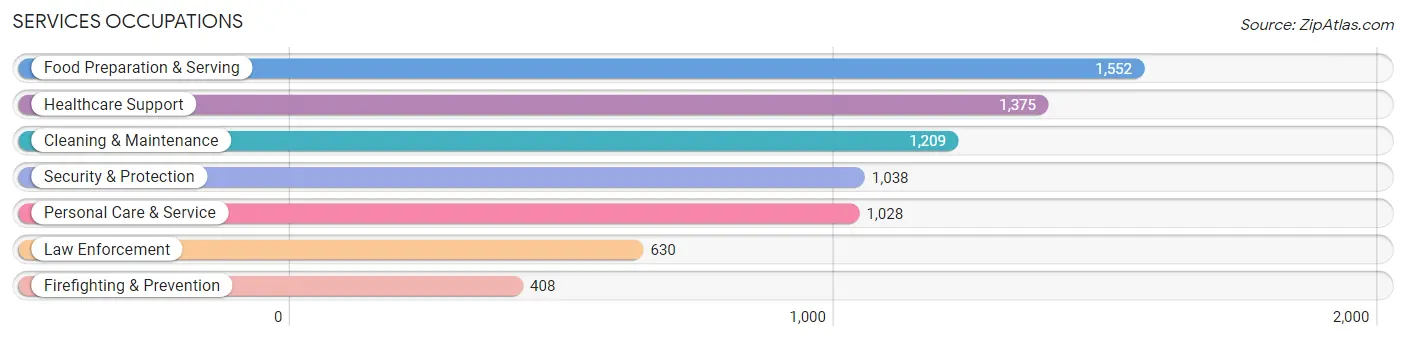
Services Occupations
The most common Services occupations in Williamson County are Food Preparation & Serving (1,552 | 5.1%), Healthcare Support (1,375 | 4.5%), Cleaning & Maintenance (1,209 | 4.0%), Security & Protection (1,038 | 3.4%), and Personal Care & Service (1,028 | 3.4%).
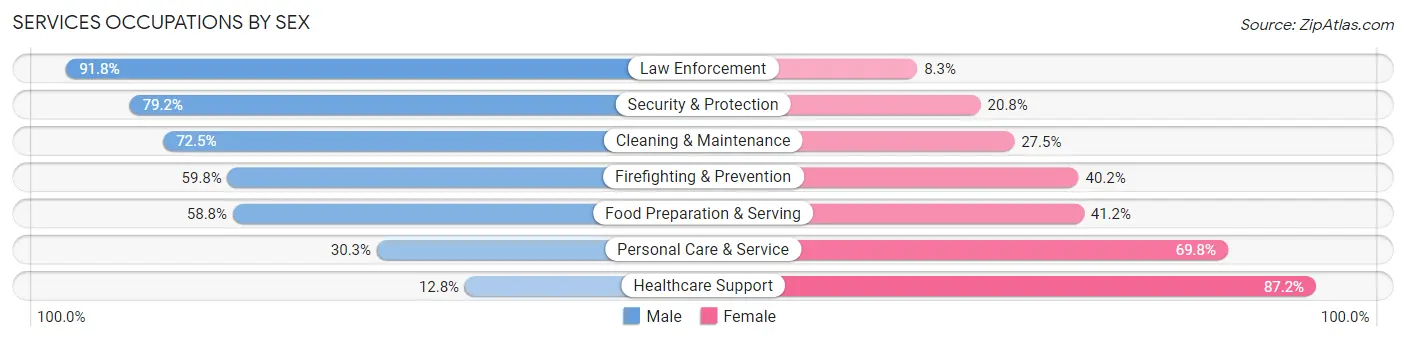
Services Occupations by Sex
Within the Services occupations in Williamson County, the most male-oriented occupations are Law Enforcement (91.7%), Security & Protection (79.2%), and Cleaning & Maintenance (72.5%), while the most female-oriented occupations are Healthcare Support (87.2%), Personal Care & Service (69.8%), and Food Preparation & Serving (41.2%).
| Occupation | Male | Female |
| Healthcare Support | 176 (12.8%) | 1,199 (87.2%) |
| Security & Protection | 822 (79.2%) | 216 (20.8%) |
| Firefighting & Prevention | 244 (59.8%) | 164 (40.2%) |
| Law Enforcement | 578 (91.7%) | 52 (8.3%) |
| Food Preparation & Serving | 912 (58.8%) | 640 (41.2%) |
| Cleaning & Maintenance | 877 (72.5%) | 332 (27.5%) |
| Personal Care & Service | 311 (30.2%) | 717 (69.8%) |
| Total (Category) | 3,098 (49.9%) | 3,104 (50.0%) |
| Total (Overall) | 15,803 (52.0%) | 14,584 (48.0%) |
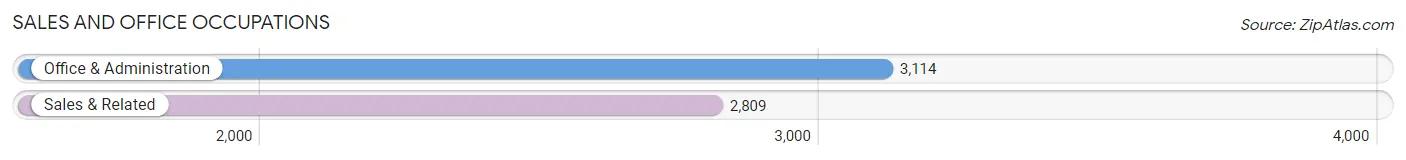
Sales and Office Occupations
The most common Sales and Office occupations in Williamson County are Office & Administration (3,114 | 10.2%), and Sales & Related (2,809 | 9.2%).
Sales and Office Occupations by Sex
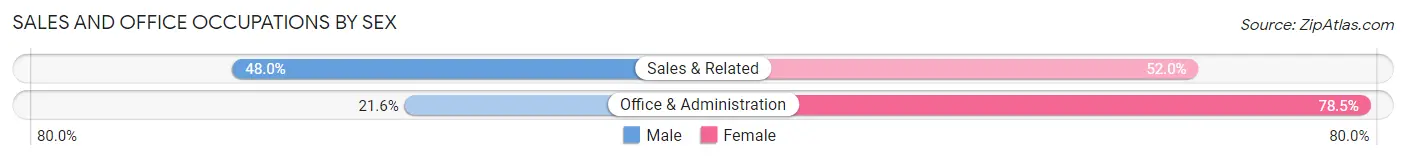
| Occupation | Male | Female |
| Sales & Related | 1,349 (48.0%) | 1,460 (52.0%) |
| Office & Administration | 671 (21.5%) | 2,443 (78.4%) |
| Total (Category) | 2,020 (34.1%) | 3,903 (65.9%) |
| Total (Overall) | 15,803 (52.0%) | 14,584 (48.0%) |
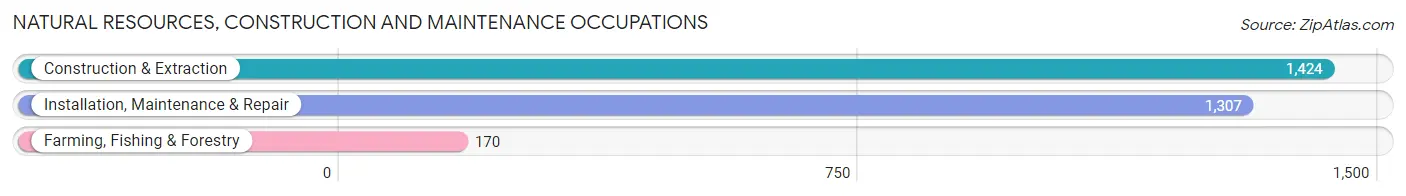
Natural Resources, Construction and Maintenance Occupations
The most common Natural Resources, Construction and Maintenance occupations in Williamson County are Construction & Extraction (1,424 | 4.7%), Installation, Maintenance & Repair (1,307 | 4.3%), and Farming, Fishing & Forestry (170 | 0.6%).
Natural Resources, Construction and Maintenance Occupations by Sex
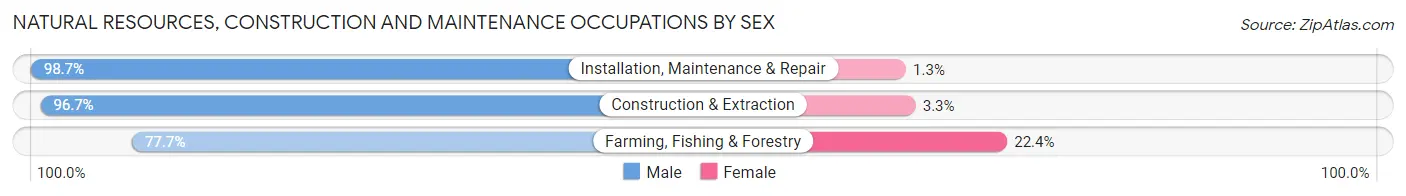
| Occupation | Male | Female |
| Farming, Fishing & Forestry | 132 (77.6%) | 38 (22.4%) |
| Construction & Extraction | 1,377 (96.7%) | 47 (3.3%) |
| Installation, Maintenance & Repair | 1,290 (98.7%) | 17 (1.3%) |
| Total (Category) | 2,799 (96.5%) | 102 (3.5%) |
| Total (Overall) | 15,803 (52.0%) | 14,584 (48.0%) |
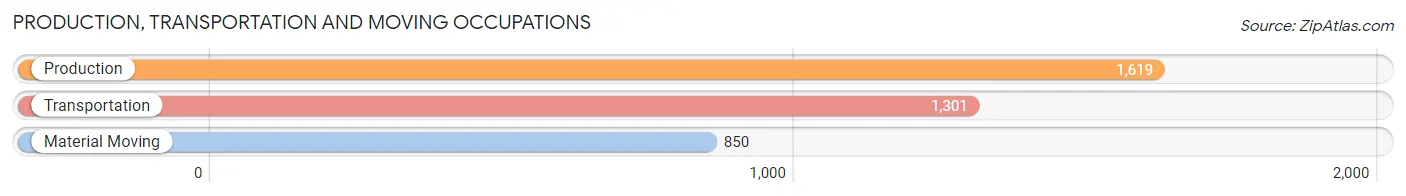
Production, Transportation and Moving Occupations
The most common Production, Transportation and Moving occupations in Williamson County are Production (1,619 | 5.3%), Transportation (1,301 | 4.3%), and Material Moving (850 | 2.8%).
Production, Transportation and Moving Occupations by Sex
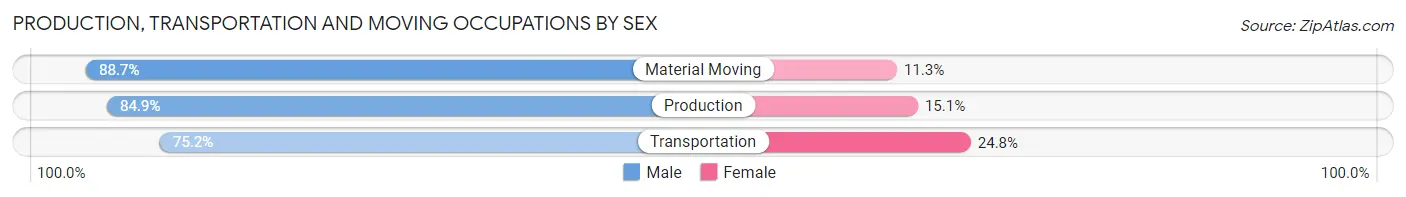
| Occupation | Male | Female |
| Production | 1,374 (84.9%) | 245 (15.1%) |
| Transportation | 978 (75.2%) | 323 (24.8%) |
| Material Moving | 754 (88.7%) | 96 (11.3%) |
| Total (Category) | 3,106 (82.4%) | 664 (17.6%) |
| Total (Overall) | 15,803 (52.0%) | 14,584 (48.0%) |
Employment Industries by Sex in Williamson County
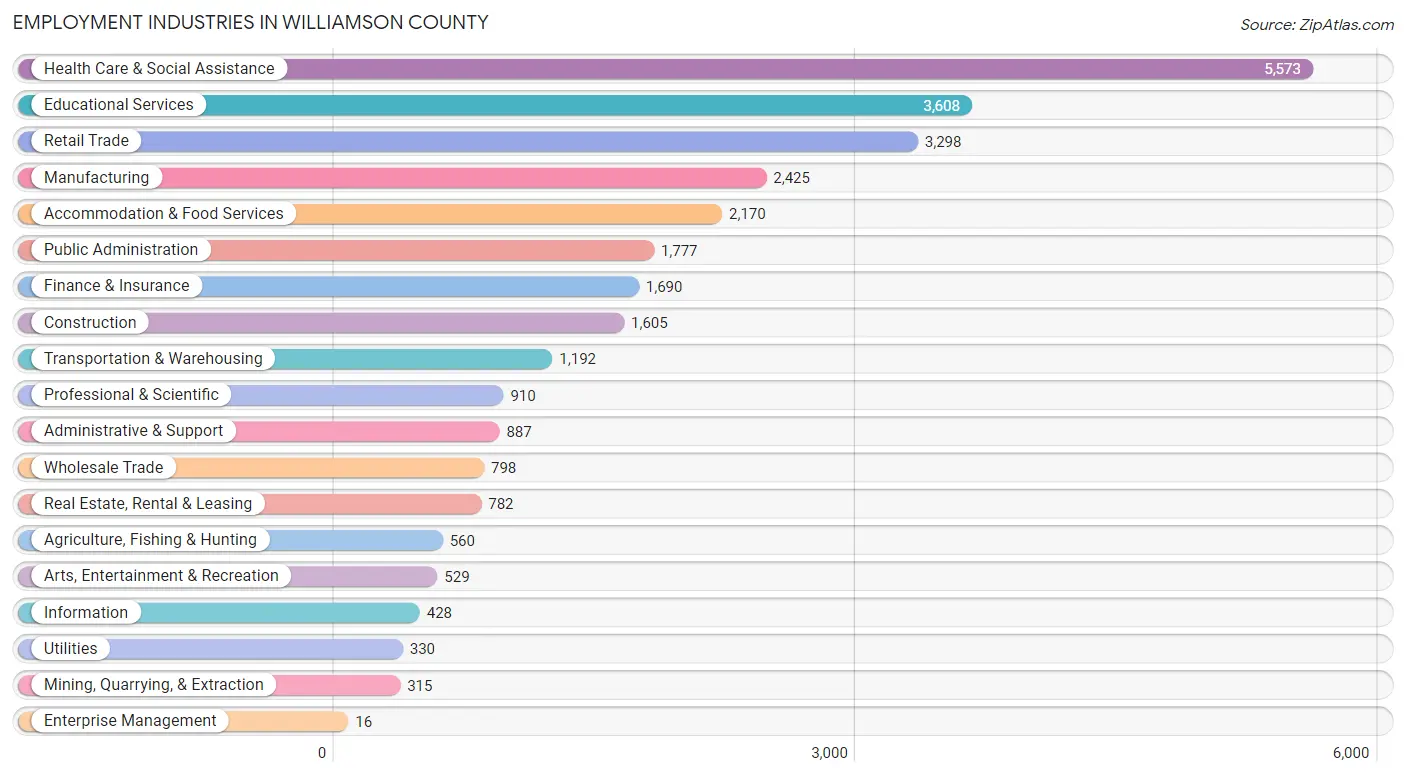
Employment Industries in Williamson County
The major employment industries in Williamson County include Health Care & Social Assistance (5,573 | 18.3%), Educational Services (3,608 | 11.9%), Retail Trade (3,298 | 10.8%), Manufacturing (2,425 | 8.0%), and Accommodation & Food Services (2,170 | 7.1%).
Employment Industries by Sex in Williamson County
The Williamson County industries that see more men than women are Mining, Quarrying, & Extraction (100.0%), Construction (93.3%), and Agriculture, Fishing & Hunting (91.1%), whereas the industries that tend to have a higher number of women are Health Care & Social Assistance (78.6%), Finance & Insurance (70.1%), and Enterprise Management (68.8%).
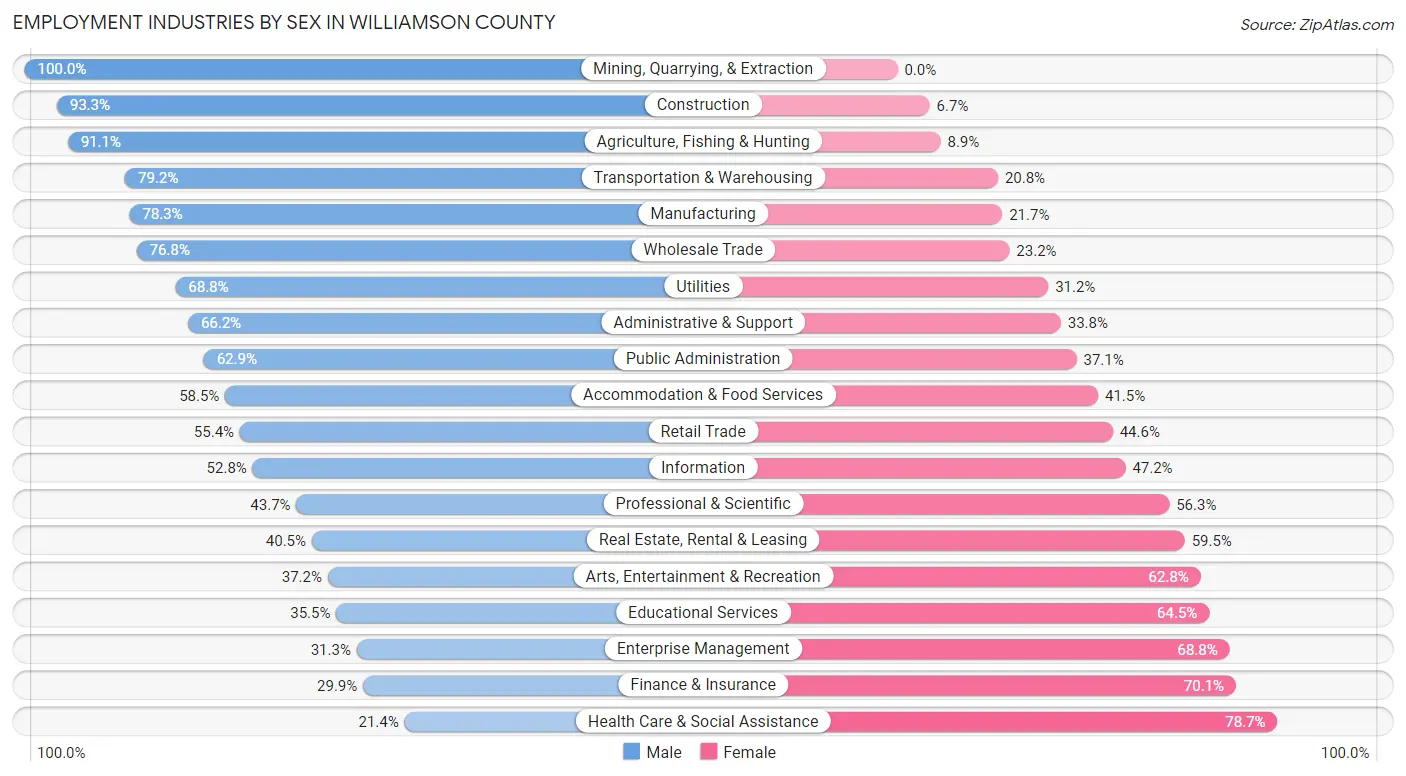
| Industry | Male | Female |
| Agriculture, Fishing & Hunting | 510 (91.1%) | 50 (8.9%) |
| Mining, Quarrying, & Extraction | 315 (100.0%) | 0 (0.0%) |
| Construction | 1,498 (93.3%) | 107 (6.7%) |
| Manufacturing | 1,899 (78.3%) | 526 (21.7%) |
| Wholesale Trade | 613 (76.8%) | 185 (23.2%) |
| Retail Trade | 1,828 (55.4%) | 1,470 (44.6%) |
| Transportation & Warehousing | 944 (79.2%) | 248 (20.8%) |
| Utilities | 227 (68.8%) | 103 (31.2%) |
| Information | 226 (52.8%) | 202 (47.2%) |
| Finance & Insurance | 506 (29.9%) | 1,184 (70.1%) |
| Real Estate, Rental & Leasing | 317 (40.5%) | 465 (59.5%) |
| Professional & Scientific | 398 (43.7%) | 512 (56.3%) |
| Enterprise Management | 5 (31.2%) | 11 (68.8%) |
| Administrative & Support | 587 (66.2%) | 300 (33.8%) |
| Educational Services | 1,280 (35.5%) | 2,328 (64.5%) |
| Health Care & Social Assistance | 1,190 (21.3%) | 4,383 (78.6%) |
| Arts, Entertainment & Recreation | 197 (37.2%) | 332 (62.8%) |
| Accommodation & Food Services | 1,269 (58.5%) | 901 (41.5%) |
| Public Administration | 1,118 (62.9%) | 659 (37.1%) |
| Total | 15,803 (52.0%) | 14,584 (48.0%) |
Education in Williamson County
School Enrollment in Williamson County
The most common levels of schooling among the 14,695 students in Williamson County are middle school (3,678 | 25.0%), high school (3,107 | 21.1%), and elementary school (3,040 | 20.7%).
| School Level | # Students | % Students |
| Nursery / Preschool | 1,048 | 7.1% |
| Kindergarten | 806 | 5.5% |
| Elementary School | 3,040 | 20.7% |
| Middle School | 3,678 | 25.0% |
| High School | 3,107 | 21.1% |
| College / Undergraduate | 2,432 | 16.6% |
| Graduate / Professional | 584 | 4.0% |
| Total | 14,695 | 100.0% |
School Enrollment by Age by Funding Source in Williamson County
Out of a total of 14,695 students who are enrolled in schools in Williamson County, 1,470 (10.0%) attend a private institution, while the remaining 13,226 (90.0%) are enrolled in public schools. The age group of 3 to 4 year olds has the highest likelihood of being enrolled in private schools, with 167 (23.6% in the age bracket) enrolled. Conversely, the age group of 20 to 24 year olds has the lowest likelihood of being enrolled in a private school, with 1,157 (99.2% in the age bracket) attending a public institution.
| Age Bracket | Public School | Private School |
| 3 to 4 Year Olds | 541 (76.4%) | 167 (23.6%) |
| 5 to 9 Year Old | 3,162 (83.5%) | 625 (16.5%) |
| 10 to 14 Year Olds | 4,038 (94.3%) | 246 (5.7%) |
| 15 to 17 Year Olds | 2,257 (93.9%) | 147 (6.1%) |
| 18 to 19 Year Olds | 774 (95.1%) | 40 (4.9%) |
| 20 to 24 Year Olds | 1,157 (99.2%) | 9 (0.8%) |
| 25 to 34 Year Olds | 748 (88.8%) | 94 (11.2%) |
| 35 Years and over | 548 (79.4%) | 142 (20.6%) |
| Total | 13,226 (90.0%) | 1,470 (10.0%) |
Educational Attainment by Field of Study in Williamson County
Education (2,863 | 20.8%), business (2,107 | 15.3%), science & technology (1,945 | 14.1%), arts & humanities (1,400 | 10.2%), and bio, nature & agricultural (882 | 6.4%) are the most common fields of study among 13,778 individuals in Williamson County who have obtained a bachelor's degree or higher.
| Field of Study | # Graduates | % Graduates |
| Computers & Mathematics | 461 | 3.4% |
| Bio, Nature & Agricultural | 882 | 6.4% |
| Physical & Health Sciences | 432 | 3.1% |
| Psychology | 777 | 5.6% |
| Social Sciences | 690 | 5.0% |
| Engineering | 501 | 3.6% |
| Multidisciplinary Studies | 189 | 1.4% |
| Science & Technology | 1,945 | 14.1% |
| Business | 2,107 | 15.3% |
| Education | 2,863 | 20.8% |
| Literature & Languages | 377 | 2.7% |
| Liberal Arts & History | 285 | 2.1% |
| Visual & Performing Arts | 485 | 3.5% |
| Communications | 384 | 2.8% |
| Arts & Humanities | 1,400 | 10.2% |
| Total | 13,778 | 100.0% |
Transportation & Commute in Williamson County
Vehicle Availability by Sex in Williamson County
The most prevalent vehicle ownership categories in Williamson County are males with 2 vehicles (7,446, accounting for 47.8%) and females with 2 vehicles (6,286, making up 52.4%).
| Vehicles Available | Male | Female |
| No Vehicle | 519 (3.3%) | 320 (2.2%) |
| 1 Vehicle | 2,511 (16.1%) | 2,989 (21.0%) |
| 2 Vehicles | 7,446 (47.8%) | 6,286 (44.2%) |
| 3 Vehicles | 3,297 (21.2%) | 3,040 (21.4%) |
| 4 Vehicles | 1,350 (8.7%) | 1,199 (8.4%) |
| 5 or more Vehicles | 459 (2.9%) | 387 (2.7%) |
| Total | 15,582 (100.0%) | 14,221 (100.0%) |
Commute Time in Williamson County
The most frequently occuring commute durations in Williamson County are 15 to 19 minutes (5,505 commuters, 19.9%), 10 to 14 minutes (5,168 commuters, 18.7%), and 20 to 24 minutes (3,468 commuters, 12.5%).

| Commute Time | # Commuters | % Commuters |
| Less than 5 Minutes | 1,233 | 4.4% |
| 5 to 9 Minutes | 3,169 | 11.4% |
| 10 to 14 Minutes | 5,168 | 18.7% |
| 15 to 19 Minutes | 5,505 | 19.9% |
| 20 to 24 Minutes | 3,468 | 12.5% |
| 25 to 29 Minutes | 1,556 | 5.6% |
| 30 to 34 Minutes | 3,349 | 12.1% |
| 35 to 39 Minutes | 796 | 2.9% |
| 40 to 44 Minutes | 558 | 2.0% |
| 45 to 59 Minutes | 1,356 | 4.9% |
| 60 to 89 Minutes | 700 | 2.5% |
| 90 or more Minutes | 845 | 3.0% |
Commute Time by Sex in Williamson County
The most common commute times in Williamson County are 15 to 19 minutes (2,816 commuters, 19.1%) for males and 15 to 19 minutes (2,689 commuters, 20.8%) for females.
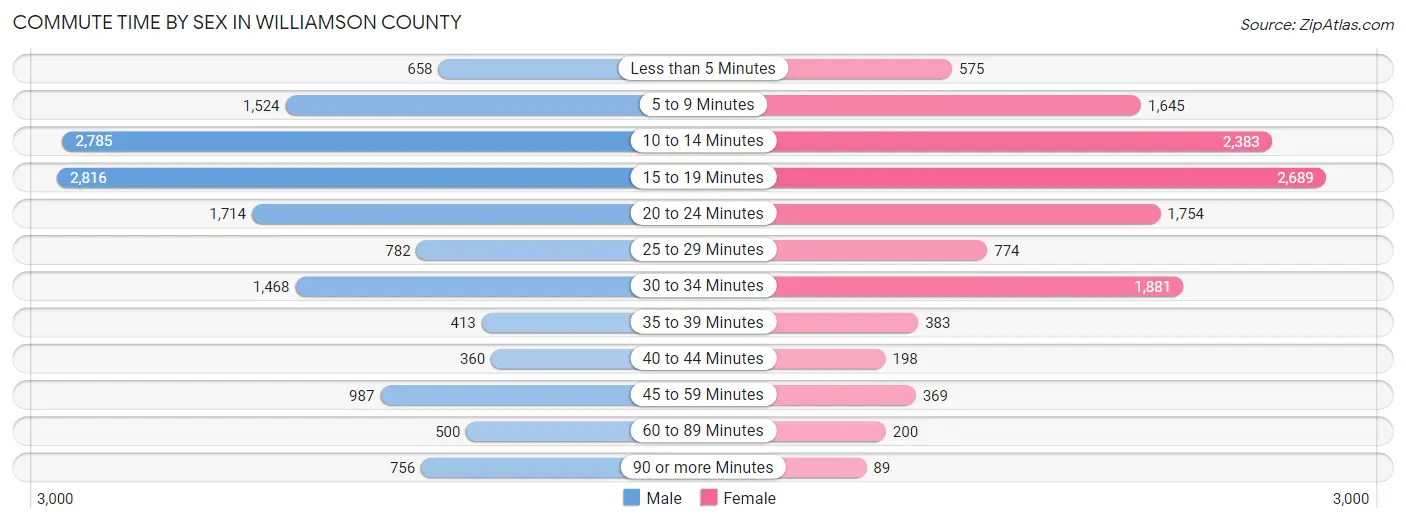
| Commute Time | Male | Female |
| Less than 5 Minutes | 658 (4.5%) | 575 (4.4%) |
| 5 to 9 Minutes | 1,524 (10.3%) | 1,645 (12.7%) |
| 10 to 14 Minutes | 2,785 (18.9%) | 2,383 (18.4%) |
| 15 to 19 Minutes | 2,816 (19.1%) | 2,689 (20.8%) |
| 20 to 24 Minutes | 1,714 (11.6%) | 1,754 (13.6%) |
| 25 to 29 Minutes | 782 (5.3%) | 774 (6.0%) |
| 30 to 34 Minutes | 1,468 (9.9%) | 1,881 (14.5%) |
| 35 to 39 Minutes | 413 (2.8%) | 383 (3.0%) |
| 40 to 44 Minutes | 360 (2.4%) | 198 (1.5%) |
| 45 to 59 Minutes | 987 (6.7%) | 369 (2.9%) |
| 60 to 89 Minutes | 500 (3.4%) | 200 (1.5%) |
| 90 or more Minutes | 756 (5.1%) | 89 (0.7%) |
Time of Departure to Work by Sex in Williamson County
The most frequent times of departure to work in Williamson County are 7:30 AM to 7:59 AM (2,213, 15.0%) for males and 7:30 AM to 7:59 AM (2,665, 20.6%) for females.
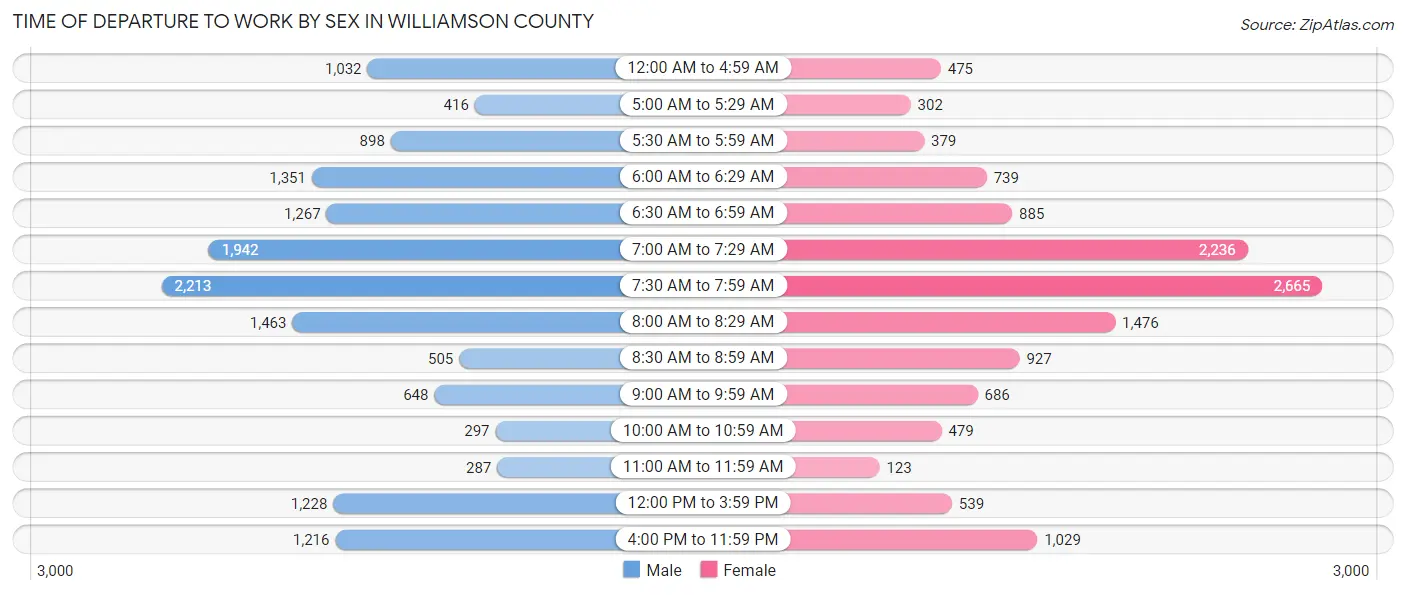
| Time of Departure | Male | Female |
| 12:00 AM to 4:59 AM | 1,032 (7.0%) | 475 (3.7%) |
| 5:00 AM to 5:29 AM | 416 (2.8%) | 302 (2.3%) |
| 5:30 AM to 5:59 AM | 898 (6.1%) | 379 (2.9%) |
| 6:00 AM to 6:29 AM | 1,351 (9.1%) | 739 (5.7%) |
| 6:30 AM to 6:59 AM | 1,267 (8.6%) | 885 (6.8%) |
| 7:00 AM to 7:29 AM | 1,942 (13.2%) | 2,236 (17.3%) |
| 7:30 AM to 7:59 AM | 2,213 (15.0%) | 2,665 (20.6%) |
| 8:00 AM to 8:29 AM | 1,463 (9.9%) | 1,476 (11.4%) |
| 8:30 AM to 8:59 AM | 505 (3.4%) | 927 (7.2%) |
| 9:00 AM to 9:59 AM | 648 (4.4%) | 686 (5.3%) |
| 10:00 AM to 10:59 AM | 297 (2.0%) | 479 (3.7%) |
| 11:00 AM to 11:59 AM | 287 (1.9%) | 123 (0.9%) |
| 12:00 PM to 3:59 PM | 1,228 (8.3%) | 539 (4.2%) |
| 4:00 PM to 11:59 PM | 1,216 (8.2%) | 1,029 (8.0%) |
| Total | 14,763 (100.0%) | 12,940 (100.0%) |
Housing Occupancy in Williamson County
Occupancy by Ownership in Williamson County
Of the total 28,521 dwellings in Williamson County, owner-occupied units account for 20,237 (71.0%), while renter-occupied units make up 8,284 (29.0%).
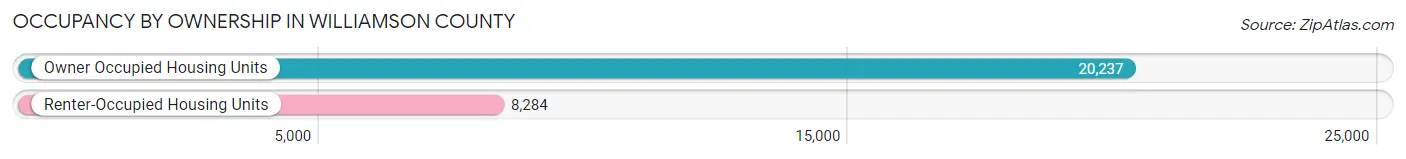
| Occupancy | # Housing Units | % Housing Units |
| Owner Occupied Housing Units | 20,237 | 71.0% |
| Renter-Occupied Housing Units | 8,284 | 29.0% |
| Total Occupied Housing Units | 28,521 | 100.0% |
Occupancy by Household Size in Williamson County
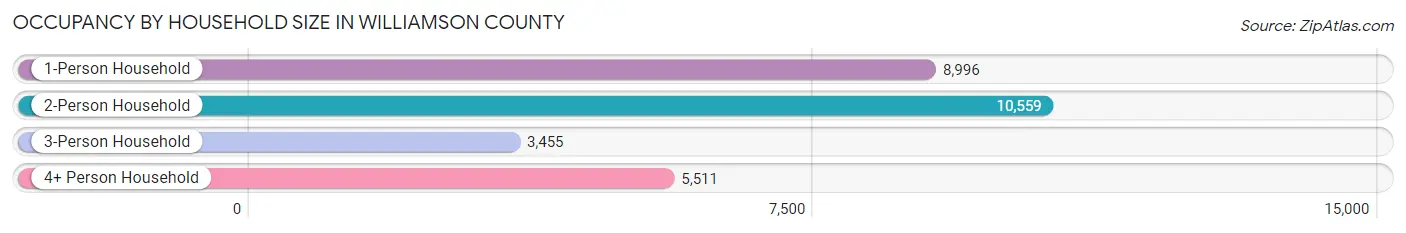
| Household Size | # Housing Units | % Housing Units |
| 1-Person Household | 8,996 | 31.5% |
| 2-Person Household | 10,559 | 37.0% |
| 3-Person Household | 3,455 | 12.1% |
| 4+ Person Household | 5,511 | 19.3% |
| Total Housing Units | 28,521 | 100.0% |
Occupancy by Ownership by Household Size in Williamson County
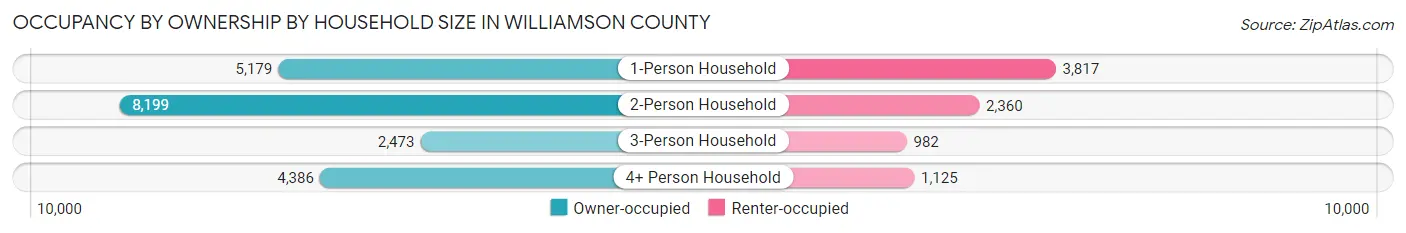
| Household Size | Owner-occupied | Renter-occupied |
| 1-Person Household | 5,179 (57.6%) | 3,817 (42.4%) |
| 2-Person Household | 8,199 (77.6%) | 2,360 (22.4%) |
| 3-Person Household | 2,473 (71.6%) | 982 (28.4%) |
| 4+ Person Household | 4,386 (79.6%) | 1,125 (20.4%) |
| Total Housing Units | 20,237 (71.0%) | 8,284 (29.0%) |
Occupancy by Educational Attainment in Williamson County
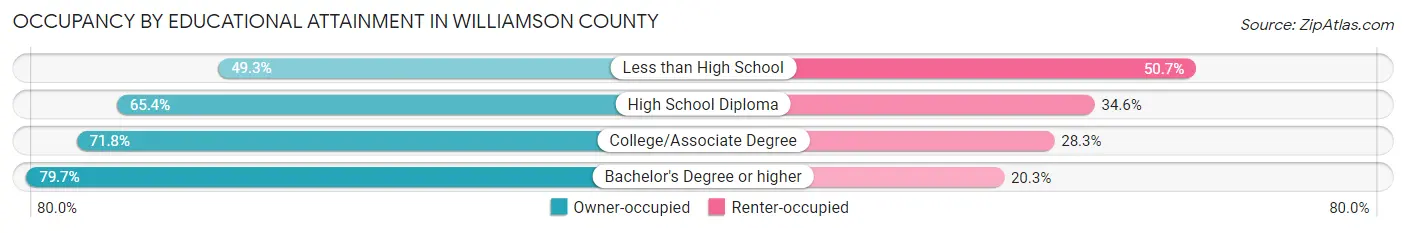
| Household Size | Owner-occupied | Renter-occupied |
| Less than High School | 894 (49.3%) | 920 (50.7%) |
| High School Diploma | 4,958 (65.4%) | 2,628 (34.6%) |
| College/Associate Degree | 7,737 (71.8%) | 3,046 (28.2%) |
| Bachelor's Degree or higher | 6,648 (79.7%) | 1,690 (20.3%) |
Occupancy by Age of Householder in Williamson County
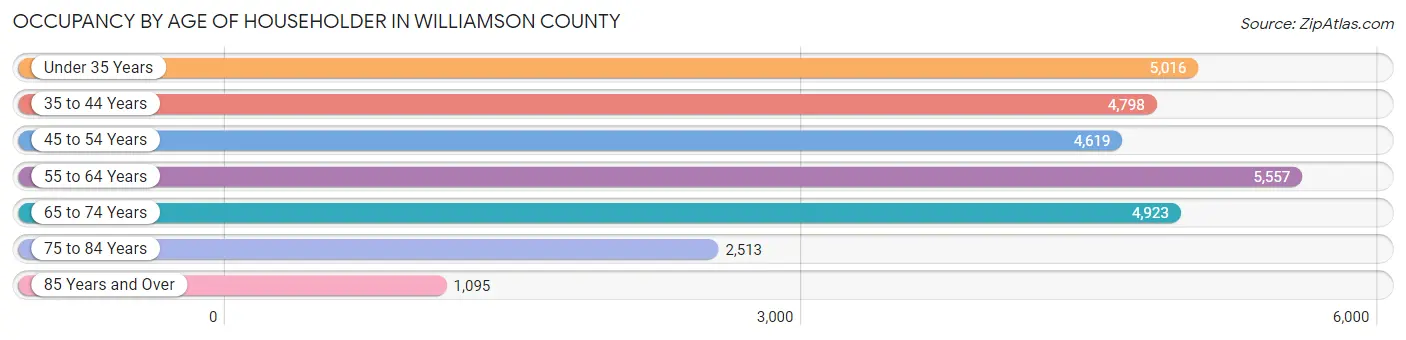
| Age Bracket | # Households | % Households |
| Under 35 Years | 5,016 | 17.6% |
| 35 to 44 Years | 4,798 | 16.8% |
| 45 to 54 Years | 4,619 | 16.2% |
| 55 to 64 Years | 5,557 | 19.5% |
| 65 to 74 Years | 4,923 | 17.3% |
| 75 to 84 Years | 2,513 | 8.8% |
| 85 Years and Over | 1,095 | 3.8% |
| Total | 28,521 | 100.0% |
Housing Finances in Williamson County
Median Income by Occupancy in Williamson County
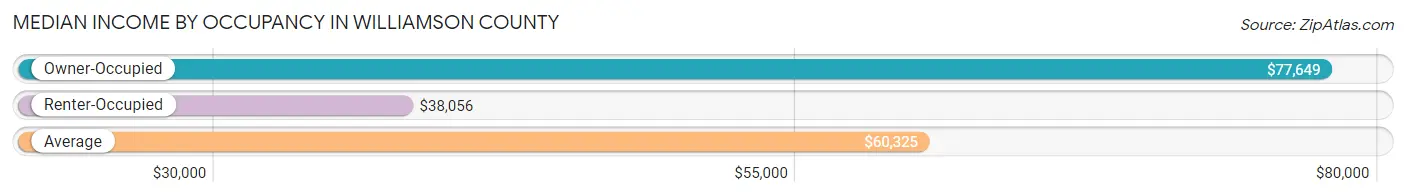
| Occupancy Type | # Households | Median Income |
| Owner-Occupied | 20,237 (71.0%) | $77,649 |
| Renter-Occupied | 8,284 (29.0%) | $38,056 |
| Average | 28,521 (100.0%) | $60,325 |
Occupancy by Householder Income Bracket in Williamson County
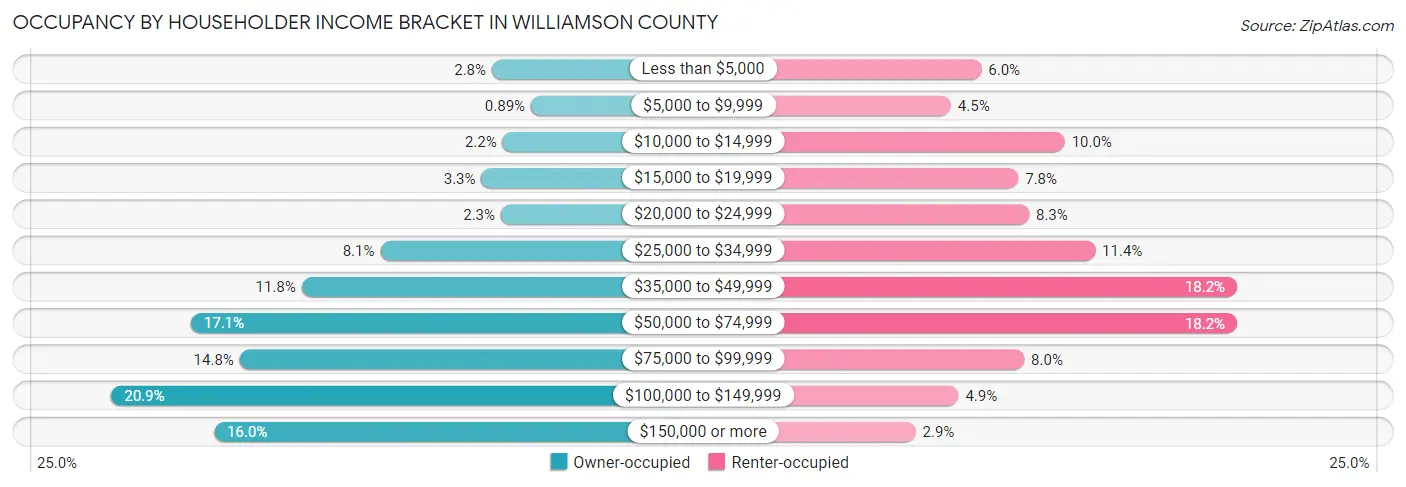
| Income Bracket | Owner-occupied | Renter-occupied |
| Less than $5,000 | 557 (2.8%) | 496 (6.0%) |
| $5,000 to $9,999 | 180 (0.9%) | 376 (4.5%) |
| $10,000 to $14,999 | 453 (2.2%) | 825 (10.0%) |
| $15,000 to $19,999 | 658 (3.3%) | 642 (7.7%) |
| $20,000 to $24,999 | 469 (2.3%) | 684 (8.3%) |
| $25,000 to $34,999 | 1,631 (8.1%) | 945 (11.4%) |
| $35,000 to $49,999 | 2,390 (11.8%) | 1,504 (18.2%) |
| $50,000 to $74,999 | 3,457 (17.1%) | 1,504 (18.2%) |
| $75,000 to $99,999 | 2,986 (14.8%) | 665 (8.0%) |
| $100,000 to $149,999 | 4,223 (20.9%) | 406 (4.9%) |
| $150,000 or more | 3,233 (16.0%) | 237 (2.9%) |
| Total | 20,237 (100.0%) | 8,284 (100.0%) |
Monthly Housing Cost Tiers in Williamson County
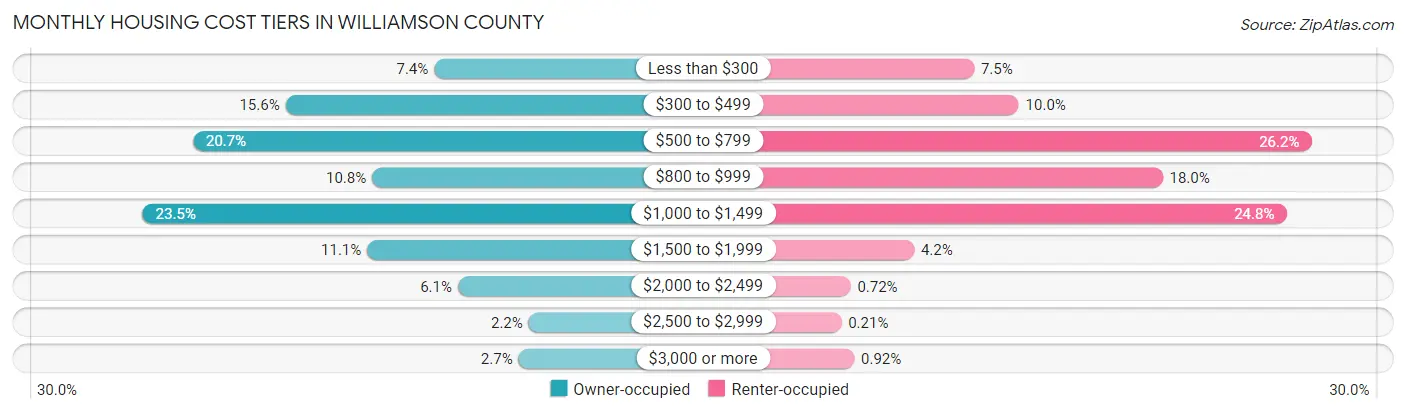
| Monthly Cost | Owner-occupied | Renter-occupied |
| Less than $300 | 1,494 (7.4%) | 625 (7.5%) |
| $300 to $499 | 3,155 (15.6%) | 829 (10.0%) |
| $500 to $799 | 4,191 (20.7%) | 2,168 (26.2%) |
| $800 to $999 | 2,187 (10.8%) | 1,488 (18.0%) |
| $1,000 to $1,499 | 4,752 (23.5%) | 2,054 (24.8%) |
| $1,500 to $1,999 | 2,243 (11.1%) | 350 (4.2%) |
| $2,000 to $2,499 | 1,228 (6.1%) | 60 (0.7%) |
| $2,500 to $2,999 | 437 (2.2%) | 17 (0.2%) |
| $3,000 or more | 550 (2.7%) | 76 (0.9%) |
| Total | 20,237 (100.0%) | 8,284 (100.0%) |
Physical Housing Characteristics in Williamson County
Housing Structures in Williamson County
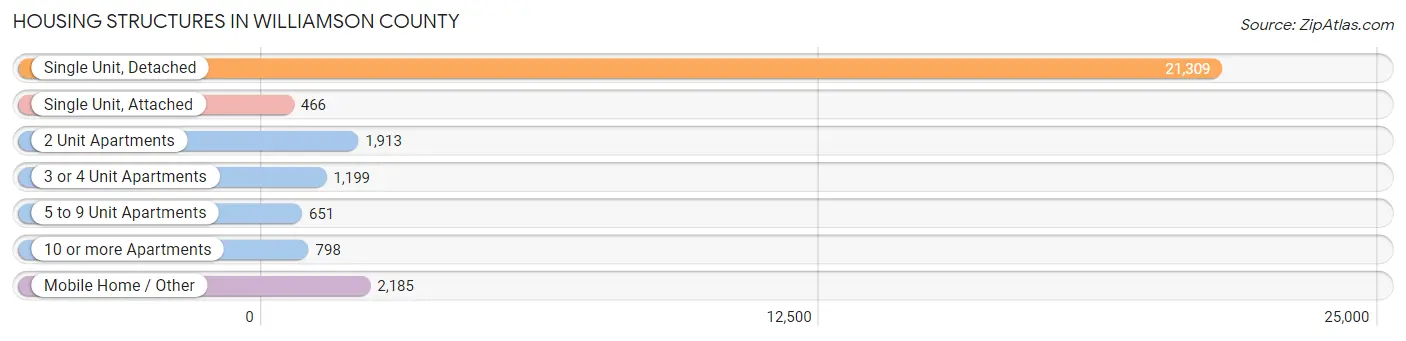
| Structure Type | # Housing Units | % Housing Units |
| Single Unit, Detached | 21,309 | 74.7% |
| Single Unit, Attached | 466 | 1.6% |
| 2 Unit Apartments | 1,913 | 6.7% |
| 3 or 4 Unit Apartments | 1,199 | 4.2% |
| 5 to 9 Unit Apartments | 651 | 2.3% |
| 10 or more Apartments | 798 | 2.8% |
| Mobile Home / Other | 2,185 | 7.7% |
| Total | 28,521 | 100.0% |
Housing Structures by Occupancy in Williamson County
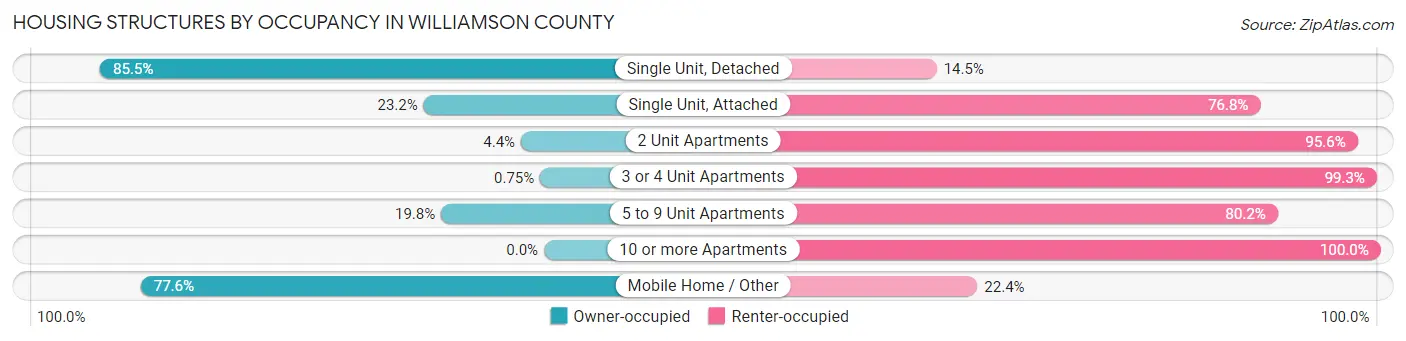
| Structure Type | Owner-occupied | Renter-occupied |
| Single Unit, Detached | 18,210 (85.5%) | 3,099 (14.5%) |
| Single Unit, Attached | 108 (23.2%) | 358 (76.8%) |
| 2 Unit Apartments | 85 (4.4%) | 1,828 (95.6%) |
| 3 or 4 Unit Apartments | 9 (0.7%) | 1,190 (99.3%) |
| 5 to 9 Unit Apartments | 129 (19.8%) | 522 (80.2%) |
| 10 or more Apartments | 0 (0.0%) | 798 (100.0%) |
| Mobile Home / Other | 1,696 (77.6%) | 489 (22.4%) |
| Total | 20,237 (71.0%) | 8,284 (29.0%) |
Housing Structures by Number of Rooms in Williamson County
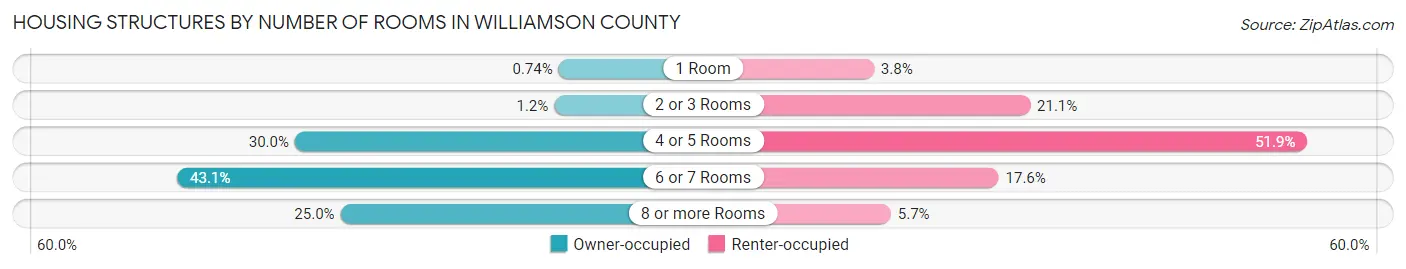
| Number of Rooms | Owner-occupied | Renter-occupied |
| 1 Room | 149 (0.7%) | 312 (3.8%) |
| 2 or 3 Rooms | 248 (1.2%) | 1,749 (21.1%) |
| 4 or 5 Rooms | 6,073 (30.0%) | 4,296 (51.9%) |
| 6 or 7 Rooms | 8,717 (43.1%) | 1,459 (17.6%) |
| 8 or more Rooms | 5,050 (24.9%) | 468 (5.7%) |
| Total | 20,237 (100.0%) | 8,284 (100.0%) |
Housing Structure by Heating Type in Williamson County
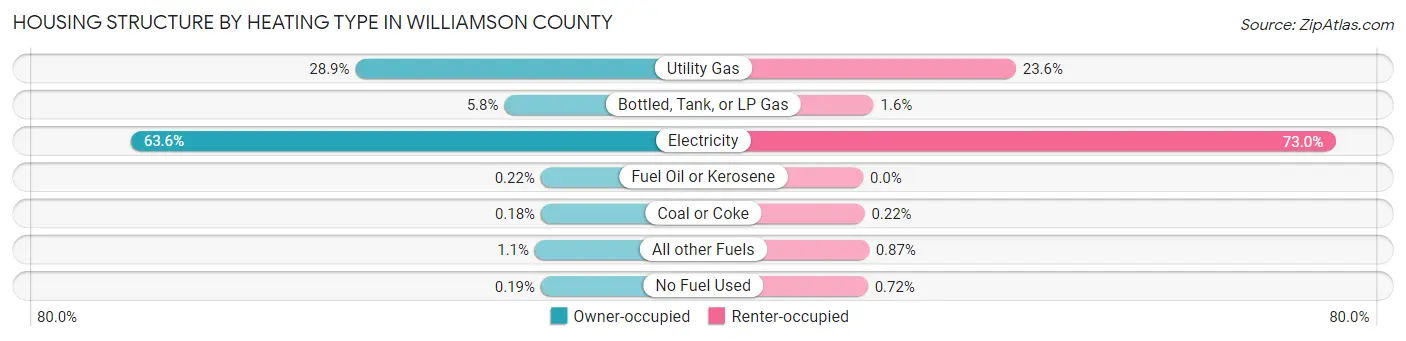
| Heating Type | Owner-occupied | Renter-occupied |
| Utility Gas | 5,842 (28.9%) | 1,956 (23.6%) |
| Bottled, Tank, or LP Gas | 1,182 (5.8%) | 135 (1.6%) |
| Electricity | 12,867 (63.6%) | 6,043 (73.0%) |
| Fuel Oil or Kerosene | 44 (0.2%) | 0 (0.0%) |
| Coal or Coke | 37 (0.2%) | 18 (0.2%) |
| All other Fuels | 226 (1.1%) | 72 (0.9%) |
| No Fuel Used | 39 (0.2%) | 60 (0.7%) |
| Total | 20,237 (100.0%) | 8,284 (100.0%) |
Household Vehicle Usage in Williamson County
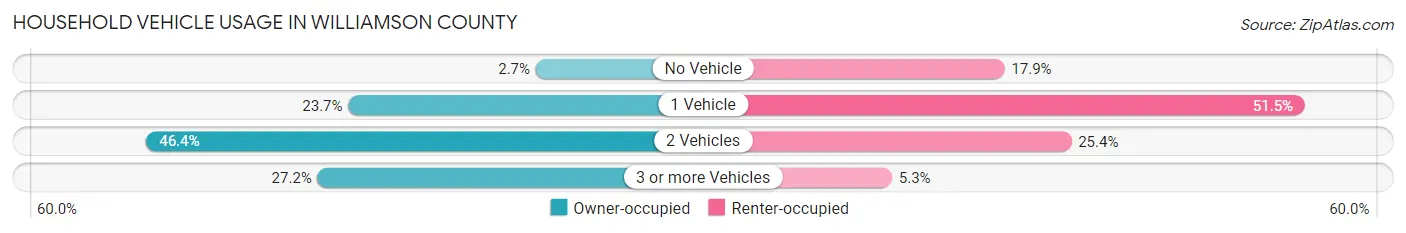
| Vehicles per Household | Owner-occupied | Renter-occupied |
| No Vehicle | 553 (2.7%) | 1,480 (17.9%) |
| 1 Vehicle | 4,803 (23.7%) | 4,268 (51.5%) |
| 2 Vehicles | 9,382 (46.4%) | 2,100 (25.4%) |
| 3 or more Vehicles | 5,499 (27.2%) | 436 (5.3%) |
| Total | 20,237 (100.0%) | 8,284 (100.0%) |
Real Estate & Mortgages in Williamson County
Real Estate and Mortgage Overview in Williamson County
| Characteristic | Without Mortgage | With Mortgage |
| Housing Units | 8,845 | 11,392 |
| Median Property Value | $110,600 | $162,600 |
| Median Household Income | $54,181 | $2,228 |
| Monthly Housing Costs | $496 | $511 |
| Real Estate Taxes | $1,491 | $349 |
Property Value by Mortgage Status in Williamson County
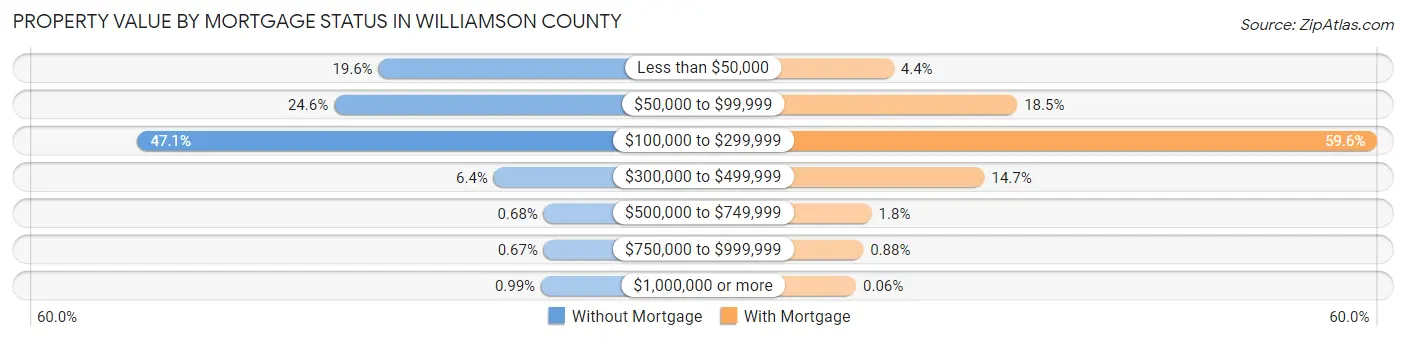
| Property Value | Without Mortgage | With Mortgage |
| Less than $50,000 | 1,730 (19.6%) | 499 (4.4%) |
| $50,000 to $99,999 | 2,179 (24.6%) | 2,105 (18.5%) |
| $100,000 to $299,999 | 4,164 (47.1%) | 6,792 (59.6%) |
| $300,000 to $499,999 | 565 (6.4%) | 1,679 (14.7%) |
| $500,000 to $749,999 | 60 (0.7%) | 210 (1.8%) |
| $750,000 to $999,999 | 59 (0.7%) | 100 (0.9%) |
| $1,000,000 or more | 88 (1.0%) | 7 (0.1%) |
| Total | 8,845 (100.0%) | 11,392 (100.0%) |
Household Income by Mortgage Status in Williamson County
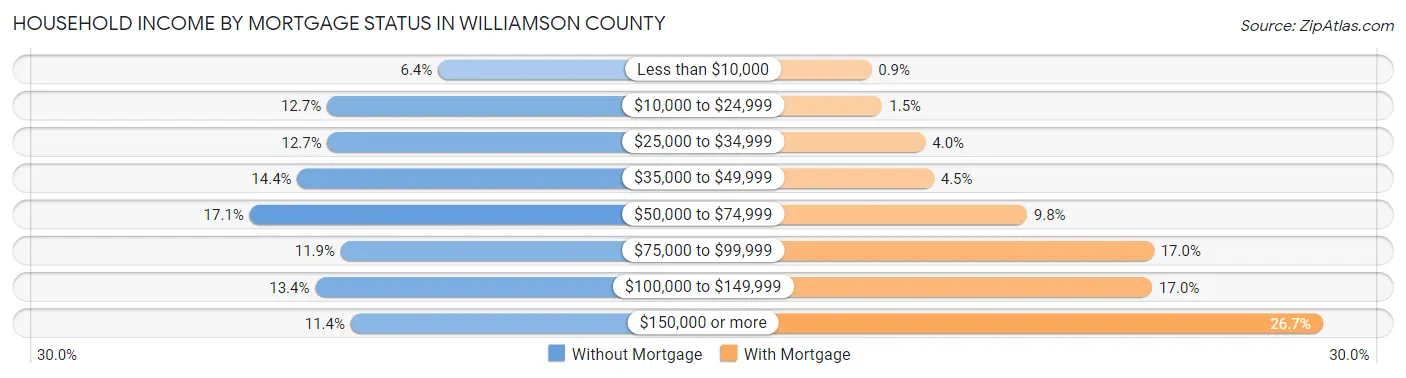
| Household Income | Without Mortgage | With Mortgage |
| Less than $10,000 | 563 (6.4%) | 102 (0.9%) |
| $10,000 to $24,999 | 1,125 (12.7%) | 174 (1.5%) |
| $25,000 to $34,999 | 1,122 (12.7%) | 455 (4.0%) |
| $35,000 to $49,999 | 1,275 (14.4%) | 509 (4.5%) |
| $50,000 to $74,999 | 1,516 (17.1%) | 1,115 (9.8%) |
| $75,000 to $99,999 | 1,055 (11.9%) | 1,941 (17.0%) |
| $100,000 to $149,999 | 1,184 (13.4%) | 1,931 (17.0%) |
| $150,000 or more | 1,005 (11.4%) | 3,039 (26.7%) |
| Total | 8,845 (100.0%) | 11,392 (100.0%) |
Property Value to Household Income Ratio in Williamson County
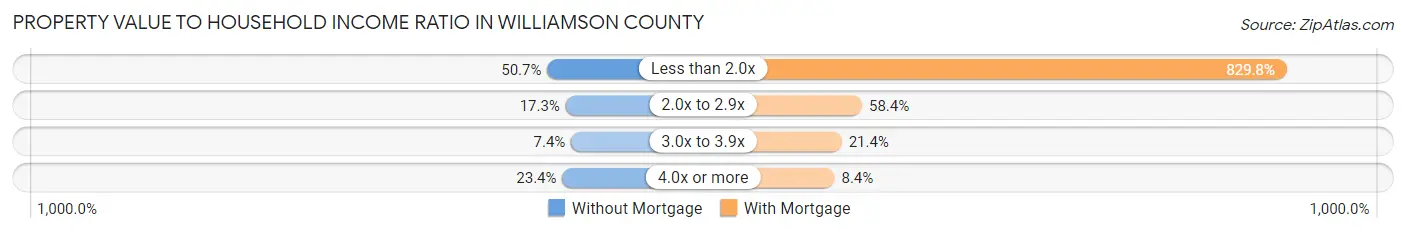
| Value-to-Income Ratio | Without Mortgage | With Mortgage |
| Less than 2.0x | 4,482 (50.7%) | 94,535 (829.8%) |
| 2.0x to 2.9x | 1,530 (17.3%) | 6,655 (58.4%) |
| 3.0x to 3.9x | 652 (7.4%) | 2,437 (21.4%) |
| 4.0x or more | 2,069 (23.4%) | 962 (8.4%) |
| Total | 8,845 (100.0%) | 11,392 (100.0%) |
Real Estate Taxes by Mortgage Status in Williamson County
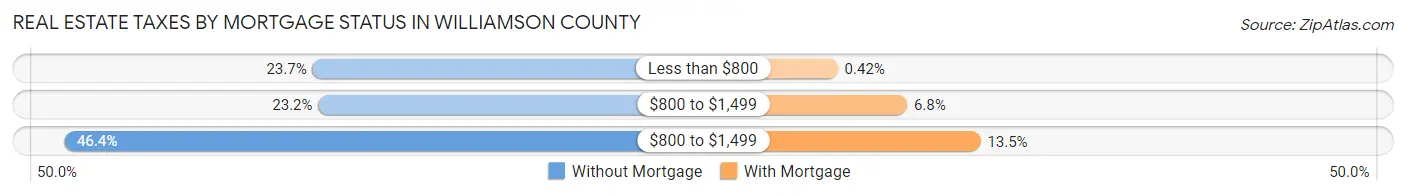
| Property Taxes | Without Mortgage | With Mortgage |
| Less than $800 | 2,097 (23.7%) | 48 (0.4%) |
| $800 to $1,499 | 2,049 (23.2%) | 769 (6.8%) |
| $800 to $1,499 | 4,104 (46.4%) | 1,533 (13.5%) |
| Total | 8,845 (100.0%) | 11,392 (100.0%) |
Health & Disability in Williamson County
Health Insurance Coverage by Age in Williamson County
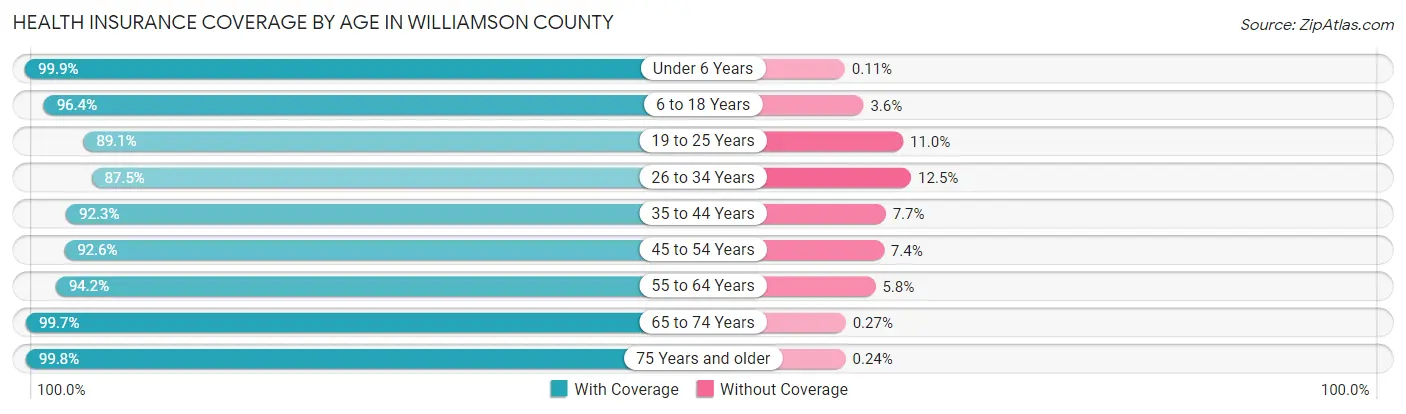
| Age Bracket | With Coverage | Without Coverage |
| Under 6 Years | 4,730 (99.9%) | 5 (0.1%) |
| 6 to 18 Years | 9,976 (96.4%) | 369 (3.6%) |
| 19 to 25 Years | 4,059 (89.0%) | 499 (11.0%) |
| 26 to 34 Years | 6,634 (87.5%) | 945 (12.5%) |
| 35 to 44 Years | 7,690 (92.3%) | 644 (7.7%) |
| 45 to 54 Years | 7,558 (92.6%) | 603 (7.4%) |
| 55 to 64 Years | 8,407 (94.2%) | 519 (5.8%) |
| 65 to 74 Years | 7,404 (99.7%) | 20 (0.3%) |
| 75 Years and older | 5,047 (99.8%) | 12 (0.2%) |
| Total | 61,505 (94.5%) | 3,616 (5.6%) |
Health Insurance Coverage by Citizenship Status in Williamson County
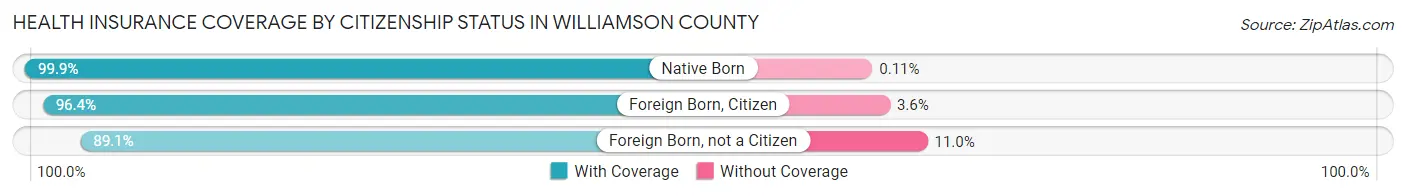
| Citizenship Status | With Coverage | Without Coverage |
| Native Born | 4,730 (99.9%) | 5 (0.1%) |
| Foreign Born, Citizen | 9,976 (96.4%) | 369 (3.6%) |
| Foreign Born, not a Citizen | 4,059 (89.0%) | 499 (11.0%) |
Health Insurance Coverage by Household Income in Williamson County
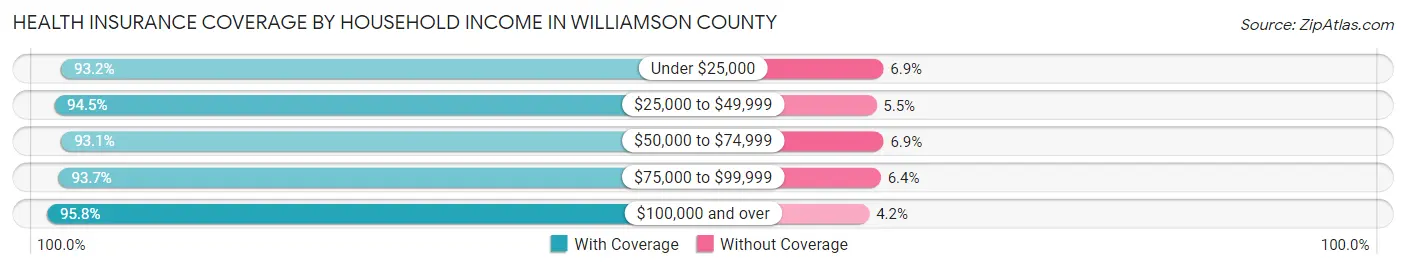
| Household Income | With Coverage | Without Coverage |
| Under $25,000 | 7,884 (93.1%) | 580 (6.9%) |
| $25,000 to $49,999 | 11,926 (94.5%) | 699 (5.5%) |
| $50,000 to $74,999 | 10,037 (93.1%) | 740 (6.9%) |
| $75,000 to $99,999 | 8,644 (93.6%) | 586 (6.4%) |
| $100,000 and over | 22,878 (95.8%) | 1,002 (4.2%) |
Public vs Private Health Insurance Coverage by Age in Williamson County
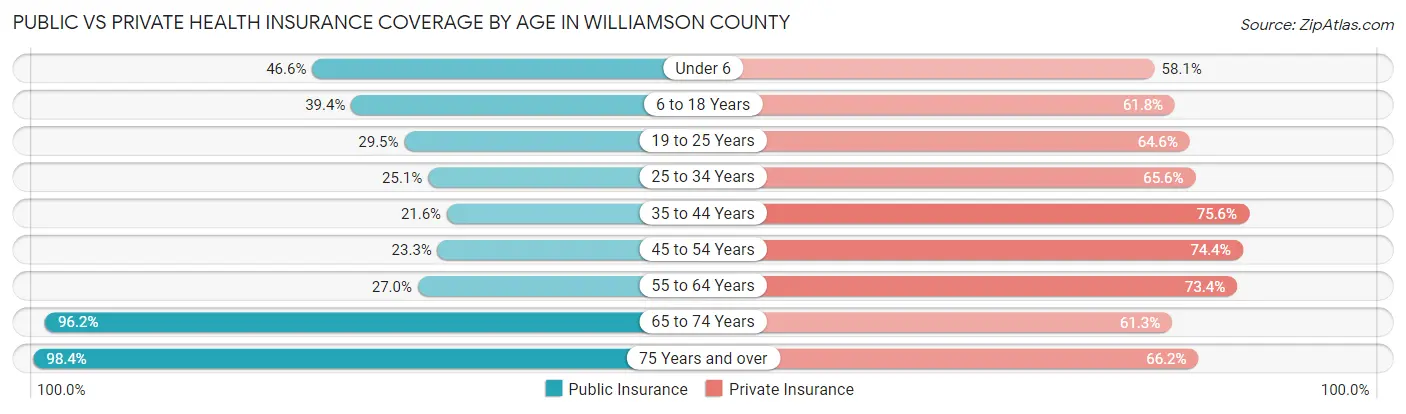
| Age Bracket | Public Insurance | Private Insurance |
| Under 6 | 2,207 (46.6%) | 2,749 (58.1%) |
| 6 to 18 Years | 4,073 (39.4%) | 6,396 (61.8%) |
| 19 to 25 Years | 1,345 (29.5%) | 2,944 (64.6%) |
| 25 to 34 Years | 1,902 (25.1%) | 4,972 (65.6%) |
| 35 to 44 Years | 1,801 (21.6%) | 6,296 (75.5%) |
| 45 to 54 Years | 1,904 (23.3%) | 6,070 (74.4%) |
| 55 to 64 Years | 2,411 (27.0%) | 6,548 (73.4%) |
| 65 to 74 Years | 7,143 (96.2%) | 4,551 (61.3%) |
| 75 Years and over | 4,976 (98.4%) | 3,348 (66.2%) |
| Total | 27,762 (42.6%) | 43,874 (67.4%) |
Disability Status by Sex by Age in Williamson County
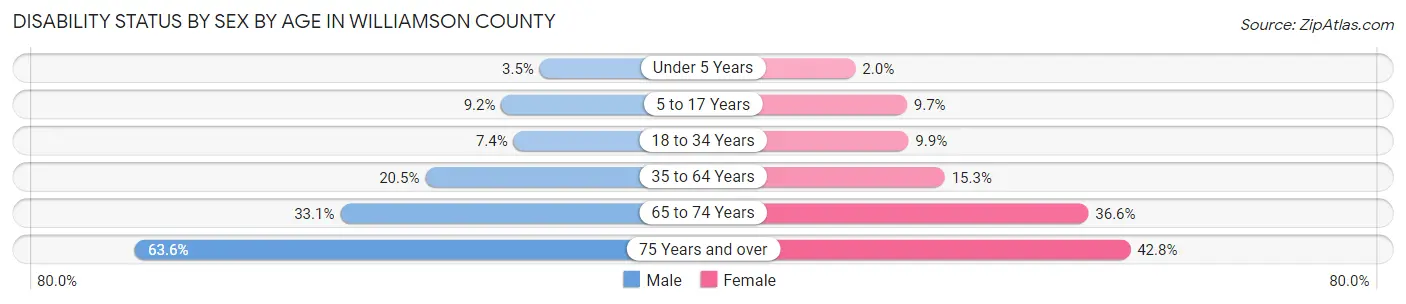
| Age Bracket | Male | Female |
| Under 5 Years | 70 (3.5%) | 36 (2.0%) |
| 5 to 17 Years | 509 (9.2%) | 500 (9.7%) |
| 18 to 34 Years | 475 (7.4%) | 624 (9.9%) |
| 35 to 64 Years | 2,564 (20.5%) | 1,975 (15.3%) |
| 65 to 74 Years | 1,162 (33.1%) | 1,434 (36.6%) |
| 75 Years and over | 1,297 (63.6%) | 1,293 (42.8%) |
Disability Class by Sex by Age in Williamson County
Disability Class: Hearing Difficulty
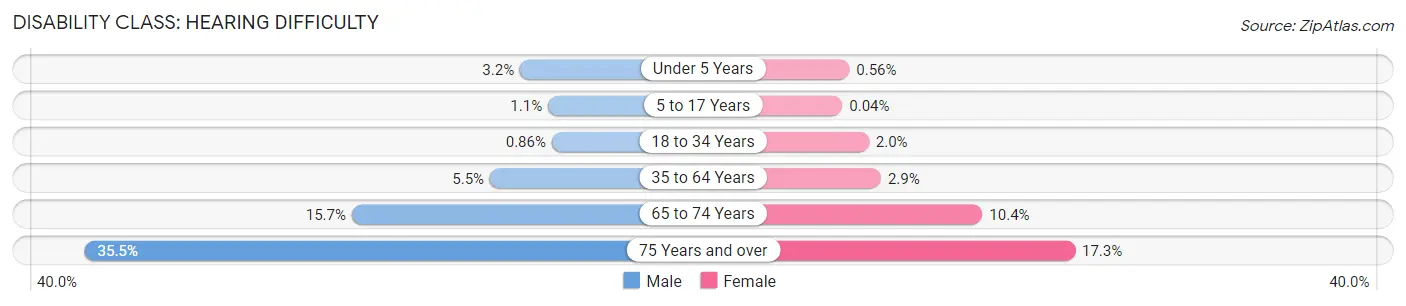
| Age Bracket | Male | Female |
| Under 5 Years | 64 (3.2%) | 10 (0.6%) |
| 5 to 17 Years | 63 (1.1%) | 2 (0.0%) |
| 18 to 34 Years | 55 (0.9%) | 127 (2.0%) |
| 35 to 64 Years | 681 (5.4%) | 376 (2.9%) |
| 65 to 74 Years | 551 (15.7%) | 409 (10.4%) |
| 75 Years and over | 725 (35.5%) | 523 (17.3%) |
Disability Class: Vision Difficulty
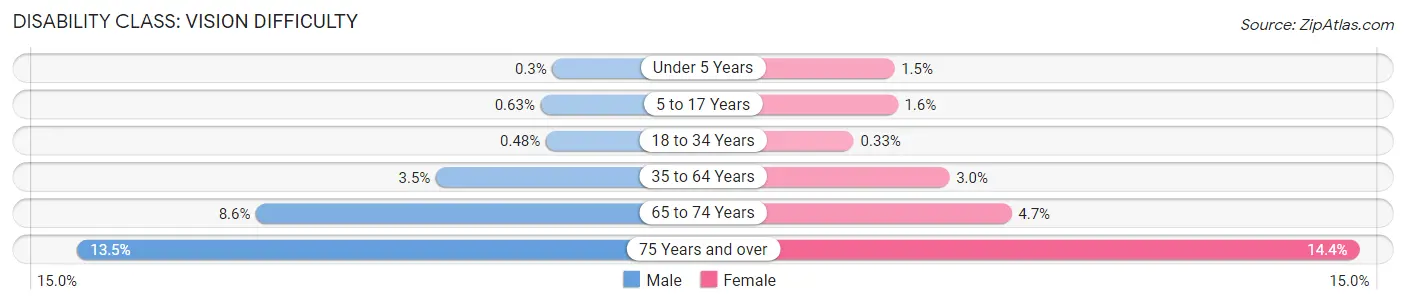
| Age Bracket | Male | Female |
| Under 5 Years | 6 (0.3%) | 26 (1.5%) |
| 5 to 17 Years | 35 (0.6%) | 80 (1.5%) |
| 18 to 34 Years | 31 (0.5%) | 21 (0.3%) |
| 35 to 64 Years | 443 (3.5%) | 386 (3.0%) |
| 65 to 74 Years | 300 (8.6%) | 185 (4.7%) |
| 75 Years and over | 276 (13.5%) | 435 (14.4%) |
Disability Class: Cognitive Difficulty
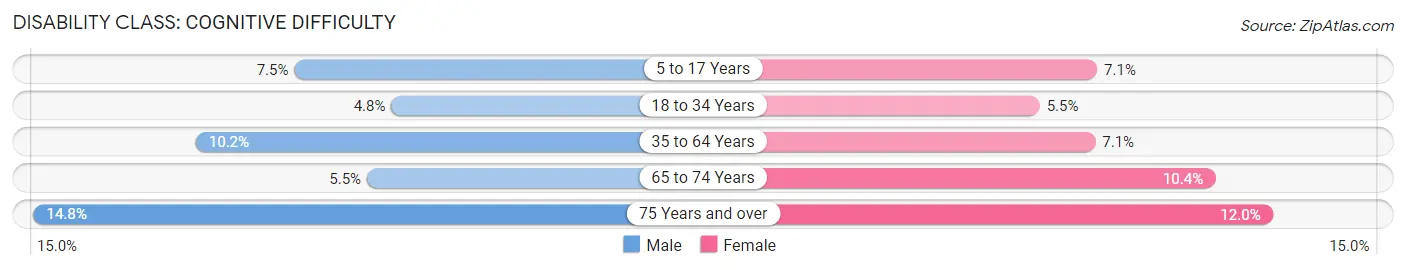
| Age Bracket | Male | Female |
| 5 to 17 Years | 414 (7.5%) | 368 (7.1%) |
| 18 to 34 Years | 308 (4.8%) | 348 (5.5%) |
| 35 to 64 Years | 1,279 (10.2%) | 912 (7.1%) |
| 65 to 74 Years | 192 (5.5%) | 407 (10.4%) |
| 75 Years and over | 301 (14.7%) | 362 (12.0%) |
Disability Class: Ambulatory Difficulty
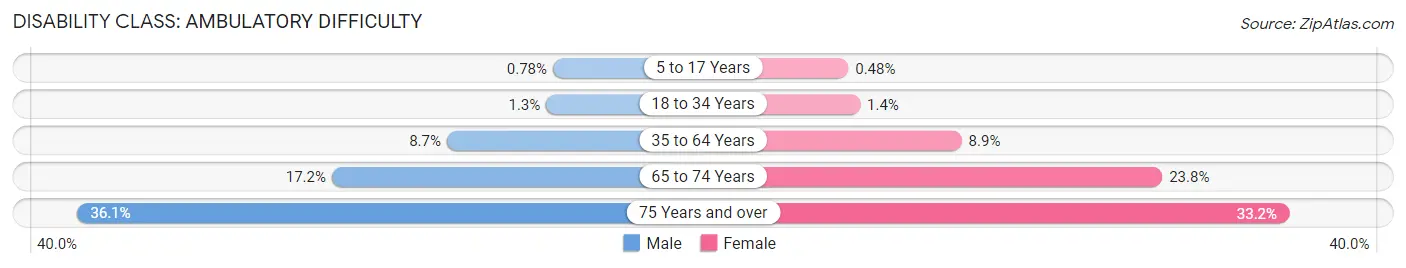
| Age Bracket | Male | Female |
| 5 to 17 Years | 43 (0.8%) | 25 (0.5%) |
| 18 to 34 Years | 82 (1.3%) | 86 (1.4%) |
| 35 to 64 Years | 1,081 (8.6%) | 1,150 (8.9%) |
| 65 to 74 Years | 603 (17.2%) | 932 (23.8%) |
| 75 Years and over | 736 (36.1%) | 1,002 (33.2%) |
Disability Class: Self-Care Difficulty
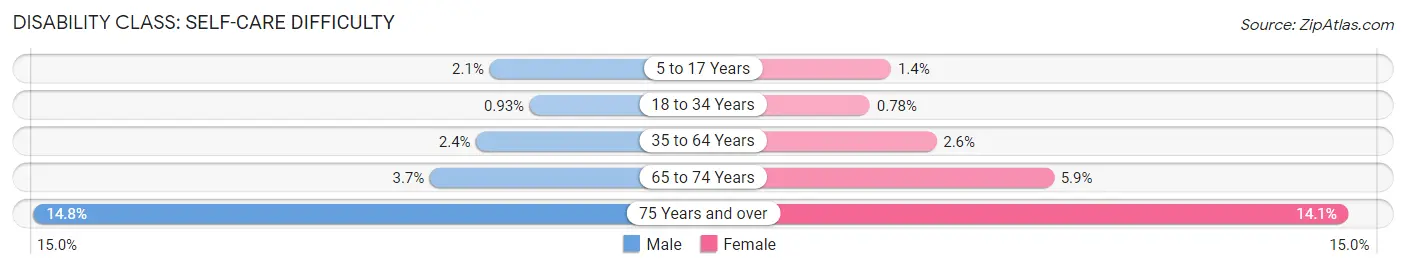
| Age Bracket | Male | Female |
| 5 to 17 Years | 113 (2.1%) | 71 (1.4%) |
| 18 to 34 Years | 60 (0.9%) | 49 (0.8%) |
| 35 to 64 Years | 303 (2.4%) | 340 (2.6%) |
| 65 to 74 Years | 130 (3.7%) | 231 (5.9%) |
| 75 Years and over | 301 (14.7%) | 426 (14.1%) |
Technology Access in Williamson County
Computing Device Access in Williamson County
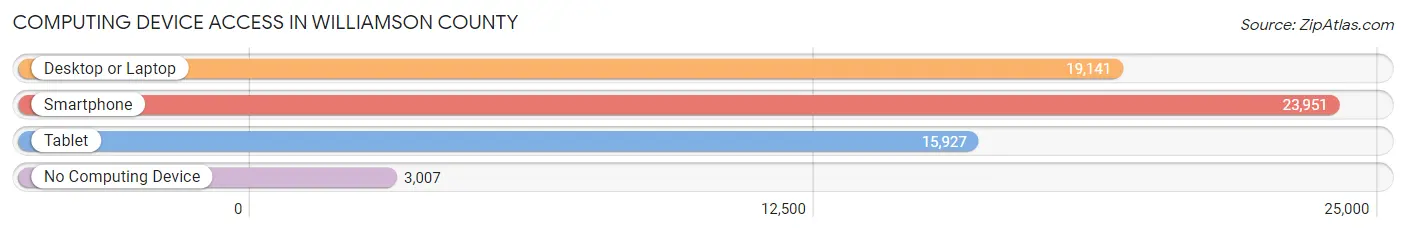
| Device Type | # Households | % Households |
| Desktop or Laptop | 19,141 | 67.1% |
| Smartphone | 23,951 | 84.0% |
| Tablet | 15,927 | 55.8% |
| No Computing Device | 3,007 | 10.5% |
| Total | 28,521 | 100.0% |
Internet Access in Williamson County
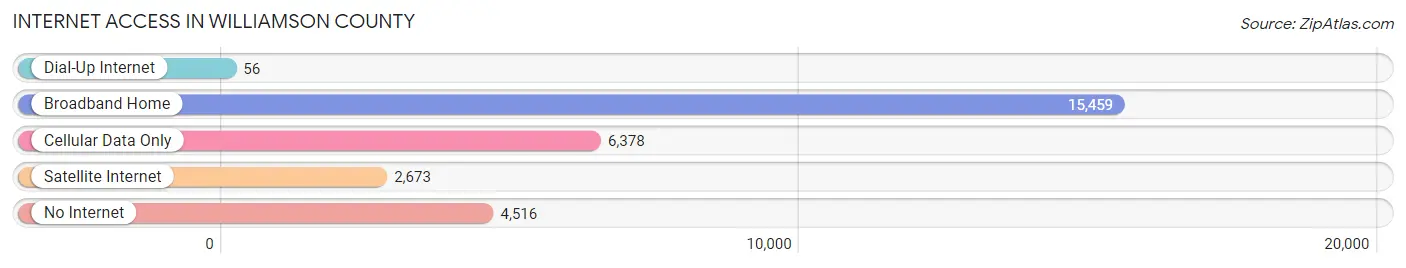
| Internet Type | # Households | % Households |
| Dial-Up Internet | 56 | 0.2% |
| Broadband Home | 15,459 | 54.2% |
| Cellular Data Only | 6,378 | 22.4% |
| Satellite Internet | 2,673 | 9.4% |
| No Internet | 4,516 | 15.8% |
| Total | 28,521 | 100.0% |
Williamson County Summary
Williamson County is located in the southernmost part of Illinois, and is bordered by the states of Missouri and Kentucky. It is part of the Metro East region of the state, and is the largest county in the region. The county seat is Marion, and the county is named after Colonel Robert M. Williamson, a veteran of the War of 1812.
Geography
Williamson County covers an area of 845 square miles, making it the largest county in the Metro East region. The county is located in the southernmost part of the state, and is bordered by the states of Missouri and Kentucky. The terrain is mostly flat, with some rolling hills in the northern part of the county. The county is drained by the Big Muddy River, which flows through the county from north to south. The county is also home to several small lakes, including Lake of Egypt, Crab Orchard Lake, and Rend Lake.
The climate of Williamson County is humid subtropical, with hot, humid summers and mild winters. The average annual temperature is around 60 degrees Fahrenheit, and the average annual precipitation is around 40 inches.
Demographics
As of the 2010 census, Williamson County had a population of 67,357. The population was spread out, with 24.3% under the age of 18, 8.2% from 18 to 24, 28.2% from 25 to 44, 24.3% from 45 to 64, and 14.0% who were 65 years of age or older. The median age was 37.4 years. The gender makeup of the county was 49.3% male and 50.7% female.
The racial makeup of the county was 92.2% White, 4.2% African American, 0.3% Native American, 0.7% Asian, 0.1% Pacific Islander, 1.3% from other races, and 1.2% from two or more races. Hispanic or Latino of any race were 3.2% of the population.
Economy
Williamson County has a diverse economy, with a mix of manufacturing, agriculture, and services. The county is home to several large employers, including the Marion VA Medical Center, the Marion Federal Penitentiary, and the Rend Lake College.
Agriculture is an important part of the county's economy, with corn, soybeans, and wheat being the main crops. Livestock production is also important, with cattle, hogs, and poultry being the main animals raised.
Manufacturing is also an important part of the county's economy, with several large factories located in the county. The largest employers in the county are the Marion VA Medical Center, the Marion Federal Penitentiary, and the Rend Lake College.
History
Williamson County was formed in 1839 from parts of Johnson and Franklin counties. The county was named after Colonel Robert M. Williamson, a veteran of the War of 1812. The county seat was originally located in the town of Marion, which was named after Francis Marion, a Revolutionary War hero.
The county was largely rural until the 1950s, when the coal mining industry began to decline. This led to an economic downturn in the county, and many people moved away in search of work. In the 1960s, the county began to experience a resurgence, as new industries began to move into the area.
Today, Williamson County is a thriving community, with a diverse economy and a strong sense of community. The county is home to several large employers, and is a popular destination for tourists and outdoor enthusiasts.
Common Questions
What is the Total Population of Williamson County?
Total Population of Williamson County is 67,120.
What is the Total Male Population of Williamson County?
Total Male Population of Williamson County is 33,757.
What is the Total Female Population of Williamson County?
Total Female Population of Williamson County is 33,363.
What is the Ratio of Males per 100 Females in Williamson County?
There are 101.18 Males per 100 Females in Williamson County.
What is the Ratio of Females per 100 Males in Williamson County?
There are 98.83 Females per 100 Males in Williamson County.
What is the Median Population Age in Williamson County?
Median Population Age in Williamson County is 41.2 Years.
What is the Average Family Size in Williamson County
Average Family Size in Williamson County is 2.8 People.
What is the Average Household Size in Williamson County
Average Household Size in Williamson County is 2.3 People.
What is Per Capita Income in Williamson County?
Per Capita income in Williamson County is $34,810.
What is the Median Family Income in Williamson County?
Median Family Income in Williamson County is $79,912.
What is the Median Household income in Williamson County?
Median Household Income in Williamson County is $60,325.
What is Income or Wage Gap in Williamson County?
Income or Wage Gap in Williamson County is 23.4%.
Women in Williamson County earn 76.6 cents for every dollar earned by a man.
What is Family Income Deficit in Williamson County?
Family Income Deficit in Williamson County is $11,135.
Families that are below poverty line in Williamson County earn $11,135 less on average than the poverty threshold level.
What is Inequality or Gini Index in Williamson County?
Inequality or Gini Index in Williamson County is 0.45.
How Large is the Labor Force in Williamson County?
There are 31,923 People in the Labor Forcein in Williamson County.
What is the Percentage of People in the Labor Force in Williamson County?
58.7% of People are in the Labor Force in Williamson County.
What is the Unemployment Rate in Williamson County?
Unemployment Rate in Williamson County is 4.4%.