Whiteside County, IL
Whiteside County Map
Whiteside County Overview
55,569
TOTAL POPULATION
27,939
MALE POPULATION
27,630
FEMALE POPULATION
101.12
MALES / 100 FEMALES
98.89
FEMALES / 100 MALES
43.5
MEDIAN AGE
2.9
AVG FAMILY SIZE
2.4
AVG HOUSEHOLD SIZE
$35,366
PER CAPITA INCOME
$80,546
AVG FAMILY INCOME
$62,828
AVG HOUSEHOLD INCOME
36.8%
WAGE / INCOME GAP [ % ]
63.2¢/ $1
WAGE / INCOME GAP [ $ ]
$10,728
FAMILY INCOME DEFICIT
0.44
INEQUALITY / GINI INDEX
27,831
LABOR FORCE [ PEOPLE ]
62.0%
PERCENT IN LABOR FORCE
4.4%
UNEMPLOYMENT RATE
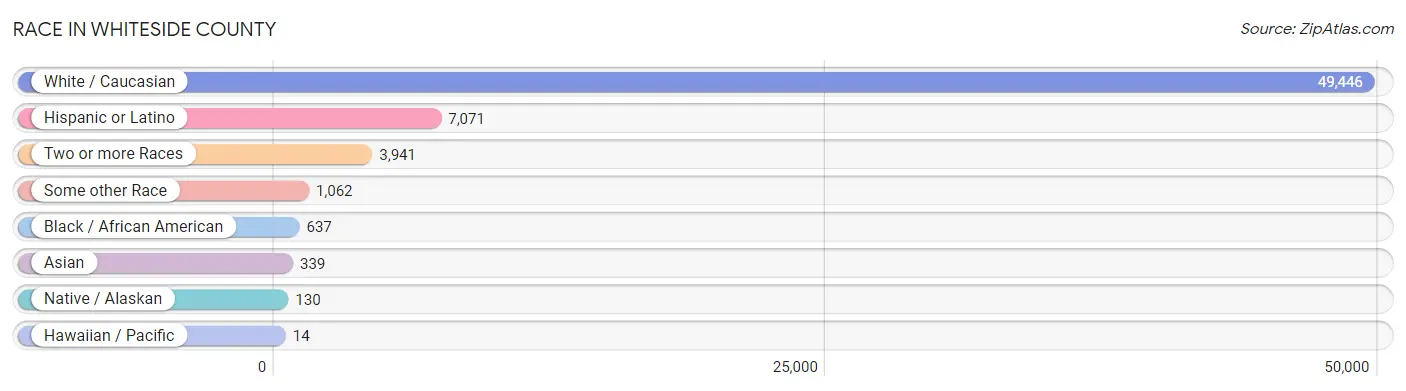
Race in Whiteside County
The most populous races in Whiteside County are White / Caucasian (49,446 | 89.0%), Hispanic or Latino (7,071 | 12.7%), and Two or more Races (3,941 | 7.1%).
| Race | # Population | % Population |
| Asian | 339 | 0.6% |
| Black / African American | 637 | 1.1% |
| Hawaiian / Pacific | 14 | 0.0% |
| Hispanic or Latino | 7,071 | 12.7% |
| Native / Alaskan | 130 | 0.2% |
| White / Caucasian | 49,446 | 89.0% |
| Two or more Races | 3,941 | 7.1% |
| Some other Race | 1,062 | 1.9% |
| Total | 55,569 | 100.0% |
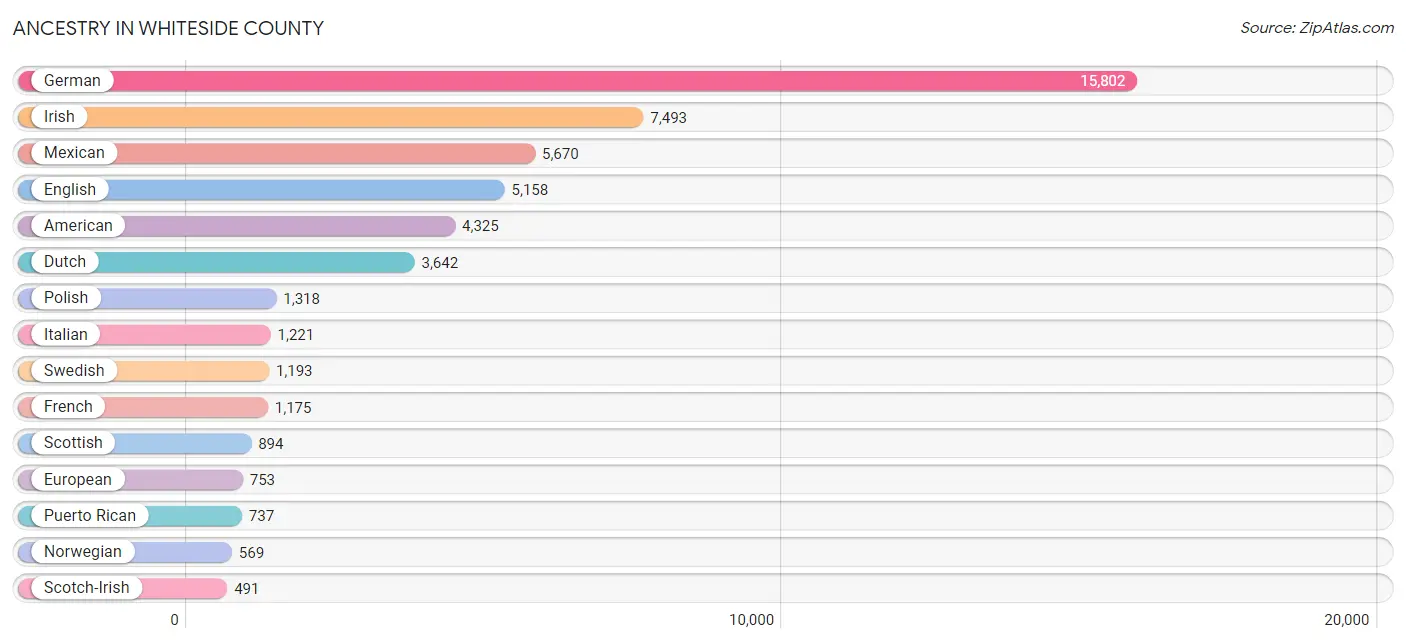
Ancestry in Whiteside County
The most populous ancestries reported in Whiteside County are German (15,802 | 28.4%), Irish (7,493 | 13.5%), Mexican (5,670 | 10.2%), English (5,158 | 9.3%), and American (4,325 | 7.8%), together accounting for 69.2% of all Whiteside County residents.
| Ancestry | # Population | % Population |
| African | 91 | 0.2% |
| American | 4,325 | 7.8% |
| Arab | 108 | 0.2% |
| Argentinean | 24 | 0.0% |
| Armenian | 11 | 0.0% |
| Australian | 10 | 0.0% |
| Austrian | 42 | 0.1% |
| Belgian | 480 | 0.9% |
| Belizean | 13 | 0.0% |
| Bhutanese | 41 | 0.1% |
| Blackfeet | 51 | 0.1% |
| British | 316 | 0.6% |
| British West Indian | 10 | 0.0% |
| Bulgarian | 20 | 0.0% |
| Burmese | 46 | 0.1% |
| Canadian | 44 | 0.1% |
| Central American | 79 | 0.1% |
| Central American Indian | 57 | 0.1% |
| Cherokee | 69 | 0.1% |
| Chickasaw | 17 | 0.0% |
| Chippewa | 21 | 0.0% |
| Colombian | 2 | 0.0% |
| Croatian | 11 | 0.0% |
| Cuban | 47 | 0.1% |
| Czech | 194 | 0.4% |
| Czechoslovakian | 41 | 0.1% |
| Danish | 367 | 0.7% |
| Dutch | 3,642 | 6.6% |
| Eastern European | 132 | 0.2% |
| English | 5,158 | 9.3% |
| European | 753 | 1.4% |
| French | 1,175 | 2.1% |
| French Canadian | 65 | 0.1% |
| German | 15,802 | 28.4% |
| Greek | 121 | 0.2% |
| Guatemalan | 79 | 0.1% |
| Hungarian | 114 | 0.2% |
| Indian (Asian) | 101 | 0.2% |
| Iranian | 41 | 0.1% |
| Irish | 7,493 | 13.5% |
| Israeli | 9 | 0.0% |
| Italian | 1,221 | 2.2% |
| Jordanian | 34 | 0.1% |
| Kiowa | 3 | 0.0% |
| Korean | 190 | 0.3% |
| Laotian | 6 | 0.0% |
| Lebanese | 9 | 0.0% |
| Lithuanian | 135 | 0.2% |
| Malaysian | 27 | 0.1% |
| Mexican | 5,670 | 10.2% |
| Mexican American Indian | 117 | 0.2% |
| Native Hawaiian | 20 | 0.0% |
| Navajo | 6 | 0.0% |
| Nigerian | 139 | 0.3% |
| Northern European | 41 | 0.1% |
| Norwegian | 569 | 1.0% |
| Ottawa | 13 | 0.0% |
| Pakistani | 6 | 0.0% |
| Palestinian | 12 | 0.0% |
| Pennsylvania German | 106 | 0.2% |
| Peruvian | 6 | 0.0% |
| Polish | 1,318 | 2.4% |
| Portuguese | 56 | 0.1% |
| Puerto Rican | 737 | 1.3% |
| Romanian | 56 | 0.1% |
| Russian | 162 | 0.3% |
| Scandinavian | 150 | 0.3% |
| Scotch-Irish | 491 | 0.9% |
| Scottish | 894 | 1.6% |
| Serbian | 55 | 0.1% |
| Sioux | 3 | 0.0% |
| Slovak | 48 | 0.1% |
| Slovene | 36 | 0.1% |
| South American | 32 | 0.1% |
| Spaniard | 162 | 0.3% |
| Spanish | 28 | 0.1% |
| Sri Lankan | 36 | 0.1% |
| Subsaharan African | 247 | 0.4% |
| Swedish | 1,193 | 2.1% |
| Swiss | 183 | 0.3% |
| Thai | 137 | 0.3% |
| Ukrainian | 32 | 0.1% |
| Welsh | 137 | 0.3% |
| Yugoslavian | 18 | 0.0% | View All 84 Rows |
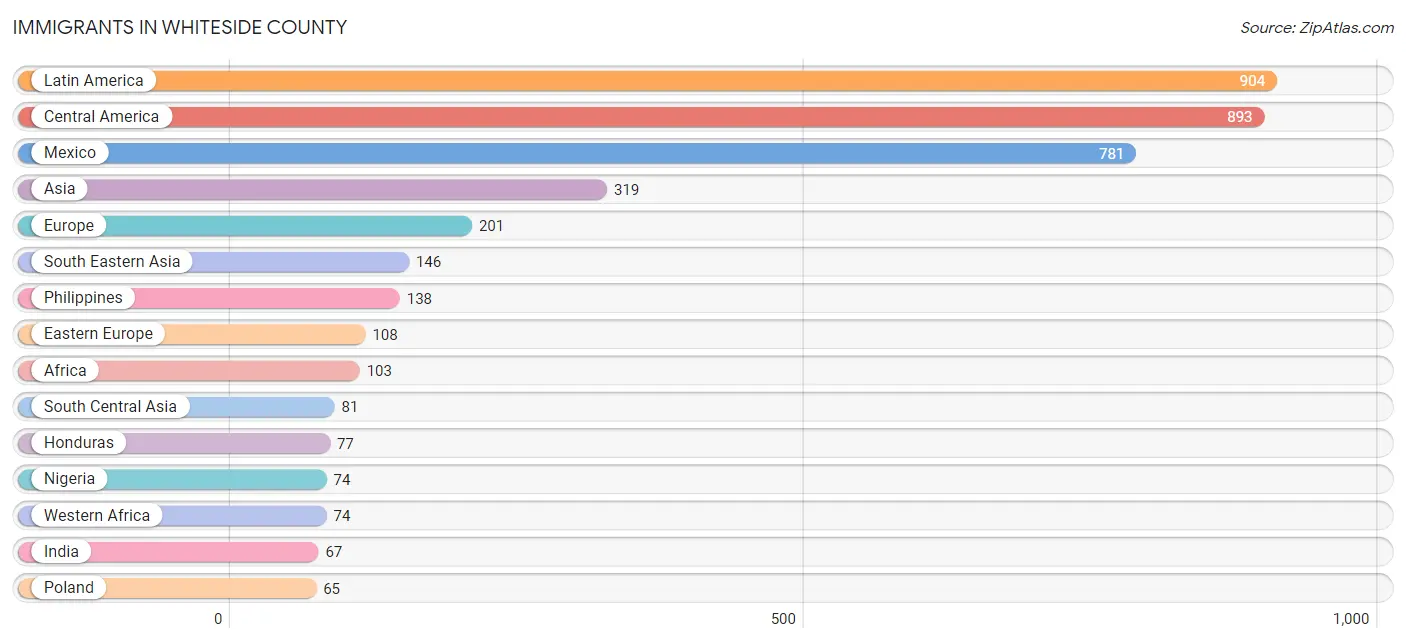
Immigrants in Whiteside County
The most numerous immigrant groups reported in Whiteside County came from Latin America (904 | 1.6%), Central America (893 | 1.6%), Mexico (781 | 1.4%), Asia (319 | 0.6%), and Europe (201 | 0.4%), together accounting for 5.6% of all Whiteside County residents.
| Immigration Origin | # Population | % Population |
| Africa | 103 | 0.2% |
| Argentina | 8 | 0.0% |
| Asia | 319 | 0.6% |
| Austria | 1 | 0.0% |
| Bulgaria | 11 | 0.0% |
| Canada | 27 | 0.1% |
| Central America | 893 | 1.6% |
| China | 27 | 0.1% |
| Congo | 13 | 0.0% |
| Eastern Asia | 32 | 0.1% |
| Eastern Europe | 108 | 0.2% |
| Egypt | 8 | 0.0% |
| England | 7 | 0.0% |
| Europe | 201 | 0.4% |
| Fiji | 14 | 0.0% |
| Germany | 30 | 0.1% |
| Guatemala | 35 | 0.1% |
| Honduras | 77 | 0.1% |
| Hungary | 9 | 0.0% |
| India | 67 | 0.1% |
| Iran | 14 | 0.0% |
| Israel | 36 | 0.1% |
| Italy | 27 | 0.1% |
| Jordan | 18 | 0.0% |
| Korea | 5 | 0.0% |
| Kuwait | 6 | 0.0% |
| Laos | 3 | 0.0% |
| Latin America | 904 | 1.6% |
| Mexico | 781 | 1.4% |
| Middle Africa | 13 | 0.0% |
| Nigeria | 74 | 0.1% |
| Northern Africa | 16 | 0.0% |
| Northern Europe | 35 | 0.1% |
| Oceania | 14 | 0.0% |
| Peru | 3 | 0.0% |
| Philippines | 138 | 0.3% |
| Poland | 65 | 0.1% |
| Russia | 23 | 0.0% |
| Scotland | 28 | 0.1% |
| South America | 11 | 0.0% |
| South Central Asia | 81 | 0.2% |
| South Eastern Asia | 146 | 0.3% |
| Southern Europe | 27 | 0.1% |
| Thailand | 1 | 0.0% |
| Western Africa | 74 | 0.1% |
| Western Asia | 60 | 0.1% |
| Western Europe | 31 | 0.1% | View All 47 Rows |
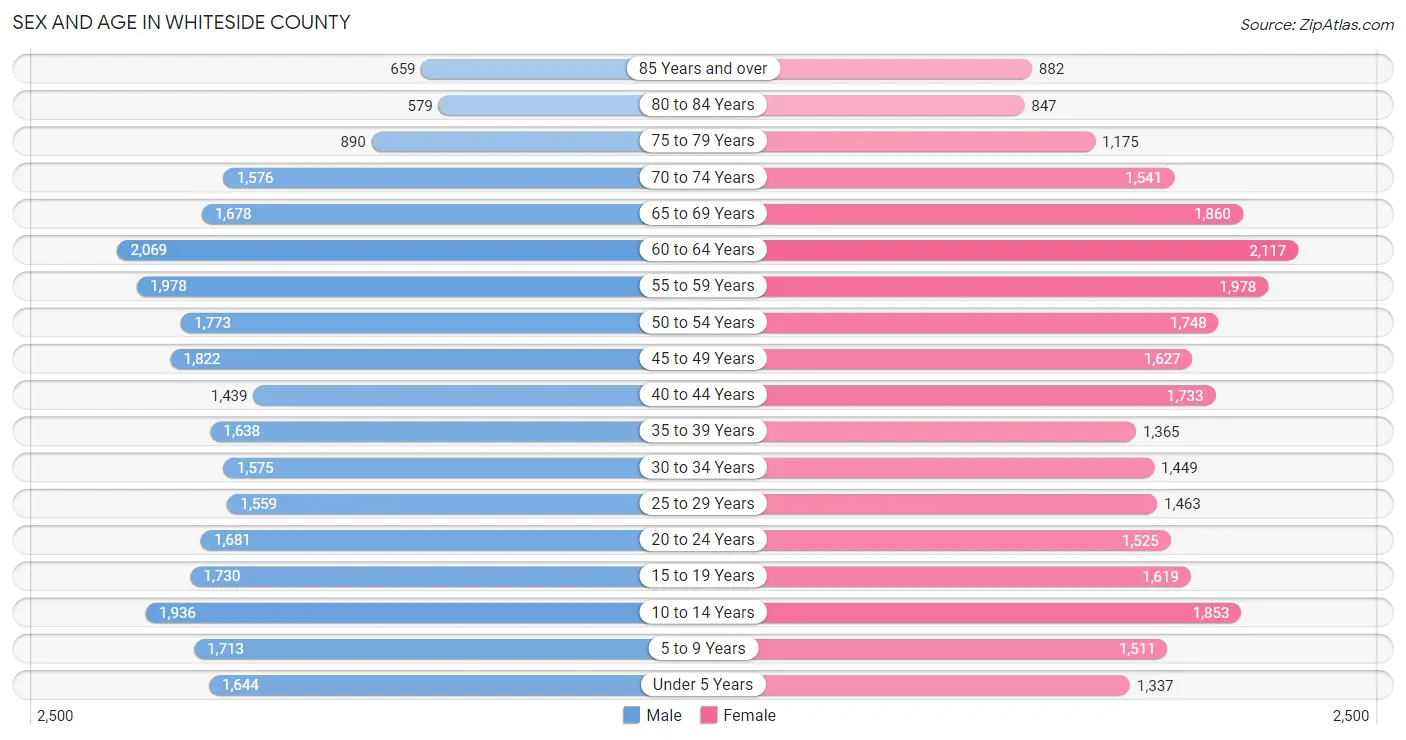
Sex and Age in Whiteside County
Sex and Age in Whiteside County
The most populous age groups in Whiteside County are 60 to 64 Years (2,069 | 7.4%) for men and 60 to 64 Years (2,117 | 7.7%) for women.
| Age Bracket | Male | Female |
| Under 5 Years | 1,644 (5.9%) | 1,337 (4.8%) |
| 5 to 9 Years | 1,713 (6.1%) | 1,511 (5.5%) |
| 10 to 14 Years | 1,936 (6.9%) | 1,853 (6.7%) |
| 15 to 19 Years | 1,730 (6.2%) | 1,619 (5.9%) |
| 20 to 24 Years | 1,681 (6.0%) | 1,525 (5.5%) |
| 25 to 29 Years | 1,559 (5.6%) | 1,463 (5.3%) |
| 30 to 34 Years | 1,575 (5.6%) | 1,449 (5.2%) |
| 35 to 39 Years | 1,638 (5.9%) | 1,365 (4.9%) |
| 40 to 44 Years | 1,439 (5.1%) | 1,733 (6.3%) |
| 45 to 49 Years | 1,822 (6.5%) | 1,627 (5.9%) |
| 50 to 54 Years | 1,773 (6.4%) | 1,748 (6.3%) |
| 55 to 59 Years | 1,978 (7.1%) | 1,978 (7.2%) |
| 60 to 64 Years | 2,069 (7.4%) | 2,117 (7.7%) |
| 65 to 69 Years | 1,678 (6.0%) | 1,860 (6.7%) |
| 70 to 74 Years | 1,576 (5.6%) | 1,541 (5.6%) |
| 75 to 79 Years | 890 (3.2%) | 1,175 (4.3%) |
| 80 to 84 Years | 579 (2.1%) | 847 (3.1%) |
| 85 Years and over | 659 (2.4%) | 882 (3.2%) |
| Total | 27,939 (100.0%) | 27,630 (100.0%) |
Families and Households in Whiteside County
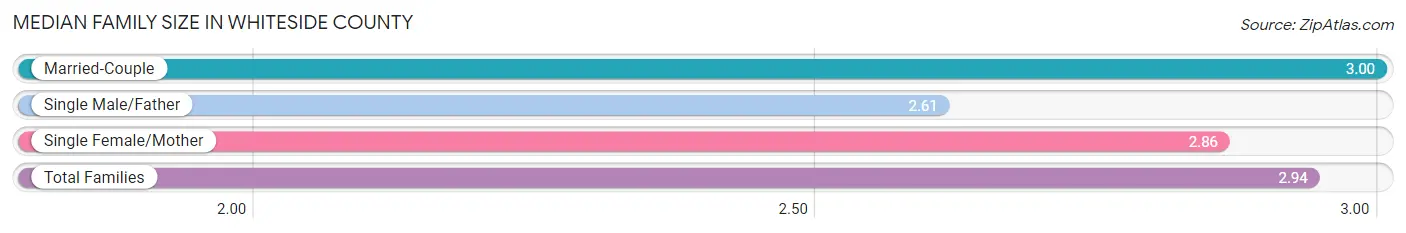
Median Family Size in Whiteside County
The median family size in Whiteside County is 2.94 persons per family, with married-couple families (10,344 | 71.7%) accounting for the largest median family size of 3 persons per family. On the other hand, single male/father families (1,170 | 8.1%) represent the smallest median family size with 2.61 persons per family.
| Family Type | # Families | Family Size |
| Married-Couple | 10,344 (71.7%) | 3.00 |
| Single Male/Father | 1,170 (8.1%) | 2.61 |
| Single Female/Mother | 2,908 (20.2%) | 2.86 |
| Total Families | 14,422 (100.0%) | 2.94 |
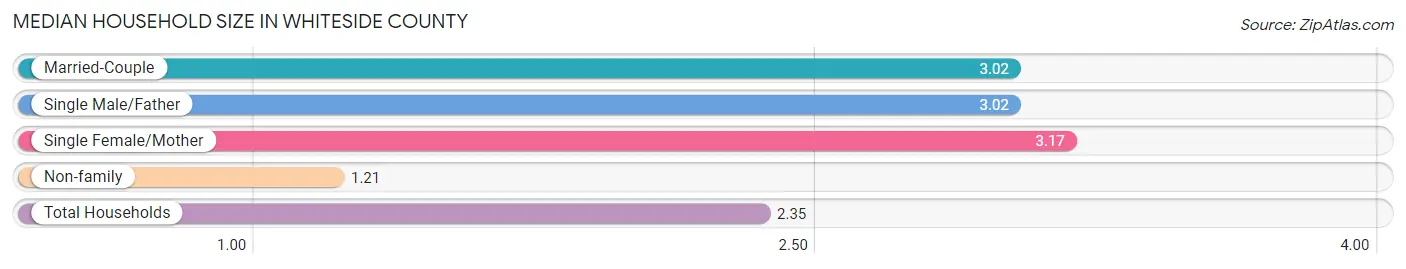
Median Household Size in Whiteside County
The median household size in Whiteside County is 2.35 persons per household, with single female/mother households (2,908 | 12.6%) accounting for the largest median household size of 3.17 persons per household. non-family households (8,742 | 37.7%) represent the smallest median household size with 1.21 persons per household.
| Household Type | # Households | Household Size |
| Married-Couple | 10,344 (44.7%) | 3.02 |
| Single Male/Father | 1,170 (5.1%) | 3.02 |
| Single Female/Mother | 2,908 (12.6%) | 3.17 |
| Non-family | 8,742 (37.7%) | 1.21 |
| Total Households | 23,164 (100.0%) | 2.35 |
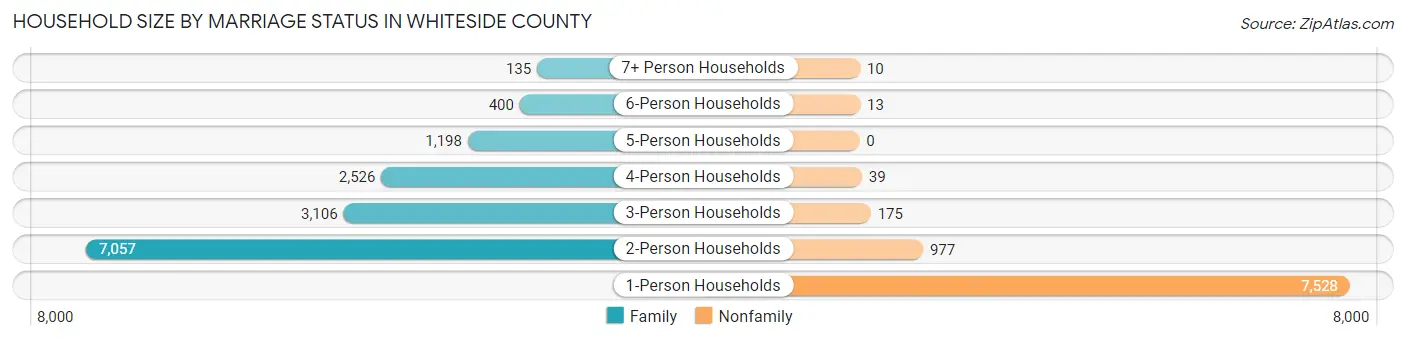
Household Size by Marriage Status in Whiteside County
Out of a total of 23,164 households in Whiteside County, 14,422 (62.3%) are family households, while 8,742 (37.7%) are nonfamily households. The most numerous type of family households are 2-person households, comprising 7,057, and the most common type of nonfamily households are 1-person households, comprising 7,528.
| Household Size | Family Households | Nonfamily Households |
| 1-Person Households | - | 7,528 (32.5%) |
| 2-Person Households | 7,057 (30.5%) | 977 (4.2%) |
| 3-Person Households | 3,106 (13.4%) | 175 (0.8%) |
| 4-Person Households | 2,526 (10.9%) | 39 (0.2%) |
| 5-Person Households | 1,198 (5.2%) | 0 (0.0%) |
| 6-Person Households | 400 (1.7%) | 13 (0.1%) |
| 7+ Person Households | 135 (0.6%) | 10 (0.0%) |
| Total | 14,422 (62.3%) | 8,742 (37.7%) |
Female Fertility in Whiteside County
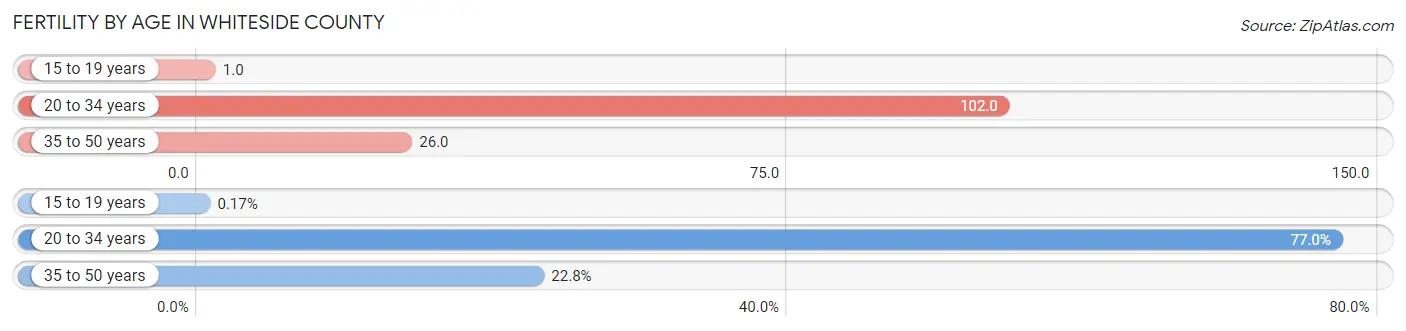
Fertility by Age in Whiteside County
Average fertility rate in Whiteside County is 53.0 births per 1,000 women. Women in the age bracket of 20 to 34 years have the highest fertility rate with 102.0 births per 1,000 women. Women in the age bracket of 20 to 34 years acount for 77.0% of all women with births.
| Age Bracket | Women with Births | Births / 1,000 Women |
| 15 to 19 years | 1 (0.2%) | 1.0 |
| 20 to 34 years | 452 (77.0%) | 102.0 |
| 35 to 50 years | 134 (22.8%) | 26.0 |
| Total | 587 (100.0%) | 53.0 |
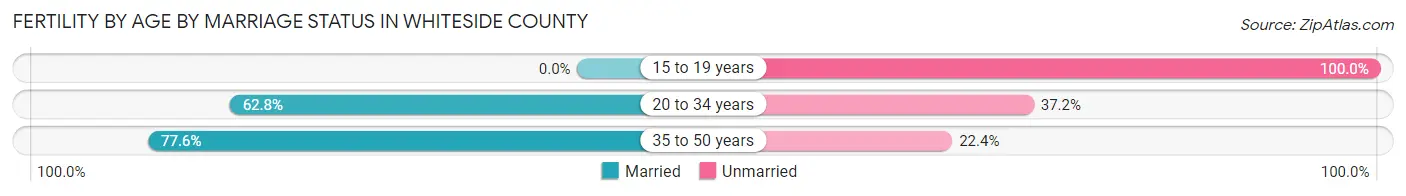
Fertility by Age by Marriage Status in Whiteside County
66.1% of women with births (587) in Whiteside County are married. The highest percentage of unmarried women with births falls into 15 to 19 years age bracket with 100.0% of them unmarried at the time of birth, while the lowest percentage of unmarried women with births belong to 35 to 50 years age bracket with 22.4% of them unmarried.
| Age Bracket | Married | Unmarried |
| 15 to 19 years | 0 (0.0%) | 1 (100.0%) |
| 20 to 34 years | 284 (62.8%) | 168 (37.2%) |
| 35 to 50 years | 104 (77.6%) | 30 (22.4%) |
| Total | 388 (66.1%) | 199 (33.9%) |
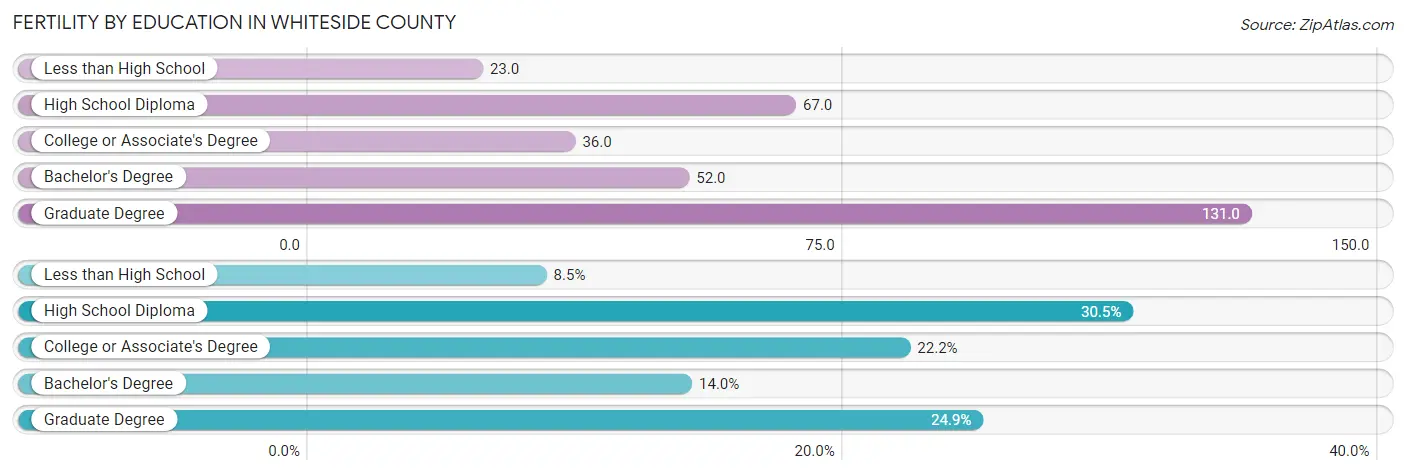
Fertility by Education in Whiteside County
Average fertility rate in Whiteside County is 53.0 births per 1,000 women. Women with the education attainment of graduate degree have the highest fertility rate of 131.0 births per 1,000 women, while women with the education attainment of less than high school have the lowest fertility at 23.0 births per 1,000 women. Women with the education attainment of high school diploma represent 30.5% of all women with births.
| Educational Attainment | Women with Births | Births / 1,000 Women |
| Less than High School | 50 (8.5%) | 23.0 |
| High School Diploma | 179 (30.5%) | 67.0 |
| College or Associate's Degree | 130 (22.2%) | 36.0 |
| Bachelor's Degree | 82 (14.0%) | 52.0 |
| Graduate Degree | 146 (24.9%) | 131.0 |
| Total | 587 (100.0%) | 53.0 |
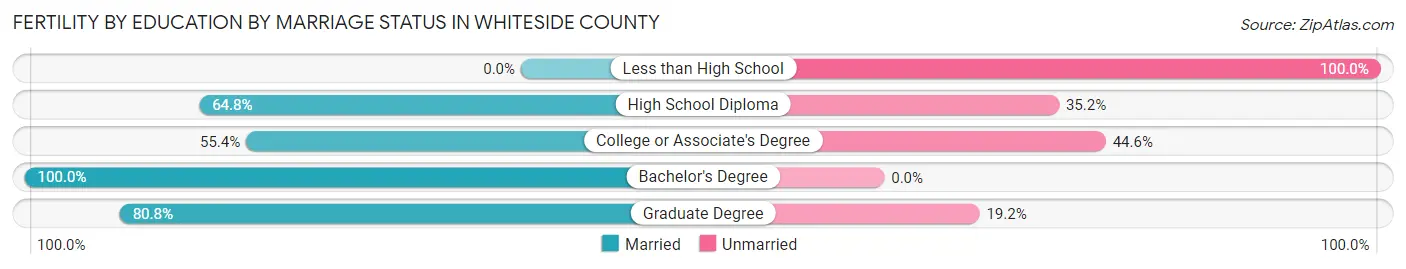
Fertility by Education by Marriage Status in Whiteside County
33.9% of women with births in Whiteside County are unmarried. Women with the educational attainment of bachelor's degree are most likely to be married with 100.0% of them married at childbirth, while women with the educational attainment of less than high school are least likely to be married with 100.0% of them unmarried at childbirth.
| Educational Attainment | Married | Unmarried |
| Less than High School | 0 (0.0%) | 50 (100.0%) |
| High School Diploma | 116 (64.8%) | 63 (35.2%) |
| College or Associate's Degree | 72 (55.4%) | 58 (44.6%) |
| Bachelor's Degree | 82 (100.0%) | 0 (0.0%) |
| Graduate Degree | 118 (80.8%) | 28 (19.2%) |
| Total | 388 (66.1%) | 199 (33.9%) |
Income in Whiteside County
Income Overview in Whiteside County
Per Capita Income in Whiteside County is $35,366, while median incomes of families and households are $80,546 and $62,828 respectively.
| Characteristic | Number | Measure |
| Per Capita Income | 55,569 | $35,366 |
| Median Family Income | 14,422 | $80,546 |
| Mean Family Income | 14,422 | $98,814 |
| Median Household Income | 23,164 | $62,828 |
| Mean Household Income | 23,164 | $82,270 |
| Income Deficit | 14,422 | $10,728 |
| Wage / Income Gap (%) | 55,569 | 36.77% |
| Wage / Income Gap ($) | 55,569 | 63.23¢ per $1 |
| Gini / Inequality Index | 55,569 | 0.44 |
Earnings by Sex in Whiteside County
Average Earnings in Whiteside County are $39,454, $46,862 for men and $29,630 for women, a difference of 36.8%.
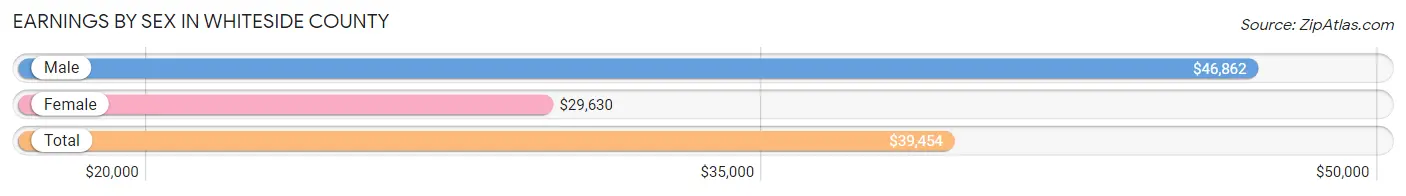
| Sex | Number | Average Earnings |
| Male | 15,441 (53.5%) | $46,862 |
| Female | 13,413 (46.5%) | $29,630 |
| Total | 28,854 (100.0%) | $39,454 |
Earnings by Sex by Income Bracket in Whiteside County
The most common earnings brackets in Whiteside County are $75,000 to $99,999 for men (2,088 | 13.5%) and $2,499 or less for women (906 | 6.8%).
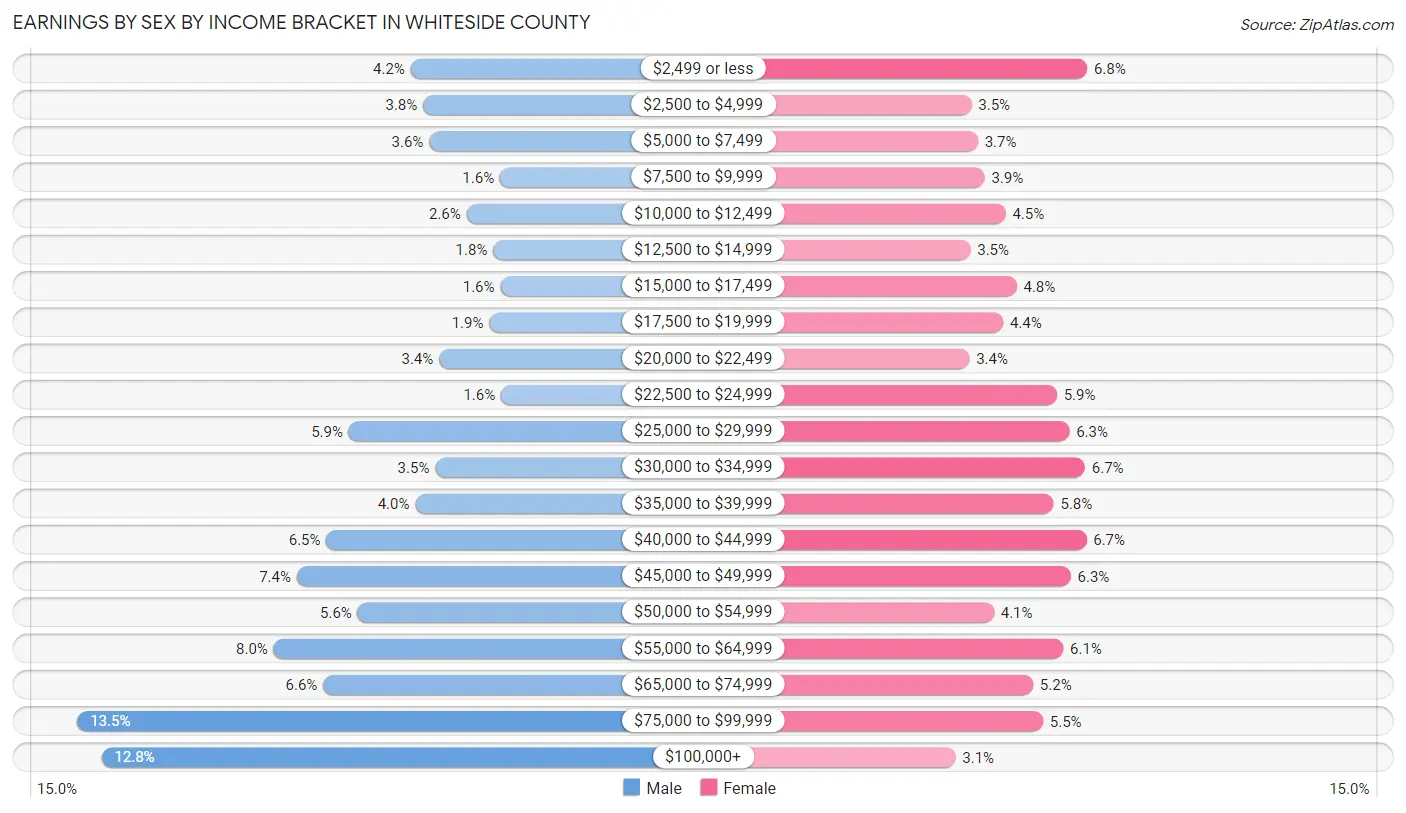
| Income | Male | Female |
| $2,499 or less | 641 (4.2%) | 906 (6.8%) |
| $2,500 to $4,999 | 586 (3.8%) | 470 (3.5%) |
| $5,000 to $7,499 | 561 (3.6%) | 493 (3.7%) |
| $7,500 to $9,999 | 254 (1.6%) | 519 (3.9%) |
| $10,000 to $12,499 | 398 (2.6%) | 598 (4.5%) |
| $12,500 to $14,999 | 282 (1.8%) | 466 (3.5%) |
| $15,000 to $17,499 | 252 (1.6%) | 640 (4.8%) |
| $17,500 to $19,999 | 299 (1.9%) | 589 (4.4%) |
| $20,000 to $22,499 | 518 (3.4%) | 461 (3.4%) |
| $22,500 to $24,999 | 248 (1.6%) | 791 (5.9%) |
| $25,000 to $29,999 | 909 (5.9%) | 838 (6.2%) |
| $30,000 to $34,999 | 534 (3.5%) | 897 (6.7%) |
| $35,000 to $39,999 | 621 (4.0%) | 779 (5.8%) |
| $40,000 to $44,999 | 1,006 (6.5%) | 903 (6.7%) |
| $45,000 to $49,999 | 1,135 (7.3%) | 844 (6.3%) |
| $50,000 to $54,999 | 871 (5.6%) | 554 (4.1%) |
| $55,000 to $64,999 | 1,235 (8.0%) | 816 (6.1%) |
| $65,000 to $74,999 | 1,020 (6.6%) | 701 (5.2%) |
| $75,000 to $99,999 | 2,088 (13.5%) | 739 (5.5%) |
| $100,000+ | 1,983 (12.8%) | 409 (3.0%) |
| Total | 15,441 (100.0%) | 13,413 (100.0%) |
Earnings by Sex by Educational Attainment in Whiteside County
Average earnings in Whiteside County are $53,058 for men and $34,266 for women, a difference of 35.4%. Men with an educational attainment of graduate degree enjoy the highest average annual earnings of $74,063, while those with less than high school education earn the least with $45,391. Women with an educational attainment of graduate degree earn the most with the average annual earnings of $57,578, while those with less than high school education have the smallest earnings of $18,304.
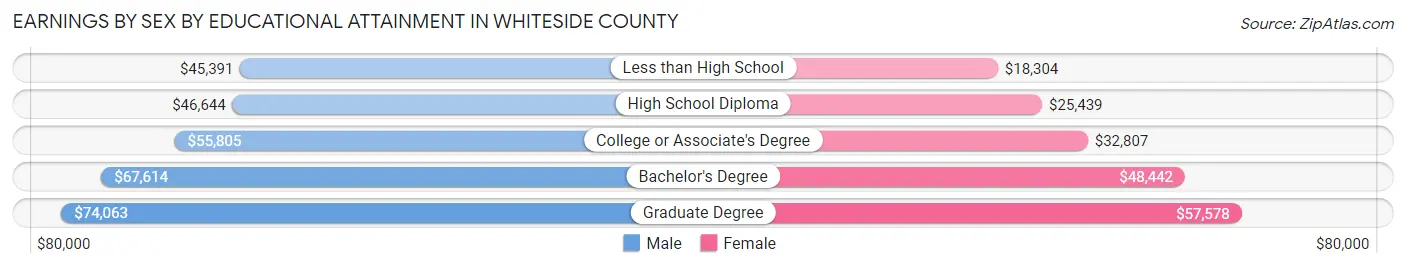
| Educational Attainment | Male Income | Female Income |
| Less than High School | $45,391 | $18,304 |
| High School Diploma | $46,644 | $25,439 |
| College or Associate's Degree | $55,805 | $32,807 |
| Bachelor's Degree | $67,614 | $48,442 |
| Graduate Degree | $74,063 | $57,578 |
| Total | $53,058 | $34,266 |
Family Income in Whiteside County
Family Income Brackets in Whiteside County
According to the Whiteside County family income data, there are 3,490 families falling into the $100,000 to $149,999 income range, which is the most common income bracket and makes up 24.2% of all families. Conversely, the less than $10,000 income bracket is the least frequent group with only 260 families (1.8%) belonging to this category.
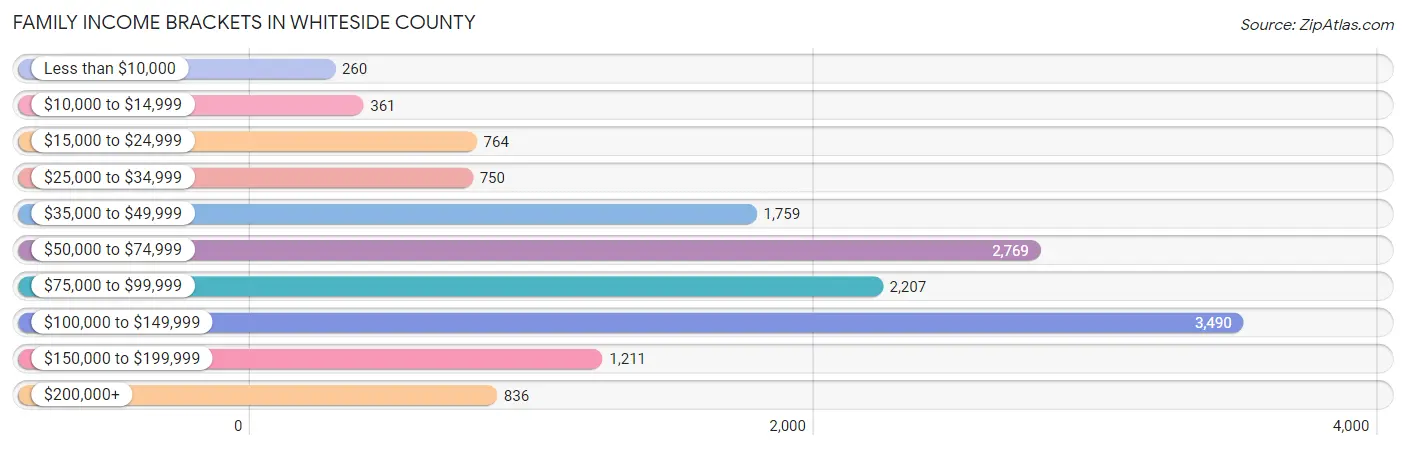
| Income Bracket | # Families | % Families |
| Less than $10,000 | 260 | 1.8% |
| $10,000 to $14,999 | 361 | 2.5% |
| $15,000 to $24,999 | 764 | 5.3% |
| $25,000 to $34,999 | 750 | 5.2% |
| $35,000 to $49,999 | 1,759 | 12.2% |
| $50,000 to $74,999 | 2,769 | 19.2% |
| $75,000 to $99,999 | 2,207 | 15.3% |
| $100,000 to $149,999 | 3,490 | 24.2% |
| $150,000 to $199,999 | 1,211 | 8.4% |
| $200,000+ | 836 | 5.8% |
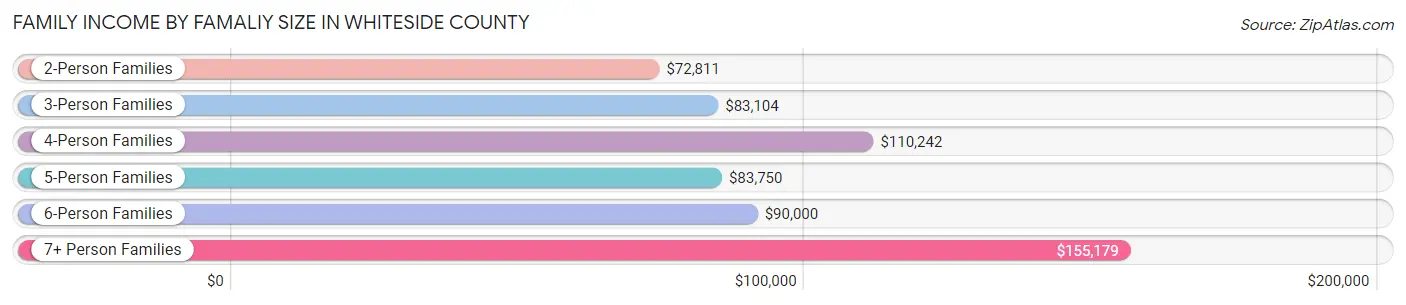
Family Income by Famaliy Size in Whiteside County
7+ person families (132 | 0.9%) account for the highest median family income in Whiteside County with $155,179 per family, while 2-person families (7,711 | 53.5%) have the highest median income of $36,406 per family member.
| Income Bracket | # Families | Median Income |
| 2-Person Families | 7,711 (53.5%) | $72,811 |
| 3-Person Families | 3,039 (21.1%) | $83,104 |
| 4-Person Families | 2,170 (15.0%) | $110,242 |
| 5-Person Families | 1,036 (7.2%) | $83,750 |
| 6-Person Families | 334 (2.3%) | $90,000 |
| 7+ Person Families | 132 (0.9%) | $155,179 |
| Total | 14,422 (100.0%) | $80,546 |
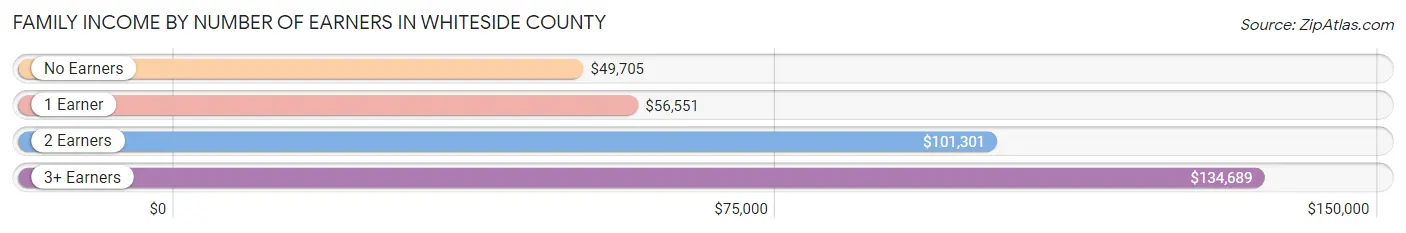
Family Income by Number of Earners in Whiteside County
The median family income in Whiteside County is $80,546, with families comprising 3+ earners (1,735) having the highest median family income of $134,689, while families with no earners (2,791) have the lowest median family income of $49,705, accounting for 12.0% and 19.4% of families, respectively.
| Number of Earners | # Families | Median Income |
| No Earners | 2,791 (19.4%) | $49,705 |
| 1 Earner | 4,646 (32.2%) | $56,551 |
| 2 Earners | 5,250 (36.4%) | $101,301 |
| 3+ Earners | 1,735 (12.0%) | $134,689 |
| Total | 14,422 (100.0%) | $80,546 |
Household Income in Whiteside County
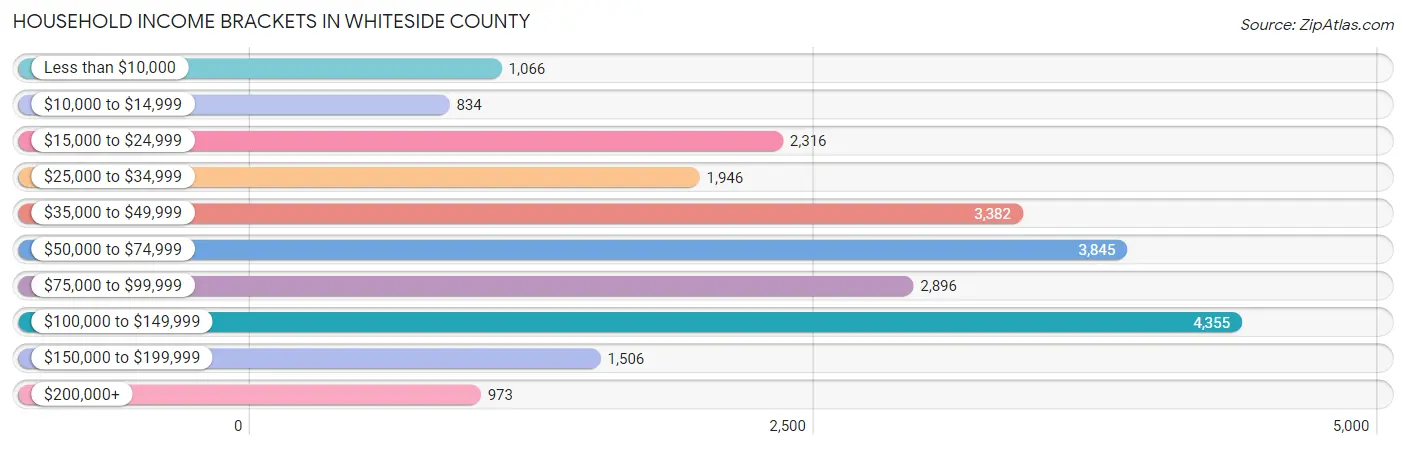
Household Income Brackets in Whiteside County
With 4,355 households falling in the category, the $100,000 to $149,999 income range is the most frequent in Whiteside County, accounting for 18.8% of all households. In contrast, only 834 households (3.6%) fall into the $10,000 to $14,999 income bracket, making it the least populous group.
| Income Bracket | # Households | % Households |
| Less than $10,000 | 1,066 | 4.6% |
| $10,000 to $14,999 | 834 | 3.6% |
| $15,000 to $24,999 | 2,316 | 10.0% |
| $25,000 to $34,999 | 1,946 | 8.4% |
| $35,000 to $49,999 | 3,382 | 14.6% |
| $50,000 to $74,999 | 3,845 | 16.6% |
| $75,000 to $99,999 | 2,896 | 12.5% |
| $100,000 to $149,999 | 4,355 | 18.8% |
| $150,000 to $199,999 | 1,506 | 6.5% |
| $200,000+ | 973 | 4.2% |
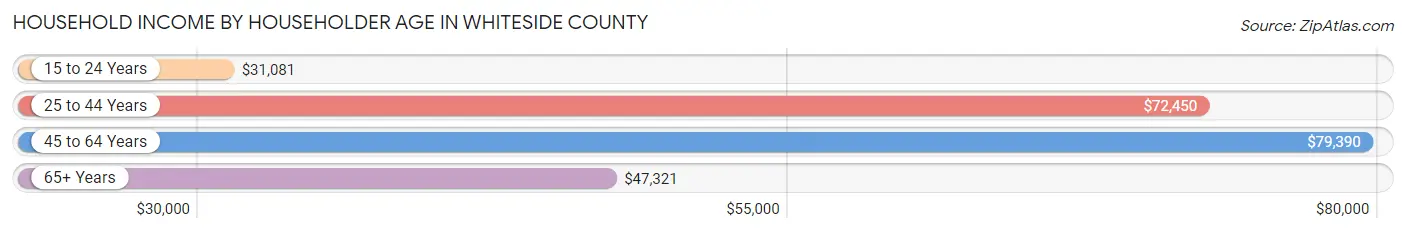
Household Income by Householder Age in Whiteside County
The median household income in Whiteside County is $62,828, with the highest median household income of $79,390 found in the 45 to 64 years age bracket for the primary householder. A total of 8,406 households (36.3%) fall into this category. Meanwhile, the 15 to 24 years age bracket for the primary householder has the lowest median household income of $31,081, with 872 households (3.8%) in this group.
| Income Bracket | # Households | Median Income |
| 15 to 24 Years | 872 (3.8%) | $31,081 |
| 25 to 44 Years | 6,097 (26.3%) | $72,450 |
| 45 to 64 Years | 8,406 (36.3%) | $79,390 |
| 65+ Years | 7,789 (33.6%) | $47,321 |
| Total | 23,164 (100.0%) | $62,828 |
Poverty in Whiteside County
Income Below Poverty by Sex and Age in Whiteside County
With 9.8% poverty level for males and 13.5% for females among the residents of Whiteside County, 6 to 11 year old males and 5 year old females are the most vulnerable to poverty, with 449 males (19.9%) and 148 females (46.8%) in their respective age groups living below the poverty level.
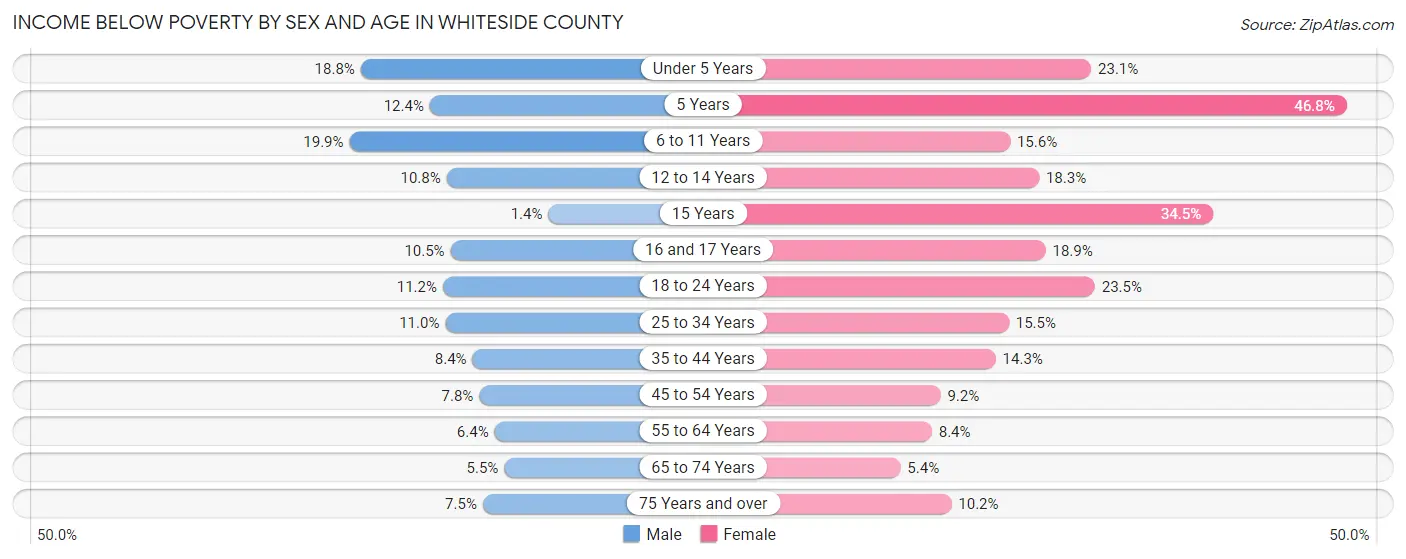
| Age Bracket | Male | Female |
| Under 5 Years | 290 (18.8%) | 298 (23.1%) |
| 5 Years | 31 (12.4%) | 148 (46.8%) |
| 6 to 11 Years | 449 (19.9%) | 266 (15.6%) |
| 12 to 14 Years | 110 (10.8%) | 226 (18.3%) |
| 15 Years | 5 (1.4%) | 113 (34.4%) |
| 16 and 17 Years | 80 (10.5%) | 135 (18.9%) |
| 18 to 24 Years | 250 (11.2%) | 493 (23.5%) |
| 25 to 34 Years | 334 (11.0%) | 445 (15.5%) |
| 35 to 44 Years | 253 (8.4%) | 434 (14.3%) |
| 45 to 54 Years | 277 (7.8%) | 307 (9.2%) |
| 55 to 64 Years | 253 (6.4%) | 334 (8.4%) |
| 65 to 74 Years | 175 (5.5%) | 182 (5.4%) |
| 75 Years and over | 157 (7.5%) | 282 (10.2%) |
| Total | 2,664 (9.8%) | 3,663 (13.5%) |
Income Above Poverty by Sex and Age in Whiteside County
According to the poverty statistics in Whiteside County, males aged 15 years and females aged 65 to 74 years are the age groups that are most secure financially, with 98.6% of males and 94.6% of females in these age groups living above the poverty line.
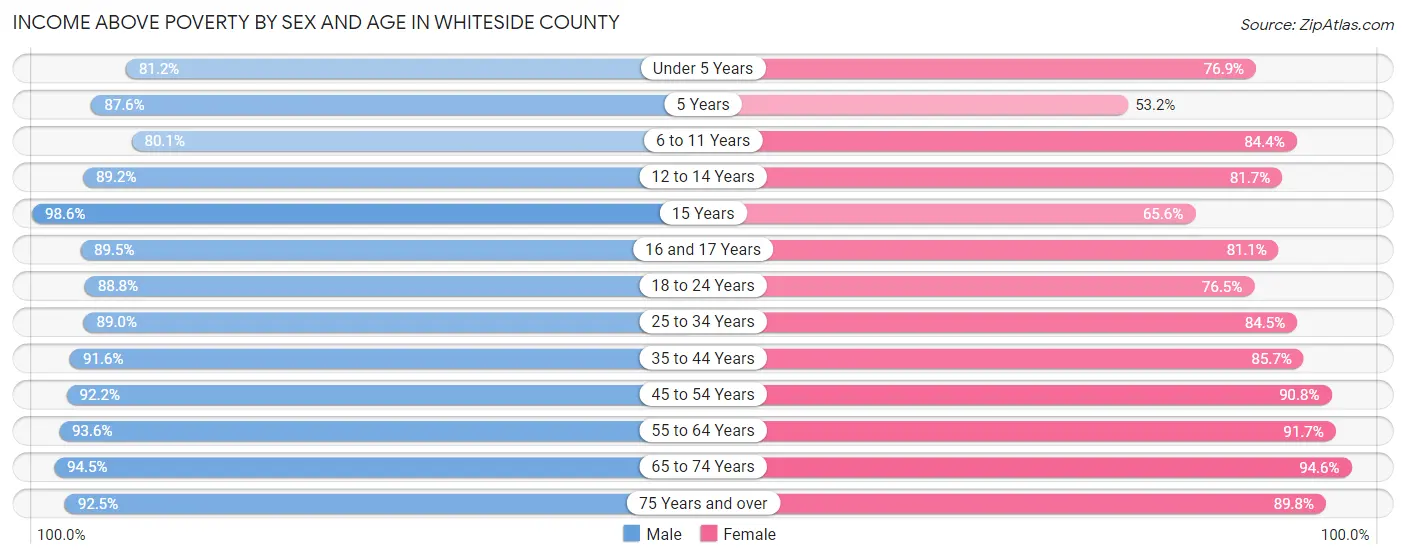
| Age Bracket | Male | Female |
| Under 5 Years | 1,252 (81.2%) | 990 (76.9%) |
| 5 Years | 219 (87.6%) | 168 (53.2%) |
| 6 to 11 Years | 1,812 (80.1%) | 1,438 (84.4%) |
| 12 to 14 Years | 905 (89.2%) | 1,009 (81.7%) |
| 15 Years | 353 (98.6%) | 215 (65.5%) |
| 16 and 17 Years | 683 (89.5%) | 579 (81.1%) |
| 18 to 24 Years | 1,984 (88.8%) | 1,607 (76.5%) |
| 25 to 34 Years | 2,714 (89.0%) | 2,426 (84.5%) |
| 35 to 44 Years | 2,745 (91.6%) | 2,606 (85.7%) |
| 45 to 54 Years | 3,268 (92.2%) | 3,043 (90.8%) |
| 55 to 64 Years | 3,708 (93.6%) | 3,667 (91.6%) |
| 65 to 74 Years | 3,014 (94.5%) | 3,164 (94.6%) |
| 75 Years and over | 1,943 (92.5%) | 2,490 (89.8%) |
| Total | 24,600 (90.2%) | 23,402 (86.5%) |
Income Below Poverty Among Married-Couple Families in Whiteside County
The poverty statistics for married-couple families in Whiteside County show that 3.0% or 313 of the total 10,344 families live below the poverty line. Families with 5 or more children have the highest poverty rate of 11.6%, comprising of 5 families. On the other hand, families with 1 or 2 children have the lowest poverty rate of 2.5%, which includes 68 families.
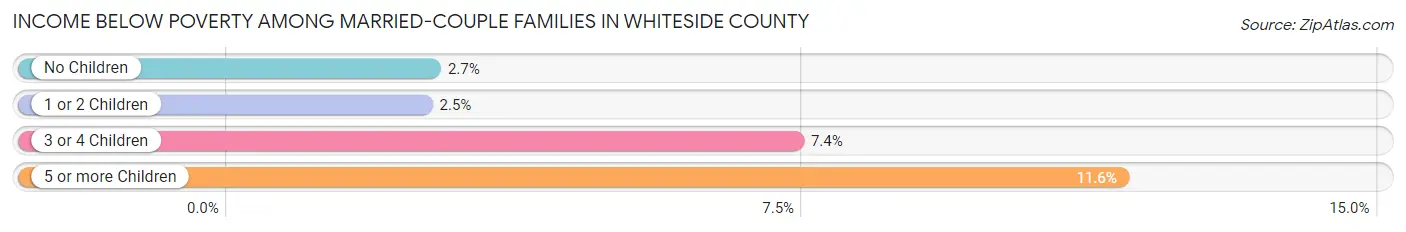
| Children | Above Poverty | Below Poverty |
| No Children | 6,644 (97.4%) | 181 (2.6%) |
| 1 or 2 Children | 2,610 (97.5%) | 68 (2.5%) |
| 3 or 4 Children | 739 (92.6%) | 59 (7.4%) |
| 5 or more Children | 38 (88.4%) | 5 (11.6%) |
| Total | 10,031 (97.0%) | 313 (3.0%) |
Income Below Poverty Among Single-Parent Households in Whiteside County
According to the poverty data in Whiteside County, 13.9% or 162 single-father households and 24.8% or 721 single-mother households are living below the poverty line. Among single-father households, those with 3 or 4 children have the highest poverty rate, with 29 households (28.4%) experiencing poverty. Likewise, among single-mother households, those with 3 or 4 children have the highest poverty rate, with 387 households (87.6%) falling below the poverty line.
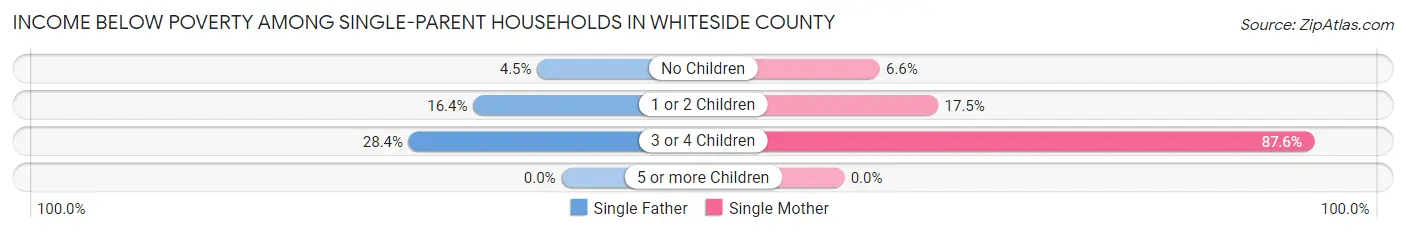
| Children | Single Father | Single Mother |
| No Children | 16 (4.5%) | 59 (6.6%) |
| 1 or 2 Children | 117 (16.4%) | 275 (17.5%) |
| 3 or 4 Children | 29 (28.4%) | 387 (87.6%) |
| 5 or more Children | 0 (0.0%) | 0 (0.0%) |
| Total | 162 (13.9%) | 721 (24.8%) |
Income Below Poverty Among Married-Couple vs Single-Parent Households in Whiteside County
The poverty data for Whiteside County shows that 313 of the married-couple family households (3.0%) and 883 of the single-parent households (21.6%) are living below the poverty level. Within the married-couple family households, those with 5 or more children have the highest poverty rate, with 5 households (11.6%) falling below the poverty line. Among the single-parent households, those with 3 or 4 children have the highest poverty rate, with 416 household (76.5%) living below poverty.
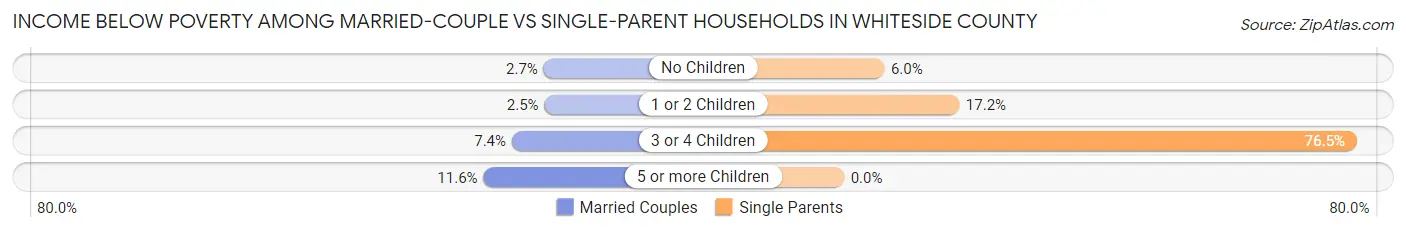
| Children | Married-Couple Families | Single-Parent Households |
| No Children | 181 (2.6%) | 75 (6.0%) |
| 1 or 2 Children | 68 (2.5%) | 392 (17.2%) |
| 3 or 4 Children | 59 (7.4%) | 416 (76.5%) |
| 5 or more Children | 5 (11.6%) | 0 (0.0%) |
| Total | 313 (3.0%) | 883 (21.6%) |
Employment Characteristics in Whiteside County
Employment by Class of Employer in Whiteside County
Among the 26,038 employed individuals in Whiteside County, private company employees (17,842 | 68.5%), local government employees (2,566 | 9.9%), and not-for-profit organizations (2,427 | 9.3%) make up the most common classes of employment.
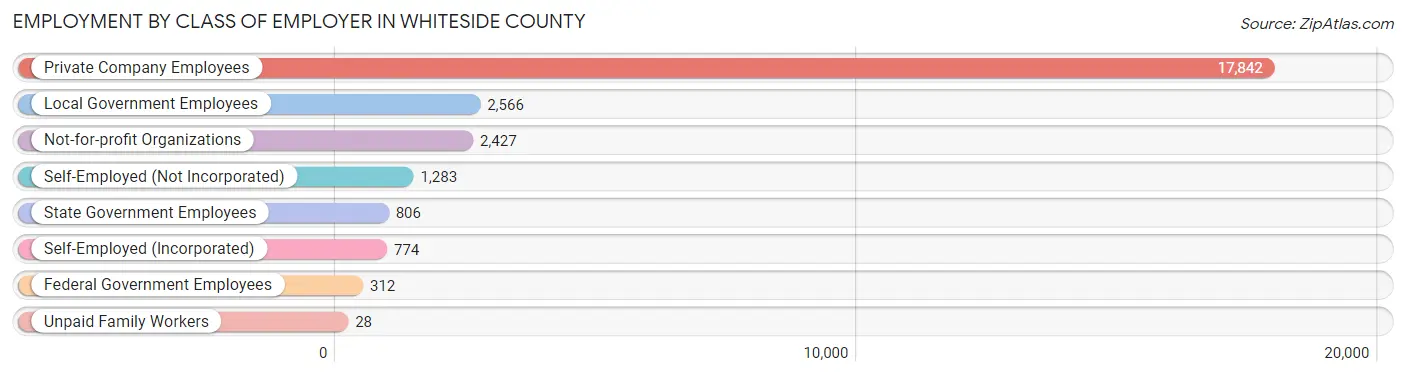
| Employer Class | # Employees | % Employees |
| Private Company Employees | 17,842 | 68.5% |
| Self-Employed (Incorporated) | 774 | 3.0% |
| Self-Employed (Not Incorporated) | 1,283 | 4.9% |
| Not-for-profit Organizations | 2,427 | 9.3% |
| Local Government Employees | 2,566 | 9.9% |
| State Government Employees | 806 | 3.1% |
| Federal Government Employees | 312 | 1.2% |
| Unpaid Family Workers | 28 | 0.1% |
| Total | 26,038 | 100.0% |
Employment Status by Age in Whiteside County
According to the labor force statistics for Whiteside County, out of the total population over 16 years of age (44,889), 62.0% or 27,831 individuals are in the labor force, with 4.4% or 1,225 of them unemployed. The age group with the highest labor force participation rate is 30 to 34 years, with 90.9% or 2,749 individuals in the labor force. Within the labor force, the 16 to 19 years age range has the highest percentage of unemployed individuals, with 14.7% or 225 of them being unemployed.
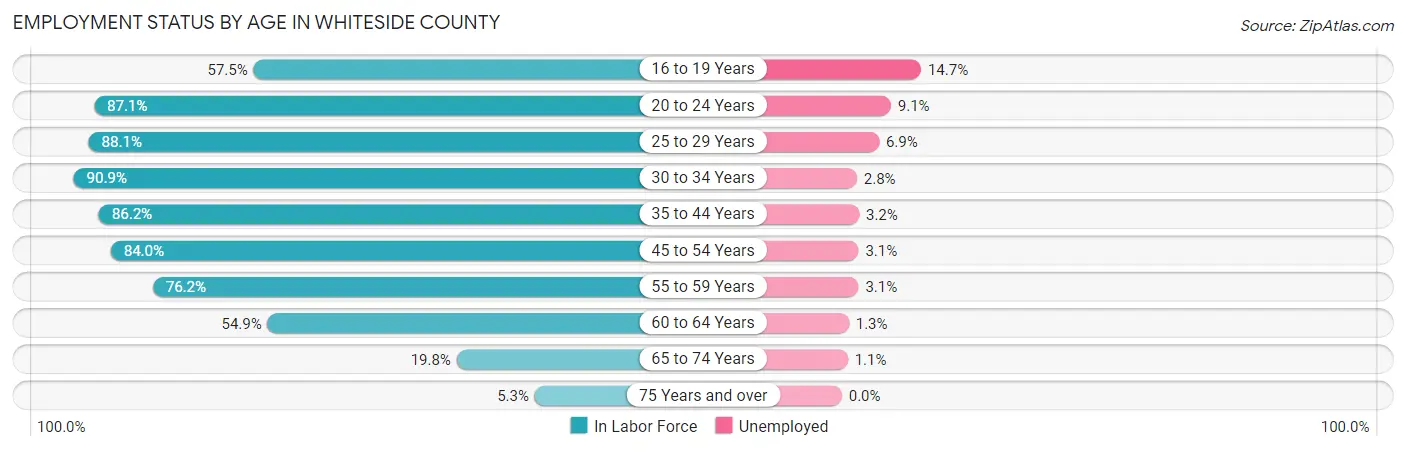
| Age Bracket | In Labor Force | Unemployed |
| 16 to 19 Years | 1,531 (57.5%) | 225 (14.7%) |
| 20 to 24 Years | 2,792 (87.1%) | 254 (9.1%) |
| 25 to 29 Years | 2,662 (88.1%) | 184 (6.9%) |
| 30 to 34 Years | 2,749 (90.9%) | 77 (2.8%) |
| 35 to 44 Years | 5,323 (86.2%) | 170 (3.2%) |
| 45 to 54 Years | 5,855 (84.0%) | 182 (3.1%) |
| 55 to 59 Years | 3,014 (76.2%) | 93 (3.1%) |
| 60 to 64 Years | 2,298 (54.9%) | 30 (1.3%) |
| 65 to 74 Years | 1,318 (19.8%) | 14 (1.1%) |
| 75 Years and over | 267 (5.3%) | 0 (0.0%) |
| Total | 27,831 (62.0%) | 1,225 (4.4%) |
Employment Status by Educational Attainment in Whiteside County
According to labor force statistics for Whiteside County, 80.1% of individuals (21,894) out of the total population between 25 and 64 years of age (27,333) are in the labor force, with 3.4% or 744 of them being unemployed. The group with the highest labor force participation rate are those with the educational attainment of bachelor's degree or higher, with 85.6% or 5,077 individuals in the labor force. Within the labor force, individuals with high school diploma education have the highest percentage of unemployment, with 5.1% or 382 of them being unemployed.
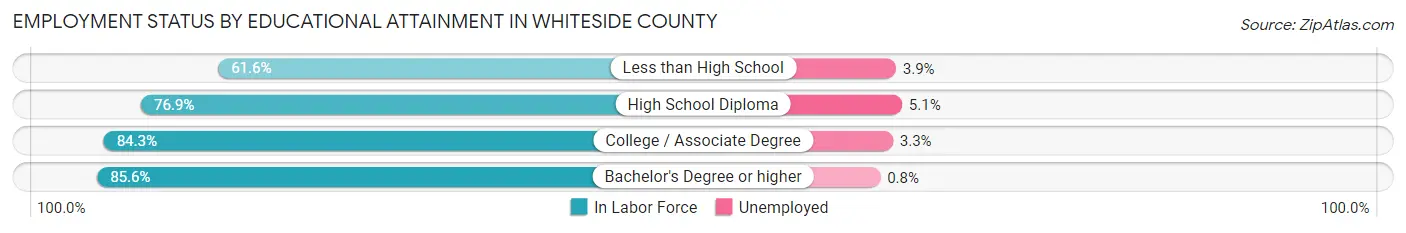
| Educational Attainment | In Labor Force | Unemployed |
| Less than High School | 1,338 (61.6%) | 85 (3.9%) |
| High School Diploma | 7,489 (76.9%) | 497 (5.1%) |
| College / Associate Degree | 8,002 (84.3%) | 313 (3.3%) |
| Bachelor's Degree or higher | 5,077 (85.6%) | 47 (0.8%) |
| Total | 21,894 (80.1%) | 929 (3.4%) |
Employment Occupations by Sex in Whiteside County
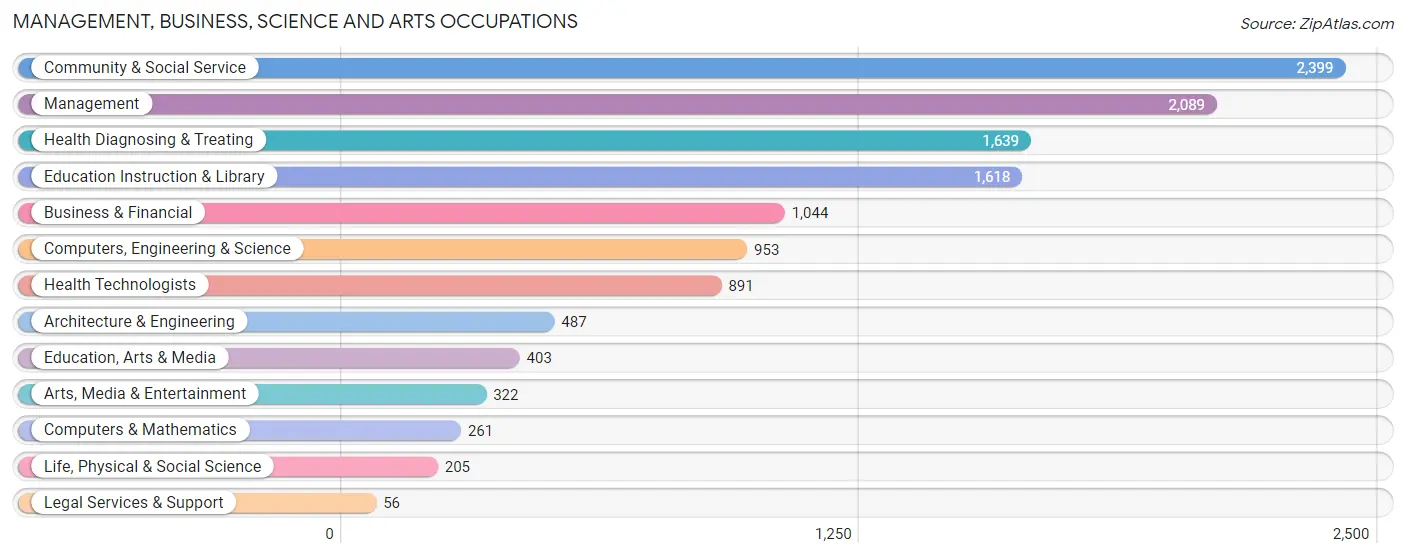
Management, Business, Science and Arts Occupations
The most common Management, Business, Science and Arts occupations in Whiteside County are Community & Social Service (2,399 | 9.0%), Management (2,089 | 7.9%), Health Diagnosing & Treating (1,639 | 6.2%), Education Instruction & Library (1,618 | 6.1%), and Business & Financial (1,044 | 3.9%).
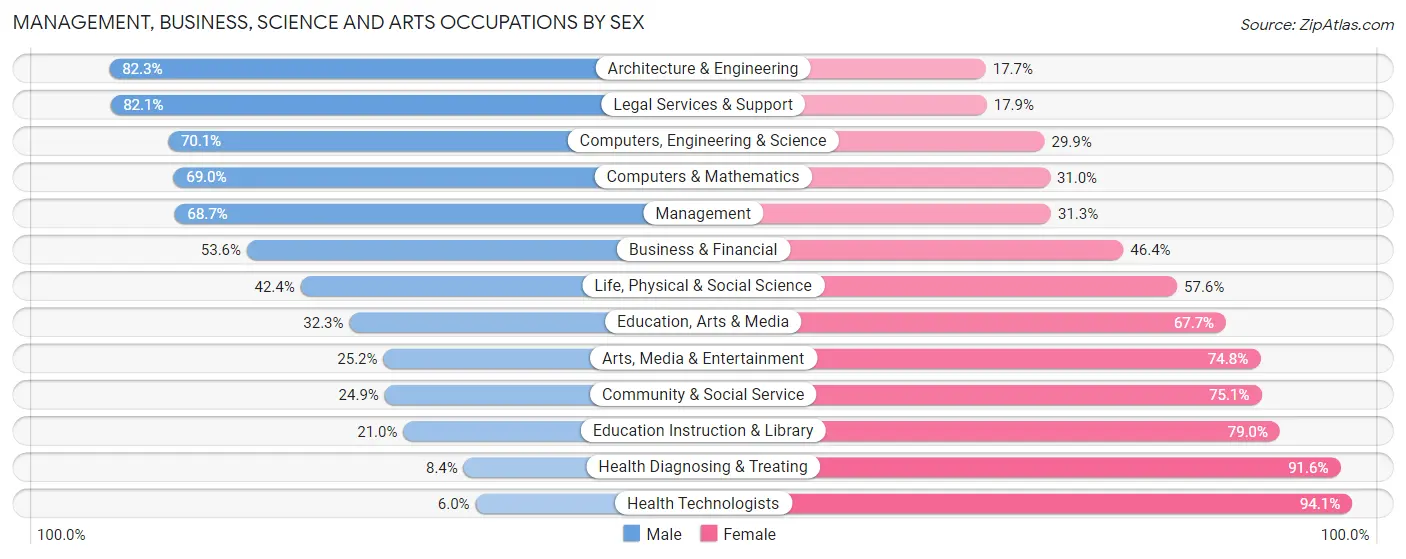
Management, Business, Science and Arts Occupations by Sex
Within the Management, Business, Science and Arts occupations in Whiteside County, the most male-oriented occupations are Architecture & Engineering (82.3%), Legal Services & Support (82.1%), and Computers, Engineering & Science (70.1%), while the most female-oriented occupations are Health Technologists (94.1%), Health Diagnosing & Treating (91.6%), and Education Instruction & Library (79.0%).
| Occupation | Male | Female |
| Management | 1,436 (68.7%) | 653 (31.3%) |
| Business & Financial | 560 (53.6%) | 484 (46.4%) |
| Computers, Engineering & Science | 668 (70.1%) | 285 (29.9%) |
| Computers & Mathematics | 180 (69.0%) | 81 (31.0%) |
| Architecture & Engineering | 401 (82.3%) | 86 (17.7%) |
| Life, Physical & Social Science | 87 (42.4%) | 118 (57.6%) |
| Community & Social Service | 597 (24.9%) | 1,802 (75.1%) |
| Education, Arts & Media | 130 (32.3%) | 273 (67.7%) |
| Legal Services & Support | 46 (82.1%) | 10 (17.9%) |
| Education Instruction & Library | 340 (21.0%) | 1,278 (79.0%) |
| Arts, Media & Entertainment | 81 (25.2%) | 241 (74.8%) |
| Health Diagnosing & Treating | 138 (8.4%) | 1,501 (91.6%) |
| Health Technologists | 53 (5.9%) | 838 (94.1%) |
| Total (Category) | 3,399 (41.8%) | 4,725 (58.2%) |
| Total (Overall) | 14,247 (53.6%) | 12,338 (46.4%) |
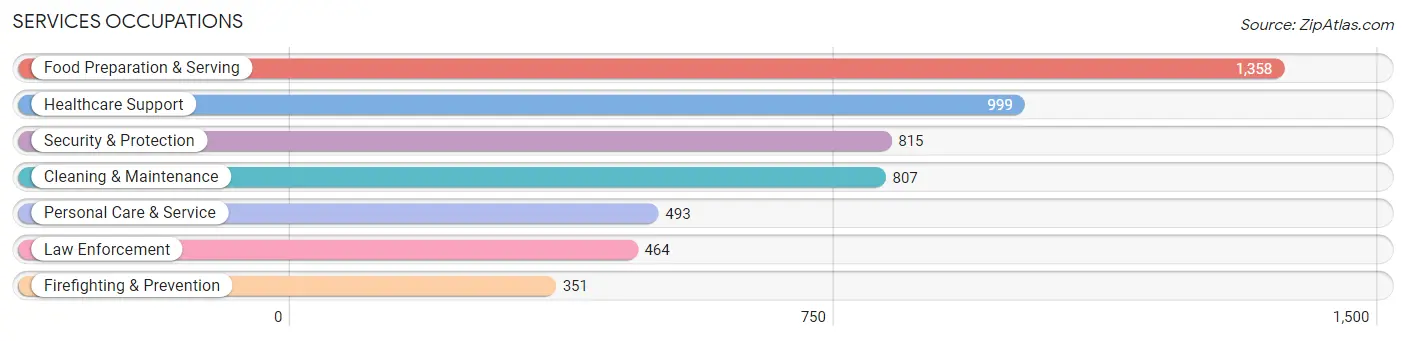
Services Occupations
The most common Services occupations in Whiteside County are Food Preparation & Serving (1,358 | 5.1%), Healthcare Support (999 | 3.8%), Security & Protection (815 | 3.1%), Cleaning & Maintenance (807 | 3.0%), and Personal Care & Service (493 | 1.8%).
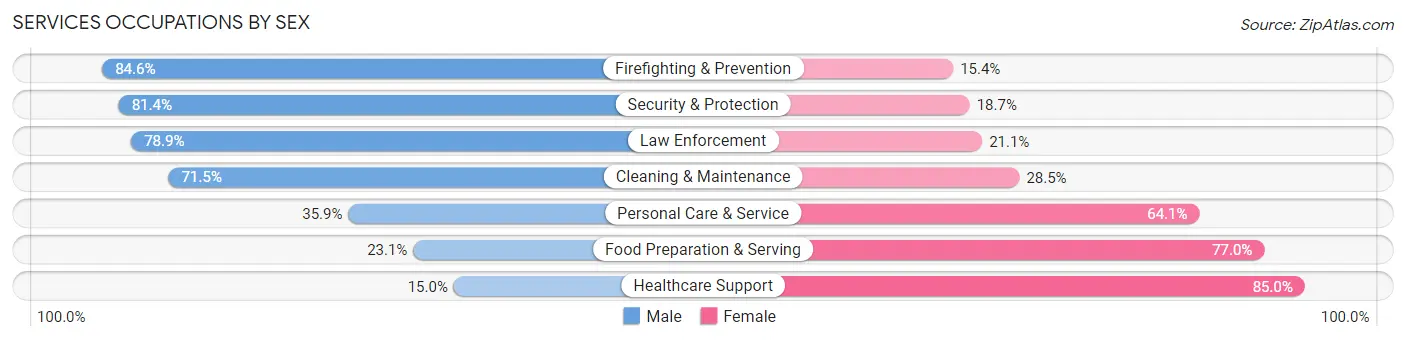
Services Occupations by Sex
Within the Services occupations in Whiteside County, the most male-oriented occupations are Firefighting & Prevention (84.6%), Security & Protection (81.4%), and Law Enforcement (78.9%), while the most female-oriented occupations are Healthcare Support (85.0%), Food Preparation & Serving (76.9%), and Personal Care & Service (64.1%).
| Occupation | Male | Female |
| Healthcare Support | 150 (15.0%) | 849 (85.0%) |
| Security & Protection | 663 (81.4%) | 152 (18.6%) |
| Firefighting & Prevention | 297 (84.6%) | 54 (15.4%) |
| Law Enforcement | 366 (78.9%) | 98 (21.1%) |
| Food Preparation & Serving | 313 (23.1%) | 1,045 (76.9%) |
| Cleaning & Maintenance | 577 (71.5%) | 230 (28.5%) |
| Personal Care & Service | 177 (35.9%) | 316 (64.1%) |
| Total (Category) | 1,880 (42.0%) | 2,592 (58.0%) |
| Total (Overall) | 14,247 (53.6%) | 12,338 (46.4%) |
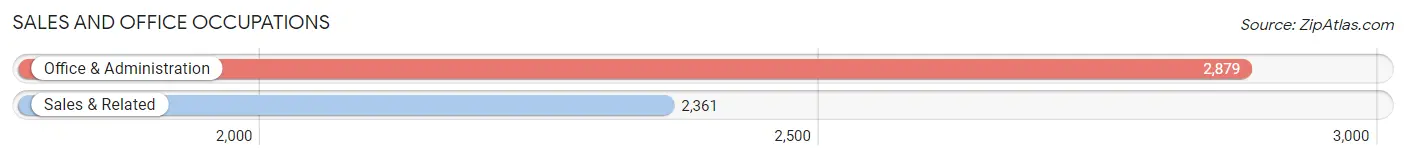
Sales and Office Occupations
The most common Sales and Office occupations in Whiteside County are Office & Administration (2,879 | 10.8%), and Sales & Related (2,361 | 8.9%).
Sales and Office Occupations by Sex
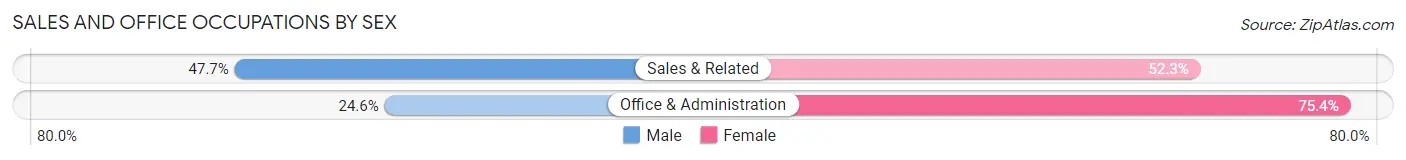
| Occupation | Male | Female |
| Sales & Related | 1,126 (47.7%) | 1,235 (52.3%) |
| Office & Administration | 709 (24.6%) | 2,170 (75.4%) |
| Total (Category) | 1,835 (35.0%) | 3,405 (65.0%) |
| Total (Overall) | 14,247 (53.6%) | 12,338 (46.4%) |
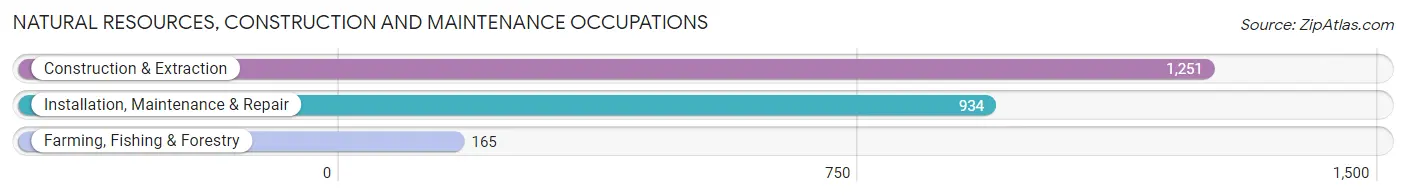
Natural Resources, Construction and Maintenance Occupations
The most common Natural Resources, Construction and Maintenance occupations in Whiteside County are Construction & Extraction (1,251 | 4.7%), Installation, Maintenance & Repair (934 | 3.5%), and Farming, Fishing & Forestry (165 | 0.6%).
Natural Resources, Construction and Maintenance Occupations by Sex
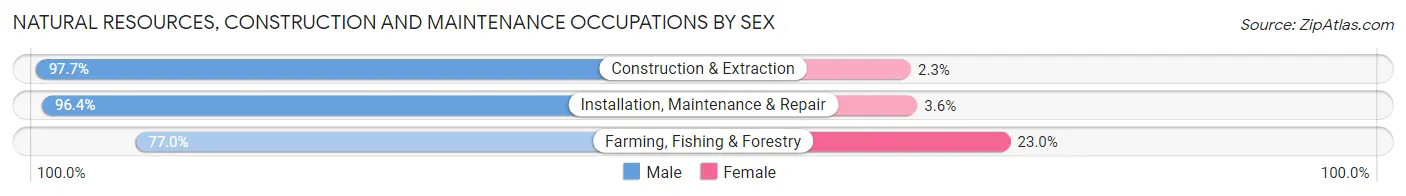
| Occupation | Male | Female |
| Farming, Fishing & Forestry | 127 (77.0%) | 38 (23.0%) |
| Construction & Extraction | 1,222 (97.7%) | 29 (2.3%) |
| Installation, Maintenance & Repair | 900 (96.4%) | 34 (3.6%) |
| Total (Category) | 2,249 (95.7%) | 101 (4.3%) |
| Total (Overall) | 14,247 (53.6%) | 12,338 (46.4%) |
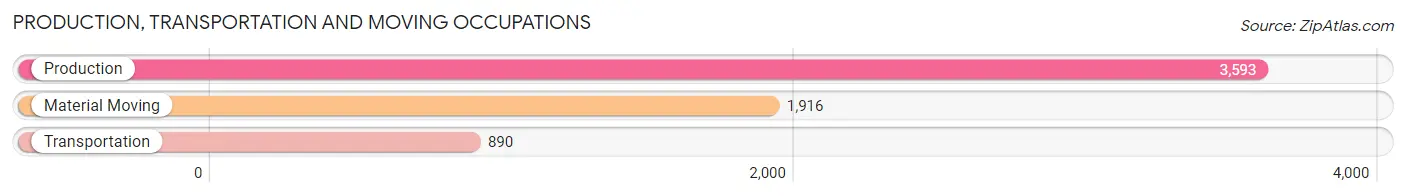
Production, Transportation and Moving Occupations
The most common Production, Transportation and Moving occupations in Whiteside County are Production (3,593 | 13.5%), Material Moving (1,916 | 7.2%), and Transportation (890 | 3.4%).
Production, Transportation and Moving Occupations by Sex
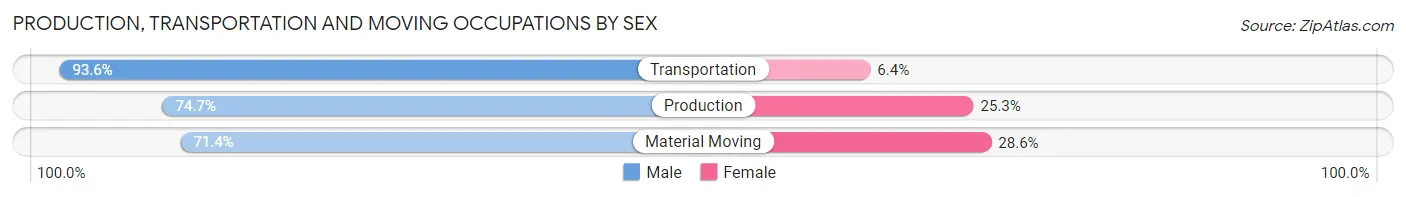
| Occupation | Male | Female |
| Production | 2,683 (74.7%) | 910 (25.3%) |
| Transportation | 833 (93.6%) | 57 (6.4%) |
| Material Moving | 1,368 (71.4%) | 548 (28.6%) |
| Total (Category) | 4,884 (76.3%) | 1,515 (23.7%) |
| Total (Overall) | 14,247 (53.6%) | 12,338 (46.4%) |
Employment Industries by Sex in Whiteside County
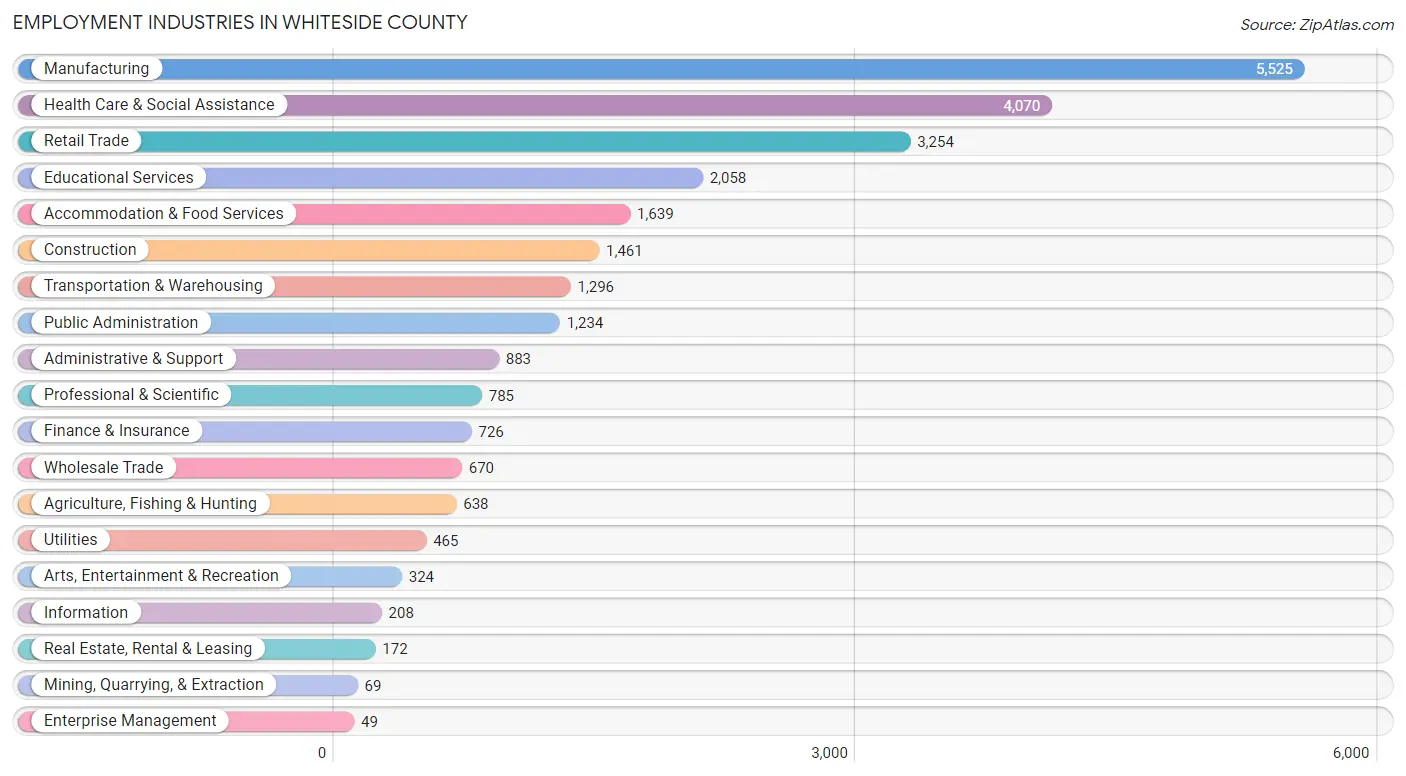
Employment Industries in Whiteside County
The major employment industries in Whiteside County include Manufacturing (5,525 | 20.8%), Health Care & Social Assistance (4,070 | 15.3%), Retail Trade (3,254 | 12.2%), Educational Services (2,058 | 7.7%), and Accommodation & Food Services (1,639 | 6.2%).
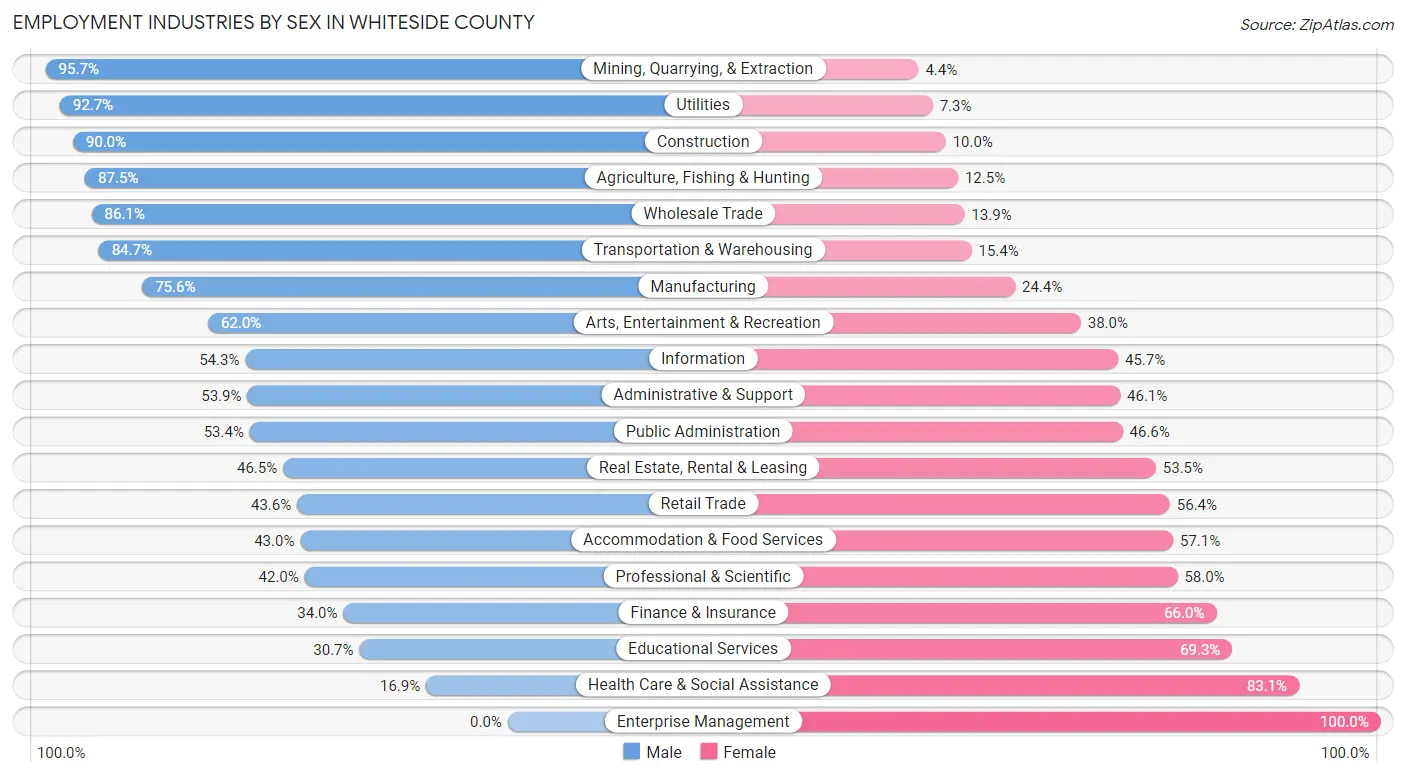
Employment Industries by Sex in Whiteside County
The Whiteside County industries that see more men than women are Mining, Quarrying, & Extraction (95.7%), Utilities (92.7%), and Construction (90.0%), whereas the industries that tend to have a higher number of women are Enterprise Management (100.0%), Health Care & Social Assistance (83.1%), and Educational Services (69.3%).
| Industry | Male | Female |
| Agriculture, Fishing & Hunting | 558 (87.5%) | 80 (12.5%) |
| Mining, Quarrying, & Extraction | 66 (95.7%) | 3 (4.3%) |
| Construction | 1,315 (90.0%) | 146 (10.0%) |
| Manufacturing | 4,179 (75.6%) | 1,346 (24.4%) |
| Wholesale Trade | 577 (86.1%) | 93 (13.9%) |
| Retail Trade | 1,419 (43.6%) | 1,835 (56.4%) |
| Transportation & Warehousing | 1,097 (84.7%) | 199 (15.3%) |
| Utilities | 431 (92.7%) | 34 (7.3%) |
| Information | 113 (54.3%) | 95 (45.7%) |
| Finance & Insurance | 247 (34.0%) | 479 (66.0%) |
| Real Estate, Rental & Leasing | 80 (46.5%) | 92 (53.5%) |
| Professional & Scientific | 330 (42.0%) | 455 (58.0%) |
| Enterprise Management | 0 (0.0%) | 49 (100.0%) |
| Administrative & Support | 476 (53.9%) | 407 (46.1%) |
| Educational Services | 632 (30.7%) | 1,426 (69.3%) |
| Health Care & Social Assistance | 688 (16.9%) | 3,382 (83.1%) |
| Arts, Entertainment & Recreation | 201 (62.0%) | 123 (38.0%) |
| Accommodation & Food Services | 704 (42.9%) | 935 (57.1%) |
| Public Administration | 659 (53.4%) | 575 (46.6%) |
| Total | 14,247 (53.6%) | 12,338 (46.4%) |
Education in Whiteside County
School Enrollment in Whiteside County
The most common levels of schooling among the 11,935 students in Whiteside County are high school (3,095 | 25.9%), middle school (2,818 | 23.6%), and elementary school (2,588 | 21.7%).
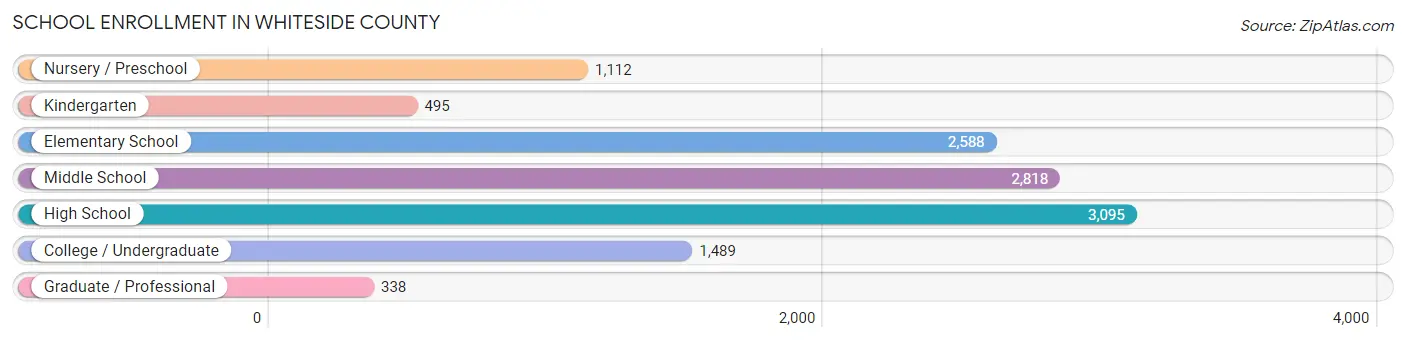
| School Level | # Students | % Students |
| Nursery / Preschool | 1,112 | 9.3% |
| Kindergarten | 495 | 4.2% |
| Elementary School | 2,588 | 21.7% |
| Middle School | 2,818 | 23.6% |
| High School | 3,095 | 25.9% |
| College / Undergraduate | 1,489 | 12.5% |
| Graduate / Professional | 338 | 2.8% |
| Total | 11,935 | 100.0% |
School Enrollment by Age by Funding Source in Whiteside County
Out of a total of 11,935 students who are enrolled in schools in Whiteside County, 1,408 (11.8%) attend a private institution, while the remaining 10,527 (88.2%) are enrolled in public schools. The age group of 3 to 4 year olds has the highest likelihood of being enrolled in private schools, with 184 (21.1% in the age bracket) enrolled. Conversely, the age group of 10 to 14 year olds has the lowest likelihood of being enrolled in a private school, with 3,372 (92.3% in the age bracket) attending a public institution.
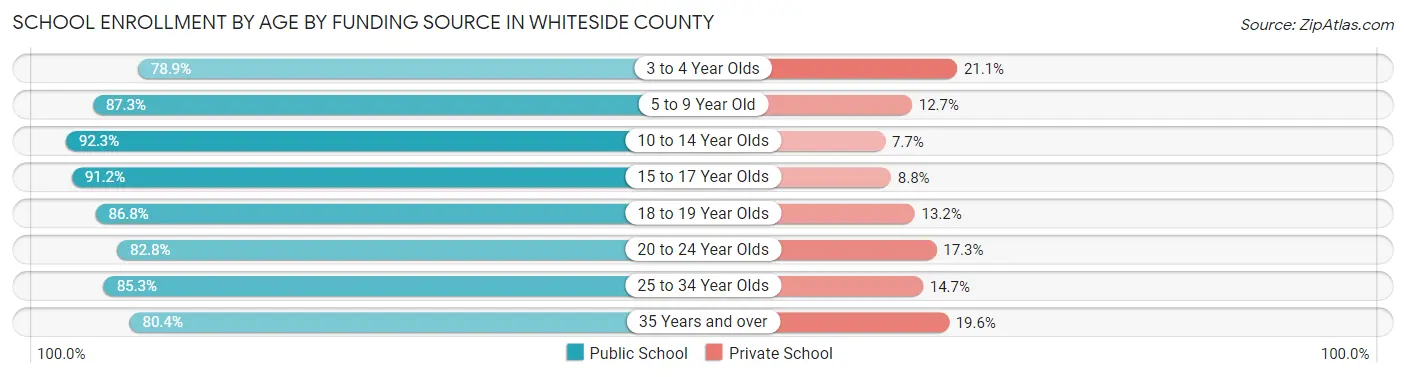
| Age Bracket | Public School | Private School |
| 3 to 4 Year Olds | 688 (78.9%) | 184 (21.1%) |
| 5 to 9 Year Old | 2,650 (87.3%) | 385 (12.7%) |
| 10 to 14 Year Olds | 3,372 (92.3%) | 281 (7.7%) |
| 15 to 17 Year Olds | 1,795 (91.2%) | 173 (8.8%) |
| 18 to 19 Year Olds | 664 (86.8%) | 101 (13.2%) |
| 20 to 24 Year Olds | 614 (82.8%) | 128 (17.2%) |
| 25 to 34 Year Olds | 266 (85.3%) | 46 (14.7%) |
| 35 Years and over | 473 (80.4%) | 115 (19.6%) |
| Total | 10,527 (88.2%) | 1,408 (11.8%) |
Educational Attainment by Field of Study in Whiteside County
Education (2,250 | 27.8%), business (1,304 | 16.1%), science & technology (925 | 11.4%), bio, nature & agricultural (696 | 8.6%), and arts & humanities (583 | 7.2%) are the most common fields of study among 8,107 individuals in Whiteside County who have obtained a bachelor's degree or higher.
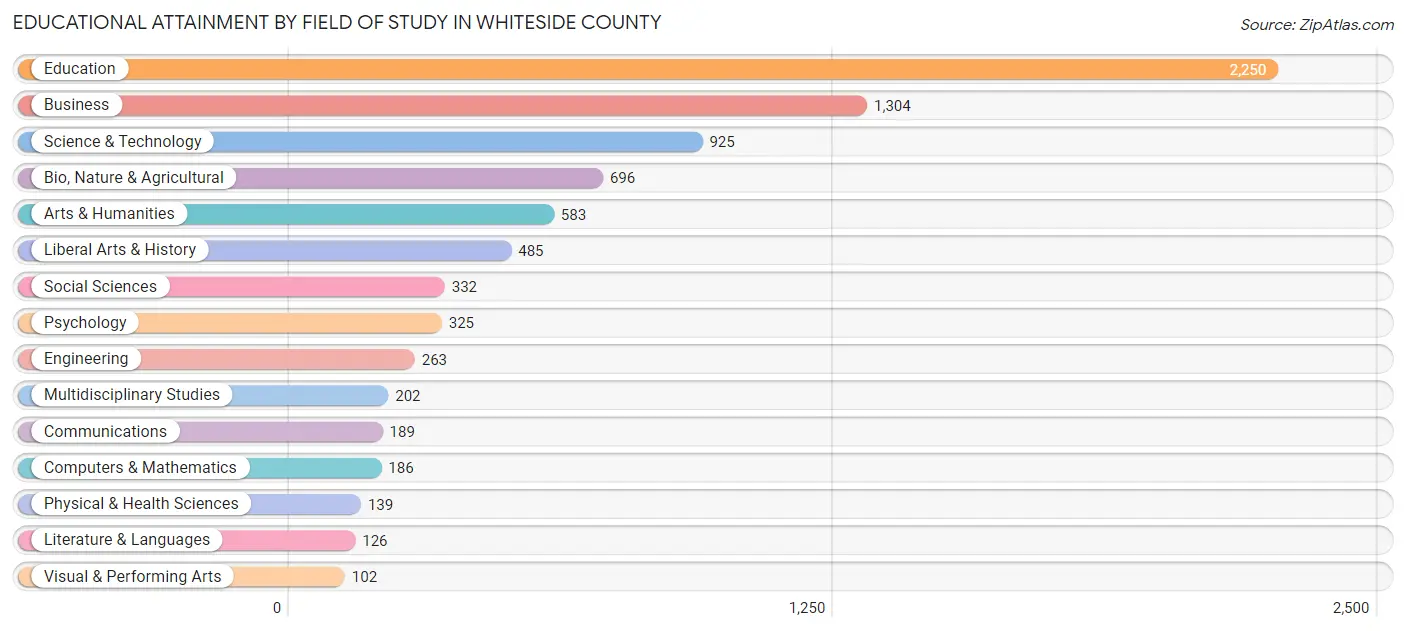
| Field of Study | # Graduates | % Graduates |
| Computers & Mathematics | 186 | 2.3% |
| Bio, Nature & Agricultural | 696 | 8.6% |
| Physical & Health Sciences | 139 | 1.7% |
| Psychology | 325 | 4.0% |
| Social Sciences | 332 | 4.1% |
| Engineering | 263 | 3.2% |
| Multidisciplinary Studies | 202 | 2.5% |
| Science & Technology | 925 | 11.4% |
| Business | 1,304 | 16.1% |
| Education | 2,250 | 27.8% |
| Literature & Languages | 126 | 1.5% |
| Liberal Arts & History | 485 | 6.0% |
| Visual & Performing Arts | 102 | 1.3% |
| Communications | 189 | 2.3% |
| Arts & Humanities | 583 | 7.2% |
| Total | 8,107 | 100.0% |
Transportation & Commute in Whiteside County
Vehicle Availability by Sex in Whiteside County
The most prevalent vehicle ownership categories in Whiteside County are males with 2 vehicles (5,692, accounting for 40.8%) and females with 2 vehicles (4,492, making up 47.2%).
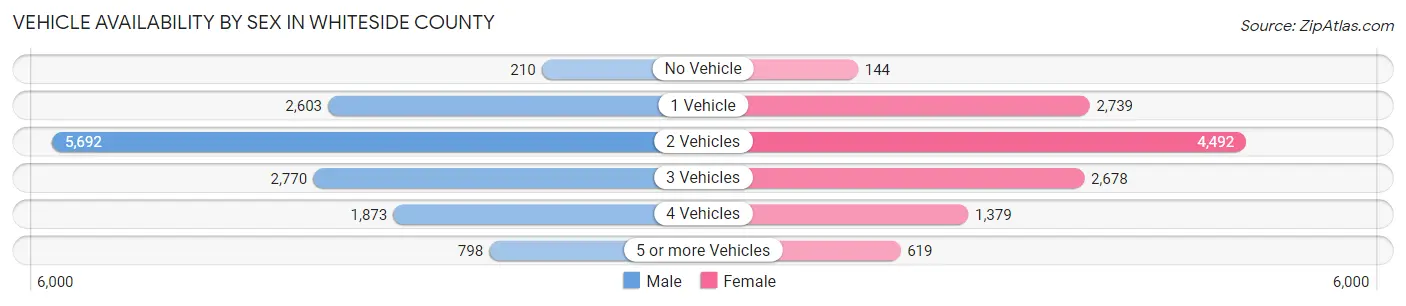
| Vehicles Available | Male | Female |
| No Vehicle | 210 (1.5%) | 144 (1.2%) |
| 1 Vehicle | 2,603 (18.7%) | 2,739 (22.7%) |
| 2 Vehicles | 5,692 (40.8%) | 4,492 (37.3%) |
| 3 Vehicles | 2,770 (19.9%) | 2,678 (22.2%) |
| 4 Vehicles | 1,873 (13.4%) | 1,379 (11.4%) |
| 5 or more Vehicles | 798 (5.7%) | 619 (5.1%) |
| Total | 13,946 (100.0%) | 12,051 (100.0%) |
Commute Time in Whiteside County
The most frequently occuring commute durations in Whiteside County are 10 to 14 minutes (4,908 commuters, 19.7%), 5 to 9 minutes (4,610 commuters, 18.5%), and 15 to 19 minutes (3,807 commuters, 15.2%).
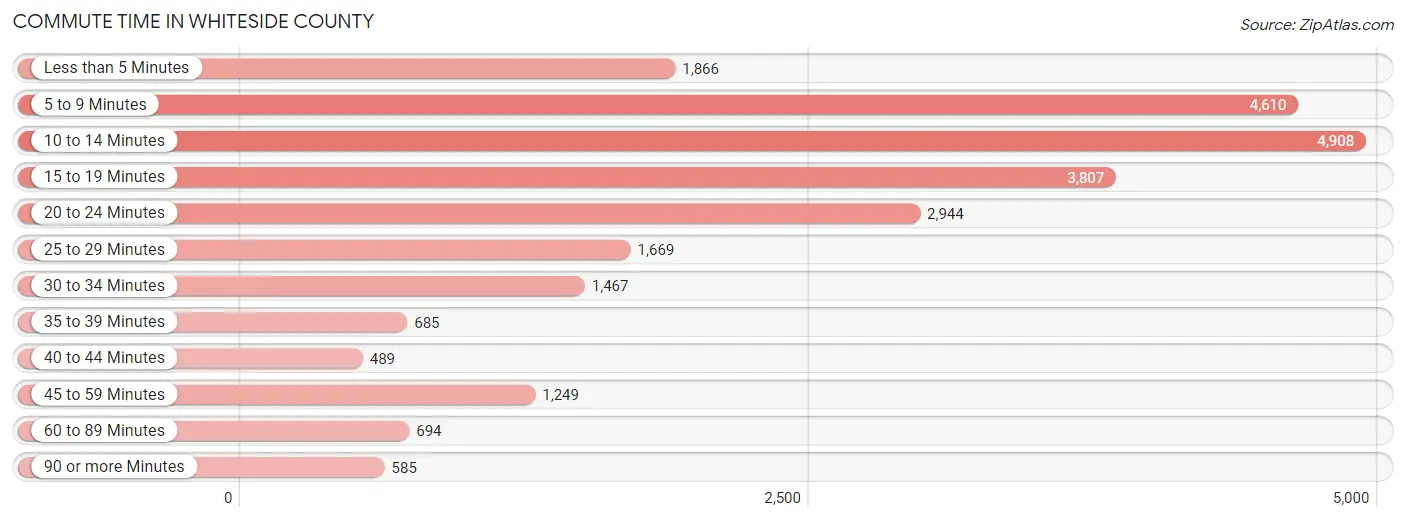
| Commute Time | # Commuters | % Commuters |
| Less than 5 Minutes | 1,866 | 7.5% |
| 5 to 9 Minutes | 4,610 | 18.5% |
| 10 to 14 Minutes | 4,908 | 19.7% |
| 15 to 19 Minutes | 3,807 | 15.2% |
| 20 to 24 Minutes | 2,944 | 11.8% |
| 25 to 29 Minutes | 1,669 | 6.7% |
| 30 to 34 Minutes | 1,467 | 5.9% |
| 35 to 39 Minutes | 685 | 2.7% |
| 40 to 44 Minutes | 489 | 2.0% |
| 45 to 59 Minutes | 1,249 | 5.0% |
| 60 to 89 Minutes | 694 | 2.8% |
| 90 or more Minutes | 585 | 2.3% |
Commute Time by Sex in Whiteside County
The most common commute times in Whiteside County are 10 to 14 minutes (2,584 commuters, 19.2%) for males and 5 to 9 minutes (2,693 commuters, 23.4%) for females.
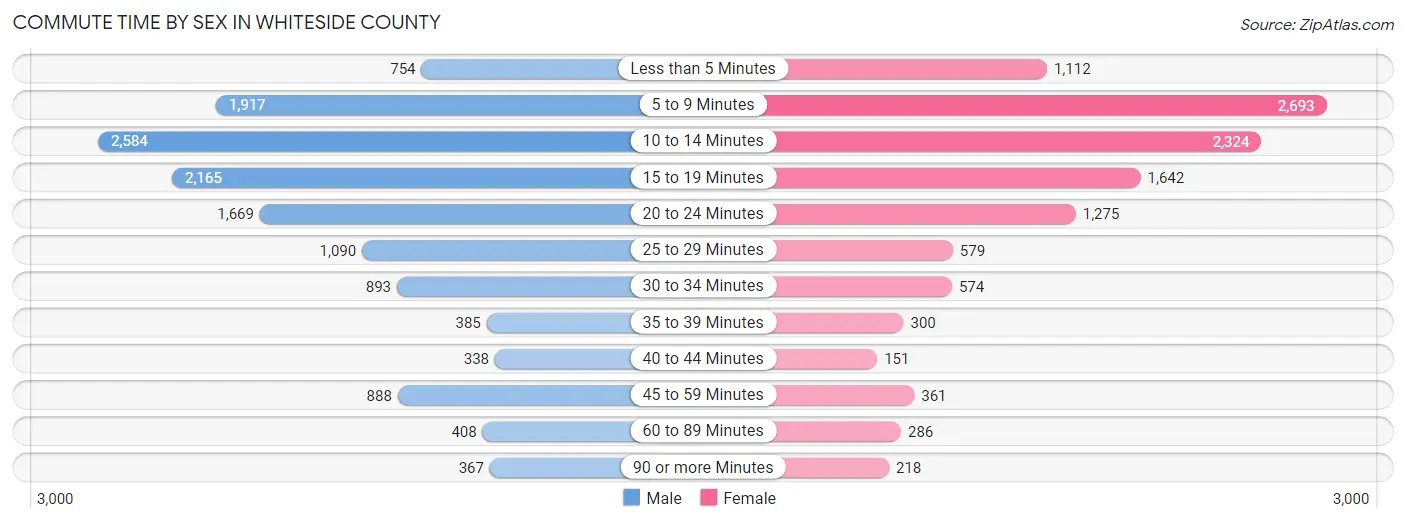
| Commute Time | Male | Female |
| Less than 5 Minutes | 754 (5.6%) | 1,112 (9.7%) |
| 5 to 9 Minutes | 1,917 (14.2%) | 2,693 (23.4%) |
| 10 to 14 Minutes | 2,584 (19.2%) | 2,324 (20.2%) |
| 15 to 19 Minutes | 2,165 (16.1%) | 1,642 (14.3%) |
| 20 to 24 Minutes | 1,669 (12.4%) | 1,275 (11.1%) |
| 25 to 29 Minutes | 1,090 (8.1%) | 579 (5.0%) |
| 30 to 34 Minutes | 893 (6.6%) | 574 (5.0%) |
| 35 to 39 Minutes | 385 (2.9%) | 300 (2.6%) |
| 40 to 44 Minutes | 338 (2.5%) | 151 (1.3%) |
| 45 to 59 Minutes | 888 (6.6%) | 361 (3.1%) |
| 60 to 89 Minutes | 408 (3.0%) | 286 (2.5%) |
| 90 or more Minutes | 367 (2.7%) | 218 (1.9%) |
Time of Departure to Work by Sex in Whiteside County
The most frequent times of departure to work in Whiteside County are 7:00 AM to 7:29 AM (1,853, 13.8%) for males and 7:30 AM to 7:59 AM (1,839, 16.0%) for females.
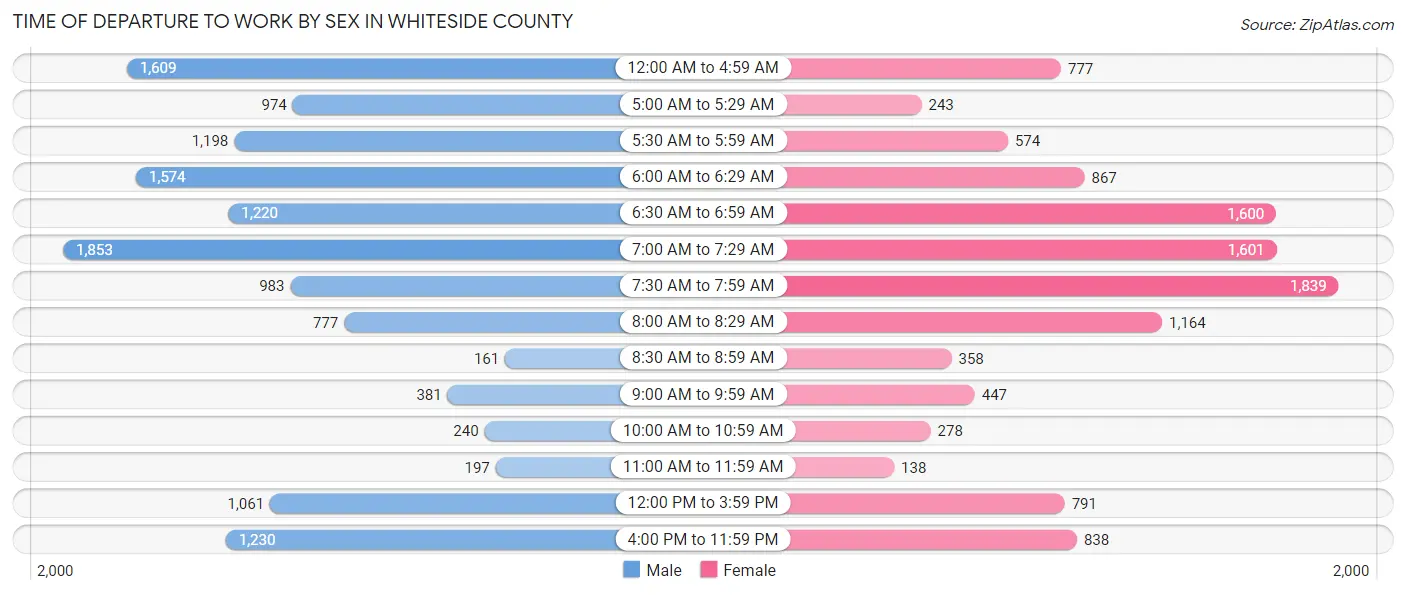
| Time of Departure | Male | Female |
| 12:00 AM to 4:59 AM | 1,609 (12.0%) | 777 (6.8%) |
| 5:00 AM to 5:29 AM | 974 (7.2%) | 243 (2.1%) |
| 5:30 AM to 5:59 AM | 1,198 (8.9%) | 574 (5.0%) |
| 6:00 AM to 6:29 AM | 1,574 (11.7%) | 867 (7.5%) |
| 6:30 AM to 6:59 AM | 1,220 (9.1%) | 1,600 (13.9%) |
| 7:00 AM to 7:29 AM | 1,853 (13.8%) | 1,601 (13.9%) |
| 7:30 AM to 7:59 AM | 983 (7.3%) | 1,839 (16.0%) |
| 8:00 AM to 8:29 AM | 777 (5.8%) | 1,164 (10.1%) |
| 8:30 AM to 8:59 AM | 161 (1.2%) | 358 (3.1%) |
| 9:00 AM to 9:59 AM | 381 (2.8%) | 447 (3.9%) |
| 10:00 AM to 10:59 AM | 240 (1.8%) | 278 (2.4%) |
| 11:00 AM to 11:59 AM | 197 (1.5%) | 138 (1.2%) |
| 12:00 PM to 3:59 PM | 1,061 (7.9%) | 791 (6.9%) |
| 4:00 PM to 11:59 PM | 1,230 (9.1%) | 838 (7.3%) |
| Total | 13,458 (100.0%) | 11,515 (100.0%) |
Housing Occupancy in Whiteside County
Occupancy by Ownership in Whiteside County
Of the total 23,164 dwellings in Whiteside County, owner-occupied units account for 17,241 (74.4%), while renter-occupied units make up 5,923 (25.6%).
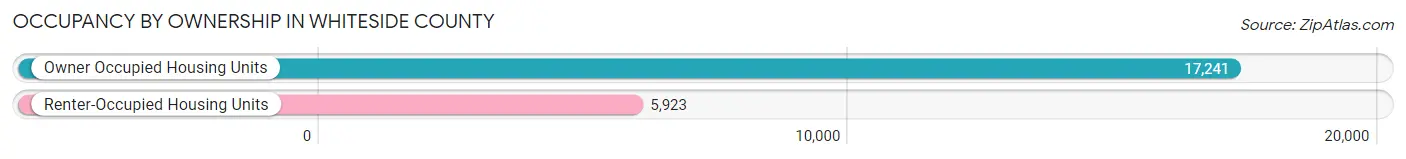
| Occupancy | # Housing Units | % Housing Units |
| Owner Occupied Housing Units | 17,241 | 74.4% |
| Renter-Occupied Housing Units | 5,923 | 25.6% |
| Total Occupied Housing Units | 23,164 | 100.0% |
Occupancy by Household Size in Whiteside County
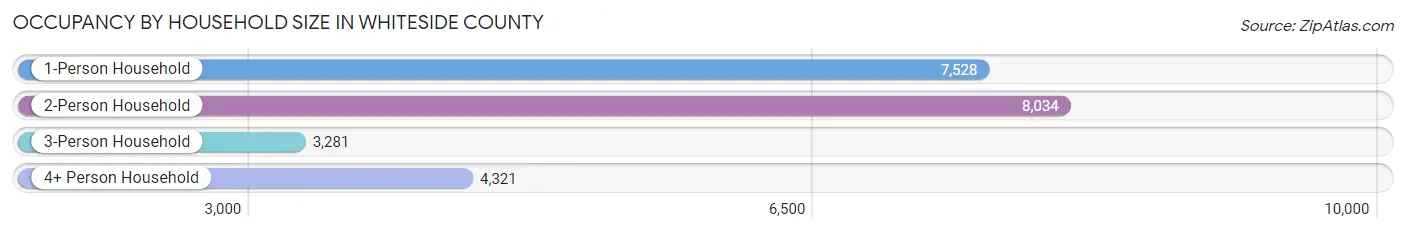
| Household Size | # Housing Units | % Housing Units |
| 1-Person Household | 7,528 | 32.5% |
| 2-Person Household | 8,034 | 34.7% |
| 3-Person Household | 3,281 | 14.2% |
| 4+ Person Household | 4,321 | 18.6% |
| Total Housing Units | 23,164 | 100.0% |
Occupancy by Ownership by Household Size in Whiteside County
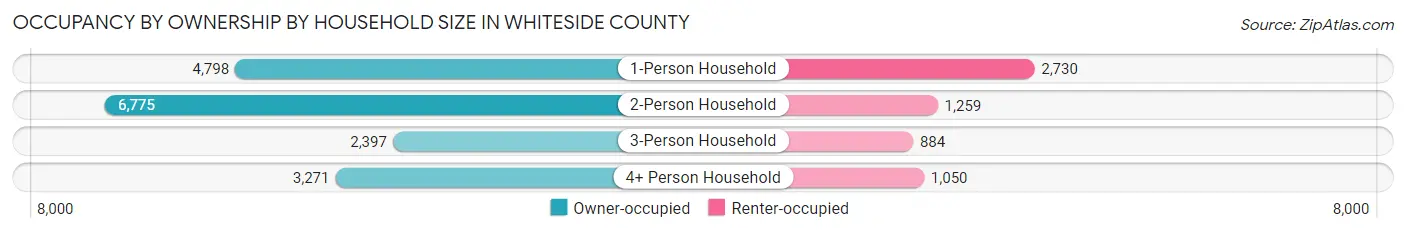
| Household Size | Owner-occupied | Renter-occupied |
| 1-Person Household | 4,798 (63.7%) | 2,730 (36.3%) |
| 2-Person Household | 6,775 (84.3%) | 1,259 (15.7%) |
| 3-Person Household | 2,397 (73.1%) | 884 (26.9%) |
| 4+ Person Household | 3,271 (75.7%) | 1,050 (24.3%) |
| Total Housing Units | 17,241 (74.4%) | 5,923 (25.6%) |
Occupancy by Educational Attainment in Whiteside County
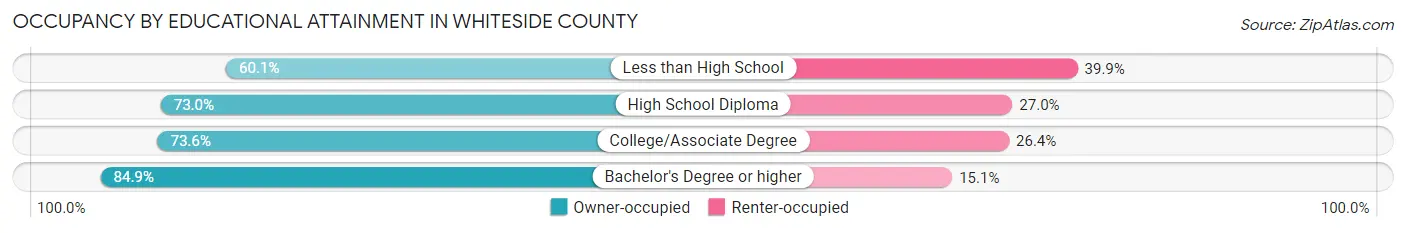
| Household Size | Owner-occupied | Renter-occupied |
| Less than High School | 1,233 (60.1%) | 820 (39.9%) |
| High School Diploma | 5,877 (73.0%) | 2,175 (27.0%) |
| College/Associate Degree | 6,261 (73.6%) | 2,241 (26.4%) |
| Bachelor's Degree or higher | 3,870 (84.9%) | 687 (15.1%) |
Occupancy by Age of Householder in Whiteside County
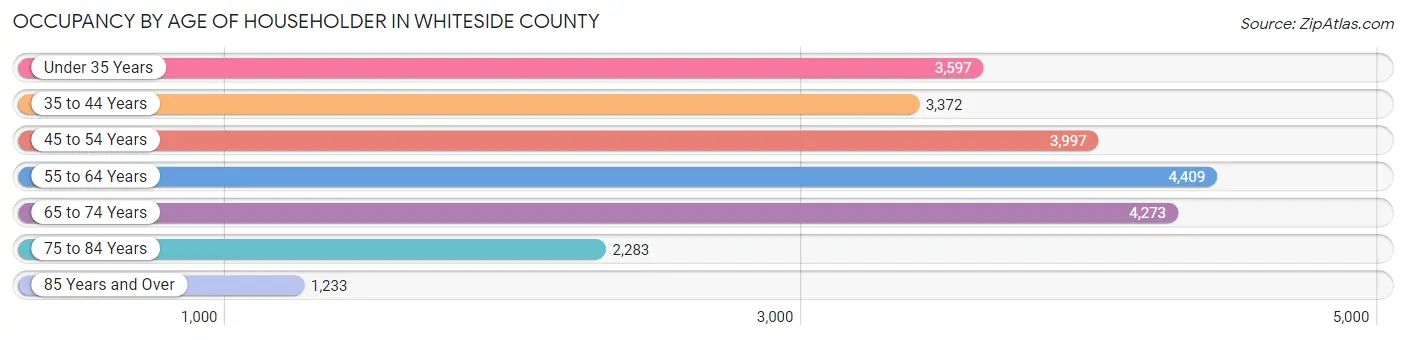
| Age Bracket | # Households | % Households |
| Under 35 Years | 3,597 | 15.5% |
| 35 to 44 Years | 3,372 | 14.6% |
| 45 to 54 Years | 3,997 | 17.3% |
| 55 to 64 Years | 4,409 | 19.0% |
| 65 to 74 Years | 4,273 | 18.4% |
| 75 to 84 Years | 2,283 | 9.9% |
| 85 Years and Over | 1,233 | 5.3% |
| Total | 23,164 | 100.0% |
Housing Finances in Whiteside County
Median Income by Occupancy in Whiteside County
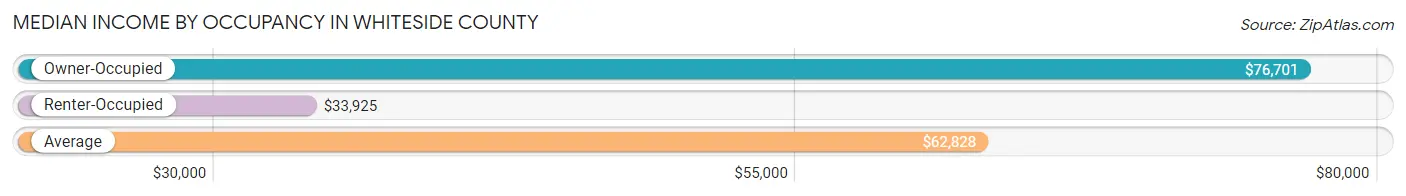
| Occupancy Type | # Households | Median Income |
| Owner-Occupied | 17,241 (74.4%) | $76,701 |
| Renter-Occupied | 5,923 (25.6%) | $33,925 |
| Average | 23,164 (100.0%) | $62,828 |
Occupancy by Householder Income Bracket in Whiteside County
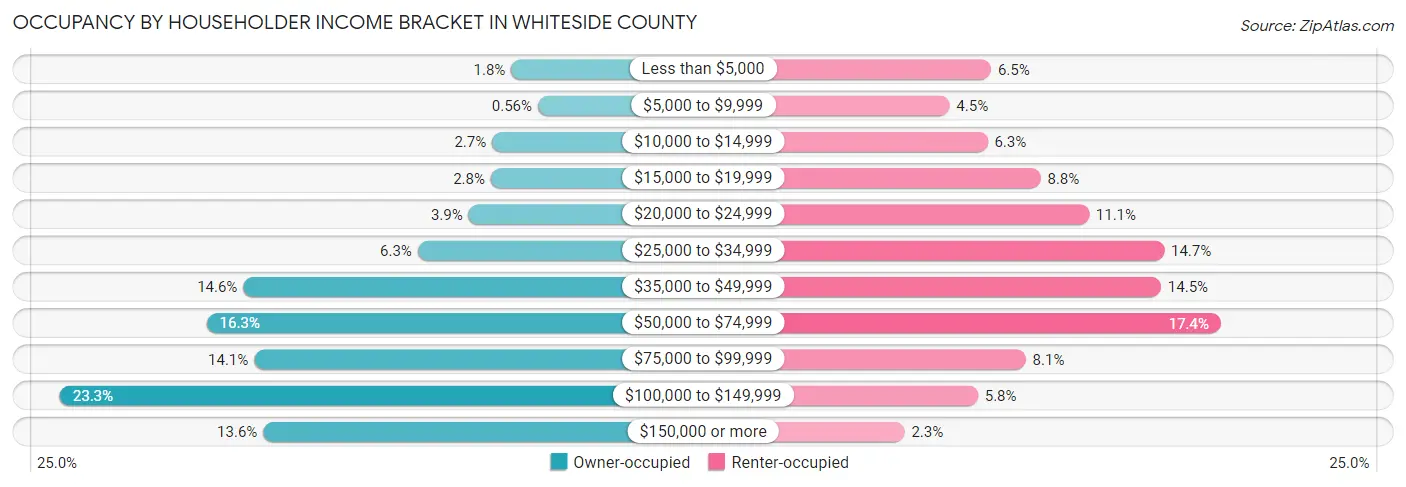
| Income Bracket | Owner-occupied | Renter-occupied |
| Less than $5,000 | 315 (1.8%) | 382 (6.5%) |
| $5,000 to $9,999 | 96 (0.6%) | 265 (4.5%) |
| $10,000 to $14,999 | 472 (2.7%) | 372 (6.3%) |
| $15,000 to $19,999 | 482 (2.8%) | 522 (8.8%) |
| $20,000 to $24,999 | 665 (3.9%) | 658 (11.1%) |
| $25,000 to $34,999 | 1,083 (6.3%) | 870 (14.7%) |
| $35,000 to $49,999 | 2,516 (14.6%) | 861 (14.5%) |
| $50,000 to $74,999 | 2,816 (16.3%) | 1,030 (17.4%) |
| $75,000 to $99,999 | 2,425 (14.1%) | 480 (8.1%) |
| $100,000 to $149,999 | 4,020 (23.3%) | 345 (5.8%) |
| $150,000 or more | 2,351 (13.6%) | 138 (2.3%) |
| Total | 17,241 (100.0%) | 5,923 (100.0%) |
Monthly Housing Cost Tiers in Whiteside County
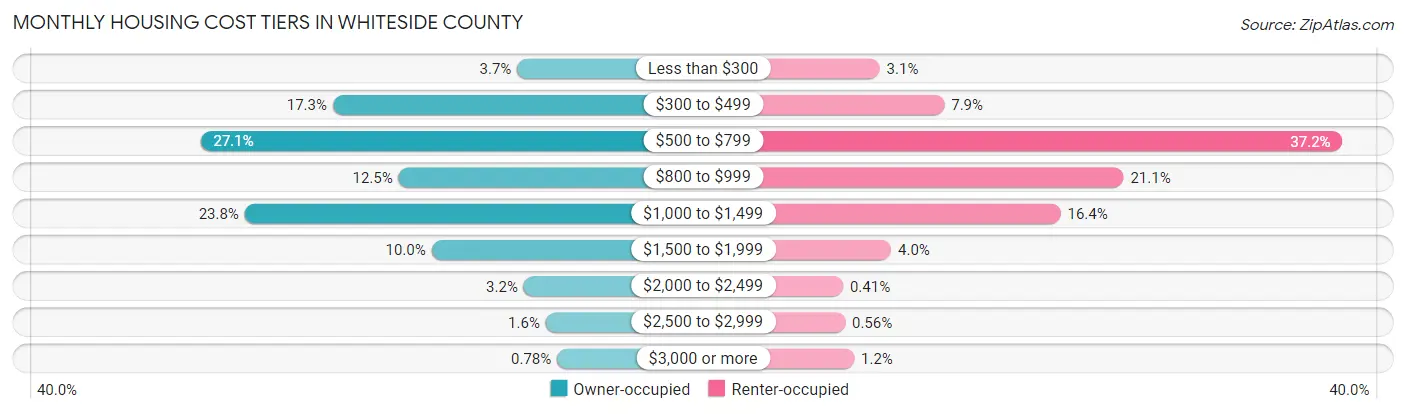
| Monthly Cost | Owner-occupied | Renter-occupied |
| Less than $300 | 642 (3.7%) | 184 (3.1%) |
| $300 to $499 | 2,982 (17.3%) | 466 (7.9%) |
| $500 to $799 | 4,665 (27.1%) | 2,203 (37.2%) |
| $800 to $999 | 2,148 (12.5%) | 1,248 (21.1%) |
| $1,000 to $1,499 | 4,102 (23.8%) | 973 (16.4%) |
| $1,500 to $1,999 | 1,729 (10.0%) | 234 (4.0%) |
| $2,000 to $2,499 | 558 (3.2%) | 24 (0.4%) |
| $2,500 to $2,999 | 280 (1.6%) | 33 (0.6%) |
| $3,000 or more | 135 (0.8%) | 73 (1.2%) |
| Total | 17,241 (100.0%) | 5,923 (100.0%) |
Physical Housing Characteristics in Whiteside County
Housing Structures in Whiteside County
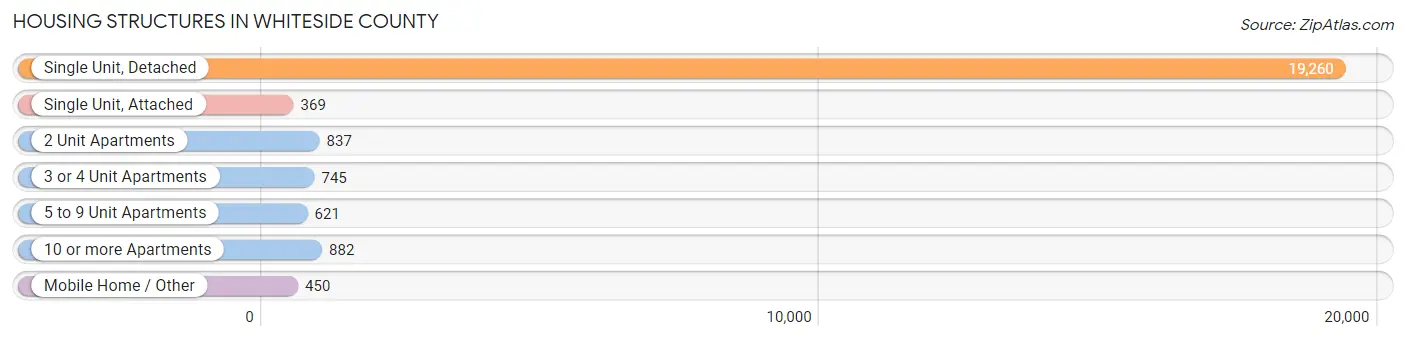
| Structure Type | # Housing Units | % Housing Units |
| Single Unit, Detached | 19,260 | 83.2% |
| Single Unit, Attached | 369 | 1.6% |
| 2 Unit Apartments | 837 | 3.6% |
| 3 or 4 Unit Apartments | 745 | 3.2% |
| 5 to 9 Unit Apartments | 621 | 2.7% |
| 10 or more Apartments | 882 | 3.8% |
| Mobile Home / Other | 450 | 1.9% |
| Total | 23,164 | 100.0% |
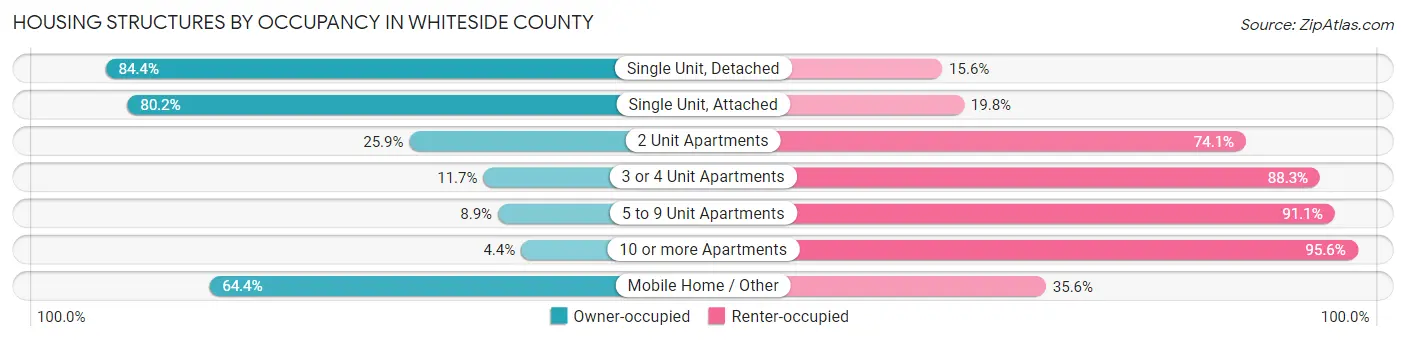
Housing Structures by Occupancy in Whiteside County
| Structure Type | Owner-occupied | Renter-occupied |
| Single Unit, Detached | 16,257 (84.4%) | 3,003 (15.6%) |
| Single Unit, Attached | 296 (80.2%) | 73 (19.8%) |
| 2 Unit Apartments | 217 (25.9%) | 620 (74.1%) |
| 3 or 4 Unit Apartments | 87 (11.7%) | 658 (88.3%) |
| 5 to 9 Unit Apartments | 55 (8.9%) | 566 (91.1%) |
| 10 or more Apartments | 39 (4.4%) | 843 (95.6%) |
| Mobile Home / Other | 290 (64.4%) | 160 (35.6%) |
| Total | 17,241 (74.4%) | 5,923 (25.6%) |
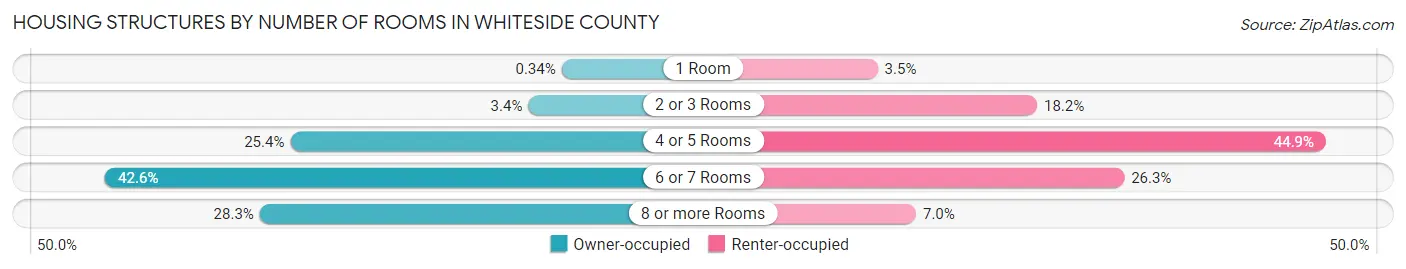
Housing Structures by Number of Rooms in Whiteside County
| Number of Rooms | Owner-occupied | Renter-occupied |
| 1 Room | 58 (0.3%) | 207 (3.5%) |
| 2 or 3 Rooms | 589 (3.4%) | 1,080 (18.2%) |
| 4 or 5 Rooms | 4,385 (25.4%) | 2,662 (44.9%) |
| 6 or 7 Rooms | 7,336 (42.5%) | 1,557 (26.3%) |
| 8 or more Rooms | 4,873 (28.3%) | 417 (7.0%) |
| Total | 17,241 (100.0%) | 5,923 (100.0%) |
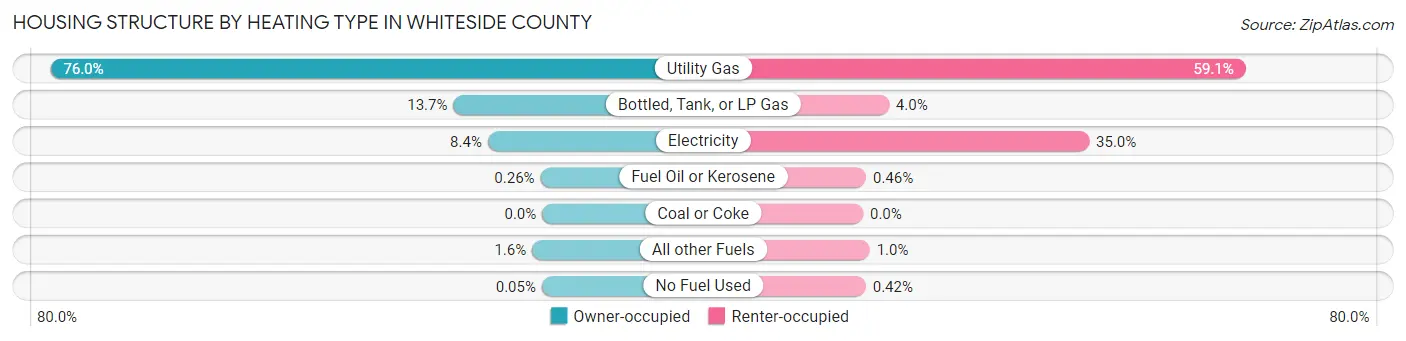
Housing Structure by Heating Type in Whiteside County
| Heating Type | Owner-occupied | Renter-occupied |
| Utility Gas | 13,105 (76.0%) | 3,503 (59.1%) |
| Bottled, Tank, or LP Gas | 2,367 (13.7%) | 237 (4.0%) |
| Electricity | 1,448 (8.4%) | 2,070 (34.9%) |
| Fuel Oil or Kerosene | 44 (0.3%) | 27 (0.5%) |
| Coal or Coke | 0 (0.0%) | 0 (0.0%) |
| All other Fuels | 268 (1.5%) | 61 (1.0%) |
| No Fuel Used | 9 (0.1%) | 25 (0.4%) |
| Total | 17,241 (100.0%) | 5,923 (100.0%) |
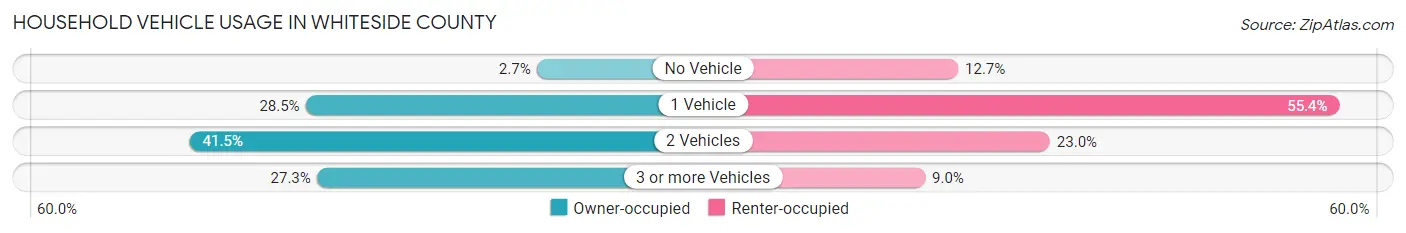
Household Vehicle Usage in Whiteside County
| Vehicles per Household | Owner-occupied | Renter-occupied |
| No Vehicle | 459 (2.7%) | 751 (12.7%) |
| 1 Vehicle | 4,921 (28.5%) | 3,280 (55.4%) |
| 2 Vehicles | 7,156 (41.5%) | 1,360 (23.0%) |
| 3 or more Vehicles | 4,705 (27.3%) | 532 (9.0%) |
| Total | 17,241 (100.0%) | 5,923 (100.0%) |
Real Estate & Mortgages in Whiteside County
Real Estate and Mortgage Overview in Whiteside County
| Characteristic | Without Mortgage | With Mortgage |
| Housing Units | 7,796 | 9,445 |
| Median Property Value | $118,000 | $127,300 |
| Median Household Income | $56,568 | $1,557 |
| Monthly Housing Costs | $530 | $128 |
| Real Estate Taxes | $2,433 | $228 |
Property Value by Mortgage Status in Whiteside County
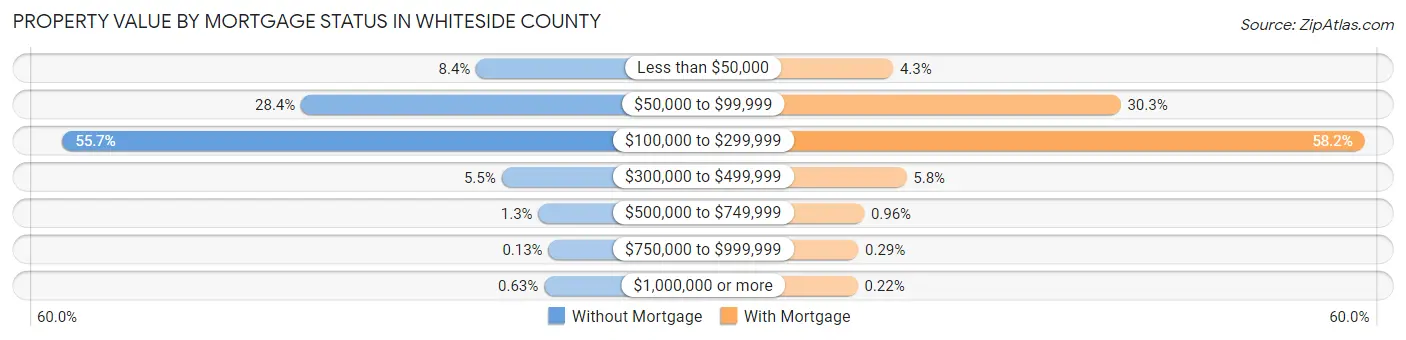
| Property Value | Without Mortgage | With Mortgage |
| Less than $50,000 | 654 (8.4%) | 404 (4.3%) |
| $50,000 to $99,999 | 2,214 (28.4%) | 2,860 (30.3%) |
| $100,000 to $299,999 | 4,341 (55.7%) | 5,493 (58.2%) |
| $300,000 to $499,999 | 428 (5.5%) | 549 (5.8%) |
| $500,000 to $749,999 | 100 (1.3%) | 91 (1.0%) |
| $750,000 to $999,999 | 10 (0.1%) | 27 (0.3%) |
| $1,000,000 or more | 49 (0.6%) | 21 (0.2%) |
| Total | 7,796 (100.0%) | 9,445 (100.0%) |
Household Income by Mortgage Status in Whiteside County
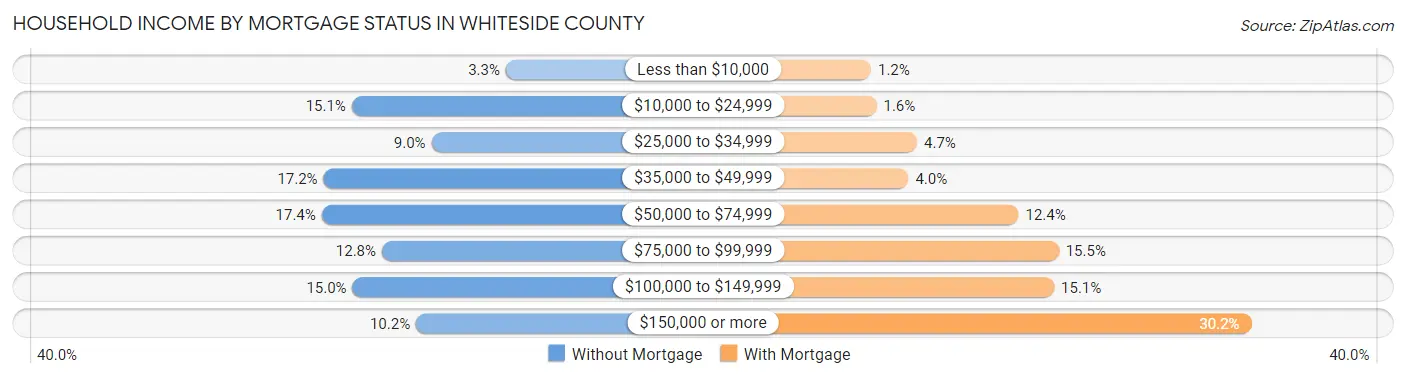
| Household Income | Without Mortgage | With Mortgage |
| Less than $10,000 | 260 (3.3%) | 111 (1.2%) |
| $10,000 to $24,999 | 1,176 (15.1%) | 151 (1.6%) |
| $25,000 to $34,999 | 702 (9.0%) | 443 (4.7%) |
| $35,000 to $49,999 | 1,343 (17.2%) | 381 (4.0%) |
| $50,000 to $74,999 | 1,354 (17.4%) | 1,173 (12.4%) |
| $75,000 to $99,999 | 996 (12.8%) | 1,462 (15.5%) |
| $100,000 to $149,999 | 1,171 (15.0%) | 1,429 (15.1%) |
| $150,000 or more | 794 (10.2%) | 2,849 (30.2%) |
| Total | 7,796 (100.0%) | 9,445 (100.0%) |
Property Value to Household Income Ratio in Whiteside County
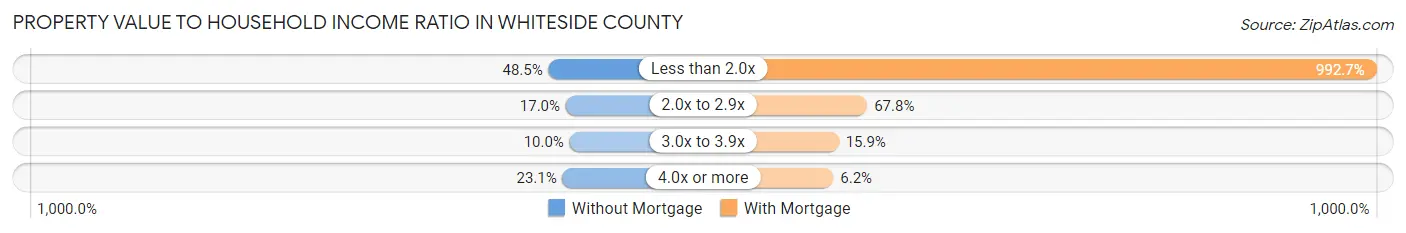
| Value-to-Income Ratio | Without Mortgage | With Mortgage |
| Less than 2.0x | 3,778 (48.5%) | 93,757 (992.7%) |
| 2.0x to 2.9x | 1,327 (17.0%) | 6,406 (67.8%) |
| 3.0x to 3.9x | 783 (10.0%) | 1,503 (15.9%) |
| 4.0x or more | 1,797 (23.1%) | 586 (6.2%) |
| Total | 7,796 (100.0%) | 9,445 (100.0%) |
Real Estate Taxes by Mortgage Status in Whiteside County
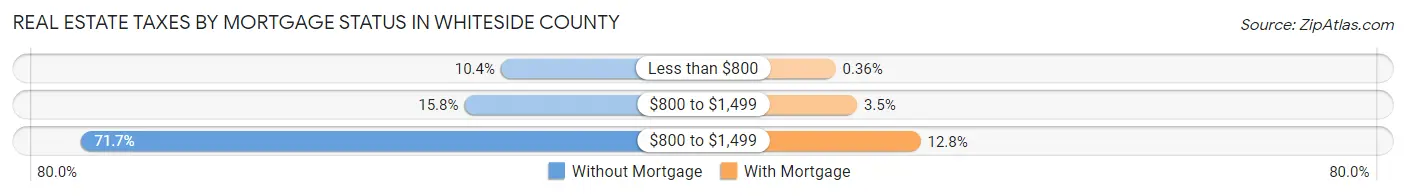
| Property Taxes | Without Mortgage | With Mortgage |
| Less than $800 | 812 (10.4%) | 34 (0.4%) |
| $800 to $1,499 | 1,228 (15.8%) | 331 (3.5%) |
| $800 to $1,499 | 5,590 (71.7%) | 1,207 (12.8%) |
| Total | 7,796 (100.0%) | 9,445 (100.0%) |
Health & Disability in Whiteside County
Health Insurance Coverage by Age in Whiteside County
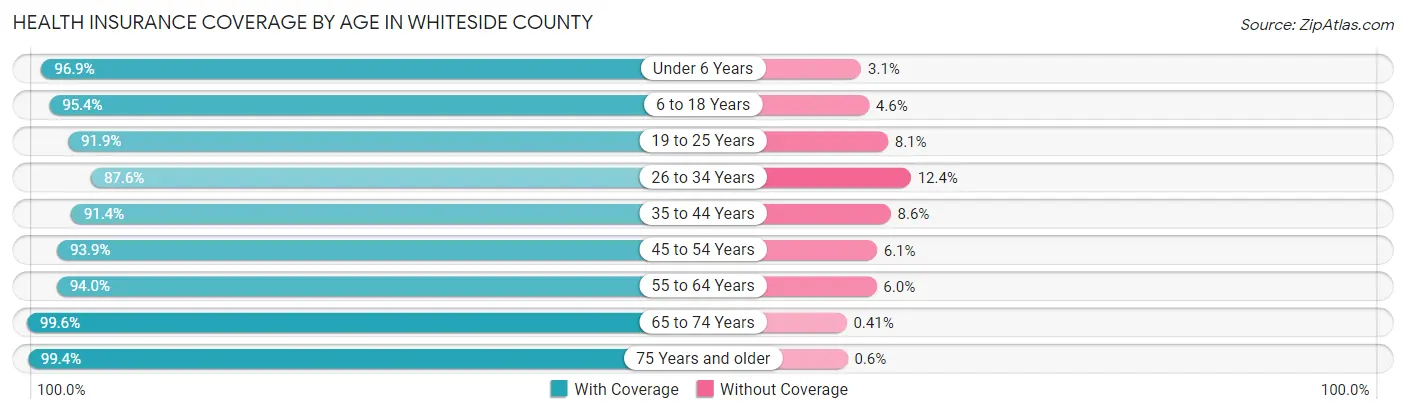
| Age Bracket | With Coverage | Without Coverage |
| Under 6 Years | 3,436 (96.9%) | 111 (3.1%) |
| 6 to 18 Years | 8,902 (95.4%) | 428 (4.6%) |
| 19 to 25 Years | 3,832 (91.9%) | 338 (8.1%) |
| 26 to 34 Years | 4,737 (87.6%) | 669 (12.4%) |
| 35 to 44 Years | 5,525 (91.4%) | 522 (8.6%) |
| 45 to 54 Years | 6,477 (93.9%) | 418 (6.1%) |
| 55 to 64 Years | 7,485 (94.0%) | 477 (6.0%) |
| 65 to 74 Years | 6,508 (99.6%) | 27 (0.4%) |
| 75 Years and older | 4,843 (99.4%) | 29 (0.6%) |
| Total | 51,745 (94.5%) | 3,019 (5.5%) |
Health Insurance Coverage by Citizenship Status in Whiteside County
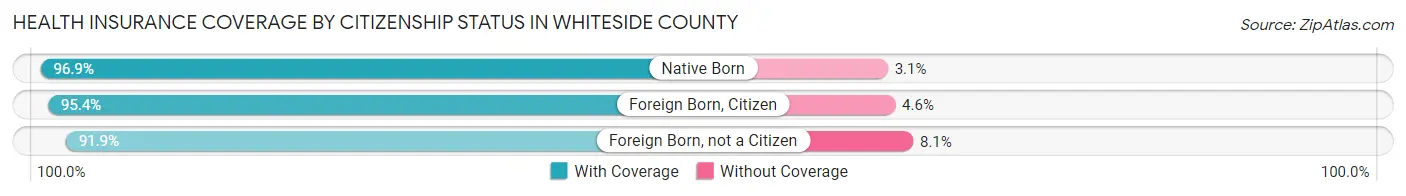
| Citizenship Status | With Coverage | Without Coverage |
| Native Born | 3,436 (96.9%) | 111 (3.1%) |
| Foreign Born, Citizen | 8,902 (95.4%) | 428 (4.6%) |
| Foreign Born, not a Citizen | 3,832 (91.9%) | 338 (8.1%) |
Health Insurance Coverage by Household Income in Whiteside County

| Household Income | With Coverage | Without Coverage |
| Under $25,000 | 6,057 (92.7%) | 478 (7.3%) |
| $25,000 to $49,999 | 9,116 (92.9%) | 695 (7.1%) |
| $50,000 to $74,999 | 8,282 (92.9%) | 634 (7.1%) |
| $75,000 to $99,999 | 7,403 (93.4%) | 520 (6.6%) |
| $100,000 and over | 20,666 (96.8%) | 692 (3.2%) |
Public vs Private Health Insurance Coverage by Age in Whiteside County
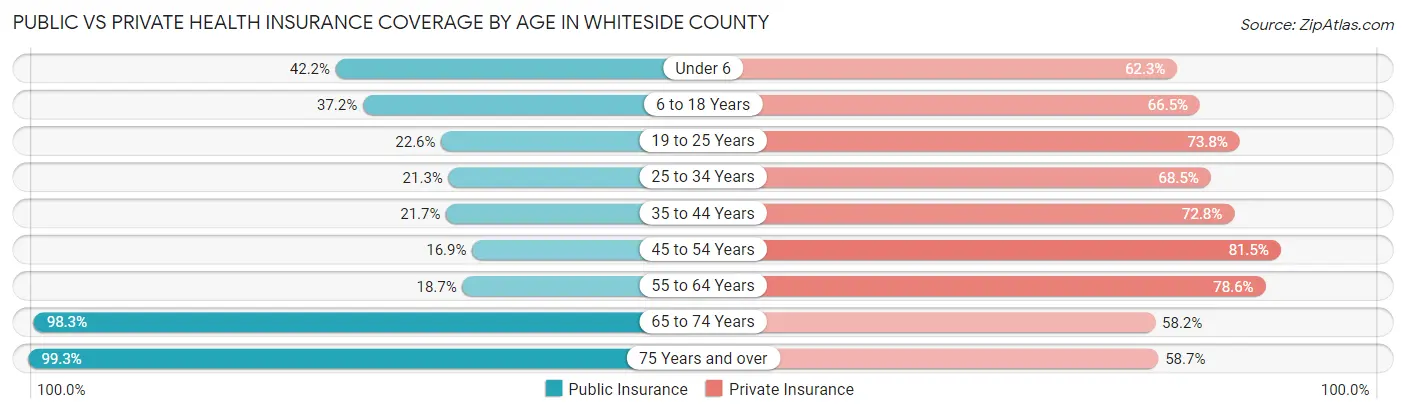
| Age Bracket | Public Insurance | Private Insurance |
| Under 6 | 1,498 (42.2%) | 2,208 (62.3%) |
| 6 to 18 Years | 3,469 (37.2%) | 6,201 (66.5%) |
| 19 to 25 Years | 944 (22.6%) | 3,079 (73.8%) |
| 25 to 34 Years | 1,151 (21.3%) | 3,701 (68.5%) |
| 35 to 44 Years | 1,314 (21.7%) | 4,403 (72.8%) |
| 45 to 54 Years | 1,165 (16.9%) | 5,617 (81.5%) |
| 55 to 64 Years | 1,490 (18.7%) | 6,260 (78.6%) |
| 65 to 74 Years | 6,423 (98.3%) | 3,800 (58.2%) |
| 75 Years and over | 4,837 (99.3%) | 2,862 (58.7%) |
| Total | 22,291 (40.7%) | 38,131 (69.6%) |
Disability Status by Sex by Age in Whiteside County
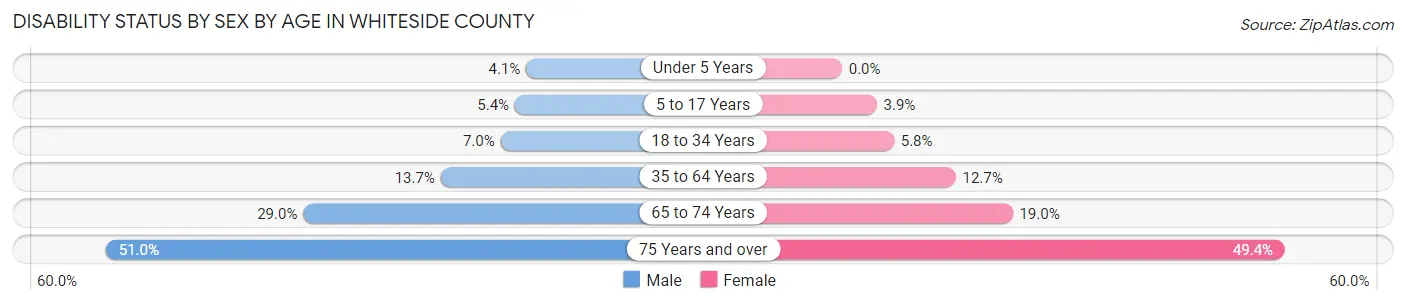
| Age Bracket | Male | Female |
| Under 5 Years | 68 (4.1%) | 0 (0.0%) |
| 5 to 17 Years | 257 (5.4%) | 171 (3.9%) |
| 18 to 34 Years | 372 (7.0%) | 288 (5.8%) |
| 35 to 64 Years | 1,436 (13.7%) | 1,317 (12.7%) |
| 65 to 74 Years | 924 (29.0%) | 636 (19.0%) |
| 75 Years and over | 1,070 (50.9%) | 1,368 (49.3%) |
Disability Class by Sex by Age in Whiteside County
Disability Class: Hearing Difficulty
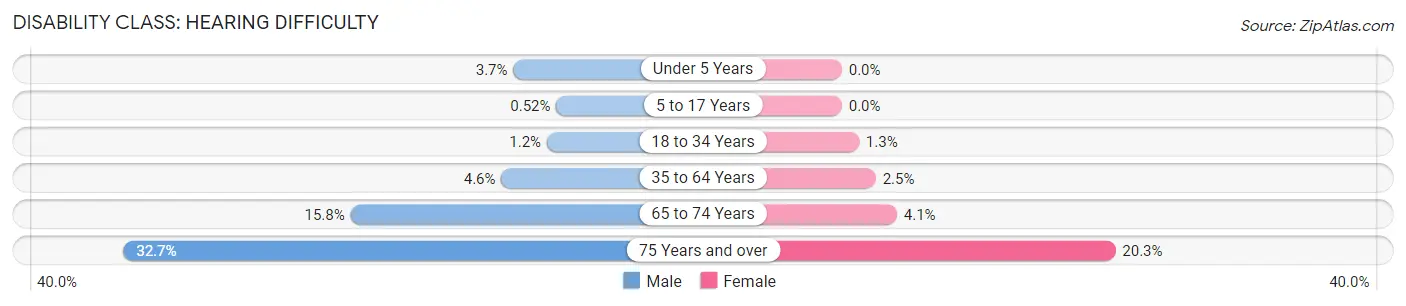
| Age Bracket | Male | Female |
| Under 5 Years | 61 (3.7%) | 0 (0.0%) |
| 5 to 17 Years | 25 (0.5%) | 0 (0.0%) |
| 18 to 34 Years | 65 (1.2%) | 63 (1.3%) |
| 35 to 64 Years | 484 (4.6%) | 262 (2.5%) |
| 65 to 74 Years | 504 (15.8%) | 137 (4.1%) |
| 75 Years and over | 686 (32.7%) | 563 (20.3%) |
Disability Class: Vision Difficulty
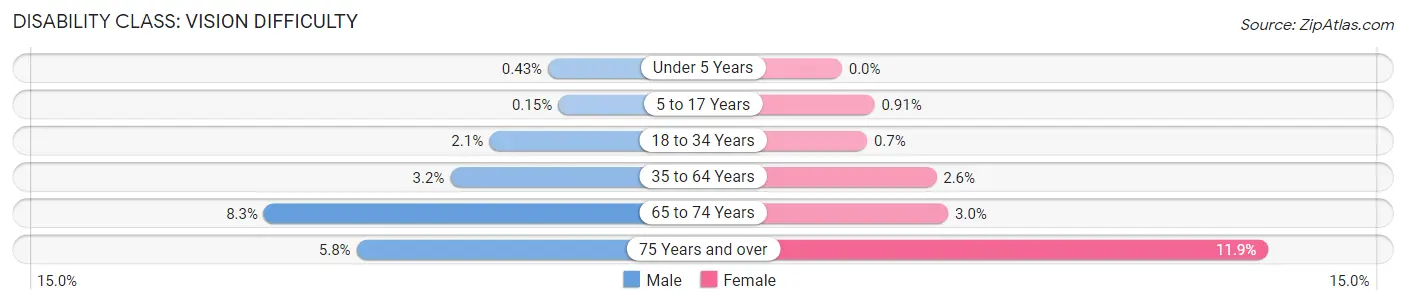
| Age Bracket | Male | Female |
| Under 5 Years | 7 (0.4%) | 0 (0.0%) |
| 5 to 17 Years | 7 (0.2%) | 40 (0.9%) |
| 18 to 34 Years | 110 (2.1%) | 35 (0.7%) |
| 35 to 64 Years | 331 (3.2%) | 273 (2.6%) |
| 65 to 74 Years | 266 (8.3%) | 99 (3.0%) |
| 75 Years and over | 121 (5.8%) | 329 (11.9%) |
Disability Class: Cognitive Difficulty
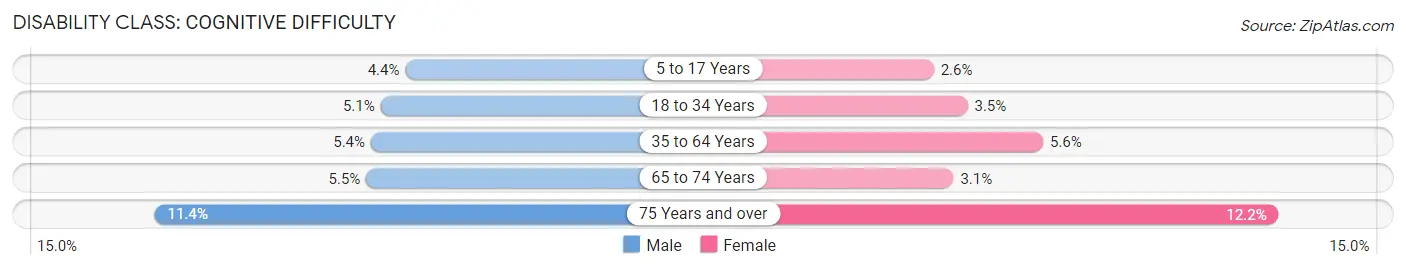
| Age Bracket | Male | Female |
| 5 to 17 Years | 210 (4.4%) | 113 (2.6%) |
| 18 to 34 Years | 271 (5.1%) | 174 (3.5%) |
| 35 to 64 Years | 563 (5.4%) | 582 (5.6%) |
| 65 to 74 Years | 175 (5.5%) | 104 (3.1%) |
| 75 Years and over | 239 (11.4%) | 337 (12.2%) |
Disability Class: Ambulatory Difficulty
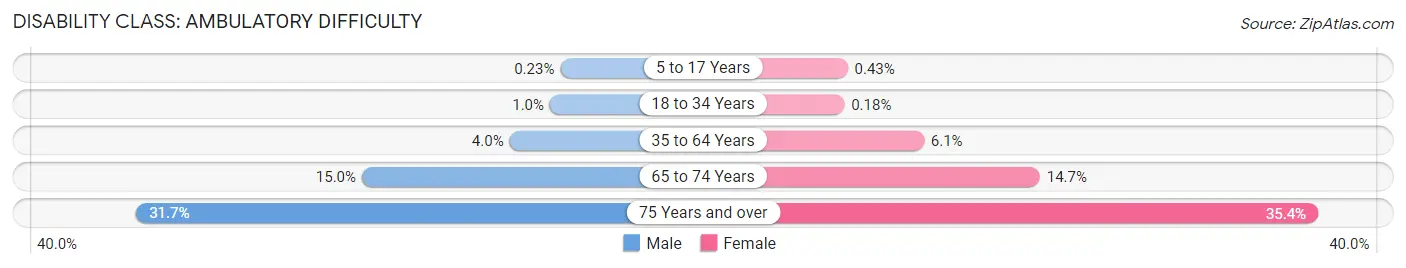
| Age Bracket | Male | Female |
| 5 to 17 Years | 11 (0.2%) | 19 (0.4%) |
| 18 to 34 Years | 53 (1.0%) | 9 (0.2%) |
| 35 to 64 Years | 420 (4.0%) | 633 (6.1%) |
| 65 to 74 Years | 477 (15.0%) | 492 (14.7%) |
| 75 Years and over | 666 (31.7%) | 980 (35.3%) |
Disability Class: Self-Care Difficulty
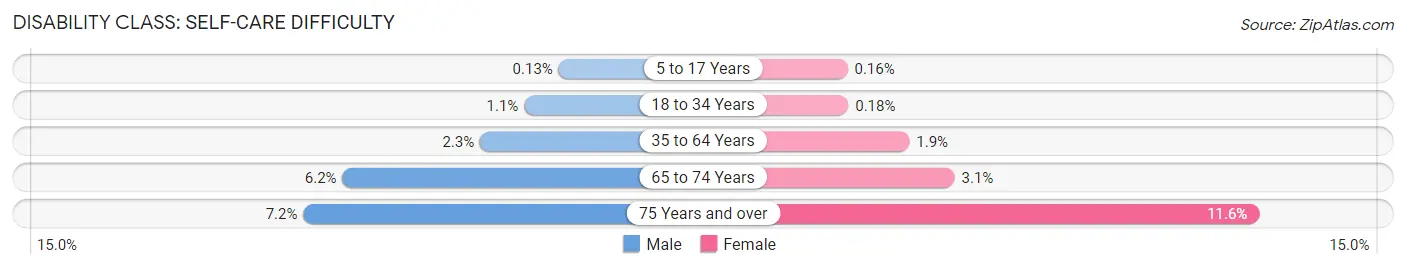
| Age Bracket | Male | Female |
| 5 to 17 Years | 6 (0.1%) | 7 (0.2%) |
| 18 to 34 Years | 58 (1.1%) | 9 (0.2%) |
| 35 to 64 Years | 244 (2.3%) | 195 (1.9%) |
| 65 to 74 Years | 196 (6.1%) | 105 (3.1%) |
| 75 Years and over | 152 (7.2%) | 322 (11.6%) |
Technology Access in Whiteside County
Computing Device Access in Whiteside County
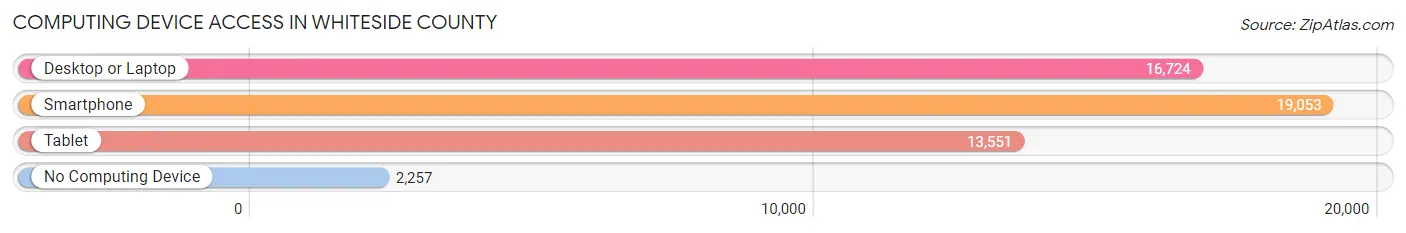
| Device Type | # Households | % Households |
| Desktop or Laptop | 16,724 | 72.2% |
| Smartphone | 19,053 | 82.3% |
| Tablet | 13,551 | 58.5% |
| No Computing Device | 2,257 | 9.7% |
| Total | 23,164 | 100.0% |
Internet Access in Whiteside County
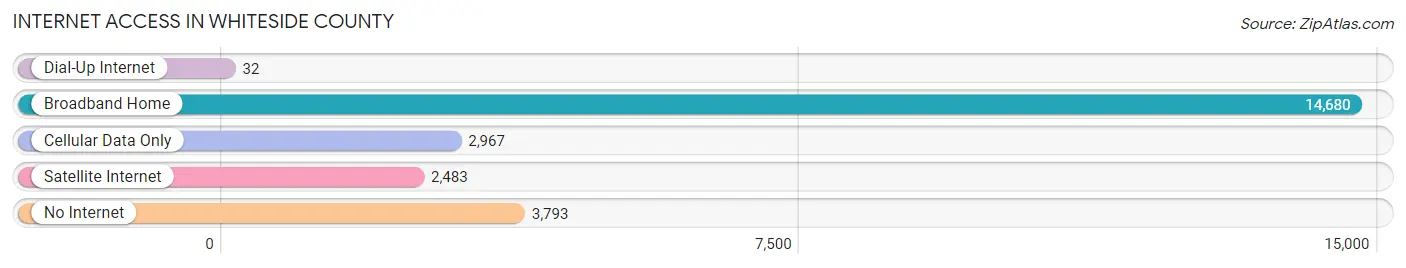
| Internet Type | # Households | % Households |
| Dial-Up Internet | 32 | 0.1% |
| Broadband Home | 14,680 | 63.4% |
| Cellular Data Only | 2,967 | 12.8% |
| Satellite Internet | 2,483 | 10.7% |
| No Internet | 3,793 | 16.4% |
| Total | 23,164 | 100.0% |
Whiteside County Summary
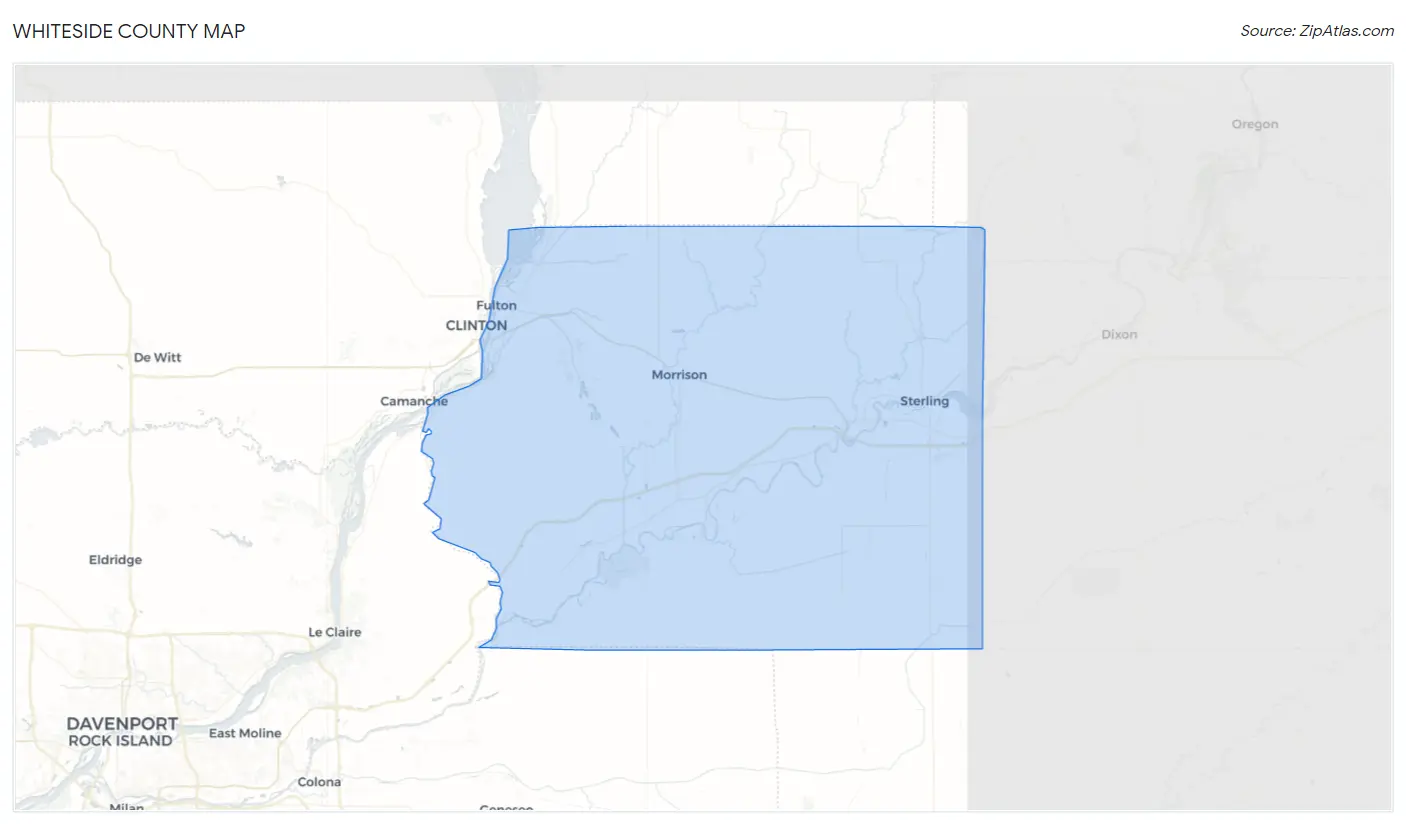
Whiteside County is located in the northwestern corner of Illinois, bordered by the Mississippi River to the west and the Rock River to the east. It is part of the Quad Cities metropolitan area, which includes the cities of Moline, East Moline, Rock Island, and Davenport, Iowa. The county seat is Morrison, and the largest city is Sterling. As of the 2010 census, the population was 58,498.
History
Whiteside County was formed in 1836 from parts of Jo Daviess and Henry counties. It was named for General Samuel Whiteside, a veteran of the War of 1812 and the Black Hawk War. The first settlers arrived in the area in the early 1830s, and the county was officially organized in 1839.
The county was largely agricultural in its early years, with the main crops being corn, wheat, and oats. The first railroad line was built in 1853, connecting the county to the rest of the state. This allowed for the development of industry, and by the late 19th century, Whiteside County was home to several factories, including a flour mill, a paper mill, and a foundry.
Geography
Whiteside County covers an area of 576 square miles, with the Mississippi River forming its western border. The Rock River forms the eastern border, and the county is also bordered by Lee, Ogle, Carroll, and Bureau counties. The terrain is mostly flat, with some rolling hills in the northern part of the county. The highest point is located in the northwest corner, at an elevation of 830 feet.
The climate is humid continental, with cold winters and hot, humid summers. The average annual temperature is 48°F, and the average annual precipitation is 36 inches.
Economy
Whiteside County’s economy is largely based on manufacturing and agriculture. The county’s largest employers are John Deere, CGH Medical Center, and the Whiteside County government. Other major employers include the Rock Falls School District, the Sterling School District, and the Morrison School District.
Agriculture is also an important part of the economy, with corn, soybeans, and wheat being the main crops. Livestock production is also important, with beef cattle, dairy cattle, and hogs being the main animals raised.
Demographics
As of the 2010 census, there were 58,498 people, 22,845 households, and 15,845 families living in the county. The population density was 101.3 people per square mile. The racial makeup of the county was 92.3% White, 2.7% African American, 0.4% Native American, 0.9% Asian, 0.1% Pacific Islander, 2.3% from other races, and 1.3% from two or more races. Hispanic or Latino of any race were 5.3% of the population.
The median income for a household in the county was $48,945, and the median income for a family was $58,945. The per capita income for the county was $22,945. About 8.3% of families and 11.2% of the population were below the poverty line, including 15.2% of those under age 18 and 6.7% of those age 65 or over.
Common Questions
What is the Total Population of Whiteside County?
Total Population of Whiteside County is 55,569.
What is the Total Male Population of Whiteside County?
Total Male Population of Whiteside County is 27,939.
What is the Total Female Population of Whiteside County?
Total Female Population of Whiteside County is 27,630.
What is the Ratio of Males per 100 Females in Whiteside County?
There are 101.12 Males per 100 Females in Whiteside County.
What is the Ratio of Females per 100 Males in Whiteside County?
There are 98.89 Females per 100 Males in Whiteside County.
What is the Median Population Age in Whiteside County?
Median Population Age in Whiteside County is 43.5 Years.
What is the Average Family Size in Whiteside County
Average Family Size in Whiteside County is 2.9 People.
What is the Average Household Size in Whiteside County
Average Household Size in Whiteside County is 2.4 People.
What is Per Capita Income in Whiteside County?
Per Capita income in Whiteside County is $35,366.
What is the Median Family Income in Whiteside County?
Median Family Income in Whiteside County is $80,546.
What is the Median Household income in Whiteside County?
Median Household Income in Whiteside County is $62,828.
What is Income or Wage Gap in Whiteside County?
Income or Wage Gap in Whiteside County is 36.8%.
Women in Whiteside County earn 63.2 cents for every dollar earned by a man.
What is Family Income Deficit in Whiteside County?
Family Income Deficit in Whiteside County is $10,728.
Families that are below poverty line in Whiteside County earn $10,728 less on average than the poverty threshold level.
What is Inequality or Gini Index in Whiteside County?
Inequality or Gini Index in Whiteside County is 0.44.
How Large is the Labor Force in Whiteside County?
There are 27,831 People in the Labor Forcein in Whiteside County.
What is the Percentage of People in the Labor Force in Whiteside County?
62.0% of People are in the Labor Force in Whiteside County.
What is the Unemployment Rate in Whiteside County?
Unemployment Rate in Whiteside County is 4.4%.