Vermilion County, IL
Vermilion County Map
Vermilion County Overview
74,113
TOTAL POPULATION
37,165
MALE POPULATION
36,948
FEMALE POPULATION
100.59
MALES / 100 FEMALES
99.42
FEMALES / 100 MALES
40.8
MEDIAN AGE
3.1
AVG FAMILY SIZE
2.4
AVG HOUSEHOLD SIZE
$28,933
PER CAPITA INCOME
$70,370
AVG FAMILY INCOME
$52,787
AVG HOUSEHOLD INCOME
34.8%
WAGE / INCOME GAP [ % ]
65.2¢/ $1
WAGE / INCOME GAP [ $ ]
$11,048
FAMILY INCOME DEFICIT
0.43
INEQUALITY / GINI INDEX
32,638
LABOR FORCE [ PEOPLE ]
55.6%
PERCENT IN LABOR FORCE
6.7%
UNEMPLOYMENT RATE
Vermilion County Area Codes
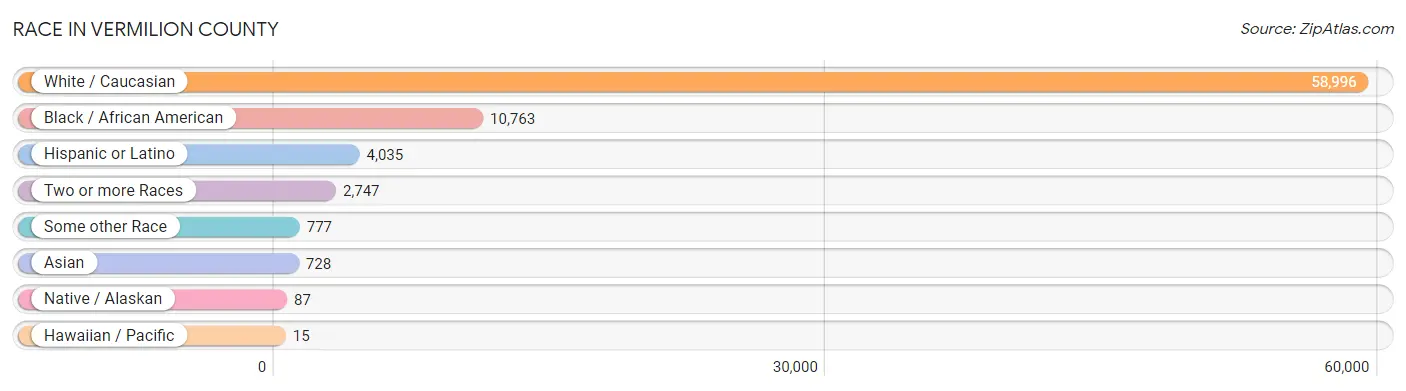
Race in Vermilion County
The most populous races in Vermilion County are White / Caucasian (58,996 | 79.6%), Black / African American (10,763 | 14.5%), and Hispanic or Latino (4,035 | 5.4%).
| Race | # Population | % Population |
| Asian | 728 | 1.0% |
| Black / African American | 10,763 | 14.5% |
| Hawaiian / Pacific | 15 | 0.0% |
| Hispanic or Latino | 4,035 | 5.4% |
| Native / Alaskan | 87 | 0.1% |
| White / Caucasian | 58,996 | 79.6% |
| Two or more Races | 2,747 | 3.7% |
| Some other Race | 777 | 1.1% |
| Total | 74,113 | 100.0% |
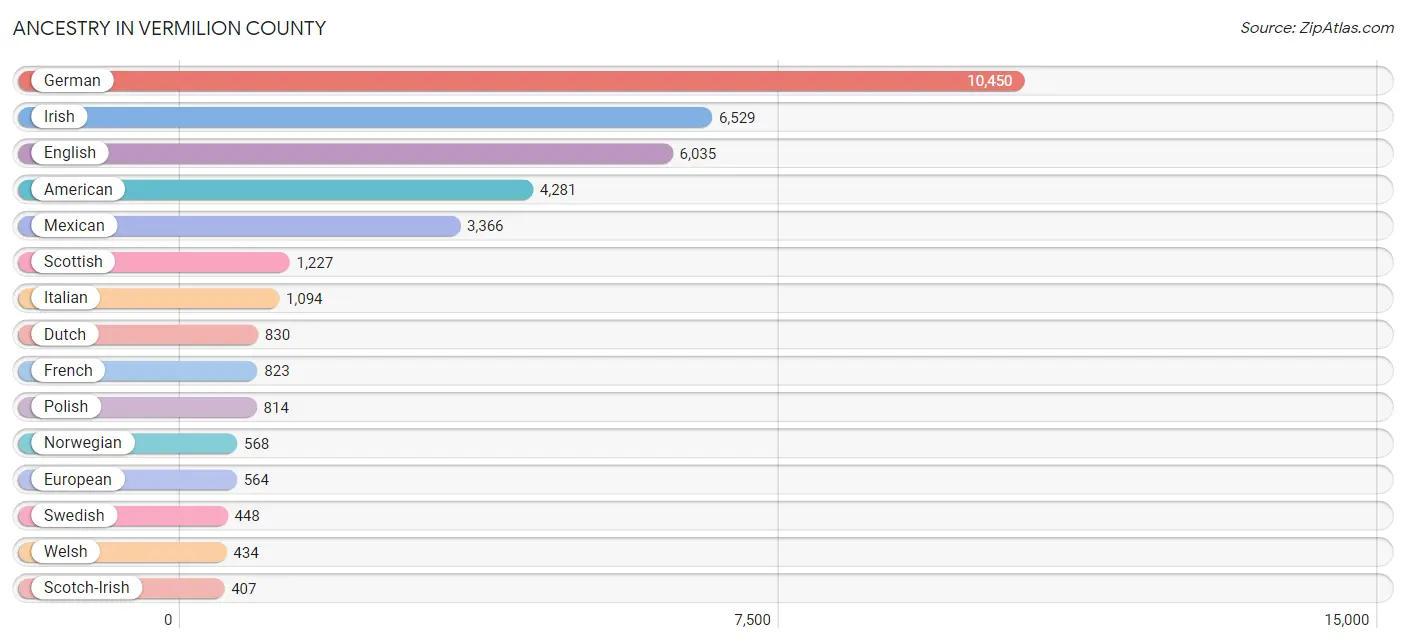
Ancestry in Vermilion County
The most populous ancestries reported in Vermilion County are German (10,450 | 14.1%), Irish (6,529 | 8.8%), English (6,035 | 8.1%), American (4,281 | 5.8%), and Mexican (3,366 | 4.5%), together accounting for 41.4% of all Vermilion County residents.
| Ancestry | # Population | % Population |
| African | 97 | 0.1% |
| Alaskan Athabascan | 3 | 0.0% |
| Albanian | 83 | 0.1% |
| American | 4,281 | 5.8% |
| Arab | 219 | 0.3% |
| Australian | 17 | 0.0% |
| Austrian | 277 | 0.4% |
| Belgian | 230 | 0.3% |
| Bhutanese | 25 | 0.0% |
| Blackfeet | 85 | 0.1% |
| British | 185 | 0.3% |
| Burmese | 67 | 0.1% |
| Cajun | 2 | 0.0% |
| Canadian | 184 | 0.3% |
| Celtic | 2 | 0.0% |
| Central American | 188 | 0.3% |
| Central American Indian | 28 | 0.0% |
| Cherokee | 101 | 0.1% |
| Chilean | 6 | 0.0% |
| Chippewa | 4 | 0.0% |
| Colombian | 6 | 0.0% |
| Croatian | 23 | 0.0% |
| Crow | 3 | 0.0% |
| Cuban | 63 | 0.1% |
| Czech | 74 | 0.1% |
| Czechoslovakian | 54 | 0.1% |
| Danish | 305 | 0.4% |
| Dominican | 13 | 0.0% |
| Dutch | 830 | 1.1% |
| Eastern European | 54 | 0.1% |
| Egyptian | 7 | 0.0% |
| English | 6,035 | 8.1% |
| European | 564 | 0.8% |
| Filipino | 3 | 0.0% |
| Finnish | 26 | 0.0% |
| French | 823 | 1.1% |
| French Canadian | 164 | 0.2% |
| German | 10,450 | 14.1% |
| Greek | 60 | 0.1% |
| Guatemalan | 158 | 0.2% |
| Hungarian | 71 | 0.1% |
| Indian (Asian) | 216 | 0.3% |
| Irish | 6,529 | 8.8% |
| Italian | 1,094 | 1.5% |
| Japanese | 80 | 0.1% |
| Korean | 77 | 0.1% |
| Laotian | 35 | 0.1% |
| Lithuanian | 316 | 0.4% |
| Mexican | 3,366 | 4.5% |
| Mexican American Indian | 8 | 0.0% |
| Mongolian | 2 | 0.0% |
| Moroccan | 1 | 0.0% |
| Native Hawaiian | 25 | 0.0% |
| Nigerian | 14 | 0.0% |
| Northern European | 29 | 0.0% |
| Norwegian | 568 | 0.8% |
| Palestinian | 141 | 0.2% |
| Panamanian | 30 | 0.0% |
| Pennsylvania German | 9 | 0.0% |
| Peruvian | 6 | 0.0% |
| Polish | 814 | 1.1% |
| Portuguese | 14 | 0.0% |
| Puerto Rican | 198 | 0.3% |
| Russian | 56 | 0.1% |
| Samoan | 18 | 0.0% |
| Scandinavian | 237 | 0.3% |
| Scotch-Irish | 407 | 0.5% |
| Scottish | 1,227 | 1.7% |
| Sioux | 35 | 0.1% |
| Slavic | 15 | 0.0% |
| Slovak | 94 | 0.1% |
| Slovene | 2 | 0.0% |
| South American | 25 | 0.0% |
| Spaniard | 4 | 0.0% |
| Spanish | 118 | 0.2% |
| Sri Lankan | 104 | 0.1% |
| Subsaharan African | 111 | 0.2% |
| Swedish | 448 | 0.6% |
| Swiss | 46 | 0.1% |
| Syrian | 50 | 0.1% |
| Thai | 326 | 0.4% |
| Tohono O'Odham | 2 | 0.0% |
| Ukrainian | 54 | 0.1% |
| Venezuelan | 7 | 0.0% |
| Welsh | 434 | 0.6% |
| Yugoslavian | 11 | 0.0% | View All 86 Rows |
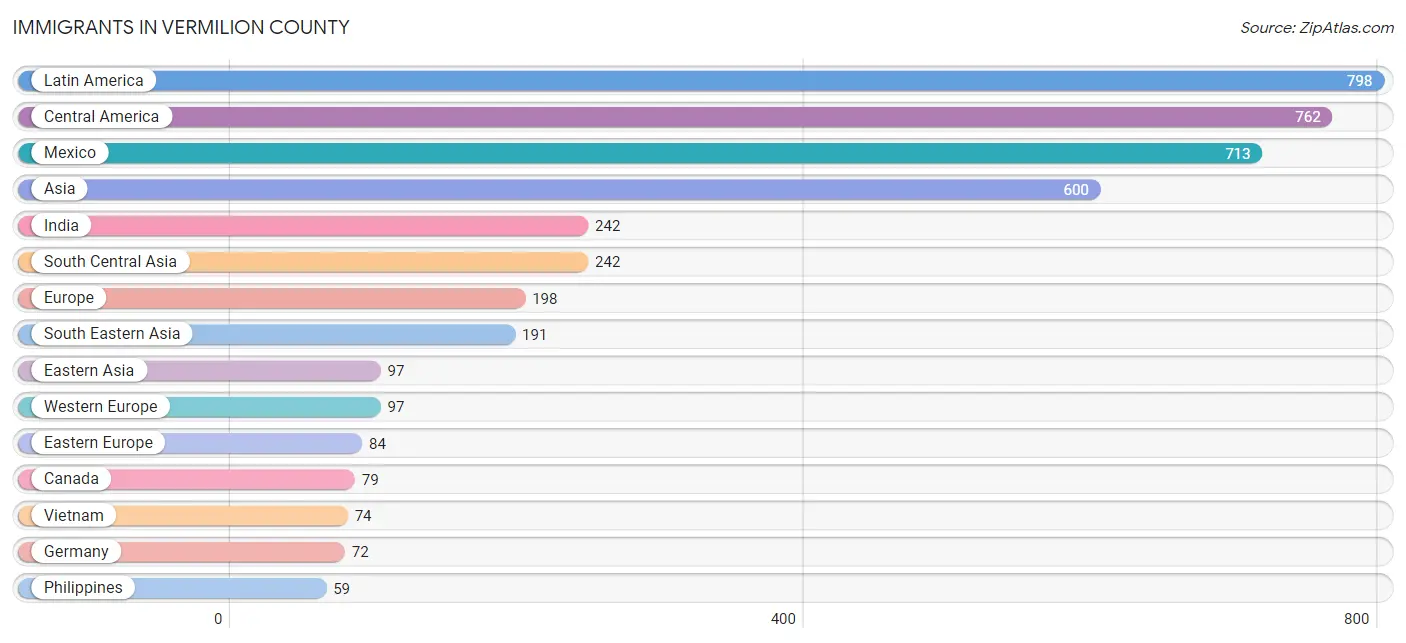
Immigrants in Vermilion County
The most numerous immigrant groups reported in Vermilion County came from Latin America (798 | 1.1%), Central America (762 | 1.0%), Mexico (713 | 1.0%), Asia (600 | 0.8%), and India (242 | 0.3%), together accounting for 4.2% of all Vermilion County residents.
| Immigration Origin | # Population | % Population |
| Africa | 33 | 0.0% |
| Asia | 600 | 0.8% |
| Australia | 7 | 0.0% |
| Austria | 11 | 0.0% |
| Belgium | 14 | 0.0% |
| Cambodia | 50 | 0.1% |
| Canada | 79 | 0.1% |
| Caribbean | 24 | 0.0% |
| Central America | 762 | 1.0% |
| Chile | 6 | 0.0% |
| China | 51 | 0.1% |
| Cuba | 13 | 0.0% |
| Czechoslovakia | 10 | 0.0% |
| Eastern Asia | 97 | 0.1% |
| Eastern Europe | 84 | 0.1% |
| Egypt | 7 | 0.0% |
| Europe | 198 | 0.3% |
| Germany | 72 | 0.1% |
| Guatemala | 49 | 0.1% |
| India | 242 | 0.3% |
| Ireland | 10 | 0.0% |
| Japan | 8 | 0.0% |
| Korea | 38 | 0.1% |
| Latin America | 798 | 1.1% |
| Mexico | 713 | 1.0% |
| Middle Africa | 7 | 0.0% |
| Nigeria | 8 | 0.0% |
| North Macedonia | 56 | 0.1% |
| Northern Africa | 7 | 0.0% |
| Northern Europe | 17 | 0.0% |
| Oceania | 7 | 0.0% |
| Peru | 6 | 0.0% |
| Philippines | 59 | 0.1% |
| Russia | 5 | 0.0% |
| Scotland | 1 | 0.0% |
| Singapore | 8 | 0.0% |
| South America | 12 | 0.0% |
| South Central Asia | 242 | 0.3% |
| South Eastern Asia | 191 | 0.3% |
| Taiwan | 1 | 0.0% |
| Vietnam | 74 | 0.1% |
| Western Africa | 8 | 0.0% |
| Western Asia | 20 | 0.0% |
| Western Europe | 97 | 0.1% |
| Yemen | 20 | 0.0% |
| Zaire | 7 | 0.0% | View All 46 Rows |
Sex and Age in Vermilion County
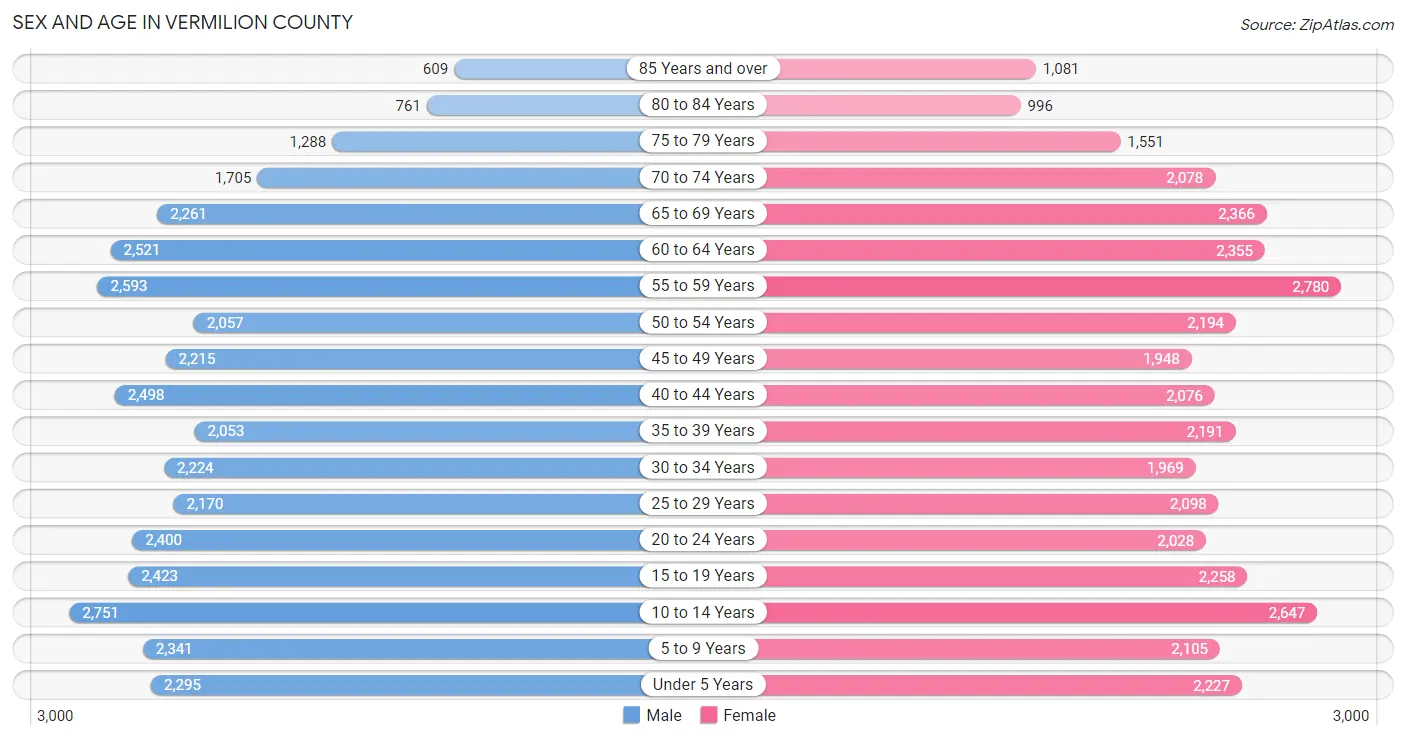
Sex and Age in Vermilion County
The most populous age groups in Vermilion County are 10 to 14 Years (2,751 | 7.4%) for men and 55 to 59 Years (2,780 | 7.5%) for women.
| Age Bracket | Male | Female |
| Under 5 Years | 2,295 (6.2%) | 2,227 (6.0%) |
| 5 to 9 Years | 2,341 (6.3%) | 2,105 (5.7%) |
| 10 to 14 Years | 2,751 (7.4%) | 2,647 (7.2%) |
| 15 to 19 Years | 2,423 (6.5%) | 2,258 (6.1%) |
| 20 to 24 Years | 2,400 (6.5%) | 2,028 (5.5%) |
| 25 to 29 Years | 2,170 (5.8%) | 2,098 (5.7%) |
| 30 to 34 Years | 2,224 (6.0%) | 1,969 (5.3%) |
| 35 to 39 Years | 2,053 (5.5%) | 2,191 (5.9%) |
| 40 to 44 Years | 2,498 (6.7%) | 2,076 (5.6%) |
| 45 to 49 Years | 2,215 (6.0%) | 1,948 (5.3%) |
| 50 to 54 Years | 2,057 (5.5%) | 2,194 (5.9%) |
| 55 to 59 Years | 2,593 (7.0%) | 2,780 (7.5%) |
| 60 to 64 Years | 2,521 (6.8%) | 2,355 (6.4%) |
| 65 to 69 Years | 2,261 (6.1%) | 2,366 (6.4%) |
| 70 to 74 Years | 1,705 (4.6%) | 2,078 (5.6%) |
| 75 to 79 Years | 1,288 (3.5%) | 1,551 (4.2%) |
| 80 to 84 Years | 761 (2.1%) | 996 (2.7%) |
| 85 Years and over | 609 (1.6%) | 1,081 (2.9%) |
| Total | 37,165 (100.0%) | 36,948 (100.0%) |
Families and Households in Vermilion County
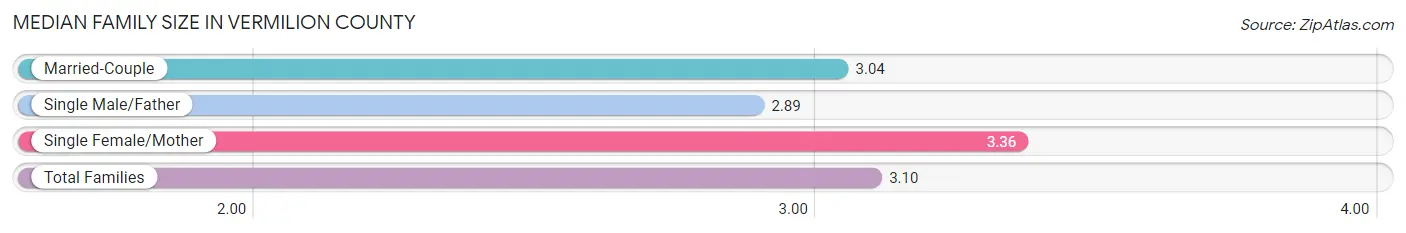
Median Family Size in Vermilion County
The median family size in Vermilion County is 3.10 persons per family, with single female/mother families (3,964 | 22.2%) accounting for the largest median family size of 3.36 persons per family. On the other hand, single male/father families (1,587 | 8.9%) represent the smallest median family size with 2.89 persons per family.
| Family Type | # Families | Family Size |
| Married-Couple | 12,334 (69.0%) | 3.04 |
| Single Male/Father | 1,587 (8.9%) | 2.89 |
| Single Female/Mother | 3,964 (22.2%) | 3.36 |
| Total Families | 17,885 (100.0%) | 3.10 |
Median Household Size in Vermilion County
The median household size in Vermilion County is 2.39 persons per household, with single female/mother households (3,964 | 13.3%) accounting for the largest median household size of 3.55 persons per household. non-family households (12,019 | 40.2%) represent the smallest median household size with 1.19 persons per household.

| Household Type | # Households | Household Size |
| Married-Couple | 12,334 (41.2%) | 3.08 |
| Single Male/Father | 1,587 (5.3%) | 3.28 |
| Single Female/Mother | 3,964 (13.3%) | 3.55 |
| Non-family | 12,019 (40.2%) | 1.19 |
| Total Households | 29,904 (100.0%) | 2.39 |
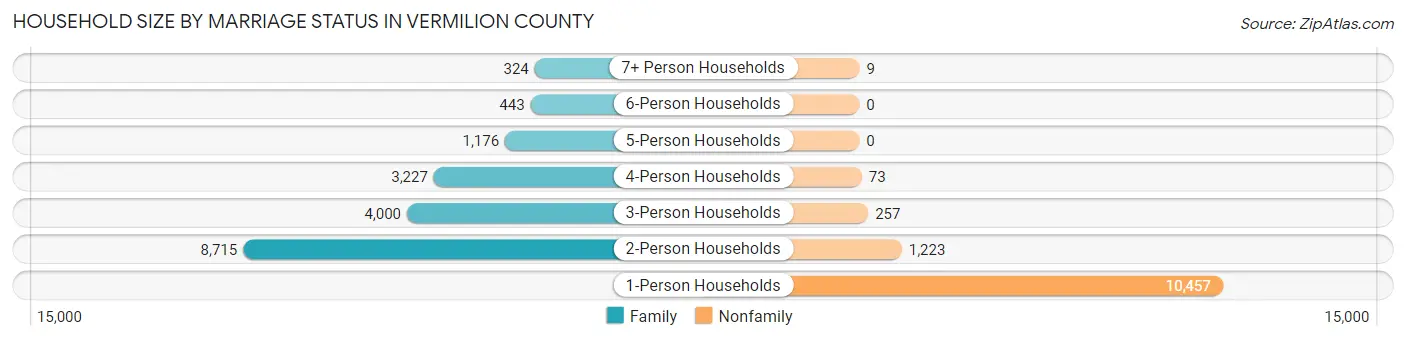
Household Size by Marriage Status in Vermilion County
Out of a total of 29,904 households in Vermilion County, 17,885 (59.8%) are family households, while 12,019 (40.2%) are nonfamily households. The most numerous type of family households are 2-person households, comprising 8,715, and the most common type of nonfamily households are 1-person households, comprising 10,457.
| Household Size | Family Households | Nonfamily Households |
| 1-Person Households | - | 10,457 (35.0%) |
| 2-Person Households | 8,715 (29.1%) | 1,223 (4.1%) |
| 3-Person Households | 4,000 (13.4%) | 257 (0.9%) |
| 4-Person Households | 3,227 (10.8%) | 73 (0.2%) |
| 5-Person Households | 1,176 (3.9%) | 0 (0.0%) |
| 6-Person Households | 443 (1.5%) | 0 (0.0%) |
| 7+ Person Households | 324 (1.1%) | 9 (0.0%) |
| Total | 17,885 (59.8%) | 12,019 (40.2%) |
Female Fertility in Vermilion County
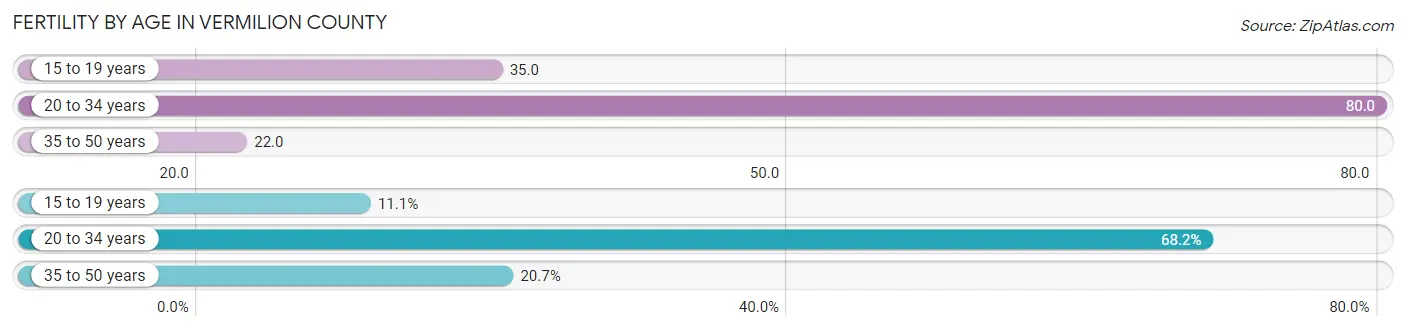
Fertility by Age in Vermilion County
Average fertility rate in Vermilion County is 47.0 births per 1,000 women. Women in the age bracket of 20 to 34 years have the highest fertility rate with 80.0 births per 1,000 women. Women in the age bracket of 20 to 34 years acount for 68.2% of all women with births.
| Age Bracket | Women with Births | Births / 1,000 Women |
| 15 to 19 years | 79 (11.1%) | 35.0 |
| 20 to 34 years | 487 (68.2%) | 80.0 |
| 35 to 50 years | 148 (20.7%) | 22.0 |
| Total | 714 (100.0%) | 47.0 |
Fertility by Age by Marriage Status in Vermilion County
28.3% of women with births (714) in Vermilion County are married. The highest percentage of unmarried women with births falls into 15 to 19 years age bracket with 100.0% of them unmarried at the time of birth, while the lowest percentage of unmarried women with births belong to 35 to 50 years age bracket with 36.5% of them unmarried.
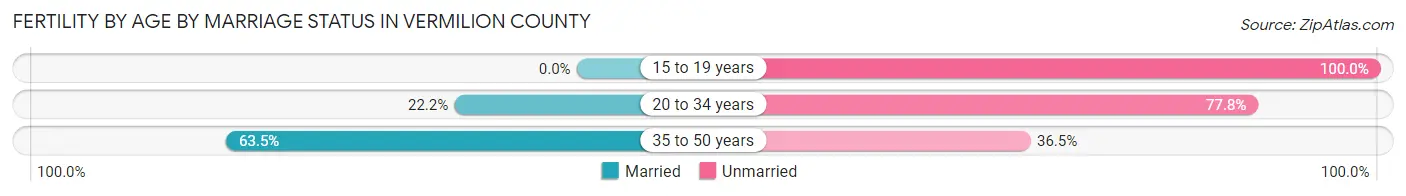
| Age Bracket | Married | Unmarried |
| 15 to 19 years | 0 (0.0%) | 79 (100.0%) |
| 20 to 34 years | 108 (22.2%) | 379 (77.8%) |
| 35 to 50 years | 94 (63.5%) | 54 (36.5%) |
| Total | 202 (28.3%) | 512 (71.7%) |
Fertility by Education in Vermilion County
Average fertility rate in Vermilion County is 47.0 births per 1,000 women. Women with the education attainment of graduate degree have the highest fertility rate of 67.0 births per 1,000 women, while women with the education attainment of bachelor's degree have the lowest fertility at 13.0 births per 1,000 women. Women with the education attainment of high school diploma represent 45.1% of all women with births.
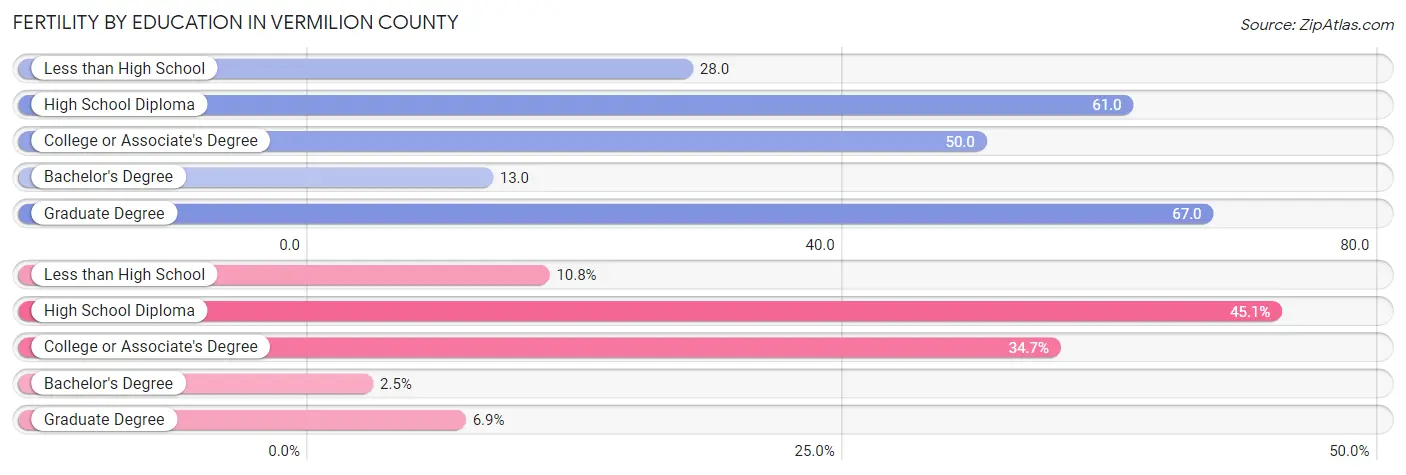
| Educational Attainment | Women with Births | Births / 1,000 Women |
| Less than High School | 77 (10.8%) | 28.0 |
| High School Diploma | 322 (45.1%) | 61.0 |
| College or Associate's Degree | 248 (34.7%) | 50.0 |
| Bachelor's Degree | 18 (2.5%) | 13.0 |
| Graduate Degree | 49 (6.9%) | 67.0 |
| Total | 714 (100.0%) | 47.0 |
Fertility by Education by Marriage Status in Vermilion County
71.7% of women with births in Vermilion County are unmarried. Women with the educational attainment of bachelor's degree are most likely to be married with 100.0% of them married at childbirth, while women with the educational attainment of high school diploma are least likely to be married with 92.9% of them unmarried at childbirth.
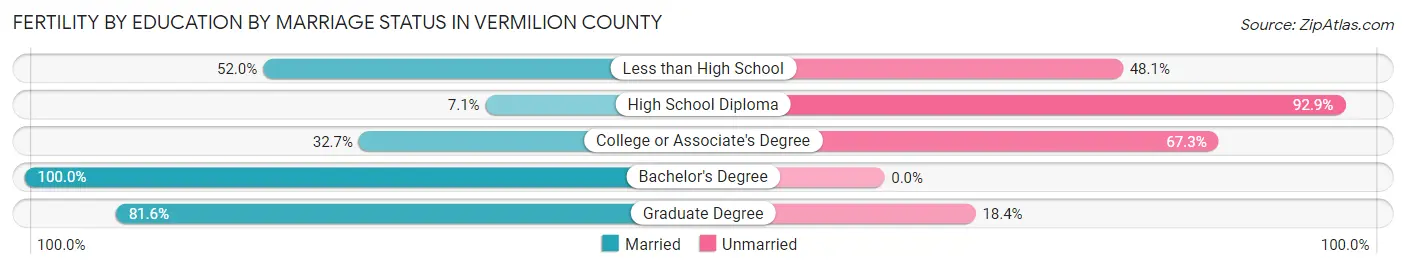
| Educational Attainment | Married | Unmarried |
| Less than High School | 40 (51.9%) | 37 (48.0%) |
| High School Diploma | 23 (7.1%) | 299 (92.9%) |
| College or Associate's Degree | 81 (32.7%) | 167 (67.3%) |
| Bachelor's Degree | 18 (100.0%) | 0 (0.0%) |
| Graduate Degree | 40 (81.6%) | 9 (18.4%) |
| Total | 202 (28.3%) | 512 (71.7%) |
Income in Vermilion County
Income Overview in Vermilion County
Per Capita Income in Vermilion County is $28,933, while median incomes of families and households are $70,370 and $52,787 respectively.
| Characteristic | Number | Measure |
| Per Capita Income | 74,113 | $28,933 |
| Median Family Income | 17,885 | $70,370 |
| Mean Family Income | 17,885 | $83,560 |
| Median Household Income | 29,904 | $52,787 |
| Mean Household Income | 29,904 | $69,249 |
| Income Deficit | 17,885 | $11,048 |
| Wage / Income Gap (%) | 74,113 | 34.81% |
| Wage / Income Gap ($) | 74,113 | 65.19¢ per $1 |
| Gini / Inequality Index | 74,113 | 0.43 |
Earnings by Sex in Vermilion County
Average Earnings in Vermilion County are $37,290, $46,000 for men and $29,988 for women, a difference of 34.8%.
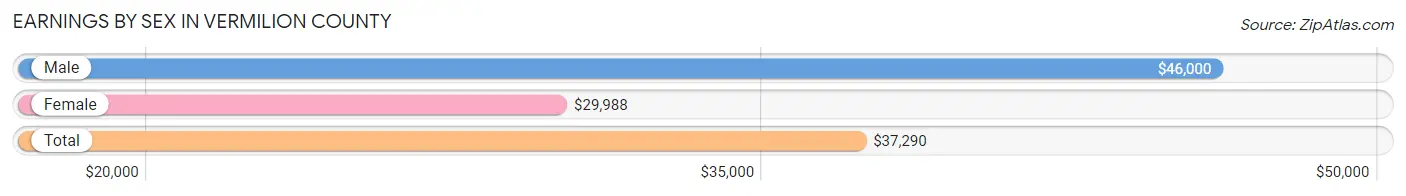
| Sex | Number | Average Earnings |
| Male | 17,423 (52.2%) | $46,000 |
| Female | 15,952 (47.8%) | $29,988 |
| Total | 33,375 (100.0%) | $37,290 |
Earnings by Sex by Income Bracket in Vermilion County
The most common earnings brackets in Vermilion County are $75,000 to $99,999 for men (1,987 | 11.4%) and $25,000 to $29,999 for women (1,545 | 9.7%).
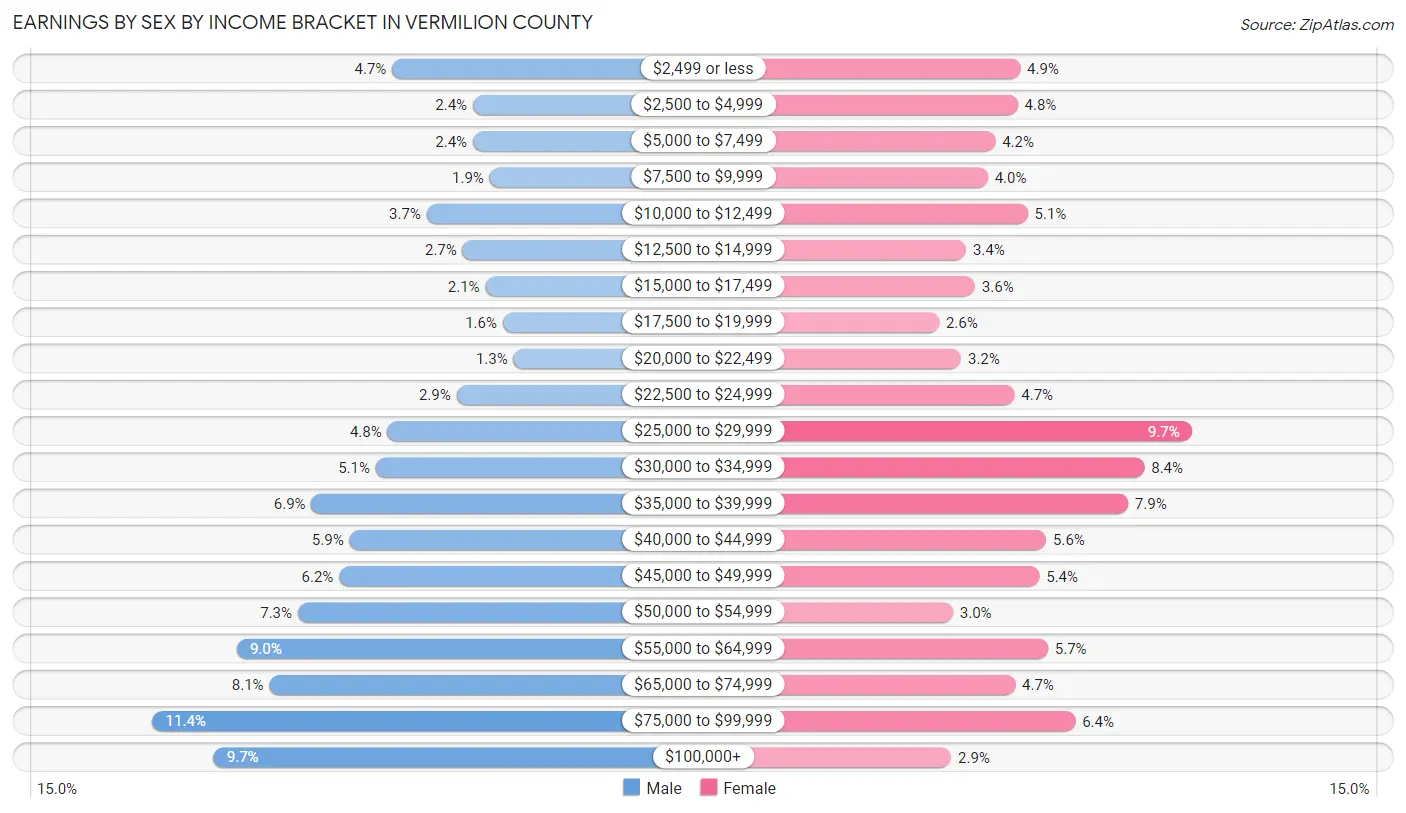
| Income | Male | Female |
| $2,499 or less | 814 (4.7%) | 777 (4.9%) |
| $2,500 to $4,999 | 419 (2.4%) | 765 (4.8%) |
| $5,000 to $7,499 | 418 (2.4%) | 665 (4.2%) |
| $7,500 to $9,999 | 337 (1.9%) | 631 (4.0%) |
| $10,000 to $12,499 | 645 (3.7%) | 811 (5.1%) |
| $12,500 to $14,999 | 469 (2.7%) | 535 (3.4%) |
| $15,000 to $17,499 | 358 (2.1%) | 574 (3.6%) |
| $17,500 to $19,999 | 272 (1.6%) | 413 (2.6%) |
| $20,000 to $22,499 | 219 (1.3%) | 512 (3.2%) |
| $22,500 to $24,999 | 499 (2.9%) | 752 (4.7%) |
| $25,000 to $29,999 | 837 (4.8%) | 1,545 (9.7%) |
| $30,000 to $34,999 | 893 (5.1%) | 1,333 (8.4%) |
| $35,000 to $39,999 | 1,210 (6.9%) | 1,261 (7.9%) |
| $40,000 to $44,999 | 1,022 (5.9%) | 893 (5.6%) |
| $45,000 to $49,999 | 1,074 (6.2%) | 863 (5.4%) |
| $50,000 to $54,999 | 1,275 (7.3%) | 476 (3.0%) |
| $55,000 to $64,999 | 1,574 (9.0%) | 901 (5.7%) |
| $65,000 to $74,999 | 1,414 (8.1%) | 754 (4.7%) |
| $75,000 to $99,999 | 1,987 (11.4%) | 1,024 (6.4%) |
| $100,000+ | 1,687 (9.7%) | 467 (2.9%) |
| Total | 17,423 (100.0%) | 15,952 (100.0%) |
Earnings by Sex by Educational Attainment in Vermilion County
Average earnings in Vermilion County are $50,588 for men and $33,461 for women, a difference of 33.9%. Men with an educational attainment of graduate degree enjoy the highest average annual earnings of $74,844, while those with high school diploma education earn the least with $41,789. Women with an educational attainment of graduate degree earn the most with the average annual earnings of $57,545, while those with less than high school education have the smallest earnings of $25,563.
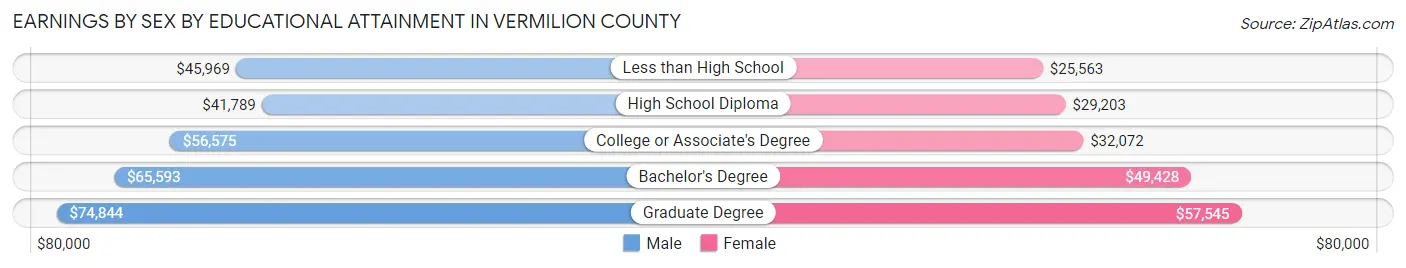
| Educational Attainment | Male Income | Female Income |
| Less than High School | $45,969 | $25,563 |
| High School Diploma | $41,789 | $29,203 |
| College or Associate's Degree | $56,575 | $32,072 |
| Bachelor's Degree | $65,593 | $49,428 |
| Graduate Degree | $74,844 | $57,545 |
| Total | $50,588 | $33,461 |
Family Income in Vermilion County
Family Income Brackets in Vermilion County
According to the Vermilion County family income data, there are 3,684 families falling into the $100,000 to $149,999 income range, which is the most common income bracket and makes up 20.6% of all families. Conversely, the $10,000 to $14,999 income bracket is the least frequent group with only 501 families (2.8%) belonging to this category.
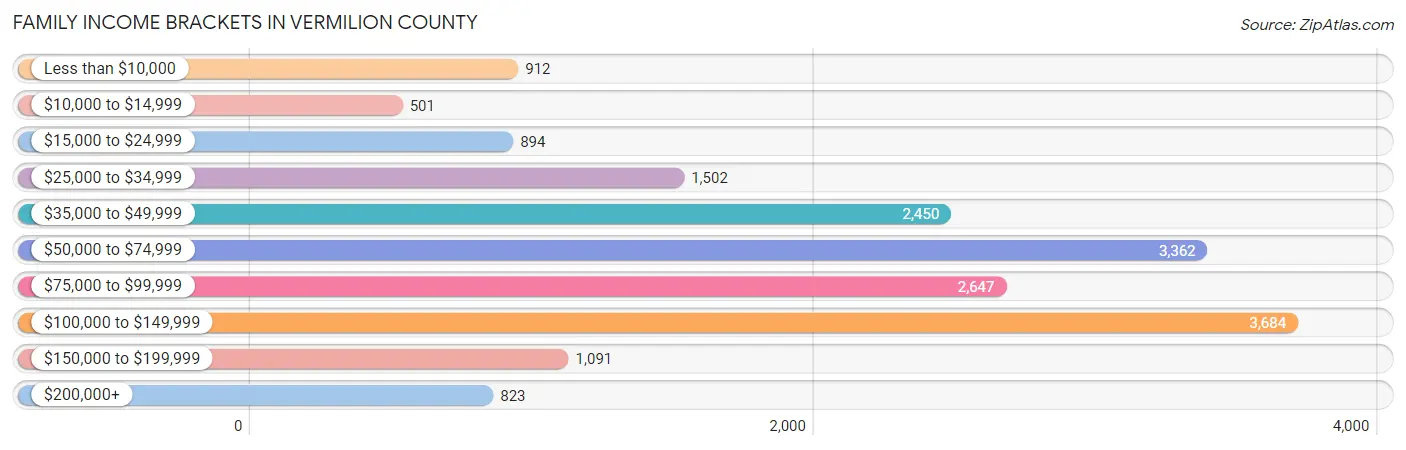
| Income Bracket | # Families | % Families |
| Less than $10,000 | 912 | 5.1% |
| $10,000 to $14,999 | 501 | 2.8% |
| $15,000 to $24,999 | 894 | 5.0% |
| $25,000 to $34,999 | 1,502 | 8.4% |
| $35,000 to $49,999 | 2,450 | 13.7% |
| $50,000 to $74,999 | 3,362 | 18.8% |
| $75,000 to $99,999 | 2,647 | 14.8% |
| $100,000 to $149,999 | 3,684 | 20.6% |
| $150,000 to $199,999 | 1,091 | 6.1% |
| $200,000+ | 823 | 4.6% |
Family Income by Famaliy Size in Vermilion County
4-person families (2,976 | 16.6%) account for the highest median family income in Vermilion County with $95,417 per family, while 2-person families (9,258 | 51.8%) have the highest median income of $34,138 per family member.
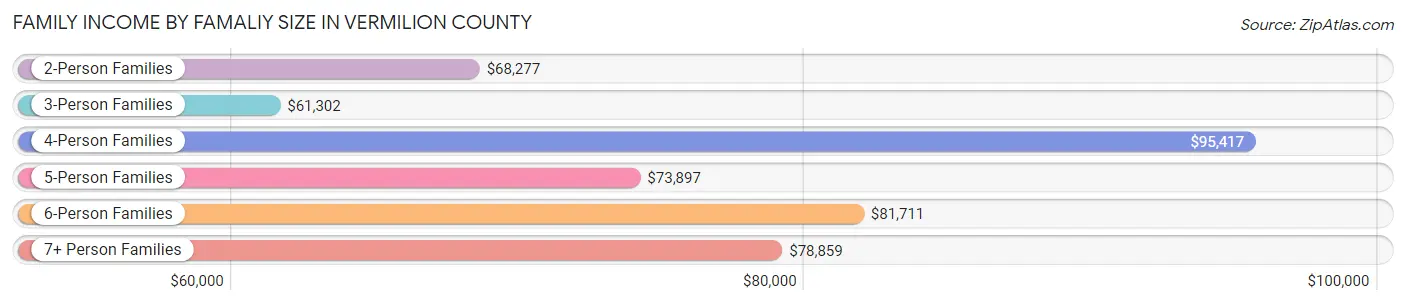
| Income Bracket | # Families | Median Income |
| 2-Person Families | 9,258 (51.8%) | $68,277 |
| 3-Person Families | 3,991 (22.3%) | $61,302 |
| 4-Person Families | 2,976 (16.6%) | $95,417 |
| 5-Person Families | 1,013 (5.7%) | $73,897 |
| 6-Person Families | 424 (2.4%) | $81,711 |
| 7+ Person Families | 223 (1.3%) | $78,859 |
| Total | 17,885 (100.0%) | $70,370 |
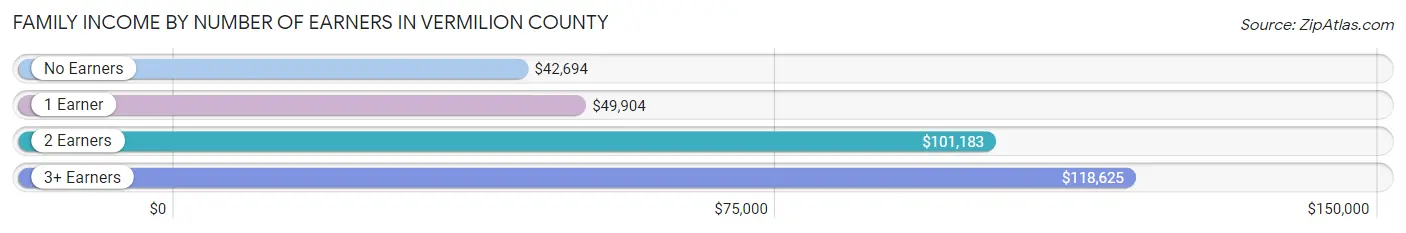
Family Income by Number of Earners in Vermilion County
The median family income in Vermilion County is $70,370, with families comprising 3+ earners (1,312) having the highest median family income of $118,625, while families with no earners (3,418) have the lowest median family income of $42,694, accounting for 7.3% and 19.1% of families, respectively.
| Number of Earners | # Families | Median Income |
| No Earners | 3,418 (19.1%) | $42,694 |
| 1 Earner | 7,025 (39.3%) | $49,904 |
| 2 Earners | 6,130 (34.3%) | $101,183 |
| 3+ Earners | 1,312 (7.3%) | $118,625 |
| Total | 17,885 (100.0%) | $70,370 |
Household Income in Vermilion County
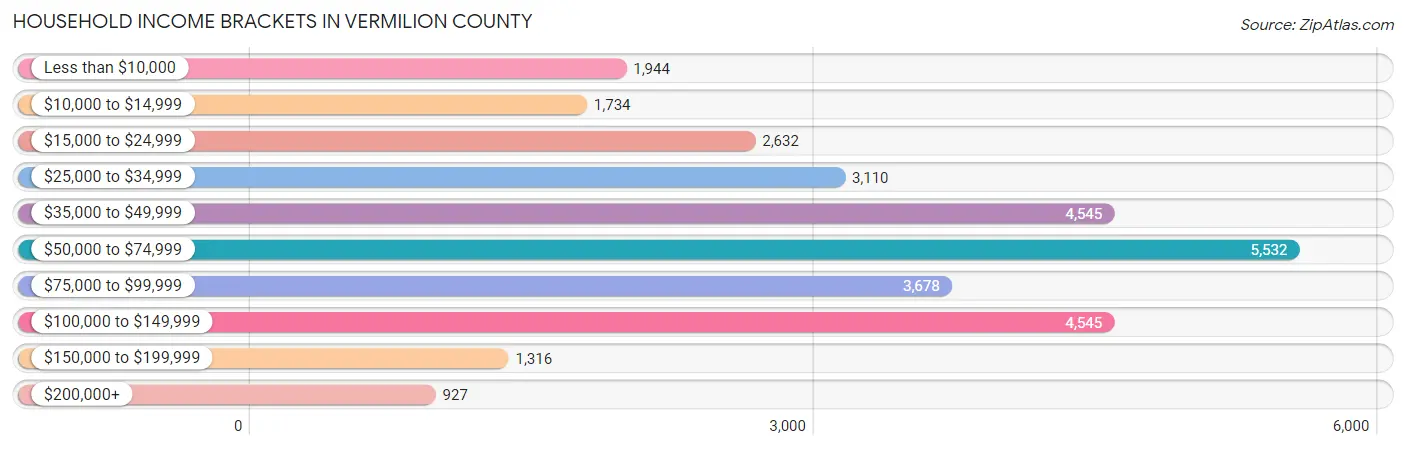
Household Income Brackets in Vermilion County
With 5,532 households falling in the category, the $50,000 to $74,999 income range is the most frequent in Vermilion County, accounting for 18.5% of all households. In contrast, only 927 households (3.1%) fall into the $200,000+ income bracket, making it the least populous group.
| Income Bracket | # Households | % Households |
| Less than $10,000 | 1,944 | 6.5% |
| $10,000 to $14,999 | 1,734 | 5.8% |
| $15,000 to $24,999 | 2,632 | 8.8% |
| $25,000 to $34,999 | 3,110 | 10.4% |
| $35,000 to $49,999 | 4,545 | 15.2% |
| $50,000 to $74,999 | 5,532 | 18.5% |
| $75,000 to $99,999 | 3,678 | 12.3% |
| $100,000 to $149,999 | 4,545 | 15.2% |
| $150,000 to $199,999 | 1,316 | 4.4% |
| $200,000+ | 927 | 3.1% |
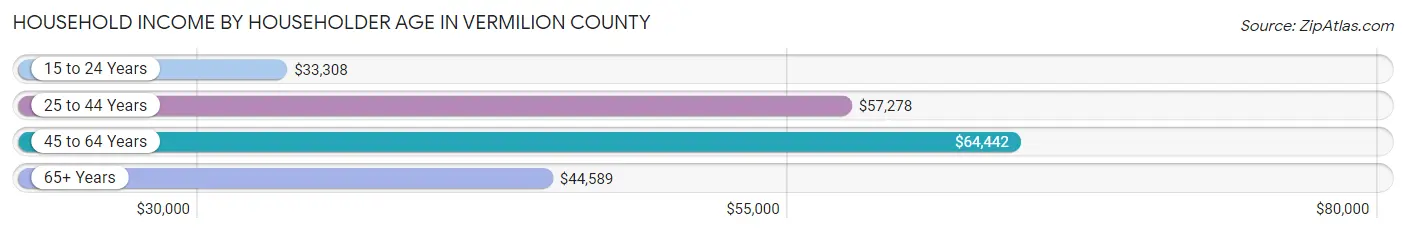
Household Income by Householder Age in Vermilion County
The median household income in Vermilion County is $52,787, with the highest median household income of $64,442 found in the 45 to 64 years age bracket for the primary householder. A total of 10,688 households (35.7%) fall into this category. Meanwhile, the 15 to 24 years age bracket for the primary householder has the lowest median household income of $33,308, with 1,365 households (4.6%) in this group.
| Income Bracket | # Households | Median Income |
| 15 to 24 Years | 1,365 (4.6%) | $33,308 |
| 25 to 44 Years | 8,071 (27.0%) | $57,278 |
| 45 to 64 Years | 10,688 (35.7%) | $64,442 |
| 65+ Years | 9,780 (32.7%) | $44,589 |
| Total | 29,904 (100.0%) | $52,787 |
Poverty in Vermilion County
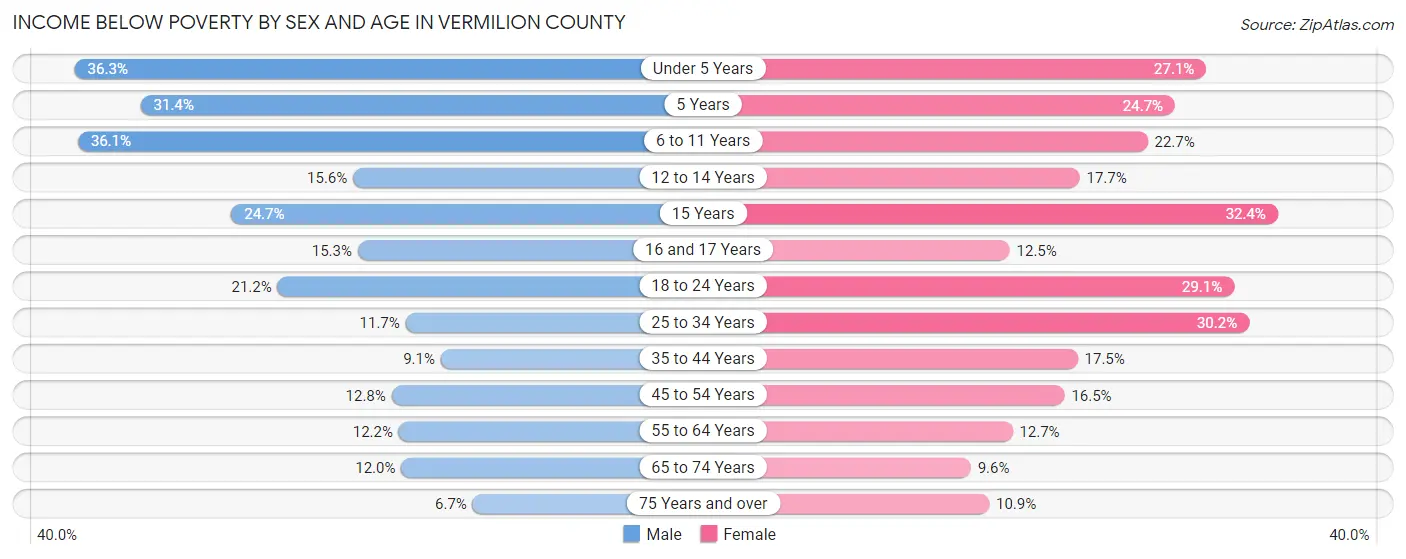
Income Below Poverty by Sex and Age in Vermilion County
With 16.3% poverty level for males and 18.5% for females among the residents of Vermilion County, under 5 year old males and 15 year old females are the most vulnerable to poverty, with 784 males (36.3%) and 178 females (32.4%) in their respective age groups living below the poverty level.
| Age Bracket | Male | Female |
| Under 5 Years | 784 (36.3%) | 560 (27.1%) |
| 5 Years | 145 (31.4%) | 93 (24.7%) |
| 6 to 11 Years | 988 (36.0%) | 611 (22.7%) |
| 12 to 14 Years | 263 (15.6%) | 262 (17.6%) |
| 15 Years | 122 (24.6%) | 178 (32.4%) |
| 16 and 17 Years | 155 (15.3%) | 112 (12.5%) |
| 18 to 24 Years | 664 (21.2%) | 826 (29.1%) |
| 25 to 34 Years | 451 (11.7%) | 1,221 (30.2%) |
| 35 to 44 Years | 365 (9.1%) | 743 (17.5%) |
| 45 to 54 Years | 500 (12.8%) | 683 (16.5%) |
| 55 to 64 Years | 601 (12.2%) | 649 (12.7%) |
| 65 to 74 Years | 453 (12.0%) | 424 (9.6%) |
| 75 Years and over | 172 (6.7%) | 382 (10.9%) |
| Total | 5,663 (16.3%) | 6,744 (18.5%) |
Income Above Poverty by Sex and Age in Vermilion County
According to the poverty statistics in Vermilion County, males aged 75 years and over and females aged 65 to 74 years are the age groups that are most secure financially, with 93.3% of males and 90.4% of females in these age groups living above the poverty line.

| Age Bracket | Male | Female |
| Under 5 Years | 1,377 (63.7%) | 1,510 (73.0%) |
| 5 Years | 317 (68.6%) | 283 (75.3%) |
| 6 to 11 Years | 1,753 (63.9%) | 2,081 (77.3%) |
| 12 to 14 Years | 1,422 (84.4%) | 1,222 (82.4%) |
| 15 Years | 373 (75.3%) | 372 (67.6%) |
| 16 and 17 Years | 861 (84.7%) | 787 (87.5%) |
| 18 to 24 Years | 2,465 (78.8%) | 2,011 (70.9%) |
| 25 to 34 Years | 3,402 (88.3%) | 2,818 (69.8%) |
| 35 to 44 Years | 3,645 (90.9%) | 3,500 (82.5%) |
| 45 to 54 Years | 3,423 (87.3%) | 3,448 (83.5%) |
| 55 to 64 Years | 4,319 (87.8%) | 4,472 (87.3%) |
| 65 to 74 Years | 3,312 (88.0%) | 4,007 (90.4%) |
| 75 Years and over | 2,384 (93.3%) | 3,112 (89.1%) |
| Total | 29,053 (83.7%) | 29,623 (81.5%) |
Income Below Poverty Among Married-Couple Families in Vermilion County
The poverty statistics for married-couple families in Vermilion County show that 5.4% or 663 of the total 12,334 families live below the poverty line. Families with 5 or more children have the highest poverty rate of 29.3%, comprising of 24 families. On the other hand, families with no children have the lowest poverty rate of 4.2%, which includes 339 families.
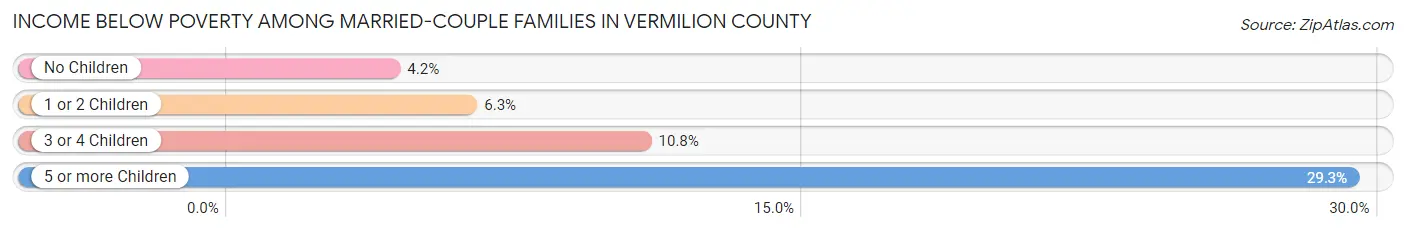
| Children | Above Poverty | Below Poverty |
| No Children | 7,665 (95.8%) | 339 (4.2%) |
| 1 or 2 Children | 3,271 (93.8%) | 218 (6.2%) |
| 3 or 4 Children | 677 (89.2%) | 82 (10.8%) |
| 5 or more Children | 58 (70.7%) | 24 (29.3%) |
| Total | 11,671 (94.6%) | 663 (5.4%) |
Income Below Poverty Among Single-Parent Households in Vermilion County
According to the poverty data in Vermilion County, 17.0% or 270 single-father households and 32.9% or 1,303 single-mother households are living below the poverty line. Among single-father households, those with 5 or more children have the highest poverty rate, with 10 households (62.5%) experiencing poverty. Likewise, among single-mother households, those with 3 or 4 children have the highest poverty rate, with 388 households (65.1%) falling below the poverty line.
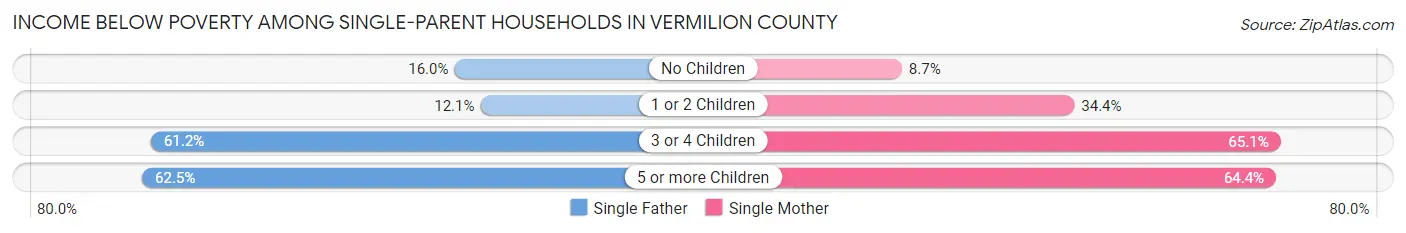
| Children | Single Father | Single Mother |
| No Children | 80 (16.0%) | 88 (8.7%) |
| 1 or 2 Children | 117 (12.1%) | 789 (34.4%) |
| 3 or 4 Children | 63 (61.2%) | 388 (65.1%) |
| 5 or more Children | 10 (62.5%) | 38 (64.4%) |
| Total | 270 (17.0%) | 1,303 (32.9%) |
Income Below Poverty Among Married-Couple vs Single-Parent Households in Vermilion County
The poverty data for Vermilion County shows that 663 of the married-couple family households (5.4%) and 1,573 of the single-parent households (28.3%) are living below the poverty level. Within the married-couple family households, those with 5 or more children have the highest poverty rate, with 24 households (29.3%) falling below the poverty line. Among the single-parent households, those with 3 or 4 children have the highest poverty rate, with 451 household (64.5%) living below poverty.
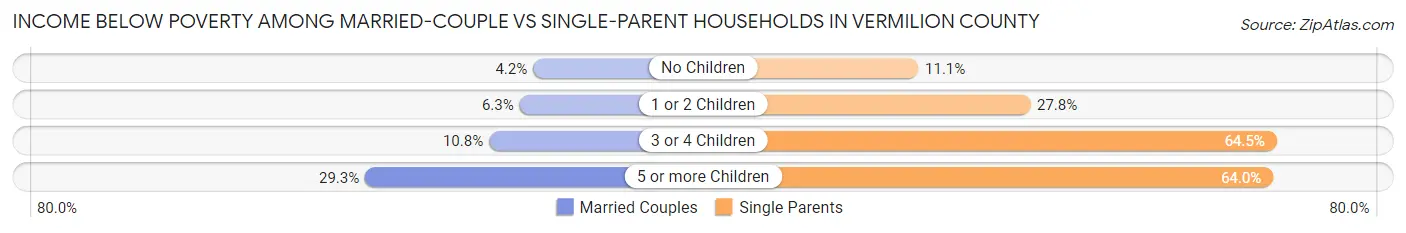
| Children | Married-Couple Families | Single-Parent Households |
| No Children | 339 (4.2%) | 168 (11.1%) |
| 1 or 2 Children | 218 (6.2%) | 906 (27.8%) |
| 3 or 4 Children | 82 (10.8%) | 451 (64.5%) |
| 5 or more Children | 24 (29.3%) | 48 (64.0%) |
| Total | 663 (5.4%) | 1,573 (28.3%) |
Employment Characteristics in Vermilion County
Employment by Class of Employer in Vermilion County
Among the 29,995 employed individuals in Vermilion County, private company employees (20,101 | 67.0%), self-employed (not incorporated) (2,372 | 7.9%), and local government employees (2,307 | 7.7%) make up the most common classes of employment.
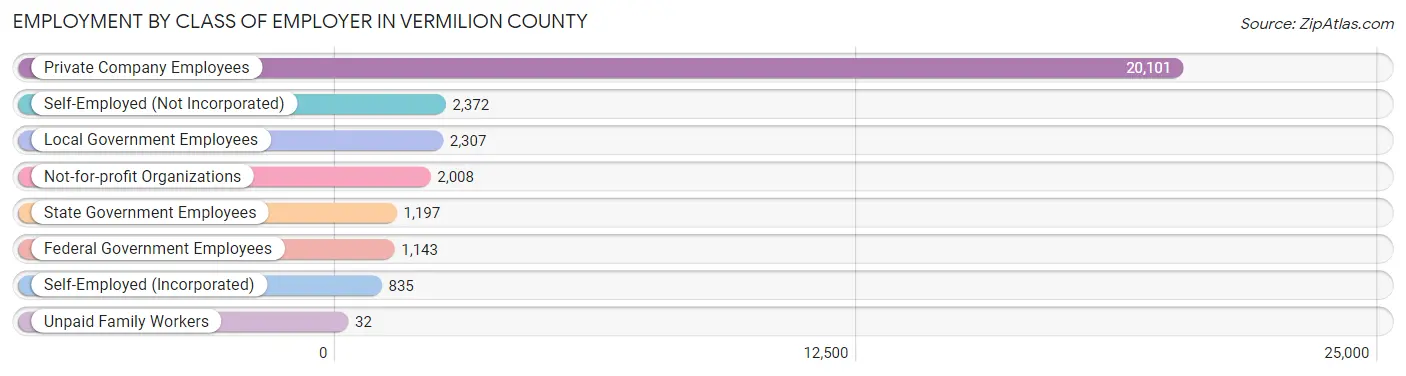
| Employer Class | # Employees | % Employees |
| Private Company Employees | 20,101 | 67.0% |
| Self-Employed (Incorporated) | 835 | 2.8% |
| Self-Employed (Not Incorporated) | 2,372 | 7.9% |
| Not-for-profit Organizations | 2,008 | 6.7% |
| Local Government Employees | 2,307 | 7.7% |
| State Government Employees | 1,197 | 4.0% |
| Federal Government Employees | 1,143 | 3.8% |
| Unpaid Family Workers | 32 | 0.1% |
| Total | 29,995 | 100.0% |
Employment Status by Age in Vermilion County
According to the labor force statistics for Vermilion County, out of the total population over 16 years of age (58,702), 55.6% or 32,638 individuals are in the labor force, with 6.7% or 2,187 of them unemployed. The age group with the highest labor force participation rate is 35 to 44 years, with 81.5% or 7,187 individuals in the labor force. Within the labor force, the 20 to 24 years age range has the highest percentage of unemployed individuals, with 17.1% or 554 of them being unemployed.
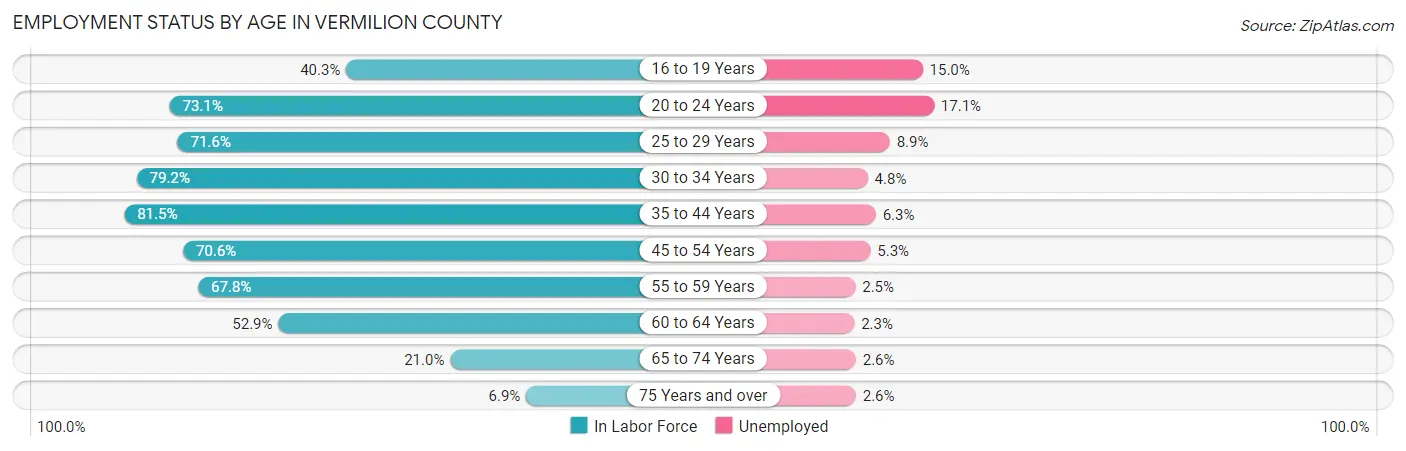
| Age Bracket | In Labor Force | Unemployed |
| 16 to 19 Years | 1,465 (40.3%) | 220 (15.0%) |
| 20 to 24 Years | 3,237 (73.1%) | 554 (17.1%) |
| 25 to 29 Years | 3,056 (71.6%) | 272 (8.9%) |
| 30 to 34 Years | 3,321 (79.2%) | 159 (4.8%) |
| 35 to 44 Years | 7,187 (81.5%) | 453 (6.3%) |
| 45 to 54 Years | 5,940 (70.6%) | 315 (5.3%) |
| 55 to 59 Years | 3,643 (67.8%) | 91 (2.5%) |
| 60 to 64 Years | 2,579 (52.9%) | 59 (2.3%) |
| 65 to 74 Years | 1,766 (21.0%) | 46 (2.6%) |
| 75 Years and over | 434 (6.9%) | 11 (2.6%) |
| Total | 32,638 (55.6%) | 2,187 (6.7%) |
Employment Status by Educational Attainment in Vermilion County
According to labor force statistics for Vermilion County, 71.6% of individuals (25,734) out of the total population between 25 and 64 years of age (35,942) are in the labor force, with 5.2% or 1,338 of them being unemployed. The group with the highest labor force participation rate are those with the educational attainment of bachelor's degree or higher, with 85.7% or 4,694 individuals in the labor force. Within the labor force, individuals with less than high school education have the highest percentage of unemployment, with 13.8% or 214 of them being unemployed.
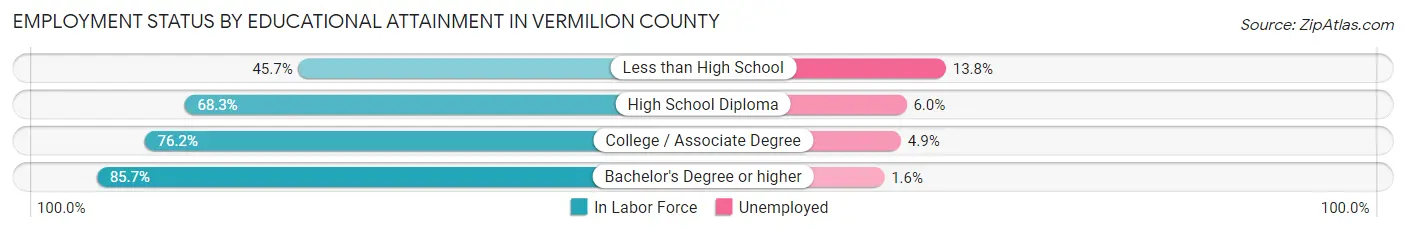
| Educational Attainment | In Labor Force | Unemployed |
| Less than High School | 1,548 (45.7%) | 467 (13.8%) |
| High School Diploma | 9,990 (68.3%) | 878 (6.0%) |
| College / Associate Degree | 9,488 (76.2%) | 610 (4.9%) |
| Bachelor's Degree or higher | 4,694 (85.7%) | 88 (1.6%) |
| Total | 25,734 (71.6%) | 1,869 (5.2%) |
Employment Occupations by Sex in Vermilion County
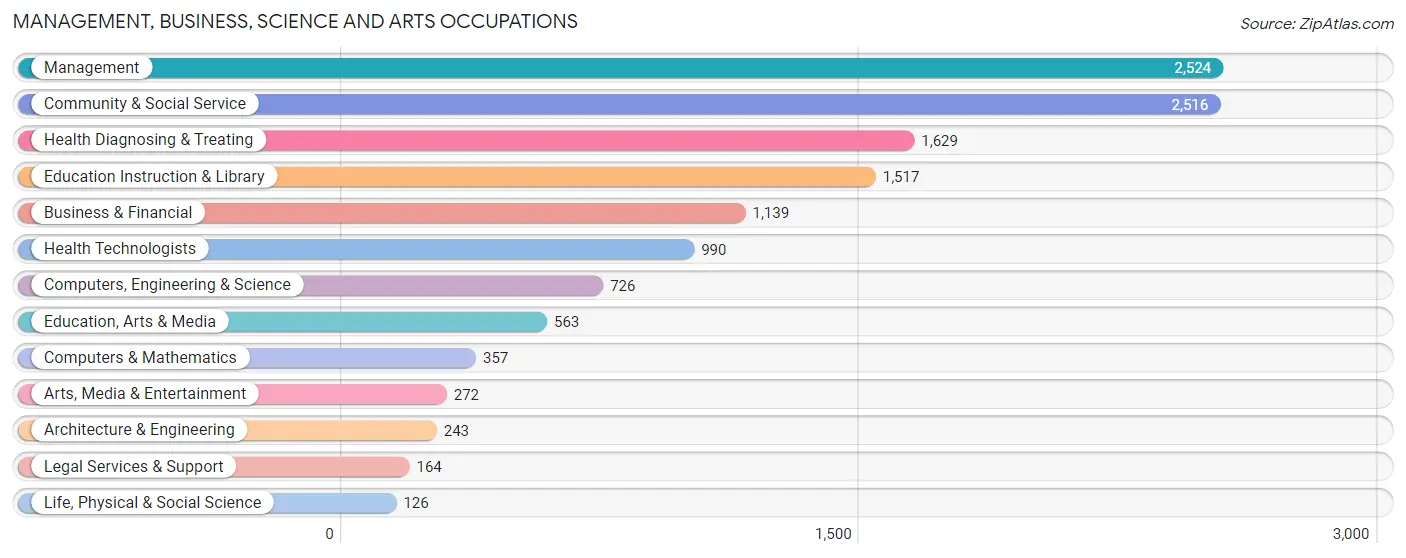
Management, Business, Science and Arts Occupations
The most common Management, Business, Science and Arts occupations in Vermilion County are Management (2,524 | 8.3%), Community & Social Service (2,516 | 8.3%), Health Diagnosing & Treating (1,629 | 5.4%), Education Instruction & Library (1,517 | 5.0%), and Business & Financial (1,139 | 3.7%).
Management, Business, Science and Arts Occupations by Sex
Within the Management, Business, Science and Arts occupations in Vermilion County, the most male-oriented occupations are Architecture & Engineering (92.2%), Life, Physical & Social Science (84.1%), and Computers, Engineering & Science (77.8%), while the most female-oriented occupations are Health Diagnosing & Treating (83.8%), Health Technologists (82.8%), and Education Instruction & Library (72.8%).
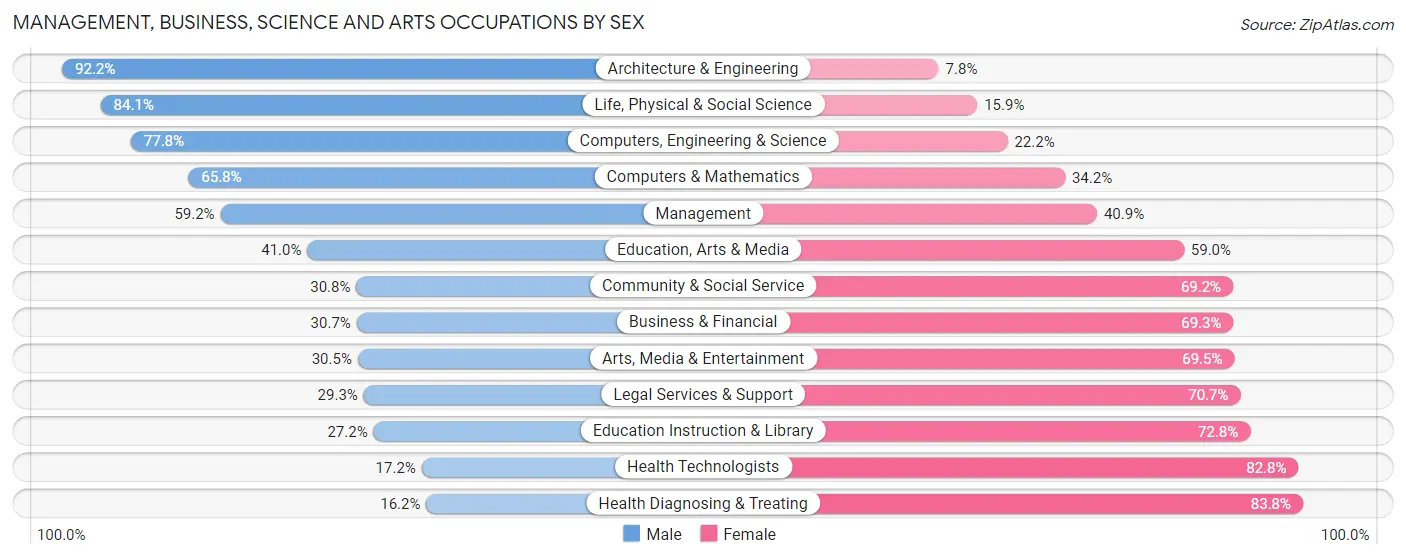
| Occupation | Male | Female |
| Management | 1,493 (59.2%) | 1,031 (40.8%) |
| Business & Financial | 350 (30.7%) | 789 (69.3%) |
| Computers, Engineering & Science | 565 (77.8%) | 161 (22.2%) |
| Computers & Mathematics | 235 (65.8%) | 122 (34.2%) |
| Architecture & Engineering | 224 (92.2%) | 19 (7.8%) |
| Life, Physical & Social Science | 106 (84.1%) | 20 (15.9%) |
| Community & Social Service | 775 (30.8%) | 1,741 (69.2%) |
| Education, Arts & Media | 231 (41.0%) | 332 (59.0%) |
| Legal Services & Support | 48 (29.3%) | 116 (70.7%) |
| Education Instruction & Library | 413 (27.2%) | 1,104 (72.8%) |
| Arts, Media & Entertainment | 83 (30.5%) | 189 (69.5%) |
| Health Diagnosing & Treating | 264 (16.2%) | 1,365 (83.8%) |
| Health Technologists | 170 (17.2%) | 820 (82.8%) |
| Total (Category) | 3,447 (40.4%) | 5,087 (59.6%) |
| Total (Overall) | 16,051 (52.8%) | 14,348 (47.2%) |
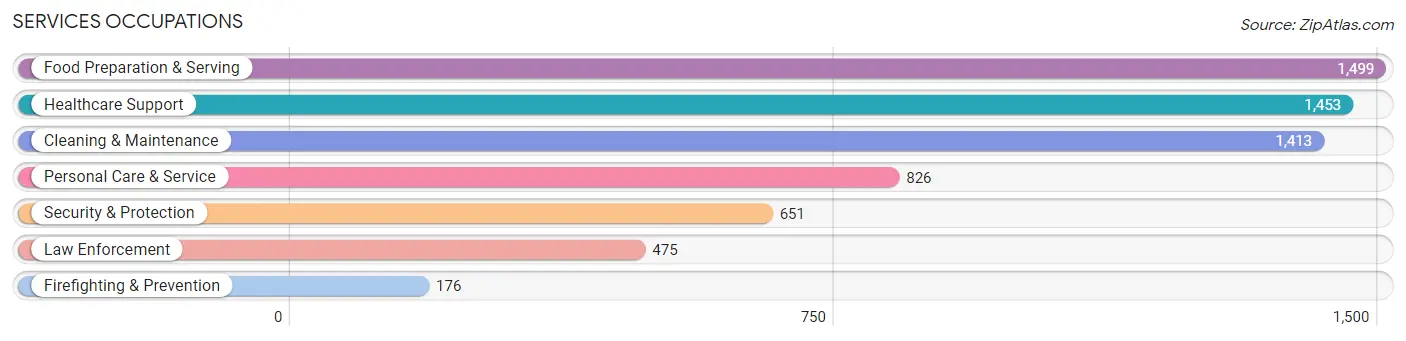
Services Occupations
The most common Services occupations in Vermilion County are Food Preparation & Serving (1,499 | 4.9%), Healthcare Support (1,453 | 4.8%), Cleaning & Maintenance (1,413 | 4.6%), Personal Care & Service (826 | 2.7%), and Security & Protection (651 | 2.1%).
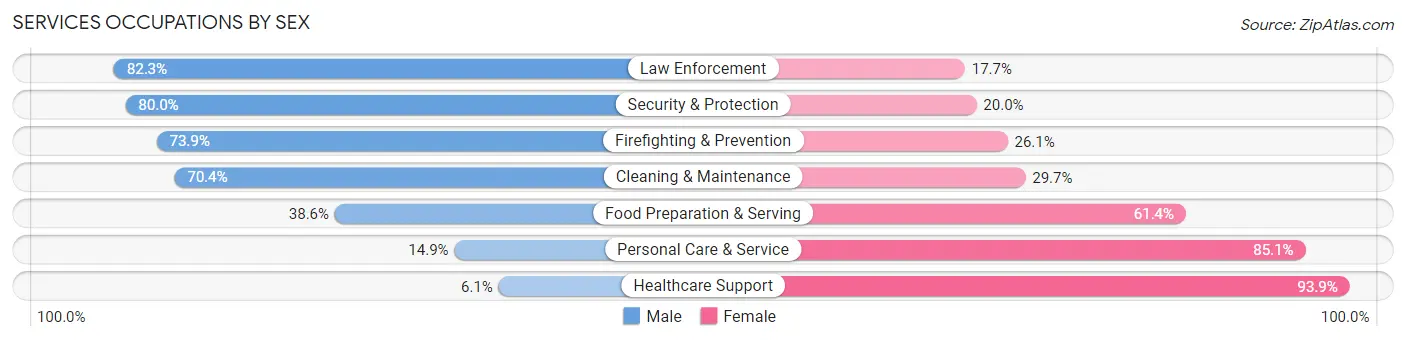
Services Occupations by Sex
Within the Services occupations in Vermilion County, the most male-oriented occupations are Law Enforcement (82.3%), Security & Protection (80.0%), and Firefighting & Prevention (73.9%), while the most female-oriented occupations are Healthcare Support (93.9%), Personal Care & Service (85.1%), and Food Preparation & Serving (61.4%).
| Occupation | Male | Female |
| Healthcare Support | 89 (6.1%) | 1,364 (93.9%) |
| Security & Protection | 521 (80.0%) | 130 (20.0%) |
| Firefighting & Prevention | 130 (73.9%) | 46 (26.1%) |
| Law Enforcement | 391 (82.3%) | 84 (17.7%) |
| Food Preparation & Serving | 578 (38.6%) | 921 (61.4%) |
| Cleaning & Maintenance | 994 (70.4%) | 419 (29.6%) |
| Personal Care & Service | 123 (14.9%) | 703 (85.1%) |
| Total (Category) | 2,305 (39.5%) | 3,537 (60.5%) |
| Total (Overall) | 16,051 (52.8%) | 14,348 (47.2%) |
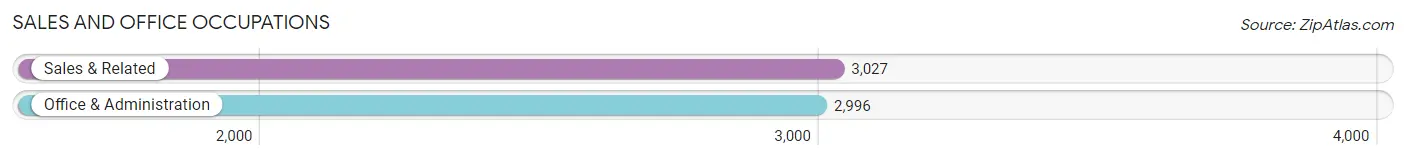
Sales and Office Occupations
The most common Sales and Office occupations in Vermilion County are Sales & Related (3,027 | 10.0%), and Office & Administration (2,996 | 9.9%).
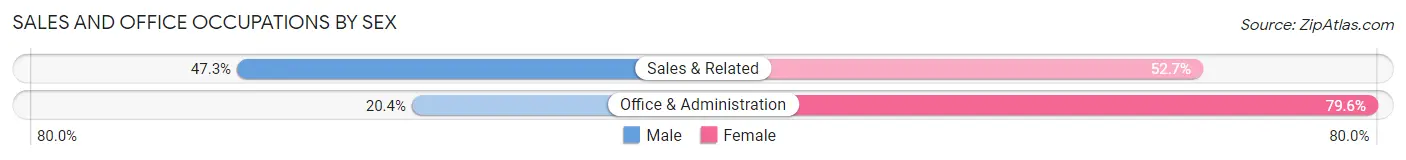
Sales and Office Occupations by Sex
| Occupation | Male | Female |
| Sales & Related | 1,433 (47.3%) | 1,594 (52.7%) |
| Office & Administration | 612 (20.4%) | 2,384 (79.6%) |
| Total (Category) | 2,045 (34.0%) | 3,978 (66.0%) |
| Total (Overall) | 16,051 (52.8%) | 14,348 (47.2%) |
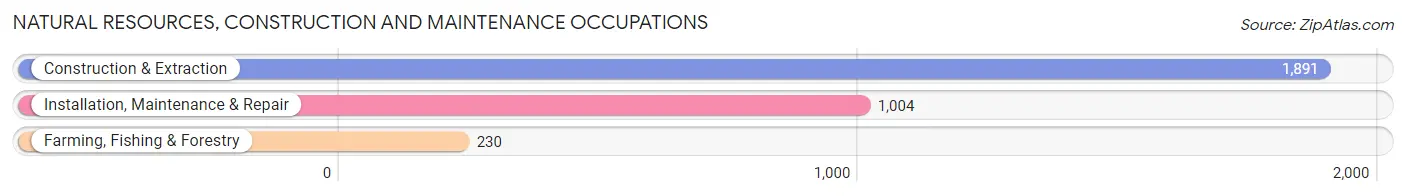
Natural Resources, Construction and Maintenance Occupations
The most common Natural Resources, Construction and Maintenance occupations in Vermilion County are Construction & Extraction (1,891 | 6.2%), Installation, Maintenance & Repair (1,004 | 3.3%), and Farming, Fishing & Forestry (230 | 0.8%).
Natural Resources, Construction and Maintenance Occupations by Sex
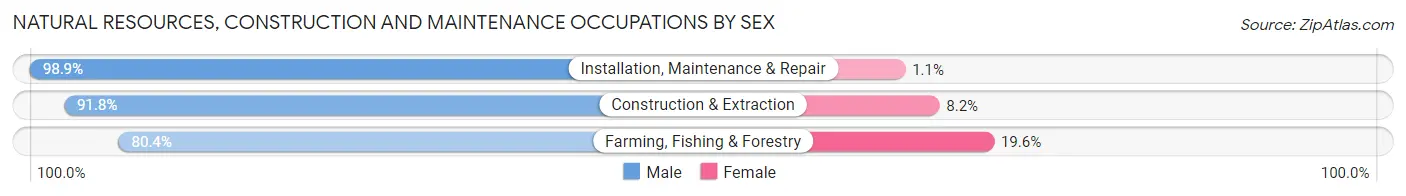
| Occupation | Male | Female |
| Farming, Fishing & Forestry | 185 (80.4%) | 45 (19.6%) |
| Construction & Extraction | 1,736 (91.8%) | 155 (8.2%) |
| Installation, Maintenance & Repair | 993 (98.9%) | 11 (1.1%) |
| Total (Category) | 2,914 (93.2%) | 211 (6.8%) |
| Total (Overall) | 16,051 (52.8%) | 14,348 (47.2%) |
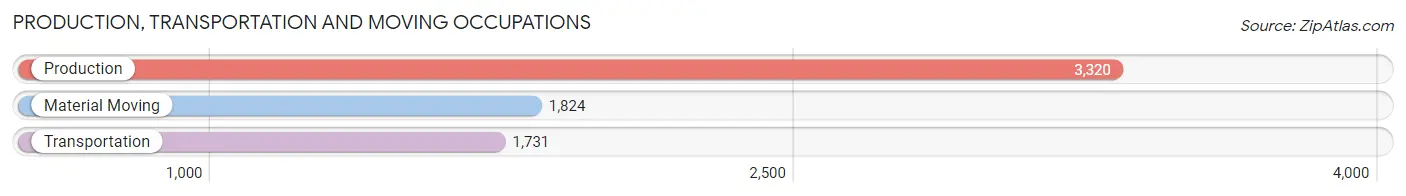
Production, Transportation and Moving Occupations
The most common Production, Transportation and Moving occupations in Vermilion County are Production (3,320 | 10.9%), Material Moving (1,824 | 6.0%), and Transportation (1,731 | 5.7%).
Production, Transportation and Moving Occupations by Sex
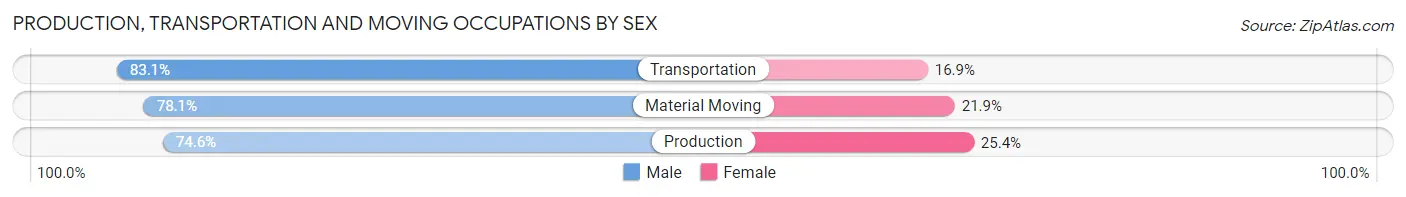
| Occupation | Male | Female |
| Production | 2,477 (74.6%) | 843 (25.4%) |
| Transportation | 1,438 (83.1%) | 293 (16.9%) |
| Material Moving | 1,425 (78.1%) | 399 (21.9%) |
| Total (Category) | 5,340 (77.7%) | 1,535 (22.3%) |
| Total (Overall) | 16,051 (52.8%) | 14,348 (47.2%) |
Employment Industries by Sex in Vermilion County
Employment Industries in Vermilion County
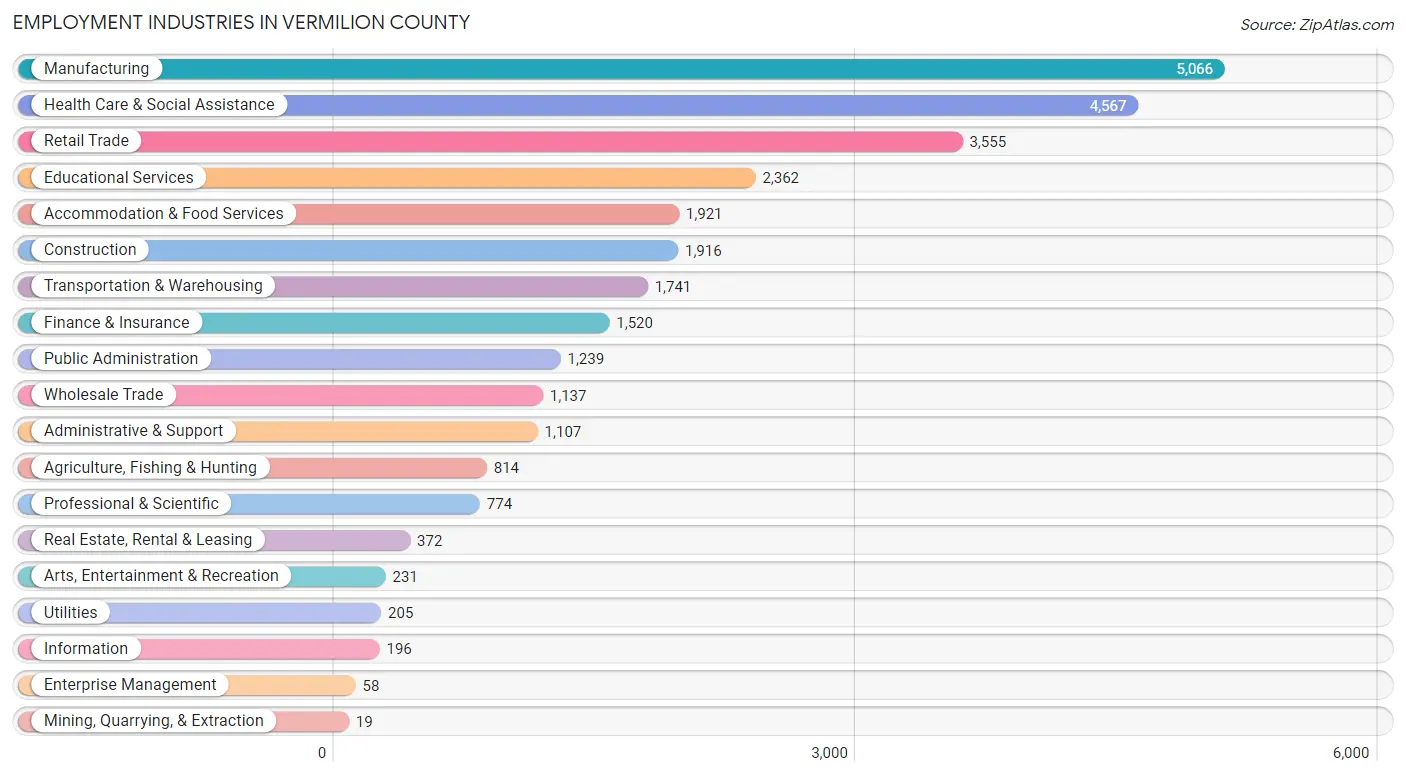
The major employment industries in Vermilion County include Manufacturing (5,066 | 16.7%), Health Care & Social Assistance (4,567 | 15.0%), Retail Trade (3,555 | 11.7%), Educational Services (2,362 | 7.8%), and Accommodation & Food Services (1,921 | 6.3%).
Employment Industries by Sex in Vermilion County
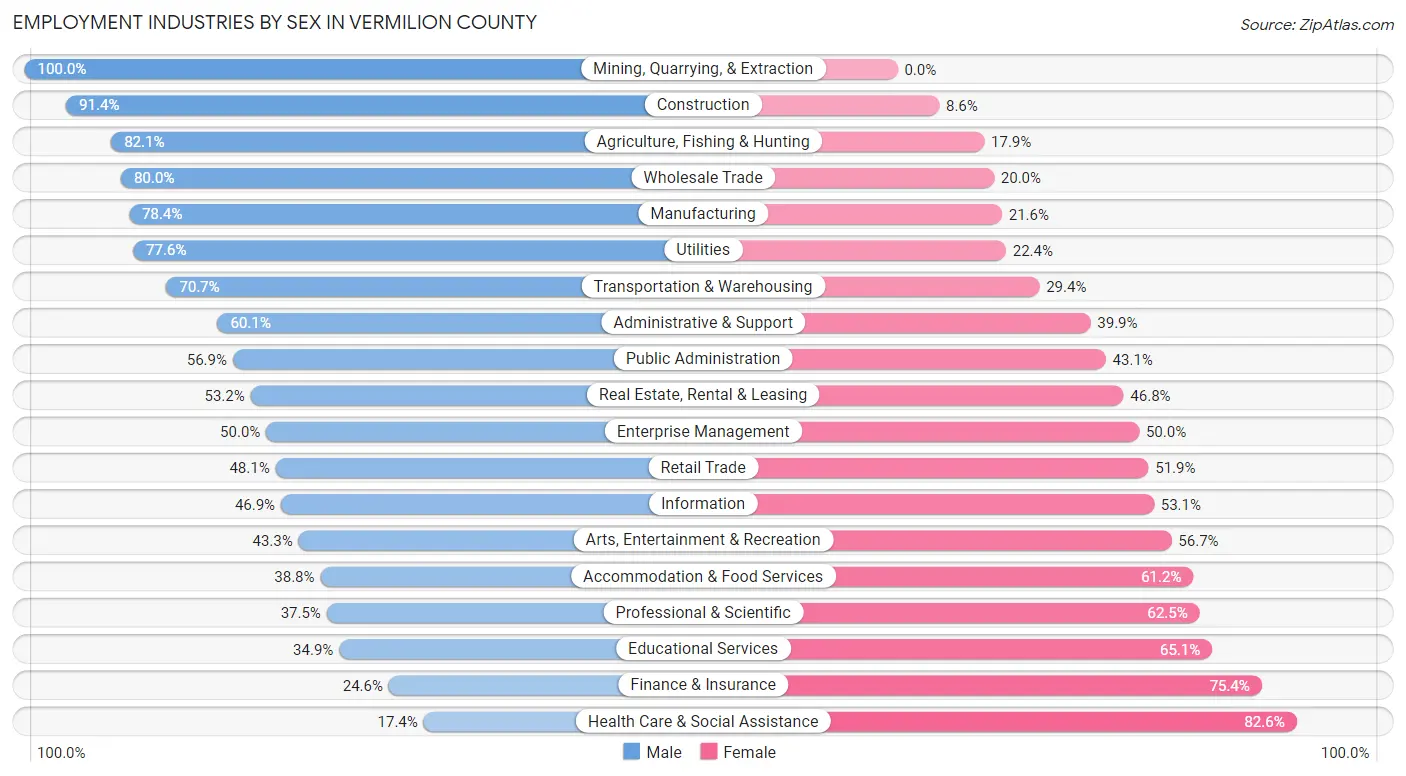
The Vermilion County industries that see more men than women are Mining, Quarrying, & Extraction (100.0%), Construction (91.4%), and Agriculture, Fishing & Hunting (82.1%), whereas the industries that tend to have a higher number of women are Health Care & Social Assistance (82.6%), Finance & Insurance (75.4%), and Educational Services (65.1%).
| Industry | Male | Female |
| Agriculture, Fishing & Hunting | 668 (82.1%) | 146 (17.9%) |
| Mining, Quarrying, & Extraction | 19 (100.0%) | 0 (0.0%) |
| Construction | 1,751 (91.4%) | 165 (8.6%) |
| Manufacturing | 3,971 (78.4%) | 1,095 (21.6%) |
| Wholesale Trade | 910 (80.0%) | 227 (20.0%) |
| Retail Trade | 1,709 (48.1%) | 1,846 (51.9%) |
| Transportation & Warehousing | 1,230 (70.7%) | 511 (29.3%) |
| Utilities | 159 (77.6%) | 46 (22.4%) |
| Information | 92 (46.9%) | 104 (53.1%) |
| Finance & Insurance | 374 (24.6%) | 1,146 (75.4%) |
| Real Estate, Rental & Leasing | 198 (53.2%) | 174 (46.8%) |
| Professional & Scientific | 290 (37.5%) | 484 (62.5%) |
| Enterprise Management | 29 (50.0%) | 29 (50.0%) |
| Administrative & Support | 665 (60.1%) | 442 (39.9%) |
| Educational Services | 824 (34.9%) | 1,538 (65.1%) |
| Health Care & Social Assistance | 795 (17.4%) | 3,772 (82.6%) |
| Arts, Entertainment & Recreation | 100 (43.3%) | 131 (56.7%) |
| Accommodation & Food Services | 745 (38.8%) | 1,176 (61.2%) |
| Public Administration | 705 (56.9%) | 534 (43.1%) |
| Total | 16,051 (52.8%) | 14,348 (47.2%) |
Education in Vermilion County
School Enrollment in Vermilion County
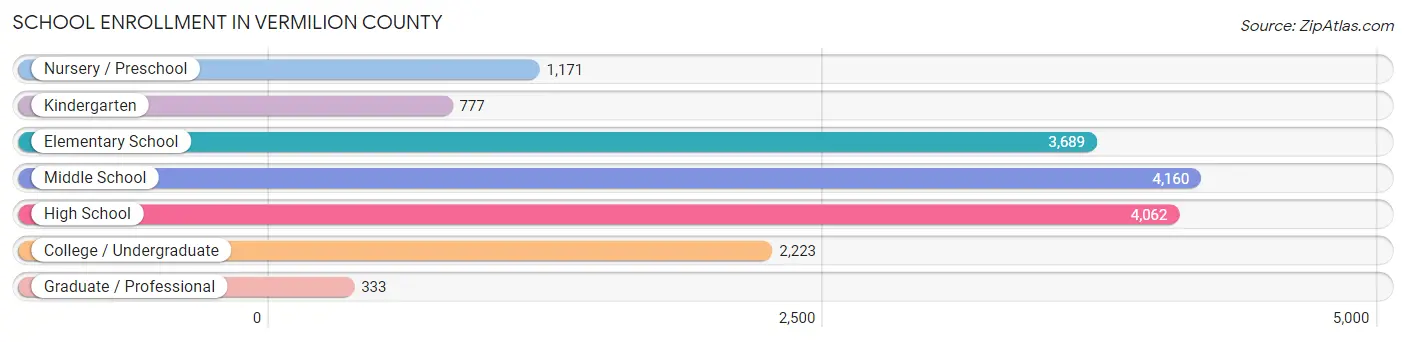
The most common levels of schooling among the 16,415 students in Vermilion County are middle school (4,160 | 25.3%), high school (4,062 | 24.7%), and elementary school (3,689 | 22.5%).
| School Level | # Students | % Students |
| Nursery / Preschool | 1,171 | 7.1% |
| Kindergarten | 777 | 4.7% |
| Elementary School | 3,689 | 22.5% |
| Middle School | 4,160 | 25.3% |
| High School | 4,062 | 24.7% |
| College / Undergraduate | 2,223 | 13.5% |
| Graduate / Professional | 333 | 2.0% |
| Total | 16,415 | 100.0% |
School Enrollment by Age by Funding Source in Vermilion County
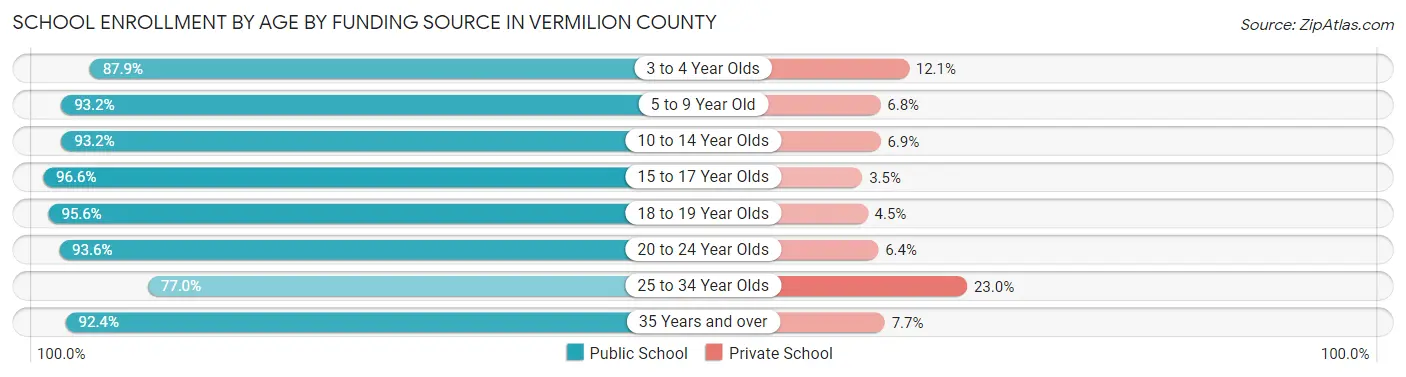
Out of a total of 16,415 students who are enrolled in schools in Vermilion County, 1,116 (6.8%) attend a private institution, while the remaining 15,299 (93.2%) are enrolled in public schools. The age group of 25 to 34 year olds has the highest likelihood of being enrolled in private schools, with 113 (23.0% in the age bracket) enrolled. Conversely, the age group of 15 to 17 year olds has the lowest likelihood of being enrolled in a private school, with 2,768 (96.6% in the age bracket) attending a public institution.
| Age Bracket | Public School | Private School |
| 3 to 4 Year Olds | 688 (87.9%) | 95 (12.1%) |
| 5 to 9 Year Old | 3,928 (93.2%) | 288 (6.8%) |
| 10 to 14 Year Olds | 4,879 (93.1%) | 359 (6.9%) |
| 15 to 17 Year Olds | 2,768 (96.6%) | 99 (3.5%) |
| 18 to 19 Year Olds | 1,030 (95.6%) | 48 (4.4%) |
| 20 to 24 Year Olds | 871 (93.6%) | 60 (6.4%) |
| 25 to 34 Year Olds | 379 (77.0%) | 113 (23.0%) |
| 35 Years and over | 748 (92.3%) | 62 (7.6%) |
| Total | 15,299 (93.2%) | 1,116 (6.8%) |
Educational Attainment by Field of Study in Vermilion County
Education (1,961 | 23.5%), business (1,203 | 14.4%), science & technology (1,042 | 12.5%), arts & humanities (661 | 7.9%), and bio, nature & agricultural (496 | 5.9%) are the most common fields of study among 8,359 individuals in Vermilion County who have obtained a bachelor's degree or higher.
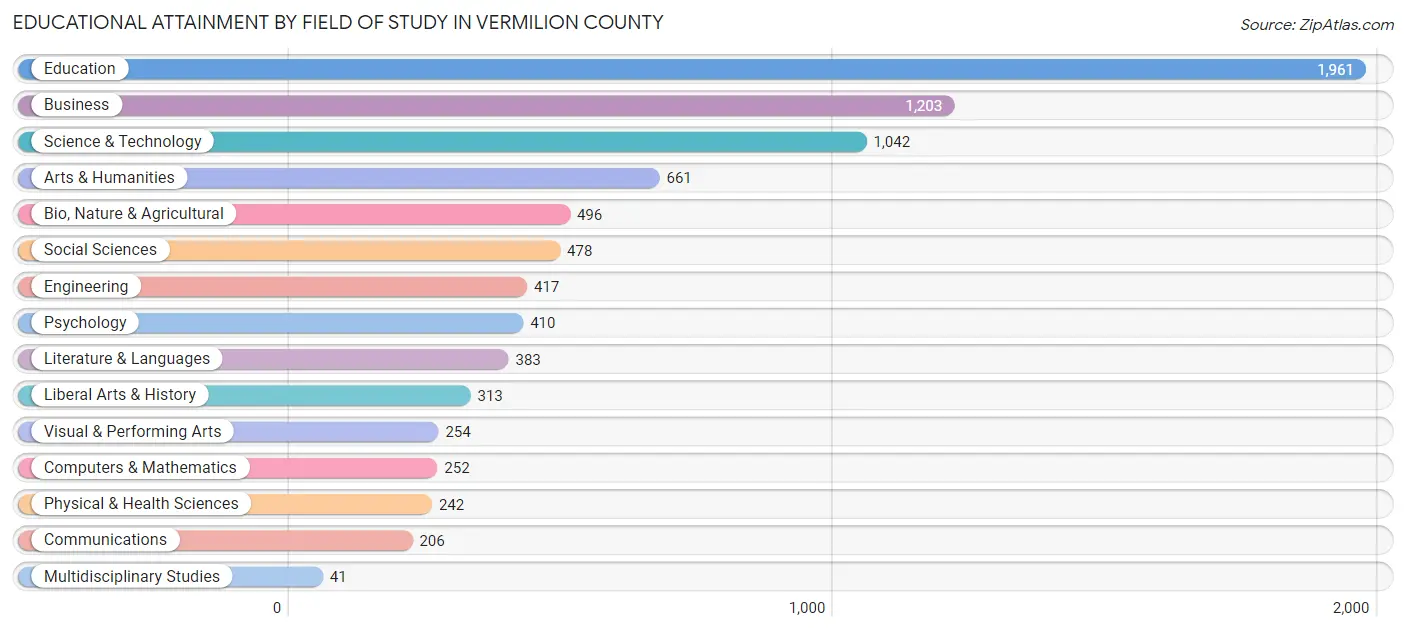
| Field of Study | # Graduates | % Graduates |
| Computers & Mathematics | 252 | 3.0% |
| Bio, Nature & Agricultural | 496 | 5.9% |
| Physical & Health Sciences | 242 | 2.9% |
| Psychology | 410 | 4.9% |
| Social Sciences | 478 | 5.7% |
| Engineering | 417 | 5.0% |
| Multidisciplinary Studies | 41 | 0.5% |
| Science & Technology | 1,042 | 12.5% |
| Business | 1,203 | 14.4% |
| Education | 1,961 | 23.5% |
| Literature & Languages | 383 | 4.6% |
| Liberal Arts & History | 313 | 3.7% |
| Visual & Performing Arts | 254 | 3.0% |
| Communications | 206 | 2.5% |
| Arts & Humanities | 661 | 7.9% |
| Total | 8,359 | 100.0% |
Transportation & Commute in Vermilion County
Vehicle Availability by Sex in Vermilion County
The most prevalent vehicle ownership categories in Vermilion County are males with 2 vehicles (6,811, accounting for 42.8%) and females with 2 vehicles (6,005, making up 48.5%).
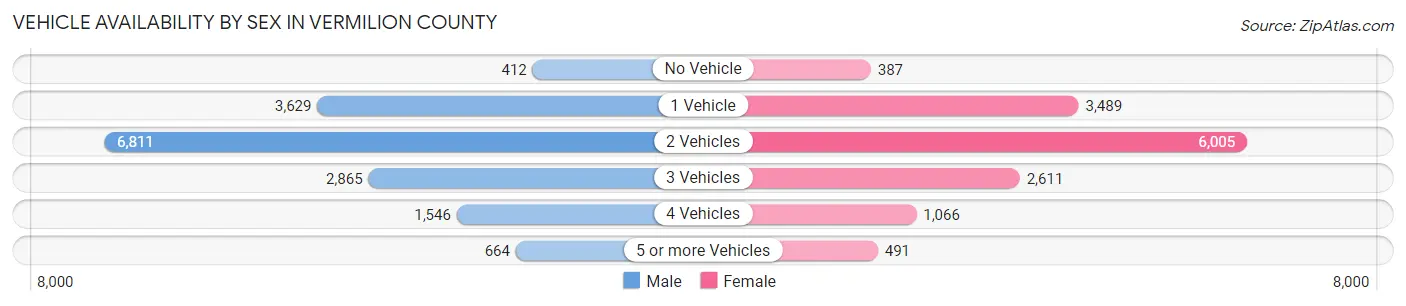
| Vehicles Available | Male | Female |
| No Vehicle | 412 (2.6%) | 387 (2.8%) |
| 1 Vehicle | 3,629 (22.8%) | 3,489 (24.8%) |
| 2 Vehicles | 6,811 (42.8%) | 6,005 (42.7%) |
| 3 Vehicles | 2,865 (18.0%) | 2,611 (18.6%) |
| 4 Vehicles | 1,546 (9.7%) | 1,066 (7.6%) |
| 5 or more Vehicles | 664 (4.2%) | 491 (3.5%) |
| Total | 15,927 (100.0%) | 14,049 (100.0%) |
Commute Time in Vermilion County
The most frequently occuring commute durations in Vermilion County are 10 to 14 minutes (6,561 commuters, 23.8%), 15 to 19 minutes (5,610 commuters, 20.3%), and 5 to 9 minutes (3,644 commuters, 13.2%).
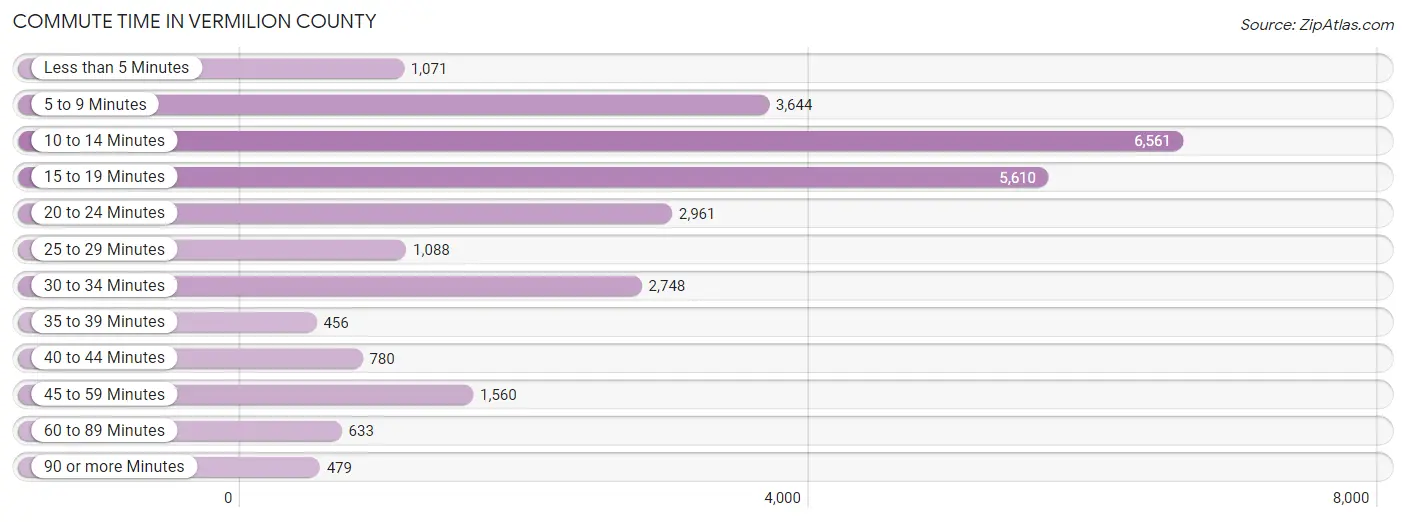
| Commute Time | # Commuters | % Commuters |
| Less than 5 Minutes | 1,071 | 3.9% |
| 5 to 9 Minutes | 3,644 | 13.2% |
| 10 to 14 Minutes | 6,561 | 23.8% |
| 15 to 19 Minutes | 5,610 | 20.3% |
| 20 to 24 Minutes | 2,961 | 10.7% |
| 25 to 29 Minutes | 1,088 | 3.9% |
| 30 to 34 Minutes | 2,748 | 10.0% |
| 35 to 39 Minutes | 456 | 1.7% |
| 40 to 44 Minutes | 780 | 2.8% |
| 45 to 59 Minutes | 1,560 | 5.7% |
| 60 to 89 Minutes | 633 | 2.3% |
| 90 or more Minutes | 479 | 1.7% |
Commute Time by Sex in Vermilion County
The most common commute times in Vermilion County are 10 to 14 minutes (3,228 commuters, 21.6%) for males and 10 to 14 minutes (3,333 commuters, 26.4%) for females.
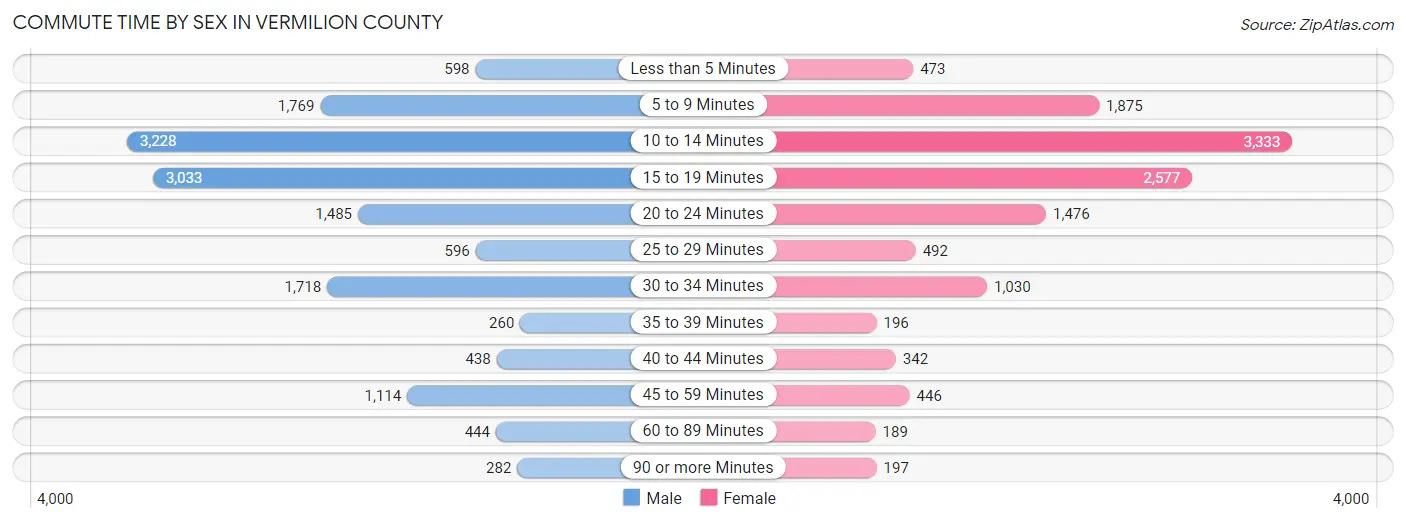
| Commute Time | Male | Female |
| Less than 5 Minutes | 598 (4.0%) | 473 (3.7%) |
| 5 to 9 Minutes | 1,769 (11.8%) | 1,875 (14.8%) |
| 10 to 14 Minutes | 3,228 (21.6%) | 3,333 (26.4%) |
| 15 to 19 Minutes | 3,033 (20.3%) | 2,577 (20.4%) |
| 20 to 24 Minutes | 1,485 (9.9%) | 1,476 (11.7%) |
| 25 to 29 Minutes | 596 (4.0%) | 492 (3.9%) |
| 30 to 34 Minutes | 1,718 (11.5%) | 1,030 (8.2%) |
| 35 to 39 Minutes | 260 (1.7%) | 196 (1.5%) |
| 40 to 44 Minutes | 438 (2.9%) | 342 (2.7%) |
| 45 to 59 Minutes | 1,114 (7.4%) | 446 (3.5%) |
| 60 to 89 Minutes | 444 (3.0%) | 189 (1.5%) |
| 90 or more Minutes | 282 (1.9%) | 197 (1.6%) |
Time of Departure to Work by Sex in Vermilion County
The most frequent times of departure to work in Vermilion County are 6:30 AM to 6:59 AM (2,266, 15.1%) for males and 7:00 AM to 7:29 AM (2,052, 16.3%) for females.
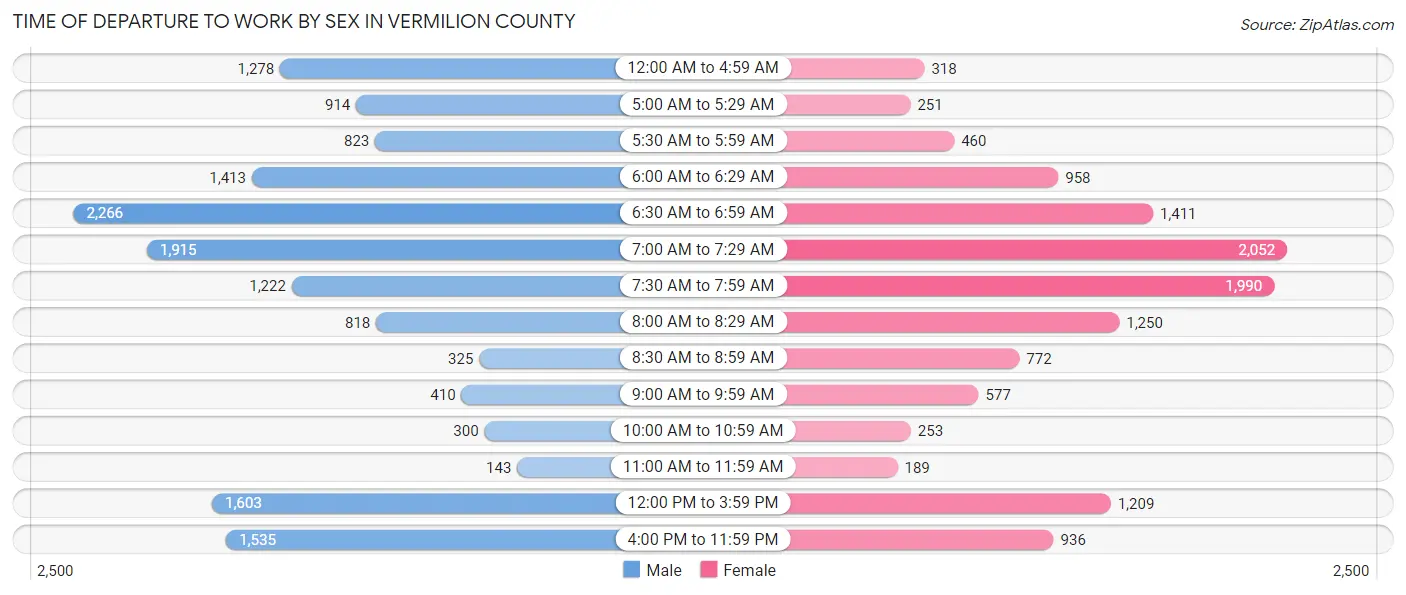
| Time of Departure | Male | Female |
| 12:00 AM to 4:59 AM | 1,278 (8.5%) | 318 (2.5%) |
| 5:00 AM to 5:29 AM | 914 (6.1%) | 251 (2.0%) |
| 5:30 AM to 5:59 AM | 823 (5.5%) | 460 (3.6%) |
| 6:00 AM to 6:29 AM | 1,413 (9.4%) | 958 (7.6%) |
| 6:30 AM to 6:59 AM | 2,266 (15.1%) | 1,411 (11.2%) |
| 7:00 AM to 7:29 AM | 1,915 (12.8%) | 2,052 (16.3%) |
| 7:30 AM to 7:59 AM | 1,222 (8.2%) | 1,990 (15.8%) |
| 8:00 AM to 8:29 AM | 818 (5.5%) | 1,250 (9.9%) |
| 8:30 AM to 8:59 AM | 325 (2.2%) | 772 (6.1%) |
| 9:00 AM to 9:59 AM | 410 (2.7%) | 577 (4.6%) |
| 10:00 AM to 10:59 AM | 300 (2.0%) | 253 (2.0%) |
| 11:00 AM to 11:59 AM | 143 (1.0%) | 189 (1.5%) |
| 12:00 PM to 3:59 PM | 1,603 (10.7%) | 1,209 (9.6%) |
| 4:00 PM to 11:59 PM | 1,535 (10.3%) | 936 (7.4%) |
| Total | 14,965 (100.0%) | 12,626 (100.0%) |
Housing Occupancy in Vermilion County
Occupancy by Ownership in Vermilion County
Of the total 29,904 dwellings in Vermilion County, owner-occupied units account for 20,781 (69.5%), while renter-occupied units make up 9,123 (30.5%).
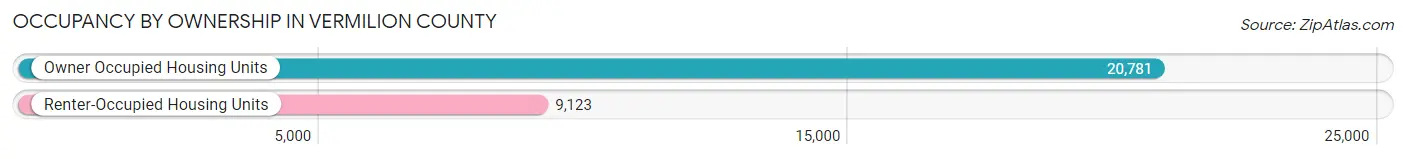
| Occupancy | # Housing Units | % Housing Units |
| Owner Occupied Housing Units | 20,781 | 69.5% |
| Renter-Occupied Housing Units | 9,123 | 30.5% |
| Total Occupied Housing Units | 29,904 | 100.0% |
Occupancy by Household Size in Vermilion County
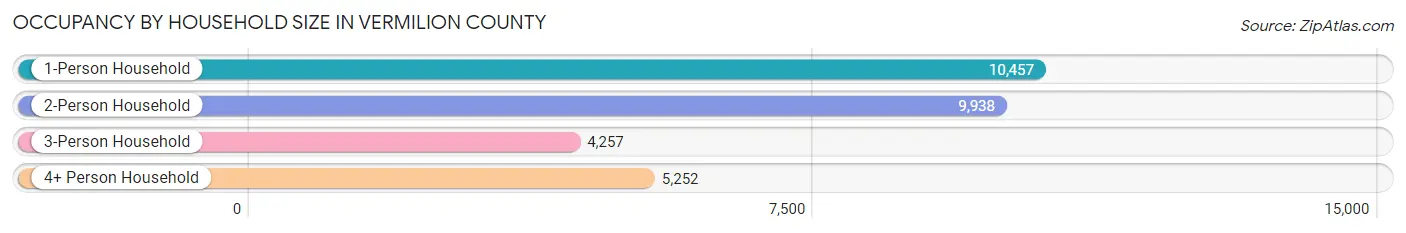
| Household Size | # Housing Units | % Housing Units |
| 1-Person Household | 10,457 | 35.0% |
| 2-Person Household | 9,938 | 33.2% |
| 3-Person Household | 4,257 | 14.2% |
| 4+ Person Household | 5,252 | 17.6% |
| Total Housing Units | 29,904 | 100.0% |
Occupancy by Ownership by Household Size in Vermilion County
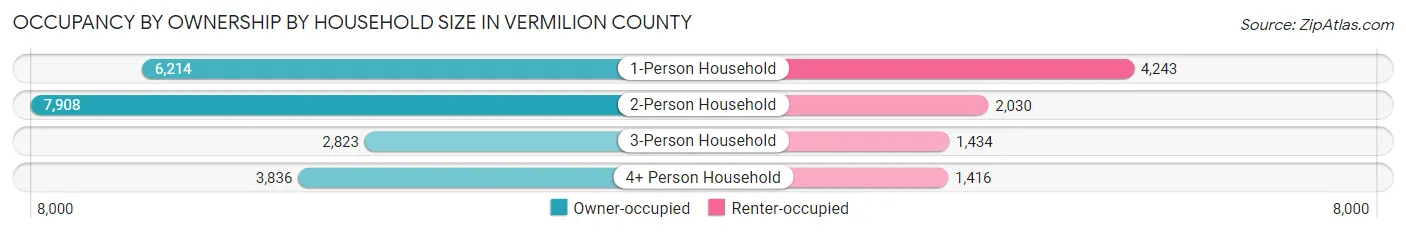
| Household Size | Owner-occupied | Renter-occupied |
| 1-Person Household | 6,214 (59.4%) | 4,243 (40.6%) |
| 2-Person Household | 7,908 (79.6%) | 2,030 (20.4%) |
| 3-Person Household | 2,823 (66.3%) | 1,434 (33.7%) |
| 4+ Person Household | 3,836 (73.0%) | 1,416 (27.0%) |
| Total Housing Units | 20,781 (69.5%) | 9,123 (30.5%) |
Occupancy by Educational Attainment in Vermilion County
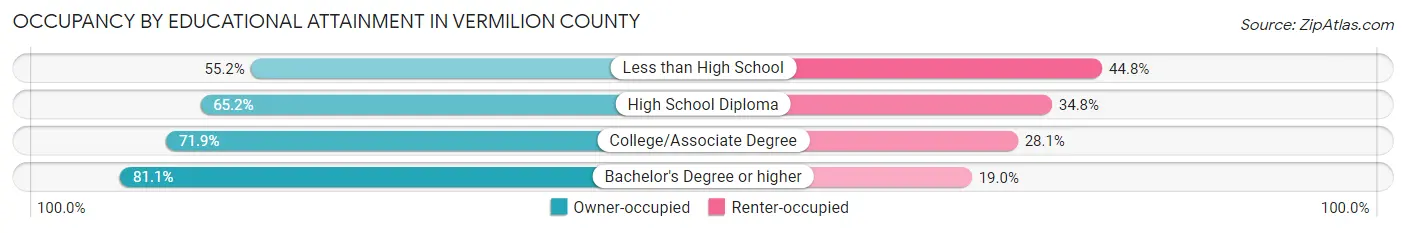
| Household Size | Owner-occupied | Renter-occupied |
| Less than High School | 1,223 (55.2%) | 993 (44.8%) |
| High School Diploma | 7,697 (65.2%) | 4,113 (34.8%) |
| College/Associate Degree | 7,964 (71.9%) | 3,106 (28.1%) |
| Bachelor's Degree or higher | 3,897 (81.0%) | 911 (19.0%) |
Occupancy by Age of Householder in Vermilion County
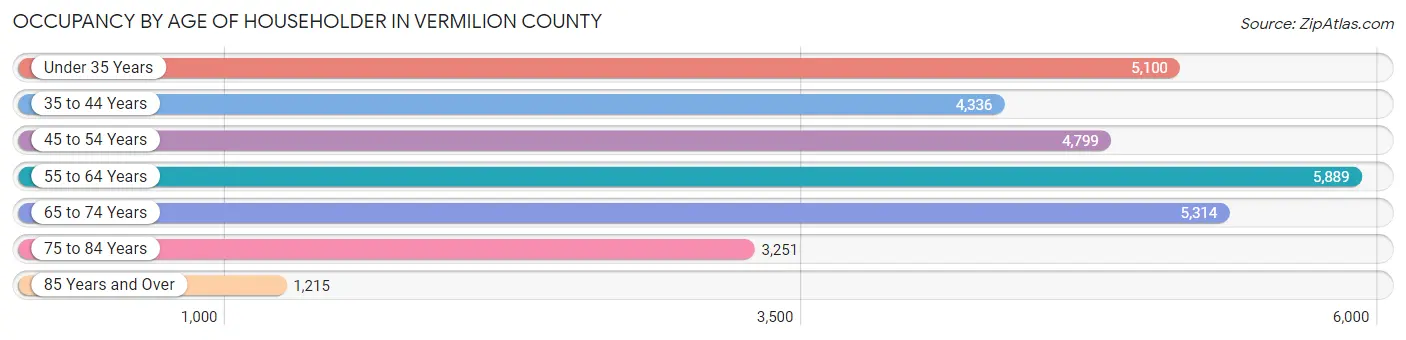
| Age Bracket | # Households | % Households |
| Under 35 Years | 5,100 | 17.1% |
| 35 to 44 Years | 4,336 | 14.5% |
| 45 to 54 Years | 4,799 | 16.1% |
| 55 to 64 Years | 5,889 | 19.7% |
| 65 to 74 Years | 5,314 | 17.8% |
| 75 to 84 Years | 3,251 | 10.9% |
| 85 Years and Over | 1,215 | 4.1% |
| Total | 29,904 | 100.0% |
Housing Finances in Vermilion County
Median Income by Occupancy in Vermilion County
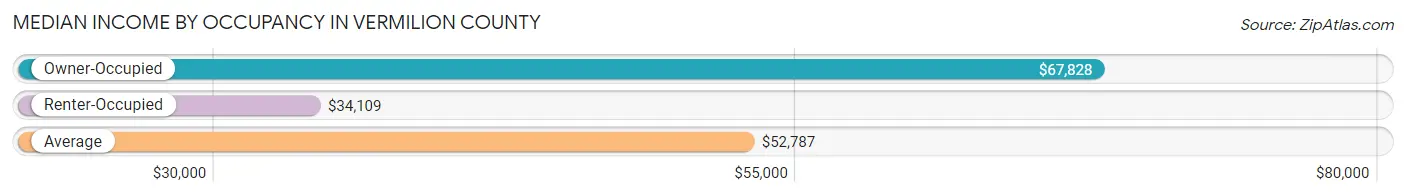
| Occupancy Type | # Households | Median Income |
| Owner-Occupied | 20,781 (69.5%) | $67,828 |
| Renter-Occupied | 9,123 (30.5%) | $34,109 |
| Average | 29,904 (100.0%) | $52,787 |
Occupancy by Householder Income Bracket in Vermilion County
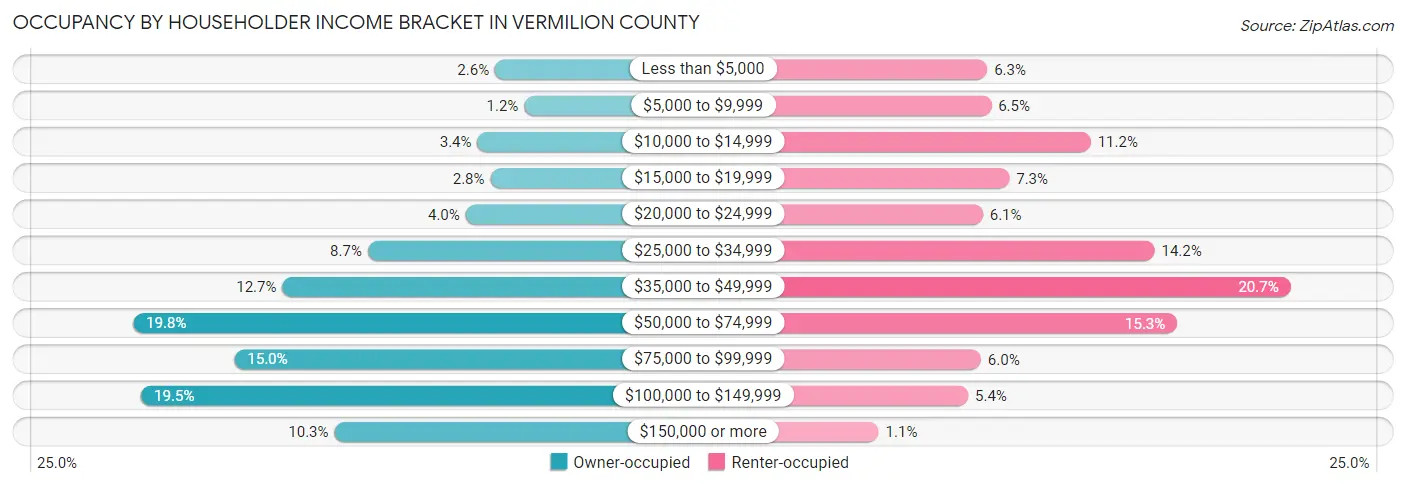
| Income Bracket | Owner-occupied | Renter-occupied |
| Less than $5,000 | 540 (2.6%) | 572 (6.3%) |
| $5,000 to $9,999 | 252 (1.2%) | 589 (6.5%) |
| $10,000 to $14,999 | 715 (3.4%) | 1,022 (11.2%) |
| $15,000 to $19,999 | 586 (2.8%) | 668 (7.3%) |
| $20,000 to $24,999 | 831 (4.0%) | 553 (6.1%) |
| $25,000 to $34,999 | 1,799 (8.7%) | 1,299 (14.2%) |
| $35,000 to $49,999 | 2,645 (12.7%) | 1,889 (20.7%) |
| $50,000 to $74,999 | 4,121 (19.8%) | 1,397 (15.3%) |
| $75,000 to $99,999 | 3,119 (15.0%) | 545 (6.0%) |
| $100,000 to $149,999 | 4,042 (19.5%) | 489 (5.4%) |
| $150,000 or more | 2,131 (10.2%) | 100 (1.1%) |
| Total | 20,781 (100.0%) | 9,123 (100.0%) |
Monthly Housing Cost Tiers in Vermilion County
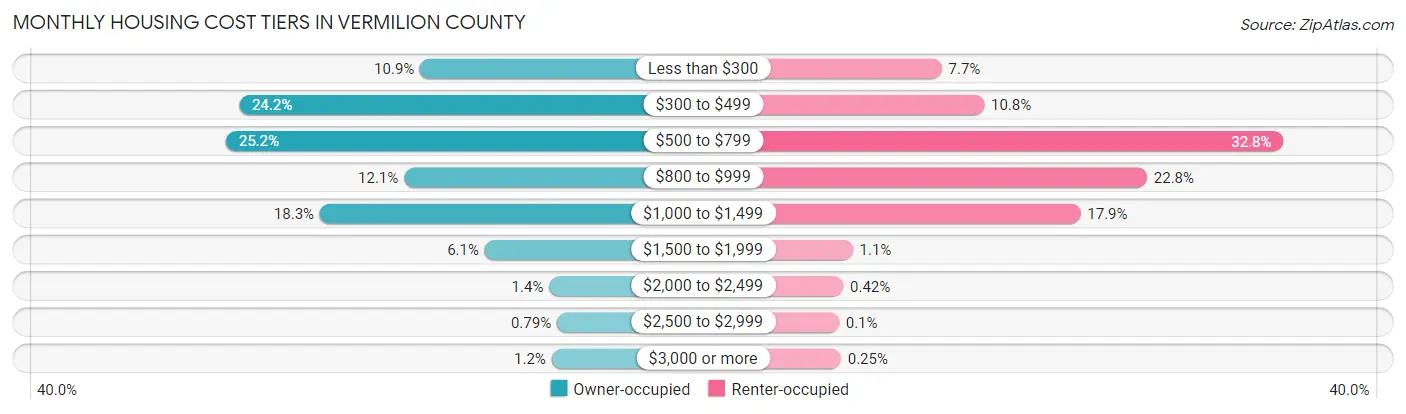
| Monthly Cost | Owner-occupied | Renter-occupied |
| Less than $300 | 2,259 (10.9%) | 700 (7.7%) |
| $300 to $499 | 5,031 (24.2%) | 985 (10.8%) |
| $500 to $799 | 5,233 (25.2%) | 2,996 (32.8%) |
| $800 to $999 | 2,504 (12.0%) | 2,079 (22.8%) |
| $1,000 to $1,499 | 3,792 (18.2%) | 1,632 (17.9%) |
| $1,500 to $1,999 | 1,270 (6.1%) | 102 (1.1%) |
| $2,000 to $2,499 | 282 (1.4%) | 38 (0.4%) |
| $2,500 to $2,999 | 164 (0.8%) | 9 (0.1%) |
| $3,000 or more | 246 (1.2%) | 23 (0.3%) |
| Total | 20,781 (100.0%) | 9,123 (100.0%) |
Physical Housing Characteristics in Vermilion County
Housing Structures in Vermilion County
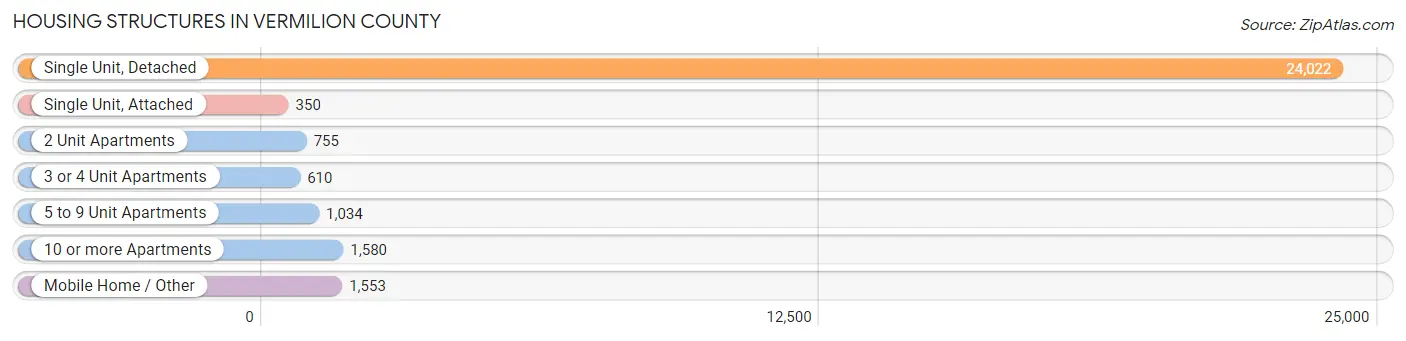
| Structure Type | # Housing Units | % Housing Units |
| Single Unit, Detached | 24,022 | 80.3% |
| Single Unit, Attached | 350 | 1.2% |
| 2 Unit Apartments | 755 | 2.5% |
| 3 or 4 Unit Apartments | 610 | 2.0% |
| 5 to 9 Unit Apartments | 1,034 | 3.5% |
| 10 or more Apartments | 1,580 | 5.3% |
| Mobile Home / Other | 1,553 | 5.2% |
| Total | 29,904 | 100.0% |
Housing Structures by Occupancy in Vermilion County
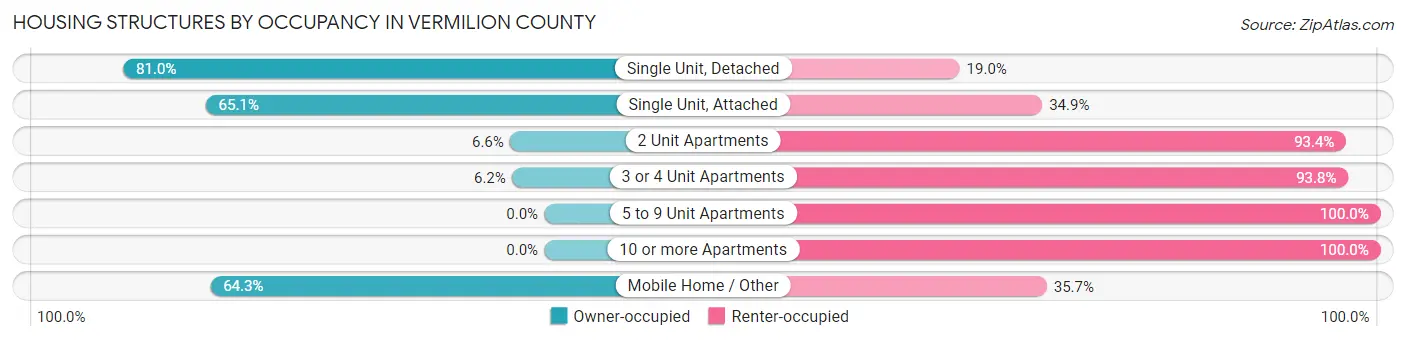
| Structure Type | Owner-occupied | Renter-occupied |
| Single Unit, Detached | 19,467 (81.0%) | 4,555 (19.0%) |
| Single Unit, Attached | 228 (65.1%) | 122 (34.9%) |
| 2 Unit Apartments | 50 (6.6%) | 705 (93.4%) |
| 3 or 4 Unit Apartments | 38 (6.2%) | 572 (93.8%) |
| 5 to 9 Unit Apartments | 0 (0.0%) | 1,034 (100.0%) |
| 10 or more Apartments | 0 (0.0%) | 1,580 (100.0%) |
| Mobile Home / Other | 998 (64.3%) | 555 (35.7%) |
| Total | 20,781 (69.5%) | 9,123 (30.5%) |
Housing Structures by Number of Rooms in Vermilion County
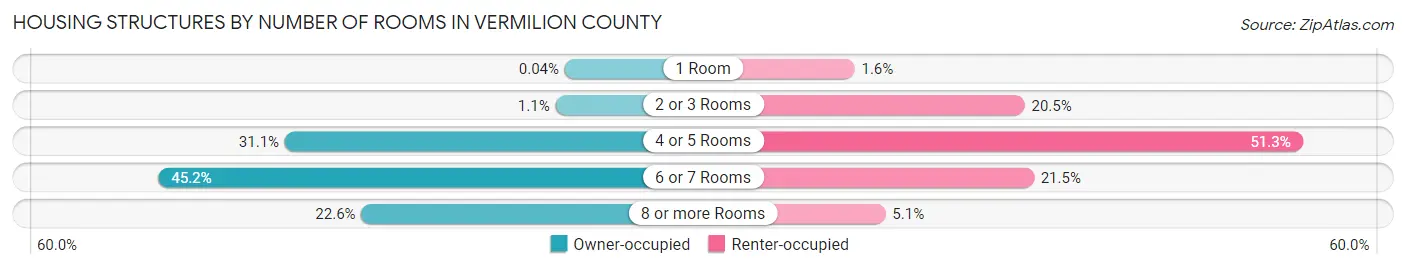
| Number of Rooms | Owner-occupied | Renter-occupied |
| 1 Room | 8 (0.0%) | 148 (1.6%) |
| 2 or 3 Rooms | 225 (1.1%) | 1,869 (20.5%) |
| 4 or 5 Rooms | 6,464 (31.1%) | 4,683 (51.3%) |
| 6 or 7 Rooms | 9,383 (45.2%) | 1,962 (21.5%) |
| 8 or more Rooms | 4,701 (22.6%) | 461 (5.1%) |
| Total | 20,781 (100.0%) | 9,123 (100.0%) |
Housing Structure by Heating Type in Vermilion County
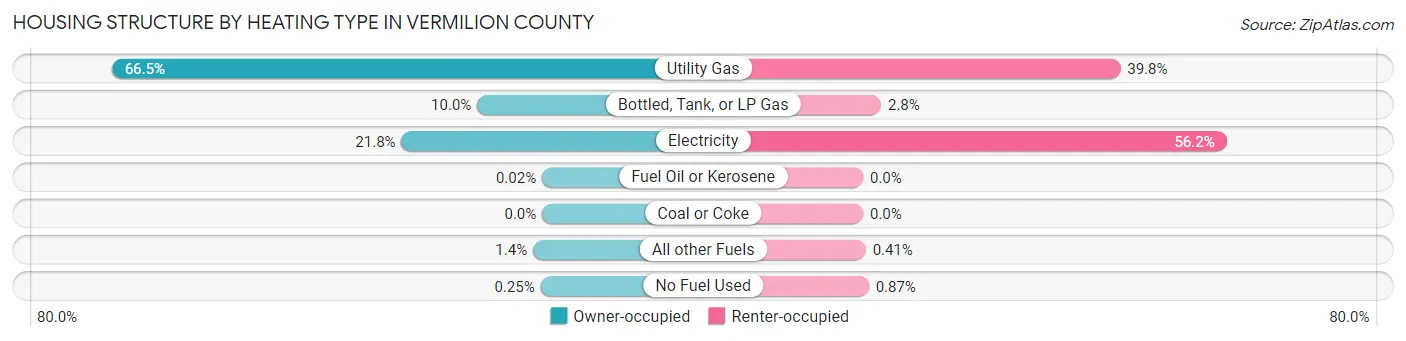
| Heating Type | Owner-occupied | Renter-occupied |
| Utility Gas | 13,826 (66.5%) | 3,628 (39.8%) |
| Bottled, Tank, or LP Gas | 2,087 (10.0%) | 254 (2.8%) |
| Electricity | 4,519 (21.7%) | 5,125 (56.2%) |
| Fuel Oil or Kerosene | 5 (0.0%) | 0 (0.0%) |
| Coal or Coke | 0 (0.0%) | 0 (0.0%) |
| All other Fuels | 292 (1.4%) | 37 (0.4%) |
| No Fuel Used | 52 (0.3%) | 79 (0.9%) |
| Total | 20,781 (100.0%) | 9,123 (100.0%) |
Household Vehicle Usage in Vermilion County
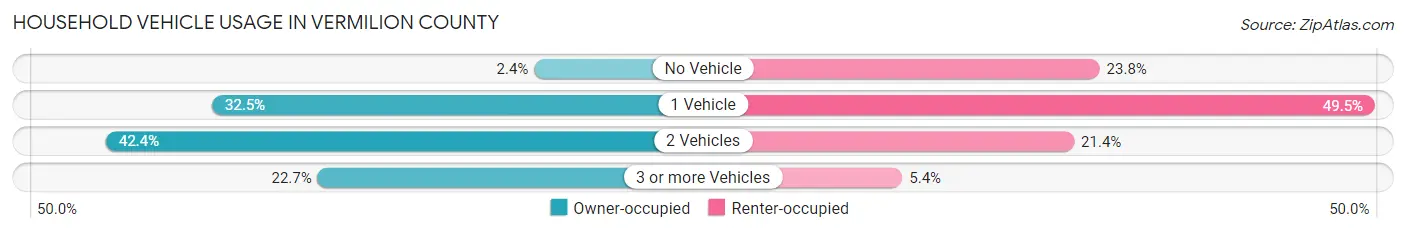
| Vehicles per Household | Owner-occupied | Renter-occupied |
| No Vehicle | 505 (2.4%) | 2,169 (23.8%) |
| 1 Vehicle | 6,755 (32.5%) | 4,513 (49.5%) |
| 2 Vehicles | 8,815 (42.4%) | 1,952 (21.4%) |
| 3 or more Vehicles | 4,706 (22.7%) | 489 (5.4%) |
| Total | 20,781 (100.0%) | 9,123 (100.0%) |
Real Estate & Mortgages in Vermilion County
Real Estate and Mortgage Overview in Vermilion County
| Characteristic | Without Mortgage | With Mortgage |
| Housing Units | 11,873 | 8,908 |
| Median Property Value | $82,700 | $103,700 |
| Median Household Income | $55,449 | $1,353 |
| Monthly Housing Costs | $452 | $225 |
| Real Estate Taxes | $1,350 | $314 |
Property Value by Mortgage Status in Vermilion County
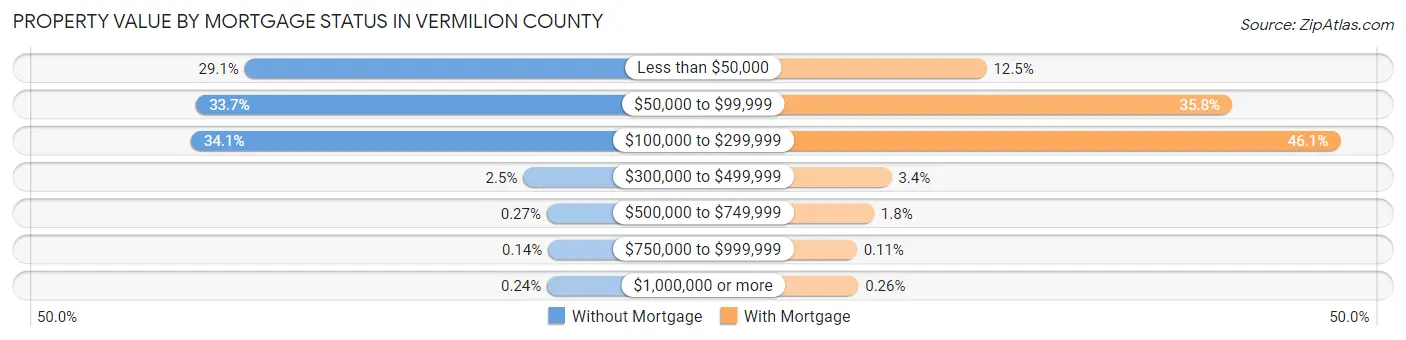
| Property Value | Without Mortgage | With Mortgage |
| Less than $50,000 | 3,449 (29.0%) | 1,111 (12.5%) |
| $50,000 to $99,999 | 3,995 (33.7%) | 3,193 (35.8%) |
| $100,000 to $299,999 | 4,053 (34.1%) | 4,110 (46.1%) |
| $300,000 to $499,999 | 298 (2.5%) | 305 (3.4%) |
| $500,000 to $749,999 | 32 (0.3%) | 156 (1.8%) |
| $750,000 to $999,999 | 17 (0.1%) | 10 (0.1%) |
| $1,000,000 or more | 29 (0.2%) | 23 (0.3%) |
| Total | 11,873 (100.0%) | 8,908 (100.0%) |
Household Income by Mortgage Status in Vermilion County
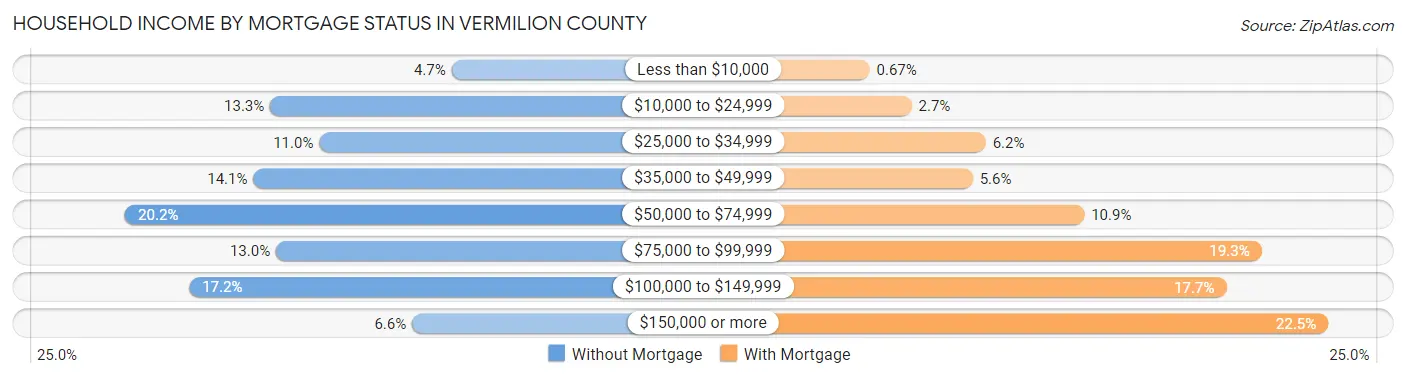
| Household Income | Without Mortgage | With Mortgage |
| Less than $10,000 | 554 (4.7%) | 60 (0.7%) |
| $10,000 to $24,999 | 1,580 (13.3%) | 238 (2.7%) |
| $25,000 to $34,999 | 1,302 (11.0%) | 552 (6.2%) |
| $35,000 to $49,999 | 1,675 (14.1%) | 497 (5.6%) |
| $50,000 to $74,999 | 2,399 (20.2%) | 970 (10.9%) |
| $75,000 to $99,999 | 1,547 (13.0%) | 1,722 (19.3%) |
| $100,000 to $149,999 | 2,038 (17.2%) | 1,572 (17.6%) |
| $150,000 or more | 778 (6.6%) | 2,004 (22.5%) |
| Total | 11,873 (100.0%) | 8,908 (100.0%) |
Property Value to Household Income Ratio in Vermilion County
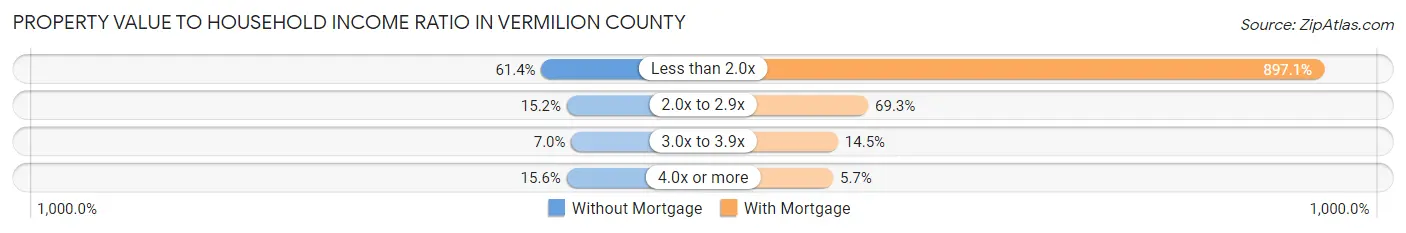
| Value-to-Income Ratio | Without Mortgage | With Mortgage |
| Less than 2.0x | 7,285 (61.4%) | 79,917 (897.1%) |
| 2.0x to 2.9x | 1,803 (15.2%) | 6,177 (69.3%) |
| 3.0x to 3.9x | 836 (7.0%) | 1,294 (14.5%) |
| 4.0x or more | 1,851 (15.6%) | 505 (5.7%) |
| Total | 11,873 (100.0%) | 8,908 (100.0%) |
Real Estate Taxes by Mortgage Status in Vermilion County
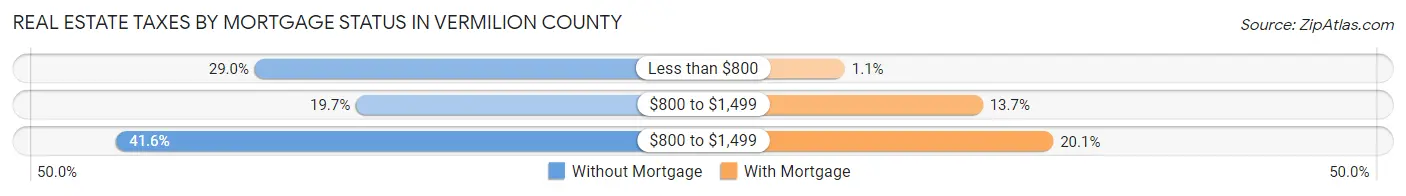
| Property Taxes | Without Mortgage | With Mortgage |
| Less than $800 | 3,441 (29.0%) | 96 (1.1%) |
| $800 to $1,499 | 2,342 (19.7%) | 1,218 (13.7%) |
| $800 to $1,499 | 4,941 (41.6%) | 1,791 (20.1%) |
| Total | 11,873 (100.0%) | 8,908 (100.0%) |
Health & Disability in Vermilion County
Health Insurance Coverage by Age in Vermilion County
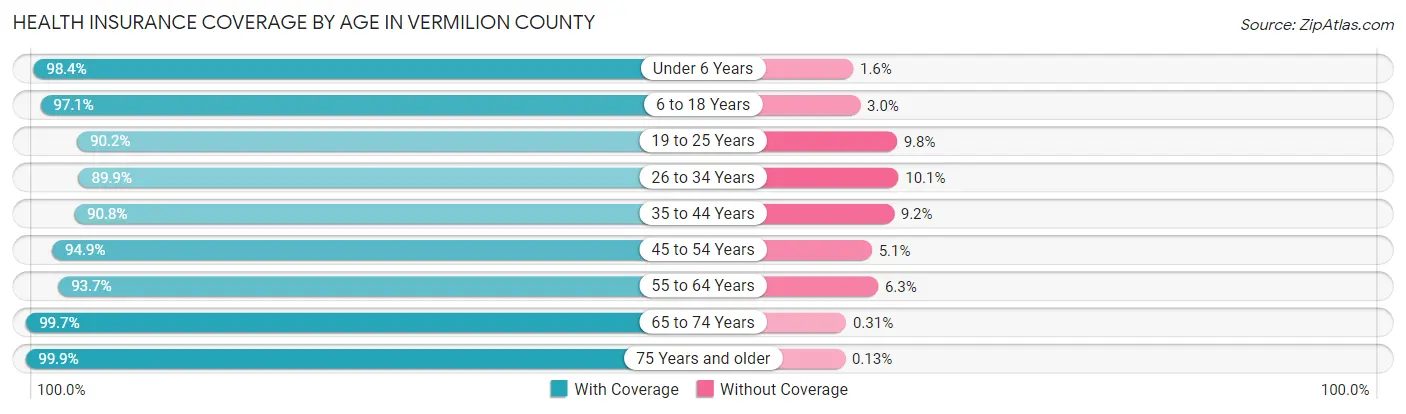
| Age Bracket | With Coverage | Without Coverage |
| Under 6 Years | 5,297 (98.4%) | 88 (1.6%) |
| 6 to 18 Years | 12,389 (97.1%) | 377 (2.9%) |
| 19 to 25 Years | 5,165 (90.2%) | 560 (9.8%) |
| 26 to 34 Years | 6,530 (89.9%) | 731 (10.1%) |
| 35 to 44 Years | 7,491 (90.8%) | 762 (9.2%) |
| 45 to 54 Years | 7,642 (94.9%) | 412 (5.1%) |
| 55 to 64 Years | 9,410 (93.7%) | 631 (6.3%) |
| 65 to 74 Years | 8,171 (99.7%) | 25 (0.3%) |
| 75 Years and older | 6,042 (99.9%) | 8 (0.1%) |
| Total | 68,137 (95.0%) | 3,594 (5.0%) |
Health Insurance Coverage by Citizenship Status in Vermilion County
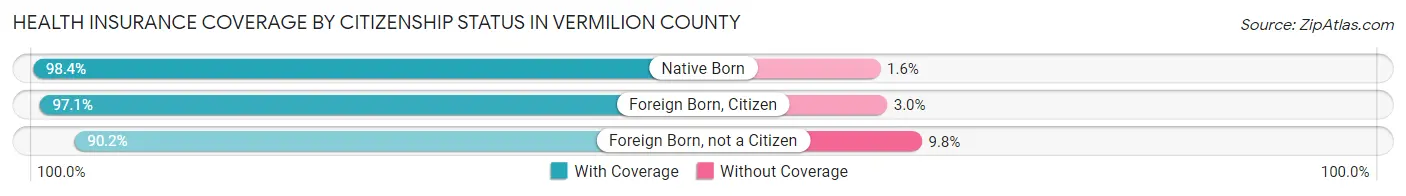
| Citizenship Status | With Coverage | Without Coverage |
| Native Born | 5,297 (98.4%) | 88 (1.6%) |
| Foreign Born, Citizen | 12,389 (97.1%) | 377 (2.9%) |
| Foreign Born, not a Citizen | 5,165 (90.2%) | 560 (9.8%) |
Health Insurance Coverage by Household Income in Vermilion County
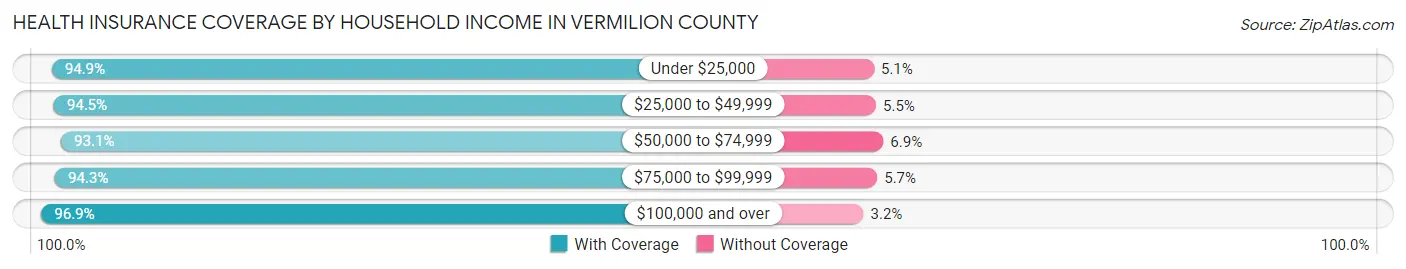
| Household Income | With Coverage | Without Coverage |
| Under $25,000 | 10,441 (94.9%) | 561 (5.1%) |
| $25,000 to $49,999 | 15,834 (94.5%) | 919 (5.5%) |
| $50,000 to $74,999 | 12,004 (93.1%) | 884 (6.9%) |
| $75,000 to $99,999 | 9,437 (94.3%) | 572 (5.7%) |
| $100,000 and over | 20,228 (96.9%) | 657 (3.2%) |
Public vs Private Health Insurance Coverage by Age in Vermilion County
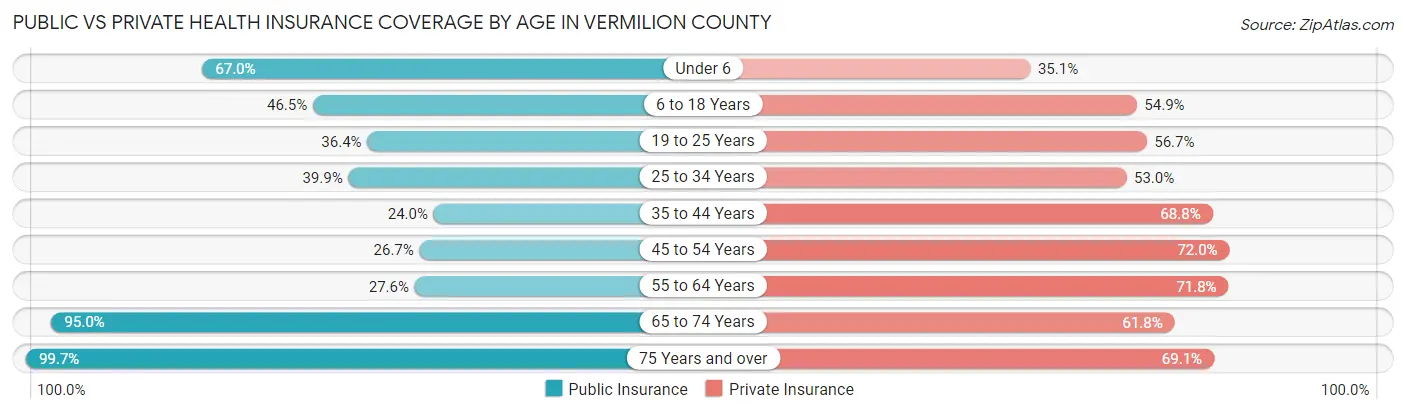
| Age Bracket | Public Insurance | Private Insurance |
| Under 6 | 3,608 (67.0%) | 1,891 (35.1%) |
| 6 to 18 Years | 5,931 (46.5%) | 7,005 (54.9%) |
| 19 to 25 Years | 2,082 (36.4%) | 3,246 (56.7%) |
| 25 to 34 Years | 2,896 (39.9%) | 3,845 (52.9%) |
| 35 to 44 Years | 1,984 (24.0%) | 5,678 (68.8%) |
| 45 to 54 Years | 2,149 (26.7%) | 5,795 (72.0%) |
| 55 to 64 Years | 2,769 (27.6%) | 7,205 (71.8%) |
| 65 to 74 Years | 7,788 (95.0%) | 5,061 (61.8%) |
| 75 Years and over | 6,034 (99.7%) | 4,178 (69.1%) |
| Total | 35,241 (49.1%) | 43,904 (61.2%) |
Disability Status by Sex by Age in Vermilion County

| Age Bracket | Male | Female |
| Under 5 Years | 0 (0.0%) | 80 (3.6%) |
| 5 to 17 Years | 399 (6.0%) | 351 (5.7%) |
| 18 to 34 Years | 517 (7.4%) | 374 (5.5%) |
| 35 to 64 Years | 1,837 (14.3%) | 2,235 (16.6%) |
| 65 to 74 Years | 1,173 (31.2%) | 1,064 (24.0%) |
| 75 Years and over | 1,056 (41.3%) | 1,289 (36.9%) |
Disability Class by Sex by Age in Vermilion County
Disability Class: Hearing Difficulty
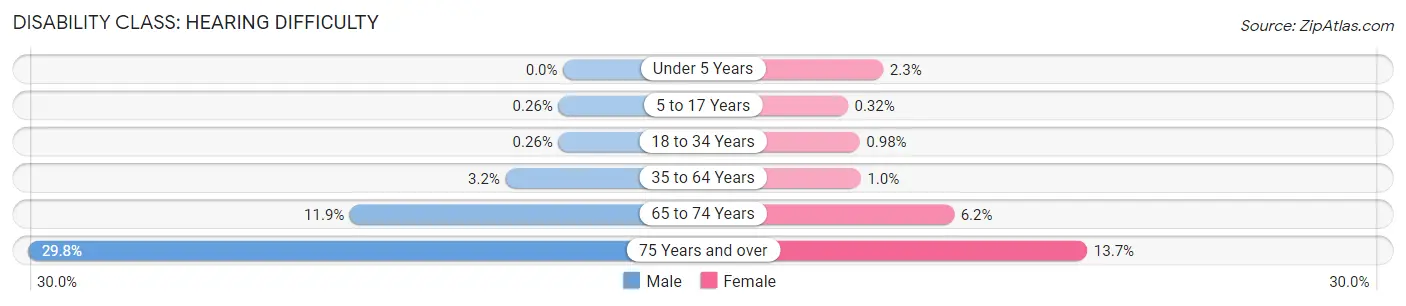
| Age Bracket | Male | Female |
| Under 5 Years | 0 (0.0%) | 51 (2.3%) |
| 5 to 17 Years | 17 (0.3%) | 20 (0.3%) |
| 18 to 34 Years | 18 (0.3%) | 67 (1.0%) |
| 35 to 64 Years | 412 (3.2%) | 141 (1.0%) |
| 65 to 74 Years | 447 (11.9%) | 276 (6.2%) |
| 75 Years and over | 761 (29.8%) | 477 (13.7%) |
Disability Class: Vision Difficulty
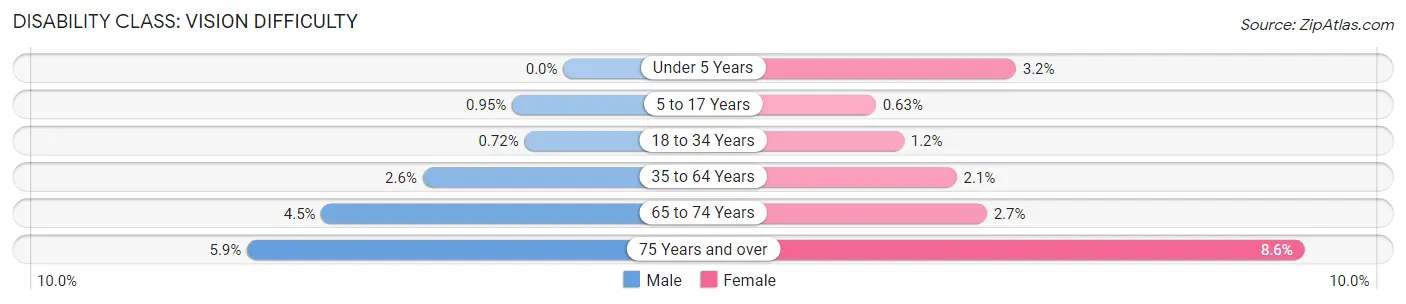
| Age Bracket | Male | Female |
| Under 5 Years | 0 (0.0%) | 72 (3.2%) |
| 5 to 17 Years | 63 (0.9%) | 39 (0.6%) |
| 18 to 34 Years | 50 (0.7%) | 79 (1.1%) |
| 35 to 64 Years | 336 (2.6%) | 287 (2.1%) |
| 65 to 74 Years | 169 (4.5%) | 119 (2.7%) |
| 75 Years and over | 150 (5.9%) | 300 (8.6%) |
Disability Class: Cognitive Difficulty
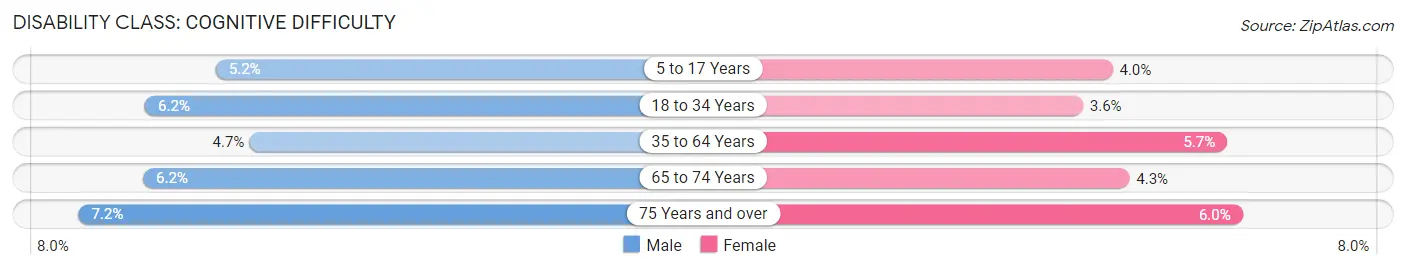
| Age Bracket | Male | Female |
| 5 to 17 Years | 341 (5.2%) | 249 (4.0%) |
| 18 to 34 Years | 432 (6.2%) | 245 (3.6%) |
| 35 to 64 Years | 598 (4.6%) | 772 (5.7%) |
| 65 to 74 Years | 235 (6.2%) | 189 (4.3%) |
| 75 Years and over | 184 (7.2%) | 208 (5.9%) |
Disability Class: Ambulatory Difficulty
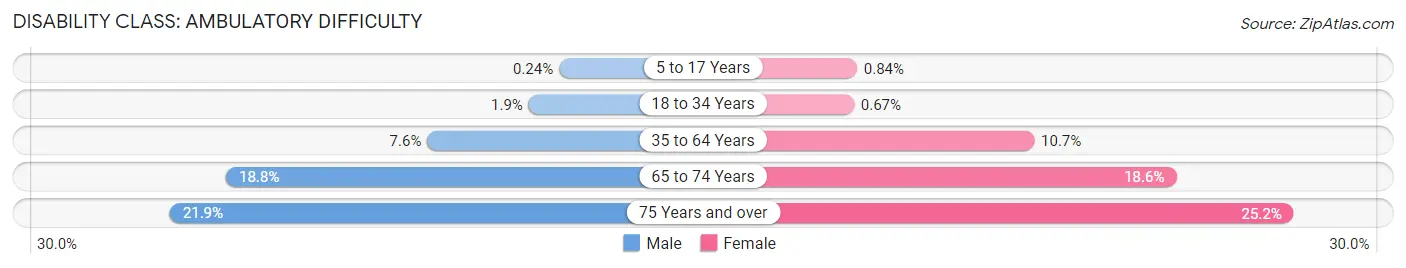
| Age Bracket | Male | Female |
| 5 to 17 Years | 16 (0.2%) | 52 (0.8%) |
| 18 to 34 Years | 134 (1.9%) | 46 (0.7%) |
| 35 to 64 Years | 974 (7.6%) | 1,445 (10.7%) |
| 65 to 74 Years | 707 (18.8%) | 825 (18.6%) |
| 75 Years and over | 560 (21.9%) | 879 (25.2%) |
Disability Class: Self-Care Difficulty
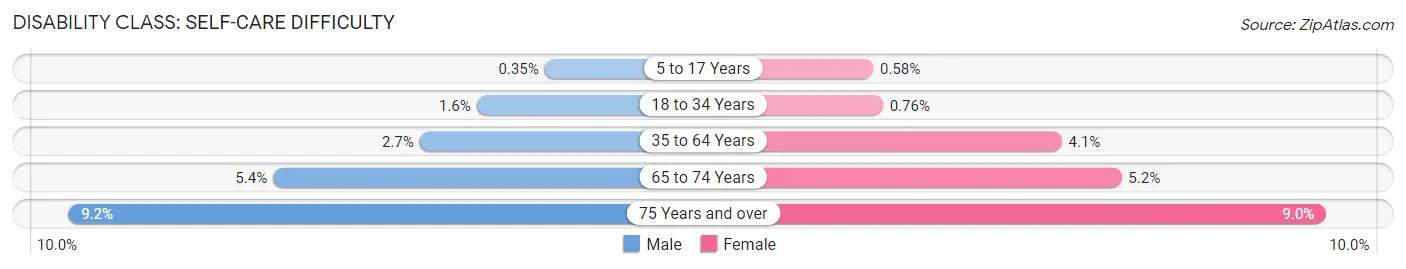
| Age Bracket | Male | Female |
| 5 to 17 Years | 23 (0.4%) | 36 (0.6%) |
| 18 to 34 Years | 112 (1.6%) | 52 (0.8%) |
| 35 to 64 Years | 343 (2.7%) | 550 (4.1%) |
| 65 to 74 Years | 203 (5.4%) | 230 (5.2%) |
| 75 Years and over | 235 (9.2%) | 314 (9.0%) |
Technology Access in Vermilion County
Computing Device Access in Vermilion County
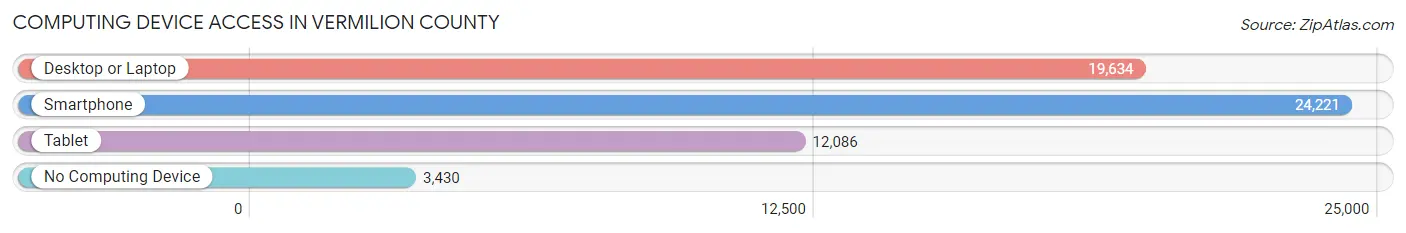
| Device Type | # Households | % Households |
| Desktop or Laptop | 19,634 | 65.7% |
| Smartphone | 24,221 | 81.0% |
| Tablet | 12,086 | 40.4% |
| No Computing Device | 3,430 | 11.5% |
| Total | 29,904 | 100.0% |
Internet Access in Vermilion County
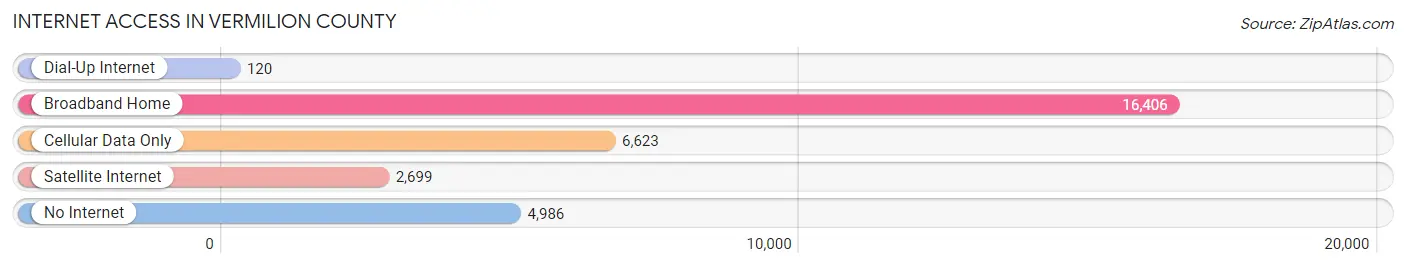
| Internet Type | # Households | % Households |
| Dial-Up Internet | 120 | 0.4% |
| Broadband Home | 16,406 | 54.9% |
| Cellular Data Only | 6,623 | 22.2% |
| Satellite Internet | 2,699 | 9.0% |
| No Internet | 4,986 | 16.7% |
| Total | 29,904 | 100.0% |
Vermilion County Summary
Vermilion County is located in the eastern part of the state of Illinois, in the United States. It is part of the Danville, Illinois Metropolitan Statistical Area. The county was established in 1826 and named after the Vermilion River, which runs through the county. As of the 2010 census, the population was 81,625.
Geography
Vermilion County is located in east-central Illinois, and is bordered by Champaign County to the north, Edgar County to the east, Iroquois County to the south, and Douglas and Champaign counties to the west. The county has a total area of 576 square miles, of which 574 square miles is land and 2.2 square miles is water. The county is drained by the Vermilion River, which runs through the county from north to south.
The county is mostly flat, with some rolling hills in the northern and western parts. The highest point in the county is located in the northwest corner, at an elevation of 890 feet. The county is mostly rural, with some small towns and villages scattered throughout.
Demographics
As of the 2010 census, there were 81,625 people, 32,845 households, and 22,845 families residing in the county. The population density was 142 people per square mile. There were 35,845 housing units at an average density of 62 per square mile. The racial makeup of the county was 92.2% White, 4.2% African American, 0.4% Native American, 0.7% Asian, 0.1% Pacific Islander, 1.2% from other races, and 1.2% from two or more races. Hispanic or Latino of any race were 3.2% of the population.
There were 32,845 households, out of which 30.2% had children under the age of 18 living with them, 54.2% were married couples living together, 10.3% had a female householder with no husband present, and 30.9% were non-families. 25.7% of all households were made up of individuals, and 11.2% had someone living alone who was 65 years of age or older. The average household size was 2.48 and the average family size was 2.97.
The median age in the county was 40.3 years. 24.2% of residents were under the age of 18; 7.7% were between the ages of 18 and 24; 24.2% were from 25 to 44; 27.2% were from 45 to 64; and 16.7% were 65 years of age or older. The gender makeup of the county was 48.3% male and 51.7% female.
Economy
Vermilion County is largely rural, and the economy is largely based on agriculture. The county is home to several large farms, and the main crops grown in the county are corn, soybeans, and wheat. The county is also home to several small businesses, including manufacturing, retail, and service industries.
The county is home to several large employers, including the Danville Correctional Center, the Vermilion County Health Department, and the Vermilion County Board of Education. The county is also home to several small businesses, including restaurants, retail stores, and service providers.
The median household income in the county was $50,845 in 2019, and the median family income was $60,945. The per capita income was $25,845. About 11.2% of families and 14.2% of the population were below the poverty line, including 19.2% of those under age 18 and 8.2% of those age 65 or over.
Conclusion
Vermilion County is a rural county located in east-central Illinois. It is home to 81,625 people, and the economy is largely based on agriculture. The county is home to several large employers, as well as small businesses, and the median household income is $50,845. The county is largely rural, with some small towns and villages scattered throughout.
Common Questions
What is the Total Population of Vermilion County?
Total Population of Vermilion County is 74,113.
What is the Total Male Population of Vermilion County?
Total Male Population of Vermilion County is 37,165.
What is the Total Female Population of Vermilion County?
Total Female Population of Vermilion County is 36,948.
What is the Ratio of Males per 100 Females in Vermilion County?
There are 100.59 Males per 100 Females in Vermilion County.
What is the Ratio of Females per 100 Males in Vermilion County?
There are 99.42 Females per 100 Males in Vermilion County.
What is the Median Population Age in Vermilion County?
Median Population Age in Vermilion County is 40.8 Years.
What is the Average Family Size in Vermilion County
Average Family Size in Vermilion County is 3.1 People.
What is the Average Household Size in Vermilion County
Average Household Size in Vermilion County is 2.4 People.
What is Per Capita Income in Vermilion County?
Per Capita income in Vermilion County is $28,933.
What is the Median Family Income in Vermilion County?
Median Family Income in Vermilion County is $70,370.
What is the Median Household income in Vermilion County?
Median Household Income in Vermilion County is $52,787.
What is Income or Wage Gap in Vermilion County?
Income or Wage Gap in Vermilion County is 34.8%.
Women in Vermilion County earn 65.2 cents for every dollar earned by a man.
What is Family Income Deficit in Vermilion County?
Family Income Deficit in Vermilion County is $11,048.
Families that are below poverty line in Vermilion County earn $11,048 less on average than the poverty threshold level.
What is Inequality or Gini Index in Vermilion County?
Inequality or Gini Index in Vermilion County is 0.43.
How Large is the Labor Force in Vermilion County?
There are 32,638 People in the Labor Forcein in Vermilion County.
What is the Percentage of People in the Labor Force in Vermilion County?
55.6% of People are in the Labor Force in Vermilion County.
What is the Unemployment Rate in Vermilion County?
Unemployment Rate in Vermilion County is 6.7%.