Union County, IL
Union County Map
Union County Overview
17,122
TOTAL POPULATION
8,662
MALE POPULATION
8,460
FEMALE POPULATION
102.39
MALES / 100 FEMALES
97.67
FEMALES / 100 MALES
44.7
MEDIAN AGE
3.1
AVG FAMILY SIZE
2.4
AVG HOUSEHOLD SIZE
$30,171
PER CAPITA INCOME
$77,414
AVG FAMILY INCOME
$54,090
AVG HOUSEHOLD INCOME
35.9%
WAGE / INCOME GAP [ % ]
64.1¢/ $1
WAGE / INCOME GAP [ $ ]
$9,560
FAMILY INCOME DEFICIT
0.45
INEQUALITY / GINI INDEX
7,241
LABOR FORCE [ PEOPLE ]
51.4%
PERCENT IN LABOR FORCE
6.3%
UNEMPLOYMENT RATE
Union County Area Codes
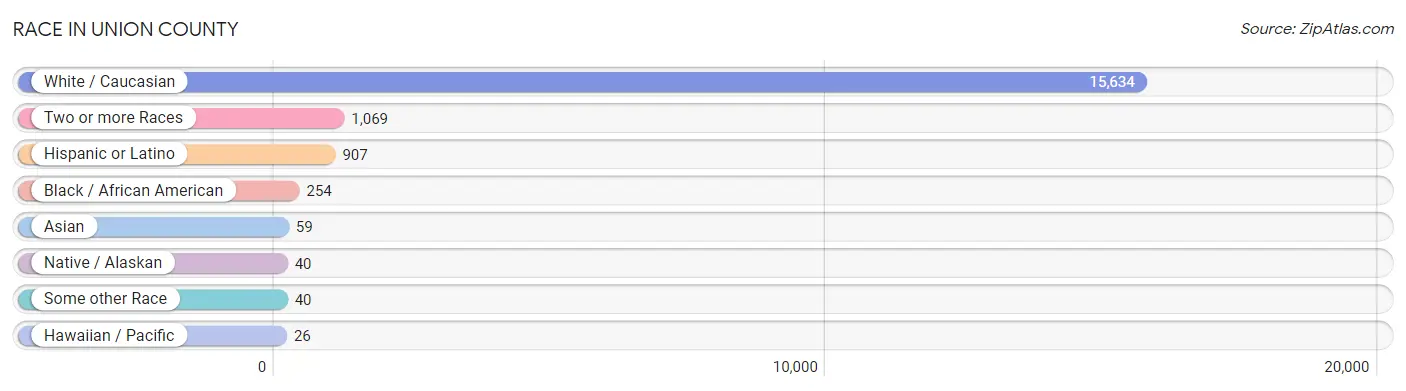
Race in Union County
The most populous races in Union County are White / Caucasian (15,634 | 91.3%), Two or more Races (1,069 | 6.2%), and Hispanic or Latino (907 | 5.3%).
| Race | # Population | % Population |
| Asian | 59 | 0.3% |
| Black / African American | 254 | 1.5% |
| Hawaiian / Pacific | 26 | 0.2% |
| Hispanic or Latino | 907 | 5.3% |
| Native / Alaskan | 40 | 0.2% |
| White / Caucasian | 15,634 | 91.3% |
| Two or more Races | 1,069 | 6.2% |
| Some other Race | 40 | 0.2% |
| Total | 17,122 | 100.0% |
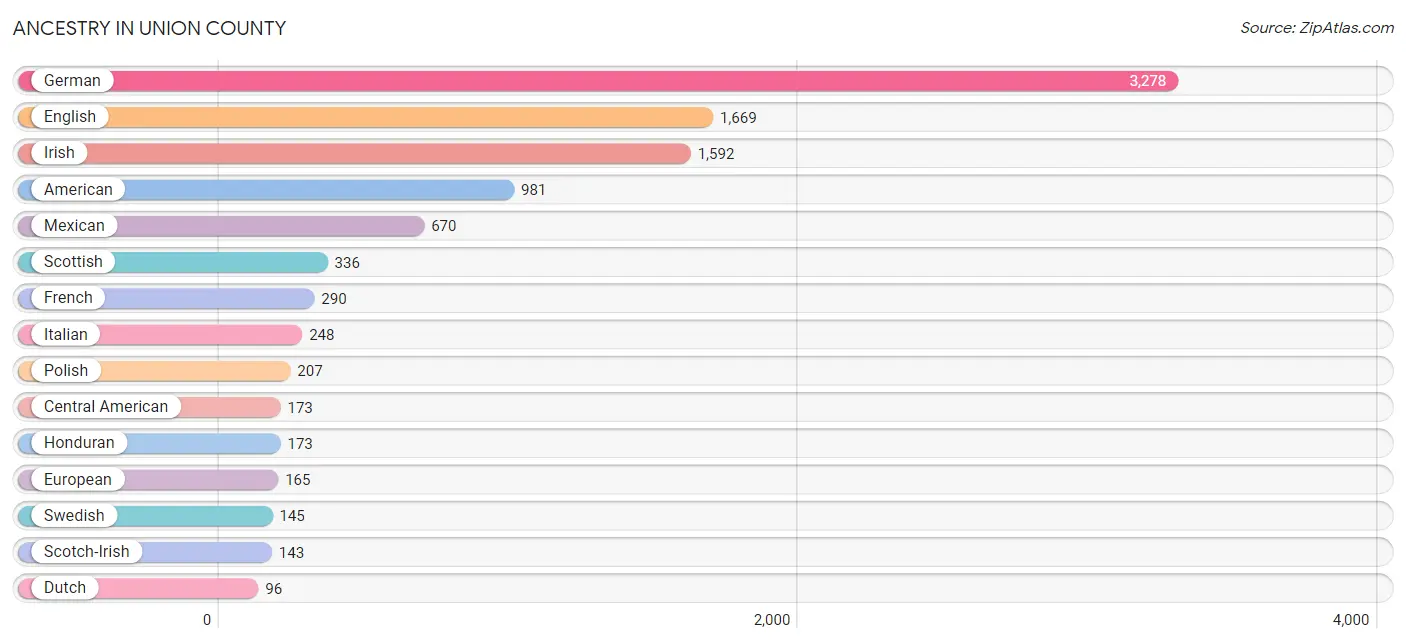
Ancestry in Union County
The most populous ancestries reported in Union County are German (3,278 | 19.1%), English (1,669 | 9.8%), Irish (1,592 | 9.3%), American (981 | 5.7%), and Mexican (670 | 3.9%), together accounting for 47.8% of all Union County residents.
| Ancestry | # Population | % Population |
| African | 4 | 0.0% |
| American | 981 | 5.7% |
| Arab | 7 | 0.0% |
| Austrian | 36 | 0.2% |
| Bhutanese | 10 | 0.1% |
| British | 37 | 0.2% |
| Burmese | 7 | 0.0% |
| Canadian | 22 | 0.1% |
| Central American | 173 | 1.0% |
| Cherokee | 30 | 0.2% |
| Chippewa | 2 | 0.0% |
| Croatian | 8 | 0.1% |
| Czech | 5 | 0.0% |
| Czechoslovakian | 6 | 0.0% |
| Danish | 17 | 0.1% |
| Dutch | 96 | 0.6% |
| Eastern European | 17 | 0.1% |
| English | 1,669 | 9.8% |
| European | 165 | 1.0% |
| French | 290 | 1.7% |
| French Canadian | 6 | 0.0% |
| German | 3,278 | 19.1% |
| Greek | 2 | 0.0% |
| Honduran | 173 | 1.0% |
| Hungarian | 6 | 0.0% |
| Indian (Asian) | 40 | 0.2% |
| Irish | 1,592 | 9.3% |
| Italian | 248 | 1.5% |
| Jamaican | 13 | 0.1% |
| Korean | 25 | 0.2% |
| Lebanese | 7 | 0.0% |
| Lithuanian | 29 | 0.2% |
| Mexican | 670 | 3.9% |
| Mexican American Indian | 12 | 0.1% |
| Native Hawaiian | 30 | 0.2% |
| Navajo | 1 | 0.0% |
| Northern European | 18 | 0.1% |
| Norwegian | 55 | 0.3% |
| Pennsylvania German | 4 | 0.0% |
| Peruvian | 1 | 0.0% |
| Polish | 207 | 1.2% |
| Puerto Rican | 4 | 0.0% |
| Russian | 32 | 0.2% |
| Scandinavian | 20 | 0.1% |
| Scotch-Irish | 143 | 0.8% |
| Scottish | 336 | 2.0% |
| Shoshone | 12 | 0.1% |
| Sioux | 8 | 0.1% |
| South American | 1 | 0.0% |
| Spaniard | 21 | 0.1% |
| Spanish | 37 | 0.2% |
| Sri Lankan | 12 | 0.1% |
| Subsaharan African | 4 | 0.0% |
| Swedish | 145 | 0.9% |
| Swiss | 3 | 0.0% |
| Syrian | 7 | 0.0% |
| Turkish | 8 | 0.1% |
| Welsh | 79 | 0.5% | View All 58 Rows |
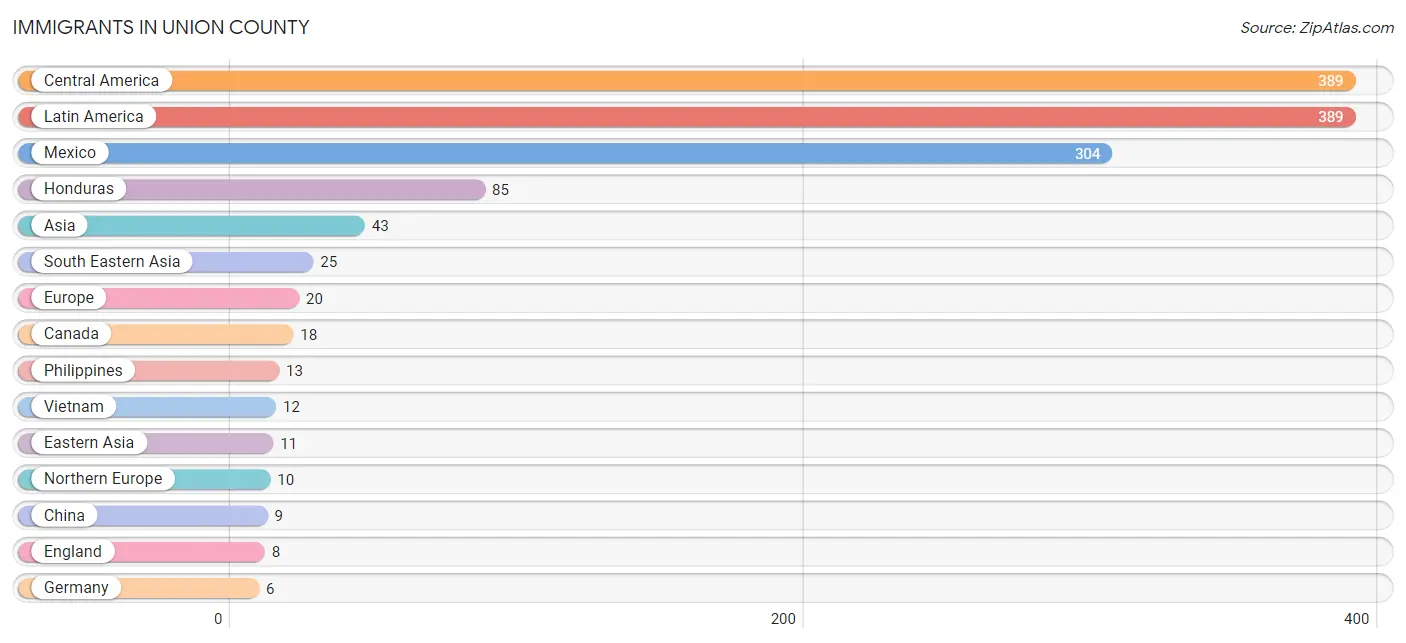
Immigrants in Union County
The most numerous immigrant groups reported in Union County came from Central America (389 | 2.3%), Latin America (389 | 2.3%), Mexico (304 | 1.8%), Honduras (85 | 0.5%), and Asia (43 | 0.3%), together accounting for 7.1% of all Union County residents.
| Immigration Origin | # Population | % Population |
| Asia | 43 | 0.3% |
| Bangladesh | 5 | 0.0% |
| Canada | 18 | 0.1% |
| Central America | 389 | 2.3% |
| China | 9 | 0.1% |
| Eastern Asia | 11 | 0.1% |
| Eastern Europe | 4 | 0.0% |
| England | 8 | 0.1% |
| Europe | 20 | 0.1% |
| Germany | 6 | 0.0% |
| Honduras | 85 | 0.5% |
| Korea | 2 | 0.0% |
| Latin America | 389 | 2.3% |
| Lithuania | 4 | 0.0% |
| Mexico | 304 | 1.8% |
| Northern Europe | 10 | 0.1% |
| Philippines | 13 | 0.1% |
| South Central Asia | 5 | 0.0% |
| South Eastern Asia | 25 | 0.2% |
| Sweden | 2 | 0.0% |
| Turkey | 2 | 0.0% |
| Vietnam | 12 | 0.1% |
| Western Asia | 2 | 0.0% |
| Western Europe | 6 | 0.0% | View All 24 Rows |
Sex and Age in Union County
Sex and Age in Union County
The most populous age groups in Union County are 55 to 59 Years (687 | 7.9%) for men and 55 to 59 Years (605 | 7.1%) for women.
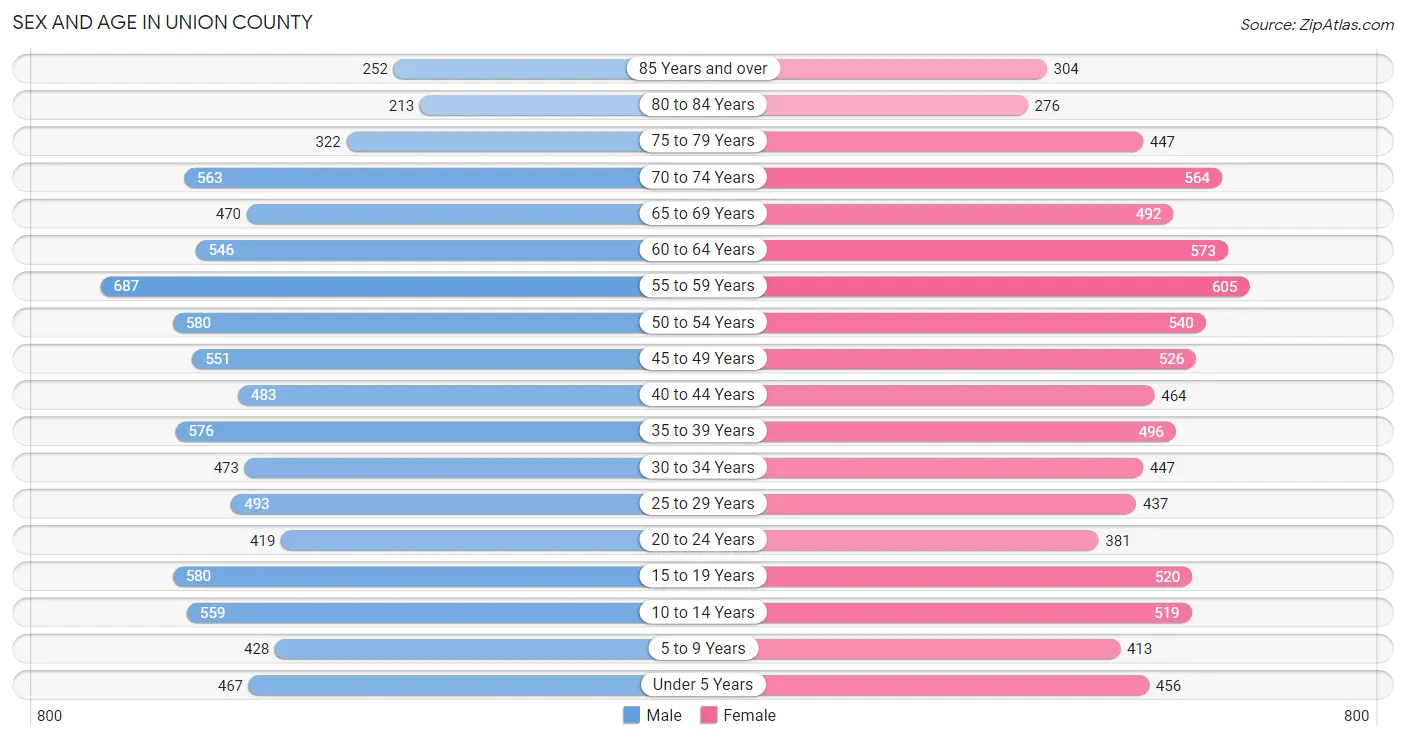
| Age Bracket | Male | Female |
| Under 5 Years | 467 (5.4%) | 456 (5.4%) |
| 5 to 9 Years | 428 (4.9%) | 413 (4.9%) |
| 10 to 14 Years | 559 (6.5%) | 519 (6.1%) |
| 15 to 19 Years | 580 (6.7%) | 520 (6.1%) |
| 20 to 24 Years | 419 (4.8%) | 381 (4.5%) |
| 25 to 29 Years | 493 (5.7%) | 437 (5.2%) |
| 30 to 34 Years | 473 (5.5%) | 447 (5.3%) |
| 35 to 39 Years | 576 (6.7%) | 496 (5.9%) |
| 40 to 44 Years | 483 (5.6%) | 464 (5.5%) |
| 45 to 49 Years | 551 (6.4%) | 526 (6.2%) |
| 50 to 54 Years | 580 (6.7%) | 540 (6.4%) |
| 55 to 59 Years | 687 (7.9%) | 605 (7.1%) |
| 60 to 64 Years | 546 (6.3%) | 573 (6.8%) |
| 65 to 69 Years | 470 (5.4%) | 492 (5.8%) |
| 70 to 74 Years | 563 (6.5%) | 564 (6.7%) |
| 75 to 79 Years | 322 (3.7%) | 447 (5.3%) |
| 80 to 84 Years | 213 (2.5%) | 276 (3.3%) |
| 85 Years and over | 252 (2.9%) | 304 (3.6%) |
| Total | 8,662 (100.0%) | 8,460 (100.0%) |
Families and Households in Union County
Median Family Size in Union County
The median family size in Union County is 3.11 persons per family, with single male/father families (363 | 8.8%) accounting for the largest median family size of 3.34 persons per family. On the other hand, single female/mother families (469 | 11.4%) represent the smallest median family size with 2.88 persons per family.
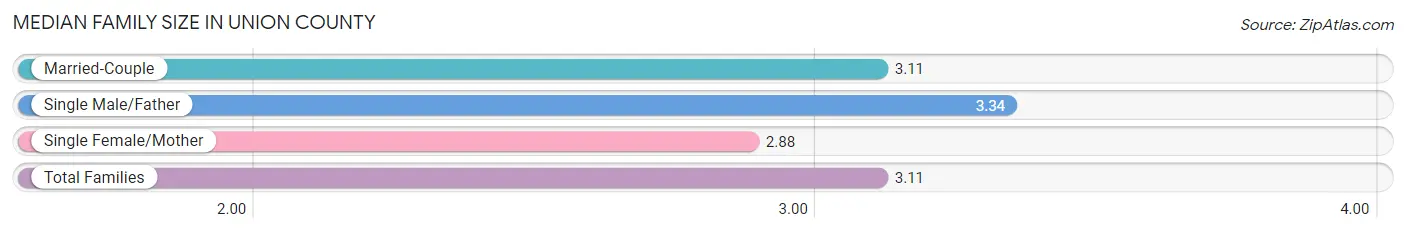
| Family Type | # Families | Family Size |
| Married-Couple | 3,279 (79.8%) | 3.11 |
| Single Male/Father | 363 (8.8%) | 3.34 |
| Single Female/Mother | 469 (11.4%) | 2.88 |
| Total Families | 4,111 (100.0%) | 3.11 |
Median Household Size in Union County
The median household size in Union County is 2.44 persons per household, with single male/father households (363 | 5.4%) accounting for the largest median household size of 3.96 persons per household. non-family households (2,652 | 39.2%) represent the smallest median household size with 1.21 persons per household.
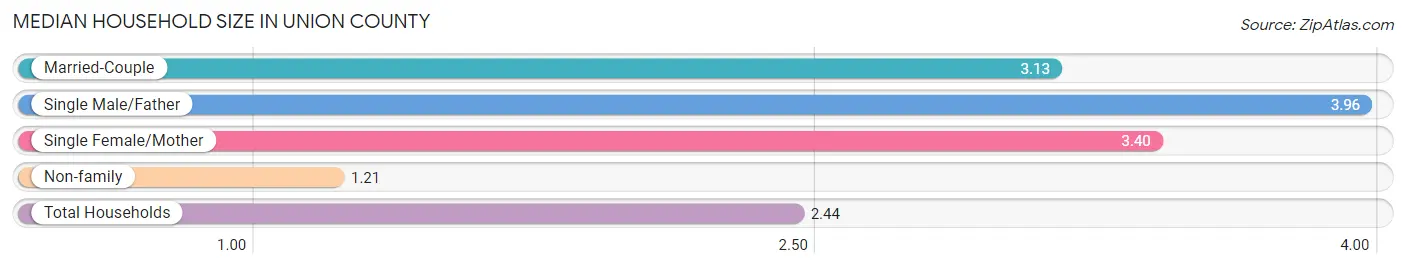
| Household Type | # Households | Household Size |
| Married-Couple | 3,279 (48.5%) | 3.13 |
| Single Male/Father | 363 (5.4%) | 3.96 |
| Single Female/Mother | 469 (6.9%) | 3.40 |
| Non-family | 2,652 (39.2%) | 1.21 |
| Total Households | 6,763 (100.0%) | 2.44 |
Household Size by Marriage Status in Union County
Out of a total of 6,763 households in Union County, 4,111 (60.8%) are family households, while 2,652 (39.2%) are nonfamily households. The most numerous type of family households are 2-person households, comprising 1,863, and the most common type of nonfamily households are 1-person households, comprising 2,339.
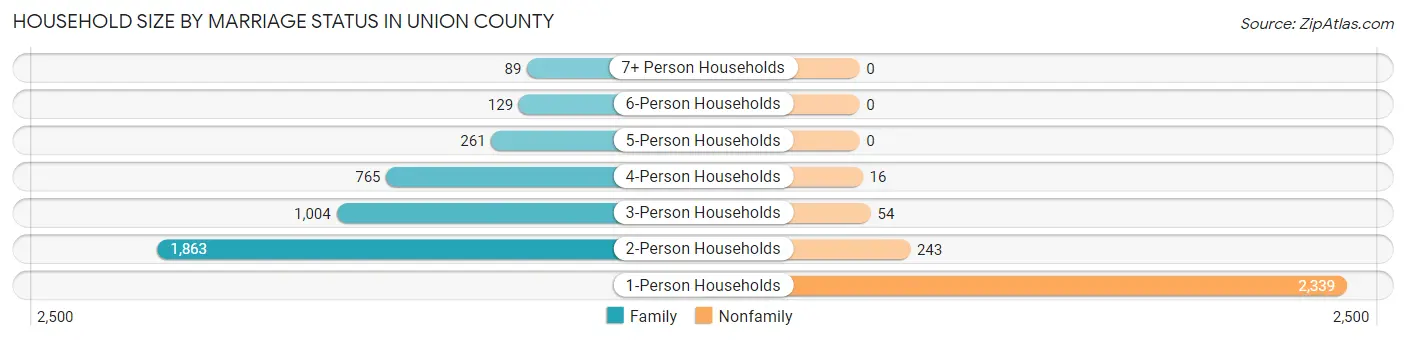
| Household Size | Family Households | Nonfamily Households |
| 1-Person Households | - | 2,339 (34.6%) |
| 2-Person Households | 1,863 (27.6%) | 243 (3.6%) |
| 3-Person Households | 1,004 (14.8%) | 54 (0.8%) |
| 4-Person Households | 765 (11.3%) | 16 (0.2%) |
| 5-Person Households | 261 (3.9%) | 0 (0.0%) |
| 6-Person Households | 129 (1.9%) | 0 (0.0%) |
| 7+ Person Households | 89 (1.3%) | 0 (0.0%) |
| Total | 4,111 (60.8%) | 2,652 (39.2%) |
Female Fertility in Union County
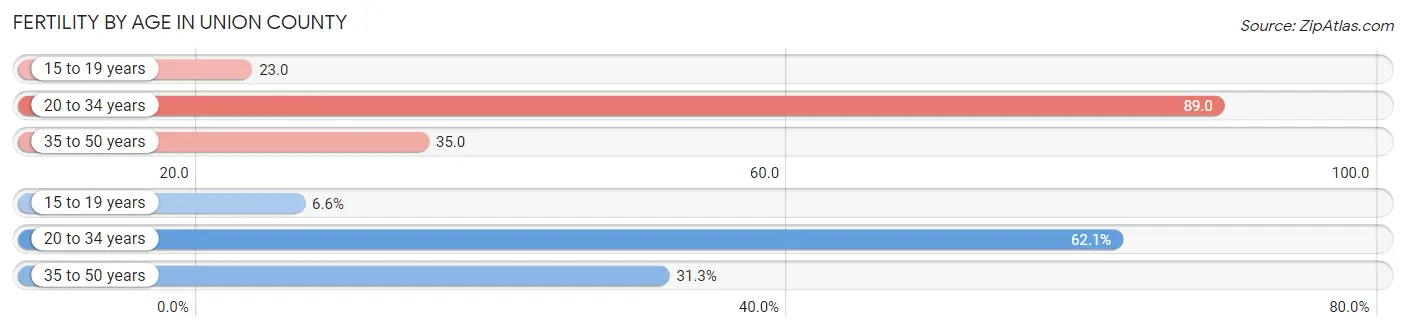
Fertility by Age in Union County
Average fertility rate in Union County is 54.0 births per 1,000 women. Women in the age bracket of 20 to 34 years have the highest fertility rate with 89.0 births per 1,000 women. Women in the age bracket of 20 to 34 years acount for 62.1% of all women with births.
| Age Bracket | Women with Births | Births / 1,000 Women |
| 15 to 19 years | 12 (6.6%) | 23.0 |
| 20 to 34 years | 113 (62.1%) | 89.0 |
| 35 to 50 years | 57 (31.3%) | 35.0 |
| Total | 182 (100.0%) | 54.0 |
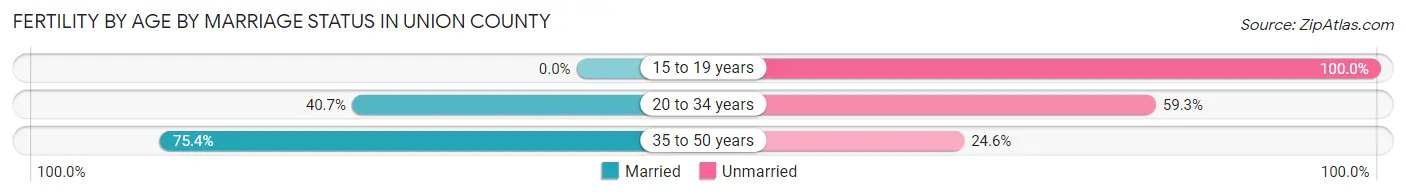
Fertility by Age by Marriage Status in Union County
48.9% of women with births (182) in Union County are married. The highest percentage of unmarried women with births falls into 15 to 19 years age bracket with 100.0% of them unmarried at the time of birth, while the lowest percentage of unmarried women with births belong to 35 to 50 years age bracket with 24.6% of them unmarried.
| Age Bracket | Married | Unmarried |
| 15 to 19 years | 0 (0.0%) | 12 (100.0%) |
| 20 to 34 years | 46 (40.7%) | 67 (59.3%) |
| 35 to 50 years | 43 (75.4%) | 14 (24.6%) |
| Total | 89 (48.9%) | 93 (51.1%) |
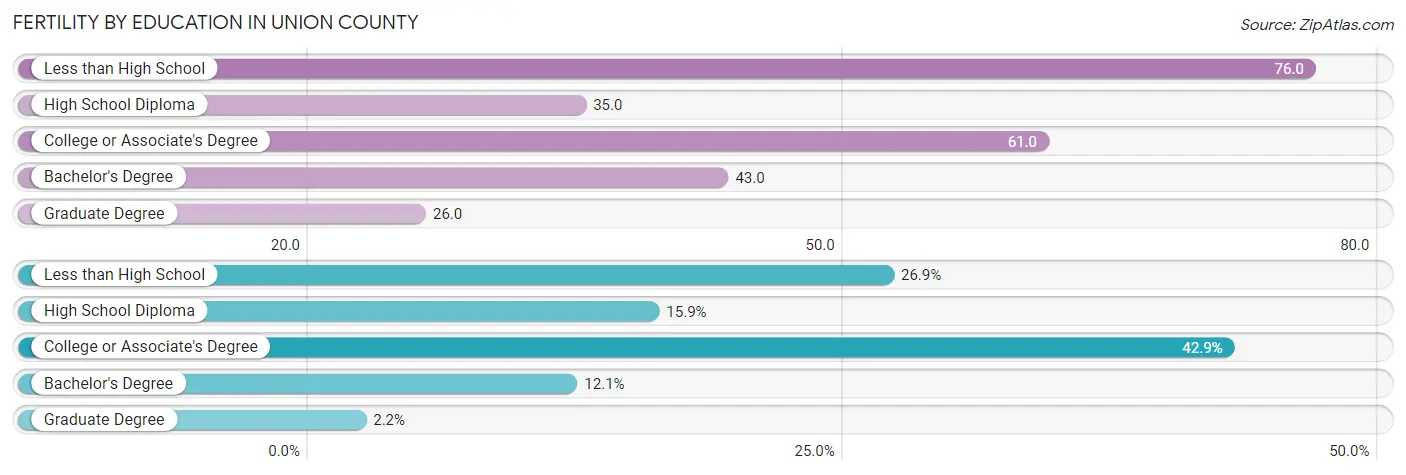
Fertility by Education in Union County
Average fertility rate in Union County is 54.0 births per 1,000 women. Women with the education attainment of less than high school have the highest fertility rate of 76.0 births per 1,000 women, while women with the education attainment of graduate degree have the lowest fertility at 26.0 births per 1,000 women. Women with the education attainment of college or associate's degree represent 42.9% of all women with births.
| Educational Attainment | Women with Births | Births / 1,000 Women |
| Less than High School | 49 (26.9%) | 76.0 |
| High School Diploma | 29 (15.9%) | 35.0 |
| College or Associate's Degree | 78 (42.9%) | 61.0 |
| Bachelor's Degree | 22 (12.1%) | 43.0 |
| Graduate Degree | 4 (2.2%) | 26.0 |
| Total | 182 (100.0%) | 54.0 |
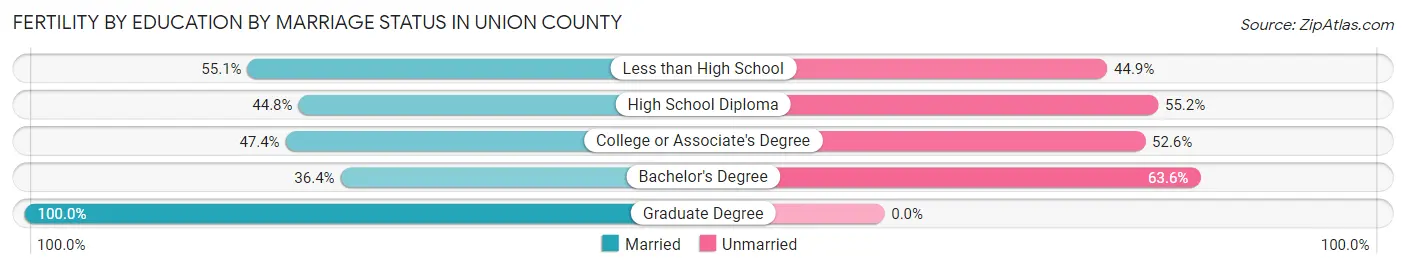
Fertility by Education by Marriage Status in Union County
51.1% of women with births in Union County are unmarried. Women with the educational attainment of graduate degree are most likely to be married with 100.0% of them married at childbirth, while women with the educational attainment of bachelor's degree are least likely to be married with 63.6% of them unmarried at childbirth.
| Educational Attainment | Married | Unmarried |
| Less than High School | 27 (55.1%) | 22 (44.9%) |
| High School Diploma | 13 (44.8%) | 16 (55.2%) |
| College or Associate's Degree | 37 (47.4%) | 41 (52.6%) |
| Bachelor's Degree | 8 (36.4%) | 14 (63.6%) |
| Graduate Degree | 4 (100.0%) | 0 (0.0%) |
| Total | 89 (48.9%) | 93 (51.1%) |
Income in Union County
Income Overview in Union County
Per Capita Income in Union County is $30,171, while median incomes of families and households are $77,414 and $54,090 respectively.
| Characteristic | Number | Measure |
| Per Capita Income | 17,122 | $30,171 |
| Median Family Income | 4,111 | $77,414 |
| Mean Family Income | 4,111 | $91,630 |
| Median Household Income | 6,763 | $54,090 |
| Mean Household Income | 6,763 | $72,159 |
| Income Deficit | 4,111 | $9,560 |
| Wage / Income Gap (%) | 17,122 | 35.93% |
| Wage / Income Gap ($) | 17,122 | 64.07¢ per $1 |
| Gini / Inequality Index | 17,122 | 0.45 |
Earnings by Sex in Union County
Average Earnings in Union County are $36,620, $45,986 for men and $29,464 for women, a difference of 35.9%.
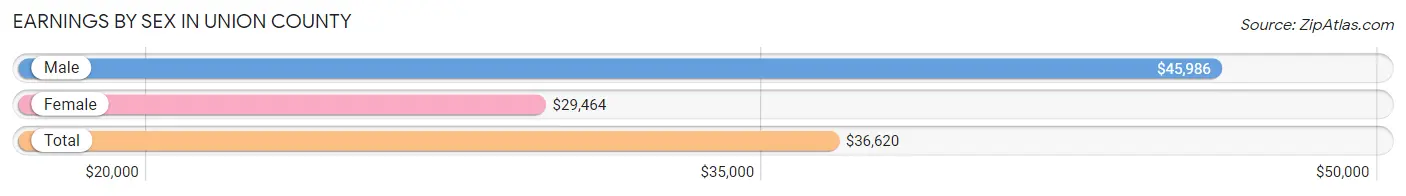
| Sex | Number | Average Earnings |
| Male | 3,858 (52.4%) | $45,986 |
| Female | 3,505 (47.6%) | $29,464 |
| Total | 7,363 (100.0%) | $36,620 |
Earnings by Sex by Income Bracket in Union County
The most common earnings brackets in Union County are $100,000+ for men (512 | 13.3%) and $55,000 to $64,999 for women (316 | 9.0%).
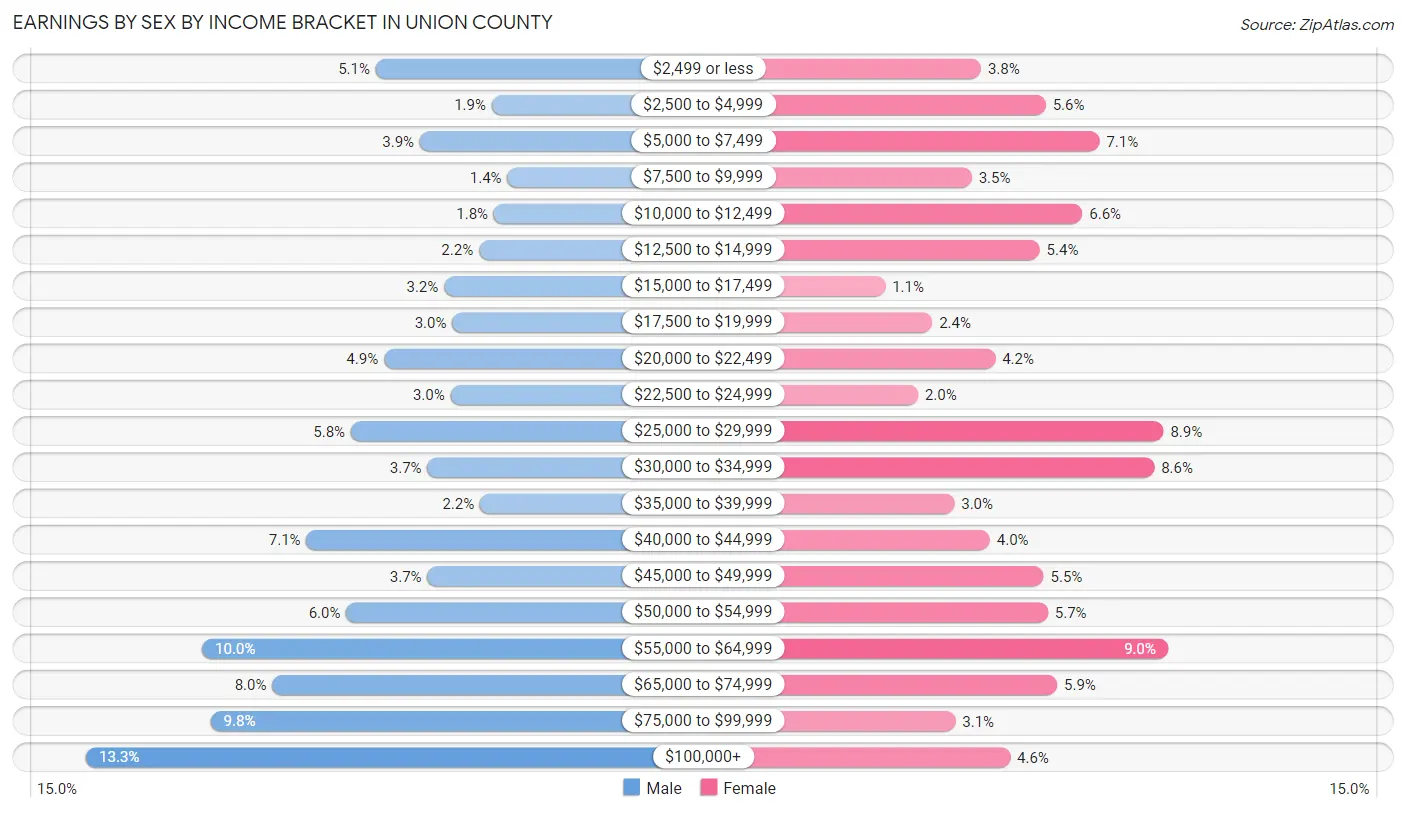
| Income | Male | Female |
| $2,499 or less | 198 (5.1%) | 132 (3.8%) |
| $2,500 to $4,999 | 72 (1.9%) | 196 (5.6%) |
| $5,000 to $7,499 | 150 (3.9%) | 249 (7.1%) |
| $7,500 to $9,999 | 55 (1.4%) | 123 (3.5%) |
| $10,000 to $12,499 | 70 (1.8%) | 232 (6.6%) |
| $12,500 to $14,999 | 86 (2.2%) | 190 (5.4%) |
| $15,000 to $17,499 | 124 (3.2%) | 38 (1.1%) |
| $17,500 to $19,999 | 115 (3.0%) | 84 (2.4%) |
| $20,000 to $22,499 | 189 (4.9%) | 146 (4.2%) |
| $22,500 to $24,999 | 117 (3.0%) | 70 (2.0%) |
| $25,000 to $29,999 | 225 (5.8%) | 312 (8.9%) |
| $30,000 to $34,999 | 142 (3.7%) | 303 (8.6%) |
| $35,000 to $39,999 | 85 (2.2%) | 106 (3.0%) |
| $40,000 to $44,999 | 273 (7.1%) | 141 (4.0%) |
| $45,000 to $49,999 | 142 (3.7%) | 194 (5.5%) |
| $50,000 to $54,999 | 230 (6.0%) | 198 (5.7%) |
| $55,000 to $64,999 | 386 (10.0%) | 316 (9.0%) |
| $65,000 to $74,999 | 310 (8.0%) | 207 (5.9%) |
| $75,000 to $99,999 | 377 (9.8%) | 107 (3.0%) |
| $100,000+ | 512 (13.3%) | 161 (4.6%) |
| Total | 3,858 (100.0%) | 3,505 (100.0%) |
Earnings by Sex by Educational Attainment in Union County
Average earnings in Union County are $52,163 for men and $33,291 for women, a difference of 36.2%. Men with an educational attainment of bachelor's degree enjoy the highest average annual earnings of $61,250, while those with less than high school education earn the least with $29,392. Women with an educational attainment of graduate degree earn the most with the average annual earnings of $58,750, while those with high school diploma education have the smallest earnings of $25,313.

| Educational Attainment | Male Income | Female Income |
| Less than High School | $29,392 | $25,943 |
| High School Diploma | $45,179 | $25,313 |
| College or Associate's Degree | $50,341 | $29,962 |
| Bachelor's Degree | $61,250 | $54,729 |
| Graduate Degree | $59,104 | $58,750 |
| Total | $52,163 | $33,291 |
Family Income in Union County
Family Income Brackets in Union County
According to the Union County family income data, there are 822 families falling into the $100,000 to $149,999 income range, which is the most common income bracket and makes up 20.0% of all families. Conversely, the less than $10,000 income bracket is the least frequent group with only 132 families (3.2%) belonging to this category.
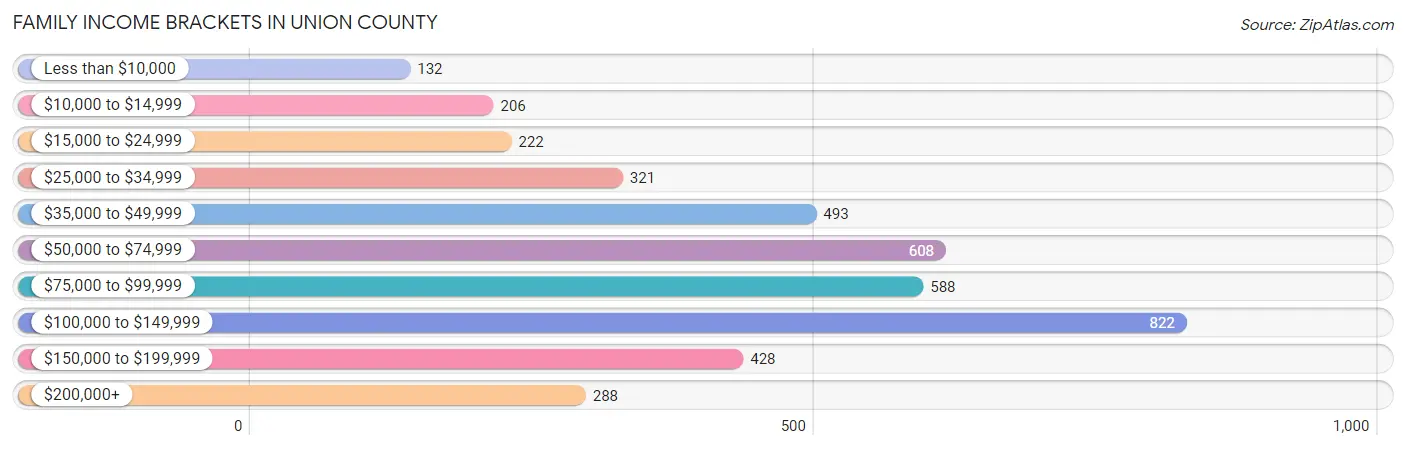
| Income Bracket | # Families | % Families |
| Less than $10,000 | 132 | 3.2% |
| $10,000 to $14,999 | 206 | 5.0% |
| $15,000 to $24,999 | 222 | 5.4% |
| $25,000 to $34,999 | 321 | 7.8% |
| $35,000 to $49,999 | 493 | 12.0% |
| $50,000 to $74,999 | 608 | 14.8% |
| $75,000 to $99,999 | 588 | 14.3% |
| $100,000 to $149,999 | 822 | 20.0% |
| $150,000 to $199,999 | 428 | 10.4% |
| $200,000+ | 288 | 7.0% |
Family Income by Famaliy Size in Union County
6-person families (93 | 2.3%) account for the highest median family income in Union County with $153,384 per family, while 2-person families (2,077 | 50.5%) have the highest median income of $33,843 per family member.
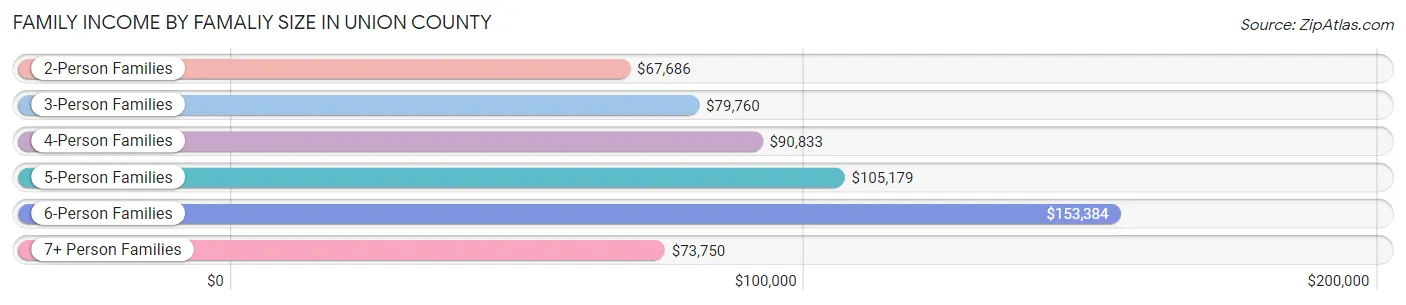
| Income Bracket | # Families | Median Income |
| 2-Person Families | 2,077 (50.5%) | $67,686 |
| 3-Person Families | 897 (21.8%) | $79,760 |
| 4-Person Families | 704 (17.1%) | $90,833 |
| 5-Person Families | 251 (6.1%) | $105,179 |
| 6-Person Families | 93 (2.3%) | $153,384 |
| 7+ Person Families | 89 (2.2%) | $73,750 |
| Total | 4,111 (100.0%) | $77,414 |
Family Income by Number of Earners in Union County
The median family income in Union County is $77,414, with families comprising 3+ earners (360) having the highest median family income of $140,795, while families with no earners (931) have the lowest median family income of $44,955, accounting for 8.8% and 22.7% of families, respectively.
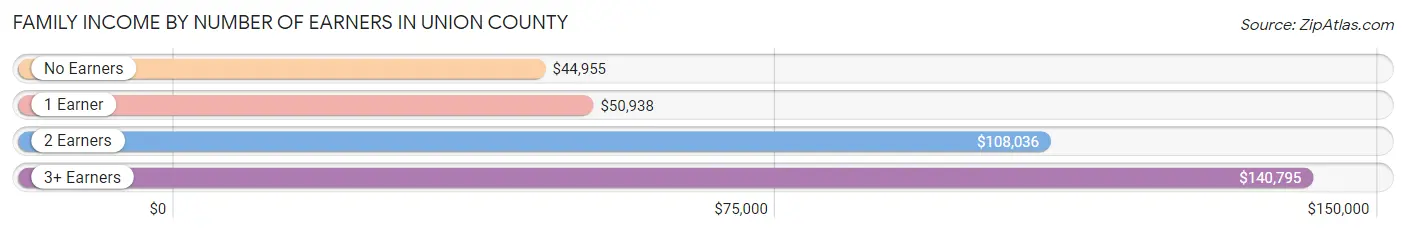
| Number of Earners | # Families | Median Income |
| No Earners | 931 (22.7%) | $44,955 |
| 1 Earner | 1,324 (32.2%) | $50,938 |
| 2 Earners | 1,496 (36.4%) | $108,036 |
| 3+ Earners | 360 (8.8%) | $140,795 |
| Total | 4,111 (100.0%) | $77,414 |
Household Income in Union County
Household Income Brackets in Union County
With 1,082 households falling in the category, the $50,000 to $74,999 income range is the most frequent in Union County, accounting for 16.0% of all households. In contrast, only 318 households (4.7%) fall into the $200,000+ income bracket, making it the least populous group.
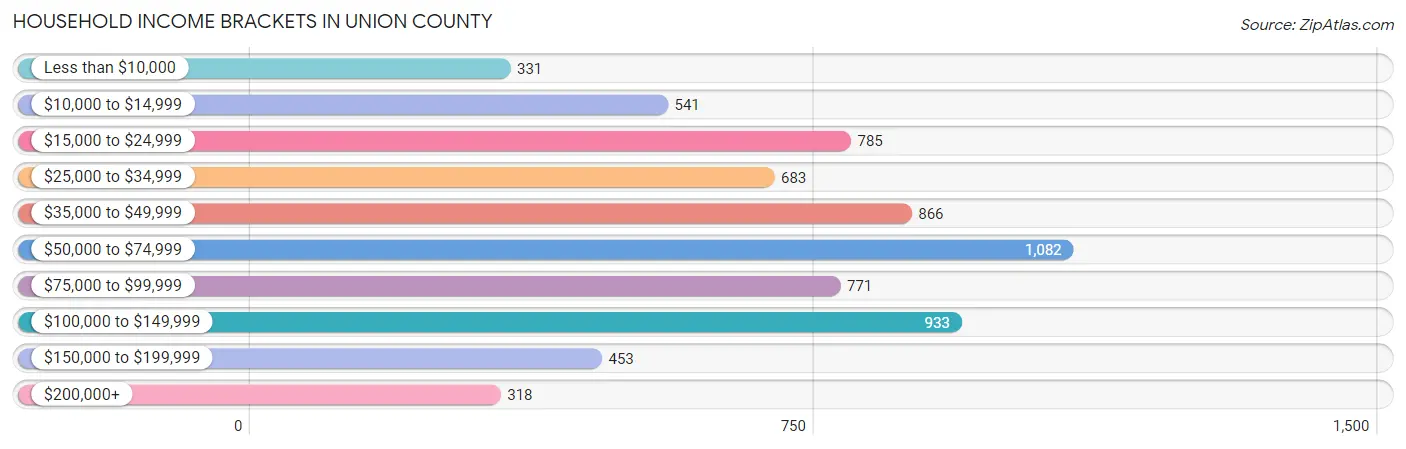
| Income Bracket | # Households | % Households |
| Less than $10,000 | 331 | 4.9% |
| $10,000 to $14,999 | 541 | 8.0% |
| $15,000 to $24,999 | 785 | 11.6% |
| $25,000 to $34,999 | 683 | 10.1% |
| $35,000 to $49,999 | 866 | 12.8% |
| $50,000 to $74,999 | 1,082 | 16.0% |
| $75,000 to $99,999 | 771 | 11.4% |
| $100,000 to $149,999 | 933 | 13.8% |
| $150,000 to $199,999 | 453 | 6.7% |
| $200,000+ | 318 | 4.7% |
Household Income by Householder Age in Union County
The median household income in Union County is $54,090, with the highest median household income of $78,500 found in the 25 to 44 years age bracket for the primary householder. A total of 1,488 households (22.0%) fall into this category. Meanwhile, the 15 to 24 years age bracket for the primary householder has the lowest median household income of $29,375, with 175 households (2.6%) in this group.
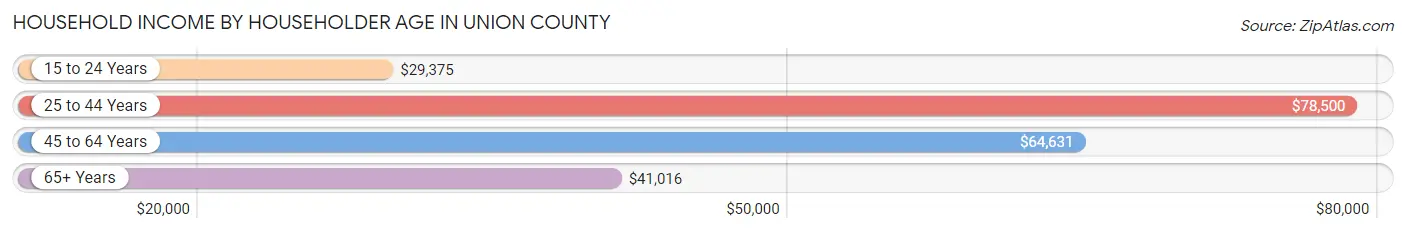
| Income Bracket | # Households | Median Income |
| 15 to 24 Years | 175 (2.6%) | $29,375 |
| 25 to 44 Years | 1,488 (22.0%) | $78,500 |
| 45 to 64 Years | 2,486 (36.8%) | $64,631 |
| 65+ Years | 2,614 (38.7%) | $41,016 |
| Total | 6,763 (100.0%) | $54,090 |
Poverty in Union County
Income Below Poverty by Sex and Age in Union County
With 20.4% poverty level for males and 19.8% for females among the residents of Union County, under 5 year old males and 5 year old females are the most vulnerable to poverty, with 208 males (45.9%) and 62 females (44.6%) in their respective age groups living below the poverty level.
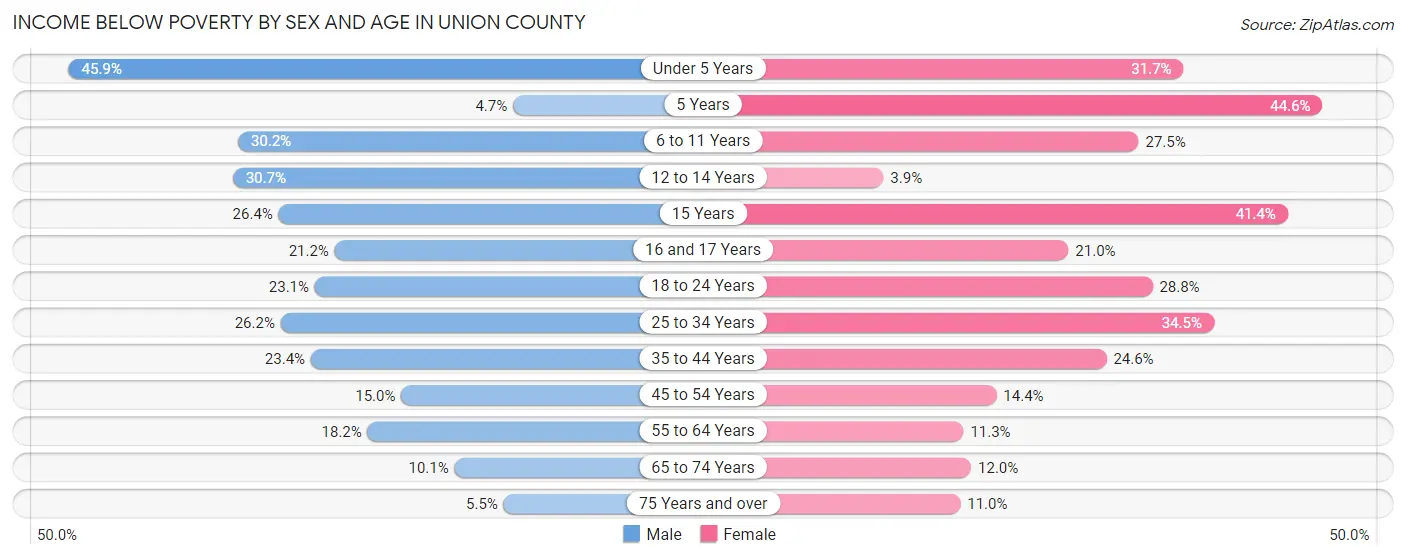
| Age Bracket | Male | Female |
| Under 5 Years | 208 (45.9%) | 142 (31.7%) |
| 5 Years | 5 (4.7%) | 62 (44.6%) |
| 6 to 11 Years | 154 (30.2%) | 133 (27.5%) |
| 12 to 14 Years | 108 (30.7%) | 11 (3.9%) |
| 15 Years | 28 (26.4%) | 36 (41.4%) |
| 16 and 17 Years | 59 (21.2%) | 53 (21.0%) |
| 18 to 24 Years | 140 (23.1%) | 162 (28.8%) |
| 25 to 34 Years | 245 (26.2%) | 301 (34.5%) |
| 35 to 44 Years | 246 (23.4%) | 235 (24.6%) |
| 45 to 54 Years | 168 (15.0%) | 152 (14.3%) |
| 55 to 64 Years | 219 (18.2%) | 133 (11.3%) |
| 65 to 74 Years | 101 (10.1%) | 122 (12.0%) |
| 75 Years and over | 41 (5.5%) | 108 (11.0%) |
| Total | 1,722 (20.4%) | 1,650 (19.8%) |
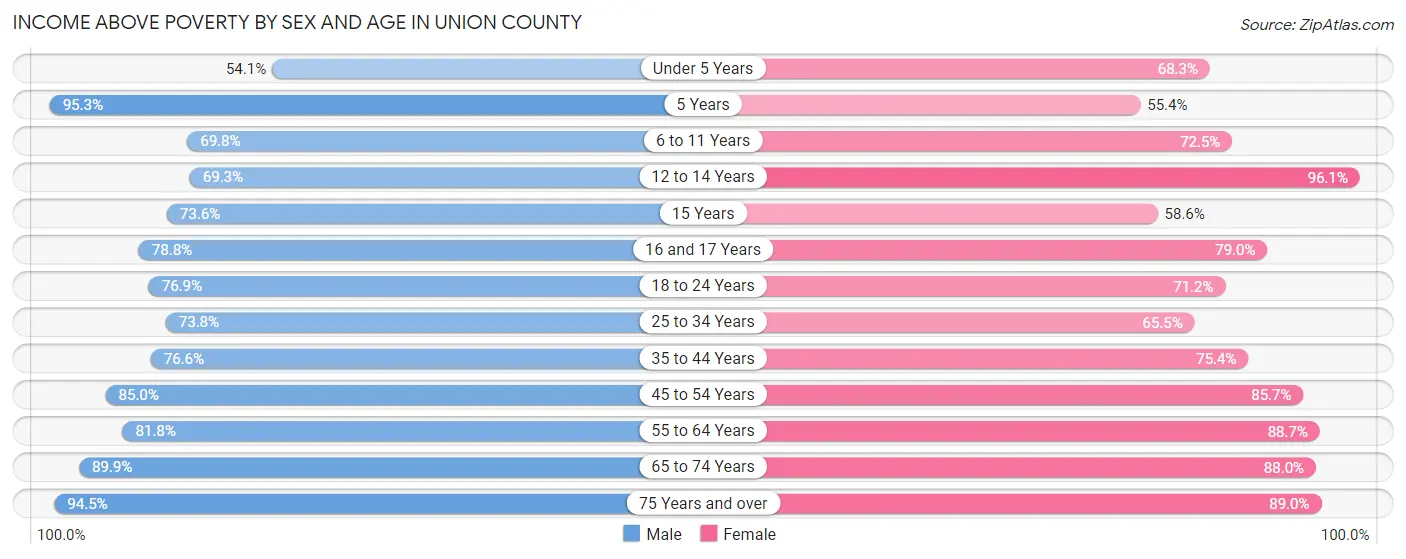
Income Above Poverty by Sex and Age in Union County
According to the poverty statistics in Union County, males aged 5 years and females aged 12 to 14 years are the age groups that are most secure financially, with 95.3% of males and 96.1% of females in these age groups living above the poverty line.
| Age Bracket | Male | Female |
| Under 5 Years | 245 (54.1%) | 306 (68.3%) |
| 5 Years | 102 (95.3%) | 77 (55.4%) |
| 6 to 11 Years | 356 (69.8%) | 350 (72.5%) |
| 12 to 14 Years | 244 (69.3%) | 274 (96.1%) |
| 15 Years | 78 (73.6%) | 51 (58.6%) |
| 16 and 17 Years | 219 (78.8%) | 199 (79.0%) |
| 18 to 24 Years | 467 (76.9%) | 400 (71.2%) |
| 25 to 34 Years | 689 (73.8%) | 571 (65.5%) |
| 35 to 44 Years | 804 (76.6%) | 722 (75.4%) |
| 45 to 54 Years | 949 (85.0%) | 907 (85.7%) |
| 55 to 64 Years | 986 (81.8%) | 1,045 (88.7%) |
| 65 to 74 Years | 899 (89.9%) | 895 (88.0%) |
| 75 Years and over | 699 (94.5%) | 874 (89.0%) |
| Total | 6,737 (79.6%) | 6,671 (80.2%) |
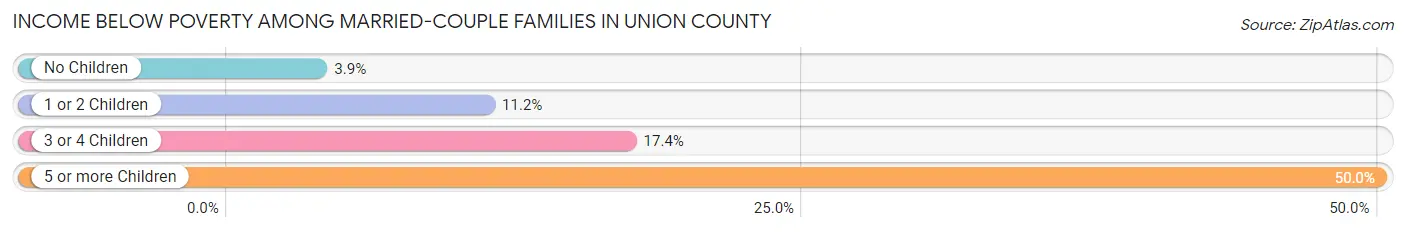
Income Below Poverty Among Married-Couple Families in Union County
The poverty statistics for married-couple families in Union County show that 8.1% or 264 of the total 3,279 families live below the poverty line. Families with 5 or more children have the highest poverty rate of 50.0%, comprising of 29 families. On the other hand, families with no children have the lowest poverty rate of 3.9%, which includes 74 families.
| Children | Above Poverty | Below Poverty |
| No Children | 1,829 (96.1%) | 74 (3.9%) |
| 1 or 2 Children | 976 (88.8%) | 123 (11.2%) |
| 3 or 4 Children | 181 (82.7%) | 38 (17.3%) |
| 5 or more Children | 29 (50.0%) | 29 (50.0%) |
| Total | 3,015 (91.9%) | 264 (8.1%) |
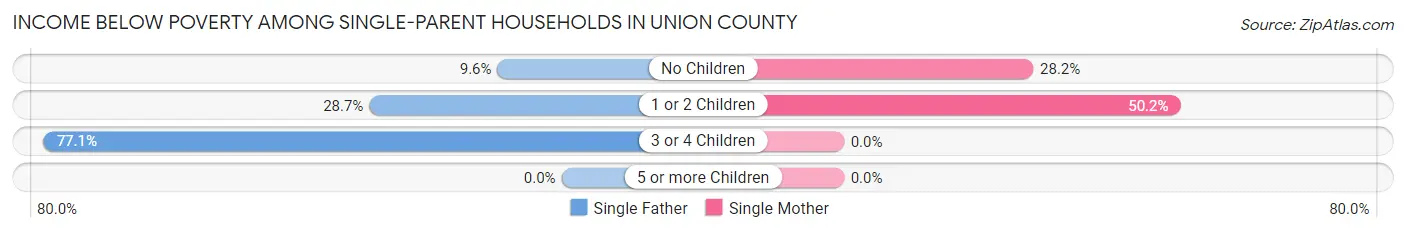
Income Below Poverty Among Single-Parent Households in Union County
According to the poverty data in Union County, 25.1% or 91 single-father households and 43.1% or 202 single-mother households are living below the poverty line. Among single-father households, those with 3 or 4 children have the highest poverty rate, with 27 households (77.1%) experiencing poverty. Likewise, among single-mother households, those with 1 or 2 children have the highest poverty rate, with 167 households (50.1%) falling below the poverty line.
| Children | Single Father | Single Mother |
| No Children | 15 (9.6%) | 35 (28.2%) |
| 1 or 2 Children | 49 (28.6%) | 167 (50.1%) |
| 3 or 4 Children | 27 (77.1%) | 0 (0.0%) |
| 5 or more Children | 0 (0.0%) | 0 (0.0%) |
| Total | 91 (25.1%) | 202 (43.1%) |
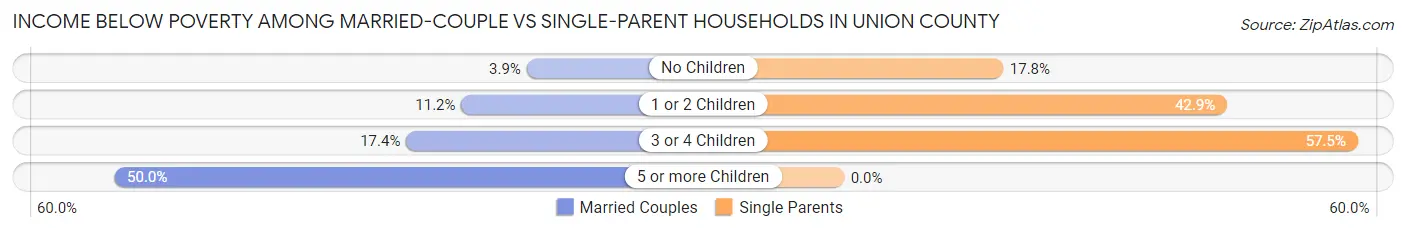
Income Below Poverty Among Married-Couple vs Single-Parent Households in Union County
The poverty data for Union County shows that 264 of the married-couple family households (8.1%) and 293 of the single-parent households (35.2%) are living below the poverty level. Within the married-couple family households, those with 5 or more children have the highest poverty rate, with 29 households (50.0%) falling below the poverty line. Among the single-parent households, those with 3 or 4 children have the highest poverty rate, with 27 household (57.5%) living below poverty.
| Children | Married-Couple Families | Single-Parent Households |
| No Children | 74 (3.9%) | 50 (17.8%) |
| 1 or 2 Children | 123 (11.2%) | 216 (42.9%) |
| 3 or 4 Children | 38 (17.3%) | 27 (57.5%) |
| 5 or more Children | 29 (50.0%) | 0 (0.0%) |
| Total | 264 (8.1%) | 293 (35.2%) |
Employment Characteristics in Union County
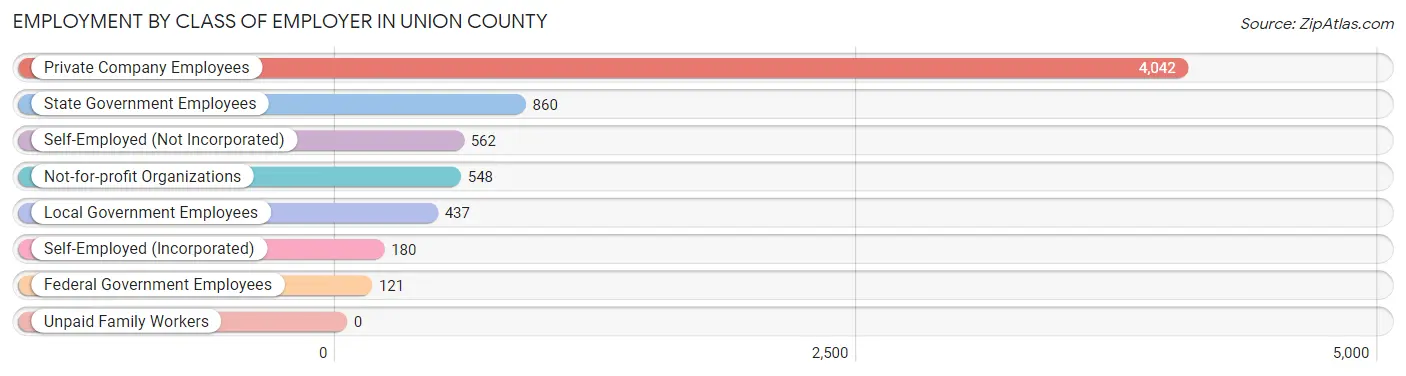
Employment by Class of Employer in Union County
Among the 6,750 employed individuals in Union County, private company employees (4,042 | 59.9%), state government employees (860 | 12.7%), and self-employed (not incorporated) (562 | 8.3%) make up the most common classes of employment.
| Employer Class | # Employees | % Employees |
| Private Company Employees | 4,042 | 59.9% |
| Self-Employed (Incorporated) | 180 | 2.7% |
| Self-Employed (Not Incorporated) | 562 | 8.3% |
| Not-for-profit Organizations | 548 | 8.1% |
| Local Government Employees | 437 | 6.5% |
| State Government Employees | 860 | 12.7% |
| Federal Government Employees | 121 | 1.8% |
| Unpaid Family Workers | 0 | 0.0% |
| Total | 6,750 | 100.0% |
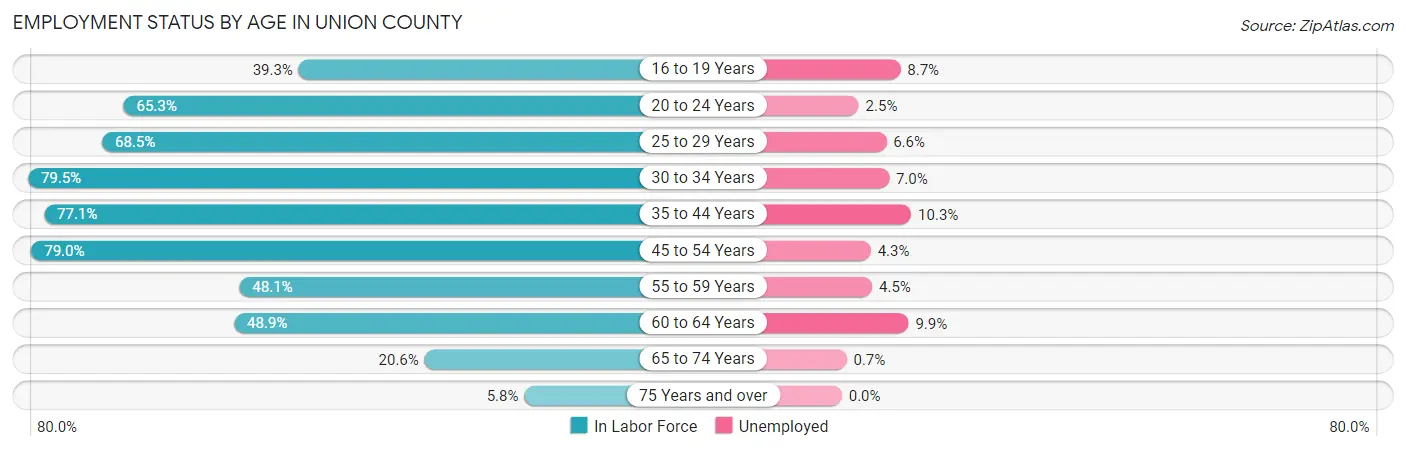
Employment Status by Age in Union County
According to the labor force statistics for Union County, out of the total population over 16 years of age (14,087), 51.4% or 7,241 individuals are in the labor force, with 6.3% or 456 of them unemployed. The age group with the highest labor force participation rate is 30 to 34 years, with 79.5% or 731 individuals in the labor force. Within the labor force, the 35 to 44 years age range has the highest percentage of unemployed individuals, with 10.3% or 160 of them being unemployed.
| Age Bracket | In Labor Force | Unemployed |
| 16 to 19 Years | 356 (39.3%) | 31 (8.7%) |
| 20 to 24 Years | 522 (65.3%) | 13 (2.5%) |
| 25 to 29 Years | 637 (68.5%) | 42 (6.6%) |
| 30 to 34 Years | 731 (79.5%) | 51 (7.0%) |
| 35 to 44 Years | 1,557 (77.1%) | 160 (10.3%) |
| 45 to 54 Years | 1,736 (79.0%) | 75 (4.3%) |
| 55 to 59 Years | 621 (48.1%) | 28 (4.5%) |
| 60 to 64 Years | 547 (48.9%) | 54 (9.9%) |
| 65 to 74 Years | 430 (20.6%) | 3 (0.7%) |
| 75 Years and over | 105 (5.8%) | 0 (0.0%) |
| Total | 7,241 (51.4%) | 456 (6.3%) |
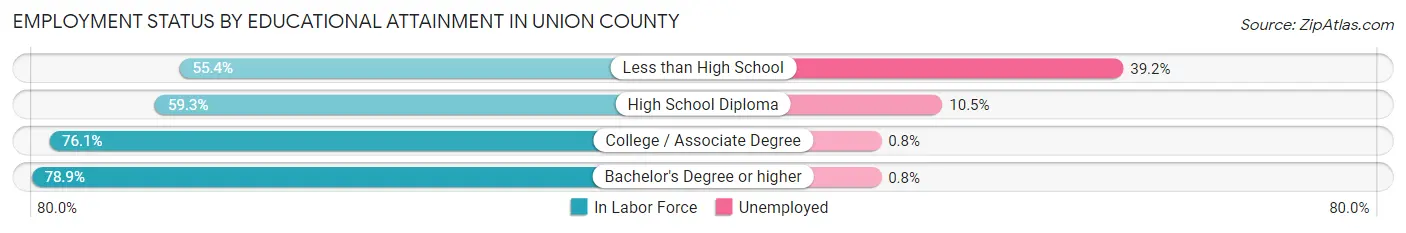
Employment Status by Educational Attainment in Union County
According to labor force statistics for Union County, 68.8% of individuals (5,832) out of the total population between 25 and 64 years of age (8,477) are in the labor force, with 7.0% or 408 of them being unemployed. The group with the highest labor force participation rate are those with the educational attainment of bachelor's degree or higher, with 78.9% or 1,405 individuals in the labor force. Within the labor force, individuals with less than high school education have the highest percentage of unemployment, with 39.2% or 204 of them being unemployed.
| Educational Attainment | In Labor Force | Unemployed |
| Less than High School | 521 (55.4%) | 369 (39.2%) |
| High School Diploma | 1,690 (59.3%) | 299 (10.5%) |
| College / Associate Degree | 2,211 (76.1%) | 23 (0.8%) |
| Bachelor's Degree or higher | 1,405 (78.9%) | 14 (0.8%) |
| Total | 5,832 (68.8%) | 593 (7.0%) |
Employment Occupations by Sex in Union County
Management, Business, Science and Arts Occupations
The most common Management, Business, Science and Arts occupations in Union County are Health Diagnosing & Treating (652 | 9.6%), Community & Social Service (533 | 7.9%), Management (476 | 7.0%), Education Instruction & Library (392 | 5.8%), and Health Technologists (344 | 5.1%).
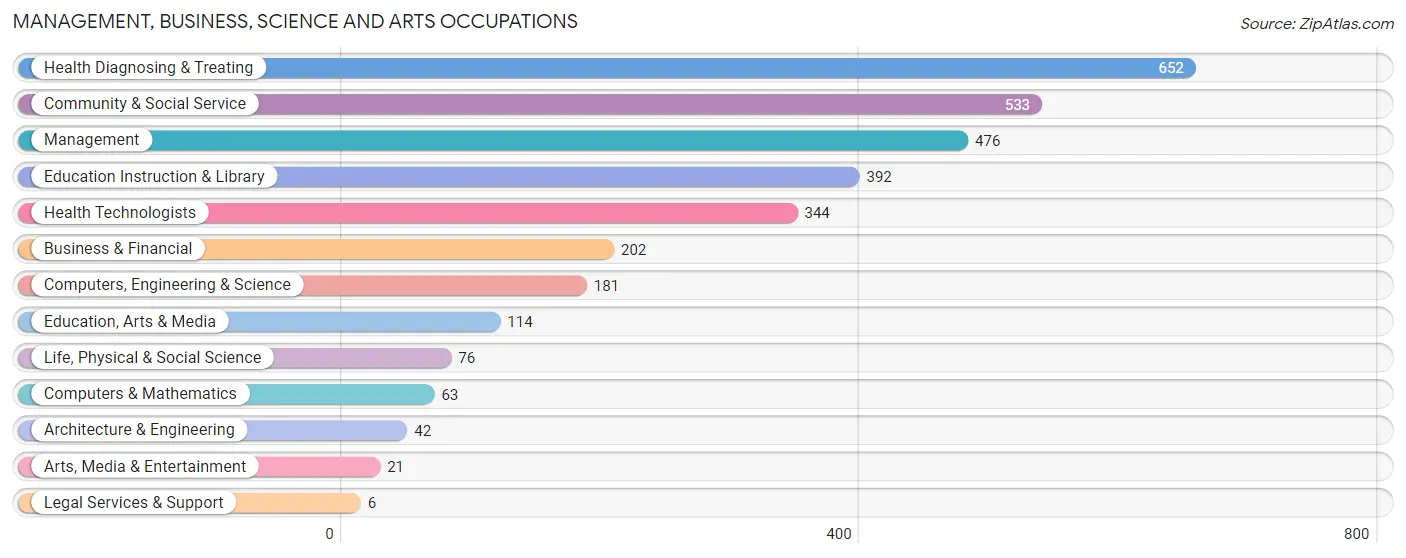
Management, Business, Science and Arts Occupations by Sex
Within the Management, Business, Science and Arts occupations in Union County, the most male-oriented occupations are Legal Services & Support (100.0%), Architecture & Engineering (97.6%), and Life, Physical & Social Science (96.1%), while the most female-oriented occupations are Education Instruction & Library (87.2%), Health Technologists (85.8%), and Health Diagnosing & Treating (75.8%).
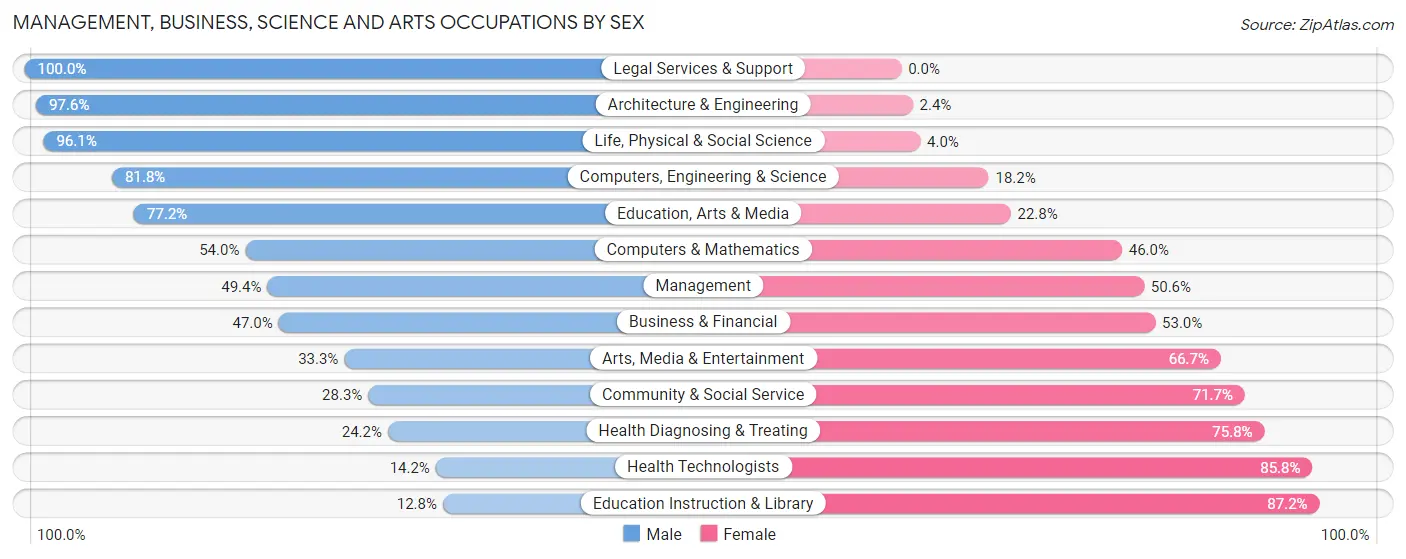
| Occupation | Male | Female |
| Management | 235 (49.4%) | 241 (50.6%) |
| Business & Financial | 95 (47.0%) | 107 (53.0%) |
| Computers, Engineering & Science | 148 (81.8%) | 33 (18.2%) |
| Computers & Mathematics | 34 (54.0%) | 29 (46.0%) |
| Architecture & Engineering | 41 (97.6%) | 1 (2.4%) |
| Life, Physical & Social Science | 73 (96.1%) | 3 (4.0%) |
| Community & Social Service | 151 (28.3%) | 382 (71.7%) |
| Education, Arts & Media | 88 (77.2%) | 26 (22.8%) |
| Legal Services & Support | 6 (100.0%) | 0 (0.0%) |
| Education Instruction & Library | 50 (12.8%) | 342 (87.2%) |
| Arts, Media & Entertainment | 7 (33.3%) | 14 (66.7%) |
| Health Diagnosing & Treating | 158 (24.2%) | 494 (75.8%) |
| Health Technologists | 49 (14.2%) | 295 (85.8%) |
| Total (Category) | 787 (38.5%) | 1,257 (61.5%) |
| Total (Overall) | 3,564 (52.5%) | 3,223 (47.5%) |
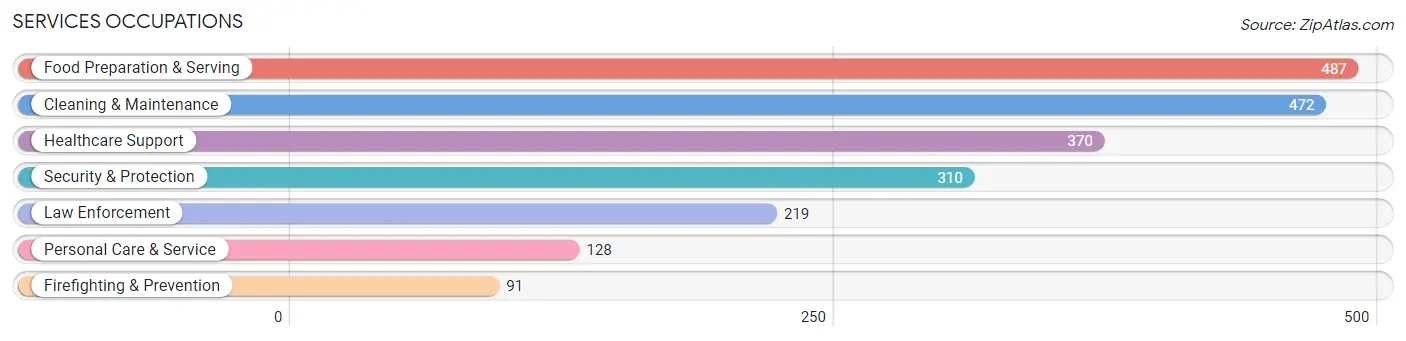
Services Occupations
The most common Services occupations in Union County are Food Preparation & Serving (487 | 7.2%), Cleaning & Maintenance (472 | 7.0%), Healthcare Support (370 | 5.4%), Security & Protection (310 | 4.6%), and Law Enforcement (219 | 3.2%).
Services Occupations by Sex
Within the Services occupations in Union County, the most male-oriented occupations are Law Enforcement (93.6%), Security & Protection (87.7%), and Firefighting & Prevention (73.6%), while the most female-oriented occupations are Healthcare Support (87.0%), Personal Care & Service (81.2%), and Food Preparation & Serving (60.6%).
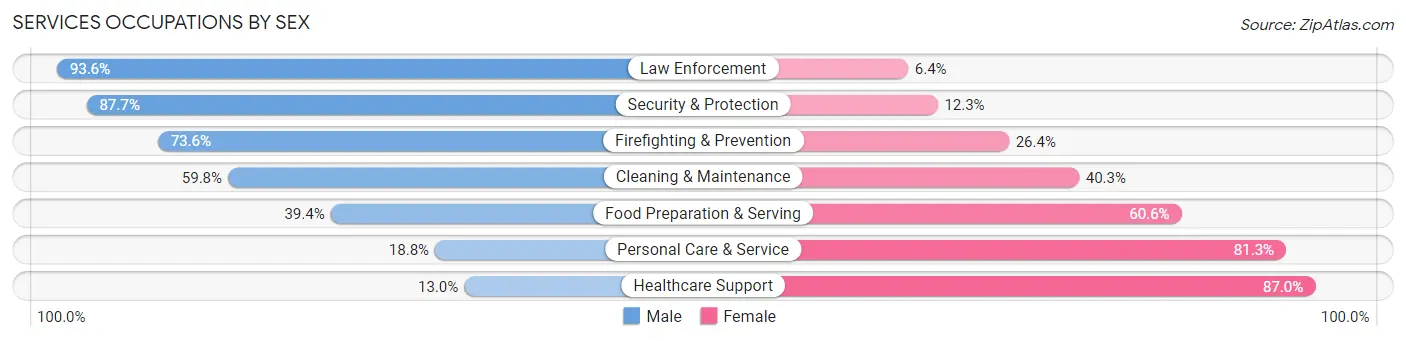
| Occupation | Male | Female |
| Healthcare Support | 48 (13.0%) | 322 (87.0%) |
| Security & Protection | 272 (87.7%) | 38 (12.3%) |
| Firefighting & Prevention | 67 (73.6%) | 24 (26.4%) |
| Law Enforcement | 205 (93.6%) | 14 (6.4%) |
| Food Preparation & Serving | 192 (39.4%) | 295 (60.6%) |
| Cleaning & Maintenance | 282 (59.8%) | 190 (40.3%) |
| Personal Care & Service | 24 (18.8%) | 104 (81.2%) |
| Total (Category) | 818 (46.3%) | 949 (53.7%) |
| Total (Overall) | 3,564 (52.5%) | 3,223 (47.5%) |
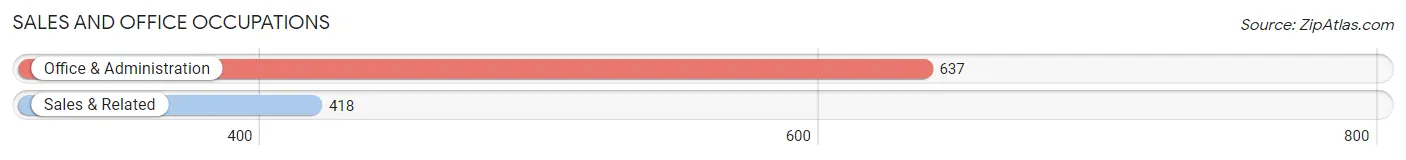
Sales and Office Occupations
The most common Sales and Office occupations in Union County are Office & Administration (637 | 9.4%), and Sales & Related (418 | 6.2%).
Sales and Office Occupations by Sex
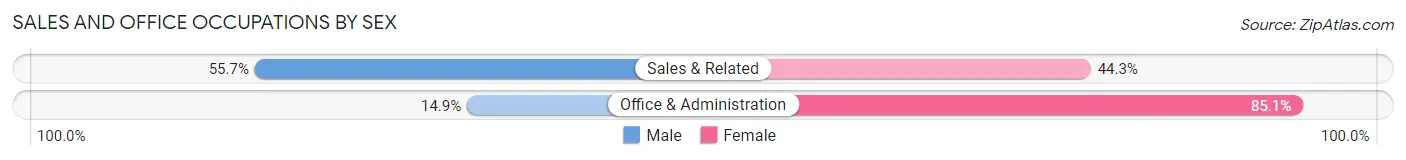
| Occupation | Male | Female |
| Sales & Related | 233 (55.7%) | 185 (44.3%) |
| Office & Administration | 95 (14.9%) | 542 (85.1%) |
| Total (Category) | 328 (31.1%) | 727 (68.9%) |
| Total (Overall) | 3,564 (52.5%) | 3,223 (47.5%) |
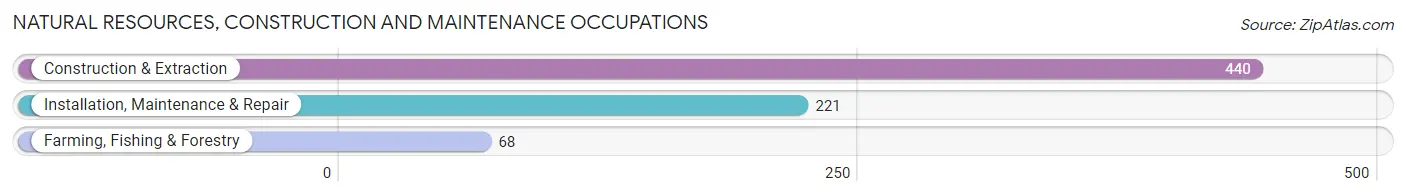
Natural Resources, Construction and Maintenance Occupations
The most common Natural Resources, Construction and Maintenance occupations in Union County are Construction & Extraction (440 | 6.5%), Installation, Maintenance & Repair (221 | 3.3%), and Farming, Fishing & Forestry (68 | 1.0%).
Natural Resources, Construction and Maintenance Occupations by Sex
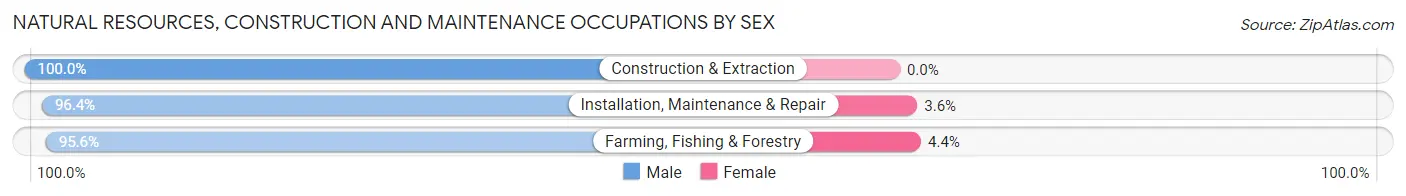
| Occupation | Male | Female |
| Farming, Fishing & Forestry | 65 (95.6%) | 3 (4.4%) |
| Construction & Extraction | 440 (100.0%) | 0 (0.0%) |
| Installation, Maintenance & Repair | 213 (96.4%) | 8 (3.6%) |
| Total (Category) | 718 (98.5%) | 11 (1.5%) |
| Total (Overall) | 3,564 (52.5%) | 3,223 (47.5%) |
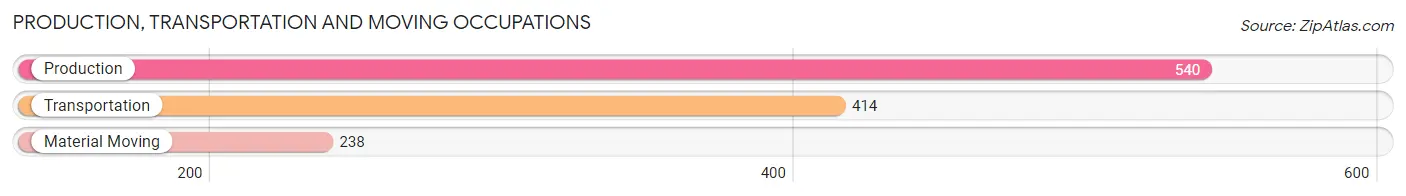
Production, Transportation and Moving Occupations
The most common Production, Transportation and Moving occupations in Union County are Production (540 | 8.0%), Transportation (414 | 6.1%), and Material Moving (238 | 3.5%).
Production, Transportation and Moving Occupations by Sex
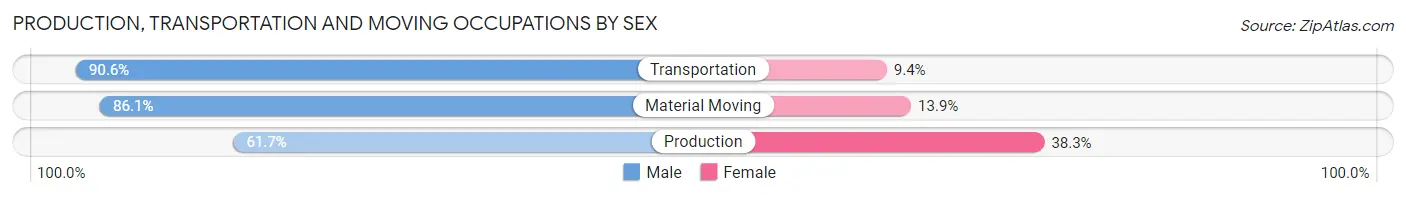
| Occupation | Male | Female |
| Production | 333 (61.7%) | 207 (38.3%) |
| Transportation | 375 (90.6%) | 39 (9.4%) |
| Material Moving | 205 (86.1%) | 33 (13.9%) |
| Total (Category) | 913 (76.6%) | 279 (23.4%) |
| Total (Overall) | 3,564 (52.5%) | 3,223 (47.5%) |
Employment Industries by Sex in Union County
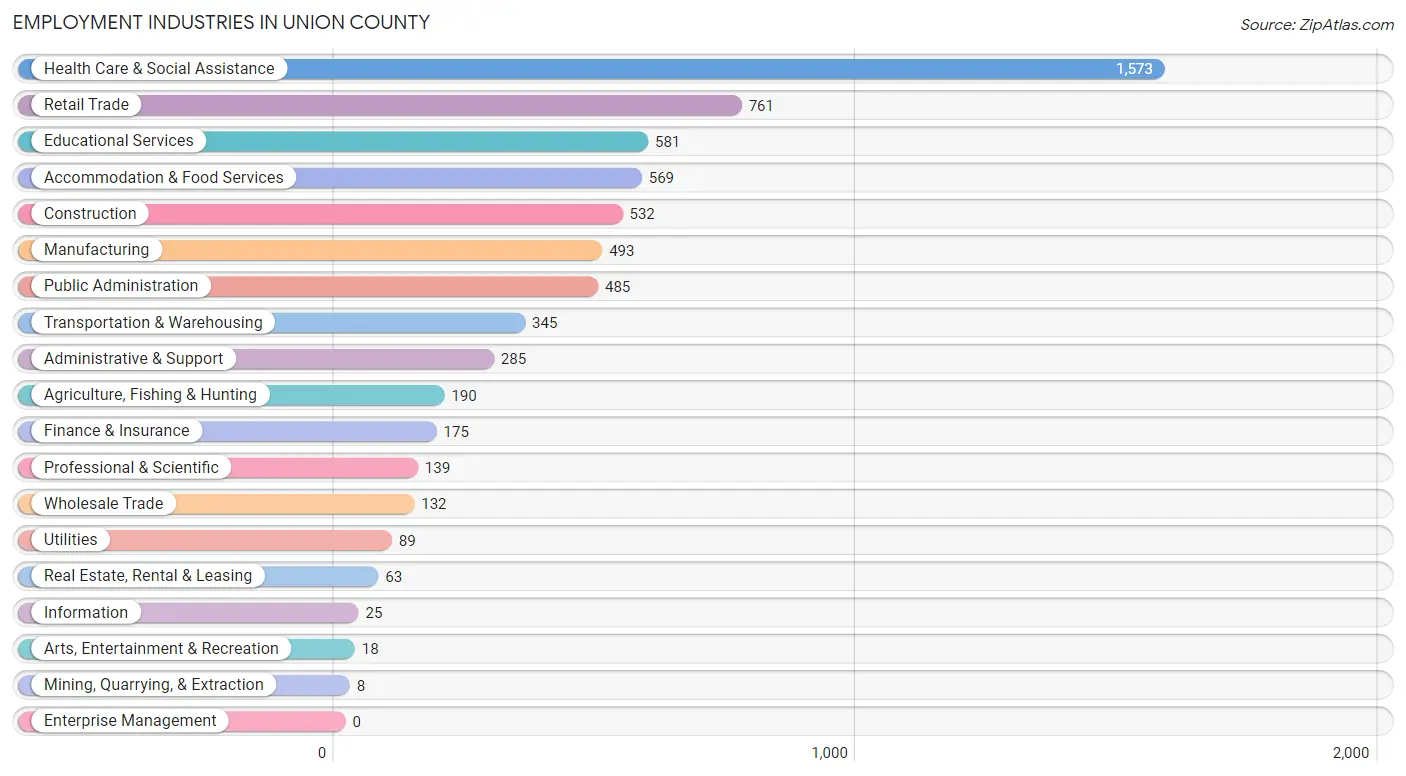
Employment Industries in Union County
The major employment industries in Union County include Health Care & Social Assistance (1,573 | 23.2%), Retail Trade (761 | 11.2%), Educational Services (581 | 8.6%), Accommodation & Food Services (569 | 8.4%), and Construction (532 | 7.8%).
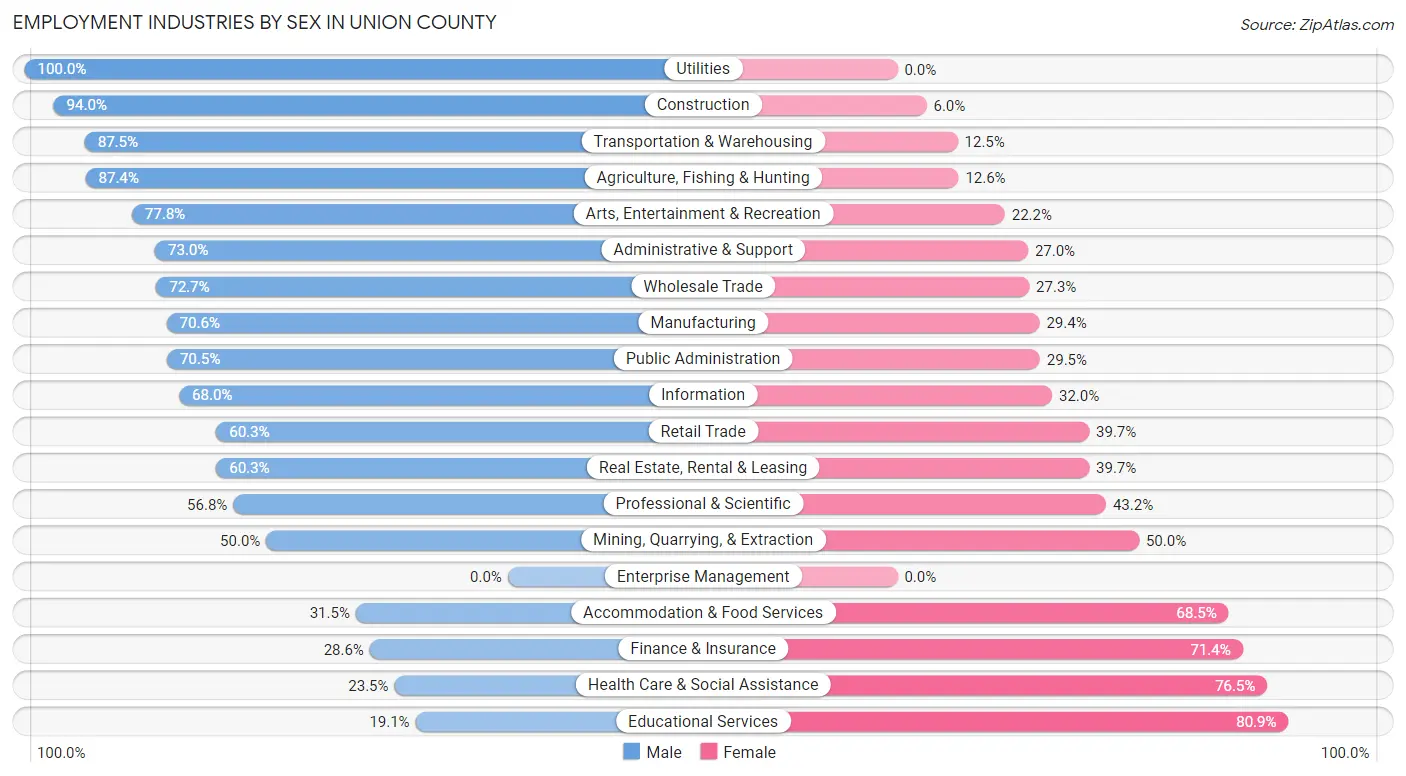
Employment Industries by Sex in Union County
The Union County industries that see more men than women are Utilities (100.0%), Construction (94.0%), and Transportation & Warehousing (87.5%), whereas the industries that tend to have a higher number of women are Educational Services (80.9%), Health Care & Social Assistance (76.5%), and Finance & Insurance (71.4%).
| Industry | Male | Female |
| Agriculture, Fishing & Hunting | 166 (87.4%) | 24 (12.6%) |
| Mining, Quarrying, & Extraction | 4 (50.0%) | 4 (50.0%) |
| Construction | 500 (94.0%) | 32 (6.0%) |
| Manufacturing | 348 (70.6%) | 145 (29.4%) |
| Wholesale Trade | 96 (72.7%) | 36 (27.3%) |
| Retail Trade | 459 (60.3%) | 302 (39.7%) |
| Transportation & Warehousing | 302 (87.5%) | 43 (12.5%) |
| Utilities | 89 (100.0%) | 0 (0.0%) |
| Information | 17 (68.0%) | 8 (32.0%) |
| Finance & Insurance | 50 (28.6%) | 125 (71.4%) |
| Real Estate, Rental & Leasing | 38 (60.3%) | 25 (39.7%) |
| Professional & Scientific | 79 (56.8%) | 60 (43.2%) |
| Enterprise Management | 0 (0.0%) | 0 (0.0%) |
| Administrative & Support | 208 (73.0%) | 77 (27.0%) |
| Educational Services | 111 (19.1%) | 470 (80.9%) |
| Health Care & Social Assistance | 369 (23.5%) | 1,204 (76.5%) |
| Arts, Entertainment & Recreation | 14 (77.8%) | 4 (22.2%) |
| Accommodation & Food Services | 179 (31.5%) | 390 (68.5%) |
| Public Administration | 342 (70.5%) | 143 (29.5%) |
| Total | 3,564 (52.5%) | 3,223 (47.5%) |
Education in Union County
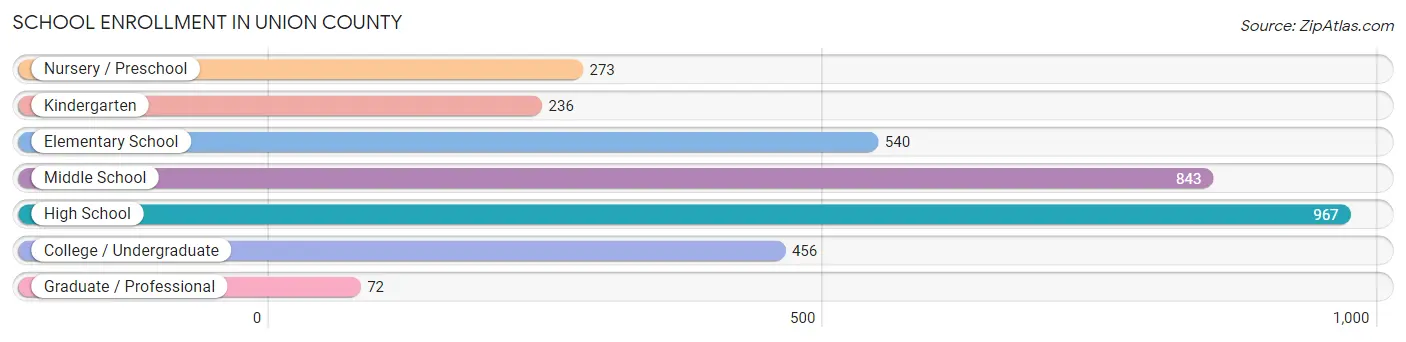
School Enrollment in Union County
The most common levels of schooling among the 3,387 students in Union County are high school (967 | 28.5%), middle school (843 | 24.9%), and elementary school (540 | 15.9%).
| School Level | # Students | % Students |
| Nursery / Preschool | 273 | 8.1% |
| Kindergarten | 236 | 7.0% |
| Elementary School | 540 | 15.9% |
| Middle School | 843 | 24.9% |
| High School | 967 | 28.5% |
| College / Undergraduate | 456 | 13.5% |
| Graduate / Professional | 72 | 2.1% |
| Total | 3,387 | 100.0% |
School Enrollment by Age by Funding Source in Union County
Out of a total of 3,387 students who are enrolled in schools in Union County, 379 (11.2%) attend a private institution, while the remaining 3,008 (88.8%) are enrolled in public schools. The age group of 25 to 34 year olds has the highest likelihood of being enrolled in private schools, with 11 (16.2% in the age bracket) enrolled. Conversely, the age group of 18 to 19 year olds has the lowest likelihood of being enrolled in a private school, with 289 (95.1% in the age bracket) attending a public institution.
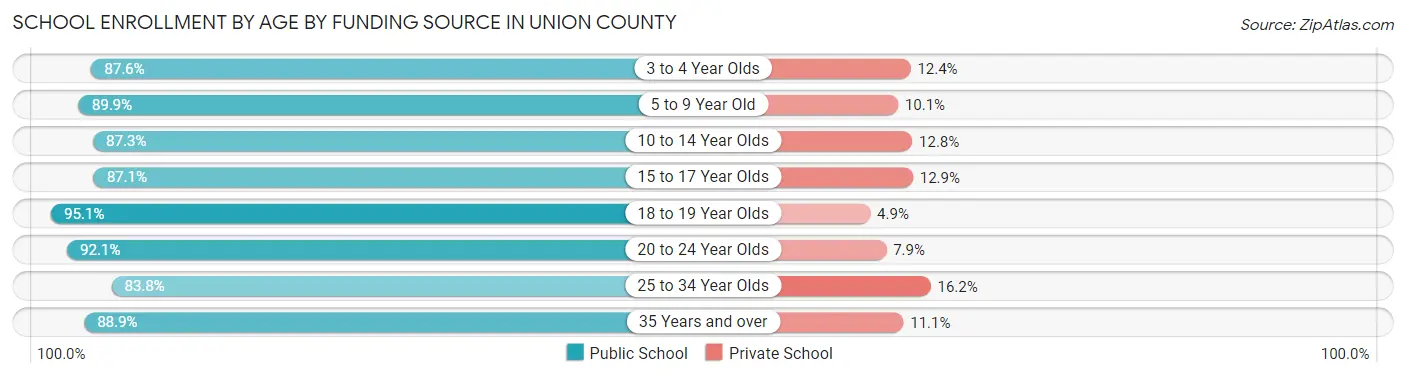
| Age Bracket | Public School | Private School |
| 3 to 4 Year Olds | 190 (87.6%) | 27 (12.4%) |
| 5 to 9 Year Old | 711 (89.9%) | 80 (10.1%) |
| 10 to 14 Year Olds | 910 (87.3%) | 133 (12.8%) |
| 15 to 17 Year Olds | 609 (87.1%) | 90 (12.9%) |
| 18 to 19 Year Olds | 289 (95.1%) | 15 (4.9%) |
| 20 to 24 Year Olds | 186 (92.1%) | 16 (7.9%) |
| 25 to 34 Year Olds | 57 (83.8%) | 11 (16.2%) |
| 35 Years and over | 56 (88.9%) | 7 (11.1%) |
| Total | 3,008 (88.8%) | 379 (11.2%) |
Educational Attainment by Field of Study in Union County
Education (618 | 21.4%), science & technology (484 | 16.8%), business (386 | 13.4%), arts & humanities (341 | 11.8%), and bio, nature & agricultural (313 | 10.8%) are the most common fields of study among 2,886 individuals in Union County who have obtained a bachelor's degree or higher.
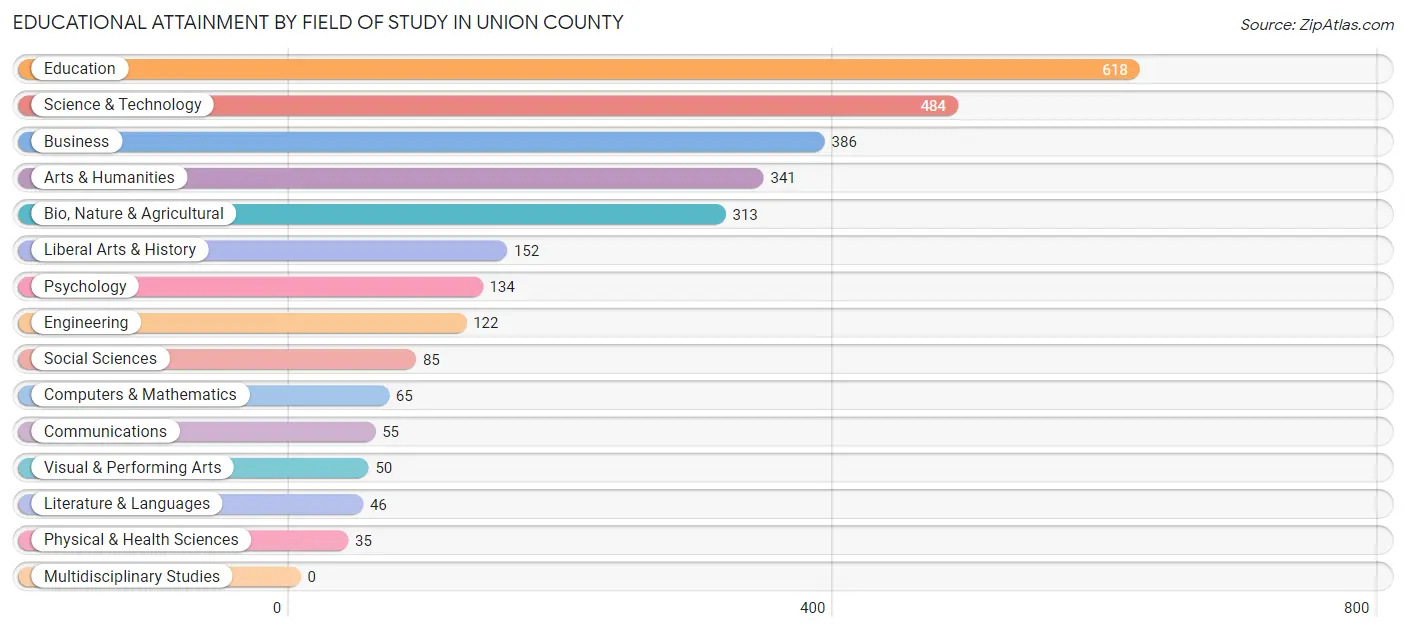
| Field of Study | # Graduates | % Graduates |
| Computers & Mathematics | 65 | 2.2% |
| Bio, Nature & Agricultural | 313 | 10.8% |
| Physical & Health Sciences | 35 | 1.2% |
| Psychology | 134 | 4.6% |
| Social Sciences | 85 | 2.9% |
| Engineering | 122 | 4.2% |
| Multidisciplinary Studies | 0 | 0.0% |
| Science & Technology | 484 | 16.8% |
| Business | 386 | 13.4% |
| Education | 618 | 21.4% |
| Literature & Languages | 46 | 1.6% |
| Liberal Arts & History | 152 | 5.3% |
| Visual & Performing Arts | 50 | 1.7% |
| Communications | 55 | 1.9% |
| Arts & Humanities | 341 | 11.8% |
| Total | 2,886 | 100.0% |
Transportation & Commute in Union County
Vehicle Availability by Sex in Union County
The most prevalent vehicle ownership categories in Union County are males with 2 vehicles (1,669, accounting for 47.1%) and females with 2 vehicles (1,290, making up 52.8%).
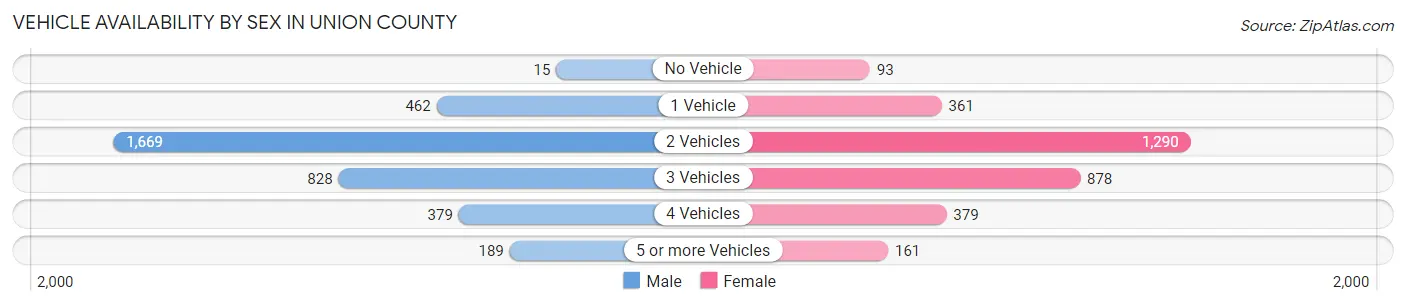
| Vehicles Available | Male | Female |
| No Vehicle | 15 (0.4%) | 93 (2.9%) |
| 1 Vehicle | 462 (13.0%) | 361 (11.4%) |
| 2 Vehicles | 1,669 (47.1%) | 1,290 (40.8%) |
| 3 Vehicles | 828 (23.4%) | 878 (27.8%) |
| 4 Vehicles | 379 (10.7%) | 379 (12.0%) |
| 5 or more Vehicles | 189 (5.3%) | 161 (5.1%) |
| Total | 3,542 (100.0%) | 3,162 (100.0%) |
Commute Time in Union County
The most frequently occuring commute durations in Union County are 30 to 34 minutes (1,177 commuters, 18.3%), 10 to 14 minutes (957 commuters, 14.9%), and 5 to 9 minutes (838 commuters, 13.1%).
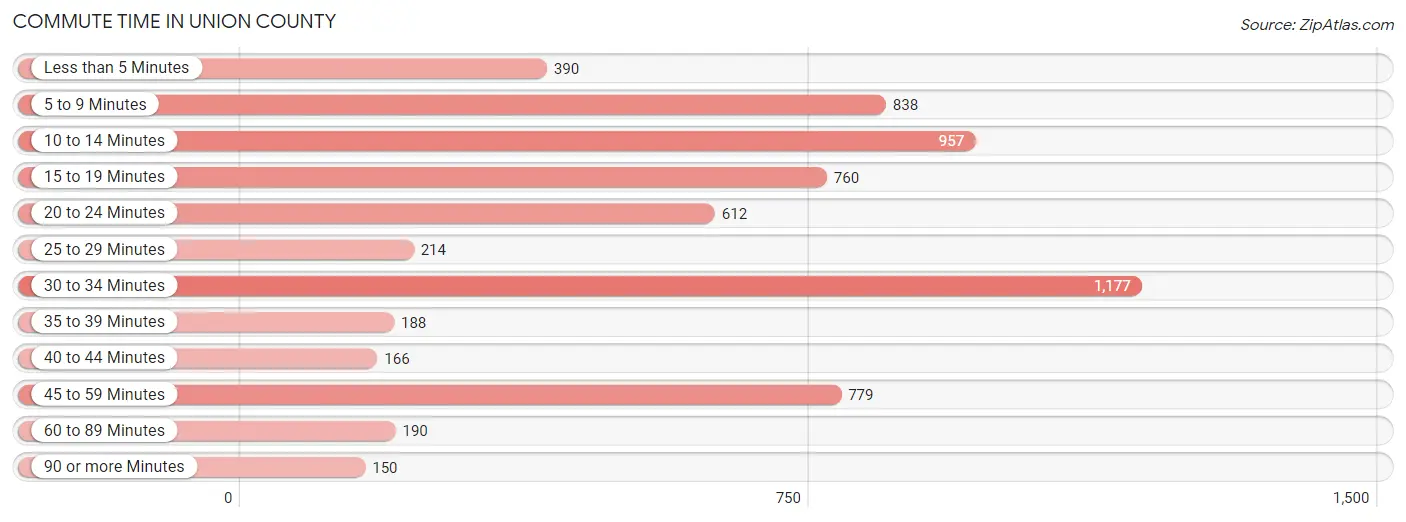
| Commute Time | # Commuters | % Commuters |
| Less than 5 Minutes | 390 | 6.1% |
| 5 to 9 Minutes | 838 | 13.1% |
| 10 to 14 Minutes | 957 | 14.9% |
| 15 to 19 Minutes | 760 | 11.8% |
| 20 to 24 Minutes | 612 | 9.5% |
| 25 to 29 Minutes | 214 | 3.3% |
| 30 to 34 Minutes | 1,177 | 18.3% |
| 35 to 39 Minutes | 188 | 2.9% |
| 40 to 44 Minutes | 166 | 2.6% |
| 45 to 59 Minutes | 779 | 12.1% |
| 60 to 89 Minutes | 190 | 3.0% |
| 90 or more Minutes | 150 | 2.3% |
Commute Time by Sex in Union County
The most common commute times in Union County are 30 to 34 minutes (673 commuters, 20.1%) for males and 10 to 14 minutes (529 commuters, 17.2%) for females.
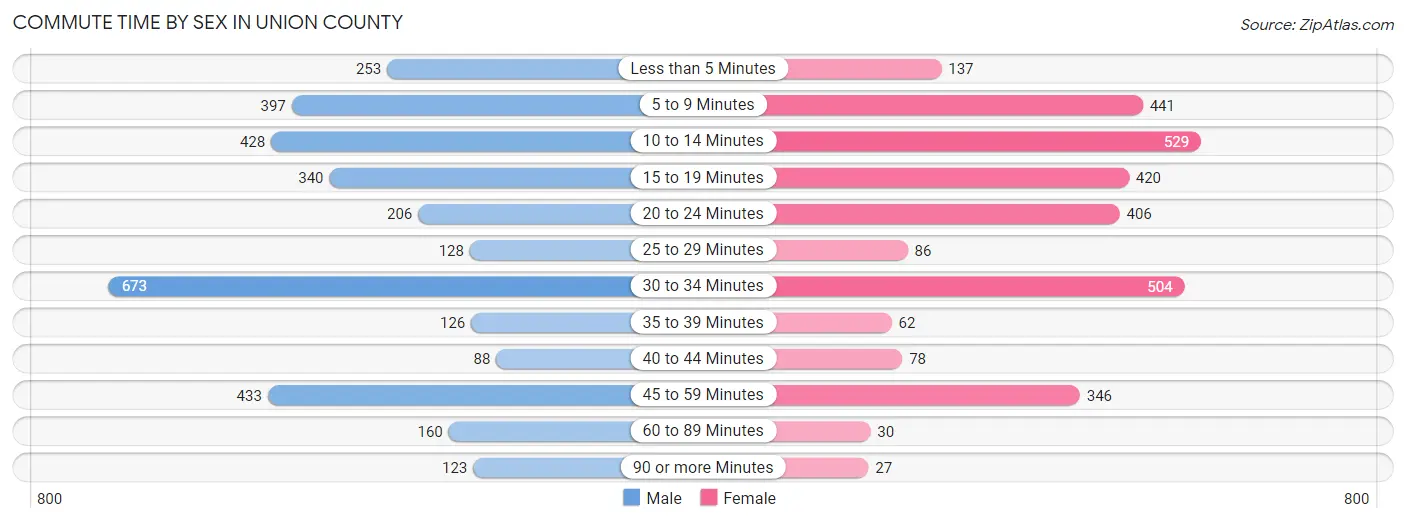
| Commute Time | Male | Female |
| Less than 5 Minutes | 253 (7.5%) | 137 (4.5%) |
| 5 to 9 Minutes | 397 (11.8%) | 441 (14.4%) |
| 10 to 14 Minutes | 428 (12.8%) | 529 (17.2%) |
| 15 to 19 Minutes | 340 (10.1%) | 420 (13.7%) |
| 20 to 24 Minutes | 206 (6.1%) | 406 (13.2%) |
| 25 to 29 Minutes | 128 (3.8%) | 86 (2.8%) |
| 30 to 34 Minutes | 673 (20.1%) | 504 (16.4%) |
| 35 to 39 Minutes | 126 (3.8%) | 62 (2.0%) |
| 40 to 44 Minutes | 88 (2.6%) | 78 (2.5%) |
| 45 to 59 Minutes | 433 (12.9%) | 346 (11.3%) |
| 60 to 89 Minutes | 160 (4.8%) | 30 (1.0%) |
| 90 or more Minutes | 123 (3.7%) | 27 (0.9%) |
Time of Departure to Work by Sex in Union County
The most frequent times of departure to work in Union County are 8:00 AM to 8:29 AM (666, 19.9%) for males and 8:00 AM to 8:29 AM (756, 24.7%) for females.
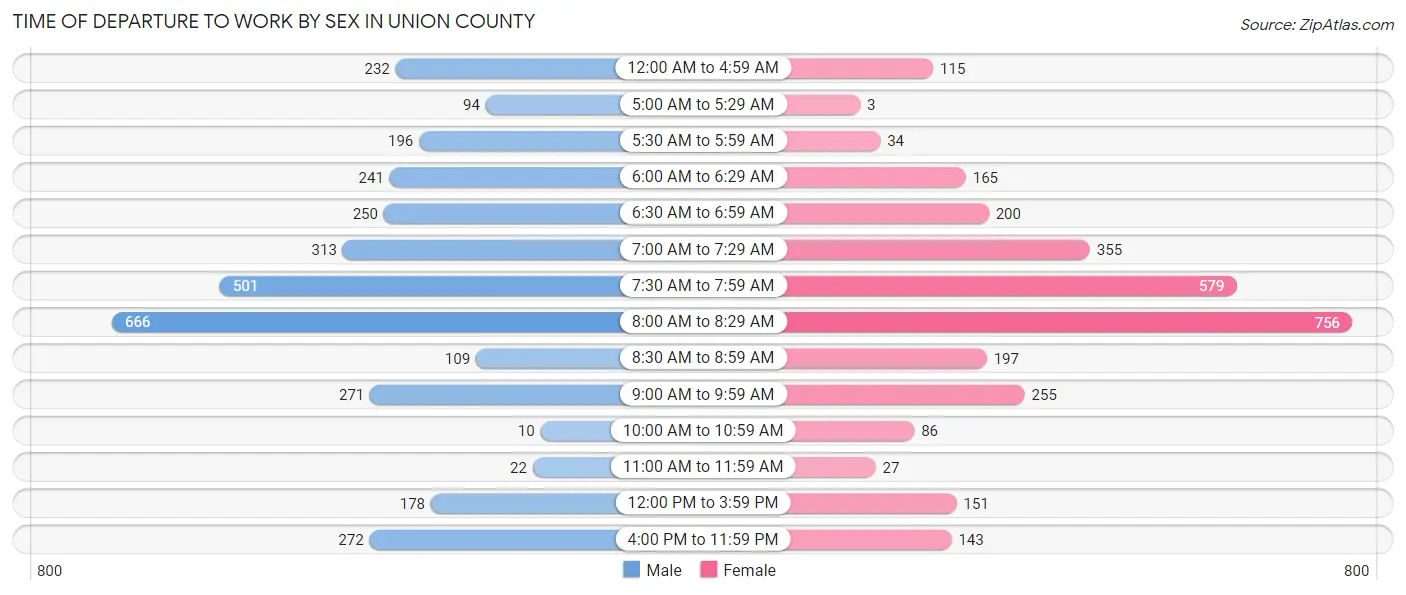
| Time of Departure | Male | Female |
| 12:00 AM to 4:59 AM | 232 (6.9%) | 115 (3.7%) |
| 5:00 AM to 5:29 AM | 94 (2.8%) | 3 (0.1%) |
| 5:30 AM to 5:59 AM | 196 (5.8%) | 34 (1.1%) |
| 6:00 AM to 6:29 AM | 241 (7.2%) | 165 (5.4%) |
| 6:30 AM to 6:59 AM | 250 (7.4%) | 200 (6.5%) |
| 7:00 AM to 7:29 AM | 313 (9.3%) | 355 (11.6%) |
| 7:30 AM to 7:59 AM | 501 (14.9%) | 579 (18.9%) |
| 8:00 AM to 8:29 AM | 666 (19.9%) | 756 (24.7%) |
| 8:30 AM to 8:59 AM | 109 (3.3%) | 197 (6.4%) |
| 9:00 AM to 9:59 AM | 271 (8.1%) | 255 (8.3%) |
| 10:00 AM to 10:59 AM | 10 (0.3%) | 86 (2.8%) |
| 11:00 AM to 11:59 AM | 22 (0.7%) | 27 (0.9%) |
| 12:00 PM to 3:59 PM | 178 (5.3%) | 151 (4.9%) |
| 4:00 PM to 11:59 PM | 272 (8.1%) | 143 (4.7%) |
| Total | 3,355 (100.0%) | 3,066 (100.0%) |
Housing Occupancy in Union County
Occupancy by Ownership in Union County
Of the total 6,763 dwellings in Union County, owner-occupied units account for 5,306 (78.5%), while renter-occupied units make up 1,457 (21.5%).
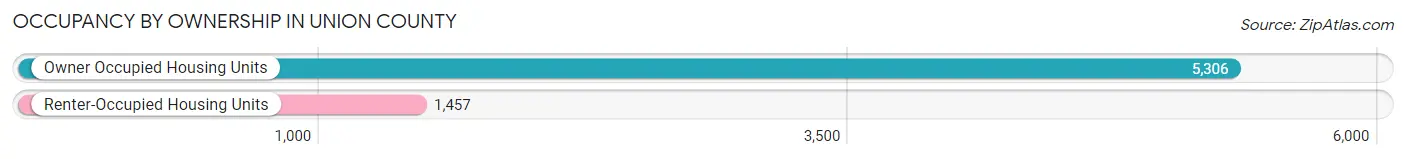
| Occupancy | # Housing Units | % Housing Units |
| Owner Occupied Housing Units | 5,306 | 78.5% |
| Renter-Occupied Housing Units | 1,457 | 21.5% |
| Total Occupied Housing Units | 6,763 | 100.0% |
Occupancy by Household Size in Union County

| Household Size | # Housing Units | % Housing Units |
| 1-Person Household | 2,339 | 34.6% |
| 2-Person Household | 2,106 | 31.1% |
| 3-Person Household | 1,058 | 15.6% |
| 4+ Person Household | 1,260 | 18.6% |
| Total Housing Units | 6,763 | 100.0% |
Occupancy by Ownership by Household Size in Union County
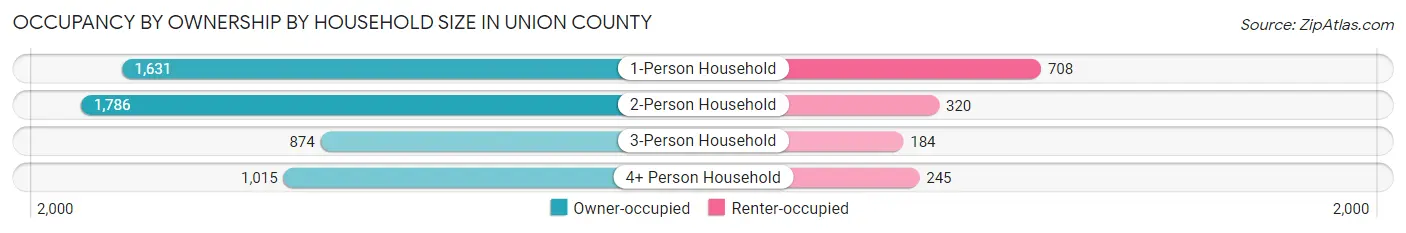
| Household Size | Owner-occupied | Renter-occupied |
| 1-Person Household | 1,631 (69.7%) | 708 (30.3%) |
| 2-Person Household | 1,786 (84.8%) | 320 (15.2%) |
| 3-Person Household | 874 (82.6%) | 184 (17.4%) |
| 4+ Person Household | 1,015 (80.6%) | 245 (19.4%) |
| Total Housing Units | 5,306 (78.5%) | 1,457 (21.5%) |
Occupancy by Educational Attainment in Union County
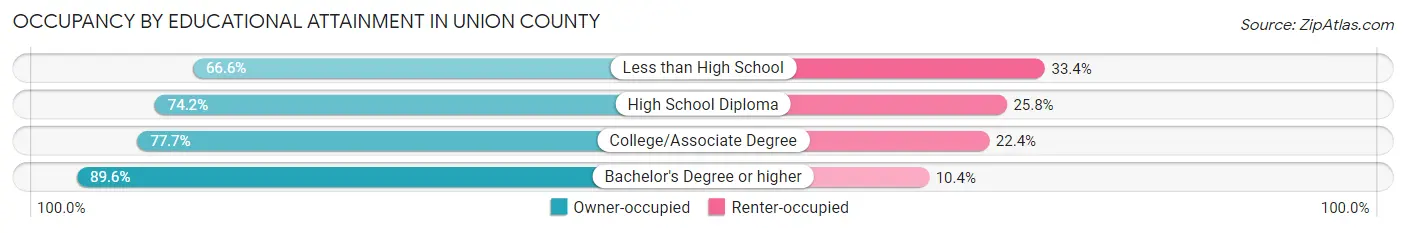
| Household Size | Owner-occupied | Renter-occupied |
| Less than High School | 483 (66.6%) | 242 (33.4%) |
| High School Diploma | 1,453 (74.2%) | 506 (25.8%) |
| College/Associate Degree | 1,848 (77.6%) | 532 (22.4%) |
| Bachelor's Degree or higher | 1,522 (89.6%) | 177 (10.4%) |
Occupancy by Age of Householder in Union County
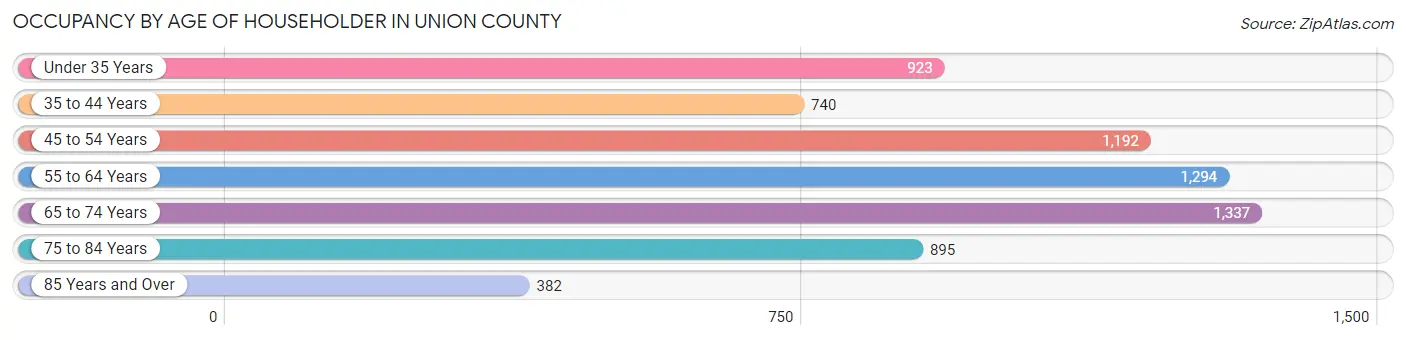
| Age Bracket | # Households | % Households |
| Under 35 Years | 923 | 13.7% |
| 35 to 44 Years | 740 | 10.9% |
| 45 to 54 Years | 1,192 | 17.6% |
| 55 to 64 Years | 1,294 | 19.1% |
| 65 to 74 Years | 1,337 | 19.8% |
| 75 to 84 Years | 895 | 13.2% |
| 85 Years and Over | 382 | 5.7% |
| Total | 6,763 | 100.0% |
Housing Finances in Union County
Median Income by Occupancy in Union County
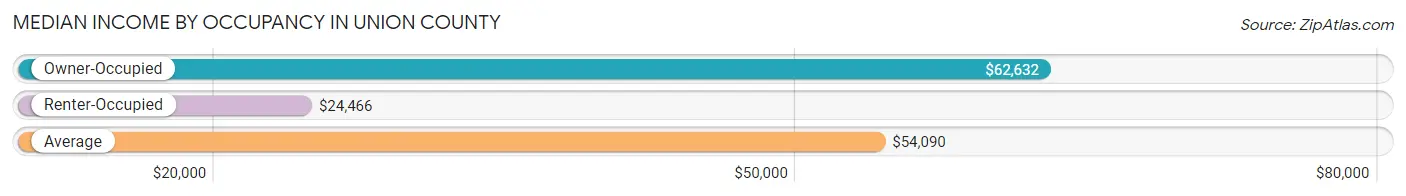
| Occupancy Type | # Households | Median Income |
| Owner-Occupied | 5,306 (78.5%) | $62,632 |
| Renter-Occupied | 1,457 (21.5%) | $24,466 |
| Average | 6,763 (100.0%) | $54,090 |
Occupancy by Householder Income Bracket in Union County
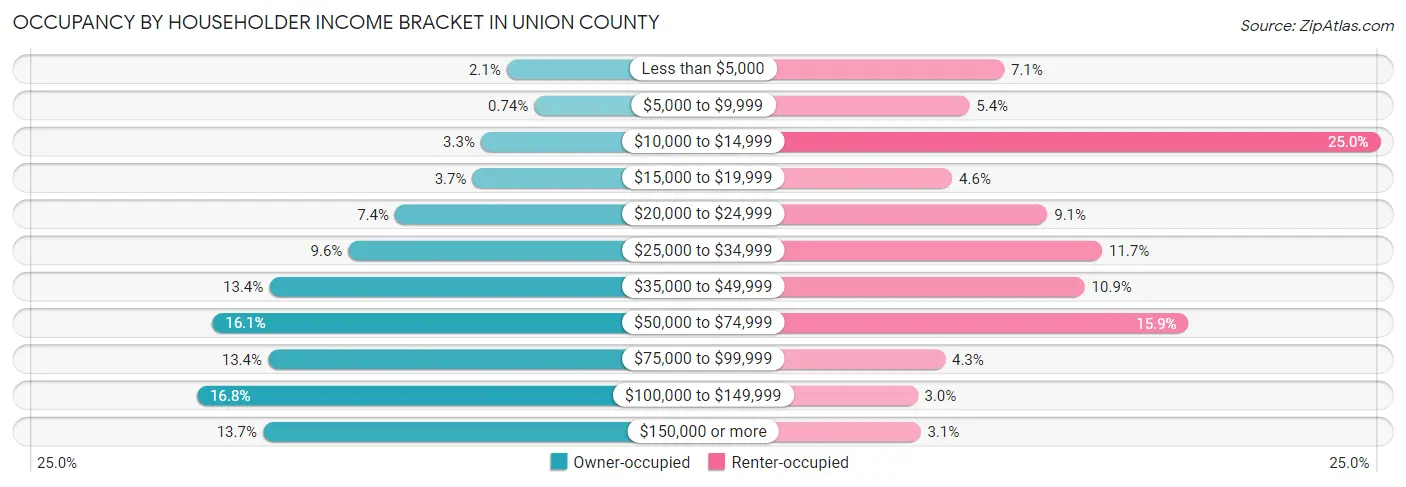
| Income Bracket | Owner-occupied | Renter-occupied |
| Less than $5,000 | 109 (2.1%) | 103 (7.1%) |
| $5,000 to $9,999 | 39 (0.7%) | 79 (5.4%) |
| $10,000 to $14,999 | 174 (3.3%) | 364 (25.0%) |
| $15,000 to $19,999 | 195 (3.7%) | 67 (4.6%) |
| $20,000 to $24,999 | 391 (7.4%) | 133 (9.1%) |
| $25,000 to $34,999 | 509 (9.6%) | 171 (11.7%) |
| $35,000 to $49,999 | 709 (13.4%) | 159 (10.9%) |
| $50,000 to $74,999 | 852 (16.1%) | 231 (15.9%) |
| $75,000 to $99,999 | 712 (13.4%) | 62 (4.3%) |
| $100,000 to $149,999 | 891 (16.8%) | 43 (2.9%) |
| $150,000 or more | 725 (13.7%) | 45 (3.1%) |
| Total | 5,306 (100.0%) | 1,457 (100.0%) |
Monthly Housing Cost Tiers in Union County
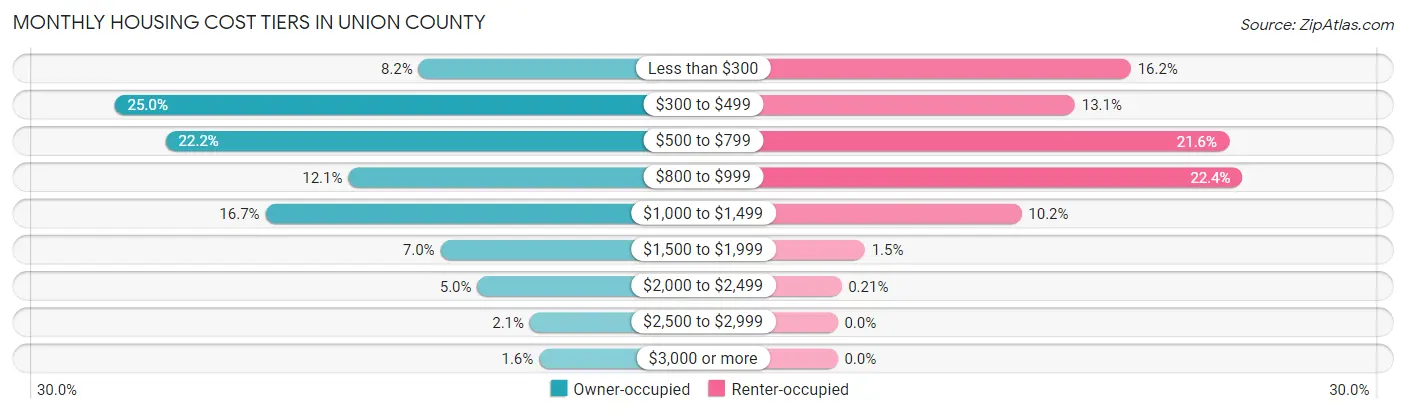
| Monthly Cost | Owner-occupied | Renter-occupied |
| Less than $300 | 437 (8.2%) | 236 (16.2%) |
| $300 to $499 | 1,328 (25.0%) | 191 (13.1%) |
| $500 to $799 | 1,179 (22.2%) | 315 (21.6%) |
| $800 to $999 | 643 (12.1%) | 326 (22.4%) |
| $1,000 to $1,499 | 886 (16.7%) | 148 (10.2%) |
| $1,500 to $1,999 | 373 (7.0%) | 22 (1.5%) |
| $2,000 to $2,499 | 265 (5.0%) | 3 (0.2%) |
| $2,500 to $2,999 | 111 (2.1%) | 0 (0.0%) |
| $3,000 or more | 84 (1.6%) | 0 (0.0%) |
| Total | 5,306 (100.0%) | 1,457 (100.0%) |
Physical Housing Characteristics in Union County
Housing Structures in Union County
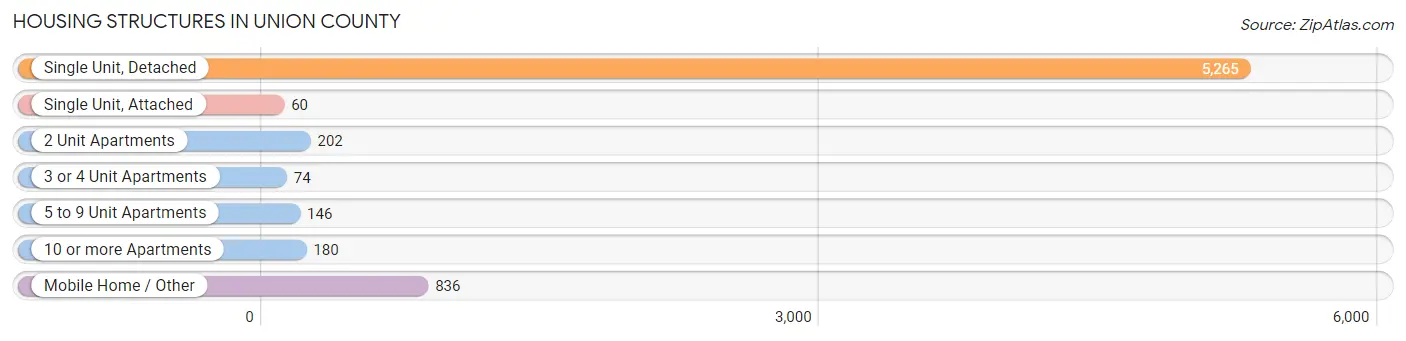
| Structure Type | # Housing Units | % Housing Units |
| Single Unit, Detached | 5,265 | 77.8% |
| Single Unit, Attached | 60 | 0.9% |
| 2 Unit Apartments | 202 | 3.0% |
| 3 or 4 Unit Apartments | 74 | 1.1% |
| 5 to 9 Unit Apartments | 146 | 2.2% |
| 10 or more Apartments | 180 | 2.7% |
| Mobile Home / Other | 836 | 12.4% |
| Total | 6,763 | 100.0% |
Housing Structures by Occupancy in Union County
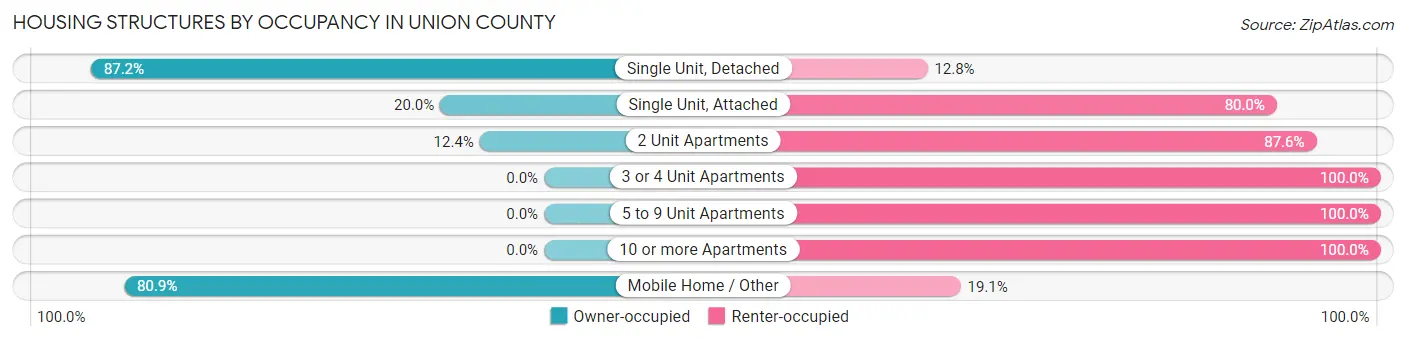
| Structure Type | Owner-occupied | Renter-occupied |
| Single Unit, Detached | 4,593 (87.2%) | 672 (12.8%) |
| Single Unit, Attached | 12 (20.0%) | 48 (80.0%) |
| 2 Unit Apartments | 25 (12.4%) | 177 (87.6%) |
| 3 or 4 Unit Apartments | 0 (0.0%) | 74 (100.0%) |
| 5 to 9 Unit Apartments | 0 (0.0%) | 146 (100.0%) |
| 10 or more Apartments | 0 (0.0%) | 180 (100.0%) |
| Mobile Home / Other | 676 (80.9%) | 160 (19.1%) |
| Total | 5,306 (78.5%) | 1,457 (21.5%) |
Housing Structures by Number of Rooms in Union County
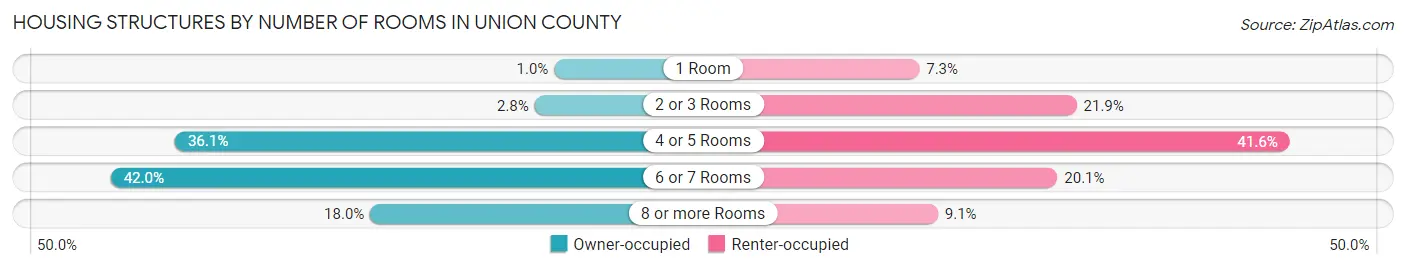
| Number of Rooms | Owner-occupied | Renter-occupied |
| 1 Room | 54 (1.0%) | 107 (7.3%) |
| 2 or 3 Rooms | 150 (2.8%) | 319 (21.9%) |
| 4 or 5 Rooms | 1,915 (36.1%) | 606 (41.6%) |
| 6 or 7 Rooms | 2,230 (42.0%) | 293 (20.1%) |
| 8 or more Rooms | 957 (18.0%) | 132 (9.1%) |
| Total | 5,306 (100.0%) | 1,457 (100.0%) |
Housing Structure by Heating Type in Union County
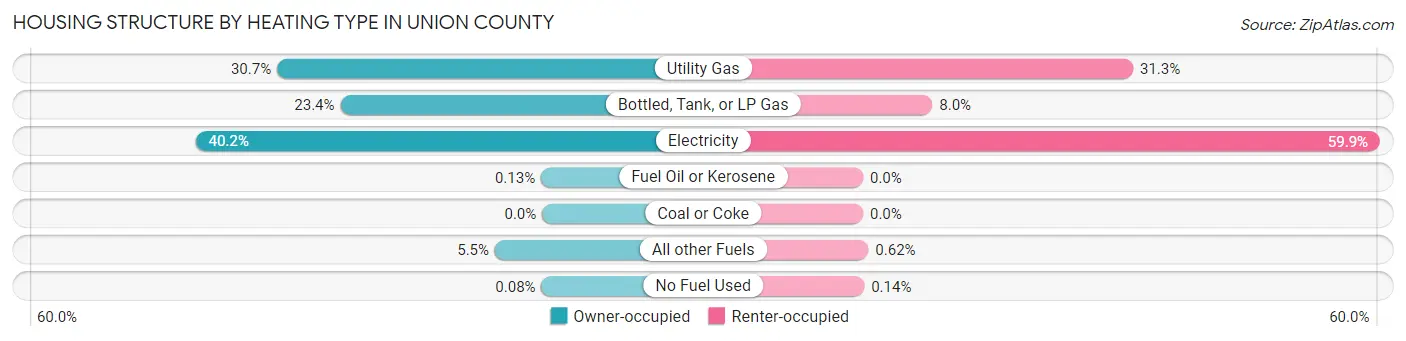
| Heating Type | Owner-occupied | Renter-occupied |
| Utility Gas | 1,631 (30.7%) | 456 (31.3%) |
| Bottled, Tank, or LP Gas | 1,241 (23.4%) | 117 (8.0%) |
| Electricity | 2,132 (40.2%) | 873 (59.9%) |
| Fuel Oil or Kerosene | 7 (0.1%) | 0 (0.0%) |
| Coal or Coke | 0 (0.0%) | 0 (0.0%) |
| All other Fuels | 291 (5.5%) | 9 (0.6%) |
| No Fuel Used | 4 (0.1%) | 2 (0.1%) |
| Total | 5,306 (100.0%) | 1,457 (100.0%) |
Household Vehicle Usage in Union County
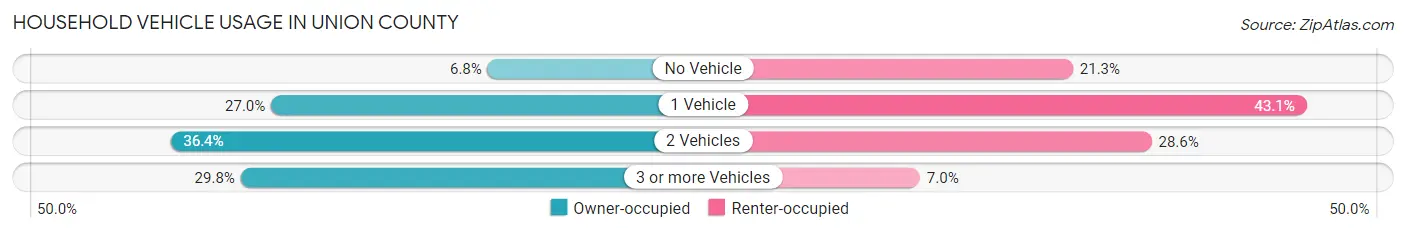
| Vehicles per Household | Owner-occupied | Renter-occupied |
| No Vehicle | 360 (6.8%) | 310 (21.3%) |
| 1 Vehicle | 1,432 (27.0%) | 628 (43.1%) |
| 2 Vehicles | 1,931 (36.4%) | 417 (28.6%) |
| 3 or more Vehicles | 1,583 (29.8%) | 102 (7.0%) |
| Total | 5,306 (100.0%) | 1,457 (100.0%) |
Real Estate & Mortgages in Union County
Real Estate and Mortgage Overview in Union County
| Characteristic | Without Mortgage | With Mortgage |
| Housing Units | 2,952 | 2,354 |
| Median Property Value | $117,300 | $139,600 |
| Median Household Income | $52,295 | $471 |
| Monthly Housing Costs | $471 | $84 |
| Real Estate Taxes | $1,533 | $197 |
Property Value by Mortgage Status in Union County
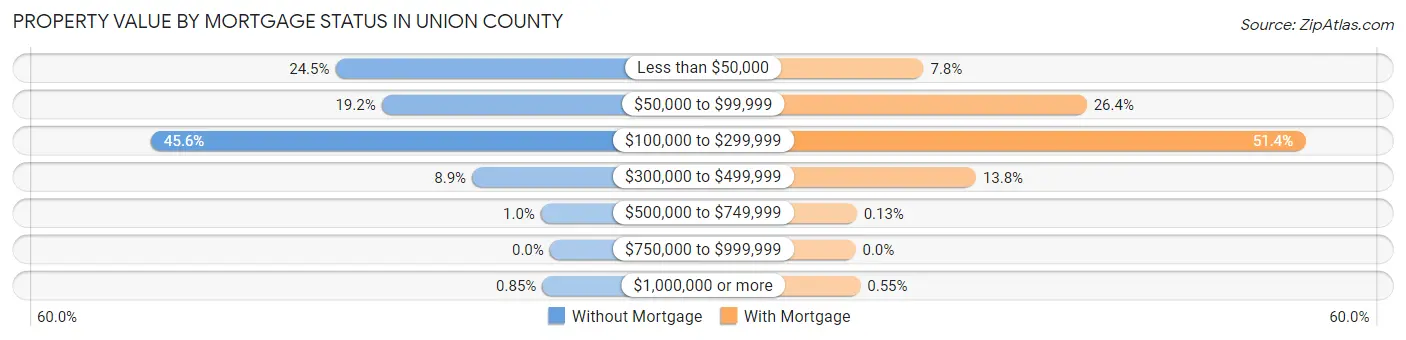
| Property Value | Without Mortgage | With Mortgage |
| Less than $50,000 | 723 (24.5%) | 183 (7.8%) |
| $50,000 to $99,999 | 567 (19.2%) | 622 (26.4%) |
| $100,000 to $299,999 | 1,345 (45.6%) | 1,209 (51.4%) |
| $300,000 to $499,999 | 262 (8.9%) | 324 (13.8%) |
| $500,000 to $749,999 | 30 (1.0%) | 3 (0.1%) |
| $750,000 to $999,999 | 0 (0.0%) | 0 (0.0%) |
| $1,000,000 or more | 25 (0.9%) | 13 (0.5%) |
| Total | 2,952 (100.0%) | 2,354 (100.0%) |
Household Income by Mortgage Status in Union County
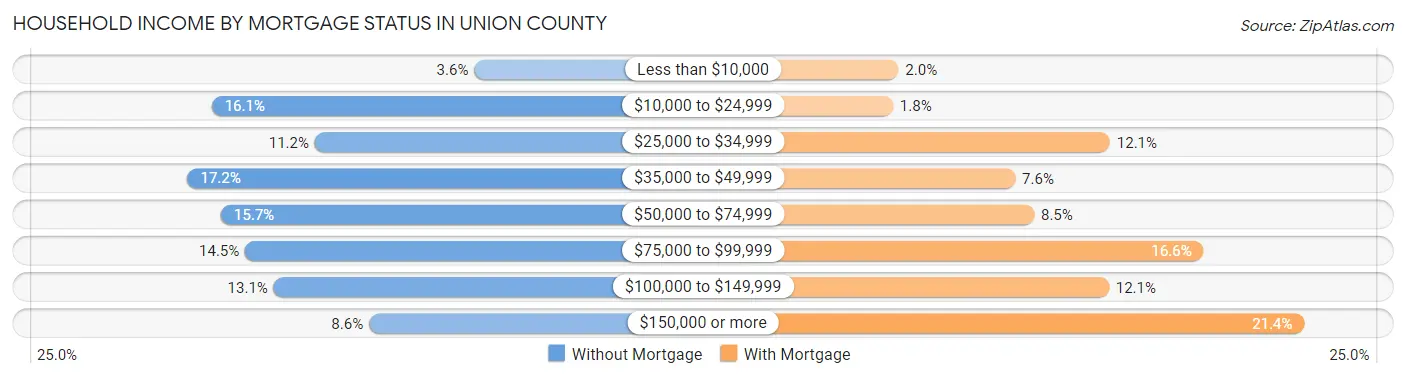
| Household Income | Without Mortgage | With Mortgage |
| Less than $10,000 | 106 (3.6%) | 48 (2.0%) |
| $10,000 to $24,999 | 475 (16.1%) | 42 (1.8%) |
| $25,000 to $34,999 | 330 (11.2%) | 285 (12.1%) |
| $35,000 to $49,999 | 509 (17.2%) | 179 (7.6%) |
| $50,000 to $74,999 | 462 (15.7%) | 200 (8.5%) |
| $75,000 to $99,999 | 428 (14.5%) | 390 (16.6%) |
| $100,000 to $149,999 | 388 (13.1%) | 284 (12.1%) |
| $150,000 or more | 254 (8.6%) | 503 (21.4%) |
| Total | 2,952 (100.0%) | 2,354 (100.0%) |
Property Value to Household Income Ratio in Union County
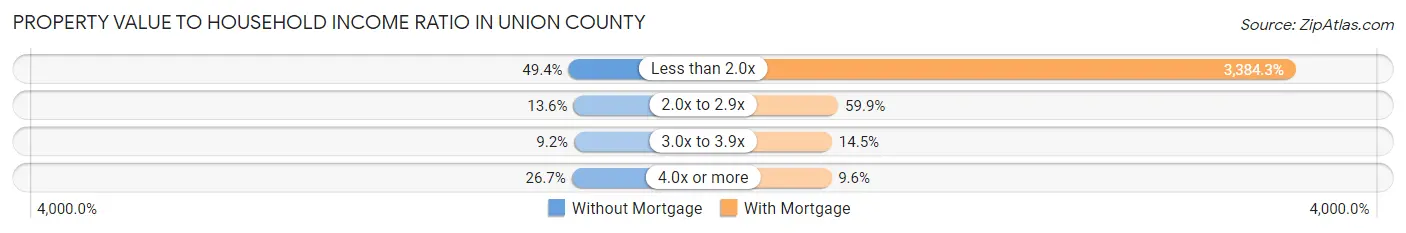
| Value-to-Income Ratio | Without Mortgage | With Mortgage |
| Less than 2.0x | 1,459 (49.4%) | 79,667 (3,384.3%) |
| 2.0x to 2.9x | 400 (13.6%) | 1,409 (59.9%) |
| 3.0x to 3.9x | 271 (9.2%) | 342 (14.5%) |
| 4.0x or more | 788 (26.7%) | 225 (9.6%) |
| Total | 2,952 (100.0%) | 2,354 (100.0%) |
Real Estate Taxes by Mortgage Status in Union County
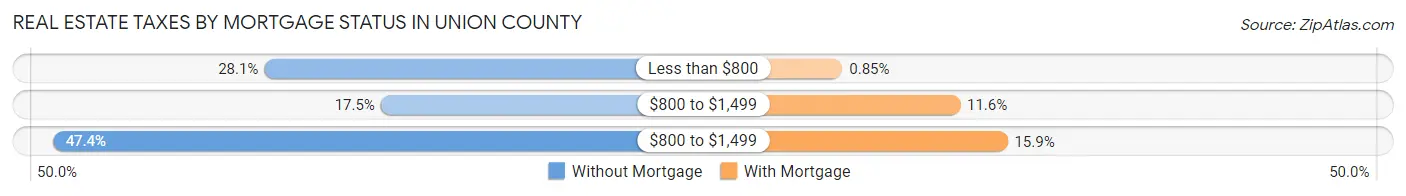
| Property Taxes | Without Mortgage | With Mortgage |
| Less than $800 | 830 (28.1%) | 20 (0.9%) |
| $800 to $1,499 | 516 (17.5%) | 273 (11.6%) |
| $800 to $1,499 | 1,400 (47.4%) | 375 (15.9%) |
| Total | 2,952 (100.0%) | 2,354 (100.0%) |
Health & Disability in Union County
Health Insurance Coverage by Age in Union County
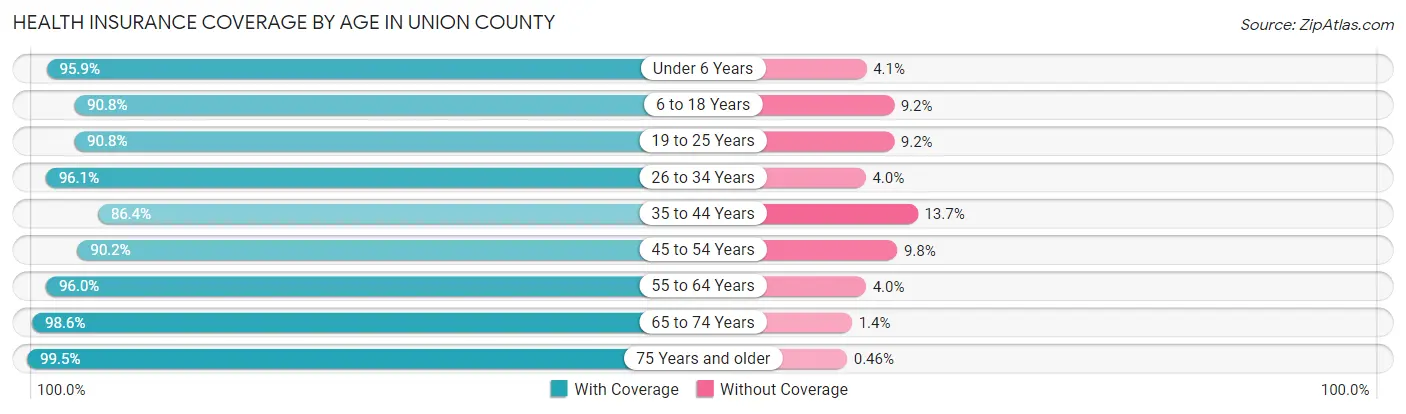
| Age Bracket | With Coverage | Without Coverage |
| Under 6 Years | 1,126 (95.9%) | 48 (4.1%) |
| 6 to 18 Years | 2,334 (90.8%) | 237 (9.2%) |
| 19 to 25 Years | 1,021 (90.8%) | 104 (9.2%) |
| 26 to 34 Years | 1,604 (96.1%) | 66 (4.0%) |
| 35 to 44 Years | 1,733 (86.4%) | 274 (13.7%) |
| 45 to 54 Years | 1,962 (90.2%) | 214 (9.8%) |
| 55 to 64 Years | 2,288 (96.0%) | 95 (4.0%) |
| 65 to 74 Years | 1,989 (98.6%) | 28 (1.4%) |
| 75 Years and older | 1,714 (99.5%) | 8 (0.5%) |
| Total | 15,771 (93.6%) | 1,074 (6.4%) |
Health Insurance Coverage by Citizenship Status in Union County
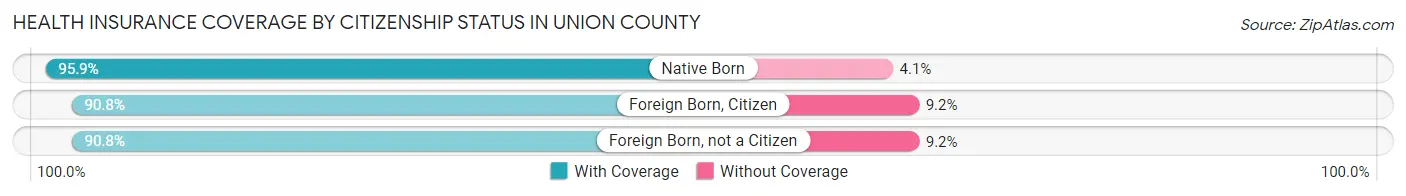
| Citizenship Status | With Coverage | Without Coverage |
| Native Born | 1,126 (95.9%) | 48 (4.1%) |
| Foreign Born, Citizen | 2,334 (90.8%) | 237 (9.2%) |
| Foreign Born, not a Citizen | 1,021 (90.8%) | 104 (9.2%) |
Health Insurance Coverage by Household Income in Union County
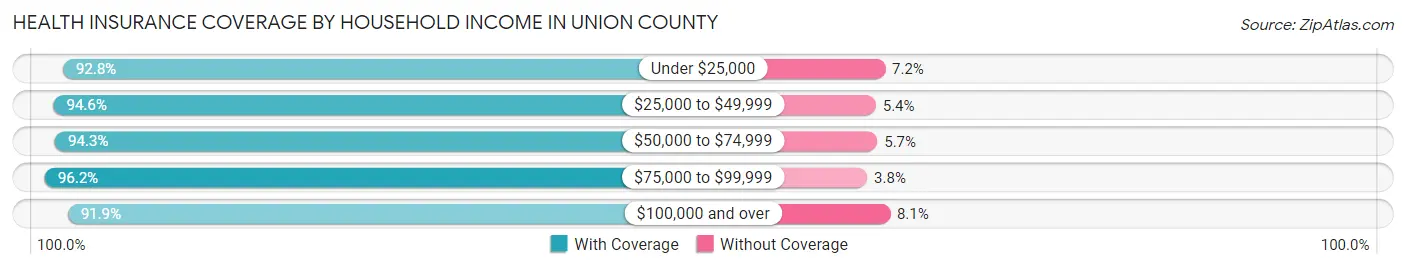
| Household Income | With Coverage | Without Coverage |
| Under $25,000 | 2,664 (92.8%) | 206 (7.2%) |
| $25,000 to $49,999 | 3,080 (94.6%) | 177 (5.4%) |
| $50,000 to $74,999 | 2,412 (94.3%) | 146 (5.7%) |
| $75,000 to $99,999 | 2,300 (96.2%) | 91 (3.8%) |
| $100,000 and over | 4,990 (91.9%) | 439 (8.1%) |
Public vs Private Health Insurance Coverage by Age in Union County
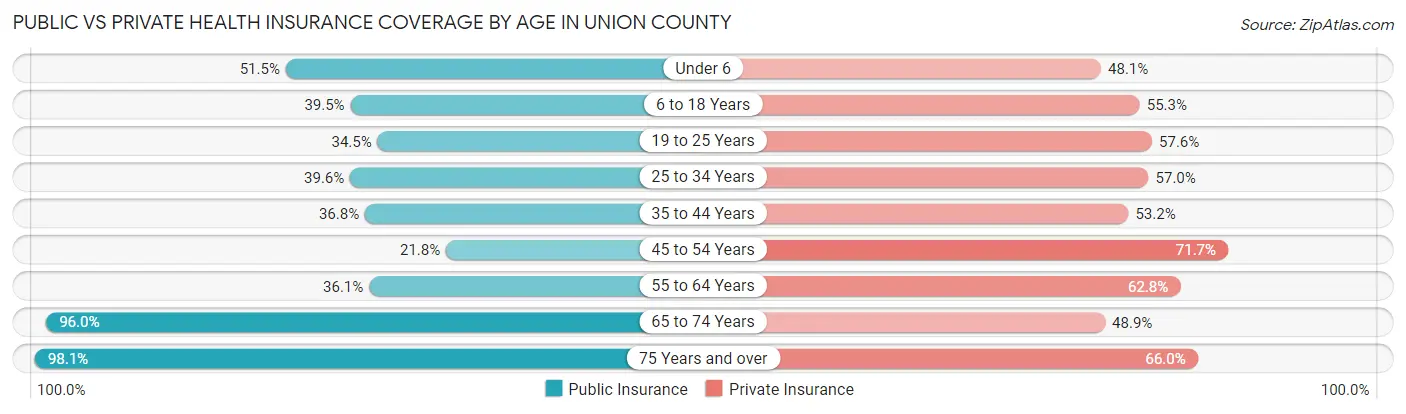
| Age Bracket | Public Insurance | Private Insurance |
| Under 6 | 605 (51.5%) | 565 (48.1%) |
| 6 to 18 Years | 1,016 (39.5%) | 1,422 (55.3%) |
| 19 to 25 Years | 388 (34.5%) | 648 (57.6%) |
| 25 to 34 Years | 661 (39.6%) | 951 (57.0%) |
| 35 to 44 Years | 739 (36.8%) | 1,068 (53.2%) |
| 45 to 54 Years | 474 (21.8%) | 1,559 (71.7%) |
| 55 to 64 Years | 859 (36.0%) | 1,496 (62.8%) |
| 65 to 74 Years | 1,936 (96.0%) | 986 (48.9%) |
| 75 Years and over | 1,689 (98.1%) | 1,137 (66.0%) |
| Total | 8,367 (49.7%) | 9,832 (58.4%) |
Disability Status by Sex by Age in Union County
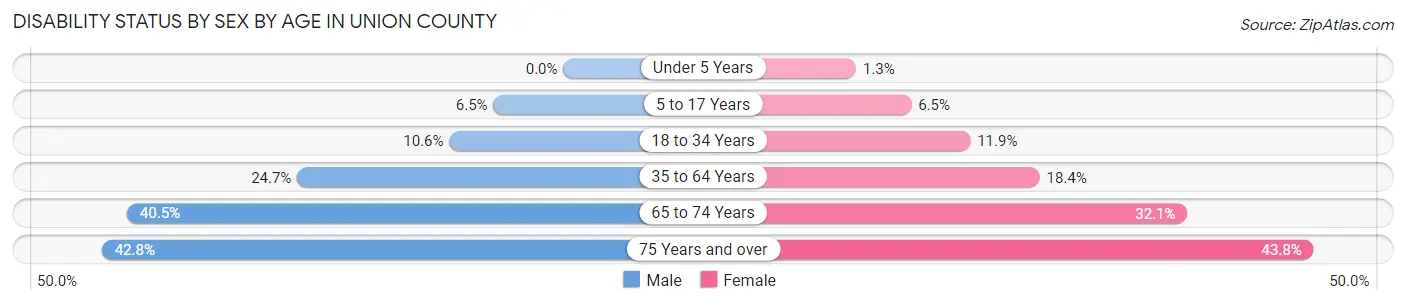
| Age Bracket | Male | Female |
| Under 5 Years | 0 (0.0%) | 6 (1.3%) |
| 5 to 17 Years | 89 (6.5%) | 82 (6.5%) |
| 18 to 34 Years | 163 (10.6%) | 171 (11.9%) |
| 35 to 64 Years | 833 (24.7%) | 586 (18.3%) |
| 65 to 74 Years | 405 (40.5%) | 326 (32.1%) |
| 75 Years and over | 317 (42.8%) | 430 (43.8%) |
Disability Class by Sex by Age in Union County
Disability Class: Hearing Difficulty
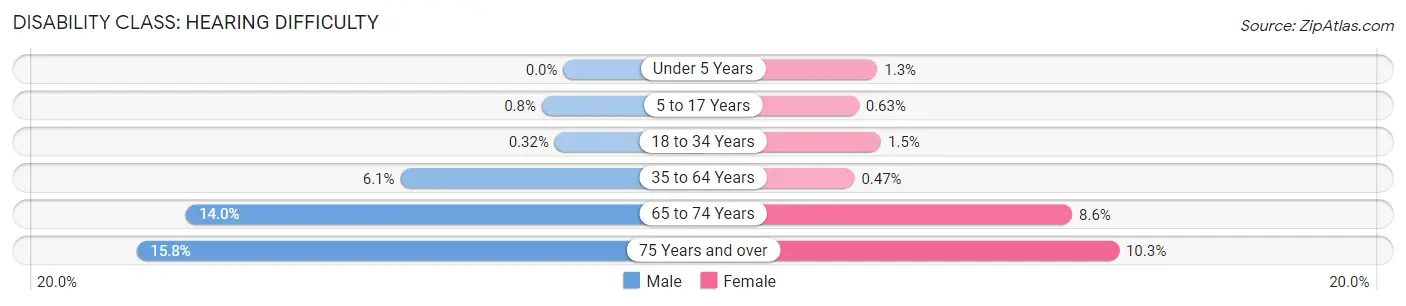
| Age Bracket | Male | Female |
| Under 5 Years | 0 (0.0%) | 6 (1.3%) |
| 5 to 17 Years | 11 (0.8%) | 8 (0.6%) |
| 18 to 34 Years | 5 (0.3%) | 21 (1.5%) |
| 35 to 64 Years | 204 (6.0%) | 15 (0.5%) |
| 65 to 74 Years | 140 (14.0%) | 87 (8.6%) |
| 75 Years and over | 117 (15.8%) | 101 (10.3%) |
Disability Class: Vision Difficulty
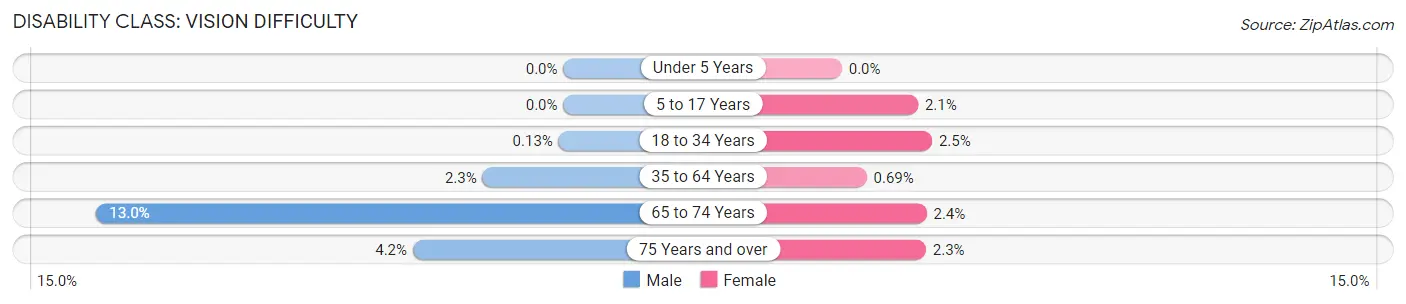
| Age Bracket | Male | Female |
| Under 5 Years | 0 (0.0%) | 0 (0.0%) |
| 5 to 17 Years | 0 (0.0%) | 27 (2.1%) |
| 18 to 34 Years | 2 (0.1%) | 36 (2.5%) |
| 35 to 64 Years | 76 (2.2%) | 22 (0.7%) |
| 65 to 74 Years | 130 (13.0%) | 24 (2.4%) |
| 75 Years and over | 31 (4.2%) | 23 (2.3%) |
Disability Class: Cognitive Difficulty
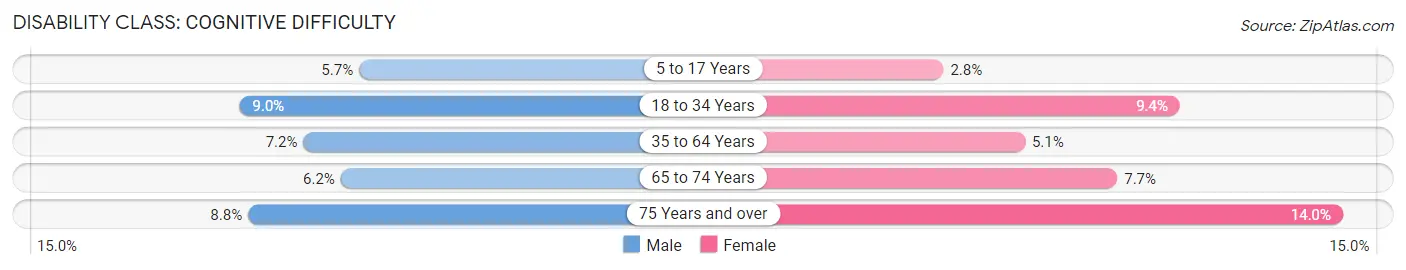
| Age Bracket | Male | Female |
| 5 to 17 Years | 78 (5.7%) | 36 (2.8%) |
| 18 to 34 Years | 139 (9.0%) | 135 (9.4%) |
| 35 to 64 Years | 244 (7.2%) | 163 (5.1%) |
| 65 to 74 Years | 62 (6.2%) | 78 (7.7%) |
| 75 Years and over | 65 (8.8%) | 137 (14.0%) |
Disability Class: Ambulatory Difficulty
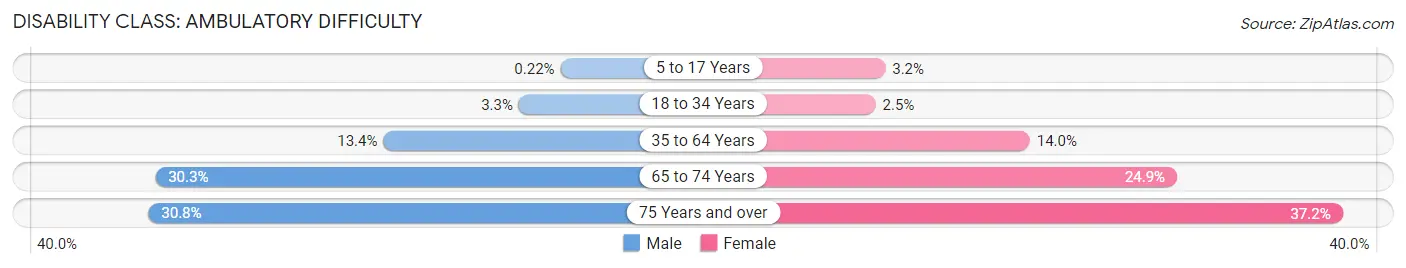
| Age Bracket | Male | Female |
| 5 to 17 Years | 3 (0.2%) | 41 (3.2%) |
| 18 to 34 Years | 51 (3.3%) | 36 (2.5%) |
| 35 to 64 Years | 451 (13.4%) | 446 (14.0%) |
| 65 to 74 Years | 303 (30.3%) | 253 (24.9%) |
| 75 Years and over | 228 (30.8%) | 365 (37.2%) |
Disability Class: Self-Care Difficulty
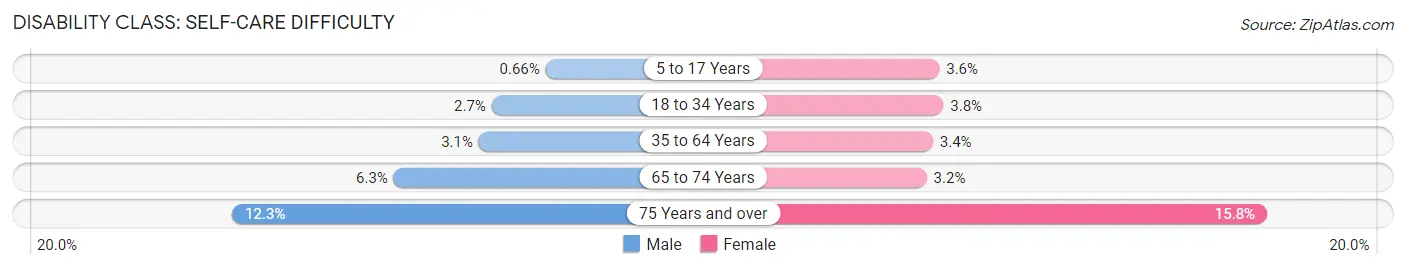
| Age Bracket | Male | Female |
| 5 to 17 Years | 9 (0.7%) | 46 (3.6%) |
| 18 to 34 Years | 41 (2.7%) | 54 (3.8%) |
| 35 to 64 Years | 106 (3.1%) | 108 (3.4%) |
| 65 to 74 Years | 63 (6.3%) | 32 (3.2%) |
| 75 Years and over | 91 (12.3%) | 155 (15.8%) |
Technology Access in Union County
Computing Device Access in Union County
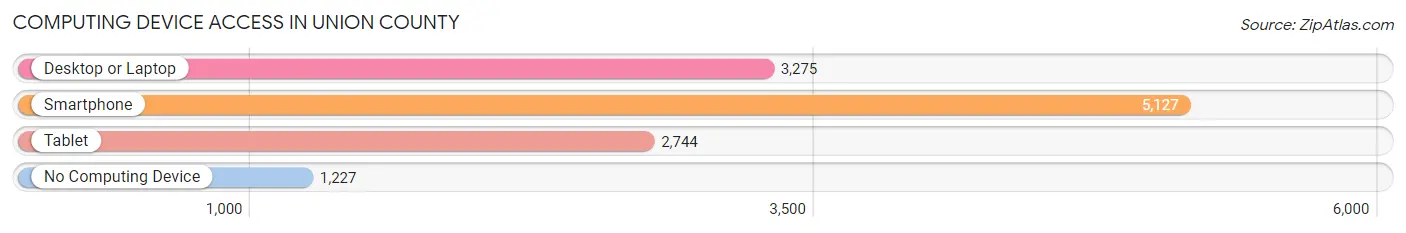
| Device Type | # Households | % Households |
| Desktop or Laptop | 3,275 | 48.4% |
| Smartphone | 5,127 | 75.8% |
| Tablet | 2,744 | 40.6% |
| No Computing Device | 1,227 | 18.1% |
| Total | 6,763 | 100.0% |
Internet Access in Union County
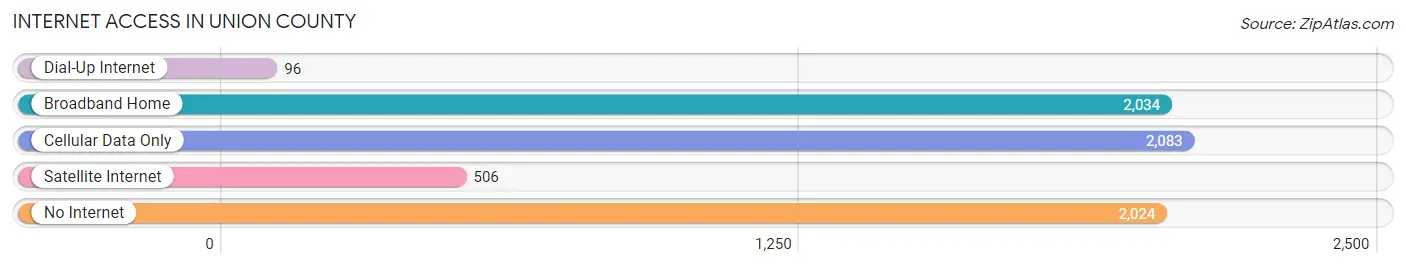
| Internet Type | # Households | % Households |
| Dial-Up Internet | 96 | 1.4% |
| Broadband Home | 2,034 | 30.1% |
| Cellular Data Only | 2,083 | 30.8% |
| Satellite Internet | 506 | 7.5% |
| No Internet | 2,024 | 29.9% |
| Total | 6,763 | 100.0% |
Union County Summary
County History
Union County, Illinois is located in the southern part of the state and is part of the Metro East region. It was established in 1818 and was named after the union of the United States. The county was originally part of Johnson County, which was created in 1812. The county seat is Jonesboro, which was established in 1818.
The first settlers in Union County were mostly from Kentucky, Tennessee, and Virginia. They were attracted to the area due to its fertile soil and abundant wildlife. The first industry in the county was farming, and the first crops grown were corn, wheat, and oats.
The county was also home to several Native American tribes, including the Shawnee, Kickapoo, and Potawatomi. These tribes were eventually forced out of the area by the US government in the 1830s.
The county experienced rapid growth in the late 19th and early 20th centuries due to the coal mining industry. The coal mines provided jobs for many of the county’s residents and helped to fuel the local economy.
Geography
Union County is located in the southern part of Illinois and is bordered by Johnson County to the north, Alexander County to the east, Pulaski County to the south, and Williamson County to the west. The county covers an area of 545 square miles and has a population of 17,845 as of the 2020 census.
The county is mostly rural, with the majority of the land being used for farming. The terrain is mostly flat, with some rolling hills in the northern part of the county. The county is also home to several small lakes and streams, including the Big Muddy River, which runs through the county.
The climate in Union County is generally mild, with hot summers and cold winters. The average annual temperature is around 50 degrees Fahrenheit.
Economy
Union County’s economy is largely based on agriculture and manufacturing. The county is home to several large farms, which produce corn, soybeans, wheat, and other crops. The county is also home to several manufacturing companies, which produce a variety of products, including furniture, clothing, and automotive parts.
The county is also home to several small businesses, including restaurants, retail stores, and service providers. The county is also home to several tourist attractions, including the Union County Museum and the Union County Historical Society.
Demographics
As of the 2020 census, the population of Union County was 17,845. The population is mostly white (94.3%), with small percentages of African American (2.3%), Hispanic (1.7%), and Asian (0.7%) residents. The median household income in the county is $45,845, and the median home value is $117,400.
The county is home to several small towns, including Jonesboro, Anna, Cobden, Dongola, and Wolf Lake. The county seat is Jonesboro, which is home to the Union County Courthouse and the Union County Museum.
Conclusion
Union County, Illinois is a rural county located in the southern part of the state. It was established in 1818 and is home to a population of 17,845 as of the 2020 census. The county’s economy is largely based on agriculture and manufacturing, and the county is home to several small towns and tourist attractions. The county is also home to several Native American tribes, which were forced out of the area in the 1830s.
Common Questions
What is the Total Population of Union County?
Total Population of Union County is 17,122.
What is the Total Male Population of Union County?
Total Male Population of Union County is 8,662.
What is the Total Female Population of Union County?
Total Female Population of Union County is 8,460.
What is the Ratio of Males per 100 Females in Union County?
There are 102.39 Males per 100 Females in Union County.
What is the Ratio of Females per 100 Males in Union County?
There are 97.67 Females per 100 Males in Union County.
What is the Median Population Age in Union County?
Median Population Age in Union County is 44.7 Years.
What is the Average Family Size in Union County
Average Family Size in Union County is 3.1 People.
What is the Average Household Size in Union County
Average Household Size in Union County is 2.4 People.
What is Per Capita Income in Union County?
Per Capita income in Union County is $30,171.
What is the Median Family Income in Union County?
Median Family Income in Union County is $77,414.
What is the Median Household income in Union County?
Median Household Income in Union County is $54,090.
What is Income or Wage Gap in Union County?
Income or Wage Gap in Union County is 35.9%.
Women in Union County earn 64.1 cents for every dollar earned by a man.
What is Family Income Deficit in Union County?
Family Income Deficit in Union County is $9,560.
Families that are below poverty line in Union County earn $9,560 less on average than the poverty threshold level.
What is Inequality or Gini Index in Union County?
Inequality or Gini Index in Union County is 0.45.
How Large is the Labor Force in Union County?
There are 7,241 People in the Labor Forcein in Union County.
What is the Percentage of People in the Labor Force in Union County?
51.4% of People are in the Labor Force in Union County.
What is the Unemployment Rate in Union County?
Unemployment Rate in Union County is 6.3%.