Tazewell County, IL
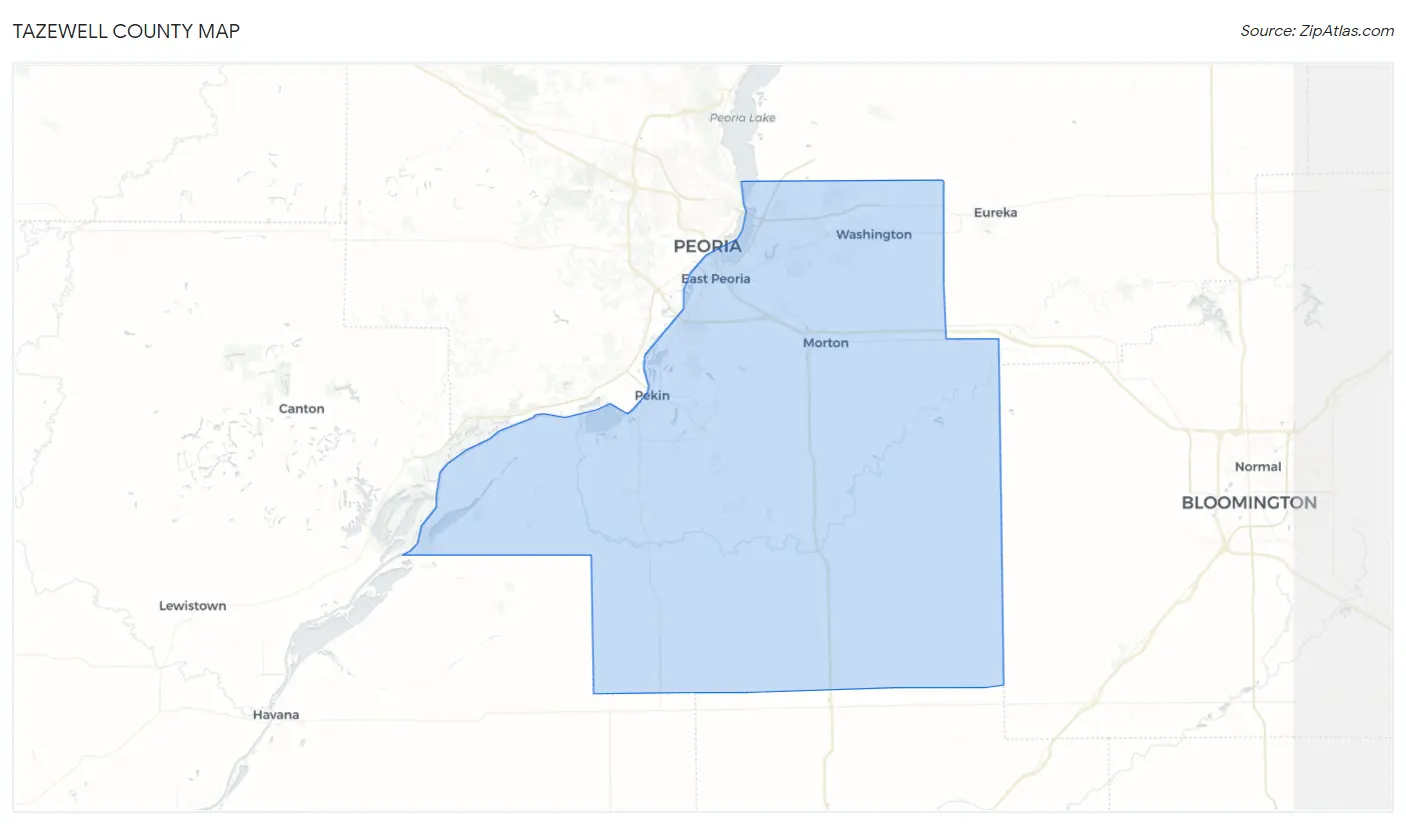
Tazewell County Map
Tazewell County Overview
131,276
TOTAL POPULATION
64,995
MALE POPULATION
66,281
FEMALE POPULATION
98.06
MALES / 100 FEMALES
101.98
FEMALES / 100 MALES
41.6
MEDIAN AGE
3.0
AVG FAMILY SIZE
2.4
AVG HOUSEHOLD SIZE
$38,573
PER CAPITA INCOME
$94,169
AVG FAMILY INCOME
$74,606
AVG HOUSEHOLD INCOME
36.6%
WAGE / INCOME GAP [ % ]
63.4¢/ $1
WAGE / INCOME GAP [ $ ]
$11,455
FAMILY INCOME DEFICIT
0.42
INEQUALITY / GINI INDEX
64,958
LABOR FORCE [ PEOPLE ]
61.6%
PERCENT IN LABOR FORCE
3.9%
UNEMPLOYMENT RATE
Tazewell County Area Codes
Race in Tazewell County
The most populous races in Tazewell County are White / Caucasian (123,986 | 94.5%), Two or more Races (3,610 | 2.8%), and Hispanic or Latino (3,385 | 2.6%).
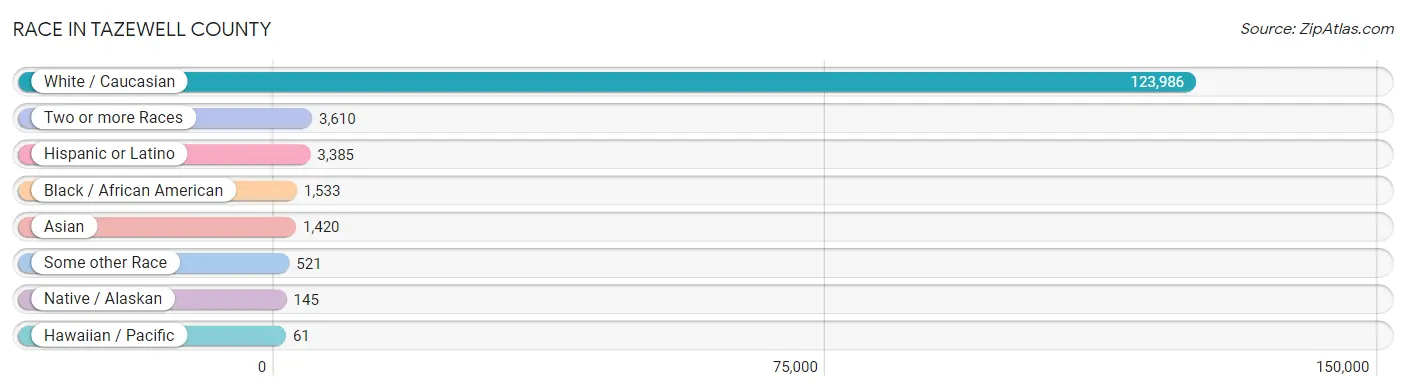
| Race | # Population | % Population |
| Asian | 1,420 | 1.1% |
| Black / African American | 1,533 | 1.2% |
| Hawaiian / Pacific | 61 | 0.1% |
| Hispanic or Latino | 3,385 | 2.6% |
| Native / Alaskan | 145 | 0.1% |
| White / Caucasian | 123,986 | 94.5% |
| Two or more Races | 3,610 | 2.8% |
| Some other Race | 521 | 0.4% |
| Total | 131,276 | 100.0% |
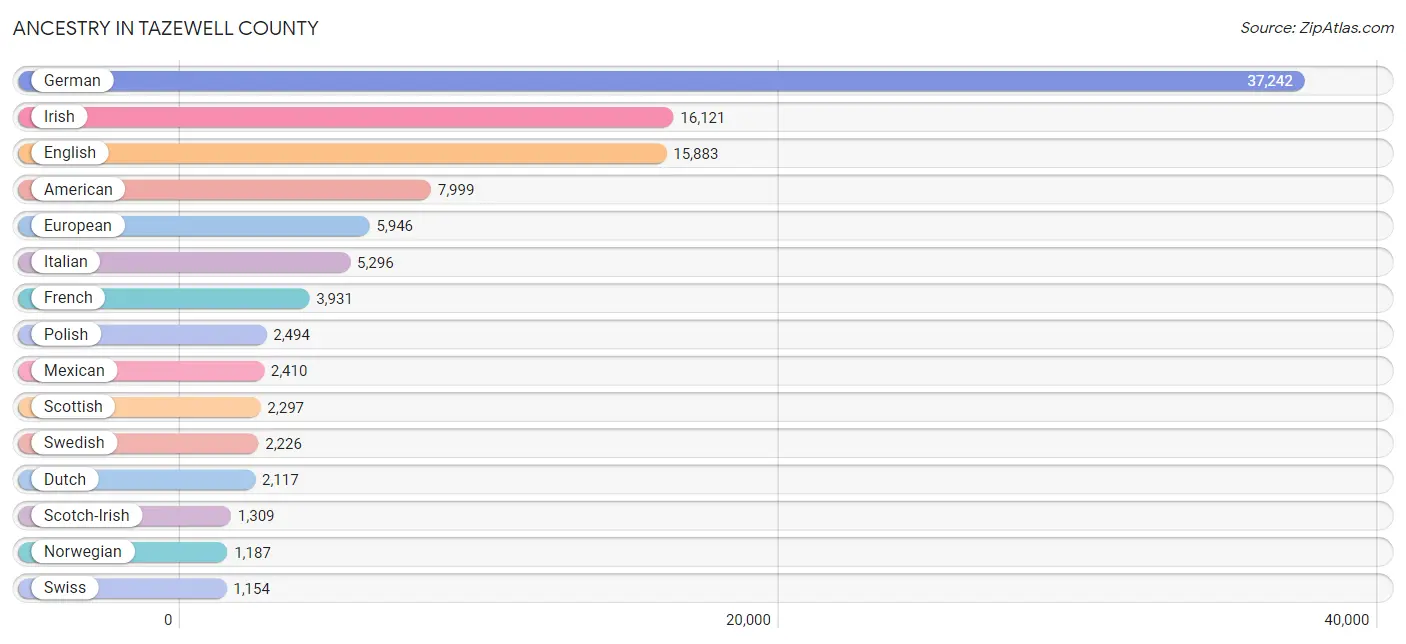
Ancestry in Tazewell County
The most populous ancestries reported in Tazewell County are German (37,242 | 28.4%), Irish (16,121 | 12.3%), English (15,883 | 12.1%), American (7,999 | 6.1%), and European (5,946 | 4.5%), together accounting for 63.4% of all Tazewell County residents.
| Ancestry | # Population | % Population |
| African | 149 | 0.1% |
| Alaska Native | 28 | 0.0% |
| Albanian | 101 | 0.1% |
| Alsatian | 10 | 0.0% |
| American | 7,999 | 6.1% |
| Arab | 289 | 0.2% |
| Argentinean | 1 | 0.0% |
| Armenian | 20 | 0.0% |
| Australian | 31 | 0.0% |
| Austrian | 226 | 0.2% |
| Belgian | 478 | 0.4% |
| Bhutanese | 158 | 0.1% |
| Blackfeet | 29 | 0.0% |
| Bolivian | 3 | 0.0% |
| Brazilian | 2 | 0.0% |
| British | 612 | 0.5% |
| British West Indian | 1 | 0.0% |
| Bulgarian | 6 | 0.0% |
| Burmese | 304 | 0.2% |
| Canadian | 151 | 0.1% |
| Central American | 76 | 0.1% |
| Central American Indian | 27 | 0.0% |
| Cherokee | 175 | 0.1% |
| Chippewa | 5 | 0.0% |
| Colombian | 53 | 0.0% |
| Colville | 2 | 0.0% |
| Croatian | 174 | 0.1% |
| Cuban | 13 | 0.0% |
| Czech | 439 | 0.3% |
| Czechoslovakian | 124 | 0.1% |
| Danish | 513 | 0.4% |
| Dominican | 3 | 0.0% |
| Dutch | 2,117 | 1.6% |
| Eastern European | 109 | 0.1% |
| English | 15,883 | 12.1% |
| Estonian | 18 | 0.0% |
| Ethiopian | 36 | 0.0% |
| European | 5,946 | 4.5% |
| Fijian | 25 | 0.0% |
| Finnish | 57 | 0.0% |
| French | 3,931 | 3.0% |
| French Canadian | 318 | 0.2% |
| German | 37,242 | 28.4% |
| Greek | 401 | 0.3% |
| Guamanian / Chamorro | 9 | 0.0% |
| Guatemalan | 37 | 0.0% |
| Haitian | 12 | 0.0% |
| Honduran | 14 | 0.0% |
| Hungarian | 232 | 0.2% |
| Icelander | 32 | 0.0% |
| Indian (Asian) | 410 | 0.3% |
| Indonesian | 29 | 0.0% |
| Inupiat | 1 | 0.0% |
| Irish | 16,121 | 12.3% |
| Italian | 5,296 | 4.0% |
| Jamaican | 13 | 0.0% |
| Japanese | 1 | 0.0% |
| Kenyan | 19 | 0.0% |
| Korean | 384 | 0.3% |
| Lebanese | 270 | 0.2% |
| Lithuanian | 211 | 0.2% |
| Mexican | 2,410 | 1.8% |
| Mongolian | 24 | 0.0% |
| Native Hawaiian | 32 | 0.0% |
| Navajo | 37 | 0.0% |
| Nigerian | 20 | 0.0% |
| Northern European | 291 | 0.2% |
| Norwegian | 1,187 | 0.9% |
| Pakistani | 14 | 0.0% |
| Panamanian | 25 | 0.0% |
| Peruvian | 14 | 0.0% |
| Polish | 2,494 | 1.9% |
| Portuguese | 220 | 0.2% |
| Puerto Rican | 466 | 0.4% |
| Puget Sound Salish | 26 | 0.0% |
| Romanian | 58 | 0.0% |
| Russian | 270 | 0.2% |
| Samoan | 28 | 0.0% |
| Scandinavian | 365 | 0.3% |
| Scotch-Irish | 1,309 | 1.0% |
| Scottish | 2,297 | 1.8% |
| Serbian | 73 | 0.1% |
| Sioux | 18 | 0.0% |
| Slavic | 17 | 0.0% |
| Slovak | 168 | 0.1% |
| Slovene | 40 | 0.0% |
| Somali | 22 | 0.0% |
| South American | 71 | 0.1% |
| Spaniard | 87 | 0.1% |
| Spanish | 71 | 0.1% |
| Sri Lankan | 234 | 0.2% |
| Subsaharan African | 288 | 0.2% |
| Swedish | 2,226 | 1.7% |
| Swiss | 1,154 | 0.9% |
| Syrian | 19 | 0.0% |
| Thai | 301 | 0.2% |
| Turkish | 3 | 0.0% |
| Ukrainian | 104 | 0.1% |
| Welsh | 814 | 0.6% |
| Yugoslavian | 61 | 0.1% |
| Zimbabwean | 26 | 0.0% | View All 101 Rows |
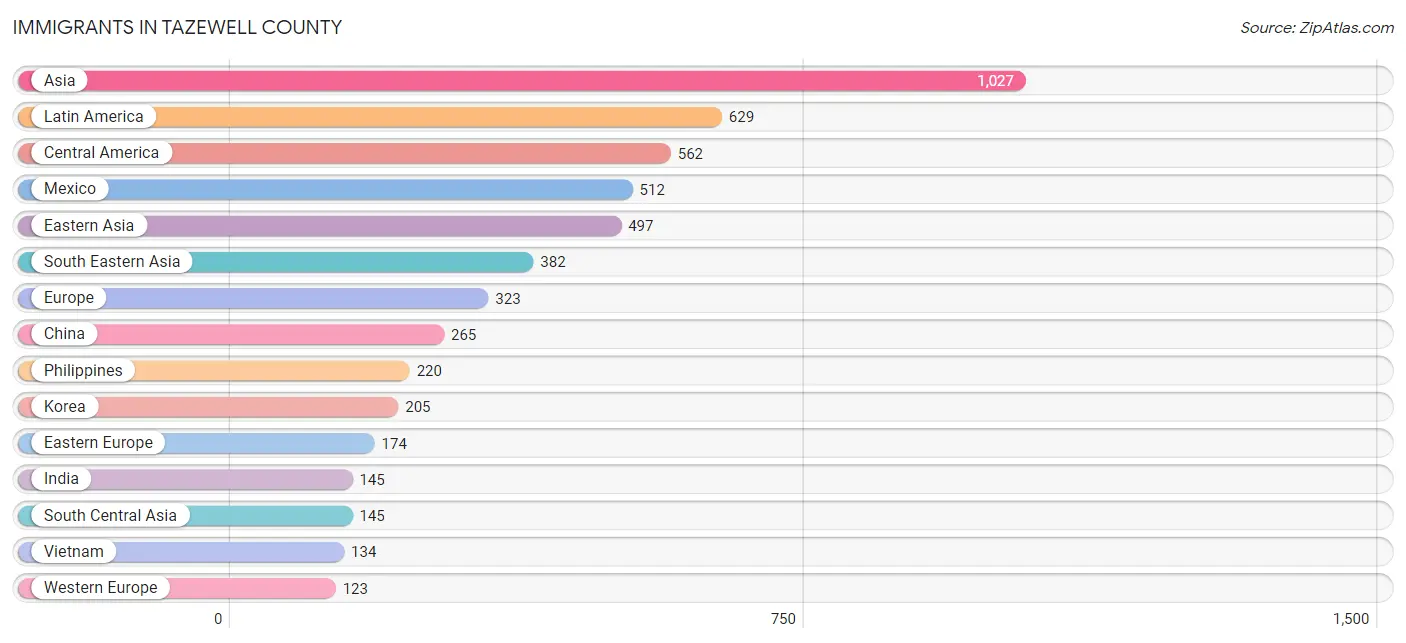
Immigrants in Tazewell County
The most numerous immigrant groups reported in Tazewell County came from Asia (1,027 | 0.8%), Latin America (629 | 0.5%), Central America (562 | 0.4%), Mexico (512 | 0.4%), and Eastern Asia (497 | 0.4%), together accounting for 2.5% of all Tazewell County residents.
| Immigration Origin | # Population | % Population |
| Africa | 101 | 0.1% |
| Albania | 82 | 0.1% |
| Asia | 1,027 | 0.8% |
| Australia | 3 | 0.0% |
| Brazil | 9 | 0.0% |
| Canada | 53 | 0.0% |
| Central America | 562 | 0.4% |
| China | 265 | 0.2% |
| Colombia | 48 | 0.0% |
| Eastern Africa | 79 | 0.1% |
| Eastern Asia | 497 | 0.4% |
| Eastern Europe | 174 | 0.1% |
| El Salvador | 15 | 0.0% |
| England | 8 | 0.0% |
| Ethiopia | 36 | 0.0% |
| Europe | 323 | 0.3% |
| France | 8 | 0.0% |
| Germany | 93 | 0.1% |
| Guatemala | 27 | 0.0% |
| Honduras | 8 | 0.0% |
| Hungary | 5 | 0.0% |
| India | 145 | 0.1% |
| Japan | 27 | 0.0% |
| Kenya | 19 | 0.0% |
| Korea | 205 | 0.2% |
| Latin America | 629 | 0.5% |
| Latvia | 7 | 0.0% |
| Malaysia | 3 | 0.0% |
| Mexico | 512 | 0.4% |
| Netherlands | 22 | 0.0% |
| Nigeria | 22 | 0.0% |
| Northern Europe | 22 | 0.0% |
| Oceania | 34 | 0.0% |
| Peru | 10 | 0.0% |
| Philippines | 220 | 0.2% |
| Poland | 7 | 0.0% |
| Portugal | 4 | 0.0% |
| Romania | 5 | 0.0% |
| Russia | 37 | 0.0% |
| Scotland | 11 | 0.0% |
| Somalia | 22 | 0.0% |
| South America | 67 | 0.1% |
| South Central Asia | 145 | 0.1% |
| South Eastern Asia | 382 | 0.3% |
| Southern Europe | 4 | 0.0% |
| Thailand | 6 | 0.0% |
| Turkey | 3 | 0.0% |
| Ukraine | 31 | 0.0% |
| Vietnam | 134 | 0.1% |
| Western Africa | 22 | 0.0% |
| Western Asia | 3 | 0.0% |
| Western Europe | 123 | 0.1% | View All 52 Rows |
Sex and Age in Tazewell County
Sex and Age in Tazewell County
The most populous age groups in Tazewell County are 40 to 44 Years (5,188 | 8.0%) for men and 60 to 64 Years (4,804 | 7.2%) for women.
| Age Bracket | Male | Female |
| Under 5 Years | 3,570 (5.5%) | 3,433 (5.2%) |
| 5 to 9 Years | 4,094 (6.3%) | 4,180 (6.3%) |
| 10 to 14 Years | 4,502 (6.9%) | 4,206 (6.4%) |
| 15 to 19 Years | 4,219 (6.5%) | 3,979 (6.0%) |
| 20 to 24 Years | 3,637 (5.6%) | 3,224 (4.9%) |
| 25 to 29 Years | 3,730 (5.7%) | 3,815 (5.8%) |
| 30 to 34 Years | 4,081 (6.3%) | 3,828 (5.8%) |
| 35 to 39 Years | 3,793 (5.8%) | 4,268 (6.4%) |
| 40 to 44 Years | 5,188 (8.0%) | 4,127 (6.2%) |
| 45 to 49 Years | 4,047 (6.2%) | 4,031 (6.1%) |
| 50 to 54 Years | 4,200 (6.5%) | 4,016 (6.1%) |
| 55 to 59 Years | 4,147 (6.4%) | 4,221 (6.4%) |
| 60 to 64 Years | 4,537 (7.0%) | 4,804 (7.2%) |
| 65 to 69 Years | 3,712 (5.7%) | 4,075 (6.1%) |
| 70 to 74 Years | 3,098 (4.8%) | 3,539 (5.3%) |
| 75 to 79 Years | 2,121 (3.3%) | 2,660 (4.0%) |
| 80 to 84 Years | 1,039 (1.6%) | 1,659 (2.5%) |
| 85 Years and over | 1,280 (2.0%) | 2,216 (3.3%) |
| Total | 64,995 (100.0%) | 66,281 (100.0%) |
Families and Households in Tazewell County
Median Family Size in Tazewell County
The median family size in Tazewell County is 2.97 persons per family, with married-couple families (27,966 | 80.7%) accounting for the largest median family size of 3.01 persons per family. On the other hand, single male/father families (2,102 | 6.1%) represent the smallest median family size with 2.69 persons per family.
| Family Type | # Families | Family Size |
| Married-Couple | 27,966 (80.7%) | 3.01 |
| Single Male/Father | 2,102 (6.1%) | 2.69 |
| Single Female/Mother | 4,592 (13.3%) | 2.87 |
| Total Families | 34,660 (100.0%) | 2.97 |
Median Household Size in Tazewell County
The median household size in Tazewell County is 2.40 persons per household, with single female/mother households (4,592 | 8.6%) accounting for the largest median household size of 3.1 persons per household. non-family households (19,016 | 35.4%) represent the smallest median household size with 1.20 persons per household.
| Household Type | # Households | Household Size |
| Married-Couple | 27,966 (52.1%) | 3.05 |
| Single Male/Father | 2,102 (3.9%) | 3.04 |
| Single Female/Mother | 4,592 (8.6%) | 3.10 |
| Non-family | 19,016 (35.4%) | 1.20 |
| Total Households | 53,676 (100.0%) | 2.40 |
Household Size by Marriage Status in Tazewell County
Out of a total of 53,676 households in Tazewell County, 34,660 (64.6%) are family households, while 19,016 (35.4%) are nonfamily households. The most numerous type of family households are 2-person households, comprising 17,176, and the most common type of nonfamily households are 1-person households, comprising 16,134.
| Household Size | Family Households | Nonfamily Households |
| 1-Person Households | - | 16,134 (30.1%) |
| 2-Person Households | 17,176 (32.0%) | 2,410 (4.5%) |
| 3-Person Households | 7,192 (13.4%) | 282 (0.5%) |
| 4-Person Households | 6,236 (11.6%) | 104 (0.2%) |
| 5-Person Households | 2,580 (4.8%) | 80 (0.2%) |
| 6-Person Households | 1,146 (2.1%) | 6 (0.0%) |
| 7+ Person Households | 330 (0.6%) | 0 (0.0%) |
| Total | 34,660 (64.6%) | 19,016 (35.4%) |
Female Fertility in Tazewell County
Fertility by Age in Tazewell County
Average fertility rate in Tazewell County is 44.0 births per 1,000 women. Women in the age bracket of 20 to 34 years have the highest fertility rate with 91.0 births per 1,000 women. Women in the age bracket of 20 to 34 years acount for 78.8% of all women with births.
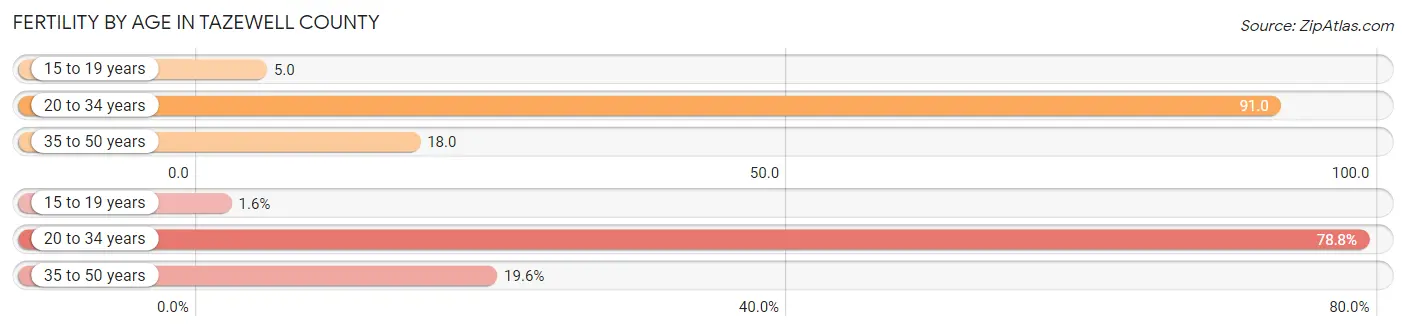
| Age Bracket | Women with Births | Births / 1,000 Women |
| 15 to 19 years | 20 (1.6%) | 5.0 |
| 20 to 34 years | 984 (78.8%) | 91.0 |
| 35 to 50 years | 245 (19.6%) | 18.0 |
| Total | 1,249 (100.0%) | 44.0 |
Fertility by Age by Marriage Status in Tazewell County
62.8% of women with births (1,249) in Tazewell County are married. The highest percentage of unmarried women with births falls into 15 to 19 years age bracket with 100.0% of them unmarried at the time of birth, while the lowest percentage of unmarried women with births belong to 35 to 50 years age bracket with 22.5% of them unmarried.
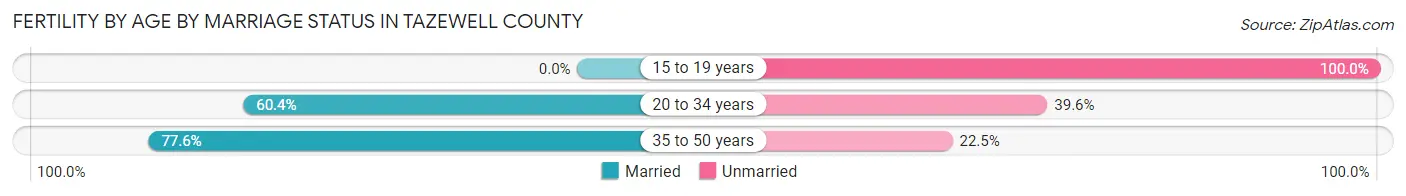
| Age Bracket | Married | Unmarried |
| 15 to 19 years | 0 (0.0%) | 20 (100.0%) |
| 20 to 34 years | 594 (60.4%) | 390 (39.6%) |
| 35 to 50 years | 190 (77.5%) | 55 (22.5%) |
| Total | 784 (62.8%) | 465 (37.2%) |
Fertility by Education in Tazewell County
Average fertility rate in Tazewell County is 44.0 births per 1,000 women. Women with the education attainment of high school diploma have the highest fertility rate of 59.0 births per 1,000 women, while women with the education attainment of less than high school have the lowest fertility at 27.0 births per 1,000 women. Women with the education attainment of college or associate's degree represent 30.2% of all women with births.
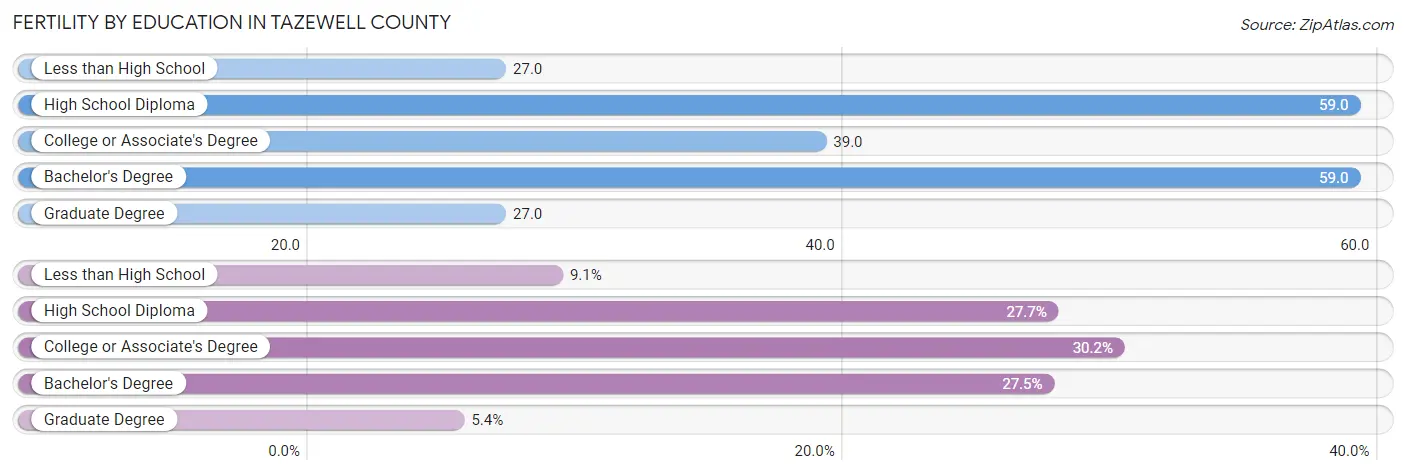
| Educational Attainment | Women with Births | Births / 1,000 Women |
| Less than High School | 114 (9.1%) | 27.0 |
| High School Diploma | 346 (27.7%) | 59.0 |
| College or Associate's Degree | 377 (30.2%) | 39.0 |
| Bachelor's Degree | 344 (27.5%) | 59.0 |
| Graduate Degree | 68 (5.4%) | 27.0 |
| Total | 1,249 (100.0%) | 44.0 |
Fertility by Education by Marriage Status in Tazewell County
37.2% of women with births in Tazewell County are unmarried. Women with the educational attainment of graduate degree are most likely to be married with 100.0% of them married at childbirth, while women with the educational attainment of less than high school are least likely to be married with 74.6% of them unmarried at childbirth.
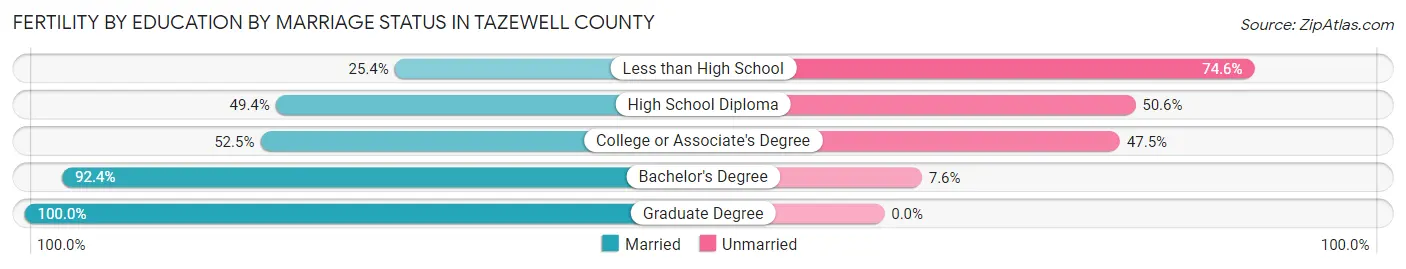
| Educational Attainment | Married | Unmarried |
| Less than High School | 29 (25.4%) | 85 (74.6%) |
| High School Diploma | 171 (49.4%) | 175 (50.6%) |
| College or Associate's Degree | 198 (52.5%) | 179 (47.5%) |
| Bachelor's Degree | 318 (92.4%) | 26 (7.6%) |
| Graduate Degree | 68 (100.0%) | 0 (0.0%) |
| Total | 784 (62.8%) | 465 (37.2%) |
Income in Tazewell County
Income Overview in Tazewell County
Per Capita Income in Tazewell County is $38,573, while median incomes of families and households are $94,169 and $74,606 respectively.
| Characteristic | Number | Measure |
| Per Capita Income | 131,276 | $38,573 |
| Median Family Income | 34,660 | $94,169 |
| Mean Family Income | 34,660 | $110,928 |
| Median Household Income | 53,676 | $74,606 |
| Mean Household Income | 53,676 | $92,162 |
| Income Deficit | 34,660 | $11,455 |
| Wage / Income Gap (%) | 131,276 | 36.58% |
| Wage / Income Gap ($) | 131,276 | 63.42¢ per $1 |
| Gini / Inequality Index | 131,276 | 0.42 |
Earnings by Sex in Tazewell County
Average Earnings in Tazewell County are $43,576, $53,213 for men and $33,749 for women, a difference of 36.6%.
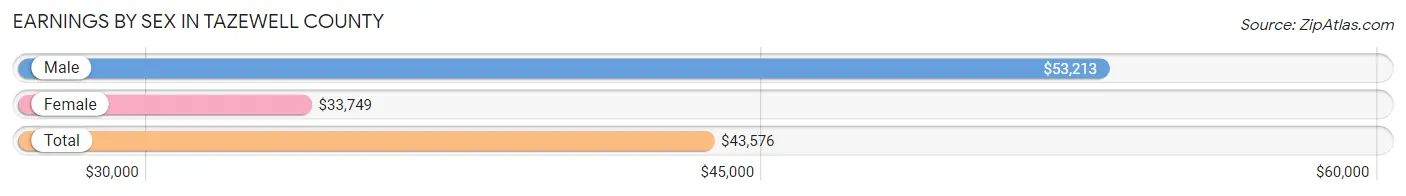
| Sex | Number | Average Earnings |
| Male | 35,610 (52.6%) | $53,213 |
| Female | 32,104 (47.4%) | $33,749 |
| Total | 67,714 (100.0%) | $43,576 |
Earnings by Sex by Income Bracket in Tazewell County
The most common earnings brackets in Tazewell County are $100,000+ for men (6,345 | 17.8%) and $75,000 to $99,999 for women (2,546 | 7.9%).

| Income | Male | Female |
| $2,499 or less | 1,406 (4.0%) | 2,268 (7.1%) |
| $2,500 to $4,999 | 986 (2.8%) | 1,070 (3.3%) |
| $5,000 to $7,499 | 778 (2.2%) | 1,064 (3.3%) |
| $7,500 to $9,999 | 497 (1.4%) | 836 (2.6%) |
| $10,000 to $12,499 | 857 (2.4%) | 1,253 (3.9%) |
| $12,500 to $14,999 | 614 (1.7%) | 1,286 (4.0%) |
| $15,000 to $17,499 | 650 (1.8%) | 1,165 (3.6%) |
| $17,500 to $19,999 | 541 (1.5%) | 945 (2.9%) |
| $20,000 to $22,499 | 689 (1.9%) | 1,119 (3.5%) |
| $22,500 to $24,999 | 897 (2.5%) | 1,480 (4.6%) |
| $25,000 to $29,999 | 1,742 (4.9%) | 1,995 (6.2%) |
| $30,000 to $34,999 | 1,550 (4.3%) | 2,306 (7.2%) |
| $35,000 to $39,999 | 1,422 (4.0%) | 1,866 (5.8%) |
| $40,000 to $44,999 | 1,543 (4.3%) | 1,808 (5.6%) |
| $45,000 to $49,999 | 2,394 (6.7%) | 1,927 (6.0%) |
| $50,000 to $54,999 | 1,695 (4.8%) | 1,539 (4.8%) |
| $55,000 to $64,999 | 3,476 (9.8%) | 2,491 (7.8%) |
| $65,000 to $74,999 | 2,600 (7.3%) | 1,409 (4.4%) |
| $75,000 to $99,999 | 4,928 (13.8%) | 2,546 (7.9%) |
| $100,000+ | 6,345 (17.8%) | 1,731 (5.4%) |
| Total | 35,610 (100.0%) | 32,104 (100.0%) |
Earnings by Sex by Educational Attainment in Tazewell County
Average earnings in Tazewell County are $58,688 for men and $38,211 for women, a difference of 34.9%. Men with an educational attainment of graduate degree enjoy the highest average annual earnings of $96,131, while those with less than high school education earn the least with $37,698. Women with an educational attainment of graduate degree earn the most with the average annual earnings of $60,508, while those with less than high school education have the smallest earnings of $19,443.
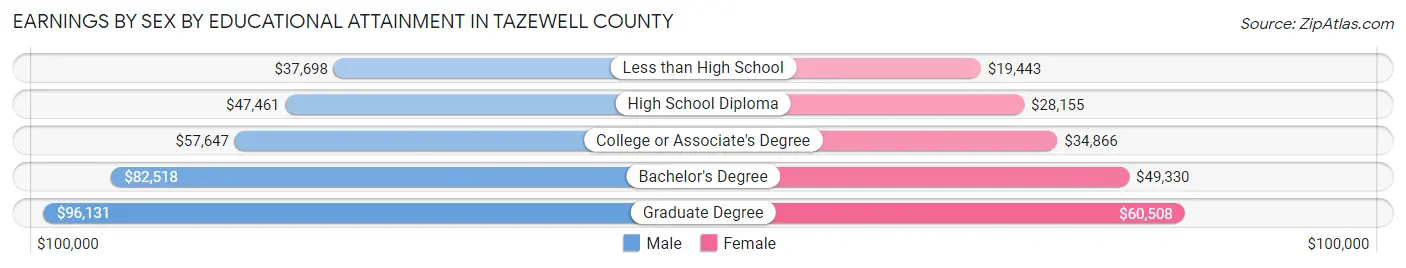
| Educational Attainment | Male Income | Female Income |
| Less than High School | $37,698 | $19,443 |
| High School Diploma | $47,461 | $28,155 |
| College or Associate's Degree | $57,647 | $34,866 |
| Bachelor's Degree | $82,518 | $49,330 |
| Graduate Degree | $96,131 | $60,508 |
| Total | $58,688 | $38,211 |
Family Income in Tazewell County
Family Income Brackets in Tazewell County
According to the Tazewell County family income data, there are 8,249 families falling into the $100,000 to $149,999 income range, which is the most common income bracket and makes up 23.8% of all families. Conversely, the $10,000 to $14,999 income bracket is the least frequent group with only 520 families (1.5%) belonging to this category.
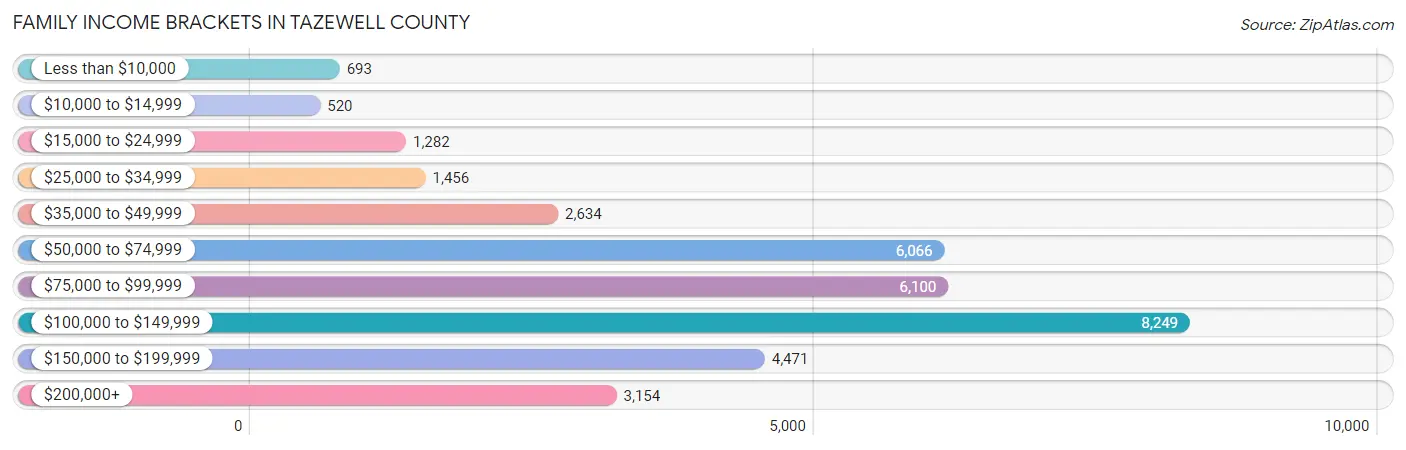
| Income Bracket | # Families | % Families |
| Less than $10,000 | 693 | 2.0% |
| $10,000 to $14,999 | 520 | 1.5% |
| $15,000 to $24,999 | 1,282 | 3.7% |
| $25,000 to $34,999 | 1,456 | 4.2% |
| $35,000 to $49,999 | 2,634 | 7.6% |
| $50,000 to $74,999 | 6,066 | 17.5% |
| $75,000 to $99,999 | 6,100 | 17.6% |
| $100,000 to $149,999 | 8,249 | 23.8% |
| $150,000 to $199,999 | 4,471 | 12.9% |
| $200,000+ | 3,154 | 9.1% |
Family Income by Famaliy Size in Tazewell County
5-person families (2,387 | 6.9%) account for the highest median family income in Tazewell County with $108,925 per family, while 2-person families (18,017 | 52.0%) have the highest median income of $42,714 per family member.
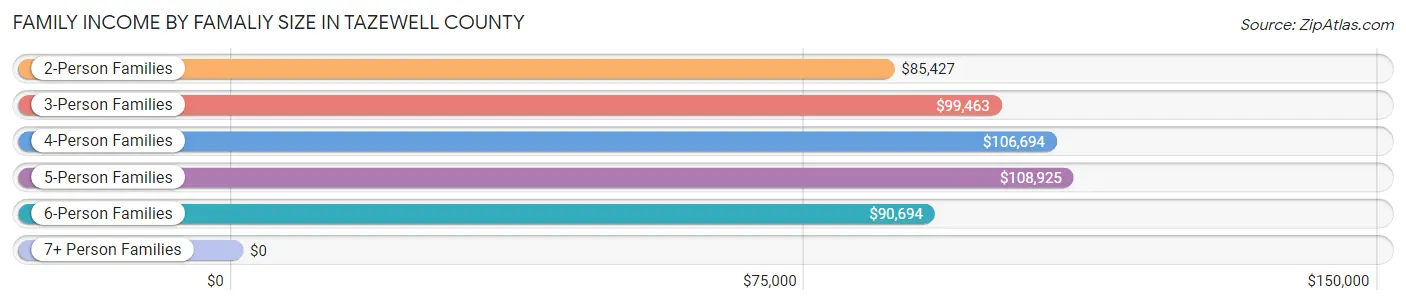
| Income Bracket | # Families | Median Income |
| 2-Person Families | 18,017 (52.0%) | $85,427 |
| 3-Person Families | 7,261 (20.9%) | $99,463 |
| 4-Person Families | 5,656 (16.3%) | $106,694 |
| 5-Person Families | 2,387 (6.9%) | $108,925 |
| 6-Person Families | 1,153 (3.3%) | $90,694 |
| 7+ Person Families | 186 (0.5%) | $0 |
| Total | 34,660 (100.0%) | $94,169 |
Family Income by Number of Earners in Tazewell County
The median family income in Tazewell County is $94,169, with families comprising 3+ earners (3,501) having the highest median family income of $143,361, while families with no earners (6,373) have the lowest median family income of $62,242, accounting for 10.1% and 18.4% of families, respectively.
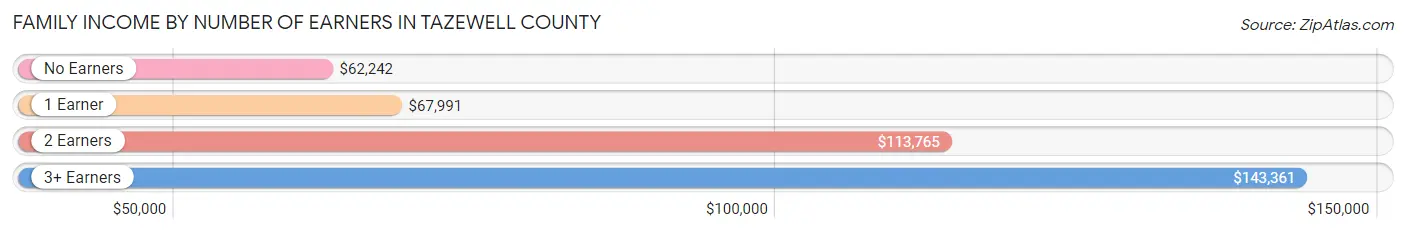
| Number of Earners | # Families | Median Income |
| No Earners | 6,373 (18.4%) | $62,242 |
| 1 Earner | 10,160 (29.3%) | $67,991 |
| 2 Earners | 14,626 (42.2%) | $113,765 |
| 3+ Earners | 3,501 (10.1%) | $143,361 |
| Total | 34,660 (100.0%) | $94,169 |
Household Income in Tazewell County
Household Income Brackets in Tazewell County
With 10,091 households falling in the category, the $100,000 to $149,999 income range is the most frequent in Tazewell County, accounting for 18.8% of all households. In contrast, only 1,610 households (3.0%) fall into the $10,000 to $14,999 income bracket, making it the least populous group.
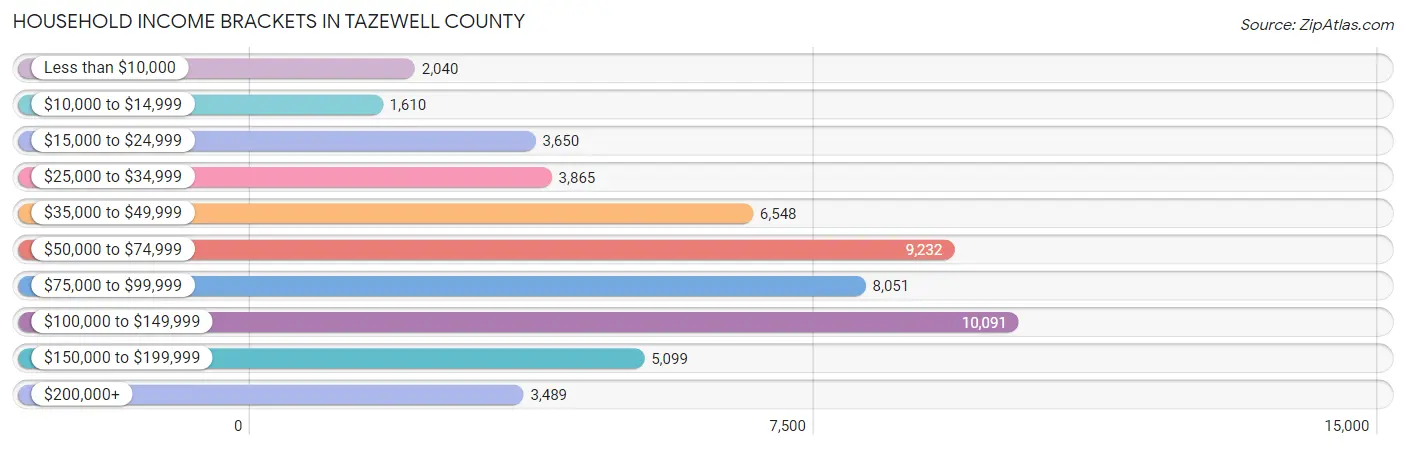
| Income Bracket | # Households | % Households |
| Less than $10,000 | 2,040 | 3.8% |
| $10,000 to $14,999 | 1,610 | 3.0% |
| $15,000 to $24,999 | 3,650 | 6.8% |
| $25,000 to $34,999 | 3,865 | 7.2% |
| $35,000 to $49,999 | 6,548 | 12.2% |
| $50,000 to $74,999 | 9,232 | 17.2% |
| $75,000 to $99,999 | 8,051 | 15.0% |
| $100,000 to $149,999 | 10,091 | 18.8% |
| $150,000 to $199,999 | 5,099 | 9.5% |
| $200,000+ | 3,489 | 6.5% |
Household Income by Householder Age in Tazewell County
The median household income in Tazewell County is $74,606, with the highest median household income of $87,300 found in the 45 to 64 years age bracket for the primary householder. A total of 19,516 households (36.4%) fall into this category. Meanwhile, the 15 to 24 years age bracket for the primary householder has the lowest median household income of $50,640, with 1,862 households (3.5%) in this group.
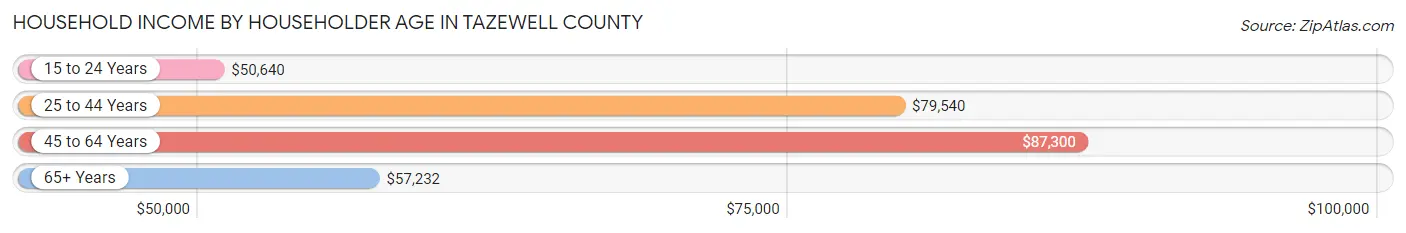
| Income Bracket | # Households | Median Income |
| 15 to 24 Years | 1,862 (3.5%) | $50,640 |
| 25 to 44 Years | 16,592 (30.9%) | $79,540 |
| 45 to 64 Years | 19,516 (36.4%) | $87,300 |
| 65+ Years | 15,706 (29.3%) | $57,232 |
| Total | 53,676 (100.0%) | $74,606 |
Poverty in Tazewell County
Income Below Poverty by Sex and Age in Tazewell County
With 8.0% poverty level for males and 9.5% for females among the residents of Tazewell County, 5 year old males and under 5 year old females are the most vulnerable to poverty, with 135 males (18.0%) and 532 females (15.9%) in their respective age groups living below the poverty level.
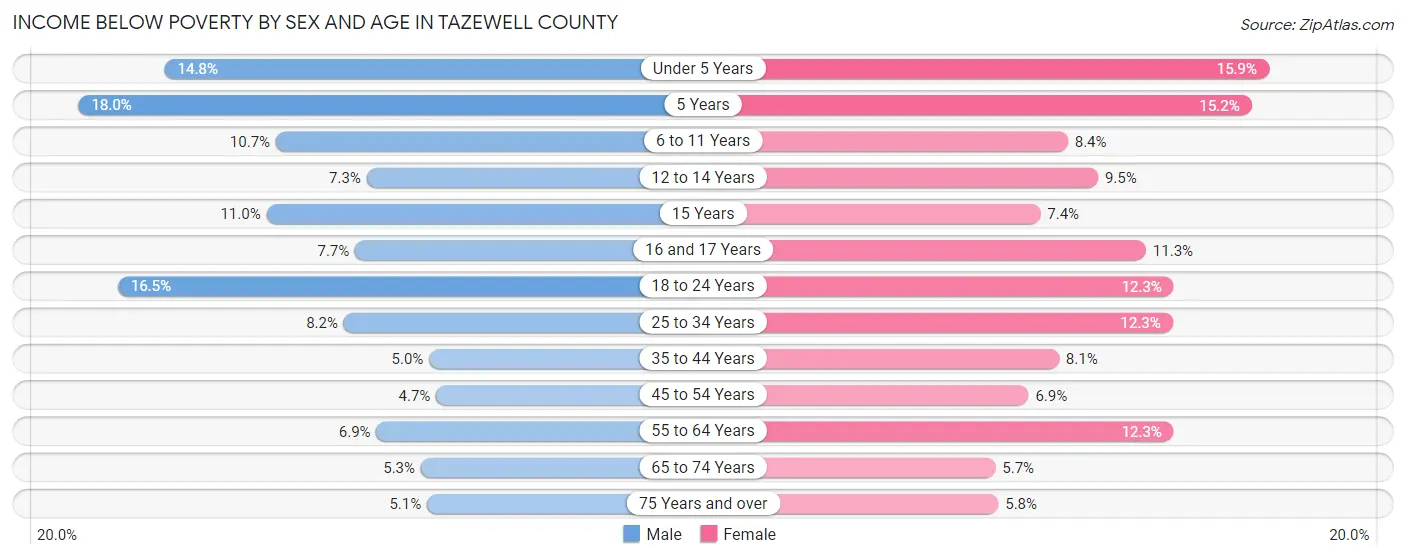
| Age Bracket | Male | Female |
| Under 5 Years | 516 (14.8%) | 532 (15.9%) |
| 5 Years | 135 (18.0%) | 108 (15.2%) |
| 6 to 11 Years | 534 (10.7%) | 421 (8.4%) |
| 12 to 14 Years | 196 (7.3%) | 242 (9.5%) |
| 15 Years | 95 (11.0%) | 72 (7.4%) |
| 16 and 17 Years | 145 (7.7%) | 181 (11.3%) |
| 18 to 24 Years | 829 (16.5%) | 565 (12.3%) |
| 25 to 34 Years | 613 (8.2%) | 932 (12.3%) |
| 35 to 44 Years | 427 (5.0%) | 669 (8.1%) |
| 45 to 54 Years | 378 (4.7%) | 555 (6.9%) |
| 55 to 64 Years | 594 (6.9%) | 1,105 (12.3%) |
| 65 to 74 Years | 355 (5.3%) | 428 (5.7%) |
| 75 Years and over | 216 (5.1%) | 352 (5.8%) |
| Total | 5,033 (8.0%) | 6,162 (9.5%) |
Income Above Poverty by Sex and Age in Tazewell County
According to the poverty statistics in Tazewell County, males aged 45 to 54 years and females aged 65 to 74 years are the age groups that are most secure financially, with 95.3% of males and 94.3% of females in these age groups living above the poverty line.
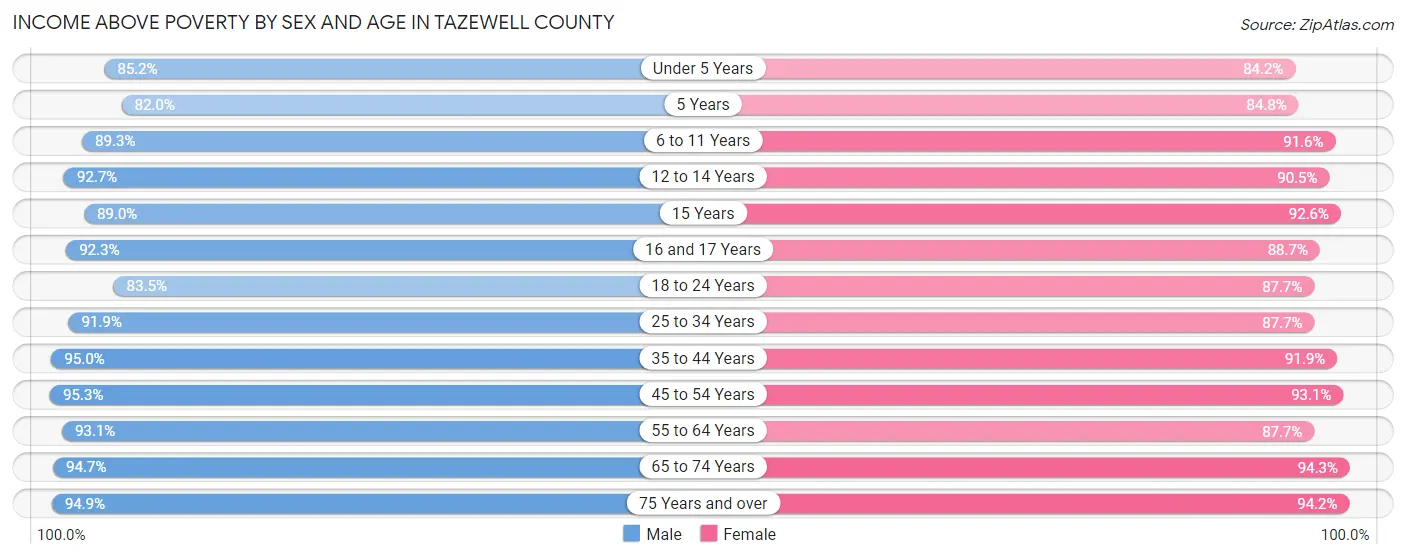
| Age Bracket | Male | Female |
| Under 5 Years | 2,971 (85.2%) | 2,824 (84.2%) |
| 5 Years | 615 (82.0%) | 602 (84.8%) |
| 6 to 11 Years | 4,469 (89.3%) | 4,597 (91.6%) |
| 12 to 14 Years | 2,490 (92.7%) | 2,304 (90.5%) |
| 15 Years | 767 (89.0%) | 905 (92.6%) |
| 16 and 17 Years | 1,730 (92.3%) | 1,422 (88.7%) |
| 18 to 24 Years | 4,184 (83.5%) | 4,021 (87.7%) |
| 25 to 34 Years | 6,911 (91.8%) | 6,655 (87.7%) |
| 35 to 44 Years | 8,145 (95.0%) | 7,636 (91.9%) |
| 45 to 54 Years | 7,634 (95.3%) | 7,454 (93.1%) |
| 55 to 64 Years | 7,967 (93.1%) | 7,861 (87.7%) |
| 65 to 74 Years | 6,358 (94.7%) | 7,078 (94.3%) |
| 75 Years and over | 4,054 (94.9%) | 5,702 (94.2%) |
| Total | 58,295 (92.0%) | 59,061 (90.5%) |
Income Below Poverty Among Married-Couple Families in Tazewell County
The poverty statistics for married-couple families in Tazewell County show that 2.1% or 577 of the total 27,966 families live below the poverty line. Families with 3 or 4 children have the highest poverty rate of 2.6%, comprising of 64 families. On the other hand, families with 5 or more children have the lowest poverty rate of 0.0%, which includes 0 families.
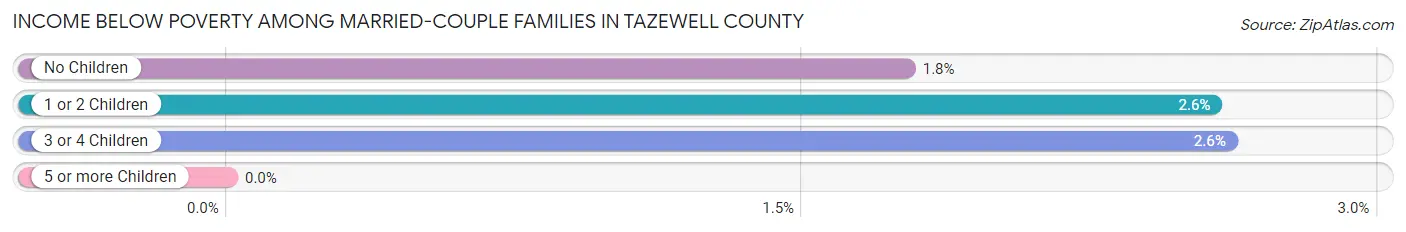
| Children | Above Poverty | Below Poverty |
| No Children | 17,141 (98.2%) | 309 (1.8%) |
| 1 or 2 Children | 7,720 (97.4%) | 204 (2.6%) |
| 3 or 4 Children | 2,392 (97.4%) | 64 (2.6%) |
| 5 or more Children | 136 (100.0%) | 0 (0.0%) |
| Total | 27,389 (97.9%) | 577 (2.1%) |
Income Below Poverty Among Single-Parent Households in Tazewell County
According to the poverty data in Tazewell County, 10.0% or 211 single-father households and 26.5% or 1,216 single-mother households are living below the poverty line. Among single-father households, those with 3 or 4 children have the highest poverty rate, with 43 households (26.7%) experiencing poverty. Likewise, among single-mother households, those with 5 or more children have the highest poverty rate, with 158 households (95.2%) falling below the poverty line.
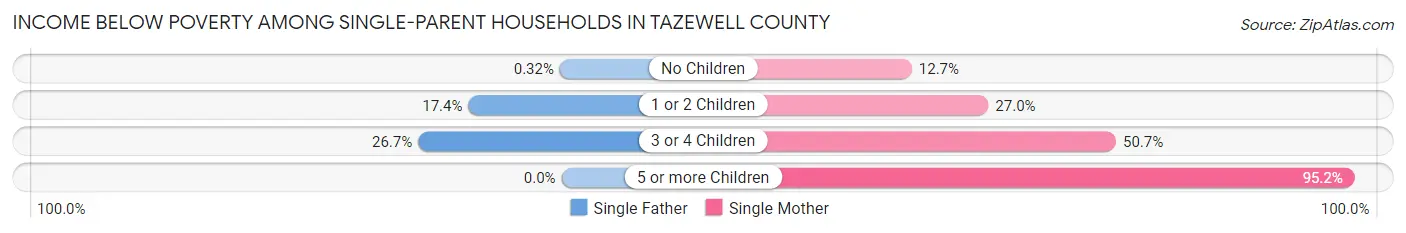
| Children | Single Father | Single Mother |
| No Children | 3 (0.3%) | 206 (12.7%) |
| 1 or 2 Children | 165 (17.3%) | 647 (27.0%) |
| 3 or 4 Children | 43 (26.7%) | 205 (50.7%) |
| 5 or more Children | 0 (0.0%) | 158 (95.2%) |
| Total | 211 (10.0%) | 1,216 (26.5%) |
Income Below Poverty Among Married-Couple vs Single-Parent Households in Tazewell County
The poverty data for Tazewell County shows that 577 of the married-couple family households (2.1%) and 1,427 of the single-parent households (21.3%) are living below the poverty level. Within the married-couple family households, those with 3 or 4 children have the highest poverty rate, with 64 households (2.6%) falling below the poverty line. Among the single-parent households, those with 5 or more children have the highest poverty rate, with 158 household (75.2%) living below poverty.
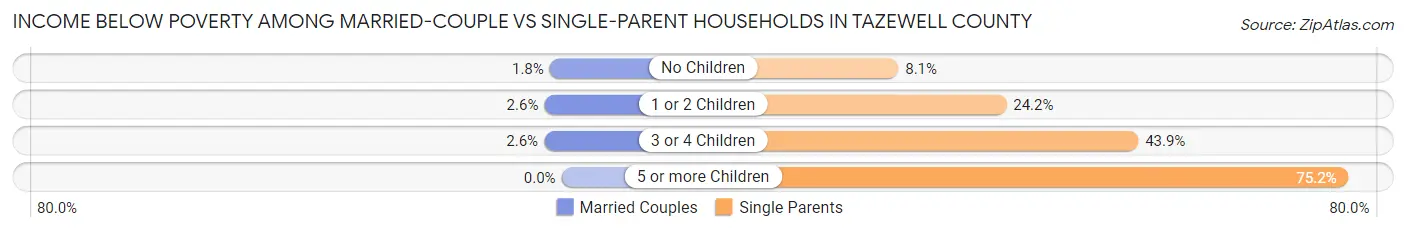
| Children | Married-Couple Families | Single-Parent Households |
| No Children | 309 (1.8%) | 209 (8.1%) |
| 1 or 2 Children | 204 (2.6%) | 812 (24.2%) |
| 3 or 4 Children | 64 (2.6%) | 248 (43.9%) |
| 5 or more Children | 0 (0.0%) | 158 (75.2%) |
| Total | 577 (2.1%) | 1,427 (21.3%) |
Employment Characteristics in Tazewell County
Employment by Class of Employer in Tazewell County
Among the 60,929 employed individuals in Tazewell County, private company employees (42,886 | 70.4%), not-for-profit organizations (6,210 | 10.2%), and local government employees (4,645 | 7.6%) make up the most common classes of employment.
| Employer Class | # Employees | % Employees |
| Private Company Employees | 42,886 | 70.4% |
| Self-Employed (Incorporated) | 1,766 | 2.9% |
| Self-Employed (Not Incorporated) | 2,436 | 4.0% |
| Not-for-profit Organizations | 6,210 | 10.2% |
| Local Government Employees | 4,645 | 7.6% |
| State Government Employees | 1,960 | 3.2% |
| Federal Government Employees | 936 | 1.5% |
| Unpaid Family Workers | 90 | 0.2% |
| Total | 60,929 | 100.0% |
Employment Status by Age in Tazewell County
According to the labor force statistics for Tazewell County, out of the total population over 16 years of age (105,452), 61.6% or 64,958 individuals are in the labor force, with 3.9% or 2,533 of them unemployed. The age group with the highest labor force participation rate is 25 to 29 years, with 85.5% or 6,451 individuals in the labor force. Within the labor force, the 16 to 19 years age range has the highest percentage of unemployed individuals, with 12.1% or 398 of them being unemployed.
| Age Bracket | In Labor Force | Unemployed |
| 16 to 19 Years | 3,288 (51.7%) | 398 (12.1%) |
| 20 to 24 Years | 5,674 (82.7%) | 516 (9.1%) |
| 25 to 29 Years | 6,451 (85.5%) | 297 (4.6%) |
| 30 to 34 Years | 6,533 (82.6%) | 203 (3.1%) |
| 35 to 44 Years | 14,735 (84.8%) | 472 (3.2%) |
| 45 to 54 Years | 13,785 (84.6%) | 289 (2.1%) |
| 55 to 59 Years | 5,991 (71.6%) | 174 (2.9%) |
| 60 to 64 Years | 5,138 (55.0%) | 113 (2.2%) |
| 65 to 74 Years | 2,712 (18.8%) | 57 (2.1%) |
| 75 Years and over | 615 (5.6%) | 29 (4.7%) |
| Total | 64,958 (61.6%) | 2,533 (3.9%) |
Employment Status by Educational Attainment in Tazewell County
According to labor force statistics for Tazewell County, 78.7% of individuals (52,598) out of the total population between 25 and 64 years of age (66,833) are in the labor force, with 2.9% or 1,525 of them being unemployed. The group with the highest labor force participation rate are those with the educational attainment of bachelor's degree or higher, with 87.2% or 17,253 individuals in the labor force. Within the labor force, individuals with less than high school education have the highest percentage of unemployment, with 10.3% or 193 of them being unemployed.
| Educational Attainment | In Labor Force | Unemployed |
| Less than High School | 1,869 (53.9%) | 357 (10.3%) |
| High School Diploma | 13,607 (72.1%) | 774 (4.1%) |
| College / Associate Degree | 19,891 (80.5%) | 840 (3.4%) |
| Bachelor's Degree or higher | 17,253 (87.2%) | 138 (0.7%) |
| Total | 52,598 (78.7%) | 1,938 (2.9%) |
Employment Occupations by Sex in Tazewell County
Management, Business, Science and Arts Occupations
The most common Management, Business, Science and Arts occupations in Tazewell County are Community & Social Service (6,507 | 10.5%), Management (5,293 | 8.5%), Health Diagnosing & Treating (4,767 | 7.7%), Computers, Engineering & Science (4,436 | 7.1%), and Education Instruction & Library (3,609 | 5.8%).
Management, Business, Science and Arts Occupations by Sex
Within the Management, Business, Science and Arts occupations in Tazewell County, the most male-oriented occupations are Architecture & Engineering (94.3%), Computers, Engineering & Science (84.0%), and Computers & Mathematics (83.2%), while the most female-oriented occupations are Education Instruction & Library (84.0%), Health Diagnosing & Treating (83.5%), and Health Technologists (82.1%).
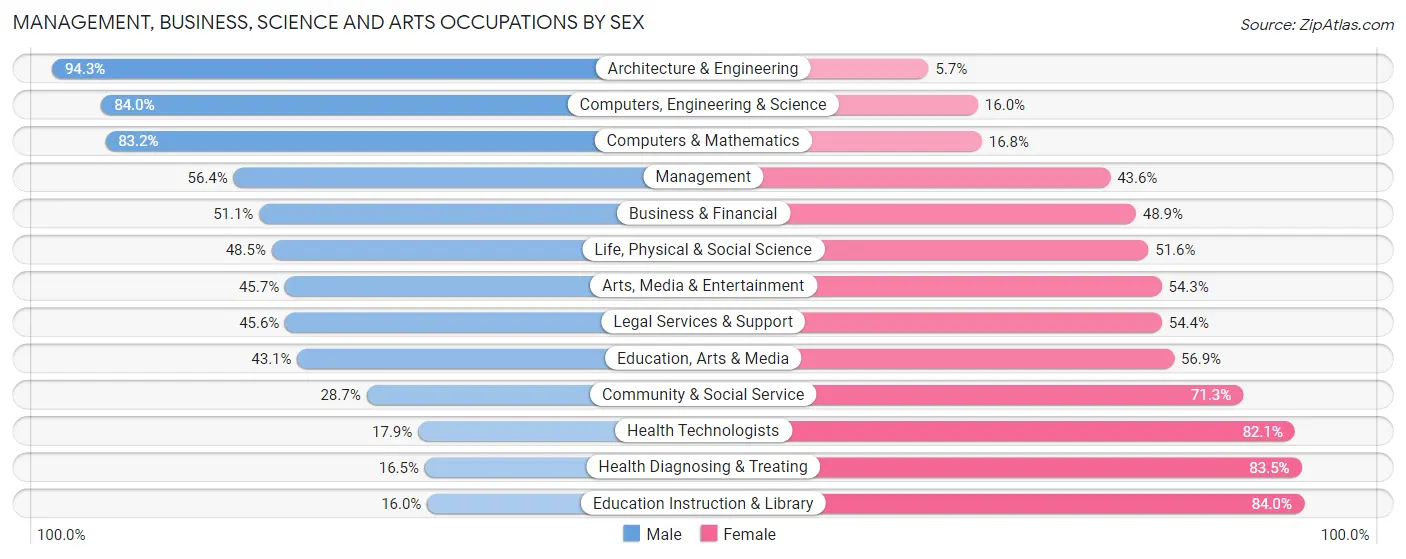
| Occupation | Male | Female |
| Management | 2,985 (56.4%) | 2,308 (43.6%) |
| Business & Financial | 1,634 (51.1%) | 1,566 (48.9%) |
| Computers, Engineering & Science | 3,726 (84.0%) | 710 (16.0%) |
| Computers & Mathematics | 1,756 (83.2%) | 355 (16.8%) |
| Architecture & Engineering | 1,735 (94.3%) | 105 (5.7%) |
| Life, Physical & Social Science | 235 (48.4%) | 250 (51.5%) |
| Community & Social Service | 1,866 (28.7%) | 4,641 (71.3%) |
| Education, Arts & Media | 597 (43.1%) | 788 (56.9%) |
| Legal Services & Support | 204 (45.6%) | 243 (54.4%) |
| Education Instruction & Library | 578 (16.0%) | 3,031 (84.0%) |
| Arts, Media & Entertainment | 487 (45.7%) | 579 (54.3%) |
| Health Diagnosing & Treating | 787 (16.5%) | 3,980 (83.5%) |
| Health Technologists | 576 (17.9%) | 2,640 (82.1%) |
| Total (Category) | 10,998 (45.4%) | 13,205 (54.6%) |
| Total (Overall) | 32,712 (52.6%) | 29,451 (47.4%) |
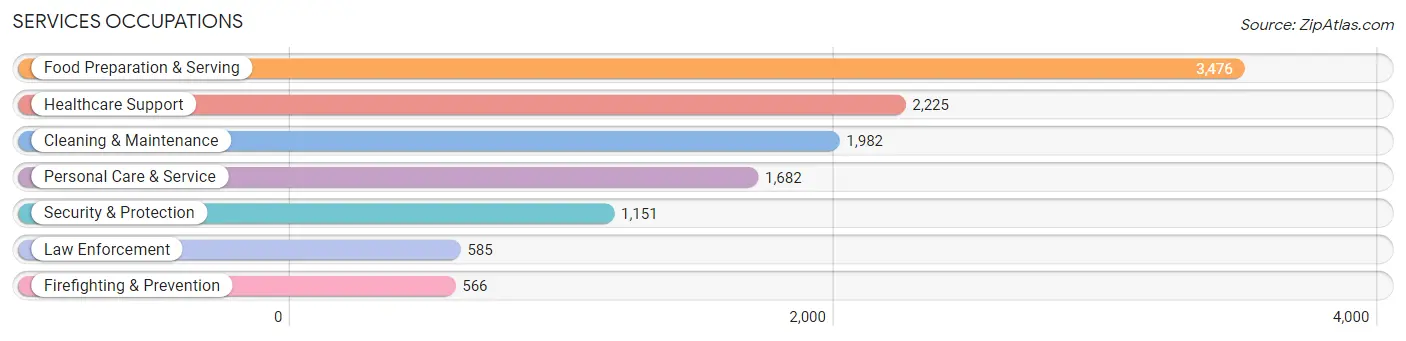
Services Occupations
The most common Services occupations in Tazewell County are Food Preparation & Serving (3,476 | 5.6%), Healthcare Support (2,225 | 3.6%), Cleaning & Maintenance (1,982 | 3.2%), Personal Care & Service (1,682 | 2.7%), and Security & Protection (1,151 | 1.8%).
Services Occupations by Sex
Within the Services occupations in Tazewell County, the most male-oriented occupations are Law Enforcement (93.2%), Security & Protection (87.4%), and Firefighting & Prevention (81.5%), while the most female-oriented occupations are Healthcare Support (92.5%), Personal Care & Service (87.3%), and Food Preparation & Serving (53.2%).
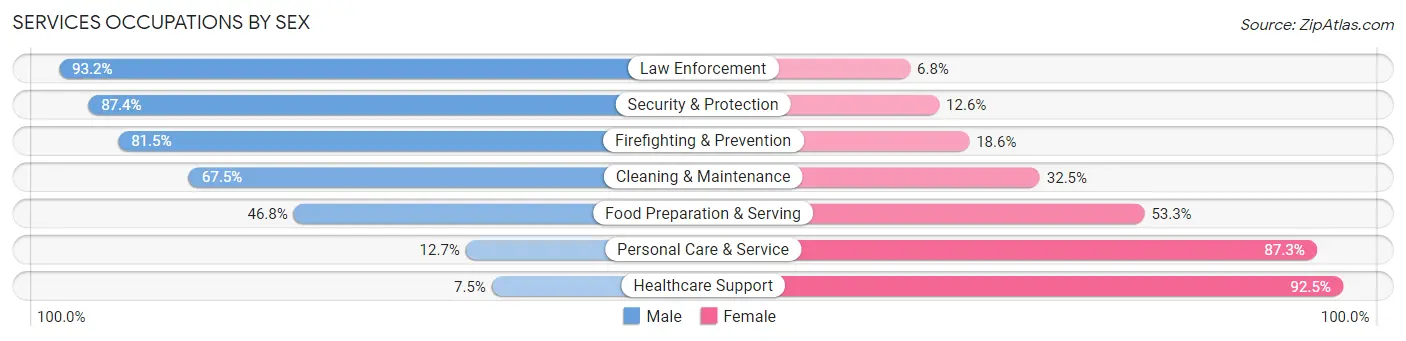
| Occupation | Male | Female |
| Healthcare Support | 167 (7.5%) | 2,058 (92.5%) |
| Security & Protection | 1,006 (87.4%) | 145 (12.6%) |
| Firefighting & Prevention | 461 (81.5%) | 105 (18.5%) |
| Law Enforcement | 545 (93.2%) | 40 (6.8%) |
| Food Preparation & Serving | 1,625 (46.8%) | 1,851 (53.2%) |
| Cleaning & Maintenance | 1,337 (67.5%) | 645 (32.5%) |
| Personal Care & Service | 213 (12.7%) | 1,469 (87.3%) |
| Total (Category) | 4,348 (41.3%) | 6,168 (58.7%) |
| Total (Overall) | 32,712 (52.6%) | 29,451 (47.4%) |
Sales and Office Occupations
The most common Sales and Office occupations in Tazewell County are Office & Administration (7,212 | 11.6%), and Sales & Related (5,813 | 9.3%).

Sales and Office Occupations by Sex
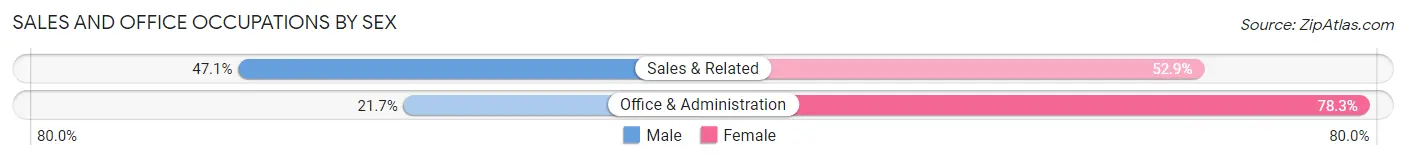
| Occupation | Male | Female |
| Sales & Related | 2,739 (47.1%) | 3,074 (52.9%) |
| Office & Administration | 1,565 (21.7%) | 5,647 (78.3%) |
| Total (Category) | 4,304 (33.0%) | 8,721 (67.0%) |
| Total (Overall) | 32,712 (52.6%) | 29,451 (47.4%) |
Natural Resources, Construction and Maintenance Occupations
The most common Natural Resources, Construction and Maintenance occupations in Tazewell County are Construction & Extraction (2,973 | 4.8%), Installation, Maintenance & Repair (2,455 | 4.0%), and Farming, Fishing & Forestry (126 | 0.2%).
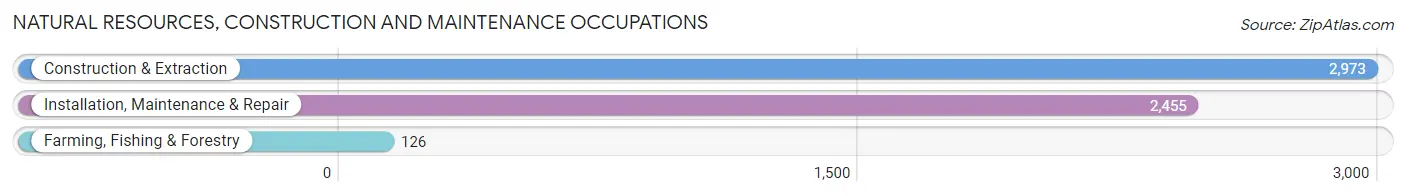
Natural Resources, Construction and Maintenance Occupations by Sex

| Occupation | Male | Female |
| Farming, Fishing & Forestry | 126 (100.0%) | 0 (0.0%) |
| Construction & Extraction | 2,942 (99.0%) | 31 (1.0%) |
| Installation, Maintenance & Repair | 2,406 (98.0%) | 49 (2.0%) |
| Total (Category) | 5,474 (98.6%) | 80 (1.4%) |
| Total (Overall) | 32,712 (52.6%) | 29,451 (47.4%) |
Production, Transportation and Moving Occupations
The most common Production, Transportation and Moving occupations in Tazewell County are Production (3,778 | 6.1%), Material Moving (2,561 | 4.1%), and Transportation (2,526 | 4.1%).
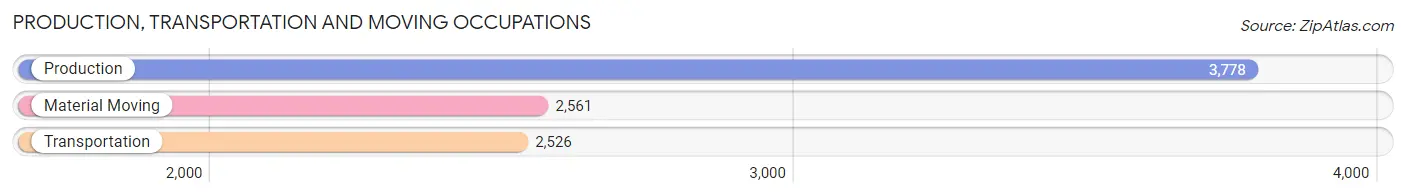
Production, Transportation and Moving Occupations by Sex
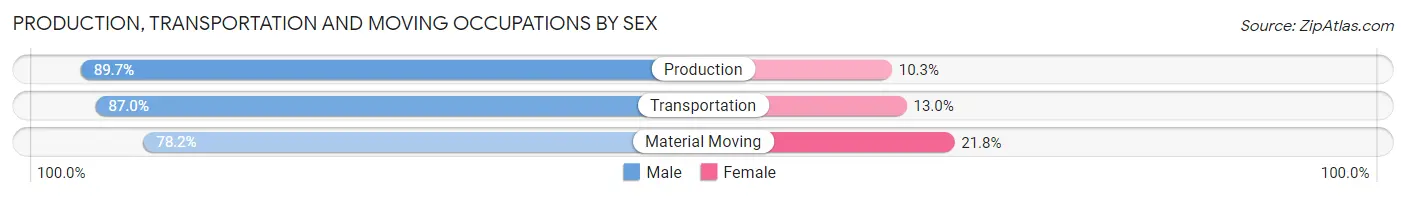
| Occupation | Male | Female |
| Production | 3,388 (89.7%) | 390 (10.3%) |
| Transportation | 2,197 (87.0%) | 329 (13.0%) |
| Material Moving | 2,003 (78.2%) | 558 (21.8%) |
| Total (Category) | 7,588 (85.6%) | 1,277 (14.4%) |
| Total (Overall) | 32,712 (52.6%) | 29,451 (47.4%) |
Employment Industries by Sex in Tazewell County
Employment Industries in Tazewell County
The major employment industries in Tazewell County include Health Care & Social Assistance (10,125 | 16.3%), Manufacturing (9,091 | 14.6%), Retail Trade (6,902 | 11.1%), Educational Services (5,065 | 8.2%), and Accommodation & Food Services (4,207 | 6.8%).
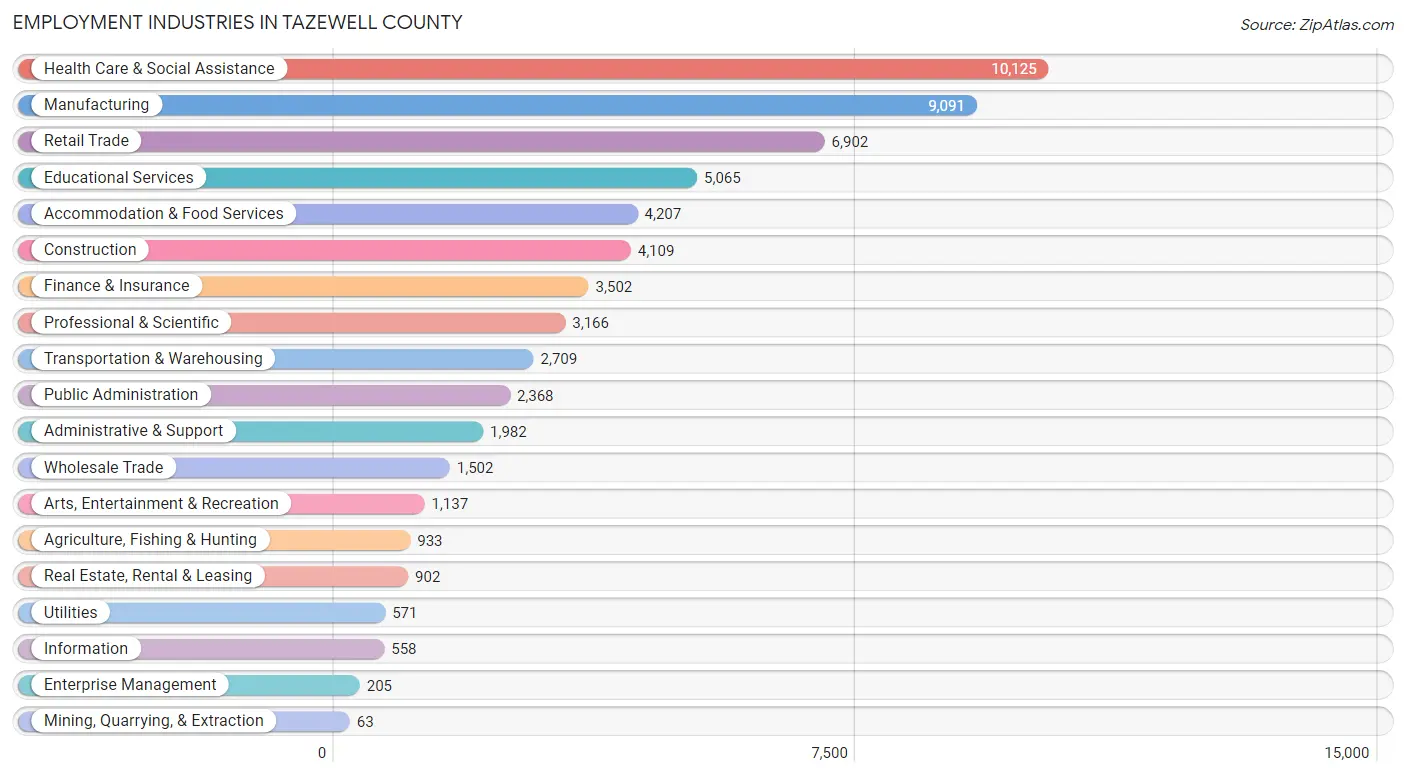
Employment Industries by Sex in Tazewell County
The Tazewell County industries that see more men than women are Mining, Quarrying, & Extraction (100.0%), Utilities (87.6%), and Construction (87.2%), whereas the industries that tend to have a higher number of women are Health Care & Social Assistance (86.1%), Enterprise Management (72.2%), and Educational Services (72.1%).
| Industry | Male | Female |
| Agriculture, Fishing & Hunting | 731 (78.3%) | 202 (21.6%) |
| Mining, Quarrying, & Extraction | 63 (100.0%) | 0 (0.0%) |
| Construction | 3,581 (87.2%) | 528 (12.9%) |
| Manufacturing | 7,721 (84.9%) | 1,370 (15.1%) |
| Wholesale Trade | 1,242 (82.7%) | 260 (17.3%) |
| Retail Trade | 3,476 (50.4%) | 3,426 (49.6%) |
| Transportation & Warehousing | 2,201 (81.2%) | 508 (18.8%) |
| Utilities | 500 (87.6%) | 71 (12.4%) |
| Information | 345 (61.8%) | 213 (38.2%) |
| Finance & Insurance | 1,228 (35.1%) | 2,274 (64.9%) |
| Real Estate, Rental & Leasing | 353 (39.1%) | 549 (60.9%) |
| Professional & Scientific | 1,784 (56.4%) | 1,382 (43.6%) |
| Enterprise Management | 57 (27.8%) | 148 (72.2%) |
| Administrative & Support | 1,165 (58.8%) | 817 (41.2%) |
| Educational Services | 1,415 (27.9%) | 3,650 (72.1%) |
| Health Care & Social Assistance | 1,405 (13.9%) | 8,720 (86.1%) |
| Arts, Entertainment & Recreation | 770 (67.7%) | 367 (32.3%) |
| Accommodation & Food Services | 1,947 (46.3%) | 2,260 (53.7%) |
| Public Administration | 1,325 (55.9%) | 1,043 (44.1%) |
| Total | 32,712 (52.6%) | 29,451 (47.4%) |
Education in Tazewell County
School Enrollment in Tazewell County
The most common levels of schooling among the 29,440 students in Tazewell County are high school (6,829 | 23.2%), elementary school (6,762 | 23.0%), and middle school (6,737 | 22.9%).
| School Level | # Students | % Students |
| Nursery / Preschool | 1,967 | 6.7% |
| Kindergarten | 1,517 | 5.1% |
| Elementary School | 6,762 | 23.0% |
| Middle School | 6,737 | 22.9% |
| High School | 6,829 | 23.2% |
| College / Undergraduate | 4,633 | 15.7% |
| Graduate / Professional | 995 | 3.4% |
| Total | 29,440 | 100.0% |
School Enrollment by Age by Funding Source in Tazewell County
Out of a total of 29,440 students who are enrolled in schools in Tazewell County, 4,151 (14.1%) attend a private institution, while the remaining 25,289 (85.9%) are enrolled in public schools. The age group of 3 to 4 year olds has the highest likelihood of being enrolled in private schools, with 465 (30.0% in the age bracket) enrolled. Conversely, the age group of 15 to 17 year olds has the lowest likelihood of being enrolled in a private school, with 4,705 (91.0% in the age bracket) attending a public institution.
| Age Bracket | Public School | Private School |
| 3 to 4 Year Olds | 1,086 (70.0%) | 465 (30.0%) |
| 5 to 9 Year Old | 6,477 (84.0%) | 1,234 (16.0%) |
| 10 to 14 Year Olds | 7,708 (90.3%) | 828 (9.7%) |
| 15 to 17 Year Olds | 4,705 (91.0%) | 463 (9.0%) |
| 18 to 19 Year Olds | 1,748 (90.8%) | 178 (9.2%) |
| 20 to 24 Year Olds | 1,587 (81.6%) | 358 (18.4%) |
| 25 to 34 Year Olds | 966 (77.5%) | 280 (22.5%) |
| 35 Years and over | 1,001 (73.8%) | 356 (26.2%) |
| Total | 25,289 (85.9%) | 4,151 (14.1%) |
Educational Attainment by Field of Study in Tazewell County
Education (4,970 | 18.2%), business (4,813 | 17.6%), science & technology (3,885 | 14.2%), engineering (2,280 | 8.4%), and arts & humanities (1,799 | 6.6%) are the most common fields of study among 27,299 individuals in Tazewell County who have obtained a bachelor's degree or higher.
| Field of Study | # Graduates | % Graduates |
| Computers & Mathematics | 1,032 | 3.8% |
| Bio, Nature & Agricultural | 1,372 | 5.0% |
| Physical & Health Sciences | 721 | 2.6% |
| Psychology | 1,128 | 4.1% |
| Social Sciences | 1,072 | 3.9% |
| Engineering | 2,280 | 8.4% |
| Multidisciplinary Studies | 231 | 0.9% |
| Science & Technology | 3,885 | 14.2% |
| Business | 4,813 | 17.6% |
| Education | 4,970 | 18.2% |
| Literature & Languages | 784 | 2.9% |
| Liberal Arts & History | 1,207 | 4.4% |
| Visual & Performing Arts | 822 | 3.0% |
| Communications | 1,183 | 4.3% |
| Arts & Humanities | 1,799 | 6.6% |
| Total | 27,299 | 100.0% |
Transportation & Commute in Tazewell County
Vehicle Availability by Sex in Tazewell County
The most prevalent vehicle ownership categories in Tazewell County are males with 2 vehicles (14,766, accounting for 46.0%) and females with 2 vehicles (12,212, making up 51.5%).
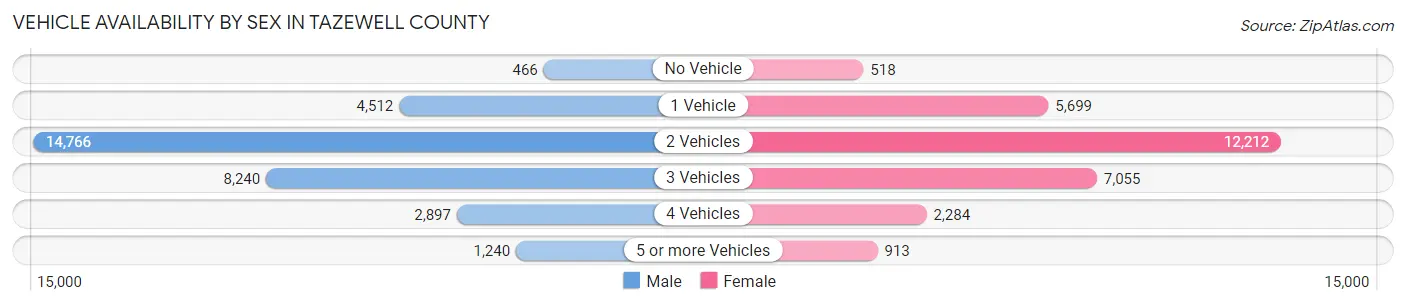
| Vehicles Available | Male | Female |
| No Vehicle | 466 (1.5%) | 518 (1.8%) |
| 1 Vehicle | 4,512 (14.1%) | 5,699 (19.9%) |
| 2 Vehicles | 14,766 (46.0%) | 12,212 (42.6%) |
| 3 Vehicles | 8,240 (25.7%) | 7,055 (24.6%) |
| 4 Vehicles | 2,897 (9.0%) | 2,284 (8.0%) |
| 5 or more Vehicles | 1,240 (3.9%) | 913 (3.2%) |
| Total | 32,121 (100.0%) | 28,681 (100.0%) |
Commute Time in Tazewell County
The most frequently occuring commute durations in Tazewell County are 20 to 24 minutes (9,643 commuters, 17.2%), 15 to 19 minutes (9,365 commuters, 16.8%), and 10 to 14 minutes (8,946 commuters, 16.0%).
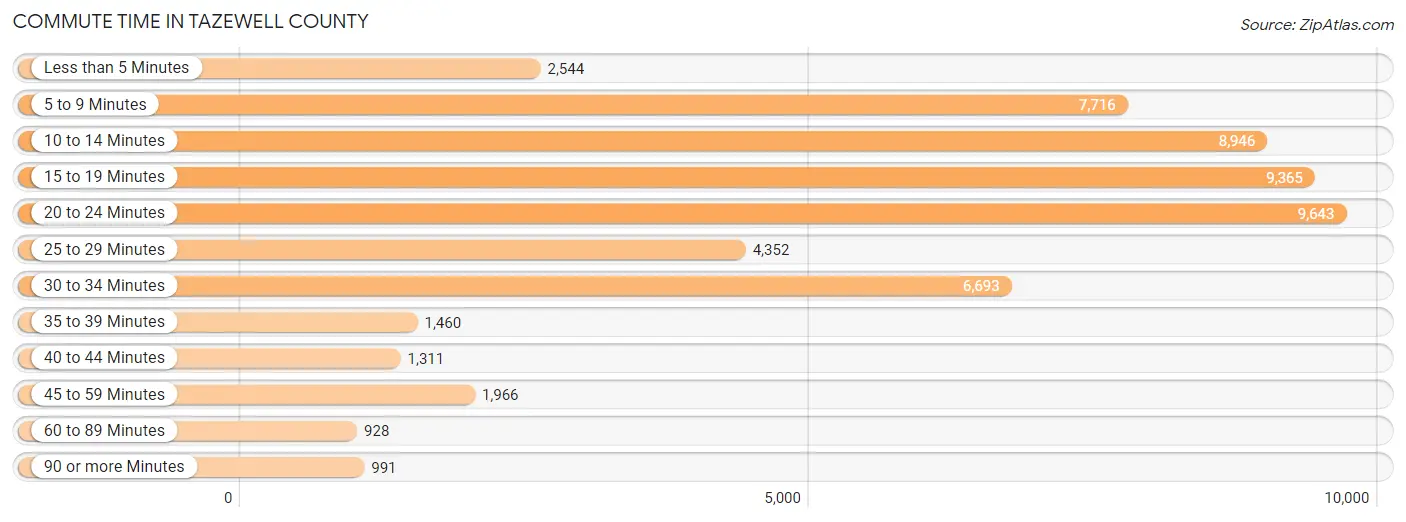
| Commute Time | # Commuters | % Commuters |
| Less than 5 Minutes | 2,544 | 4.5% |
| 5 to 9 Minutes | 7,716 | 13.8% |
| 10 to 14 Minutes | 8,946 | 16.0% |
| 15 to 19 Minutes | 9,365 | 16.8% |
| 20 to 24 Minutes | 9,643 | 17.2% |
| 25 to 29 Minutes | 4,352 | 7.8% |
| 30 to 34 Minutes | 6,693 | 12.0% |
| 35 to 39 Minutes | 1,460 | 2.6% |
| 40 to 44 Minutes | 1,311 | 2.3% |
| 45 to 59 Minutes | 1,966 | 3.5% |
| 60 to 89 Minutes | 928 | 1.7% |
| 90 or more Minutes | 991 | 1.8% |
Commute Time by Sex in Tazewell County
The most common commute times in Tazewell County are 20 to 24 minutes (5,091 commuters, 17.1%) for males and 20 to 24 minutes (4,552 commuters, 17.4%) for females.
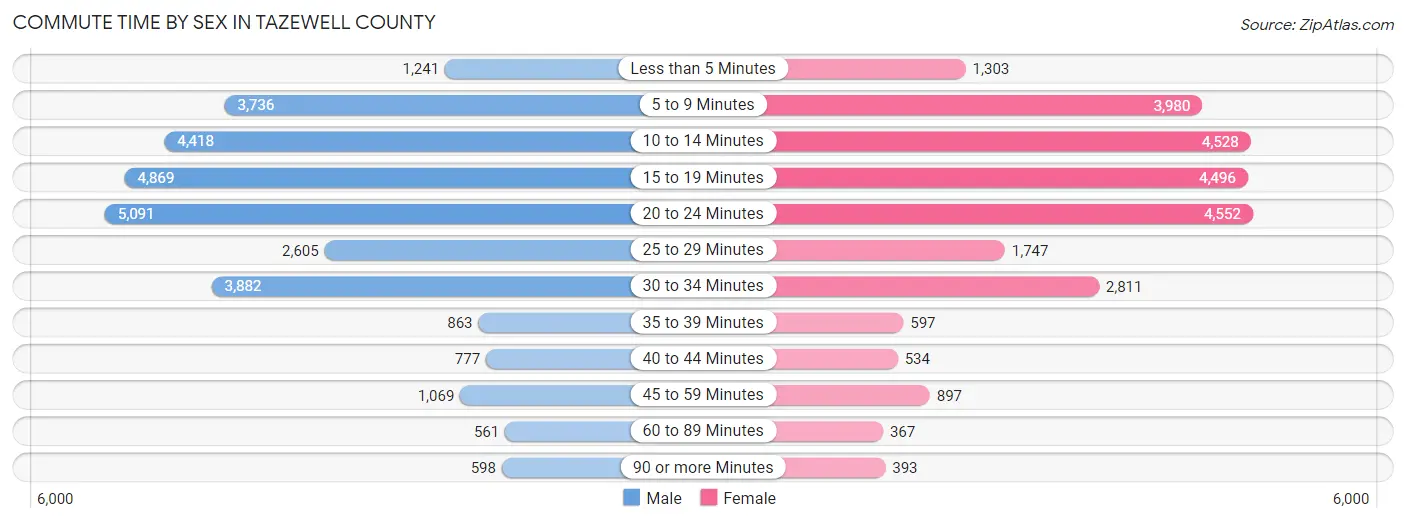
| Commute Time | Male | Female |
| Less than 5 Minutes | 1,241 (4.2%) | 1,303 (5.0%) |
| 5 to 9 Minutes | 3,736 (12.6%) | 3,980 (15.2%) |
| 10 to 14 Minutes | 4,418 (14.9%) | 4,528 (17.3%) |
| 15 to 19 Minutes | 4,869 (16.4%) | 4,496 (17.2%) |
| 20 to 24 Minutes | 5,091 (17.1%) | 4,552 (17.4%) |
| 25 to 29 Minutes | 2,605 (8.8%) | 1,747 (6.7%) |
| 30 to 34 Minutes | 3,882 (13.1%) | 2,811 (10.7%) |
| 35 to 39 Minutes | 863 (2.9%) | 597 (2.3%) |
| 40 to 44 Minutes | 777 (2.6%) | 534 (2.0%) |
| 45 to 59 Minutes | 1,069 (3.6%) | 897 (3.4%) |
| 60 to 89 Minutes | 561 (1.9%) | 367 (1.4%) |
| 90 or more Minutes | 598 (2.0%) | 393 (1.5%) |
Time of Departure to Work by Sex in Tazewell County
The most frequent times of departure to work in Tazewell County are 7:00 AM to 7:29 AM (4,006, 13.5%) for males and 7:30 AM to 7:59 AM (4,810, 18.4%) for females.
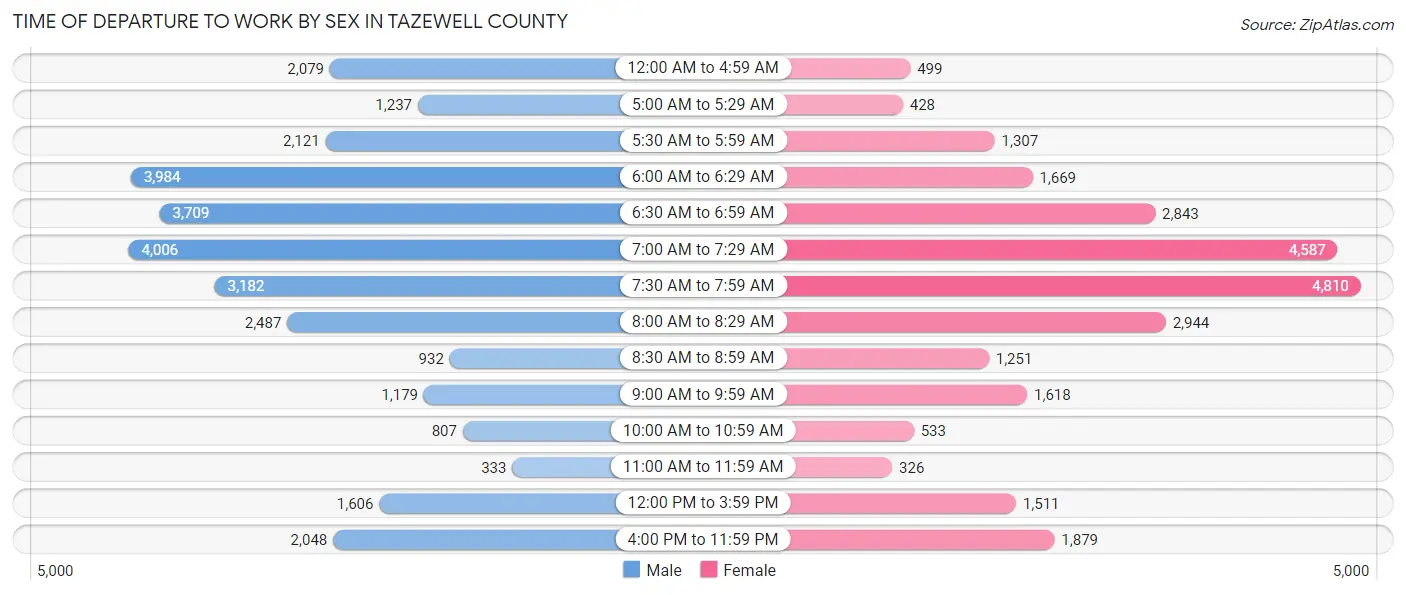
| Time of Departure | Male | Female |
| 12:00 AM to 4:59 AM | 2,079 (7.0%) | 499 (1.9%) |
| 5:00 AM to 5:29 AM | 1,237 (4.2%) | 428 (1.6%) |
| 5:30 AM to 5:59 AM | 2,121 (7.1%) | 1,307 (5.0%) |
| 6:00 AM to 6:29 AM | 3,984 (13.4%) | 1,669 (6.4%) |
| 6:30 AM to 6:59 AM | 3,709 (12.5%) | 2,843 (10.8%) |
| 7:00 AM to 7:29 AM | 4,006 (13.5%) | 4,587 (17.5%) |
| 7:30 AM to 7:59 AM | 3,182 (10.7%) | 4,810 (18.4%) |
| 8:00 AM to 8:29 AM | 2,487 (8.4%) | 2,944 (11.2%) |
| 8:30 AM to 8:59 AM | 932 (3.1%) | 1,251 (4.8%) |
| 9:00 AM to 9:59 AM | 1,179 (4.0%) | 1,618 (6.2%) |
| 10:00 AM to 10:59 AM | 807 (2.7%) | 533 (2.0%) |
| 11:00 AM to 11:59 AM | 333 (1.1%) | 326 (1.2%) |
| 12:00 PM to 3:59 PM | 1,606 (5.4%) | 1,511 (5.8%) |
| 4:00 PM to 11:59 PM | 2,048 (6.9%) | 1,879 (7.2%) |
| Total | 29,710 (100.0%) | 26,205 (100.0%) |
Housing Occupancy in Tazewell County
Occupancy by Ownership in Tazewell County
Of the total 53,676 dwellings in Tazewell County, owner-occupied units account for 41,480 (77.3%), while renter-occupied units make up 12,196 (22.7%).
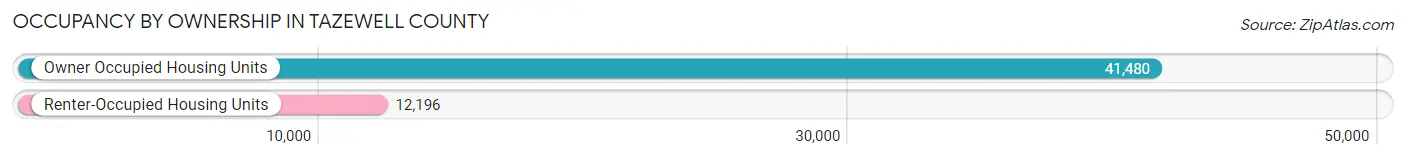
| Occupancy | # Housing Units | % Housing Units |
| Owner Occupied Housing Units | 41,480 | 77.3% |
| Renter-Occupied Housing Units | 12,196 | 22.7% |
| Total Occupied Housing Units | 53,676 | 100.0% |
Occupancy by Household Size in Tazewell County
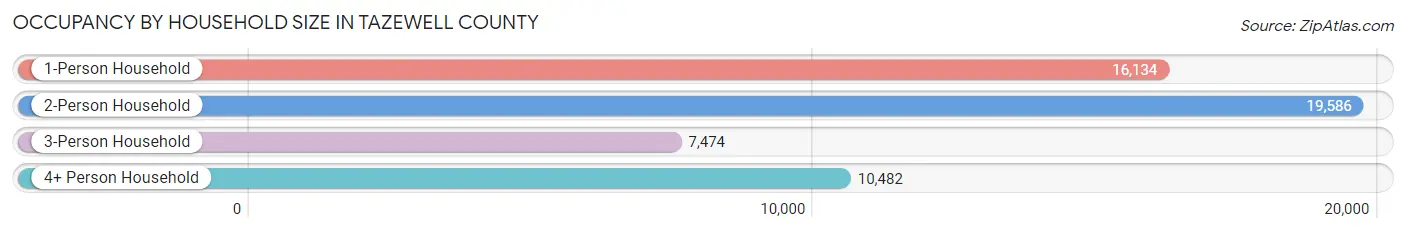
| Household Size | # Housing Units | % Housing Units |
| 1-Person Household | 16,134 | 30.1% |
| 2-Person Household | 19,586 | 36.5% |
| 3-Person Household | 7,474 | 13.9% |
| 4+ Person Household | 10,482 | 19.5% |
| Total Housing Units | 53,676 | 100.0% |
Occupancy by Ownership by Household Size in Tazewell County
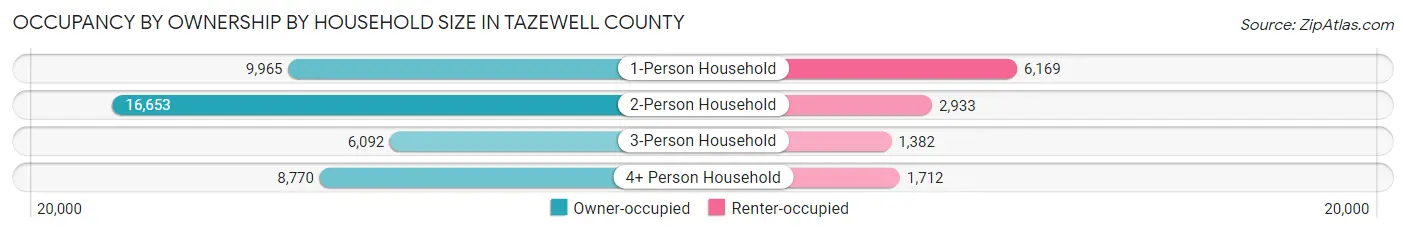
| Household Size | Owner-occupied | Renter-occupied |
| 1-Person Household | 9,965 (61.8%) | 6,169 (38.2%) |
| 2-Person Household | 16,653 (85.0%) | 2,933 (15.0%) |
| 3-Person Household | 6,092 (81.5%) | 1,382 (18.5%) |
| 4+ Person Household | 8,770 (83.7%) | 1,712 (16.3%) |
| Total Housing Units | 41,480 (77.3%) | 12,196 (22.7%) |
Occupancy by Educational Attainment in Tazewell County
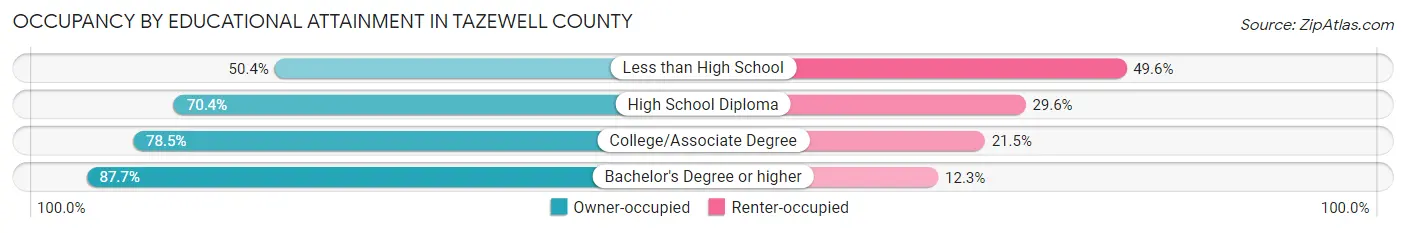
| Household Size | Owner-occupied | Renter-occupied |
| Less than High School | 1,426 (50.4%) | 1,402 (49.6%) |
| High School Diploma | 10,941 (70.4%) | 4,601 (29.6%) |
| College/Associate Degree | 15,751 (78.5%) | 4,322 (21.5%) |
| Bachelor's Degree or higher | 13,362 (87.7%) | 1,871 (12.3%) |
Occupancy by Age of Householder in Tazewell County
| Age Bracket | # Households | % Households |
| Under 35 Years | 9,602 | 17.9% |
| 35 to 44 Years | 8,852 | 16.5% |
| 45 to 54 Years | 8,987 | 16.7% |
| 55 to 64 Years | 10,529 | 19.6% |
| 65 to 74 Years | 9,020 | 16.8% |
| 75 to 84 Years | 4,806 | 8.9% |
| 85 Years and Over | 1,880 | 3.5% |
| Total | 53,676 | 100.0% |
Housing Finances in Tazewell County
Median Income by Occupancy in Tazewell County
| Occupancy Type | # Households | Median Income |
| Owner-Occupied | 41,480 (77.3%) | $86,870 |
| Renter-Occupied | 12,196 (22.7%) | $40,424 |
| Average | 53,676 (100.0%) | $74,606 |
Occupancy by Householder Income Bracket in Tazewell County
| Income Bracket | Owner-occupied | Renter-occupied |
| Less than $5,000 | 651 (1.6%) | 778 (6.4%) |
| $5,000 to $9,999 | 366 (0.9%) | 270 (2.2%) |
| $10,000 to $14,999 | 494 (1.2%) | 1,117 (9.2%) |
| $15,000 to $19,999 | 735 (1.8%) | 720 (5.9%) |
| $20,000 to $24,999 | 1,033 (2.5%) | 1,169 (9.6%) |
| $25,000 to $34,999 | 2,471 (6.0%) | 1,375 (11.3%) |
| $35,000 to $49,999 | 4,355 (10.5%) | 2,215 (18.2%) |
| $50,000 to $74,999 | 7,159 (17.3%) | 2,096 (17.2%) |
| $75,000 to $99,999 | 6,753 (16.3%) | 1,273 (10.4%) |
| $100,000 to $149,999 | 9,220 (22.2%) | 853 (7.0%) |
| $150,000 or more | 8,243 (19.9%) | 330 (2.7%) |
| Total | 41,480 (100.0%) | 12,196 (100.0%) |
Monthly Housing Cost Tiers in Tazewell County
| Monthly Cost | Owner-occupied | Renter-occupied |
| Less than $300 | 961 (2.3%) | 650 (5.3%) |
| $300 to $499 | 4,102 (9.9%) | 622 (5.1%) |
| $500 to $799 | 9,402 (22.7%) | 3,714 (30.4%) |
| $800 to $999 | 5,306 (12.8%) | 2,429 (19.9%) |
| $1,000 to $1,499 | 10,354 (25.0%) | 2,918 (23.9%) |
| $1,500 to $1,999 | 6,092 (14.7%) | 530 (4.3%) |
| $2,000 to $2,499 | 2,738 (6.6%) | 112 (0.9%) |
| $2,500 to $2,999 | 1,134 (2.7%) | 112 (0.9%) |
| $3,000 or more | 1,391 (3.4%) | 233 (1.9%) |
| Total | 41,480 (100.0%) | 12,196 (100.0%) |
Physical Housing Characteristics in Tazewell County
Housing Structures in Tazewell County
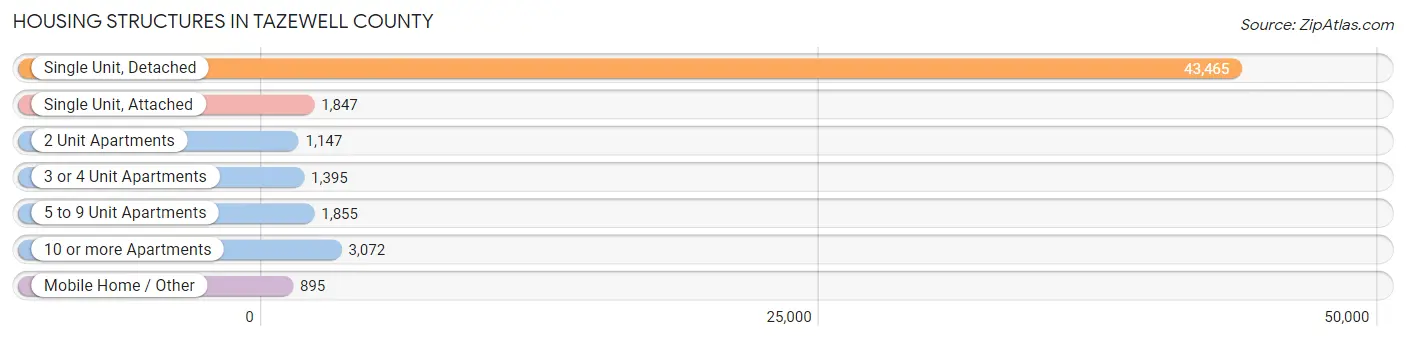
| Structure Type | # Housing Units | % Housing Units |
| Single Unit, Detached | 43,465 | 81.0% |
| Single Unit, Attached | 1,847 | 3.4% |
| 2 Unit Apartments | 1,147 | 2.1% |
| 3 or 4 Unit Apartments | 1,395 | 2.6% |
| 5 to 9 Unit Apartments | 1,855 | 3.5% |
| 10 or more Apartments | 3,072 | 5.7% |
| Mobile Home / Other | 895 | 1.7% |
| Total | 53,676 | 100.0% |
Housing Structures by Occupancy in Tazewell County
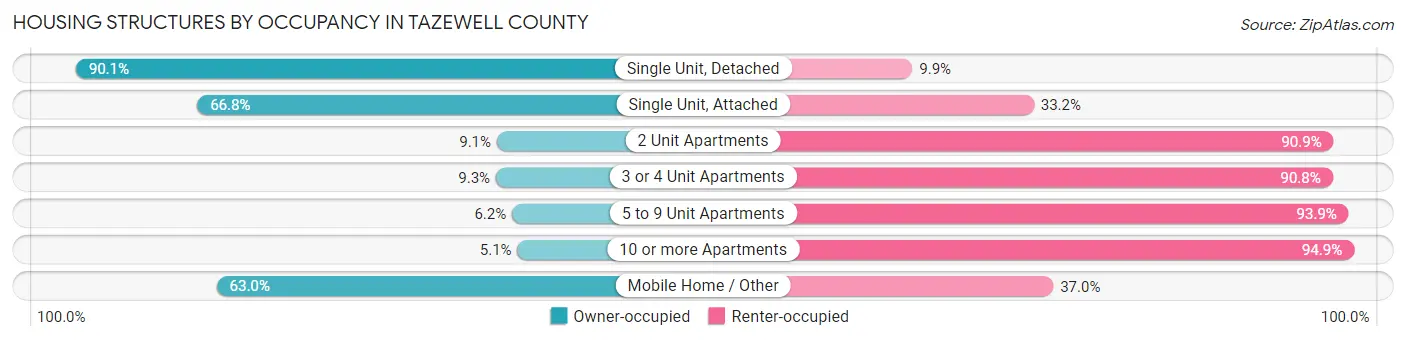
| Structure Type | Owner-occupied | Renter-occupied |
| Single Unit, Detached | 39,179 (90.1%) | 4,286 (9.9%) |
| Single Unit, Attached | 1,233 (66.8%) | 614 (33.2%) |
| 2 Unit Apartments | 104 (9.1%) | 1,043 (90.9%) |
| 3 or 4 Unit Apartments | 129 (9.2%) | 1,266 (90.7%) |
| 5 to 9 Unit Apartments | 114 (6.1%) | 1,741 (93.9%) |
| 10 or more Apartments | 157 (5.1%) | 2,915 (94.9%) |
| Mobile Home / Other | 564 (63.0%) | 331 (37.0%) |
| Total | 41,480 (77.3%) | 12,196 (22.7%) |
Housing Structures by Number of Rooms in Tazewell County
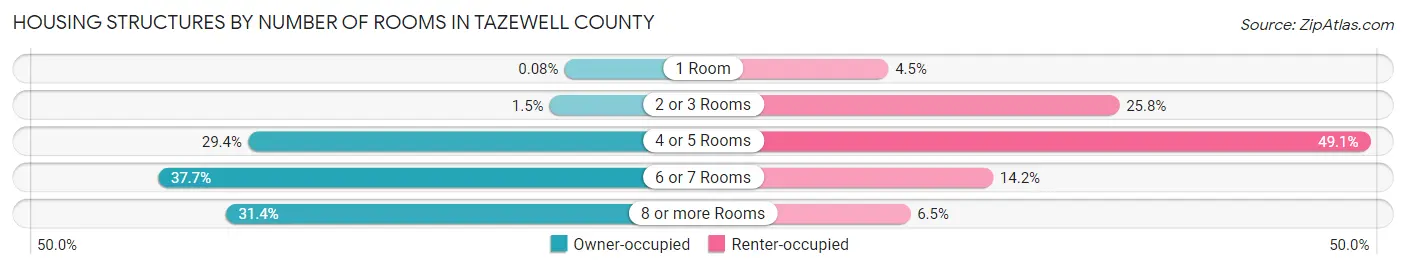
| Number of Rooms | Owner-occupied | Renter-occupied |
| 1 Room | 35 (0.1%) | 545 (4.5%) |
| 2 or 3 Rooms | 604 (1.5%) | 3,150 (25.8%) |
| 4 or 5 Rooms | 12,180 (29.4%) | 5,982 (49.0%) |
| 6 or 7 Rooms | 15,630 (37.7%) | 1,726 (14.1%) |
| 8 or more Rooms | 13,031 (31.4%) | 793 (6.5%) |
| Total | 41,480 (100.0%) | 12,196 (100.0%) |
Housing Structure by Heating Type in Tazewell County

| Heating Type | Owner-occupied | Renter-occupied |
| Utility Gas | 32,221 (77.7%) | 7,022 (57.6%) |
| Bottled, Tank, or LP Gas | 3,017 (7.3%) | 342 (2.8%) |
| Electricity | 5,816 (14.0%) | 4,616 (37.9%) |
| Fuel Oil or Kerosene | 13 (0.0%) | 0 (0.0%) |
| Coal or Coke | 2 (0.0%) | 0 (0.0%) |
| All other Fuels | 349 (0.8%) | 153 (1.3%) |
| No Fuel Used | 62 (0.2%) | 63 (0.5%) |
| Total | 41,480 (100.0%) | 12,196 (100.0%) |
Household Vehicle Usage in Tazewell County
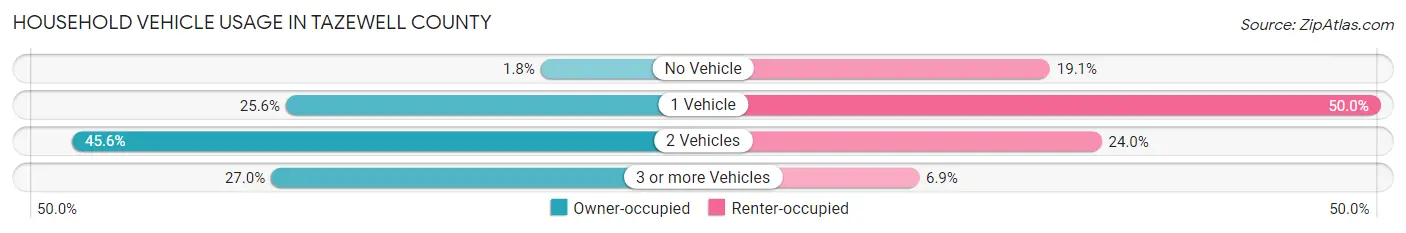
| Vehicles per Household | Owner-occupied | Renter-occupied |
| No Vehicle | 759 (1.8%) | 2,333 (19.1%) |
| 1 Vehicle | 10,622 (25.6%) | 6,097 (50.0%) |
| 2 Vehicles | 18,899 (45.6%) | 2,922 (24.0%) |
| 3 or more Vehicles | 11,200 (27.0%) | 844 (6.9%) |
| Total | 41,480 (100.0%) | 12,196 (100.0%) |
Real Estate & Mortgages in Tazewell County
Real Estate and Mortgage Overview in Tazewell County
| Characteristic | Without Mortgage | With Mortgage |
| Housing Units | 16,078 | 25,402 |
| Median Property Value | $157,700 | $160,000 |
| Median Household Income | $70,790 | $5,902 |
| Monthly Housing Costs | $619 | $1,370 |
| Real Estate Taxes | $3,131 | $392 |
Property Value by Mortgage Status in Tazewell County
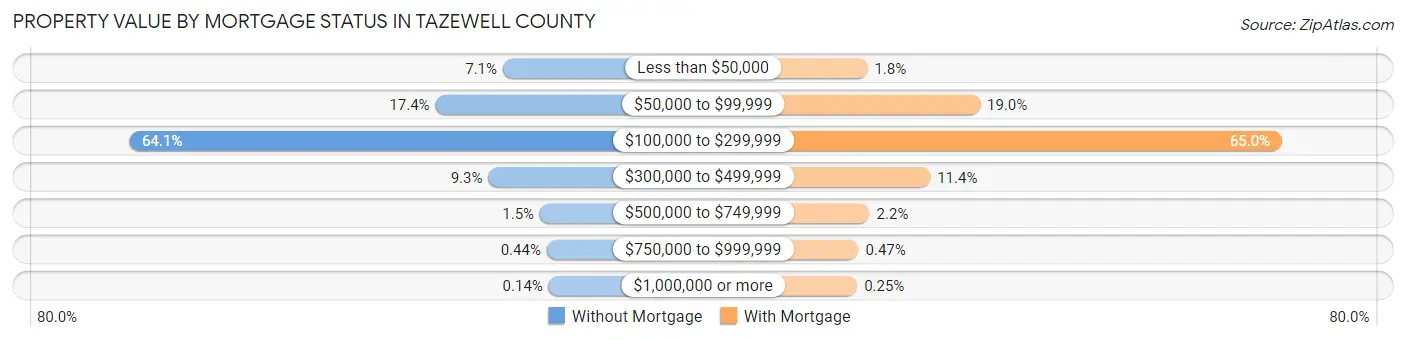
| Property Value | Without Mortgage | With Mortgage |
| Less than $50,000 | 1,144 (7.1%) | 459 (1.8%) |
| $50,000 to $99,999 | 2,798 (17.4%) | 4,820 (19.0%) |
| $100,000 to $299,999 | 10,305 (64.1%) | 16,504 (65.0%) |
| $300,000 to $499,999 | 1,501 (9.3%) | 2,890 (11.4%) |
| $500,000 to $749,999 | 236 (1.5%) | 545 (2.1%) |
| $750,000 to $999,999 | 71 (0.4%) | 120 (0.5%) |
| $1,000,000 or more | 23 (0.1%) | 64 (0.3%) |
| Total | 16,078 (100.0%) | 25,402 (100.0%) |
Household Income by Mortgage Status in Tazewell County
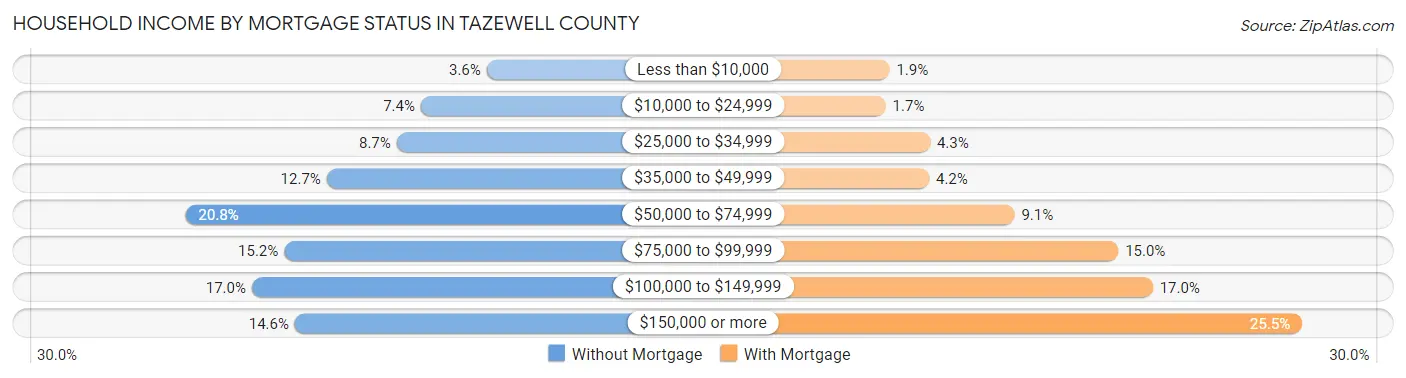
| Household Income | Without Mortgage | With Mortgage |
| Less than $10,000 | 579 (3.6%) | 493 (1.9%) |
| $10,000 to $24,999 | 1,183 (7.4%) | 438 (1.7%) |
| $25,000 to $34,999 | 1,405 (8.7%) | 1,079 (4.3%) |
| $35,000 to $49,999 | 2,048 (12.7%) | 1,066 (4.2%) |
| $50,000 to $74,999 | 3,346 (20.8%) | 2,307 (9.1%) |
| $75,000 to $99,999 | 2,439 (15.2%) | 3,813 (15.0%) |
| $100,000 to $149,999 | 2,737 (17.0%) | 4,314 (17.0%) |
| $150,000 or more | 2,341 (14.6%) | 6,483 (25.5%) |
| Total | 16,078 (100.0%) | 25,402 (100.0%) |
Property Value to Household Income Ratio in Tazewell County
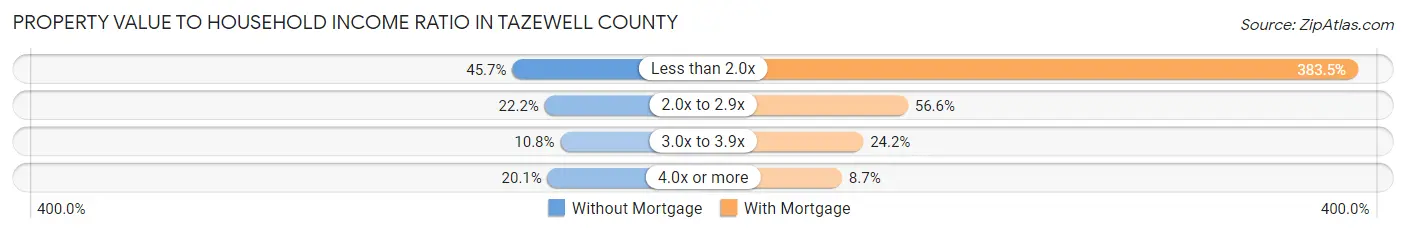
| Value-to-Income Ratio | Without Mortgage | With Mortgage |
| Less than 2.0x | 7,348 (45.7%) | 97,423 (383.5%) |
| 2.0x to 2.9x | 3,570 (22.2%) | 14,364 (56.6%) |
| 3.0x to 3.9x | 1,738 (10.8%) | 6,140 (24.2%) |
| 4.0x or more | 3,227 (20.1%) | 2,212 (8.7%) |
| Total | 16,078 (100.0%) | 25,402 (100.0%) |
Real Estate Taxes by Mortgage Status in Tazewell County

| Property Taxes | Without Mortgage | With Mortgage |
| Less than $800 | 1,292 (8.0%) | 102 (0.4%) |
| $800 to $1,499 | 1,780 (11.1%) | 630 (2.5%) |
| $800 to $1,499 | 12,785 (79.5%) | 2,010 (7.9%) |
| Total | 16,078 (100.0%) | 25,402 (100.0%) |
Health & Disability in Tazewell County
Health Insurance Coverage by Age in Tazewell County
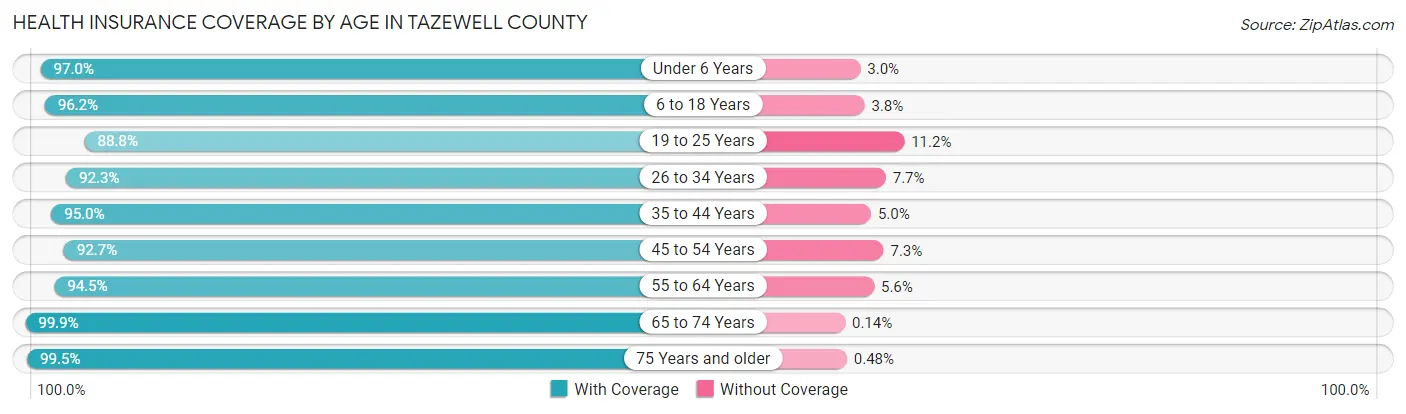
| Age Bracket | With Coverage | Without Coverage |
| Under 6 Years | 8,220 (97.0%) | 253 (3.0%) |
| 6 to 18 Years | 21,411 (96.2%) | 839 (3.8%) |
| 19 to 25 Years | 8,430 (88.8%) | 1,061 (11.2%) |
| 26 to 34 Years | 12,751 (92.3%) | 1,069 (7.7%) |
| 35 to 44 Years | 15,906 (95.0%) | 834 (5.0%) |
| 45 to 54 Years | 14,849 (92.7%) | 1,172 (7.3%) |
| 55 to 64 Years | 16,552 (94.5%) | 972 (5.6%) |
| 65 to 74 Years | 14,199 (99.9%) | 20 (0.1%) |
| 75 Years and older | 10,274 (99.5%) | 50 (0.5%) |
| Total | 122,592 (95.1%) | 6,270 (4.9%) |
Health Insurance Coverage by Citizenship Status in Tazewell County

| Citizenship Status | With Coverage | Without Coverage |
| Native Born | 8,220 (97.0%) | 253 (3.0%) |
| Foreign Born, Citizen | 21,411 (96.2%) | 839 (3.8%) |
| Foreign Born, not a Citizen | 8,430 (88.8%) | 1,061 (11.2%) |
Health Insurance Coverage by Household Income in Tazewell County

| Household Income | With Coverage | Without Coverage |
| Under $25,000 | 10,916 (93.5%) | 753 (6.5%) |
| $25,000 to $49,999 | 17,229 (93.7%) | 1,155 (6.3%) |
| $50,000 to $74,999 | 20,263 (95.1%) | 1,044 (4.9%) |
| $75,000 to $99,999 | 20,142 (94.8%) | 1,102 (5.2%) |
| $100,000 and over | 53,683 (96.0%) | 2,211 (4.0%) |
Public vs Private Health Insurance Coverage by Age in Tazewell County

| Age Bracket | Public Insurance | Private Insurance |
| Under 6 | 3,398 (40.1%) | 5,219 (61.6%) |
| 6 to 18 Years | 5,852 (26.3%) | 16,532 (74.3%) |
| 19 to 25 Years | 1,865 (19.7%) | 6,732 (70.9%) |
| 25 to 34 Years | 3,039 (22.0%) | 10,226 (74.0%) |
| 35 to 44 Years | 2,830 (16.9%) | 13,748 (82.1%) |
| 45 to 54 Years | 2,055 (12.8%) | 13,253 (82.7%) |
| 55 to 64 Years | 3,611 (20.6%) | 13,662 (78.0%) |
| 65 to 74 Years | 13,897 (97.7%) | 9,513 (66.9%) |
| 75 Years and over | 10,172 (98.5%) | 7,327 (71.0%) |
| Total | 46,719 (36.3%) | 96,212 (74.7%) |
Disability Status by Sex by Age in Tazewell County
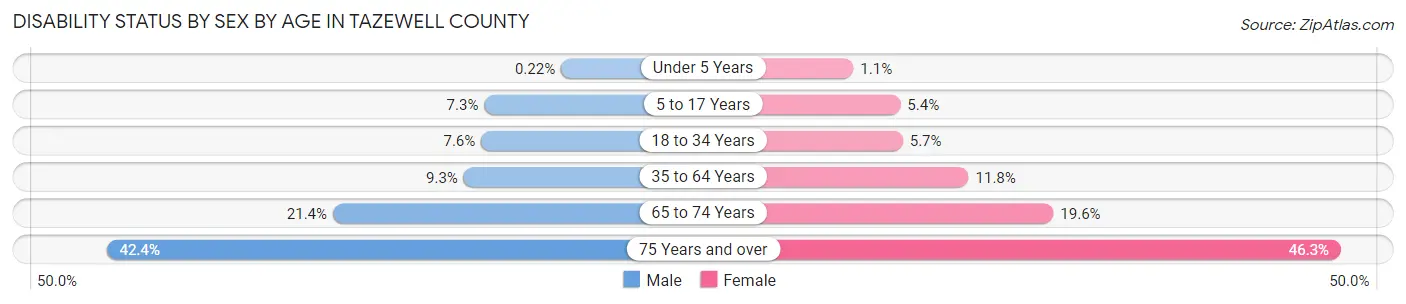
| Age Bracket | Male | Female |
| Under 5 Years | 8 (0.2%) | 37 (1.1%) |
| 5 to 17 Years | 832 (7.3%) | 596 (5.4%) |
| 18 to 34 Years | 956 (7.6%) | 691 (5.7%) |
| 35 to 64 Years | 2,314 (9.2%) | 2,974 (11.8%) |
| 65 to 74 Years | 1,436 (21.4%) | 1,474 (19.6%) |
| 75 Years and over | 1,810 (42.4%) | 2,804 (46.3%) |
Disability Class by Sex by Age in Tazewell County
Disability Class: Hearing Difficulty
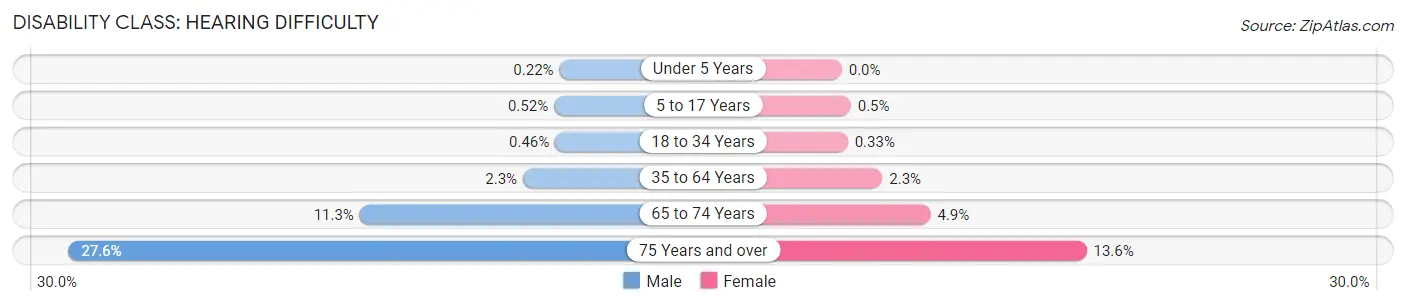
| Age Bracket | Male | Female |
| Under 5 Years | 8 (0.2%) | 0 (0.0%) |
| 5 to 17 Years | 59 (0.5%) | 55 (0.5%) |
| 18 to 34 Years | 57 (0.5%) | 40 (0.3%) |
| 35 to 64 Years | 563 (2.2%) | 572 (2.3%) |
| 65 to 74 Years | 761 (11.3%) | 371 (4.9%) |
| 75 Years and over | 1,177 (27.6%) | 825 (13.6%) |
Disability Class: Vision Difficulty
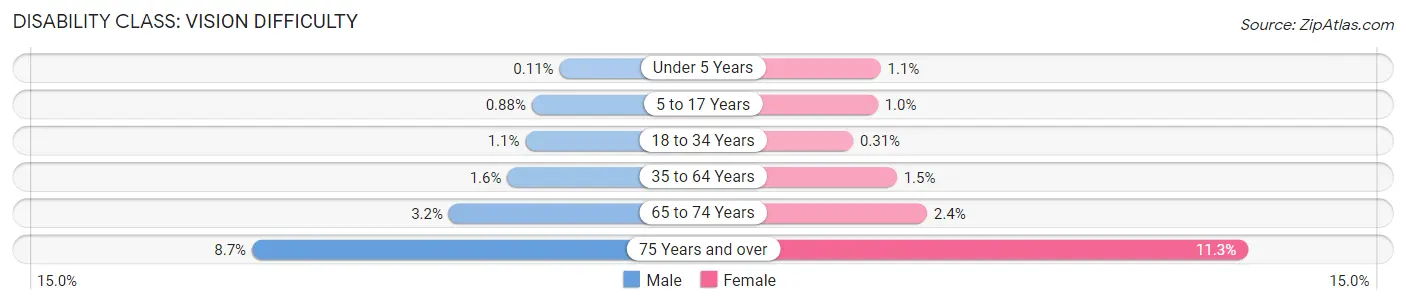
| Age Bracket | Male | Female |
| Under 5 Years | 4 (0.1%) | 37 (1.1%) |
| 5 to 17 Years | 100 (0.9%) | 110 (1.0%) |
| 18 to 34 Years | 133 (1.1%) | 38 (0.3%) |
| 35 to 64 Years | 390 (1.6%) | 387 (1.5%) |
| 65 to 74 Years | 214 (3.2%) | 178 (2.4%) |
| 75 Years and over | 370 (8.7%) | 685 (11.3%) |
Disability Class: Cognitive Difficulty
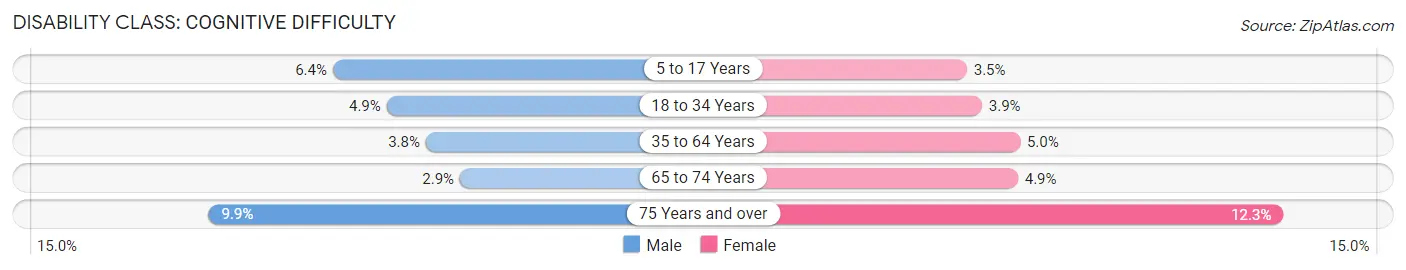
| Age Bracket | Male | Female |
| 5 to 17 Years | 728 (6.4%) | 382 (3.5%) |
| 18 to 34 Years | 616 (4.9%) | 476 (3.9%) |
| 35 to 64 Years | 959 (3.8%) | 1,254 (5.0%) |
| 65 to 74 Years | 193 (2.9%) | 368 (4.9%) |
| 75 Years and over | 422 (9.9%) | 744 (12.3%) |
Disability Class: Ambulatory Difficulty
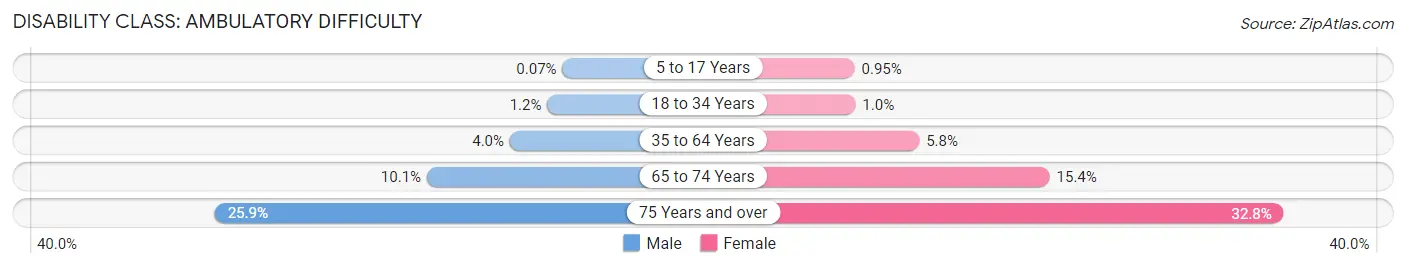
| Age Bracket | Male | Female |
| 5 to 17 Years | 8 (0.1%) | 104 (0.9%) |
| 18 to 34 Years | 149 (1.2%) | 123 (1.0%) |
| 35 to 64 Years | 992 (4.0%) | 1,453 (5.8%) |
| 65 to 74 Years | 680 (10.1%) | 1,158 (15.4%) |
| 75 Years and over | 1,105 (25.9%) | 1,986 (32.8%) |
Disability Class: Self-Care Difficulty

| Age Bracket | Male | Female |
| 5 to 17 Years | 184 (1.6%) | 114 (1.0%) |
| 18 to 34 Years | 84 (0.7%) | 65 (0.5%) |
| 35 to 64 Years | 438 (1.8%) | 434 (1.7%) |
| 65 to 74 Years | 329 (4.9%) | 359 (4.8%) |
| 75 Years and over | 469 (11.0%) | 842 (13.9%) |
Technology Access in Tazewell County
Computing Device Access in Tazewell County
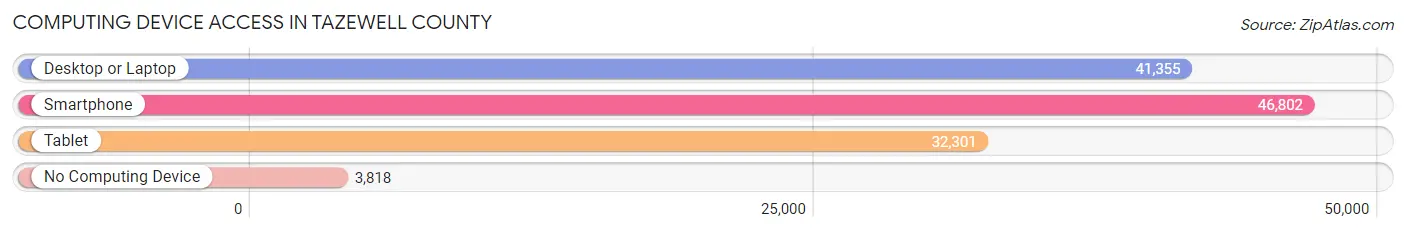
| Device Type | # Households | % Households |
| Desktop or Laptop | 41,355 | 77.0% |
| Smartphone | 46,802 | 87.2% |
| Tablet | 32,301 | 60.2% |
| No Computing Device | 3,818 | 7.1% |
| Total | 53,676 | 100.0% |
Internet Access in Tazewell County

| Internet Type | # Households | % Households |
| Dial-Up Internet | 103 | 0.2% |
| Broadband Home | 38,229 | 71.2% |
| Cellular Data Only | 6,715 | 12.5% |
| Satellite Internet | 2,249 | 4.2% |
| No Internet | 6,717 | 12.5% |
| Total | 53,676 | 100.0% |
Tazewell County Summary
Tazewell County, Illinois is located in the central part of the state, and is part of the Peoria, IL Metropolitan Statistical Area. It is bordered by Woodford County to the north, Mason County to the east, McLean County to the south, and Fulton County to the west. The county seat is Pekin, and the largest city is East Peoria. As of the 2010 census, the population was 135,394, making it the tenth most populous county in Illinois.
History
Tazewell County was formed in 1827 from parts of Peoria and Fulton counties. It was named after Littleton Tazewell, who was a U.S. Senator from Virginia and the Governor of Virginia from 1834 to 1836. The county was initially divided into nine townships, but this was later reduced to eight.
The first settlers in the area were of French and German descent, and the first permanent settlement was established in 1825. The county was largely agricultural in its early years, with corn, wheat, and oats being the main crops. The first railroad line was built in 1854, connecting Pekin to Peoria. This was followed by the Chicago, Burlington and Quincy Railroad in 1871, which connected Pekin to Chicago.
Geography
Tazewell County covers an area of 845 square miles, of which 843 square miles is land and 2 square miles is water. The county is located in the central part of the state, and is part of the Peoria, IL Metropolitan Statistical Area. It is bordered by Woodford County to the north, Mason County to the east, McLean County to the south, and Fulton County to the west.
The county is mostly flat, with some rolling hills in the northern and western parts. The highest point in the county is located in the northwest corner, at an elevation of 890 feet. The county is drained by the Mackinaw River, which flows through the center of the county.
Economy
Tazewell County has a diverse economy, with a mix of manufacturing, agriculture, and services. The largest employers in the county are Caterpillar Inc., OSF Healthcare, and Pekin Community High School District 303.
Agriculture is an important part of the county’s economy, with corn, soybeans, and wheat being the main crops. Livestock production is also important, with hogs, cattle, and sheep being the main animals raised.
Manufacturing is also an important part of the economy, with Caterpillar Inc. being the largest employer in the county. Other major employers include Pekin Energy, Pekin Steel, and Pekin Plastics.
Demographics
As of the 2010 census, there were 135,394 people, 51,945 households, and 36,845 families living in the county. The population density was 161.2 people per square mile. There were 55,845 housing units, of which 50,945 were occupied.
The racial makeup of the county was 92.2% White, 4.2% Black or African American, 0.4% Native American, 0.7% Asian, 0.1% Pacific Islander, 1.2% from other races, and 1.2% from two or more races. Hispanic or Latino of any race were 3.3% of the population.
The median income for a household in the county was $50,945, and the median income for a family was $60,945. The per capita income for the county was $24,945. About 8.2% of families and 10.2% of the population were below the poverty line, including 14.2% of those under age 18 and 6.2% of those age 65 or over.
Common Questions
What is the Total Population of Tazewell County?
Total Population of Tazewell County is 131,276.
What is the Total Male Population of Tazewell County?
Total Male Population of Tazewell County is 64,995.
What is the Total Female Population of Tazewell County?
Total Female Population of Tazewell County is 66,281.
What is the Ratio of Males per 100 Females in Tazewell County?
There are 98.06 Males per 100 Females in Tazewell County.
What is the Ratio of Females per 100 Males in Tazewell County?
There are 101.98 Females per 100 Males in Tazewell County.
What is the Median Population Age in Tazewell County?
Median Population Age in Tazewell County is 41.6 Years.
What is the Average Family Size in Tazewell County
Average Family Size in Tazewell County is 3.0 People.
What is the Average Household Size in Tazewell County
Average Household Size in Tazewell County is 2.4 People.
What is Per Capita Income in Tazewell County?
Per Capita income in Tazewell County is $38,573.
What is the Median Family Income in Tazewell County?
Median Family Income in Tazewell County is $94,169.
What is the Median Household income in Tazewell County?
Median Household Income in Tazewell County is $74,606.
What is Income or Wage Gap in Tazewell County?
Income or Wage Gap in Tazewell County is 36.6%.
Women in Tazewell County earn 63.4 cents for every dollar earned by a man.
What is Family Income Deficit in Tazewell County?
Family Income Deficit in Tazewell County is $11,455.
Families that are below poverty line in Tazewell County earn $11,455 less on average than the poverty threshold level.
What is Inequality or Gini Index in Tazewell County?
Inequality or Gini Index in Tazewell County is 0.42.
How Large is the Labor Force in Tazewell County?
There are 64,958 People in the Labor Forcein in Tazewell County.
What is the Percentage of People in the Labor Force in Tazewell County?
61.6% of People are in the Labor Force in Tazewell County.
What is the Unemployment Rate in Tazewell County?
Unemployment Rate in Tazewell County is 3.9%.