Stark County, IL
Stark County Map

Stark County Overview
5,395
TOTAL POPULATION
2,720
MALE POPULATION
2,675
FEMALE POPULATION
101.68
MALES / 100 FEMALES
98.35
FEMALES / 100 MALES
44.8
MEDIAN AGE
2.9
AVG FAMILY SIZE
2.3
AVG HOUSEHOLD SIZE
$32,618
PER CAPITA INCOME
$79,254
AVG FAMILY INCOME
$58,125
AVG HOUSEHOLD INCOME
30.7%
WAGE / INCOME GAP [ % ]
69.3¢/ $1
WAGE / INCOME GAP [ $ ]
0.45
INEQUALITY / GINI INDEX
2,526
LABOR FORCE [ PEOPLE ]
57.7%
PERCENT IN LABOR FORCE
3.3%
UNEMPLOYMENT RATE
Stark County Area Codes
Race in Stark County
The most populous races in Stark County are White / Caucasian (5,089 | 94.3%), Two or more Races (139 | 2.6%), and Hispanic or Latino (124 | 2.3%).
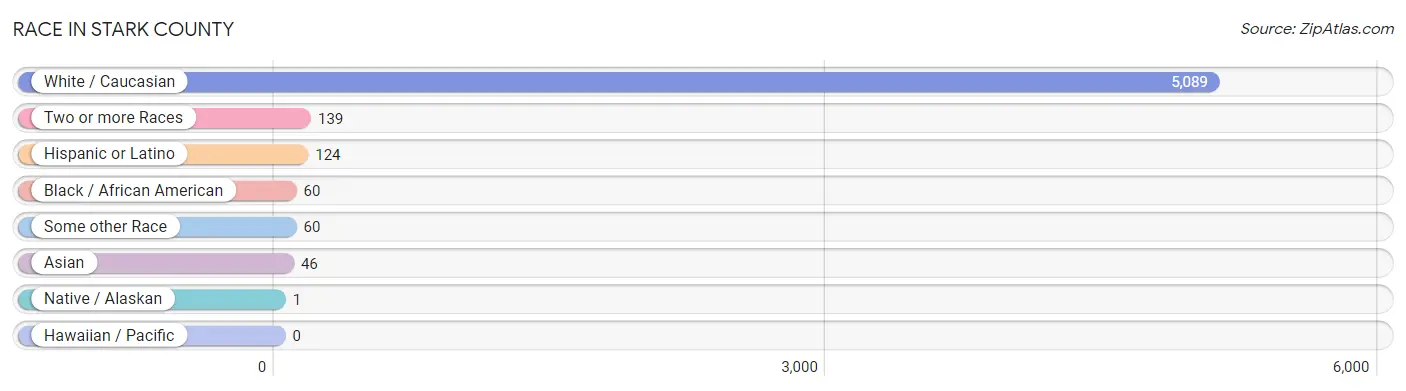
| Race | # Population | % Population |
| Asian | 46 | 0.9% |
| Black / African American | 60 | 1.1% |
| Hawaiian / Pacific | 0 | 0.0% |
| Hispanic or Latino | 124 | 2.3% |
| Native / Alaskan | 1 | 0.0% |
| White / Caucasian | 5,089 | 94.3% |
| Two or more Races | 139 | 2.6% |
| Some other Race | 60 | 1.1% |
| Total | 5,395 | 100.0% |
Ancestry in Stark County
The most populous ancestries reported in Stark County are German (1,338 | 24.8%), English (787 | 14.6%), Irish (721 | 13.4%), American (267 | 5.0%), and Swedish (192 | 3.6%), together accounting for 61.3% of all Stark County residents.

| Ancestry | # Population | % Population |
| American | 267 | 5.0% |
| Apache | 1 | 0.0% |
| Arab | 56 | 1.0% |
| Argentinean | 4 | 0.1% |
| Austrian | 86 | 1.6% |
| Belgian | 19 | 0.4% |
| Blackfeet | 3 | 0.1% |
| British | 31 | 0.6% |
| Canadian | 2 | 0.0% |
| Central American | 40 | 0.7% |
| Cherokee | 12 | 0.2% |
| Comanche | 3 | 0.1% |
| Danish | 14 | 0.3% |
| Dutch | 154 | 2.9% |
| Eastern European | 7 | 0.1% |
| English | 787 | 14.6% |
| European | 117 | 2.2% |
| French | 57 | 1.1% |
| French Canadian | 7 | 0.1% |
| German | 1,338 | 24.8% |
| Iraqi | 50 | 0.9% |
| Irish | 721 | 13.4% |
| Italian | 133 | 2.5% |
| Korean | 56 | 1.0% |
| Lebanese | 6 | 0.1% |
| Lithuanian | 3 | 0.1% |
| Mexican | 68 | 1.3% |
| Navajo | 3 | 0.1% |
| Northern European | 10 | 0.2% |
| Norwegian | 56 | 1.0% |
| Polish | 108 | 2.0% |
| Portuguese | 2 | 0.0% |
| Puerto Rican | 12 | 0.2% |
| Romanian | 6 | 0.1% |
| Salvadoran | 40 | 0.7% |
| Scandinavian | 30 | 0.6% |
| Scotch-Irish | 82 | 1.5% |
| Scottish | 176 | 3.3% |
| Serbian | 1 | 0.0% |
| South American | 4 | 0.1% |
| Swedish | 192 | 3.6% |
| Swiss | 141 | 2.6% |
| Ukrainian | 39 | 0.7% |
| Welsh | 10 | 0.2% | View All 44 Rows |
Immigrants in Stark County
The most numerous immigrant groups reported in Stark County came from Asia (52 | 1.0%), Europe (40 | 0.7%), Latin America (33 | 0.6%), Iraq (31 | 0.6%), and Western Asia (31 | 0.6%), together accounting for 3.5% of all Stark County residents.

| Immigration Origin | # Population | % Population |
| Argentina | 4 | 0.1% |
| Asia | 52 | 1.0% |
| Austria | 5 | 0.1% |
| Bosnia and Herzegovina | 2 | 0.0% |
| Canada | 2 | 0.0% |
| Central America | 29 | 0.5% |
| Eastern Europe | 23 | 0.4% |
| El Salvador | 18 | 0.3% |
| England | 3 | 0.1% |
| Europe | 40 | 0.7% |
| Germany | 5 | 0.1% |
| Iraq | 31 | 0.6% |
| Italy | 4 | 0.1% |
| Latin America | 33 | 0.6% |
| Mexico | 11 | 0.2% |
| Northern Europe | 3 | 0.1% |
| Philippines | 21 | 0.4% |
| Serbia | 1 | 0.0% |
| South America | 4 | 0.1% |
| South Eastern Asia | 21 | 0.4% |
| Southern Europe | 4 | 0.1% |
| Ukraine | 20 | 0.4% |
| Western Asia | 31 | 0.6% |
| Western Europe | 10 | 0.2% | View All 24 Rows |
Sex and Age in Stark County
Sex and Age in Stark County
The most populous age groups in Stark County are 55 to 59 Years (211 | 7.8%) for men and 60 to 64 Years (226 | 8.5%) for women.

| Age Bracket | Male | Female |
| Under 5 Years | 145 (5.3%) | 139 (5.2%) |
| 5 to 9 Years | 141 (5.2%) | 192 (7.2%) |
| 10 to 14 Years | 183 (6.7%) | 141 (5.3%) |
| 15 to 19 Years | 164 (6.0%) | 149 (5.6%) |
| 20 to 24 Years | 154 (5.7%) | 139 (5.2%) |
| 25 to 29 Years | 143 (5.3%) | 143 (5.3%) |
| 30 to 34 Years | 148 (5.4%) | 120 (4.5%) |
| 35 to 39 Years | 133 (4.9%) | 134 (5.0%) |
| 40 to 44 Years | 184 (6.8%) | 156 (5.8%) |
| 45 to 49 Years | 170 (6.2%) | 159 (5.9%) |
| 50 to 54 Years | 171 (6.3%) | 176 (6.6%) |
| 55 to 59 Years | 211 (7.8%) | 151 (5.6%) |
| 60 to 64 Years | 198 (7.3%) | 226 (8.5%) |
| 65 to 69 Years | 197 (7.2%) | 185 (6.9%) |
| 70 to 74 Years | 150 (5.5%) | 164 (6.1%) |
| 75 to 79 Years | 133 (4.9%) | 143 (5.3%) |
| 80 to 84 Years | 72 (2.6%) | 58 (2.2%) |
| 85 Years and over | 23 (0.9%) | 100 (3.7%) |
| Total | 2,720 (100.0%) | 2,675 (100.0%) |
Families and Households in Stark County
Median Family Size in Stark County
The median family size in Stark County is 2.93 persons per family, with married-couple families (1,161 | 82.1%) accounting for the largest median family size of 2.98 persons per family. On the other hand, single male/father families (94 | 6.7%) represent the smallest median family size with 2.57 persons per family.

| Family Type | # Families | Family Size |
| Married-Couple | 1,161 (82.1%) | 2.98 |
| Single Male/Father | 94 (6.7%) | 2.57 |
| Single Female/Mother | 159 (11.2%) | 2.77 |
| Total Families | 1,414 (100.0%) | 2.93 |
Median Household Size in Stark County
The median household size in Stark County is 2.28 persons per household, with single male/father households (94 | 4.0%) accounting for the largest median household size of 3.18 persons per household. non-family households (912 | 39.2%) represent the smallest median household size with 1.15 persons per household.

| Household Type | # Households | Household Size |
| Married-Couple | 1,161 (49.9%) | 2.99 |
| Single Male/Father | 94 (4.0%) | 3.18 |
| Single Female/Mother | 159 (6.8%) | 2.97 |
| Non-family | 912 (39.2%) | 1.15 |
| Total Households | 2,326 (100.0%) | 2.28 |
Household Size by Marriage Status in Stark County
Out of a total of 2,326 households in Stark County, 1,414 (60.8%) are family households, while 912 (39.2%) are nonfamily households. The most numerous type of family households are 2-person households, comprising 706, and the most common type of nonfamily households are 1-person households, comprising 830.
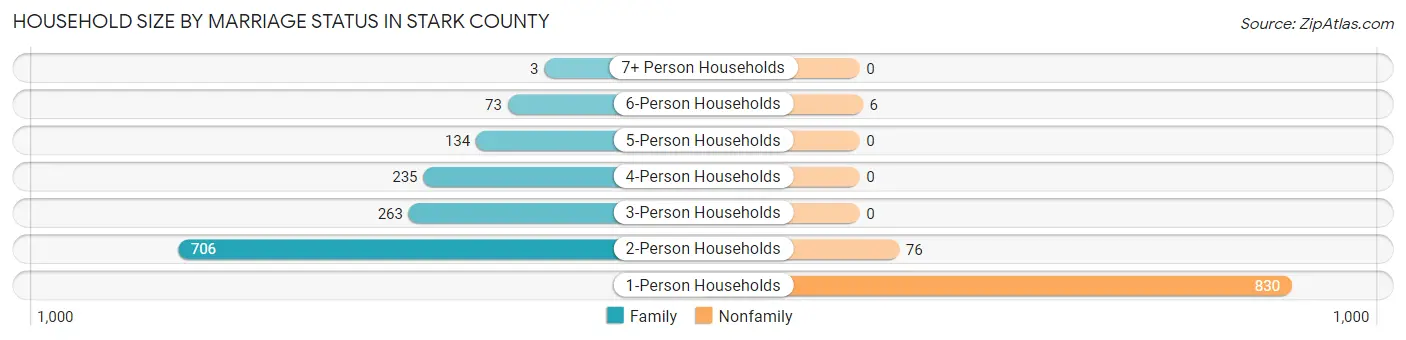
| Household Size | Family Households | Nonfamily Households |
| 1-Person Households | - | 830 (35.7%) |
| 2-Person Households | 706 (30.3%) | 76 (3.3%) |
| 3-Person Households | 263 (11.3%) | 0 (0.0%) |
| 4-Person Households | 235 (10.1%) | 0 (0.0%) |
| 5-Person Households | 134 (5.8%) | 0 (0.0%) |
| 6-Person Households | 73 (3.1%) | 6 (0.3%) |
| 7+ Person Households | 3 (0.1%) | 0 (0.0%) |
| Total | 1,414 (60.8%) | 912 (39.2%) |
Female Fertility in Stark County
Fertility by Age in Stark County
Average fertility rate in Stark County is 58.0 births per 1,000 women. Women in the age bracket of 20 to 34 years have the highest fertility rate with 122.0 births per 1,000 women. Women in the age bracket of 20 to 34 years acount for 83.1% of all women with births.

| Age Bracket | Women with Births | Births / 1,000 Women |
| 15 to 19 years | 0 (0.0%) | 0.0 |
| 20 to 34 years | 49 (83.1%) | 122.0 |
| 35 to 50 years | 10 (17.0%) | 21.0 |
| Total | 59 (100.0%) | 58.0 |
Fertility by Age by Marriage Status in Stark County
84.7% of women with births (59) in Stark County are married. The highest percentage of unmarried women with births falls into 20 to 34 years age bracket with 18.4% of them unmarried at the time of birth, while the lowest percentage of unmarried women with births belong to 35 to 50 years age bracket with 0.0% of them unmarried.

| Age Bracket | Married | Unmarried |
| 15 to 19 years | 0 (0.0%) | 0 (0.0%) |
| 20 to 34 years | 40 (81.6%) | 9 (18.4%) |
| 35 to 50 years | 10 (100.0%) | 0 (0.0%) |
| Total | 50 (84.8%) | 9 (15.2%) |
Fertility by Education in Stark County
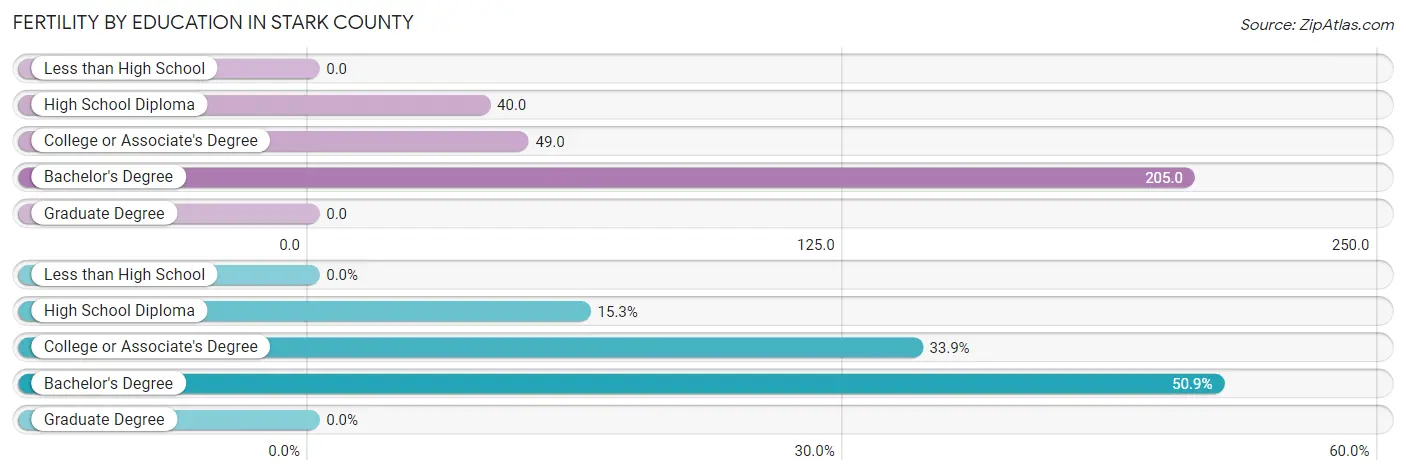
| Educational Attainment | Women with Births | Births / 1,000 Women |
| Less than High School | 0 (0.0%) | 0.0 |
| High School Diploma | 9 (15.2%) | 40.0 |
| College or Associate's Degree | 20 (33.9%) | 49.0 |
| Bachelor's Degree | 30 (50.8%) | 205.0 |
| Graduate Degree | 0 (0.0%) | 0.0 |
| Total | 59 (100.0%) | 58.0 |
Fertility by Education by Marriage Status in Stark County
15.2% of women with births in Stark County are unmarried. Women with the educational attainment of bachelor's degree are most likely to be married with 100.0% of them married at childbirth, while women with the educational attainment of college or associate's degree are least likely to be married with 35.0% of them unmarried at childbirth.
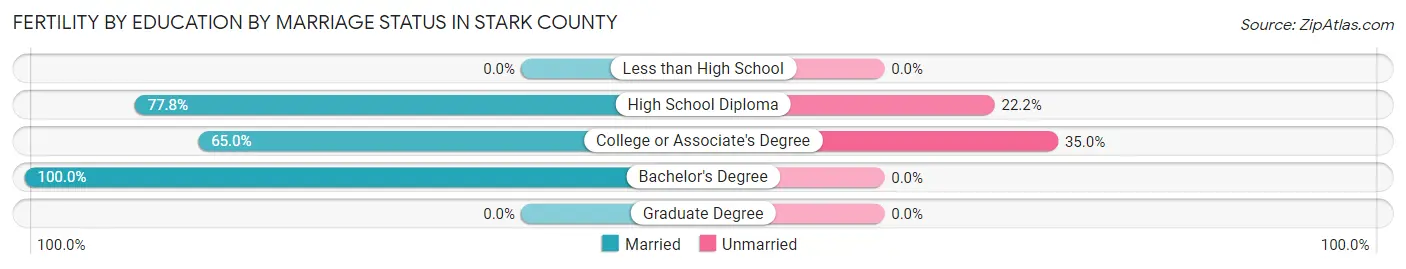
| Educational Attainment | Married | Unmarried |
| Less than High School | 0 (0.0%) | 0 (0.0%) |
| High School Diploma | 7 (77.8%) | 2 (22.2%) |
| College or Associate's Degree | 13 (65.0%) | 7 (35.0%) |
| Bachelor's Degree | 30 (100.0%) | 0 (0.0%) |
| Graduate Degree | 0 (0.0%) | 0 (0.0%) |
| Total | 50 (84.8%) | 9 (15.2%) |
Income in Stark County
Income Overview in Stark County
Per Capita Income in Stark County is $32,618, while median incomes of families and households are $79,254 and $58,125 respectively.
| Characteristic | Number | Measure |
| Per Capita Income | 5,395 | $32,618 |
| Median Family Income | 1,414 | $79,254 |
| Mean Family Income | 1,414 | $96,312 |
| Median Household Income | 2,326 | $58,125 |
| Mean Household Income | 2,326 | $75,678 |
| Income Deficit | 1,414 | $0 |
| Wage / Income Gap (%) | 5,395 | 30.68% |
| Wage / Income Gap ($) | 5,395 | 69.32¢ per $1 |
| Gini / Inequality Index | 5,395 | 0.45 |
Earnings by Sex in Stark County
Average Earnings in Stark County are $39,432, $46,157 for men and $31,996 for women, a difference of 30.7%.

| Sex | Number | Average Earnings |
| Male | 1,454 (55.1%) | $46,157 |
| Female | 1,183 (44.9%) | $31,996 |
| Total | 2,637 (100.0%) | $39,432 |
Earnings by Sex by Income Bracket in Stark County
The most common earnings brackets in Stark County are $55,000 to $64,999 for men (154 | 10.6%) and $30,000 to $34,999 for women (111 | 9.4%).

| Income | Male | Female |
| $2,499 or less | 45 (3.1%) | 67 (5.7%) |
| $2,500 to $4,999 | 12 (0.8%) | 33 (2.8%) |
| $5,000 to $7,499 | 38 (2.6%) | 49 (4.1%) |
| $7,500 to $9,999 | 45 (3.1%) | 23 (1.9%) |
| $10,000 to $12,499 | 37 (2.5%) | 57 (4.8%) |
| $12,500 to $14,999 | 45 (3.1%) | 65 (5.5%) |
| $15,000 to $17,499 | 13 (0.9%) | 19 (1.6%) |
| $17,500 to $19,999 | 14 (1.0%) | 42 (3.5%) |
| $20,000 to $22,499 | 21 (1.4%) | 62 (5.2%) |
| $22,500 to $24,999 | 50 (3.4%) | 47 (4.0%) |
| $25,000 to $29,999 | 100 (6.9%) | 78 (6.6%) |
| $30,000 to $34,999 | 105 (7.2%) | 111 (9.4%) |
| $35,000 to $39,999 | 68 (4.7%) | 90 (7.6%) |
| $40,000 to $44,999 | 103 (7.1%) | 92 (7.8%) |
| $45,000 to $49,999 | 104 (7.1%) | 41 (3.5%) |
| $50,000 to $54,999 | 70 (4.8%) | 80 (6.8%) |
| $55,000 to $64,999 | 154 (10.6%) | 95 (8.0%) |
| $65,000 to $74,999 | 139 (9.6%) | 34 (2.9%) |
| $75,000 to $99,999 | 145 (10.0%) | 52 (4.4%) |
| $100,000+ | 146 (10.0%) | 46 (3.9%) |
| Total | 1,454 (100.0%) | 1,183 (100.0%) |
Earnings by Sex by Educational Attainment in Stark County
Average earnings in Stark County are $49,122 for men and $35,822 for women, a difference of 27.1%. Men with an educational attainment of graduate degree enjoy the highest average annual earnings of $92,750, while those with less than high school education earn the least with $28,281. Women with an educational attainment of graduate degree earn the most with the average annual earnings of $90,500, while those with high school diploma education have the smallest earnings of $26,250.

| Educational Attainment | Male Income | Female Income |
| Less than High School | $28,281 | $31,250 |
| High School Diploma | $44,103 | $26,250 |
| College or Associate's Degree | $58,882 | $33,472 |
| Bachelor's Degree | $86,719 | $46,339 |
| Graduate Degree | $92,750 | $90,500 |
| Total | $49,122 | $35,822 |
Family Income in Stark County
Family Income Brackets in Stark County
According to the Stark County family income data, there are 311 families falling into the $100,000 to $149,999 income range, which is the most common income bracket and makes up 22.0% of all families. Conversely, the $10,000 to $14,999 income bracket is the least frequent group with only 24 families (1.7%) belonging to this category.
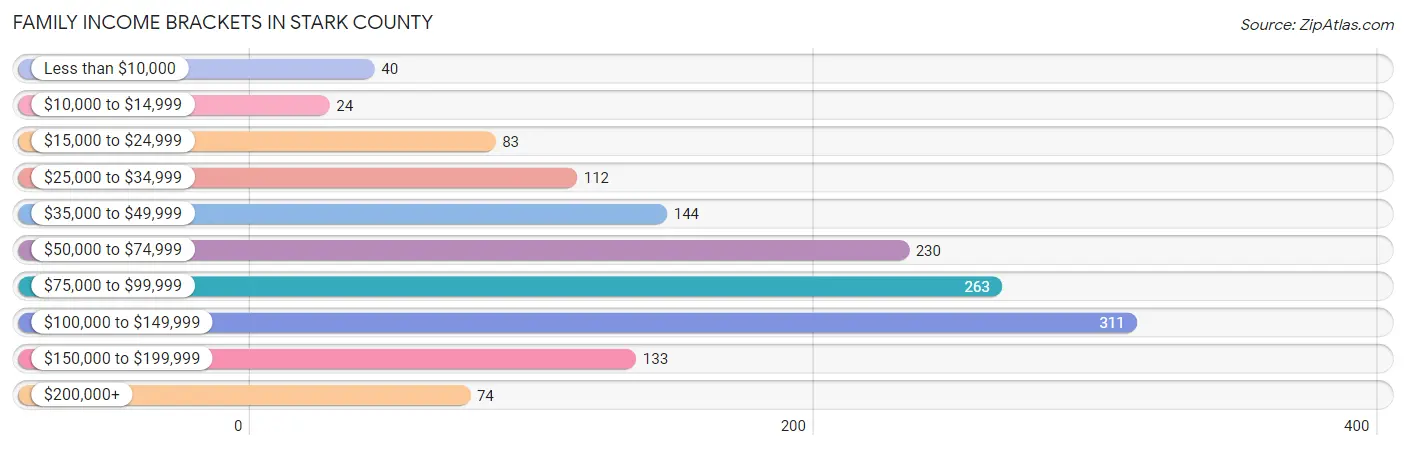
| Income Bracket | # Families | % Families |
| Less than $10,000 | 40 | 2.8% |
| $10,000 to $14,999 | 24 | 1.7% |
| $15,000 to $24,999 | 83 | 5.9% |
| $25,000 to $34,999 | 112 | 7.9% |
| $35,000 to $49,999 | 144 | 10.2% |
| $50,000 to $74,999 | 230 | 16.3% |
| $75,000 to $99,999 | 263 | 18.6% |
| $100,000 to $149,999 | 311 | 22.0% |
| $150,000 to $199,999 | 133 | 9.4% |
| $200,000+ | 74 | 5.2% |
Family Income by Famaliy Size in Stark County
4-person families (227 | 16.1%) account for the highest median family income in Stark County with $101,875 per family, while 2-person families (764 | 54.0%) have the highest median income of $32,404 per family member.

| Income Bracket | # Families | Median Income |
| 2-Person Families | 764 (54.0%) | $64,808 |
| 3-Person Families | 234 (16.6%) | $90,893 |
| 4-Person Families | 227 (16.1%) | $101,875 |
| 5-Person Families | 120 (8.5%) | $101,667 |
| 6-Person Families | 66 (4.7%) | $82,500 |
| 7+ Person Families | 3 (0.2%) | $0 |
| Total | 1,414 (100.0%) | $79,254 |
Family Income by Number of Earners in Stark County
The median family income in Stark County is $79,254, with families comprising 3+ earners (116) having the highest median family income of $150,833, while families with no earners (234) have the lowest median family income of $45,000, accounting for 8.2% and 16.6% of families, respectively.

| Number of Earners | # Families | Median Income |
| No Earners | 234 (16.6%) | $45,000 |
| 1 Earner | 495 (35.0%) | $60,938 |
| 2 Earners | 569 (40.2%) | $103,393 |
| 3+ Earners | 116 (8.2%) | $150,833 |
| Total | 1,414 (100.0%) | $79,254 |
Household Income in Stark County
Household Income Brackets in Stark County
With 365 households falling in the category, the $100,000 to $149,999 income range is the most frequent in Stark County, accounting for 15.7% of all households. In contrast, only 77 households (3.3%) fall into the $200,000+ income bracket, making it the least populous group.

| Income Bracket | # Households | % Households |
| Less than $10,000 | 102 | 4.4% |
| $10,000 to $14,999 | 144 | 6.2% |
| $15,000 to $24,999 | 221 | 9.5% |
| $25,000 to $34,999 | 291 | 12.5% |
| $35,000 to $49,999 | 272 | 11.7% |
| $50,000 to $74,999 | 351 | 15.1% |
| $75,000 to $99,999 | 363 | 15.6% |
| $100,000 to $149,999 | 365 | 15.7% |
| $150,000 to $199,999 | 142 | 6.1% |
| $200,000+ | 77 | 3.3% |
Household Income by Householder Age in Stark County
The median household income in Stark County is $58,125, with the highest median household income of $77,594 found in the 45 to 64 years age bracket for the primary householder. A total of 811 households (34.9%) fall into this category. Meanwhile, the 15 to 24 years age bracket for the primary householder has the lowest median household income of $0, with 97 households (4.2%) in this group.

| Income Bracket | # Households | Median Income |
| 15 to 24 Years | 97 (4.2%) | $0 |
| 25 to 44 Years | 604 (26.0%) | $71,154 |
| 45 to 64 Years | 811 (34.9%) | $77,594 |
| 65+ Years | 814 (35.0%) | $39,048 |
| Total | 2,326 (100.0%) | $58,125 |
Poverty in Stark County
Income Below Poverty by Sex and Age in Stark County
With 11.0% poverty level for males and 14.0% for females among the residents of Stark County, under 5 year old males and 15 year old females are the most vulnerable to poverty, with 49 males (33.8%) and 9 females (64.3%) in their respective age groups living below the poverty level.

| Age Bracket | Male | Female |
| Under 5 Years | 49 (33.8%) | 20 (14.4%) |
| 5 Years | 2 (5.7%) | 7 (13.7%) |
| 6 to 11 Years | 6 (3.9%) | 32 (15.1%) |
| 12 to 14 Years | 9 (7.6%) | 13 (24.5%) |
| 15 Years | 5 (7.9%) | 9 (64.3%) |
| 16 and 17 Years | 12 (25.0%) | 27 (35.1%) |
| 18 to 24 Years | 0 (0.0%) | 77 (39.1%) |
| 25 to 34 Years | 65 (22.4%) | 34 (12.9%) |
| 35 to 44 Years | 25 (8.0%) | 37 (12.8%) |
| 45 to 54 Years | 24 (7.1%) | 36 (10.7%) |
| 55 to 64 Years | 65 (15.9%) | 40 (10.7%) |
| 65 to 74 Years | 23 (7.4%) | 23 (7.0%) |
| 75 Years and over | 5 (2.3%) | 12 (4.3%) |
| Total | 290 (11.0%) | 367 (14.0%) |
Income Above Poverty by Sex and Age in Stark County
According to the poverty statistics in Stark County, males aged 18 to 24 years and females aged 75 years and over are the age groups that are most secure financially, with 100.0% of males and 95.7% of females in these age groups living above the poverty line.

| Age Bracket | Male | Female |
| Under 5 Years | 96 (66.2%) | 119 (85.6%) |
| 5 Years | 33 (94.3%) | 44 (86.3%) |
| 6 to 11 Years | 148 (96.1%) | 180 (84.9%) |
| 12 to 14 Years | 109 (92.4%) | 40 (75.5%) |
| 15 Years | 58 (92.1%) | 5 (35.7%) |
| 16 and 17 Years | 36 (75.0%) | 50 (64.9%) |
| 18 to 24 Years | 205 (100.0%) | 120 (60.9%) |
| 25 to 34 Years | 225 (77.6%) | 229 (87.1%) |
| 35 to 44 Years | 289 (92.0%) | 253 (87.2%) |
| 45 to 54 Years | 312 (92.9%) | 299 (89.2%) |
| 55 to 64 Years | 344 (84.1%) | 334 (89.3%) |
| 65 to 74 Years | 289 (92.6%) | 306 (93.0%) |
| 75 Years and over | 214 (97.7%) | 269 (95.7%) |
| Total | 2,358 (89.0%) | 2,248 (86.0%) |
Income Below Poverty Among Married-Couple Families in Stark County
The poverty statistics for married-couple families in Stark County show that 4.2% or 49 of the total 1,161 families live below the poverty line. Families with 3 or 4 children have the highest poverty rate of 18.8%, comprising of 21 families. On the other hand, families with 5 or more children have the lowest poverty rate of 0.0%, which includes 0 families.

| Children | Above Poverty | Below Poverty |
| No Children | 748 (98.0%) | 15 (2.0%) |
| 1 or 2 Children | 270 (95.4%) | 13 (4.6%) |
| 3 or 4 Children | 91 (81.2%) | 21 (18.8%) |
| 5 or more Children | 3 (100.0%) | 0 (0.0%) |
| Total | 1,112 (95.8%) | 49 (4.2%) |
Income Below Poverty Among Single-Parent Households in Stark County
According to the poverty data in Stark County, 33.0% or 31 single-father households and 21.4% or 34 single-mother households are living below the poverty line. Among single-father households, those with 1 or 2 children have the highest poverty rate, with 31 households (59.6%) experiencing poverty. Likewise, among single-mother households, those with 5 or more children have the highest poverty rate, with 8 households (100.0%) falling below the poverty line.

| Children | Single Father | Single Mother |
| No Children | 0 (0.0%) | 5 (6.9%) |
| 1 or 2 Children | 31 (59.6%) | 18 (29.0%) |
| 3 or 4 Children | 0 (0.0%) | 3 (17.6%) |
| 5 or more Children | 0 (0.0%) | 8 (100.0%) |
| Total | 31 (33.0%) | 34 (21.4%) |
Income Below Poverty Among Married-Couple vs Single-Parent Households in Stark County
The poverty data for Stark County shows that 49 of the married-couple family households (4.2%) and 65 of the single-parent households (25.7%) are living below the poverty level. Within the married-couple family households, those with 3 or 4 children have the highest poverty rate, with 21 households (18.8%) falling below the poverty line. Among the single-parent households, those with 5 or more children have the highest poverty rate, with 8 household (100.0%) living below poverty.

| Children | Married-Couple Families | Single-Parent Households |
| No Children | 15 (2.0%) | 5 (4.7%) |
| 1 or 2 Children | 13 (4.6%) | 49 (43.0%) |
| 3 or 4 Children | 21 (18.8%) | 3 (12.5%) |
| 5 or more Children | 0 (0.0%) | 8 (100.0%) |
| Total | 49 (4.2%) | 65 (25.7%) |
Employment Characteristics in Stark County
Employment by Class of Employer in Stark County
Among the 2,384 employed individuals in Stark County, private company employees (1,580 | 66.3%), not-for-profit organizations (241 | 10.1%), and self-employed (incorporated) (158 | 6.6%) make up the most common classes of employment.

| Employer Class | # Employees | % Employees |
| Private Company Employees | 1,580 | 66.3% |
| Self-Employed (Incorporated) | 158 | 6.6% |
| Self-Employed (Not Incorporated) | 146 | 6.1% |
| Not-for-profit Organizations | 241 | 10.1% |
| Local Government Employees | 97 | 4.1% |
| State Government Employees | 104 | 4.4% |
| Federal Government Employees | 49 | 2.1% |
| Unpaid Family Workers | 9 | 0.4% |
| Total | 2,384 | 100.0% |
Employment Status by Age in Stark County
According to the labor force statistics for Stark County, out of the total population over 16 years of age (4,377), 57.7% or 2,526 individuals are in the labor force, with 3.3% or 83 of them unemployed. The age group with the highest labor force participation rate is 25 to 29 years, with 87.1% or 249 individuals in the labor force. Within the labor force, the 16 to 19 years age range has the highest percentage of unemployed individuals, with 16.3% or 14 of them being unemployed.

| Age Bracket | In Labor Force | Unemployed |
| 16 to 19 Years | 85 (36.0%) | 14 (16.3%) |
| 20 to 24 Years | 212 (72.4%) | 10 (4.7%) |
| 25 to 29 Years | 249 (87.1%) | 1 (0.4%) |
| 30 to 34 Years | 217 (81.0%) | 0 (0.0%) |
| 35 to 44 Years | 521 (85.8%) | 5 (1.0%) |
| 45 to 54 Years | 548 (81.1%) | 19 (3.5%) |
| 55 to 59 Years | 263 (72.7%) | 22 (8.4%) |
| 60 to 64 Years | 218 (51.4%) | 7 (3.2%) |
| 65 to 74 Years | 145 (20.8%) | 7 (4.8%) |
| 75 Years and over | 69 (13.0%) | 0 (0.0%) |
| Total | 2,526 (57.7%) | 83 (3.3%) |
Employment Status by Educational Attainment in Stark County
According to labor force statistics for Stark County, 76.9% of individuals (2,017) out of the total population between 25 and 64 years of age (2,623) are in the labor force, with 2.7% or 54 of them being unemployed. The group with the highest labor force participation rate are those with the educational attainment of bachelor's degree or higher, with 83.9% or 481 individuals in the labor force. Within the labor force, individuals with less than high school education have the highest percentage of unemployment, with 9.8% or 14 of them being unemployed.

| Educational Attainment | In Labor Force | Unemployed |
| Less than High School | 143 (63.8%) | 22 (9.8%) |
| High School Diploma | 708 (73.1%) | 20 (2.1%) |
| College / Associate Degree | 684 (79.7%) | 27 (3.1%) |
| Bachelor's Degree or higher | 481 (83.9%) | 5 (0.8%) |
| Total | 2,017 (76.9%) | 71 (2.7%) |
Employment Occupations by Sex in Stark County
Management, Business, Science and Arts Occupations
The most common Management, Business, Science and Arts occupations in Stark County are Management (233 | 9.6%), Health Diagnosing & Treating (173 | 7.1%), Community & Social Service (166 | 6.8%), Health Technologists (118 | 4.8%), and Education Instruction & Library (116 | 4.8%).

Management, Business, Science and Arts Occupations by Sex
Within the Management, Business, Science and Arts occupations in Stark County, the most male-oriented occupations are Computers & Mathematics (100.0%), Life, Physical & Social Science (100.0%), and Legal Services & Support (100.0%), while the most female-oriented occupations are Education Instruction & Library (90.5%), Community & Social Service (86.1%), and Education, Arts & Media (85.3%).

| Occupation | Male | Female |
| Management | 168 (72.1%) | 65 (27.9%) |
| Business & Financial | 32 (30.8%) | 72 (69.2%) |
| Computers, Engineering & Science | 54 (88.5%) | 7 (11.5%) |
| Computers & Mathematics | 9 (100.0%) | 0 (0.0%) |
| Architecture & Engineering | 35 (83.3%) | 7 (16.7%) |
| Life, Physical & Social Science | 10 (100.0%) | 0 (0.0%) |
| Community & Social Service | 23 (13.9%) | 143 (86.1%) |
| Education, Arts & Media | 5 (14.7%) | 29 (85.3%) |
| Legal Services & Support | 4 (100.0%) | 0 (0.0%) |
| Education Instruction & Library | 11 (9.5%) | 105 (90.5%) |
| Arts, Media & Entertainment | 3 (25.0%) | 9 (75.0%) |
| Health Diagnosing & Treating | 51 (29.5%) | 122 (70.5%) |
| Health Technologists | 33 (28.0%) | 85 (72.0%) |
| Total (Category) | 328 (44.5%) | 409 (55.5%) |
| Total (Overall) | 1,335 (54.8%) | 1,103 (45.2%) |
Services Occupations
The most common Services occupations in Stark County are Healthcare Support (105 | 4.3%), Cleaning & Maintenance (90 | 3.7%), Food Preparation & Serving (83 | 3.4%), Security & Protection (50 | 2.1%), and Law Enforcement (42 | 1.7%).

Services Occupations by Sex
Within the Services occupations in Stark County, the most male-oriented occupations are Law Enforcement (100.0%), Security & Protection (92.0%), and Cleaning & Maintenance (60.0%), while the most female-oriented occupations are Healthcare Support (100.0%), Personal Care & Service (100.0%), and Food Preparation & Serving (87.9%).

| Occupation | Male | Female |
| Healthcare Support | 0 (0.0%) | 105 (100.0%) |
| Security & Protection | 46 (92.0%) | 4 (8.0%) |
| Firefighting & Prevention | 4 (50.0%) | 4 (50.0%) |
| Law Enforcement | 42 (100.0%) | 0 (0.0%) |
| Food Preparation & Serving | 10 (12.0%) | 73 (87.9%) |
| Cleaning & Maintenance | 54 (60.0%) | 36 (40.0%) |
| Personal Care & Service | 0 (0.0%) | 13 (100.0%) |
| Total (Category) | 110 (32.3%) | 231 (67.7%) |
| Total (Overall) | 1,335 (54.8%) | 1,103 (45.2%) |
Sales and Office Occupations
The most common Sales and Office occupations in Stark County are Office & Administration (360 | 14.8%), and Sales & Related (185 | 7.6%).

Sales and Office Occupations by Sex
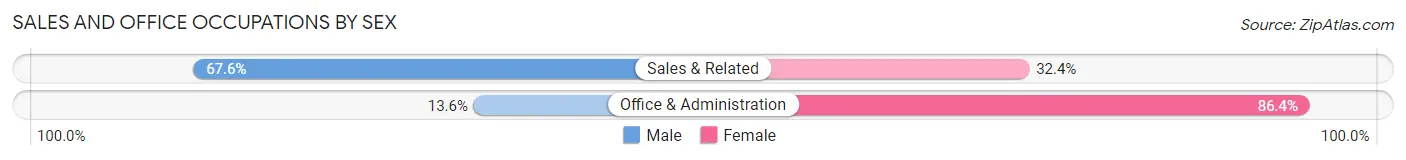
| Occupation | Male | Female |
| Sales & Related | 125 (67.6%) | 60 (32.4%) |
| Office & Administration | 49 (13.6%) | 311 (86.4%) |
| Total (Category) | 174 (31.9%) | 371 (68.1%) |
| Total (Overall) | 1,335 (54.8%) | 1,103 (45.2%) |
Natural Resources, Construction and Maintenance Occupations
The most common Natural Resources, Construction and Maintenance occupations in Stark County are Construction & Extraction (210 | 8.6%), Installation, Maintenance & Repair (147 | 6.0%), and Farming, Fishing & Forestry (40 | 1.6%).

Natural Resources, Construction and Maintenance Occupations by Sex
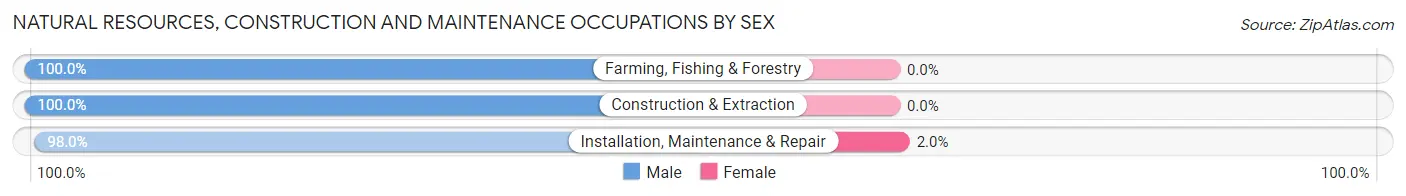
| Occupation | Male | Female |
| Farming, Fishing & Forestry | 40 (100.0%) | 0 (0.0%) |
| Construction & Extraction | 210 (100.0%) | 0 (0.0%) |
| Installation, Maintenance & Repair | 144 (98.0%) | 3 (2.0%) |
| Total (Category) | 394 (99.2%) | 3 (0.8%) |
| Total (Overall) | 1,335 (54.8%) | 1,103 (45.2%) |
Production, Transportation and Moving Occupations
The most common Production, Transportation and Moving occupations in Stark County are Production (247 | 10.1%), Material Moving (94 | 3.9%), and Transportation (77 | 3.2%).

Production, Transportation and Moving Occupations by Sex

| Occupation | Male | Female |
| Production | 195 (78.9%) | 52 (21.0%) |
| Transportation | 77 (100.0%) | 0 (0.0%) |
| Material Moving | 57 (60.6%) | 37 (39.4%) |
| Total (Category) | 329 (78.7%) | 89 (21.3%) |
| Total (Overall) | 1,335 (54.8%) | 1,103 (45.2%) |
Employment Industries by Sex in Stark County
Employment Industries in Stark County
The major employment industries in Stark County include Manufacturing (378 | 15.5%), Retail Trade (325 | 13.3%), Health Care & Social Assistance (321 | 13.2%), Construction (244 | 10.0%), and Agriculture, Fishing & Hunting (169 | 6.9%).

Employment Industries by Sex in Stark County
The Stark County industries that see more men than women are Utilities (100.0%), Agriculture, Fishing & Hunting (92.9%), and Information (84.9%), whereas the industries that tend to have a higher number of women are Real Estate, Rental & Leasing (100.0%), Enterprise Management (100.0%), and Health Care & Social Assistance (84.1%).

| Industry | Male | Female |
| Agriculture, Fishing & Hunting | 157 (92.9%) | 12 (7.1%) |
| Mining, Quarrying, & Extraction | 0 (0.0%) | 0 (0.0%) |
| Construction | 203 (83.2%) | 41 (16.8%) |
| Manufacturing | 278 (73.5%) | 100 (26.5%) |
| Wholesale Trade | 46 (65.7%) | 24 (34.3%) |
| Retail Trade | 178 (54.8%) | 147 (45.2%) |
| Transportation & Warehousing | 87 (73.1%) | 32 (26.9%) |
| Utilities | 13 (100.0%) | 0 (0.0%) |
| Information | 28 (84.9%) | 5 (15.1%) |
| Finance & Insurance | 34 (25.4%) | 100 (74.6%) |
| Real Estate, Rental & Leasing | 0 (0.0%) | 4 (100.0%) |
| Professional & Scientific | 21 (25.6%) | 61 (74.4%) |
| Enterprise Management | 0 (0.0%) | 18 (100.0%) |
| Administrative & Support | 30 (47.6%) | 33 (52.4%) |
| Educational Services | 42 (26.8%) | 115 (73.3%) |
| Health Care & Social Assistance | 51 (15.9%) | 270 (84.1%) |
| Arts, Entertainment & Recreation | 7 (63.6%) | 4 (36.4%) |
| Accommodation & Food Services | 18 (18.2%) | 81 (81.8%) |
| Public Administration | 50 (67.6%) | 24 (32.4%) |
| Total | 1,335 (54.8%) | 1,103 (45.2%) |
Education in Stark County
School Enrollment in Stark County
The most common levels of schooling among the 1,001 students in Stark County are middle school (300 | 30.0%), elementary school (231 | 23.1%), and high school (205 | 20.5%).

| School Level | # Students | % Students |
| Nursery / Preschool | 31 | 3.1% |
| Kindergarten | 106 | 10.6% |
| Elementary School | 231 | 23.1% |
| Middle School | 300 | 30.0% |
| High School | 205 | 20.5% |
| College / Undergraduate | 113 | 11.3% |
| Graduate / Professional | 15 | 1.5% |
| Total | 1,001 | 100.0% |
School Enrollment by Age by Funding Source in Stark County
Out of a total of 1,001 students who are enrolled in schools in Stark County, 106 (10.6%) attend a private institution, while the remaining 895 (89.4%) are enrolled in public schools. The age group of 25 to 34 year olds has the highest likelihood of being enrolled in private schools, with 17 (46.0% in the age bracket) enrolled. Conversely, the age group of 3 to 4 year olds has the lowest likelihood of being enrolled in a private school, with 20 (100.0% in the age bracket) attending a public institution.

| Age Bracket | Public School | Private School |
| 3 to 4 Year Olds | 20 (100.0%) | 0 (0.0%) |
| 5 to 9 Year Old | 270 (81.8%) | 60 (18.2%) |
| 10 to 14 Year Olds | 322 (99.4%) | 2 (0.6%) |
| 15 to 17 Year Olds | 182 (95.3%) | 9 (4.7%) |
| 18 to 19 Year Olds | 40 (74.1%) | 14 (25.9%) |
| 20 to 24 Year Olds | 25 (86.2%) | 4 (13.8%) |
| 25 to 34 Year Olds | 20 (54.0%) | 17 (46.0%) |
| 35 Years and over | 16 (100.0%) | 0 (0.0%) |
| Total | 895 (89.4%) | 106 (10.6%) |
Educational Attainment by Field of Study in Stark County
Education (185 | 23.8%), science & technology (127 | 16.3%), business (114 | 14.6%), bio, nature & agricultural (83 | 10.7%), and engineering (68 | 8.7%) are the most common fields of study among 778 individuals in Stark County who have obtained a bachelor's degree or higher.
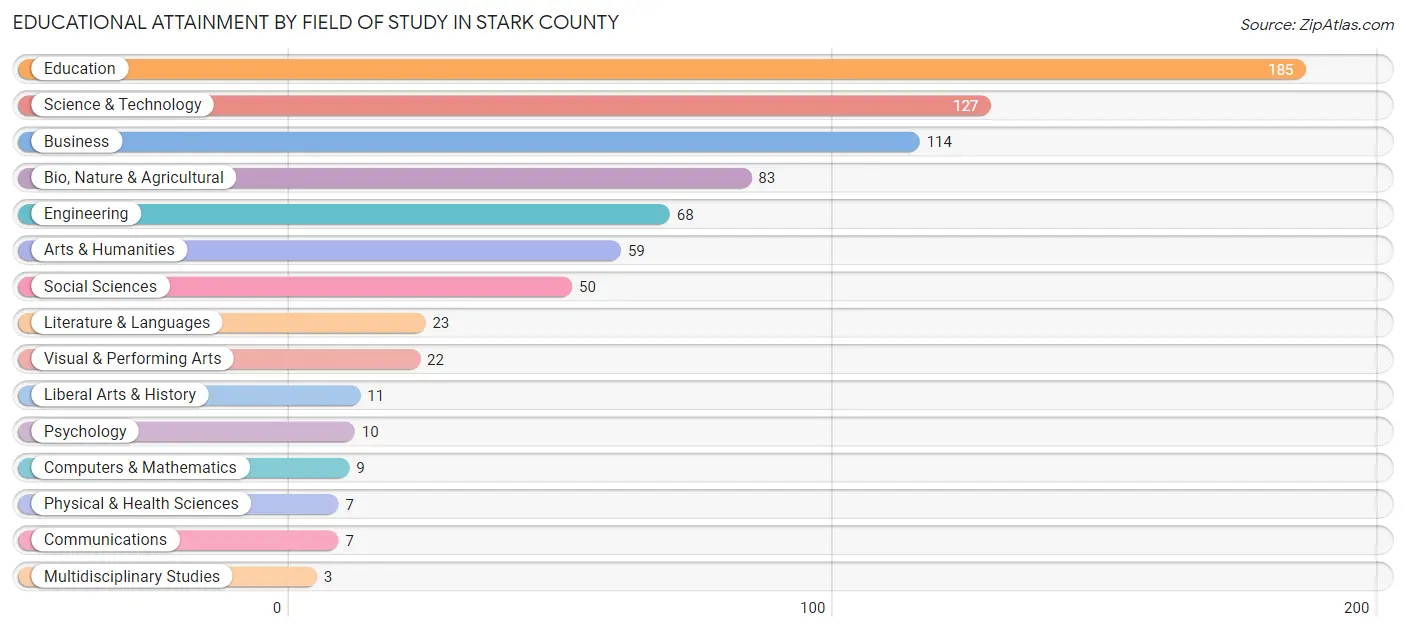
| Field of Study | # Graduates | % Graduates |
| Computers & Mathematics | 9 | 1.2% |
| Bio, Nature & Agricultural | 83 | 10.7% |
| Physical & Health Sciences | 7 | 0.9% |
| Psychology | 10 | 1.3% |
| Social Sciences | 50 | 6.4% |
| Engineering | 68 | 8.7% |
| Multidisciplinary Studies | 3 | 0.4% |
| Science & Technology | 127 | 16.3% |
| Business | 114 | 14.6% |
| Education | 185 | 23.8% |
| Literature & Languages | 23 | 3.0% |
| Liberal Arts & History | 11 | 1.4% |
| Visual & Performing Arts | 22 | 2.8% |
| Communications | 7 | 0.9% |
| Arts & Humanities | 59 | 7.6% |
| Total | 778 | 100.0% |
Transportation & Commute in Stark County
Vehicle Availability by Sex in Stark County
The most prevalent vehicle ownership categories in Stark County are males with 2 vehicles (511, accounting for 38.5%) and females with 2 vehicles (418, making up 48.4%).
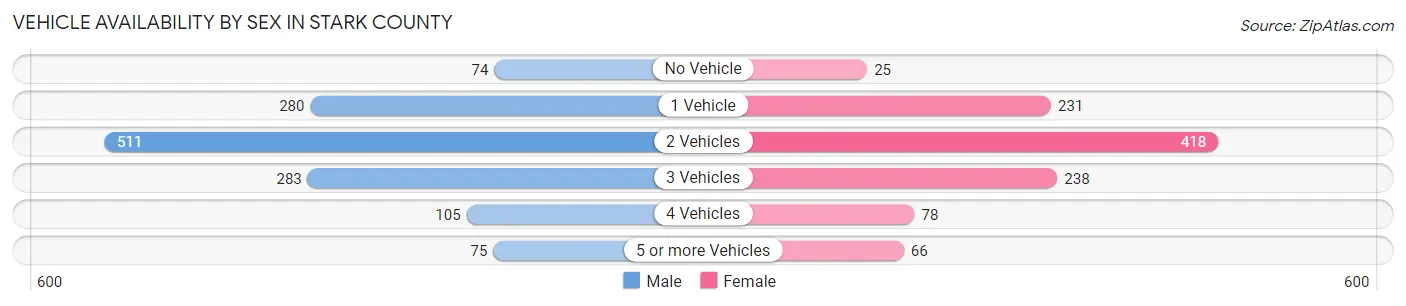
| Vehicles Available | Male | Female |
| No Vehicle | 74 (5.6%) | 25 (2.4%) |
| 1 Vehicle | 280 (21.1%) | 231 (21.9%) |
| 2 Vehicles | 511 (38.5%) | 418 (39.6%) |
| 3 Vehicles | 283 (21.3%) | 238 (22.5%) |
| 4 Vehicles | 105 (7.9%) | 78 (7.4%) |
| 5 or more Vehicles | 75 (5.7%) | 66 (6.2%) |
| Total | 1,328 (100.0%) | 1,056 (100.0%) |
Commute Time in Stark County
The most frequently occuring commute durations in Stark County are 30 to 34 minutes (313 commuters, 14.1%), 45 to 59 minutes (307 commuters, 13.8%), and 10 to 14 minutes (288 commuters, 13.0%).

| Commute Time | # Commuters | % Commuters |
| Less than 5 Minutes | 241 | 10.9% |
| 5 to 9 Minutes | 271 | 12.2% |
| 10 to 14 Minutes | 288 | 13.0% |
| 15 to 19 Minutes | 112 | 5.1% |
| 20 to 24 Minutes | 218 | 9.8% |
| 25 to 29 Minutes | 160 | 7.2% |
| 30 to 34 Minutes | 313 | 14.1% |
| 35 to 39 Minutes | 80 | 3.6% |
| 40 to 44 Minutes | 89 | 4.0% |
| 45 to 59 Minutes | 307 | 13.8% |
| 60 to 89 Minutes | 94 | 4.2% |
| 90 or more Minutes | 46 | 2.1% |
Commute Time by Sex in Stark County
The most common commute times in Stark County are 30 to 34 minutes (162 commuters, 13.4%) for males and 45 to 59 minutes (156 commuters, 15.5%) for females.

| Commute Time | Male | Female |
| Less than 5 Minutes | 120 (9.9%) | 121 (12.0%) |
| 5 to 9 Minutes | 148 (12.2%) | 123 (12.2%) |
| 10 to 14 Minutes | 152 (12.6%) | 136 (13.5%) |
| 15 to 19 Minutes | 62 (5.1%) | 50 (5.0%) |
| 20 to 24 Minutes | 158 (13.1%) | 60 (5.9%) |
| 25 to 29 Minutes | 88 (7.3%) | 72 (7.1%) |
| 30 to 34 Minutes | 162 (13.4%) | 151 (15.0%) |
| 35 to 39 Minutes | 56 (4.6%) | 24 (2.4%) |
| 40 to 44 Minutes | 24 (2.0%) | 65 (6.5%) |
| 45 to 59 Minutes | 151 (12.5%) | 156 (15.5%) |
| 60 to 89 Minutes | 44 (3.6%) | 50 (5.0%) |
| 90 or more Minutes | 46 (3.8%) | 0 (0.0%) |
Time of Departure to Work by Sex in Stark County
The most frequent times of departure to work in Stark County are 6:00 AM to 6:29 AM (229, 18.9%) for males and 7:00 AM to 7:29 AM (192, 19.1%) for females.

| Time of Departure | Male | Female |
| 12:00 AM to 4:59 AM | 72 (5.9%) | 56 (5.6%) |
| 5:00 AM to 5:29 AM | 101 (8.3%) | 43 (4.3%) |
| 5:30 AM to 5:59 AM | 143 (11.8%) | 29 (2.9%) |
| 6:00 AM to 6:29 AM | 229 (18.9%) | 92 (9.1%) |
| 6:30 AM to 6:59 AM | 189 (15.6%) | 114 (11.3%) |
| 7:00 AM to 7:29 AM | 176 (14.5%) | 192 (19.1%) |
| 7:30 AM to 7:59 AM | 120 (9.9%) | 141 (14.0%) |
| 8:00 AM to 8:29 AM | 43 (3.5%) | 137 (13.6%) |
| 8:30 AM to 8:59 AM | 17 (1.4%) | 42 (4.2%) |
| 9:00 AM to 9:59 AM | 48 (4.0%) | 55 (5.5%) |
| 10:00 AM to 10:59 AM | 10 (0.8%) | 13 (1.3%) |
| 11:00 AM to 11:59 AM | 0 (0.0%) | 6 (0.6%) |
| 12:00 PM to 3:59 PM | 32 (2.6%) | 55 (5.5%) |
| 4:00 PM to 11:59 PM | 31 (2.6%) | 33 (3.3%) |
| Total | 1,211 (100.0%) | 1,008 (100.0%) |
Housing Occupancy in Stark County
Occupancy by Ownership in Stark County
Of the total 2,326 dwellings in Stark County, owner-occupied units account for 1,767 (76.0%), while renter-occupied units make up 559 (24.0%).
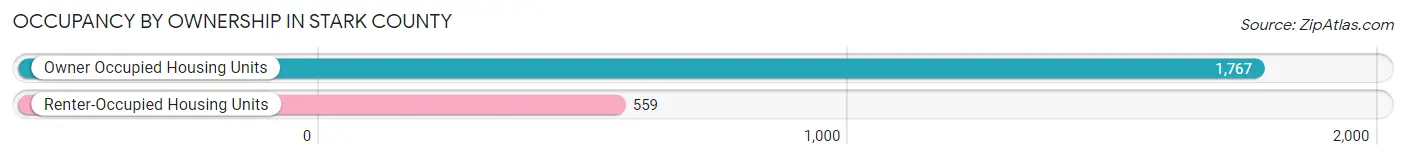
| Occupancy | # Housing Units | % Housing Units |
| Owner Occupied Housing Units | 1,767 | 76.0% |
| Renter-Occupied Housing Units | 559 | 24.0% |
| Total Occupied Housing Units | 2,326 | 100.0% |
Occupancy by Household Size in Stark County

| Household Size | # Housing Units | % Housing Units |
| 1-Person Household | 830 | 35.7% |
| 2-Person Household | 782 | 33.6% |
| 3-Person Household | 263 | 11.3% |
| 4+ Person Household | 451 | 19.4% |
| Total Housing Units | 2,326 | 100.0% |
Occupancy by Ownership by Household Size in Stark County

| Household Size | Owner-occupied | Renter-occupied |
| 1-Person Household | 536 (64.6%) | 294 (35.4%) |
| 2-Person Household | 692 (88.5%) | 90 (11.5%) |
| 3-Person Household | 182 (69.2%) | 81 (30.8%) |
| 4+ Person Household | 357 (79.2%) | 94 (20.8%) |
| Total Housing Units | 1,767 (76.0%) | 559 (24.0%) |
Occupancy by Educational Attainment in Stark County

| Household Size | Owner-occupied | Renter-occupied |
| Less than High School | 125 (59.8%) | 84 (40.2%) |
| High School Diploma | 708 (72.8%) | 265 (27.2%) |
| College/Associate Degree | 596 (83.7%) | 116 (16.3%) |
| Bachelor's Degree or higher | 338 (78.2%) | 94 (21.8%) |
Occupancy by Age of Householder in Stark County

| Age Bracket | # Households | % Households |
| Under 35 Years | 360 | 15.5% |
| 35 to 44 Years | 341 | 14.7% |
| 45 to 54 Years | 399 | 17.2% |
| 55 to 64 Years | 412 | 17.7% |
| 65 to 74 Years | 414 | 17.8% |
| 75 to 84 Years | 296 | 12.7% |
| 85 Years and Over | 104 | 4.5% |
| Total | 2,326 | 100.0% |
Housing Finances in Stark County
Median Income by Occupancy in Stark County

| Occupancy Type | # Households | Median Income |
| Owner-Occupied | 1,767 (76.0%) | $66,815 |
| Renter-Occupied | 559 (24.0%) | $36,350 |
| Average | 2,326 (100.0%) | $58,125 |
Occupancy by Householder Income Bracket in Stark County

| Income Bracket | Owner-occupied | Renter-occupied |
| Less than $5,000 | 35 (2.0%) | 38 (6.8%) |
| $5,000 to $9,999 | 12 (0.7%) | 17 (3.0%) |
| $10,000 to $14,999 | 47 (2.7%) | 97 (17.3%) |
| $15,000 to $19,999 | 92 (5.2%) | 32 (5.7%) |
| $20,000 to $24,999 | 66 (3.7%) | 30 (5.4%) |
| $25,000 to $34,999 | 239 (13.5%) | 52 (9.3%) |
| $35,000 to $49,999 | 188 (10.6%) | 83 (14.8%) |
| $50,000 to $74,999 | 249 (14.1%) | 102 (18.2%) |
| $75,000 to $99,999 | 301 (17.0%) | 62 (11.1%) |
| $100,000 to $149,999 | 337 (19.1%) | 28 (5.0%) |
| $150,000 or more | 201 (11.4%) | 18 (3.2%) |
| Total | 1,767 (100.0%) | 559 (100.0%) |
Monthly Housing Cost Tiers in Stark County

| Monthly Cost | Owner-occupied | Renter-occupied |
| Less than $300 | 124 (7.0%) | 10 (1.8%) |
| $300 to $499 | 417 (23.6%) | 70 (12.5%) |
| $500 to $799 | 459 (26.0%) | 224 (40.1%) |
| $800 to $999 | 231 (13.1%) | 93 (16.6%) |
| $1,000 to $1,499 | 354 (20.0%) | 74 (13.2%) |
| $1,500 to $1,999 | 131 (7.4%) | 5 (0.9%) |
| $2,000 to $2,499 | 24 (1.4%) | 2 (0.4%) |
| $2,500 to $2,999 | 9 (0.5%) | 0 (0.0%) |
| $3,000 or more | 18 (1.0%) | 0 (0.0%) |
| Total | 1,767 (100.0%) | 559 (100.0%) |
Physical Housing Characteristics in Stark County
Housing Structures in Stark County

| Structure Type | # Housing Units | % Housing Units |
| Single Unit, Detached | 2,076 | 89.2% |
| Single Unit, Attached | 16 | 0.7% |
| 2 Unit Apartments | 58 | 2.5% |
| 3 or 4 Unit Apartments | 78 | 3.4% |
| 5 to 9 Unit Apartments | 50 | 2.1% |
| 10 or more Apartments | 3 | 0.1% |
| Mobile Home / Other | 45 | 1.9% |
| Total | 2,326 | 100.0% |
Housing Structures by Occupancy in Stark County

| Structure Type | Owner-occupied | Renter-occupied |
| Single Unit, Detached | 1,724 (83.0%) | 352 (17.0%) |
| Single Unit, Attached | 4 (25.0%) | 12 (75.0%) |
| 2 Unit Apartments | 5 (8.6%) | 53 (91.4%) |
| 3 or 4 Unit Apartments | 0 (0.0%) | 78 (100.0%) |
| 5 to 9 Unit Apartments | 6 (12.0%) | 44 (88.0%) |
| 10 or more Apartments | 0 (0.0%) | 3 (100.0%) |
| Mobile Home / Other | 28 (62.2%) | 17 (37.8%) |
| Total | 1,767 (76.0%) | 559 (24.0%) |
Housing Structures by Number of Rooms in Stark County
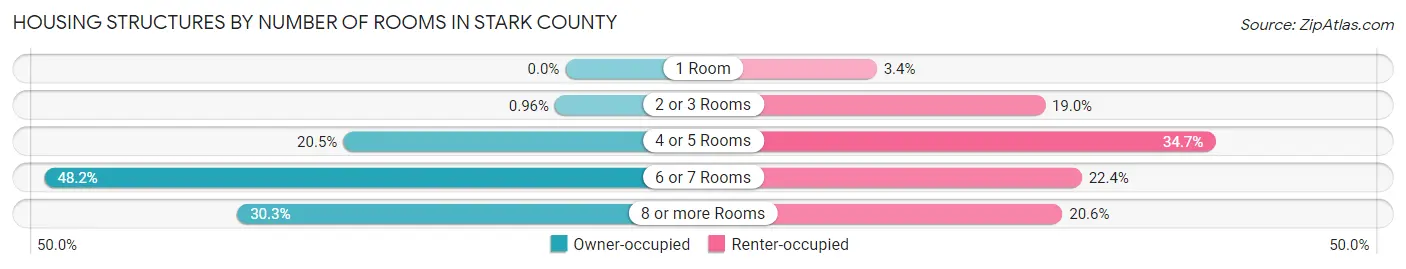
| Number of Rooms | Owner-occupied | Renter-occupied |
| 1 Room | 0 (0.0%) | 19 (3.4%) |
| 2 or 3 Rooms | 17 (1.0%) | 106 (19.0%) |
| 4 or 5 Rooms | 363 (20.5%) | 194 (34.7%) |
| 6 or 7 Rooms | 851 (48.2%) | 125 (22.4%) |
| 8 or more Rooms | 536 (30.3%) | 115 (20.6%) |
| Total | 1,767 (100.0%) | 559 (100.0%) |
Housing Structure by Heating Type in Stark County

| Heating Type | Owner-occupied | Renter-occupied |
| Utility Gas | 1,031 (58.4%) | 264 (47.2%) |
| Bottled, Tank, or LP Gas | 449 (25.4%) | 71 (12.7%) |
| Electricity | 254 (14.4%) | 219 (39.2%) |
| Fuel Oil or Kerosene | 3 (0.2%) | 0 (0.0%) |
| Coal or Coke | 0 (0.0%) | 0 (0.0%) |
| All other Fuels | 23 (1.3%) | 0 (0.0%) |
| No Fuel Used | 7 (0.4%) | 5 (0.9%) |
| Total | 1,767 (100.0%) | 559 (100.0%) |
Household Vehicle Usage in Stark County

| Vehicles per Household | Owner-occupied | Renter-occupied |
| No Vehicle | 54 (3.1%) | 48 (8.6%) |
| 1 Vehicle | 491 (27.8%) | 346 (61.9%) |
| 2 Vehicles | 756 (42.8%) | 102 (18.2%) |
| 3 or more Vehicles | 466 (26.4%) | 63 (11.3%) |
| Total | 1,767 (100.0%) | 559 (100.0%) |
Real Estate & Mortgages in Stark County
Real Estate and Mortgage Overview in Stark County
| Characteristic | Without Mortgage | With Mortgage |
| Housing Units | 906 | 861 |
| Median Property Value | $96,000 | $95,800 |
| Median Household Income | $51,765 | $149 |
| Monthly Housing Costs | $469 | $18 |
| Real Estate Taxes | $1,512 | $15 |
Property Value by Mortgage Status in Stark County

| Property Value | Without Mortgage | With Mortgage |
| Less than $50,000 | 116 (12.8%) | 93 (10.8%) |
| $50,000 to $99,999 | 368 (40.6%) | 362 (42.0%) |
| $100,000 to $299,999 | 373 (41.2%) | 344 (40.0%) |
| $300,000 to $499,999 | 36 (4.0%) | 31 (3.6%) |
| $500,000 to $749,999 | 0 (0.0%) | 28 (3.3%) |
| $750,000 to $999,999 | 13 (1.4%) | 0 (0.0%) |
| $1,000,000 or more | 0 (0.0%) | 3 (0.4%) |
| Total | 906 (100.0%) | 861 (100.0%) |
Household Income by Mortgage Status in Stark County

| Household Income | Without Mortgage | With Mortgage |
| Less than $10,000 | 38 (4.2%) | 9 (1.1%) |
| $10,000 to $24,999 | 142 (15.7%) | 9 (1.1%) |
| $25,000 to $34,999 | 137 (15.1%) | 63 (7.3%) |
| $35,000 to $49,999 | 124 (13.7%) | 102 (11.8%) |
| $50,000 to $74,999 | 135 (14.9%) | 64 (7.4%) |
| $75,000 to $99,999 | 156 (17.2%) | 114 (13.2%) |
| $100,000 to $149,999 | 122 (13.5%) | 145 (16.8%) |
| $150,000 or more | 52 (5.7%) | 215 (25.0%) |
| Total | 906 (100.0%) | 861 (100.0%) |
Property Value to Household Income Ratio in Stark County

| Value-to-Income Ratio | Without Mortgage | With Mortgage |
| Less than 2.0x | 430 (47.5%) | 88,454 (10,273.4%) |
| 2.0x to 2.9x | 202 (22.3%) | 617 (71.7%) |
| 3.0x to 3.9x | 103 (11.4%) | 82 (9.5%) |
| 4.0x or more | 151 (16.7%) | 60 (7.0%) |
| Total | 906 (100.0%) | 861 (100.0%) |
Real Estate Taxes by Mortgage Status in Stark County

| Property Taxes | Without Mortgage | With Mortgage |
| Less than $800 | 151 (16.7%) | 0 (0.0%) |
| $800 to $1,499 | 284 (31.4%) | 114 (13.2%) |
| $800 to $1,499 | 438 (48.3%) | 196 (22.8%) |
| Total | 906 (100.0%) | 861 (100.0%) |
Health & Disability in Stark County
Health Insurance Coverage by Age in Stark County

| Age Bracket | With Coverage | Without Coverage |
| Under 6 Years | 361 (97.6%) | 9 (2.4%) |
| 6 to 18 Years | 797 (97.4%) | 21 (2.6%) |
| 19 to 25 Years | 399 (91.7%) | 36 (8.3%) |
| 26 to 34 Years | 427 (90.8%) | 43 (9.1%) |
| 35 to 44 Years | 550 (91.1%) | 54 (8.9%) |
| 45 to 54 Years | 632 (94.2%) | 39 (5.8%) |
| 55 to 64 Years | 696 (88.9%) | 87 (11.1%) |
| 65 to 74 Years | 634 (98.9%) | 7 (1.1%) |
| 75 Years and older | 495 (99.0%) | 5 (1.0%) |
| Total | 4,991 (94.3%) | 301 (5.7%) |
Health Insurance Coverage by Citizenship Status in Stark County

| Citizenship Status | With Coverage | Without Coverage |
| Native Born | 361 (97.6%) | 9 (2.4%) |
| Foreign Born, Citizen | 797 (97.4%) | 21 (2.6%) |
| Foreign Born, not a Citizen | 399 (91.7%) | 36 (8.3%) |
Health Insurance Coverage by Household Income in Stark County

| Household Income | With Coverage | Without Coverage |
| Under $25,000 | 681 (87.3%) | 99 (12.7%) |
| $25,000 to $49,999 | 800 (90.1%) | 88 (9.9%) |
| $50,000 to $74,999 | 748 (96.5%) | 27 (3.5%) |
| $75,000 to $99,999 | 978 (100.0%) | 0 (0.0%) |
| $100,000 and over | 1,784 (95.4%) | 87 (4.6%) |
Public vs Private Health Insurance Coverage by Age in Stark County
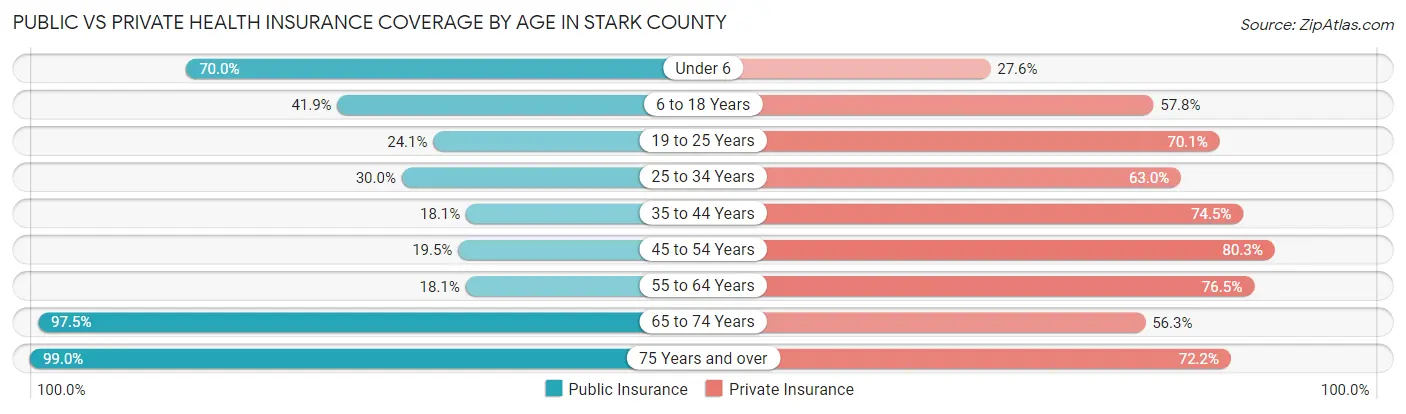
| Age Bracket | Public Insurance | Private Insurance |
| Under 6 | 259 (70.0%) | 102 (27.6%) |
| 6 to 18 Years | 343 (41.9%) | 473 (57.8%) |
| 19 to 25 Years | 105 (24.1%) | 305 (70.1%) |
| 25 to 34 Years | 141 (30.0%) | 296 (63.0%) |
| 35 to 44 Years | 109 (18.0%) | 450 (74.5%) |
| 45 to 54 Years | 131 (19.5%) | 539 (80.3%) |
| 55 to 64 Years | 142 (18.1%) | 599 (76.5%) |
| 65 to 74 Years | 625 (97.5%) | 361 (56.3%) |
| 75 Years and over | 495 (99.0%) | 361 (72.2%) |
| Total | 2,350 (44.4%) | 3,486 (65.9%) |
Disability Status by Sex by Age in Stark County

| Age Bracket | Male | Female |
| Under 5 Years | 0 (0.0%) | 7 (5.0%) |
| 5 to 17 Years | 19 (4.4%) | 9 (2.1%) |
| 18 to 34 Years | 17 (3.5%) | 31 (6.7%) |
| 35 to 64 Years | 155 (14.6%) | 141 (14.1%) |
| 65 to 74 Years | 116 (37.2%) | 81 (24.6%) |
| 75 Years and over | 84 (38.4%) | 117 (41.6%) |
Disability Class by Sex by Age in Stark County
Disability Class: Hearing Difficulty
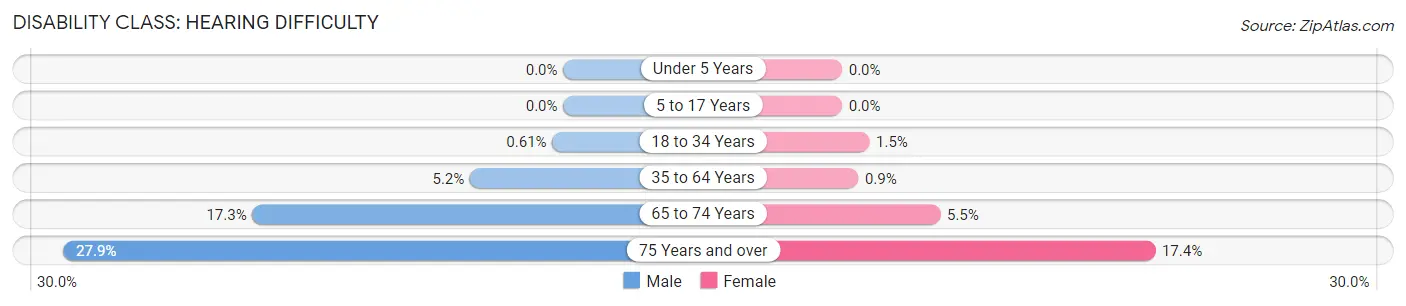
| Age Bracket | Male | Female |
| Under 5 Years | 0 (0.0%) | 0 (0.0%) |
| 5 to 17 Years | 0 (0.0%) | 0 (0.0%) |
| 18 to 34 Years | 3 (0.6%) | 7 (1.5%) |
| 35 to 64 Years | 55 (5.2%) | 9 (0.9%) |
| 65 to 74 Years | 54 (17.3%) | 18 (5.5%) |
| 75 Years and over | 61 (27.9%) | 49 (17.4%) |
Disability Class: Vision Difficulty
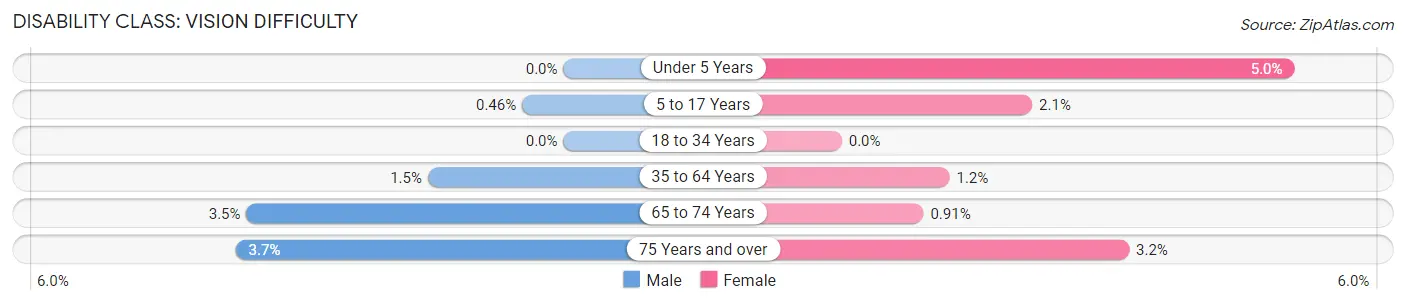
| Age Bracket | Male | Female |
| Under 5 Years | 0 (0.0%) | 7 (5.0%) |
| 5 to 17 Years | 2 (0.5%) | 9 (2.1%) |
| 18 to 34 Years | 0 (0.0%) | 0 (0.0%) |
| 35 to 64 Years | 16 (1.5%) | 12 (1.2%) |
| 65 to 74 Years | 11 (3.5%) | 3 (0.9%) |
| 75 Years and over | 8 (3.6%) | 9 (3.2%) |
Disability Class: Cognitive Difficulty

| Age Bracket | Male | Female |
| 5 to 17 Years | 17 (3.9%) | 0 (0.0%) |
| 18 to 34 Years | 9 (1.8%) | 10 (2.2%) |
| 35 to 64 Years | 53 (5.0%) | 38 (3.8%) |
| 65 to 74 Years | 48 (15.4%) | 16 (4.9%) |
| 75 Years and over | 26 (11.9%) | 21 (7.5%) |
Disability Class: Ambulatory Difficulty

| Age Bracket | Male | Female |
| 5 to 17 Years | 0 (0.0%) | 0 (0.0%) |
| 18 to 34 Years | 0 (0.0%) | 3 (0.6%) |
| 35 to 64 Years | 57 (5.4%) | 111 (11.1%) |
| 65 to 74 Years | 54 (17.3%) | 52 (15.8%) |
| 75 Years and over | 37 (16.9%) | 69 (24.6%) |
Disability Class: Self-Care Difficulty

| Age Bracket | Male | Female |
| 5 to 17 Years | 9 (2.1%) | 0 (0.0%) |
| 18 to 34 Years | 0 (0.0%) | 17 (3.7%) |
| 35 to 64 Years | 25 (2.4%) | 18 (1.8%) |
| 65 to 74 Years | 46 (14.7%) | 26 (7.9%) |
| 75 Years and over | 19 (8.7%) | 35 (12.5%) |
Technology Access in Stark County
Computing Device Access in Stark County

| Device Type | # Households | % Households |
| Desktop or Laptop | 1,571 | 67.5% |
| Smartphone | 1,947 | 83.7% |
| Tablet | 1,217 | 52.3% |
| No Computing Device | 214 | 9.2% |
| Total | 2,326 | 100.0% |
Internet Access in Stark County

| Internet Type | # Households | % Households |
| Dial-Up Internet | 3 | 0.1% |
| Broadband Home | 1,213 | 52.1% |
| Cellular Data Only | 469 | 20.2% |
| Satellite Internet | 254 | 10.9% |
| No Internet | 401 | 17.2% |
| Total | 2,326 | 100.0% |
Stark County Summary
Stark County is located in the northwestern corner of Illinois, and is part of the Peoria, IL Metropolitan Statistical Area. The county was established in 1839 and is named after General John Stark, a Revolutionary War hero. The county seat is Toulon, and the largest city is Kewanee. As of the 2010 census, the population was 5,994.
Geography
Stark County is located in the northwestern corner of Illinois, and is bordered by Henry County to the north, Knox County to the east, Peoria County to the south, and Bureau County to the west. The county has a total area of 545 square miles, of which 544 square miles is land and 1.2 square miles (0.2%) is water. The highest point in the county is located in the northwest corner, at an elevation of 810 feet. The county is mostly flat, with some rolling hills in the western part.
The major waterways in the county are the Spoon River, which flows through the western part of the county, and the Illinois River, which forms the southern border. The county is also home to several small lakes, including Lake Toulon, Lake Kewanee, and Lake Stark.
Climate
Stark County has a humid continental climate, with cold, snowy winters and hot, humid summers. The average annual temperature is 48°F, and the average annual precipitation is 37 inches.
Demographics
As of the 2010 census, there were 5,994 people, 2,346 households, and 1,619 families residing in the county. The population density was 11 people per square mile. The racial makeup of the county was 97.3% White, 0.5% African American, 0.3% Native American, 0.2% Asian, 0.1% Pacific Islander, 0.7% from other races, and 0.9% from two or more races. Hispanic or Latino of any race were 1.7% of the population.
The median income for a household in the county was $45,945, and the median income for a family was $54,844. The per capita income for the county was $21,845. About 8.2% of families and 11.2% of the population were below the poverty line, including 15.2% of those under age 18 and 8.2% of those age 65 or over.
Economy
Stark County is largely rural, and the economy is based on agriculture. The major crops grown in the county are corn, soybeans, and wheat. Livestock production is also important, with beef cattle, dairy cattle, and hogs being the main animals raised.
The county is also home to several manufacturing companies, including Kewanee Boiler, which produces boilers and other industrial equipment, and Kewanee Machinery, which manufactures agricultural equipment.
The county is served by two major highways, Interstate 80 and U.S. Route 6. The nearest airport is the Greater Peoria Regional Airport, located in Peoria County.
Conclusion
Stark County is a rural county located in the northwestern corner of Illinois. The county is home to 5,994 people, and the economy is based on agriculture and manufacturing. The county is served by two major highways and the Greater Peoria Regional Airport.
Common Questions
What is the Total Population of Stark County?
Total Population of Stark County is 5,395.
What is the Total Male Population of Stark County?
Total Male Population of Stark County is 2,720.
What is the Total Female Population of Stark County?
Total Female Population of Stark County is 2,675.
What is the Ratio of Males per 100 Females in Stark County?
There are 101.68 Males per 100 Females in Stark County.
What is the Ratio of Females per 100 Males in Stark County?
There are 98.35 Females per 100 Males in Stark County.
What is the Median Population Age in Stark County?
Median Population Age in Stark County is 44.8 Years.
What is the Average Family Size in Stark County
Average Family Size in Stark County is 2.9 People.
What is the Average Household Size in Stark County
Average Household Size in Stark County is 2.3 People.
What is Per Capita Income in Stark County?
Per Capita income in Stark County is $32,618.
What is the Median Family Income in Stark County?
Median Family Income in Stark County is $79,254.
What is the Median Household income in Stark County?
Median Household Income in Stark County is $58,125.
What is Income or Wage Gap in Stark County?
Income or Wage Gap in Stark County is 30.7%.
Women in Stark County earn 69.3 cents for every dollar earned by a man.
What is Inequality or Gini Index in Stark County?
Inequality or Gini Index in Stark County is 0.45.
How Large is the Labor Force in Stark County?
There are 2,526 People in the Labor Forcein in Stark County.
What is the Percentage of People in the Labor Force in Stark County?
57.7% of People are in the Labor Force in Stark County.
What is the Unemployment Rate in Stark County?
Unemployment Rate in Stark County is 3.3%.