St. Clair County, IL
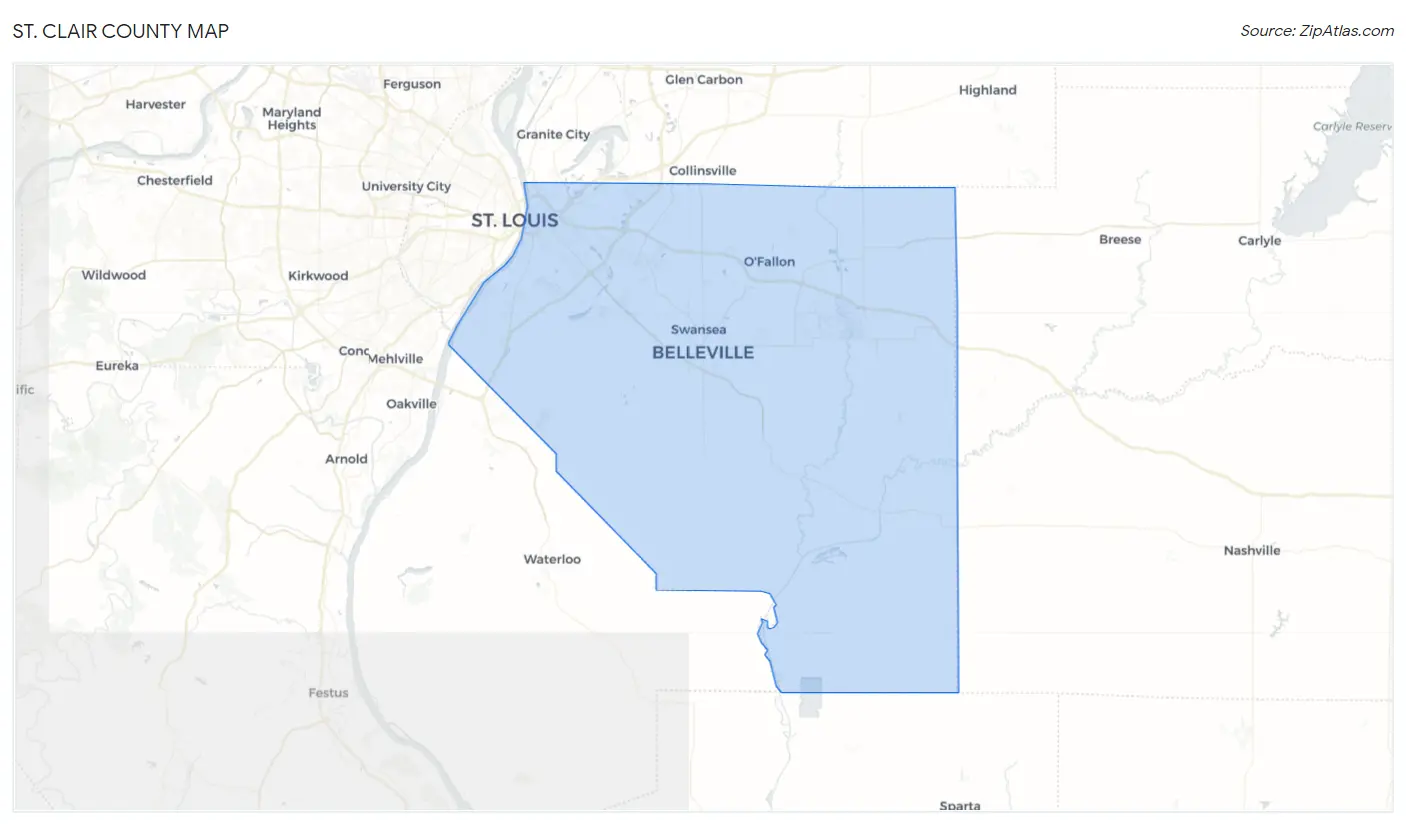
St. Clair County Map
St. Clair County Overview
256,791
TOTAL POPULATION
124,864
MALE POPULATION
131,927
FEMALE POPULATION
94.65
MALES / 100 FEMALES
105.66
FEMALES / 100 MALES
39.4
MEDIAN AGE
3.2
AVG FAMILY SIZE
2.5
AVG HOUSEHOLD SIZE
$36,010
PER CAPITA INCOME
$88,951
AVG FAMILY INCOME
$68,915
AVG HOUSEHOLD INCOME
31.8%
WAGE / INCOME GAP [ % ]
68.2¢/ $1
WAGE / INCOME GAP [ $ ]
$12,741
FAMILY INCOME DEFICIT
0.45
INEQUALITY / GINI INDEX
130,967
LABOR FORCE [ PEOPLE ]
64.2%
PERCENT IN LABOR FORCE
5.7%
UNEMPLOYMENT RATE
St. Clair County Area Codes
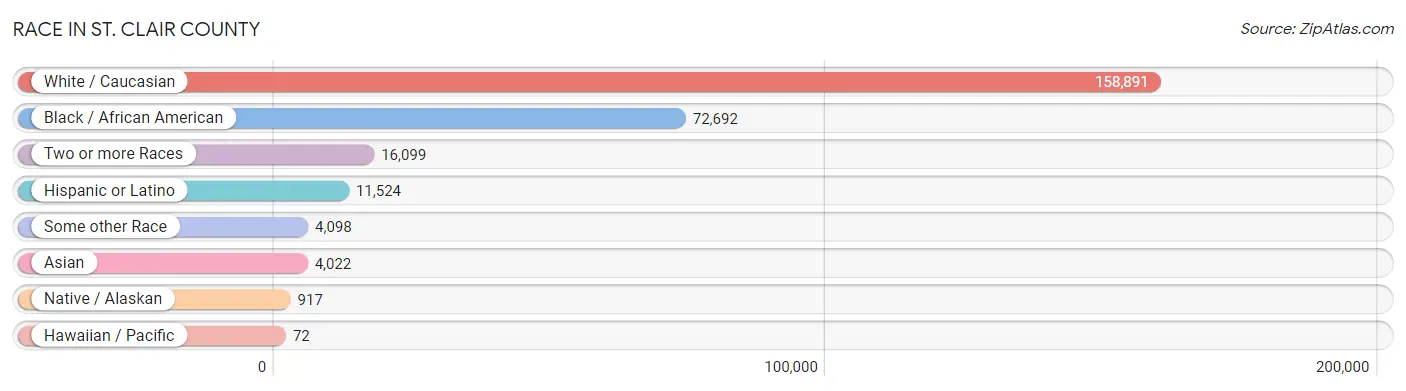
Race in St. Clair County
The most populous races in St. Clair County are White / Caucasian (158,891 | 61.9%), Black / African American (72,692 | 28.3%), and Two or more Races (16,099 | 6.3%).
| Race | # Population | % Population |
| Asian | 4,022 | 1.6% |
| Black / African American | 72,692 | 28.3% |
| Hawaiian / Pacific | 72 | 0.0% |
| Hispanic or Latino | 11,524 | 4.5% |
| Native / Alaskan | 917 | 0.4% |
| White / Caucasian | 158,891 | 61.9% |
| Two or more Races | 16,099 | 6.3% |
| Some other Race | 4,098 | 1.6% |
| Total | 256,791 | 100.0% |
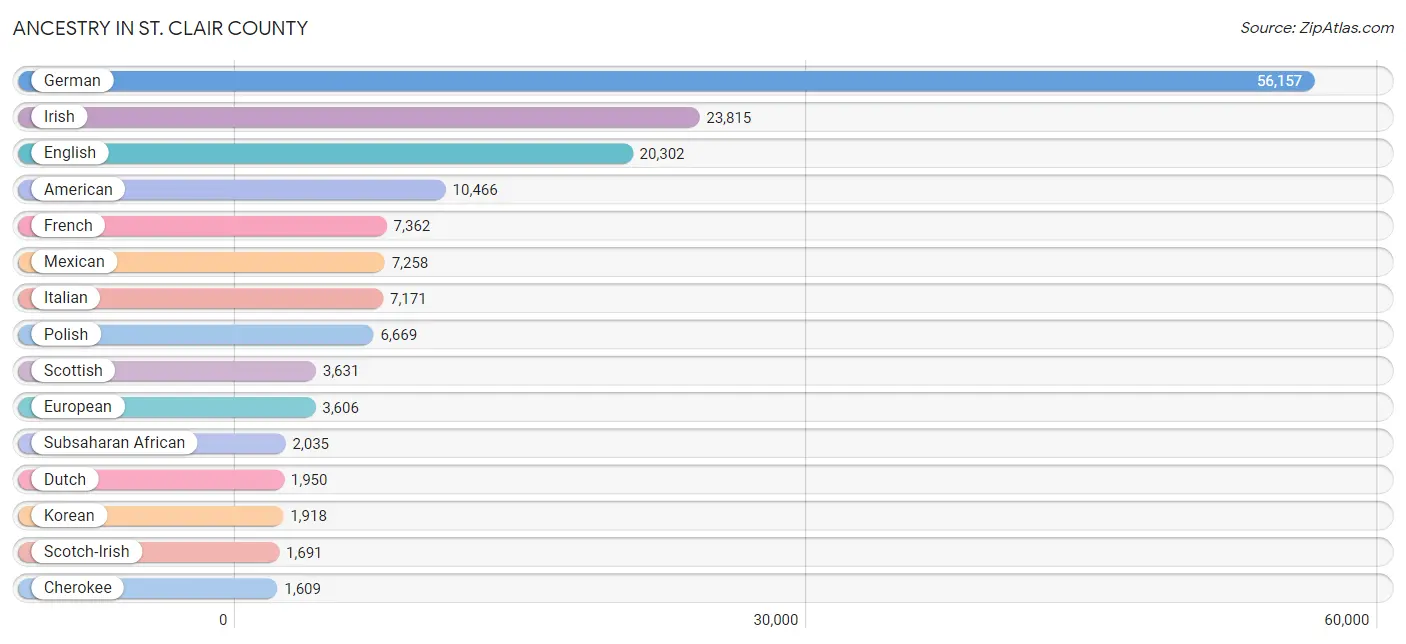
Ancestry in St. Clair County
The most populous ancestries reported in St. Clair County are German (56,157 | 21.9%), Irish (23,815 | 9.3%), English (20,302 | 7.9%), American (10,466 | 4.1%), and French (7,362 | 2.9%), together accounting for 46.0% of all St. Clair County residents.
| Ancestry | # Population | % Population |
| African | 1,027 | 0.4% |
| Albanian | 105 | 0.0% |
| Alsatian | 30 | 0.0% |
| American | 10,466 | 4.1% |
| Apache | 197 | 0.1% |
| Arab | 939 | 0.4% |
| Armenian | 259 | 0.1% |
| Austrian | 563 | 0.2% |
| Belgian | 79 | 0.0% |
| Belizean | 19 | 0.0% |
| Bermudan | 8 | 0.0% |
| Bhutanese | 628 | 0.2% |
| Blackfeet | 486 | 0.2% |
| Bolivian | 69 | 0.0% |
| Brazilian | 37 | 0.0% |
| British | 960 | 0.4% |
| Bulgarian | 30 | 0.0% |
| Burmese | 895 | 0.4% |
| Canadian | 217 | 0.1% |
| Central American | 652 | 0.3% |
| Central American Indian | 47 | 0.0% |
| Cherokee | 1,609 | 0.6% |
| Cheyenne | 31 | 0.0% |
| Chinese | 8 | 0.0% |
| Chippewa | 71 | 0.0% |
| Choctaw | 372 | 0.1% |
| Colombian | 62 | 0.0% |
| Comanche | 202 | 0.1% |
| Costa Rican | 136 | 0.1% |
| Creek | 231 | 0.1% |
| Croatian | 521 | 0.2% |
| Cuban | 260 | 0.1% |
| Czech | 912 | 0.4% |
| Czechoslovakian | 221 | 0.1% |
| Danish | 338 | 0.1% |
| Dominican | 97 | 0.0% |
| Dutch | 1,950 | 0.8% |
| Eastern European | 408 | 0.2% |
| Ecuadorian | 10 | 0.0% |
| Egyptian | 52 | 0.0% |
| English | 20,302 | 7.9% |
| Ethiopian | 610 | 0.2% |
| European | 3,606 | 1.4% |
| Finnish | 47 | 0.0% |
| French | 7,362 | 2.9% |
| French American Indian | 11 | 0.0% |
| French Canadian | 574 | 0.2% |
| German | 56,157 | 21.9% |
| Ghanaian | 46 | 0.0% |
| Greek | 664 | 0.3% |
| Guamanian / Chamorro | 17 | 0.0% |
| Guatemalan | 199 | 0.1% |
| Guyanese | 65 | 0.0% |
| Haitian | 58 | 0.0% |
| Honduran | 209 | 0.1% |
| Hungarian | 725 | 0.3% |
| Icelander | 40 | 0.0% |
| Indian (Asian) | 1,016 | 0.4% |
| Indonesian | 41 | 0.0% |
| Iranian | 20 | 0.0% |
| Iraqi | 28 | 0.0% |
| Irish | 23,815 | 9.3% |
| Iroquois | 106 | 0.0% |
| Israeli | 7 | 0.0% |
| Italian | 7,171 | 2.8% |
| Jamaican | 636 | 0.3% |
| Japanese | 56 | 0.0% |
| Jordanian | 297 | 0.1% |
| Korean | 1,918 | 0.7% |
| Laotian | 93 | 0.0% |
| Latvian | 23 | 0.0% |
| Lebanese | 110 | 0.0% |
| Lithuanian | 617 | 0.2% |
| Luxembourger | 13 | 0.0% |
| Macedonian | 9 | 0.0% |
| Malaysian | 29 | 0.0% |
| Mexican | 7,258 | 2.8% |
| Mexican American Indian | 145 | 0.1% |
| Native Hawaiian | 116 | 0.1% |
| Navajo | 365 | 0.1% |
| Nigerian | 283 | 0.1% |
| Northern European | 195 | 0.1% |
| Norwegian | 1,470 | 0.6% |
| Ottawa | 51 | 0.0% |
| Pakistani | 224 | 0.1% |
| Palestinian | 35 | 0.0% |
| Panamanian | 61 | 0.0% |
| Peruvian | 62 | 0.0% |
| Polish | 6,669 | 2.6% |
| Portuguese | 272 | 0.1% |
| Pueblo | 8 | 0.0% |
| Puerto Rican | 1,452 | 0.6% |
| Romanian | 68 | 0.0% |
| Russian | 546 | 0.2% |
| Salvadoran | 47 | 0.0% |
| Samoan | 38 | 0.0% |
| Scandinavian | 455 | 0.2% |
| Scotch-Irish | 1,691 | 0.7% |
| Scottish | 3,631 | 1.4% |
| Serbian | 69 | 0.0% |
| Sioux | 209 | 0.1% |
| Slavic | 72 | 0.0% |
| Slovak | 253 | 0.1% |
| South American | 213 | 0.1% |
| Spaniard | 538 | 0.2% |
| Spanish | 281 | 0.1% |
| Sri Lankan | 220 | 0.1% |
| Subsaharan African | 2,035 | 0.8% |
| Swedish | 1,318 | 0.5% |
| Swiss | 466 | 0.2% |
| Syrian | 79 | 0.0% |
| Thai | 872 | 0.3% |
| Trinidadian and Tobagonian | 69 | 0.0% |
| Turkish | 7 | 0.0% |
| Ukrainian | 131 | 0.1% |
| Venezuelan | 10 | 0.0% |
| Vietnamese | 40 | 0.0% |
| Welsh | 1,447 | 0.6% |
| West Indian | 69 | 0.0% |
| Yaqui | 20 | 0.0% |
| Yugoslavian | 37 | 0.0% | View All 121 Rows |
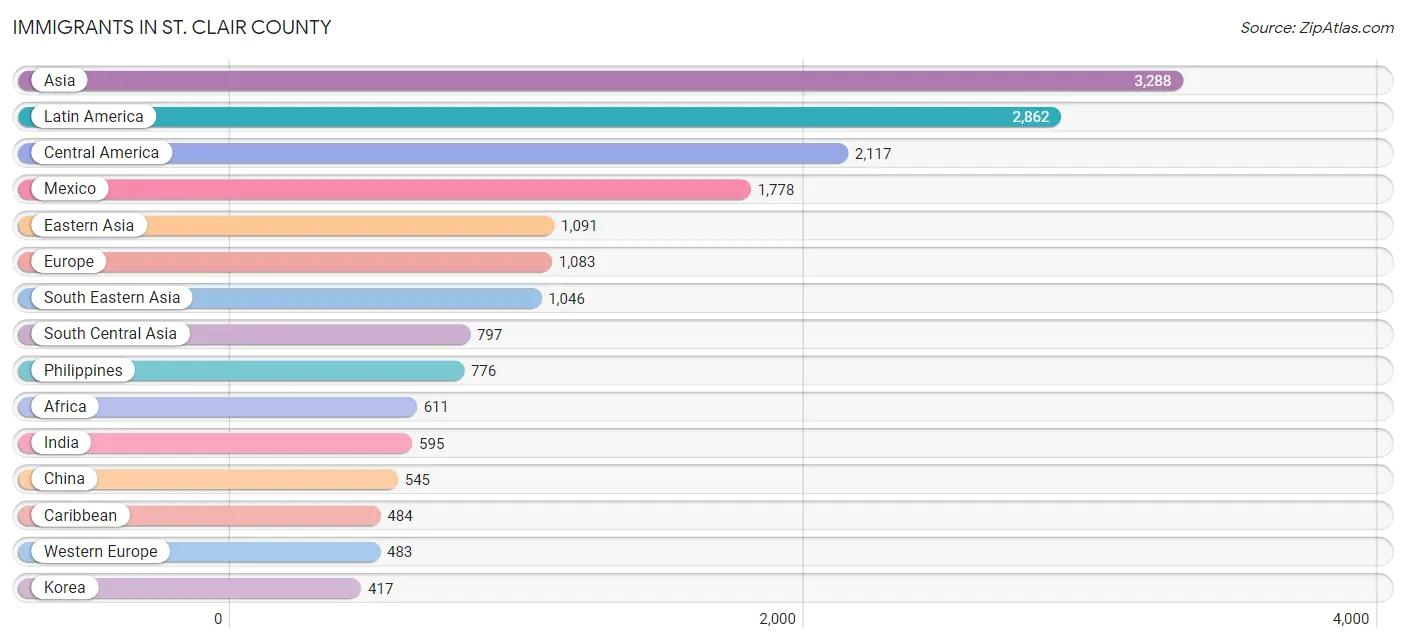
Immigrants in St. Clair County
The most numerous immigrant groups reported in St. Clair County came from Asia (3,288 | 1.3%), Latin America (2,862 | 1.1%), Central America (2,117 | 0.8%), Mexico (1,778 | 0.7%), and Eastern Asia (1,091 | 0.4%), together accounting for 4.3% of all St. Clair County residents.
| Immigration Origin | # Population | % Population |
| Africa | 611 | 0.2% |
| Albania | 31 | 0.0% |
| Asia | 3,288 | 1.3% |
| Austria | 24 | 0.0% |
| Belgium | 27 | 0.0% |
| Belize | 19 | 0.0% |
| Bosnia and Herzegovina | 1 | 0.0% |
| Brazil | 31 | 0.0% |
| Cambodia | 9 | 0.0% |
| Canada | 289 | 0.1% |
| Caribbean | 484 | 0.2% |
| Central America | 2,117 | 0.8% |
| China | 545 | 0.2% |
| Colombia | 146 | 0.1% |
| Costa Rica | 41 | 0.0% |
| Croatia | 3 | 0.0% |
| Cuba | 50 | 0.0% |
| Dominican Republic | 32 | 0.0% |
| Eastern Africa | 239 | 0.1% |
| Eastern Asia | 1,091 | 0.4% |
| Eastern Europe | 204 | 0.1% |
| Ecuador | 10 | 0.0% |
| Egypt | 52 | 0.0% |
| El Salvador | 26 | 0.0% |
| England | 92 | 0.0% |
| Ethiopia | 206 | 0.1% |
| Europe | 1,083 | 0.4% |
| Germany | 374 | 0.2% |
| Ghana | 37 | 0.0% |
| Greece | 26 | 0.0% |
| Guatemala | 36 | 0.0% |
| Guyana | 52 | 0.0% |
| Haiti | 32 | 0.0% |
| Honduras | 188 | 0.1% |
| Hungary | 38 | 0.0% |
| India | 595 | 0.2% |
| Indonesia | 3 | 0.0% |
| Iraq | 14 | 0.0% |
| Italy | 17 | 0.0% |
| Jamaica | 299 | 0.1% |
| Japan | 129 | 0.1% |
| Jordan | 221 | 0.1% |
| Kenya | 24 | 0.0% |
| Korea | 417 | 0.2% |
| Kuwait | 63 | 0.0% |
| Laos | 28 | 0.0% |
| Latin America | 2,862 | 1.1% |
| Mexico | 1,778 | 0.7% |
| Middle Africa | 8 | 0.0% |
| Nepal | 69 | 0.0% |
| Netherlands | 58 | 0.0% |
| Nigeria | 98 | 0.0% |
| North Macedonia | 41 | 0.0% |
| Northern Africa | 138 | 0.1% |
| Northern Europe | 323 | 0.1% |
| Oceania | 17 | 0.0% |
| Pakistan | 95 | 0.0% |
| Panama | 29 | 0.0% |
| Peru | 17 | 0.0% |
| Philippines | 776 | 0.3% |
| Poland | 26 | 0.0% |
| Russia | 52 | 0.0% |
| Scotland | 6 | 0.0% |
| South Africa | 15 | 0.0% |
| South America | 261 | 0.1% |
| South Central Asia | 797 | 0.3% |
| South Eastern Asia | 1,046 | 0.4% |
| Southern Europe | 73 | 0.0% |
| Spain | 30 | 0.0% |
| Sweden | 7 | 0.0% |
| Syria | 14 | 0.0% |
| Taiwan | 26 | 0.0% |
| Thailand | 83 | 0.0% |
| Trinidad and Tobago | 71 | 0.0% |
| Turkey | 7 | 0.0% |
| Venezuela | 5 | 0.0% |
| Vietnam | 106 | 0.0% |
| Western Africa | 135 | 0.1% |
| Western Asia | 319 | 0.1% |
| Western Europe | 483 | 0.2% |
| Zaire | 8 | 0.0% | View All 81 Rows |
Sex and Age in St. Clair County
Sex and Age in St. Clair County
The most populous age groups in St. Clair County are 10 to 14 Years (9,662 | 7.7%) for men and 60 to 64 Years (9,255 | 7.0%) for women.
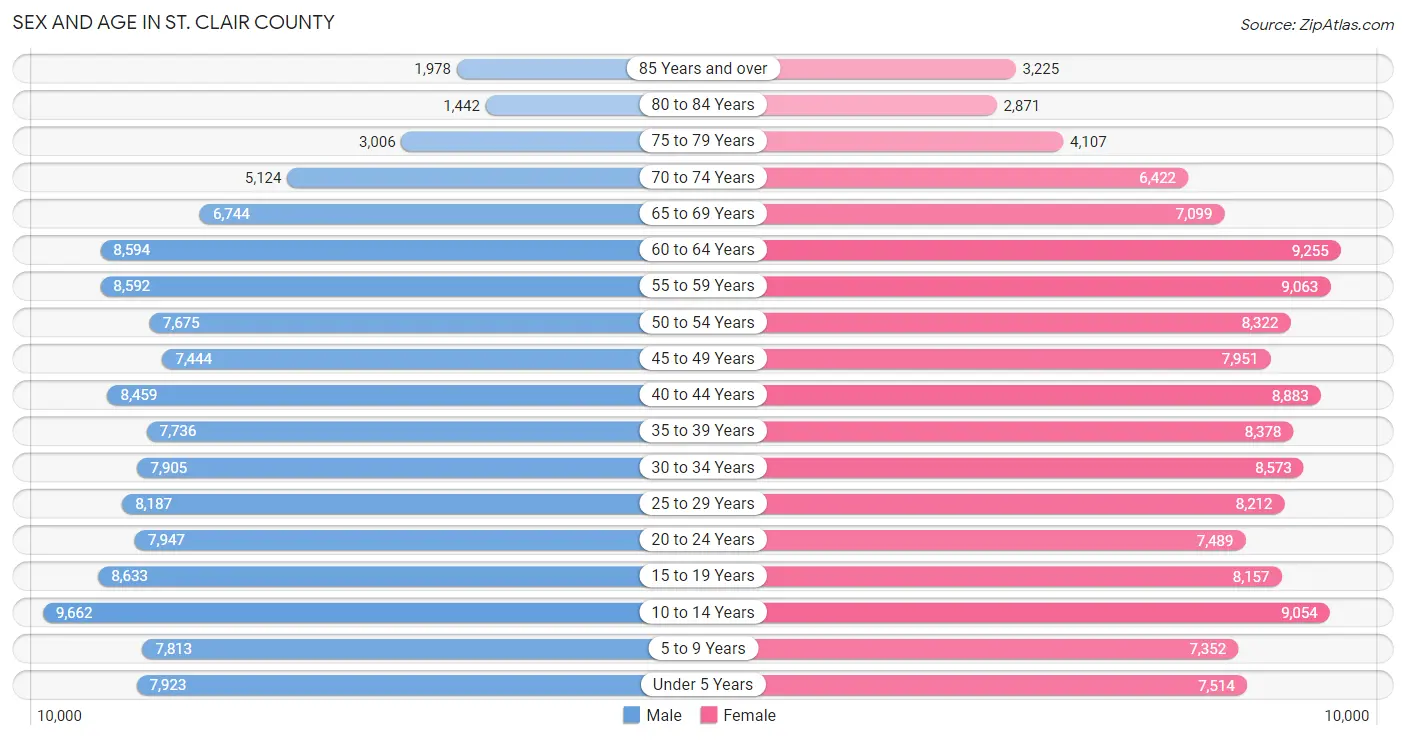
| Age Bracket | Male | Female |
| Under 5 Years | 7,923 (6.4%) | 7,514 (5.7%) |
| 5 to 9 Years | 7,813 (6.3%) | 7,352 (5.6%) |
| 10 to 14 Years | 9,662 (7.7%) | 9,054 (6.9%) |
| 15 to 19 Years | 8,633 (6.9%) | 8,157 (6.2%) |
| 20 to 24 Years | 7,947 (6.4%) | 7,489 (5.7%) |
| 25 to 29 Years | 8,187 (6.6%) | 8,212 (6.2%) |
| 30 to 34 Years | 7,905 (6.3%) | 8,573 (6.5%) |
| 35 to 39 Years | 7,736 (6.2%) | 8,378 (6.4%) |
| 40 to 44 Years | 8,459 (6.8%) | 8,883 (6.7%) |
| 45 to 49 Years | 7,444 (6.0%) | 7,951 (6.0%) |
| 50 to 54 Years | 7,675 (6.1%) | 8,322 (6.3%) |
| 55 to 59 Years | 8,592 (6.9%) | 9,063 (6.9%) |
| 60 to 64 Years | 8,594 (6.9%) | 9,255 (7.0%) |
| 65 to 69 Years | 6,744 (5.4%) | 7,099 (5.4%) |
| 70 to 74 Years | 5,124 (4.1%) | 6,422 (4.9%) |
| 75 to 79 Years | 3,006 (2.4%) | 4,107 (3.1%) |
| 80 to 84 Years | 1,442 (1.1%) | 2,871 (2.2%) |
| 85 Years and over | 1,978 (1.6%) | 3,225 (2.4%) |
| Total | 124,864 (100.0%) | 131,927 (100.0%) |
Families and Households in St. Clair County
Median Family Size in St. Clair County
The median family size in St. Clair County is 3.17 persons per family, with single female/mother families (14,915 | 23.2%) accounting for the largest median family size of 3.39 persons per family. On the other hand, single male/father families (4,481 | 7.0%) represent the smallest median family size with 2.99 persons per family.
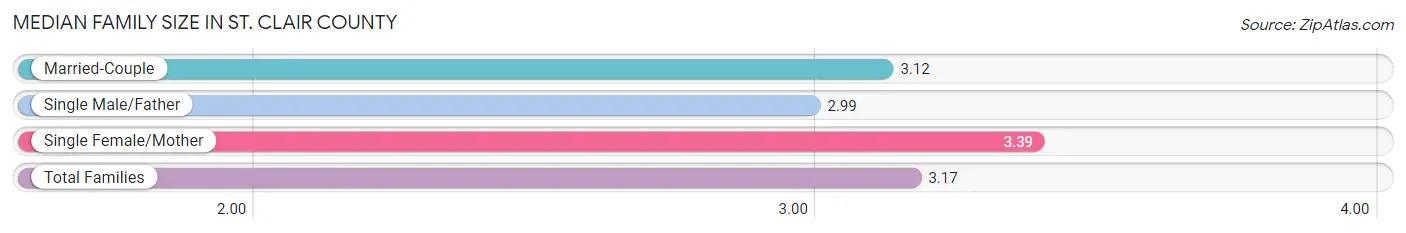
| Family Type | # Families | Family Size |
| Married-Couple | 44,817 (69.8%) | 3.12 |
| Single Male/Father | 4,481 (7.0%) | 2.99 |
| Single Female/Mother | 14,915 (23.2%) | 3.39 |
| Total Families | 64,213 (100.0%) | 3.17 |
Median Household Size in St. Clair County
The median household size in St. Clair County is 2.51 persons per household, with single female/mother households (14,915 | 14.8%) accounting for the largest median household size of 3.62 persons per household. non-family households (36,488 | 36.2%) represent the smallest median household size with 1.17 persons per household.
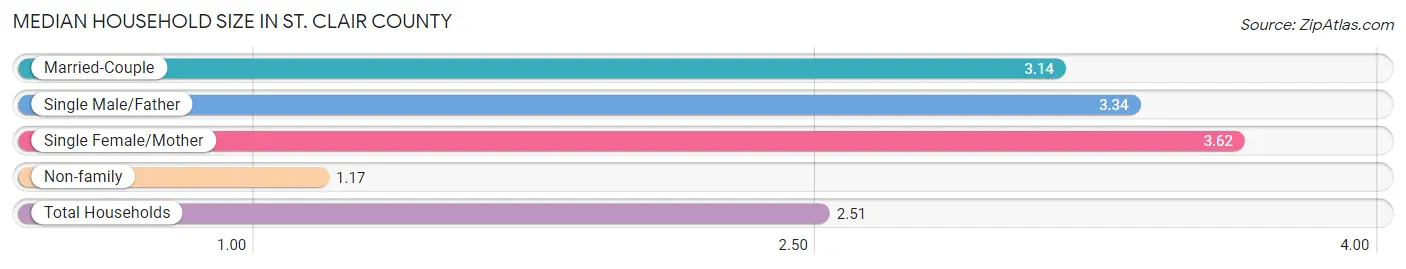
| Household Type | # Households | Household Size |
| Married-Couple | 44,817 (44.5%) | 3.14 |
| Single Male/Father | 4,481 (4.4%) | 3.34 |
| Single Female/Mother | 14,915 (14.8%) | 3.62 |
| Non-family | 36,488 (36.2%) | 1.17 |
| Total Households | 100,701 (100.0%) | 2.51 |
Household Size by Marriage Status in St. Clair County
Out of a total of 100,701 households in St. Clair County, 64,213 (63.8%) are family households, while 36,488 (36.2%) are nonfamily households. The most numerous type of family households are 2-person households, comprising 28,466, and the most common type of nonfamily households are 1-person households, comprising 31,638.
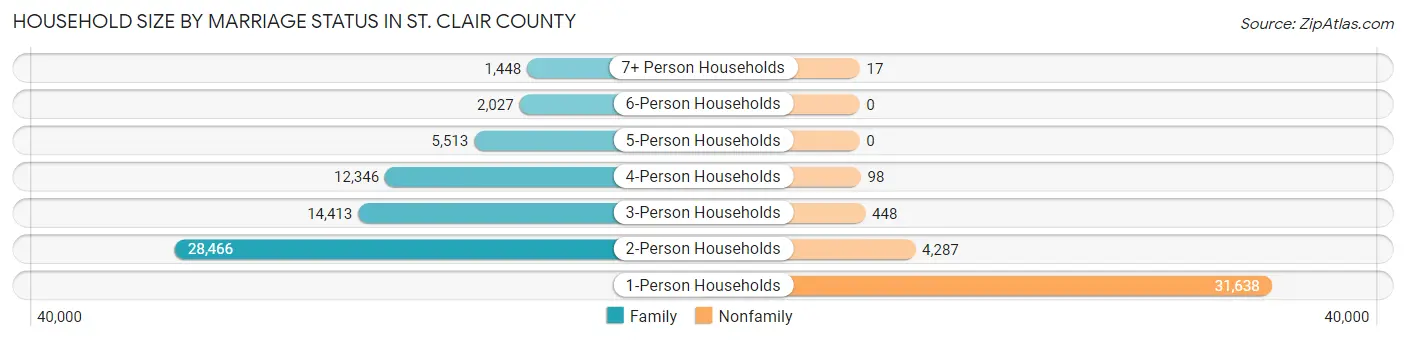
| Household Size | Family Households | Nonfamily Households |
| 1-Person Households | - | 31,638 (31.4%) |
| 2-Person Households | 28,466 (28.3%) | 4,287 (4.3%) |
| 3-Person Households | 14,413 (14.3%) | 448 (0.4%) |
| 4-Person Households | 12,346 (12.3%) | 98 (0.1%) |
| 5-Person Households | 5,513 (5.5%) | 0 (0.0%) |
| 6-Person Households | 2,027 (2.0%) | 0 (0.0%) |
| 7+ Person Households | 1,448 (1.4%) | 17 (0.0%) |
| Total | 64,213 (63.8%) | 36,488 (36.2%) |
Female Fertility in St. Clair County
Fertility by Age in St. Clair County
Average fertility rate in St. Clair County is 58.0 births per 1,000 women. Women in the age bracket of 20 to 34 years have the highest fertility rate with 97.0 births per 1,000 women. Women in the age bracket of 20 to 34 years acount for 68.7% of all women with births.

| Age Bracket | Women with Births | Births / 1,000 Women |
| 15 to 19 years | 60 (1.7%) | 7.0 |
| 20 to 34 years | 2,366 (68.7%) | 97.0 |
| 35 to 50 years | 1,017 (29.5%) | 38.0 |
| Total | 3,443 (100.0%) | 58.0 |
Fertility by Age by Marriage Status in St. Clair County
56.3% of women with births (3,443) in St. Clair County are married. The highest percentage of unmarried women with births falls into 15 to 19 years age bracket with 100.0% of them unmarried at the time of birth, while the lowest percentage of unmarried women with births belong to 35 to 50 years age bracket with 40.2% of them unmarried.
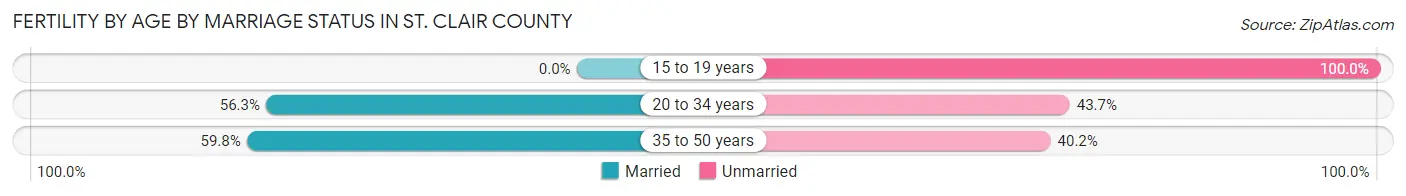
| Age Bracket | Married | Unmarried |
| 15 to 19 years | 0 (0.0%) | 60 (100.0%) |
| 20 to 34 years | 1,332 (56.3%) | 1,034 (43.7%) |
| 35 to 50 years | 608 (59.8%) | 409 (40.2%) |
| Total | 1,938 (56.3%) | 1,505 (43.7%) |
Fertility by Education in St. Clair County
Average fertility rate in St. Clair County is 58.0 births per 1,000 women. Women with the education attainment of bachelor's degree have the highest fertility rate of 81.0 births per 1,000 women, while women with the education attainment of college or associate's degree have the lowest fertility at 39.0 births per 1,000 women. Women with the education attainment of high school diploma represent 29.3% of all women with births.
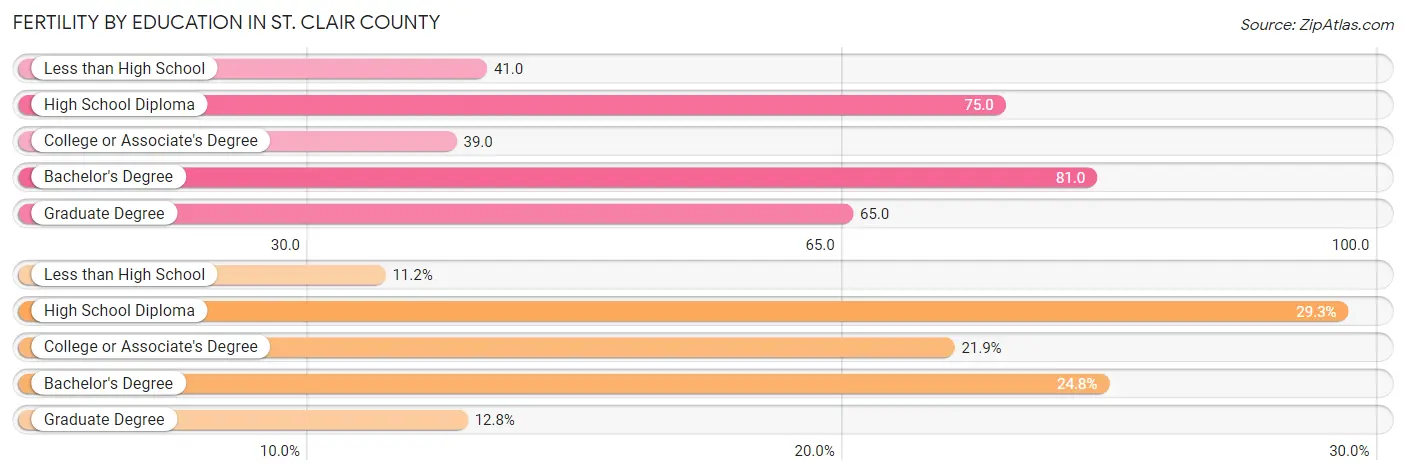
| Educational Attainment | Women with Births | Births / 1,000 Women |
| Less than High School | 387 (11.2%) | 41.0 |
| High School Diploma | 1,008 (29.3%) | 75.0 |
| College or Associate's Degree | 754 (21.9%) | 39.0 |
| Bachelor's Degree | 854 (24.8%) | 81.0 |
| Graduate Degree | 440 (12.8%) | 65.0 |
| Total | 3,443 (100.0%) | 58.0 |
Fertility by Education by Marriage Status in St. Clair County
43.7% of women with births in St. Clair County are unmarried. Women with the educational attainment of graduate degree are most likely to be married with 100.0% of them married at childbirth, while women with the educational attainment of high school diploma are least likely to be married with 83.6% of them unmarried at childbirth.
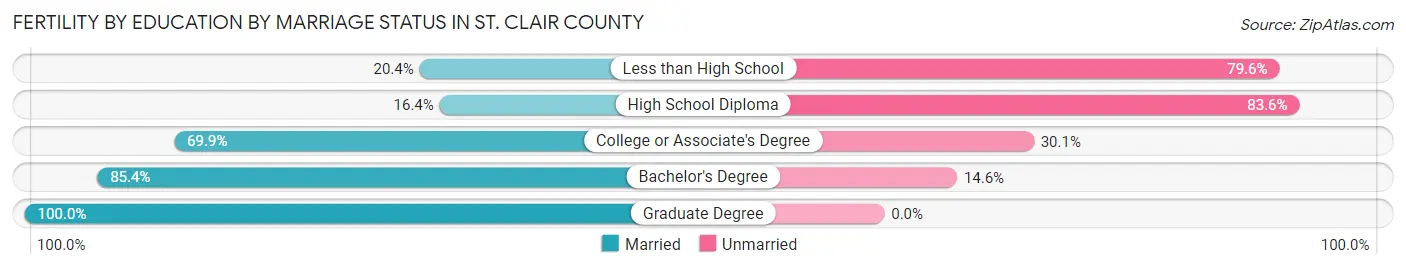
| Educational Attainment | Married | Unmarried |
| Less than High School | 79 (20.4%) | 308 (79.6%) |
| High School Diploma | 165 (16.4%) | 843 (83.6%) |
| College or Associate's Degree | 527 (69.9%) | 227 (30.1%) |
| Bachelor's Degree | 729 (85.4%) | 125 (14.6%) |
| Graduate Degree | 440 (100.0%) | 0 (0.0%) |
| Total | 1,938 (56.3%) | 1,505 (43.7%) |
Income in St. Clair County
Income Overview in St. Clair County
Per Capita Income in St. Clair County is $36,010, while median incomes of families and households are $88,951 and $68,915 respectively.
| Characteristic | Number | Measure |
| Per Capita Income | 256,791 | $36,010 |
| Median Family Income | 64,213 | $88,951 |
| Mean Family Income | 64,213 | $108,281 |
| Median Household Income | 100,701 | $68,915 |
| Mean Household Income | 100,701 | $89,002 |
| Income Deficit | 64,213 | $12,741 |
| Wage / Income Gap (%) | 256,791 | 31.85% |
| Wage / Income Gap ($) | 256,791 | 68.15¢ per $1 |
| Gini / Inequality Index | 256,791 | 0.45 |
Earnings by Sex in St. Clair County
Average Earnings in St. Clair County are $39,888, $48,817 for men and $33,269 for women, a difference of 31.9%.
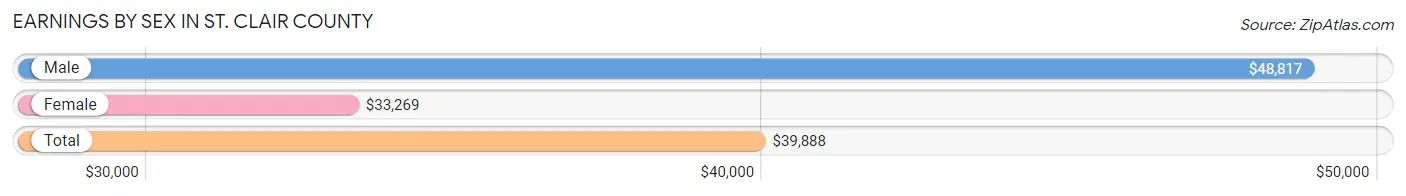
| Sex | Number | Average Earnings |
| Male | 67,707 (50.3%) | $48,817 |
| Female | 66,946 (49.7%) | $33,269 |
| Total | 134,653 (100.0%) | $39,888 |
Earnings by Sex by Income Bracket in St. Clair County
The most common earnings brackets in St. Clair County are $100,000+ for men (11,802 | 17.4%) and $55,000 to $64,999 for women (5,005 | 7.5%).
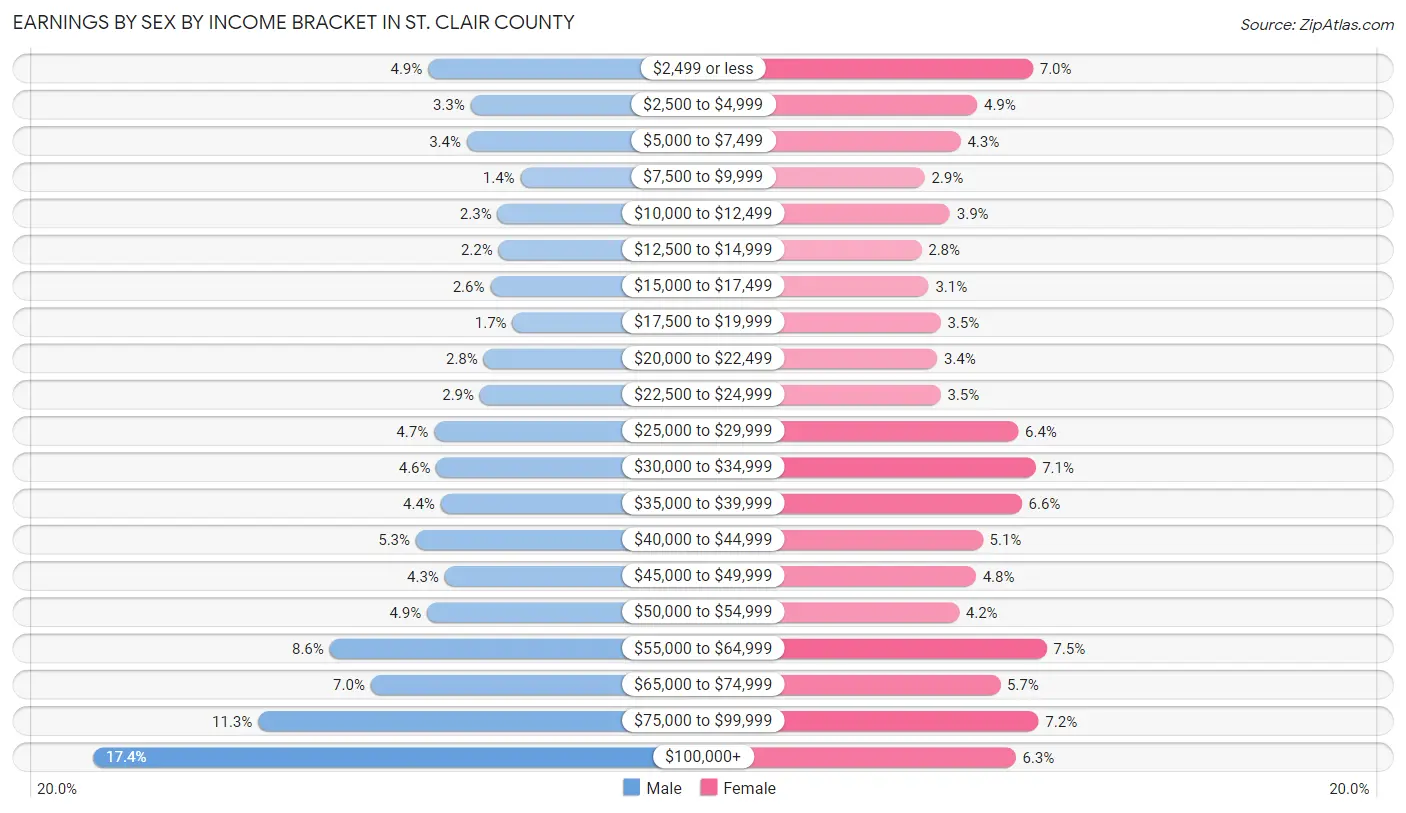
| Income | Male | Female |
| $2,499 or less | 3,302 (4.9%) | 4,669 (7.0%) |
| $2,500 to $4,999 | 2,229 (3.3%) | 3,268 (4.9%) |
| $5,000 to $7,499 | 2,323 (3.4%) | 2,851 (4.3%) |
| $7,500 to $9,999 | 959 (1.4%) | 1,945 (2.9%) |
| $10,000 to $12,499 | 1,545 (2.3%) | 2,585 (3.9%) |
| $12,500 to $14,999 | 1,514 (2.2%) | 1,869 (2.8%) |
| $15,000 to $17,499 | 1,729 (2.5%) | 2,050 (3.1%) |
| $17,500 to $19,999 | 1,163 (1.7%) | 2,352 (3.5%) |
| $20,000 to $22,499 | 1,895 (2.8%) | 2,263 (3.4%) |
| $22,500 to $24,999 | 1,991 (2.9%) | 2,351 (3.5%) |
| $25,000 to $29,999 | 3,158 (4.7%) | 4,301 (6.4%) |
| $30,000 to $34,999 | 3,096 (4.6%) | 4,724 (7.1%) |
| $35,000 to $39,999 | 2,985 (4.4%) | 4,382 (6.6%) |
| $40,000 to $44,999 | 3,616 (5.3%) | 3,405 (5.1%) |
| $45,000 to $49,999 | 2,884 (4.3%) | 3,235 (4.8%) |
| $50,000 to $54,999 | 3,330 (4.9%) | 2,810 (4.2%) |
| $55,000 to $64,999 | 5,804 (8.6%) | 5,005 (7.5%) |
| $65,000 to $74,999 | 4,763 (7.0%) | 3,843 (5.7%) |
| $75,000 to $99,999 | 7,619 (11.3%) | 4,805 (7.2%) |
| $100,000+ | 11,802 (17.4%) | 4,233 (6.3%) |
| Total | 67,707 (100.0%) | 66,946 (100.0%) |
Earnings by Sex by Educational Attainment in St. Clair County
Average earnings in St. Clair County are $56,116 for men and $38,295 for women, a difference of 31.8%. Men with an educational attainment of graduate degree enjoy the highest average annual earnings of $92,841, while those with less than high school education earn the least with $29,654. Women with an educational attainment of graduate degree earn the most with the average annual earnings of $62,198, while those with less than high school education have the smallest earnings of $23,392.
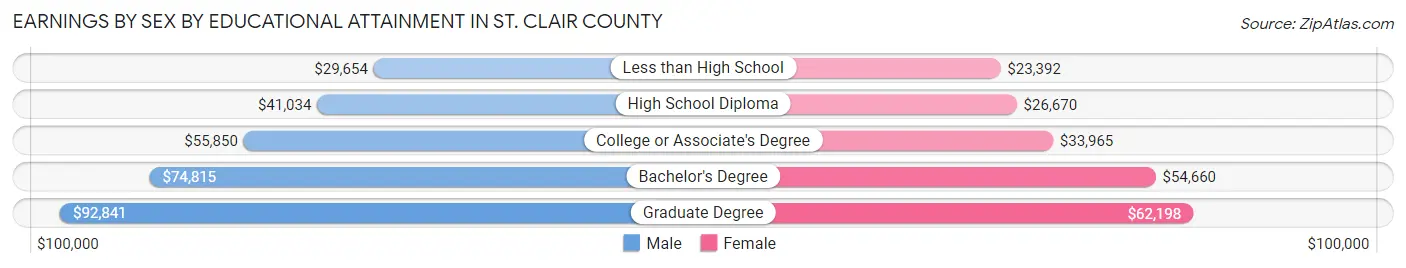
| Educational Attainment | Male Income | Female Income |
| Less than High School | $29,654 | $23,392 |
| High School Diploma | $41,034 | $26,670 |
| College or Associate's Degree | $55,850 | $33,965 |
| Bachelor's Degree | $74,815 | $54,660 |
| Graduate Degree | $92,841 | $62,198 |
| Total | $56,116 | $38,295 |
Family Income in St. Clair County
Family Income Brackets in St. Clair County
According to the St. Clair County family income data, there are 13,164 families falling into the $100,000 to $149,999 income range, which is the most common income bracket and makes up 20.5% of all families. Conversely, the $10,000 to $14,999 income bracket is the least frequent group with only 1,284 families (2.0%) belonging to this category.
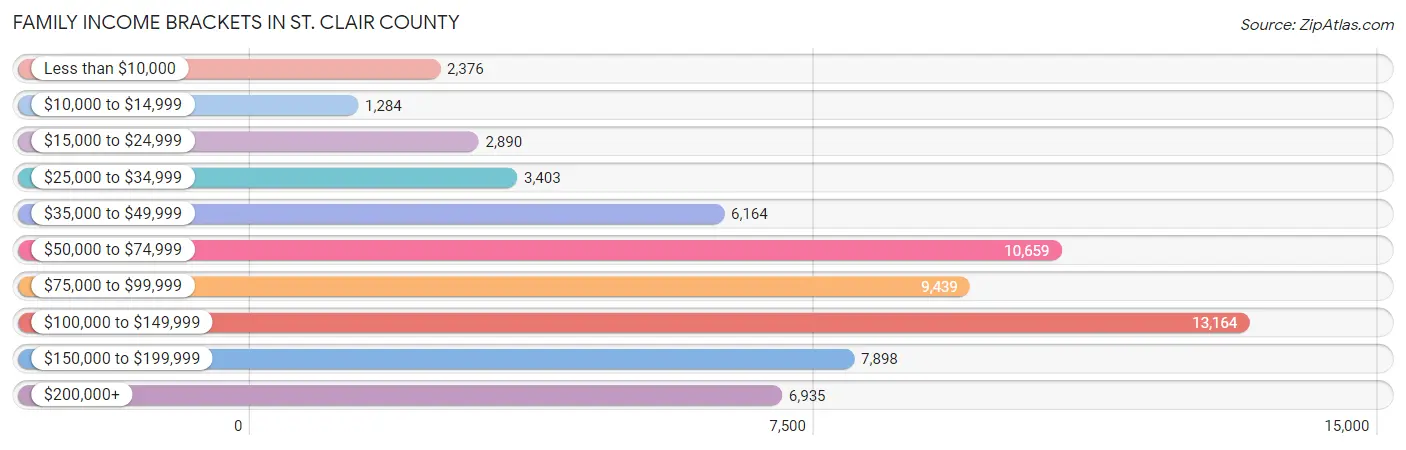
| Income Bracket | # Families | % Families |
| Less than $10,000 | 2,376 | 3.7% |
| $10,000 to $14,999 | 1,284 | 2.0% |
| $15,000 to $24,999 | 2,890 | 4.5% |
| $25,000 to $34,999 | 3,403 | 5.3% |
| $35,000 to $49,999 | 6,164 | 9.6% |
| $50,000 to $74,999 | 10,659 | 16.6% |
| $75,000 to $99,999 | 9,439 | 14.7% |
| $100,000 to $149,999 | 13,164 | 20.5% |
| $150,000 to $199,999 | 7,898 | 12.3% |
| $200,000+ | 6,935 | 10.8% |
Family Income by Famaliy Size in St. Clair County
4-person families (11,342 | 17.7%) account for the highest median family income in St. Clair County with $116,663 per family, while 2-person families (30,481 | 47.5%) have the highest median income of $39,533 per family member.
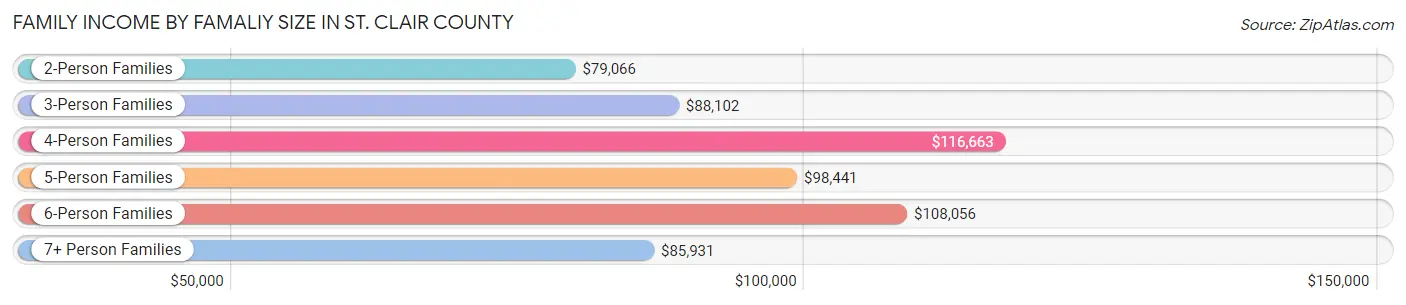
| Income Bracket | # Families | Median Income |
| 2-Person Families | 30,481 (47.5%) | $79,066 |
| 3-Person Families | 14,185 (22.1%) | $88,102 |
| 4-Person Families | 11,342 (17.7%) | $116,663 |
| 5-Person Families | 5,190 (8.1%) | $98,441 |
| 6-Person Families | 1,760 (2.7%) | $108,056 |
| 7+ Person Families | 1,255 (1.9%) | $85,931 |
| Total | 64,213 (100.0%) | $88,951 |
Family Income by Number of Earners in St. Clair County
The median family income in St. Clair County is $88,951, with families comprising 3+ earners (7,616) having the highest median family income of $149,682, while families with no earners (9,176) have the lowest median family income of $55,176, accounting for 11.9% and 14.3% of families, respectively.
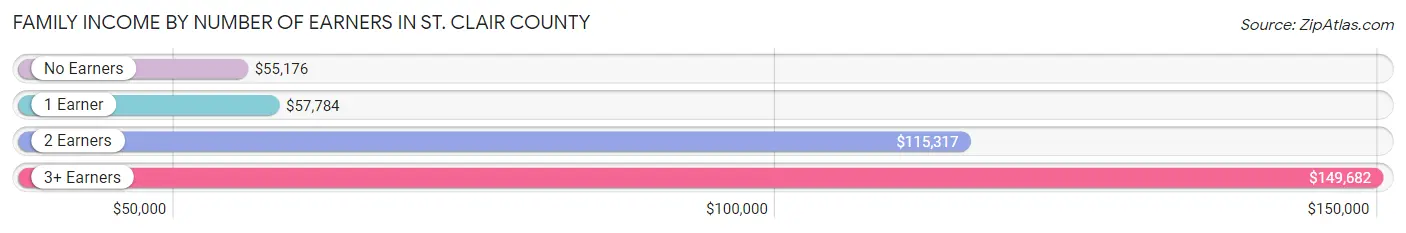
| Number of Earners | # Families | Median Income |
| No Earners | 9,176 (14.3%) | $55,176 |
| 1 Earner | 21,336 (33.2%) | $57,784 |
| 2 Earners | 26,085 (40.6%) | $115,317 |
| 3+ Earners | 7,616 (11.9%) | $149,682 |
| Total | 64,213 (100.0%) | $88,951 |
Household Income in St. Clair County
Household Income Brackets in St. Clair County
With 17,018 households falling in the category, the $50,000 to $74,999 income range is the most frequent in St. Clair County, accounting for 16.9% of all households. In contrast, only 4,028 households (4.0%) fall into the $10,000 to $14,999 income bracket, making it the least populous group.
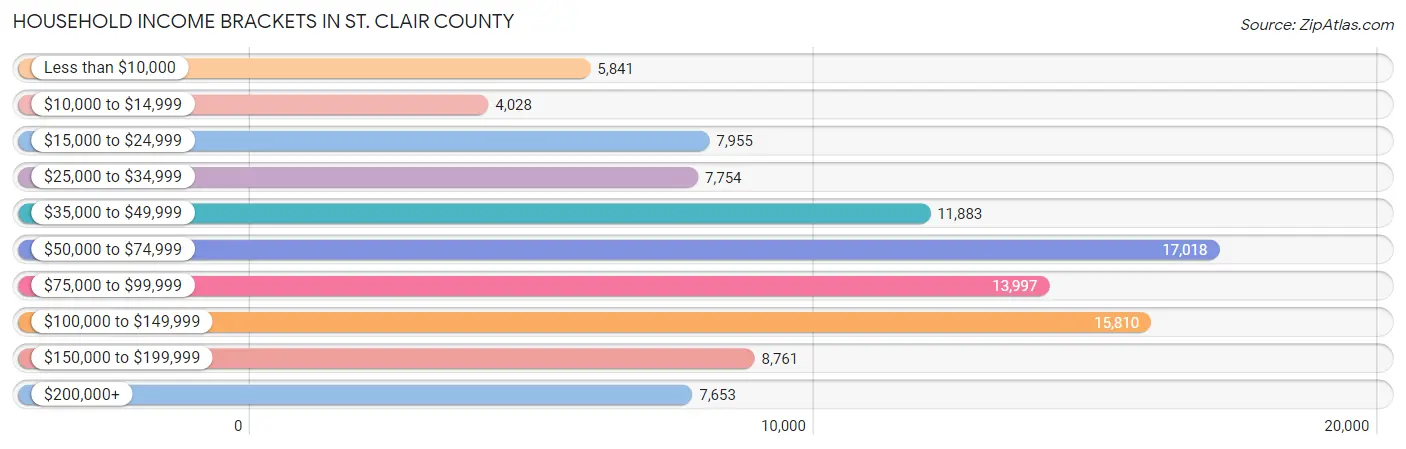
| Income Bracket | # Households | % Households |
| Less than $10,000 | 5,841 | 5.8% |
| $10,000 to $14,999 | 4,028 | 4.0% |
| $15,000 to $24,999 | 7,955 | 7.9% |
| $25,000 to $34,999 | 7,754 | 7.7% |
| $35,000 to $49,999 | 11,883 | 11.8% |
| $50,000 to $74,999 | 17,018 | 16.9% |
| $75,000 to $99,999 | 13,997 | 13.9% |
| $100,000 to $149,999 | 15,810 | 15.7% |
| $150,000 to $199,999 | 8,761 | 8.7% |
| $200,000+ | 7,653 | 7.6% |
Household Income by Householder Age in St. Clair County
The median household income in St. Clair County is $68,915, with the highest median household income of $79,787 found in the 45 to 64 years age bracket for the primary householder. A total of 38,398 households (38.1%) fall into this category. Meanwhile, the 15 to 24 years age bracket for the primary householder has the lowest median household income of $33,063, with 2,976 households (3.0%) in this group.
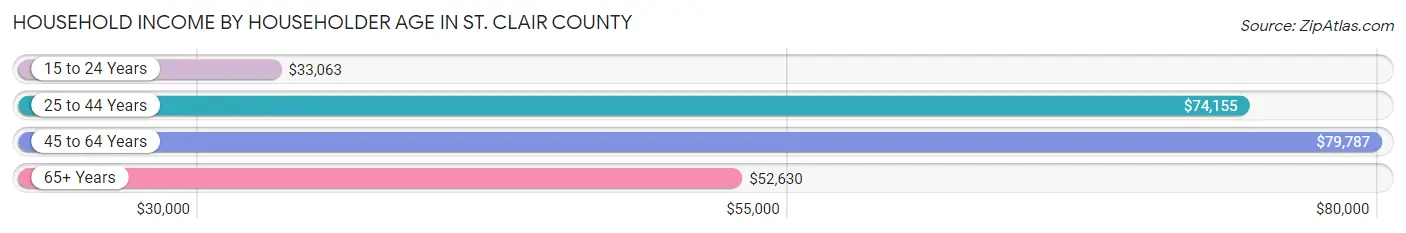
| Income Bracket | # Households | Median Income |
| 15 to 24 Years | 2,976 (3.0%) | $33,063 |
| 25 to 44 Years | 32,634 (32.4%) | $74,155 |
| 45 to 64 Years | 38,398 (38.1%) | $79,787 |
| 65+ Years | 26,693 (26.5%) | $52,630 |
| Total | 100,701 (100.0%) | $68,915 |
Poverty in St. Clair County
Income Below Poverty by Sex and Age in St. Clair County
With 12.2% poverty level for males and 15.3% for females among the residents of St. Clair County, under 5 year old males and 5 year old females are the most vulnerable to poverty, with 2,064 males (26.8%) and 340 females (31.2%) in their respective age groups living below the poverty level.
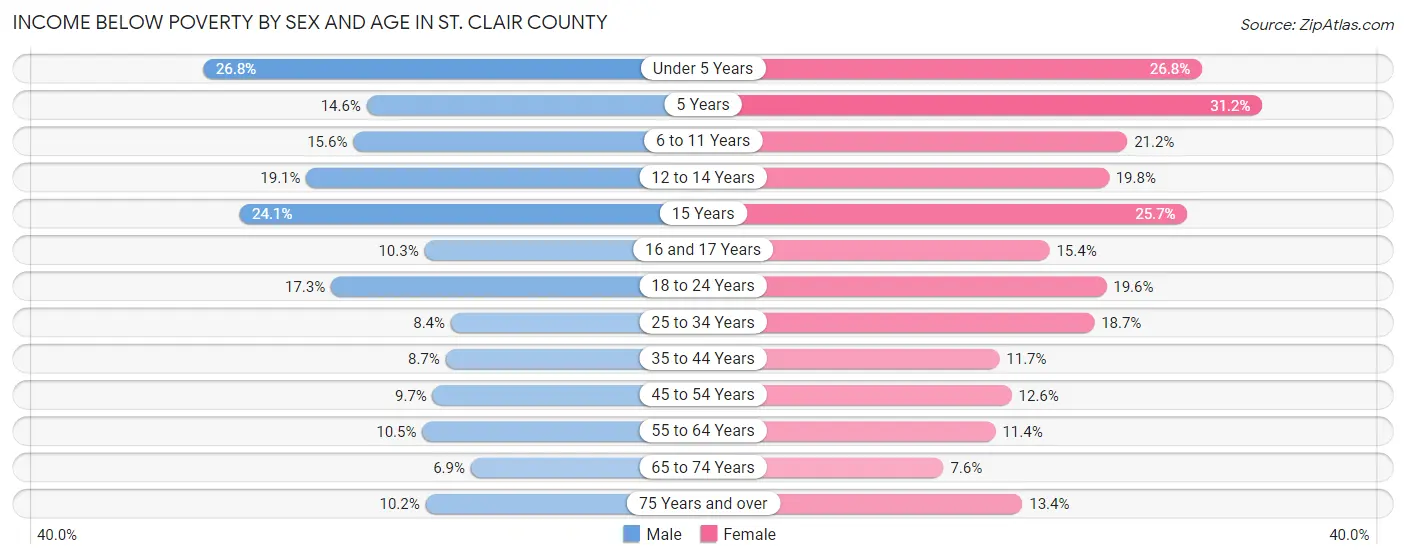
| Age Bracket | Male | Female |
| Under 5 Years | 2,064 (26.8%) | 1,946 (26.8%) |
| 5 Years | 197 (14.6%) | 340 (31.2%) |
| 6 to 11 Years | 1,651 (15.6%) | 1,962 (21.2%) |
| 12 to 14 Years | 990 (19.1%) | 1,125 (19.8%) |
| 15 Years | 388 (24.1%) | 477 (25.7%) |
| 16 and 17 Years | 377 (10.3%) | 501 (15.4%) |
| 18 to 24 Years | 1,826 (17.2%) | 2,001 (19.6%) |
| 25 to 34 Years | 1,314 (8.4%) | 3,128 (18.7%) |
| 35 to 44 Years | 1,397 (8.7%) | 2,012 (11.7%) |
| 45 to 54 Years | 1,451 (9.7%) | 2,048 (12.6%) |
| 55 to 64 Years | 1,777 (10.5%) | 2,068 (11.4%) |
| 65 to 74 Years | 794 (6.9%) | 1,008 (7.5%) |
| 75 Years and over | 642 (10.2%) | 1,300 (13.4%) |
| Total | 14,868 (12.2%) | 19,916 (15.3%) |
Income Above Poverty by Sex and Age in St. Clair County
According to the poverty statistics in St. Clair County, males aged 65 to 74 years and females aged 65 to 74 years are the age groups that are most secure financially, with 93.1% of males and 92.4% of females in these age groups living above the poverty line.
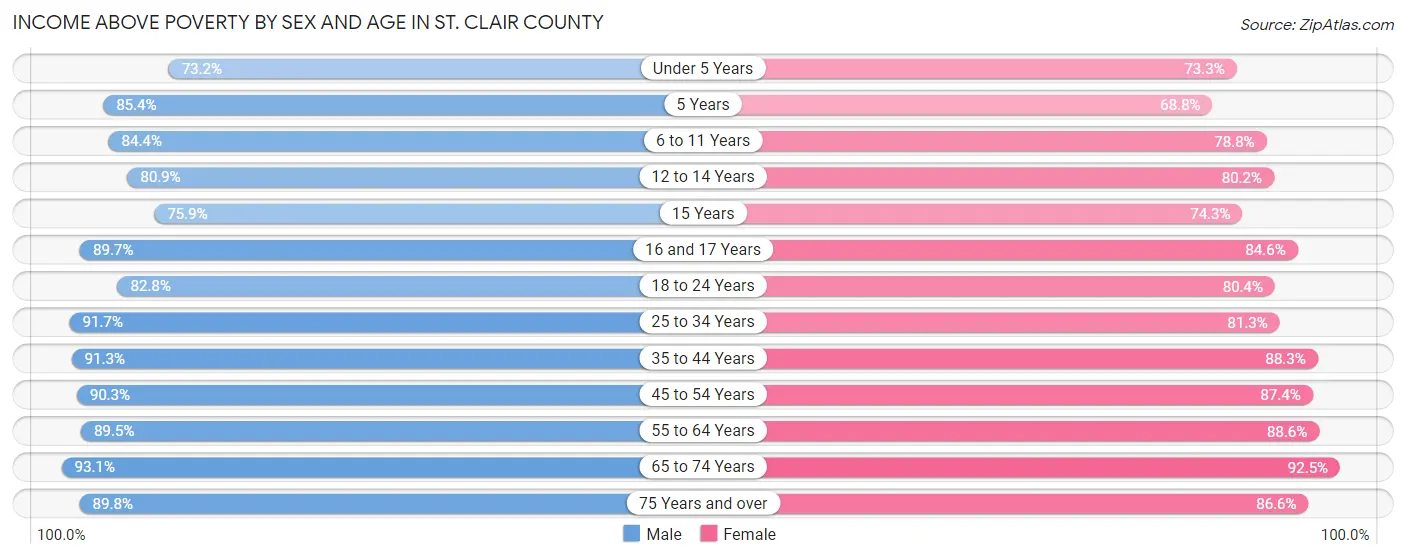
| Age Bracket | Male | Female |
| Under 5 Years | 5,648 (73.2%) | 5,330 (73.3%) |
| 5 Years | 1,152 (85.4%) | 749 (68.8%) |
| 6 to 11 Years | 8,930 (84.4%) | 7,297 (78.8%) |
| 12 to 14 Years | 4,199 (80.9%) | 4,551 (80.2%) |
| 15 Years | 1,224 (75.9%) | 1,382 (74.3%) |
| 16 and 17 Years | 3,279 (89.7%) | 2,749 (84.6%) |
| 18 to 24 Years | 8,760 (82.8%) | 8,188 (80.4%) |
| 25 to 34 Years | 14,420 (91.6%) | 13,567 (81.3%) |
| 35 to 44 Years | 14,590 (91.3%) | 15,181 (88.3%) |
| 45 to 54 Years | 13,515 (90.3%) | 14,197 (87.4%) |
| 55 to 64 Years | 15,191 (89.5%) | 16,057 (88.6%) |
| 65 to 74 Years | 10,770 (93.1%) | 12,342 (92.4%) |
| 75 Years and over | 5,632 (89.8%) | 8,399 (86.6%) |
| Total | 107,310 (87.8%) | 109,989 (84.7%) |
Income Below Poverty Among Married-Couple Families in St. Clair County
The poverty statistics for married-couple families in St. Clair County show that 3.0% or 1,342 of the total 44,817 families live below the poverty line. Families with 3 or 4 children have the highest poverty rate of 11.6%, comprising of 439 families. On the other hand, families with no children have the lowest poverty rate of 1.9%, which includes 514 families.

| Children | Above Poverty | Below Poverty |
| No Children | 26,875 (98.1%) | 514 (1.9%) |
| 1 or 2 Children | 12,756 (97.2%) | 365 (2.8%) |
| 3 or 4 Children | 3,333 (88.4%) | 439 (11.6%) |
| 5 or more Children | 511 (95.5%) | 24 (4.5%) |
| Total | 43,475 (97.0%) | 1,342 (3.0%) |
Income Below Poverty Among Single-Parent Households in St. Clair County
According to the poverty data in St. Clair County, 11.5% or 516 single-father households and 29.2% or 4,356 single-mother households are living below the poverty line. Among single-father households, those with 1 or 2 children have the highest poverty rate, with 260 households (12.6%) experiencing poverty. Likewise, among single-mother households, those with 5 or more children have the highest poverty rate, with 246 households (88.2%) falling below the poverty line.
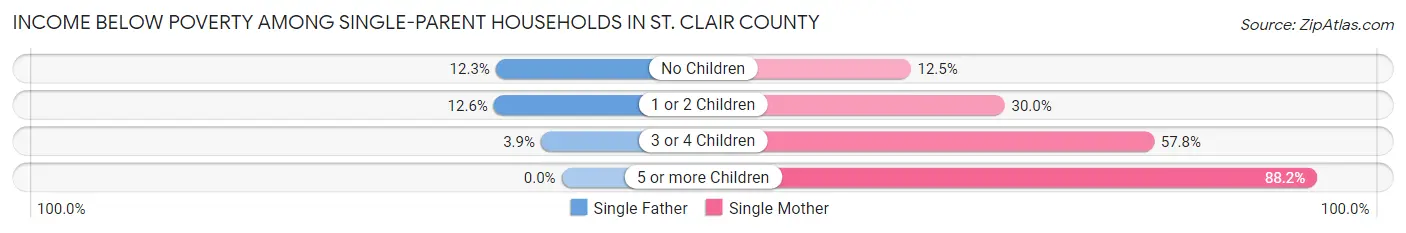
| Children | Single Father | Single Mother |
| No Children | 241 (12.3%) | 613 (12.4%) |
| 1 or 2 Children | 260 (12.6%) | 2,276 (30.0%) |
| 3 or 4 Children | 15 (3.8%) | 1,221 (57.8%) |
| 5 or more Children | 0 (0.0%) | 246 (88.2%) |
| Total | 516 (11.5%) | 4,356 (29.2%) |
Income Below Poverty Among Married-Couple vs Single-Parent Households in St. Clair County
The poverty data for St. Clair County shows that 1,342 of the married-couple family households (3.0%) and 4,872 of the single-parent households (25.1%) are living below the poverty level. Within the married-couple family households, those with 3 or 4 children have the highest poverty rate, with 439 households (11.6%) falling below the poverty line. Among the single-parent households, those with 5 or more children have the highest poverty rate, with 246 household (70.9%) living below poverty.
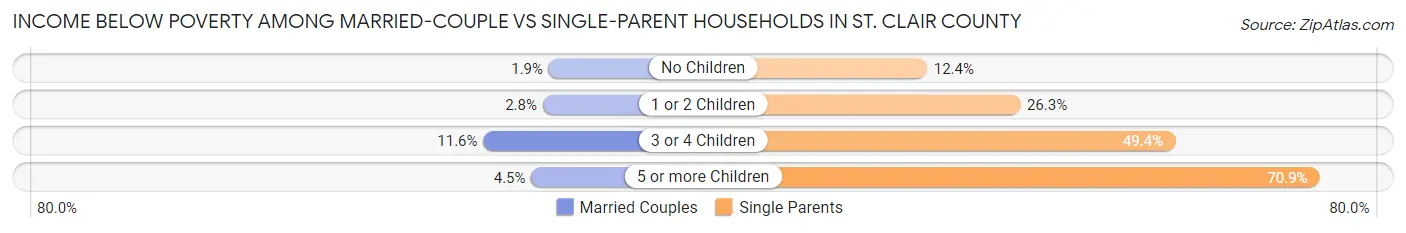
| Children | Married-Couple Families | Single-Parent Households |
| No Children | 514 (1.9%) | 854 (12.4%) |
| 1 or 2 Children | 365 (2.8%) | 2,536 (26.3%) |
| 3 or 4 Children | 439 (11.6%) | 1,236 (49.4%) |
| 5 or more Children | 24 (4.5%) | 246 (70.9%) |
| Total | 1,342 (3.0%) | 4,872 (25.1%) |
Employment Characteristics in St. Clair County
Employment by Class of Employer in St. Clair County
Among the 121,312 employed individuals in St. Clair County, private company employees (80,732 | 66.5%), not-for-profit organizations (10,970 | 9.0%), and federal government employees (10,302 | 8.5%) make up the most common classes of employment.
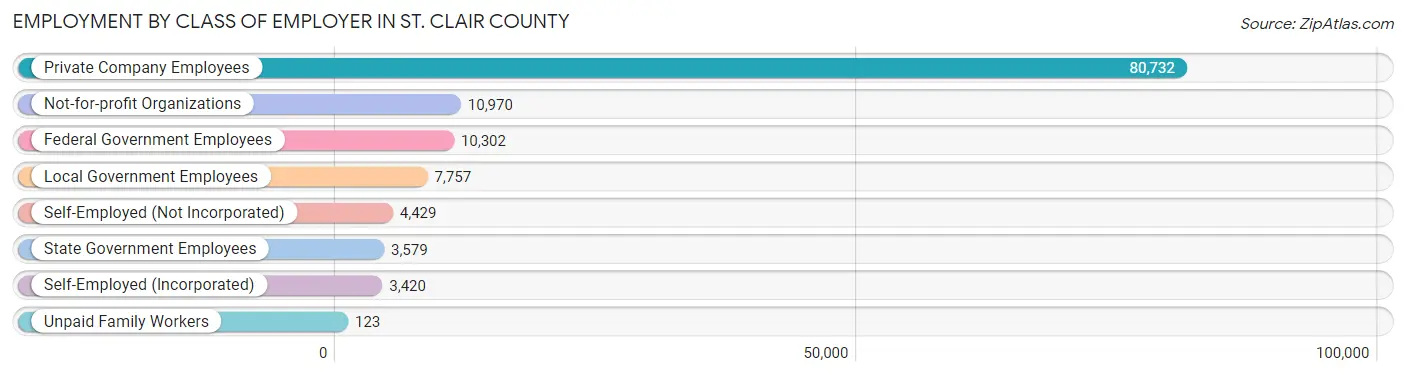
| Employer Class | # Employees | % Employees |
| Private Company Employees | 80,732 | 66.5% |
| Self-Employed (Incorporated) | 3,420 | 2.8% |
| Self-Employed (Not Incorporated) | 4,429 | 3.6% |
| Not-for-profit Organizations | 10,970 | 9.0% |
| Local Government Employees | 7,757 | 6.4% |
| State Government Employees | 3,579 | 2.9% |
| Federal Government Employees | 10,302 | 8.5% |
| Unpaid Family Workers | 123 | 0.1% |
| Total | 121,312 | 100.0% |
Employment Status by Age in St. Clair County
According to the labor force statistics for St. Clair County, out of the total population over 16 years of age (203,998), 64.2% or 130,967 individuals are in the labor force, with 5.7% or 7,465 of them unemployed. The age group with the highest labor force participation rate is 30 to 34 years, with 87.1% or 14,352 individuals in the labor force. Within the labor force, the 16 to 19 years age range has the highest percentage of unemployed individuals, with 14.4% or 1,022 of them being unemployed.
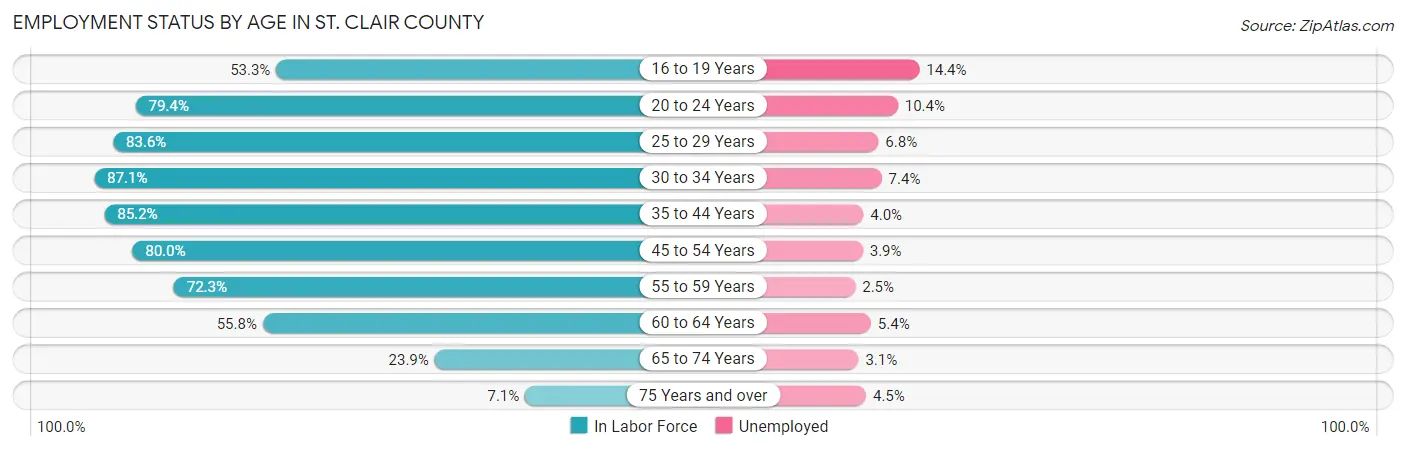
| Age Bracket | In Labor Force | Unemployed |
| 16 to 19 Years | 7,097 (53.3%) | 1,022 (14.4%) |
| 20 to 24 Years | 12,256 (79.4%) | 1,275 (10.4%) |
| 25 to 29 Years | 13,710 (83.6%) | 932 (6.8%) |
| 30 to 34 Years | 14,352 (87.1%) | 1,062 (7.4%) |
| 35 to 44 Years | 28,505 (85.2%) | 1,140 (4.0%) |
| 45 to 54 Years | 25,114 (80.0%) | 979 (3.9%) |
| 55 to 59 Years | 12,765 (72.3%) | 319 (2.5%) |
| 60 to 64 Years | 9,960 (55.8%) | 538 (5.4%) |
| 65 to 74 Years | 6,068 (23.9%) | 188 (3.1%) |
| 75 Years and over | 1,181 (7.1%) | 53 (4.5%) |
| Total | 130,967 (64.2%) | 7,465 (5.7%) |
Employment Status by Educational Attainment in St. Clair County
According to labor force statistics for St. Clair County, 78.4% of individuals (104,452) out of the total population between 25 and 64 years of age (133,229) are in the labor force, with 4.7% or 4,909 of them being unemployed. The group with the highest labor force participation rate are those with the educational attainment of bachelor's degree or higher, with 87.0% or 37,199 individuals in the labor force. Within the labor force, individuals with less than high school education have the highest percentage of unemployment, with 9.8% or 455 of them being unemployed.
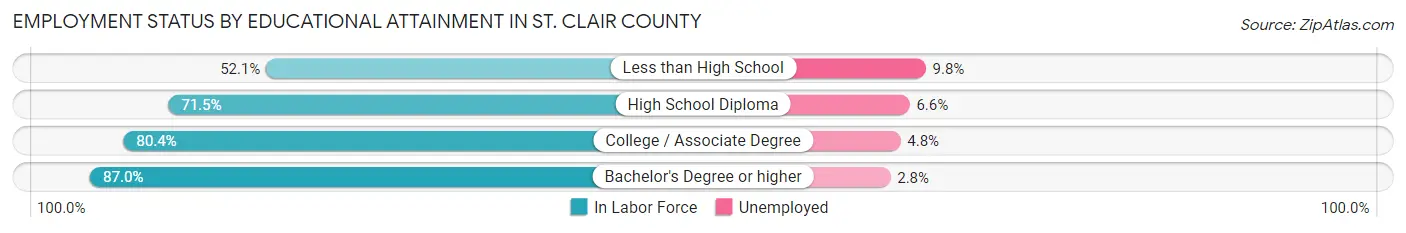
| Educational Attainment | In Labor Force | Unemployed |
| Less than High School | 4,646 (52.1%) | 874 (9.8%) |
| High School Diploma | 24,145 (71.5%) | 2,229 (6.6%) |
| College / Associate Degree | 38,419 (80.4%) | 2,294 (4.8%) |
| Bachelor's Degree or higher | 37,199 (87.0%) | 1,197 (2.8%) |
| Total | 104,452 (78.4%) | 6,262 (4.7%) |
Employment Occupations by Sex in St. Clair County
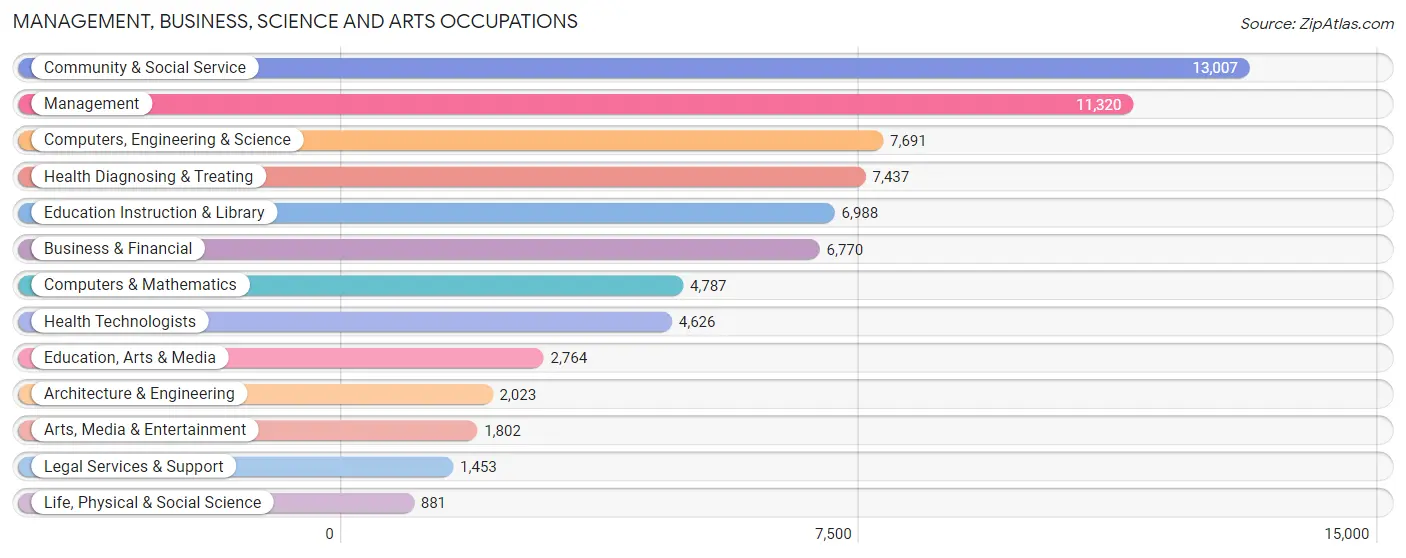
Management, Business, Science and Arts Occupations
The most common Management, Business, Science and Arts occupations in St. Clair County are Community & Social Service (13,007 | 10.8%), Management (11,320 | 9.4%), Computers, Engineering & Science (7,691 | 6.4%), Health Diagnosing & Treating (7,437 | 6.2%), and Education Instruction & Library (6,988 | 5.8%).
Management, Business, Science and Arts Occupations by Sex
Within the Management, Business, Science and Arts occupations in St. Clair County, the most male-oriented occupations are Computers & Mathematics (79.2%), Architecture & Engineering (78.6%), and Computers, Engineering & Science (77.2%), while the most female-oriented occupations are Health Diagnosing & Treating (80.7%), Education Instruction & Library (79.2%), and Education, Arts & Media (79.1%).
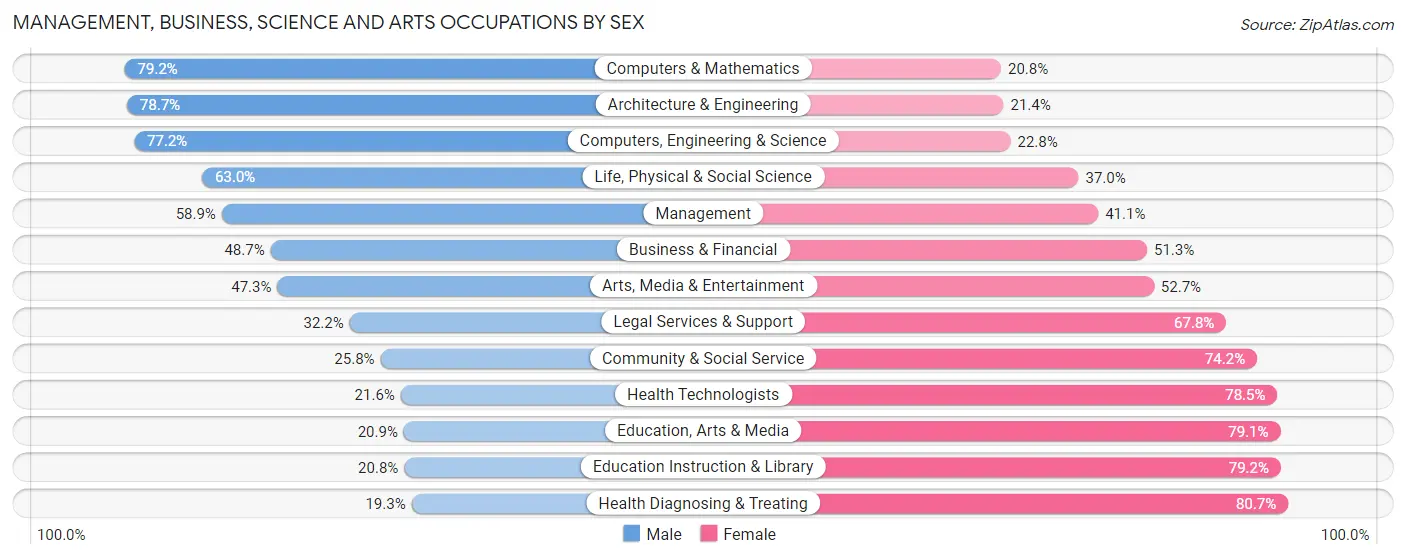
| Occupation | Male | Female |
| Management | 6,666 (58.9%) | 4,654 (41.1%) |
| Business & Financial | 3,298 (48.7%) | 3,472 (51.3%) |
| Computers, Engineering & Science | 5,936 (77.2%) | 1,755 (22.8%) |
| Computers & Mathematics | 3,790 (79.2%) | 997 (20.8%) |
| Architecture & Engineering | 1,591 (78.6%) | 432 (21.3%) |
| Life, Physical & Social Science | 555 (63.0%) | 326 (37.0%) |
| Community & Social Service | 3,353 (25.8%) | 9,654 (74.2%) |
| Education, Arts & Media | 578 (20.9%) | 2,186 (79.1%) |
| Legal Services & Support | 468 (32.2%) | 985 (67.8%) |
| Education Instruction & Library | 1,455 (20.8%) | 5,533 (79.2%) |
| Arts, Media & Entertainment | 852 (47.3%) | 950 (52.7%) |
| Health Diagnosing & Treating | 1,435 (19.3%) | 6,002 (80.7%) |
| Health Technologists | 997 (21.5%) | 3,629 (78.4%) |
| Total (Category) | 20,688 (44.8%) | 25,537 (55.2%) |
| Total (Overall) | 59,681 (49.6%) | 60,518 (50.3%) |
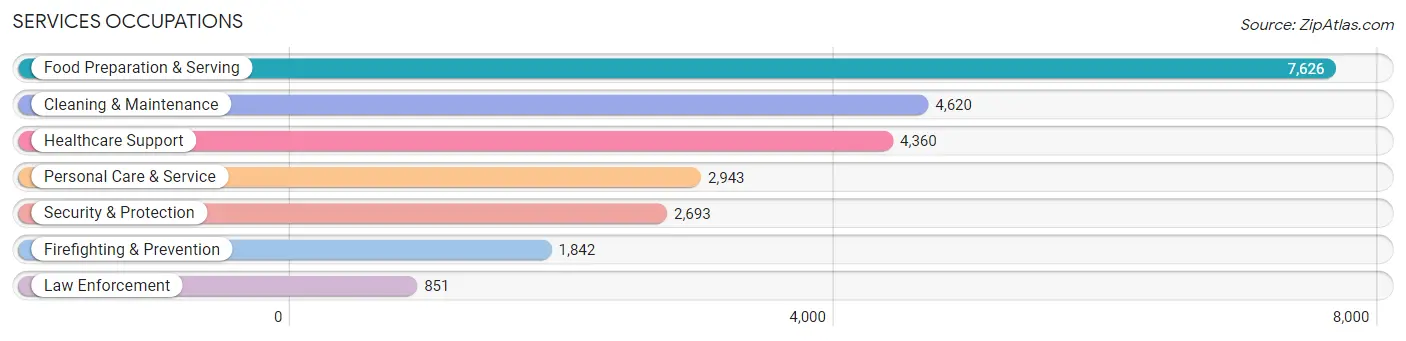
Services Occupations
The most common Services occupations in St. Clair County are Food Preparation & Serving (7,626 | 6.3%), Cleaning & Maintenance (4,620 | 3.8%), Healthcare Support (4,360 | 3.6%), Personal Care & Service (2,943 | 2.5%), and Security & Protection (2,693 | 2.2%).
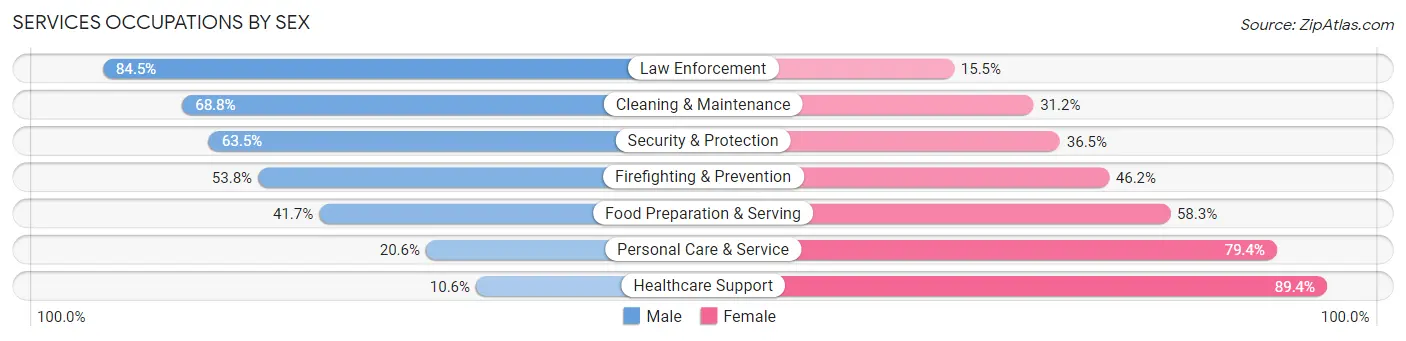
Services Occupations by Sex
Within the Services occupations in St. Clair County, the most male-oriented occupations are Law Enforcement (84.5%), Cleaning & Maintenance (68.8%), and Security & Protection (63.5%), while the most female-oriented occupations are Healthcare Support (89.4%), Personal Care & Service (79.4%), and Food Preparation & Serving (58.3%).
| Occupation | Male | Female |
| Healthcare Support | 464 (10.6%) | 3,896 (89.4%) |
| Security & Protection | 1,710 (63.5%) | 983 (36.5%) |
| Firefighting & Prevention | 991 (53.8%) | 851 (46.2%) |
| Law Enforcement | 719 (84.5%) | 132 (15.5%) |
| Food Preparation & Serving | 3,180 (41.7%) | 4,446 (58.3%) |
| Cleaning & Maintenance | 3,177 (68.8%) | 1,443 (31.2%) |
| Personal Care & Service | 605 (20.6%) | 2,338 (79.4%) |
| Total (Category) | 9,136 (41.1%) | 13,106 (58.9%) |
| Total (Overall) | 59,681 (49.6%) | 60,518 (50.3%) |
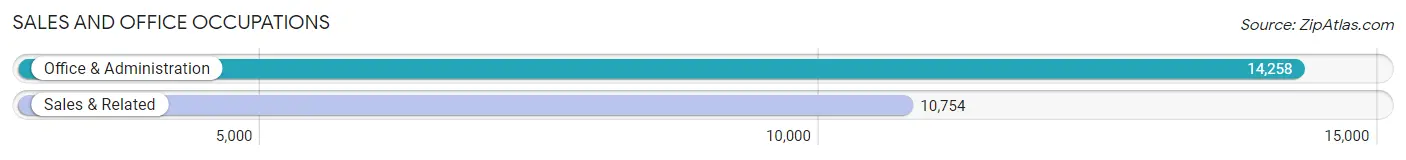
Sales and Office Occupations
The most common Sales and Office occupations in St. Clair County are Office & Administration (14,258 | 11.9%), and Sales & Related (10,754 | 8.9%).
Sales and Office Occupations by Sex
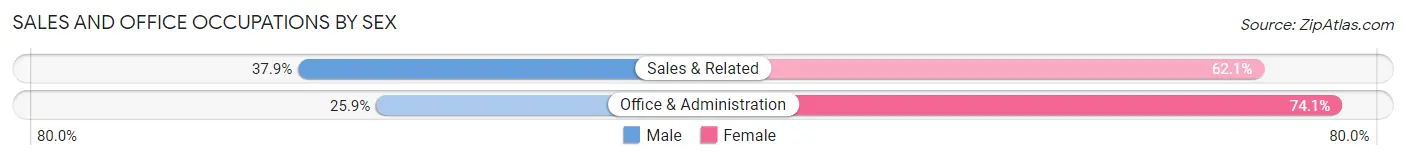
| Occupation | Male | Female |
| Sales & Related | 4,080 (37.9%) | 6,674 (62.1%) |
| Office & Administration | 3,695 (25.9%) | 10,563 (74.1%) |
| Total (Category) | 7,775 (31.1%) | 17,237 (68.9%) |
| Total (Overall) | 59,681 (49.6%) | 60,518 (50.3%) |
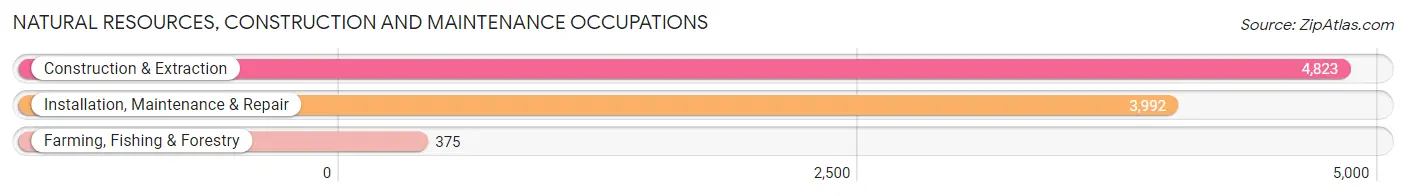
Natural Resources, Construction and Maintenance Occupations
The most common Natural Resources, Construction and Maintenance occupations in St. Clair County are Construction & Extraction (4,823 | 4.0%), Installation, Maintenance & Repair (3,992 | 3.3%), and Farming, Fishing & Forestry (375 | 0.3%).
Natural Resources, Construction and Maintenance Occupations by Sex
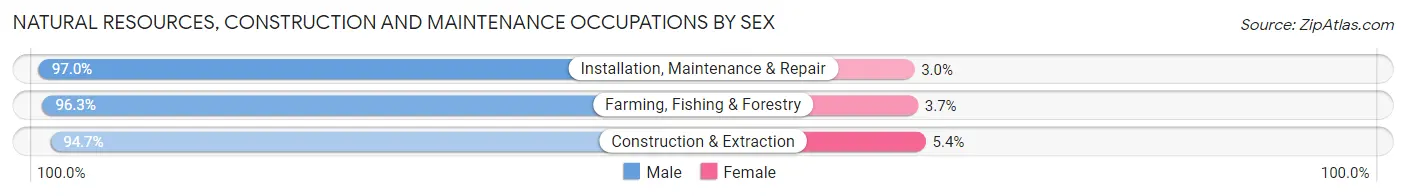
| Occupation | Male | Female |
| Farming, Fishing & Forestry | 361 (96.3%) | 14 (3.7%) |
| Construction & Extraction | 4,565 (94.7%) | 258 (5.3%) |
| Installation, Maintenance & Repair | 3,873 (97.0%) | 119 (3.0%) |
| Total (Category) | 8,799 (95.8%) | 391 (4.3%) |
| Total (Overall) | 59,681 (49.6%) | 60,518 (50.3%) |
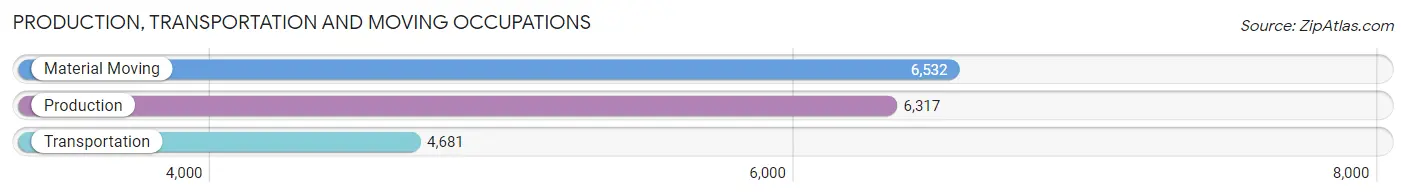
Production, Transportation and Moving Occupations
The most common Production, Transportation and Moving occupations in St. Clair County are Material Moving (6,532 | 5.4%), Production (6,317 | 5.3%), and Transportation (4,681 | 3.9%).
Production, Transportation and Moving Occupations by Sex

| Occupation | Male | Female |
| Production | 4,351 (68.9%) | 1,966 (31.1%) |
| Transportation | 3,955 (84.5%) | 726 (15.5%) |
| Material Moving | 4,977 (76.2%) | 1,555 (23.8%) |
| Total (Category) | 13,283 (75.8%) | 4,247 (24.2%) |
| Total (Overall) | 59,681 (49.6%) | 60,518 (50.3%) |
Employment Industries by Sex in St. Clair County
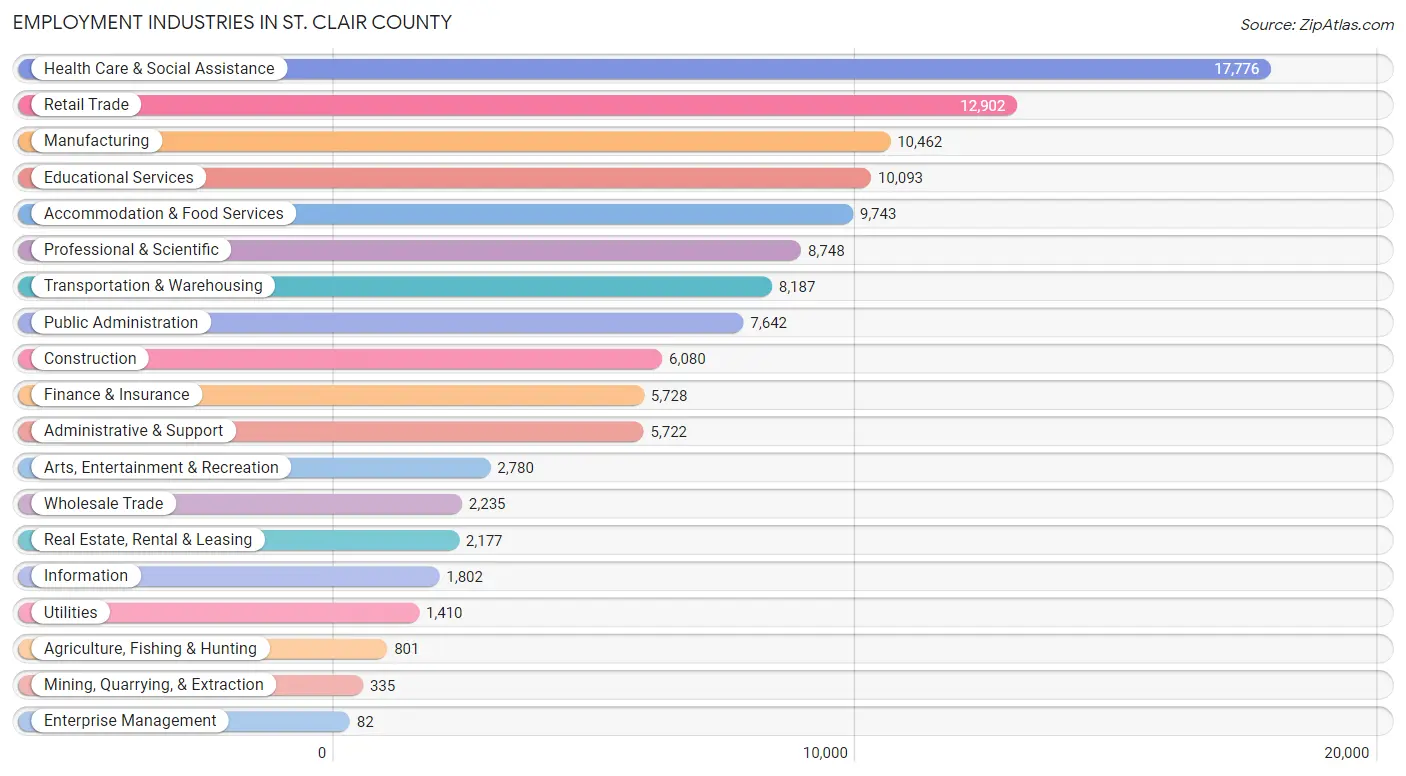
Employment Industries in St. Clair County
The major employment industries in St. Clair County include Health Care & Social Assistance (17,776 | 14.8%), Retail Trade (12,902 | 10.7%), Manufacturing (10,462 | 8.7%), Educational Services (10,093 | 8.4%), and Accommodation & Food Services (9,743 | 8.1%).
Employment Industries by Sex in St. Clair County
The St. Clair County industries that see more men than women are Mining, Quarrying, & Extraction (94.3%), Agriculture, Fishing & Hunting (90.5%), and Construction (86.8%), whereas the industries that tend to have a higher number of women are Health Care & Social Assistance (82.2%), Educational Services (73.9%), and Enterprise Management (67.1%).
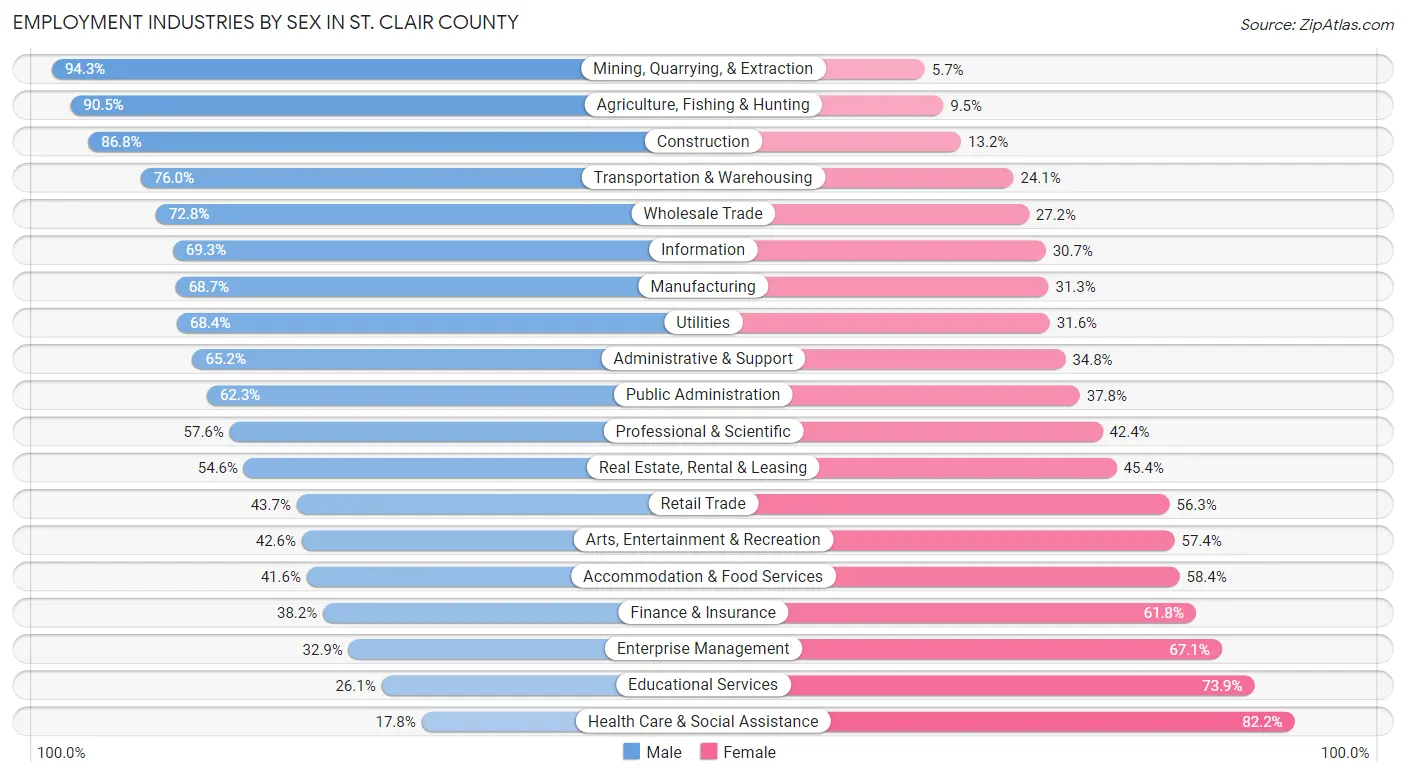
| Industry | Male | Female |
| Agriculture, Fishing & Hunting | 725 (90.5%) | 76 (9.5%) |
| Mining, Quarrying, & Extraction | 316 (94.3%) | 19 (5.7%) |
| Construction | 5,278 (86.8%) | 802 (13.2%) |
| Manufacturing | 7,190 (68.7%) | 3,272 (31.3%) |
| Wholesale Trade | 1,627 (72.8%) | 608 (27.2%) |
| Retail Trade | 5,634 (43.7%) | 7,268 (56.3%) |
| Transportation & Warehousing | 6,218 (75.9%) | 1,969 (24.0%) |
| Utilities | 965 (68.4%) | 445 (31.6%) |
| Information | 1,249 (69.3%) | 553 (30.7%) |
| Finance & Insurance | 2,190 (38.2%) | 3,538 (61.8%) |
| Real Estate, Rental & Leasing | 1,189 (54.6%) | 988 (45.4%) |
| Professional & Scientific | 5,035 (57.6%) | 3,713 (42.4%) |
| Enterprise Management | 27 (32.9%) | 55 (67.1%) |
| Administrative & Support | 3,732 (65.2%) | 1,990 (34.8%) |
| Educational Services | 2,637 (26.1%) | 7,456 (73.9%) |
| Health Care & Social Assistance | 3,169 (17.8%) | 14,607 (82.2%) |
| Arts, Entertainment & Recreation | 1,185 (42.6%) | 1,595 (57.4%) |
| Accommodation & Food Services | 4,053 (41.6%) | 5,690 (58.4%) |
| Public Administration | 4,757 (62.3%) | 2,885 (37.8%) |
| Total | 59,681 (49.6%) | 60,518 (50.3%) |
Education in St. Clair County
School Enrollment in St. Clair County
The most common levels of schooling among the 65,483 students in St. Clair County are middle school (15,228 | 23.3%), high school (14,259 | 21.8%), and elementary school (12,480 | 19.1%).
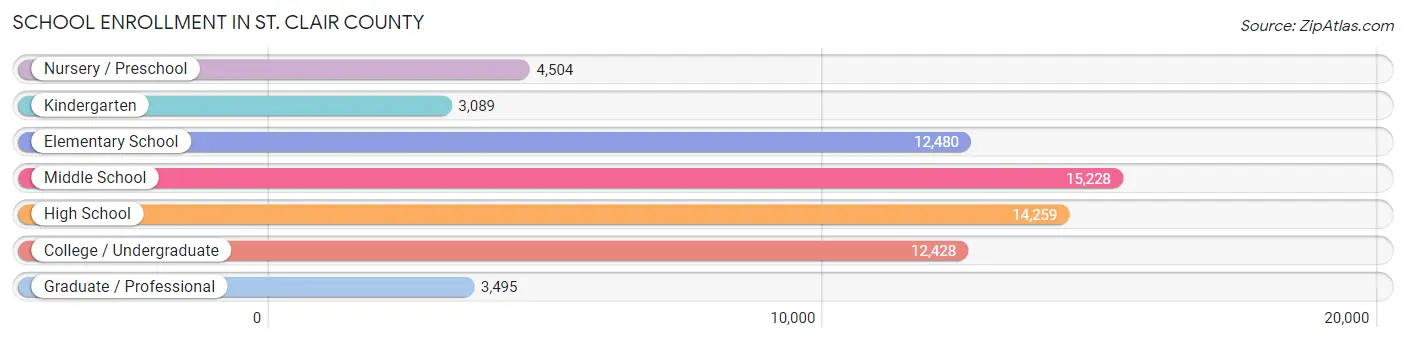
| School Level | # Students | % Students |
| Nursery / Preschool | 4,504 | 6.9% |
| Kindergarten | 3,089 | 4.7% |
| Elementary School | 12,480 | 19.1% |
| Middle School | 15,228 | 23.3% |
| High School | 14,259 | 21.8% |
| College / Undergraduate | 12,428 | 19.0% |
| Graduate / Professional | 3,495 | 5.3% |
| Total | 65,483 | 100.0% |
School Enrollment by Age by Funding Source in St. Clair County
Out of a total of 65,483 students who are enrolled in schools in St. Clair County, 11,263 (17.2%) attend a private institution, while the remaining 54,220 (82.8%) are enrolled in public schools. The age group of 3 to 4 year olds has the highest likelihood of being enrolled in private schools, with 1,426 (36.8% in the age bracket) enrolled. Conversely, the age group of 15 to 17 year olds has the lowest likelihood of being enrolled in a private school, with 9,283 (92.0% in the age bracket) attending a public institution.
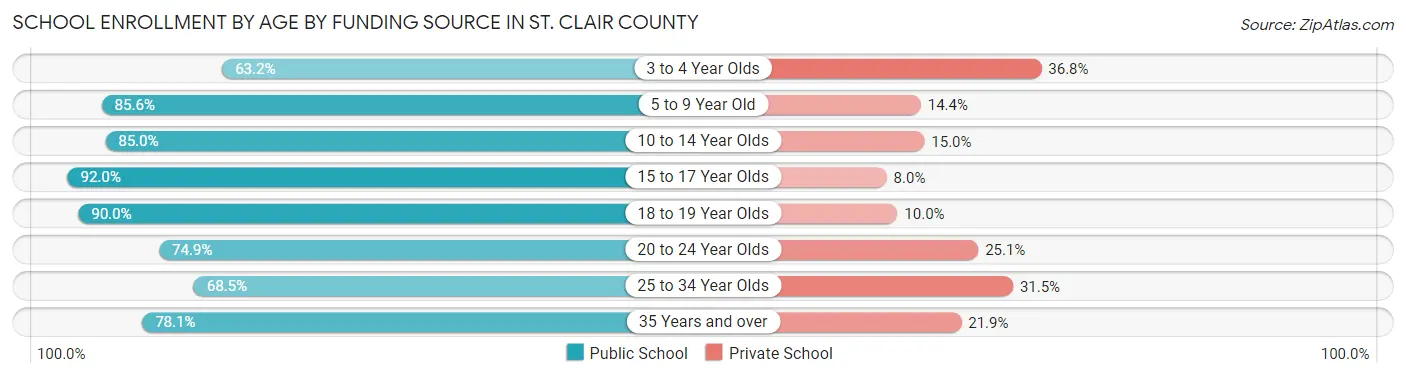
| Age Bracket | Public School | Private School |
| 3 to 4 Year Olds | 2,447 (63.2%) | 1,426 (36.8%) |
| 5 to 9 Year Old | 12,533 (85.6%) | 2,101 (14.4%) |
| 10 to 14 Year Olds | 15,722 (85.0%) | 2,781 (15.0%) |
| 15 to 17 Year Olds | 9,283 (92.0%) | 808 (8.0%) |
| 18 to 19 Year Olds | 3,588 (90.0%) | 399 (10.0%) |
| 20 to 24 Year Olds | 4,055 (74.9%) | 1,356 (25.1%) |
| 25 to 34 Year Olds | 2,895 (68.5%) | 1,333 (31.5%) |
| 35 Years and over | 3,714 (78.1%) | 1,042 (21.9%) |
| Total | 54,220 (82.8%) | 11,263 (17.2%) |
Educational Attainment by Field of Study in St. Clair County
Business (13,524 | 23.5%), education (9,403 | 16.4%), science & technology (5,560 | 9.7%), arts & humanities (4,496 | 7.8%), and social sciences (3,372 | 5.9%) are the most common fields of study among 57,492 individuals in St. Clair County who have obtained a bachelor's degree or higher.
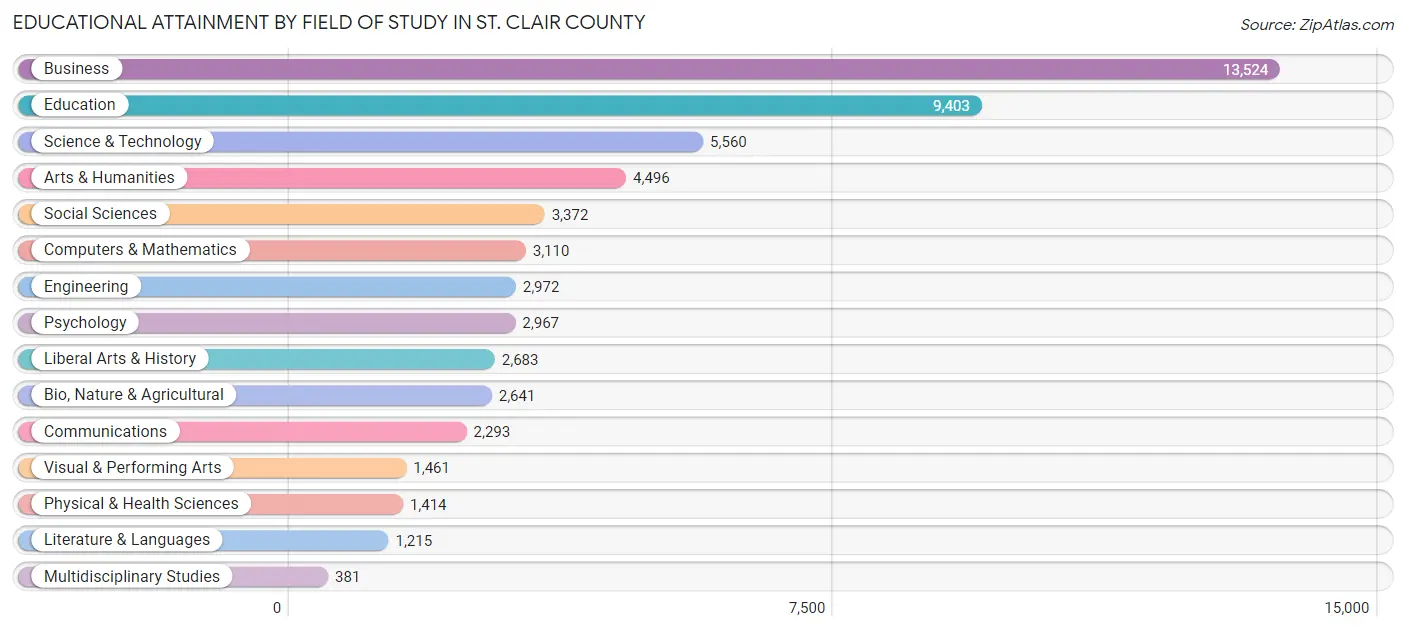
| Field of Study | # Graduates | % Graduates |
| Computers & Mathematics | 3,110 | 5.4% |
| Bio, Nature & Agricultural | 2,641 | 4.6% |
| Physical & Health Sciences | 1,414 | 2.5% |
| Psychology | 2,967 | 5.2% |
| Social Sciences | 3,372 | 5.9% |
| Engineering | 2,972 | 5.2% |
| Multidisciplinary Studies | 381 | 0.7% |
| Science & Technology | 5,560 | 9.7% |
| Business | 13,524 | 23.5% |
| Education | 9,403 | 16.4% |
| Literature & Languages | 1,215 | 2.1% |
| Liberal Arts & History | 2,683 | 4.7% |
| Visual & Performing Arts | 1,461 | 2.5% |
| Communications | 2,293 | 4.0% |
| Arts & Humanities | 4,496 | 7.8% |
| Total | 57,492 | 100.0% |
Transportation & Commute in St. Clair County
Vehicle Availability by Sex in St. Clair County
The most prevalent vehicle ownership categories in St. Clair County are males with 2 vehicles (25,153, accounting for 41.2%) and females with 2 vehicles (23,039, making up 42.3%).
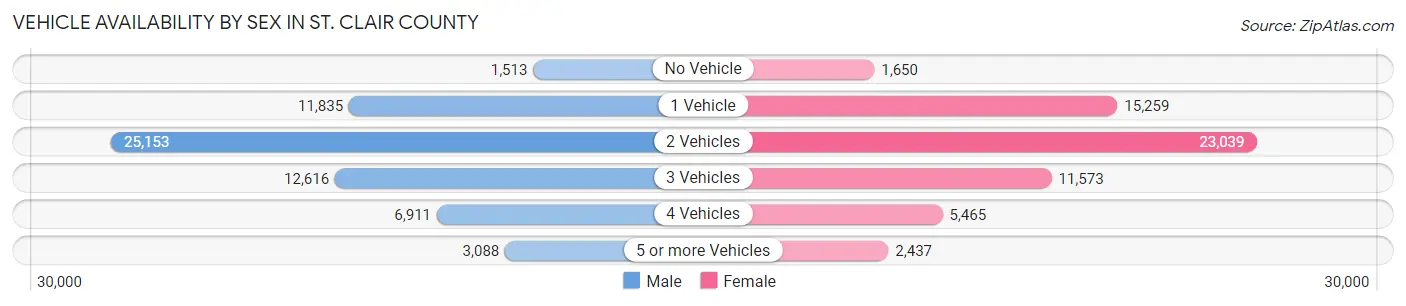
| Vehicles Available | Male | Female |
| No Vehicle | 1,513 (2.5%) | 1,650 (2.8%) |
| 1 Vehicle | 11,835 (19.4%) | 15,259 (25.7%) |
| 2 Vehicles | 25,153 (41.2%) | 23,039 (38.8%) |
| 3 Vehicles | 12,616 (20.6%) | 11,573 (19.5%) |
| 4 Vehicles | 6,911 (11.3%) | 5,465 (9.2%) |
| 5 or more Vehicles | 3,088 (5.1%) | 2,437 (4.1%) |
| Total | 61,116 (100.0%) | 59,423 (100.0%) |
Commute Time in St. Clair County
The most frequently occuring commute durations in St. Clair County are 15 to 19 minutes (17,785 commuters, 16.1%), 20 to 24 minutes (15,499 commuters, 14.1%), and 10 to 14 minutes (15,168 commuters, 13.8%).
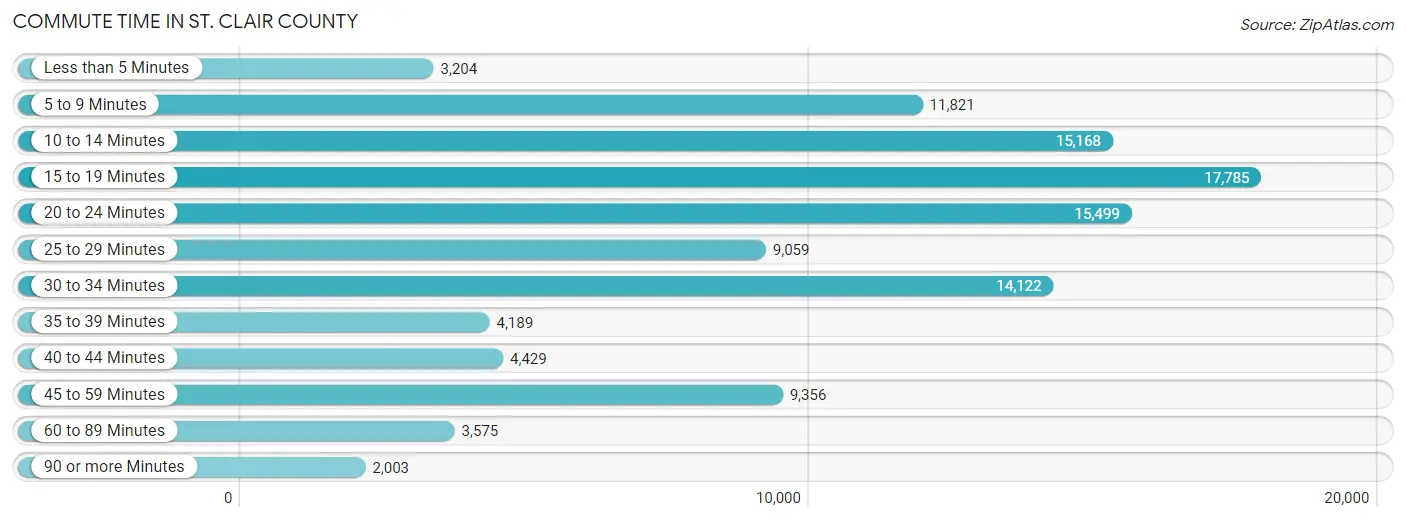
| Commute Time | # Commuters | % Commuters |
| Less than 5 Minutes | 3,204 | 2.9% |
| 5 to 9 Minutes | 11,821 | 10.7% |
| 10 to 14 Minutes | 15,168 | 13.8% |
| 15 to 19 Minutes | 17,785 | 16.1% |
| 20 to 24 Minutes | 15,499 | 14.1% |
| 25 to 29 Minutes | 9,059 | 8.2% |
| 30 to 34 Minutes | 14,122 | 12.8% |
| 35 to 39 Minutes | 4,189 | 3.8% |
| 40 to 44 Minutes | 4,429 | 4.0% |
| 45 to 59 Minutes | 9,356 | 8.5% |
| 60 to 89 Minutes | 3,575 | 3.2% |
| 90 or more Minutes | 2,003 | 1.8% |
Commute Time by Sex in St. Clair County
The most common commute times in St. Clair County are 15 to 19 minutes (8,939 commuters, 15.9%) for males and 15 to 19 minutes (8,846 commuters, 16.4%) for females.
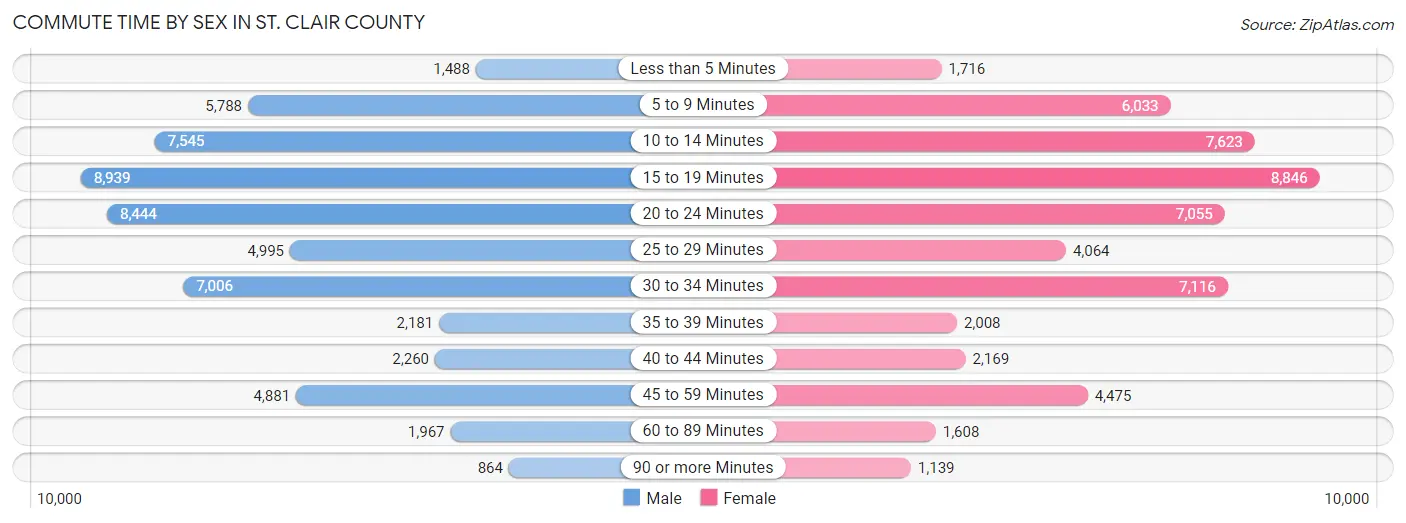
| Commute Time | Male | Female |
| Less than 5 Minutes | 1,488 (2.6%) | 1,716 (3.2%) |
| 5 to 9 Minutes | 5,788 (10.3%) | 6,033 (11.2%) |
| 10 to 14 Minutes | 7,545 (13.4%) | 7,623 (14.2%) |
| 15 to 19 Minutes | 8,939 (15.9%) | 8,846 (16.4%) |
| 20 to 24 Minutes | 8,444 (15.0%) | 7,055 (13.1%) |
| 25 to 29 Minutes | 4,995 (8.9%) | 4,064 (7.5%) |
| 30 to 34 Minutes | 7,006 (12.4%) | 7,116 (13.2%) |
| 35 to 39 Minutes | 2,181 (3.9%) | 2,008 (3.7%) |
| 40 to 44 Minutes | 2,260 (4.0%) | 2,169 (4.0%) |
| 45 to 59 Minutes | 4,881 (8.7%) | 4,475 (8.3%) |
| 60 to 89 Minutes | 1,967 (3.5%) | 1,608 (3.0%) |
| 90 or more Minutes | 864 (1.5%) | 1,139 (2.1%) |
Time of Departure to Work by Sex in St. Clair County
The most frequent times of departure to work in St. Clair County are 7:00 AM to 7:29 AM (7,493, 13.3%) for males and 7:30 AM to 7:59 AM (8,678, 16.1%) for females.
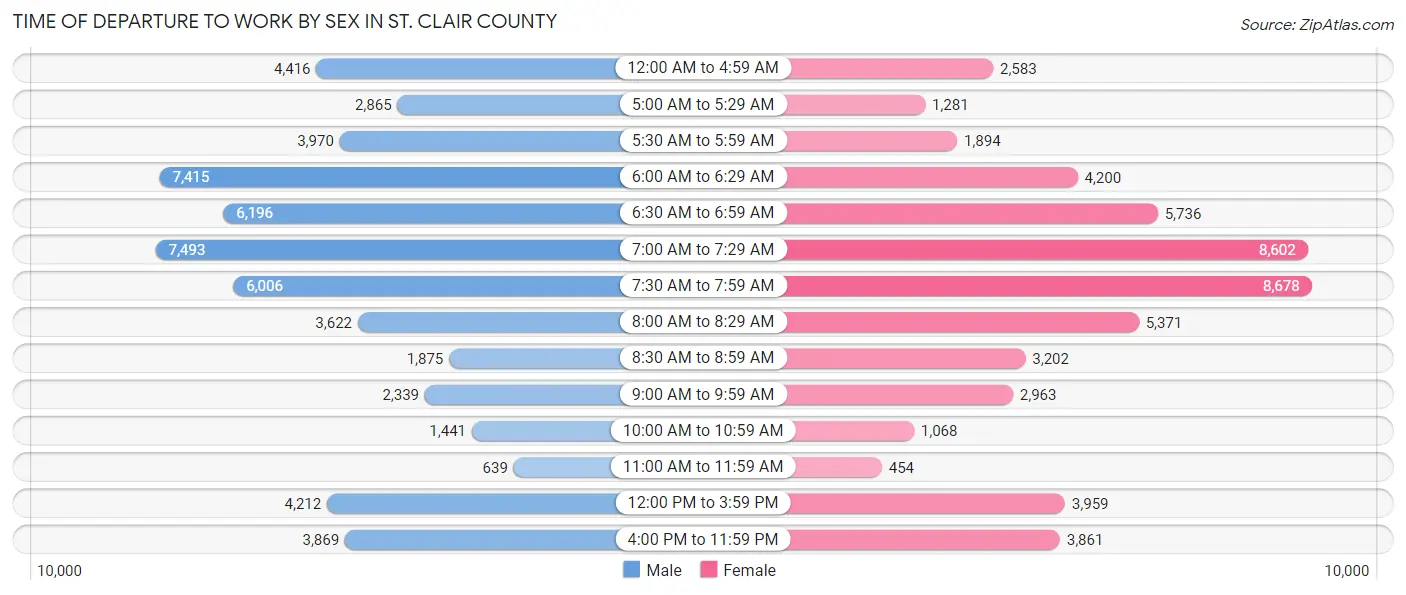
| Time of Departure | Male | Female |
| 12:00 AM to 4:59 AM | 4,416 (7.8%) | 2,583 (4.8%) |
| 5:00 AM to 5:29 AM | 2,865 (5.1%) | 1,281 (2.4%) |
| 5:30 AM to 5:59 AM | 3,970 (7.0%) | 1,894 (3.5%) |
| 6:00 AM to 6:29 AM | 7,415 (13.2%) | 4,200 (7.8%) |
| 6:30 AM to 6:59 AM | 6,196 (11.0%) | 5,736 (10.6%) |
| 7:00 AM to 7:29 AM | 7,493 (13.3%) | 8,602 (16.0%) |
| 7:30 AM to 7:59 AM | 6,006 (10.7%) | 8,678 (16.1%) |
| 8:00 AM to 8:29 AM | 3,622 (6.4%) | 5,371 (10.0%) |
| 8:30 AM to 8:59 AM | 1,875 (3.3%) | 3,202 (5.9%) |
| 9:00 AM to 9:59 AM | 2,339 (4.2%) | 2,963 (5.5%) |
| 10:00 AM to 10:59 AM | 1,441 (2.6%) | 1,068 (2.0%) |
| 11:00 AM to 11:59 AM | 639 (1.1%) | 454 (0.8%) |
| 12:00 PM to 3:59 PM | 4,212 (7.5%) | 3,959 (7.3%) |
| 4:00 PM to 11:59 PM | 3,869 (6.9%) | 3,861 (7.2%) |
| Total | 56,358 (100.0%) | 53,852 (100.0%) |
Housing Occupancy in St. Clair County
Occupancy by Ownership in St. Clair County
Of the total 100,701 dwellings in St. Clair County, owner-occupied units account for 68,404 (67.9%), while renter-occupied units make up 32,297 (32.1%).
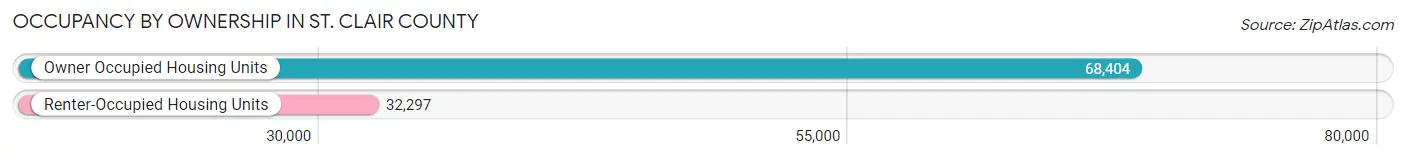
| Occupancy | # Housing Units | % Housing Units |
| Owner Occupied Housing Units | 68,404 | 67.9% |
| Renter-Occupied Housing Units | 32,297 | 32.1% |
| Total Occupied Housing Units | 100,701 | 100.0% |
Occupancy by Household Size in St. Clair County
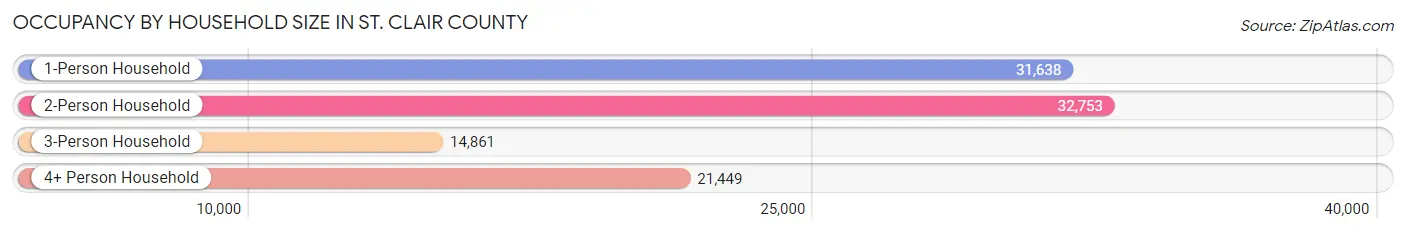
| Household Size | # Housing Units | % Housing Units |
| 1-Person Household | 31,638 | 31.4% |
| 2-Person Household | 32,753 | 32.5% |
| 3-Person Household | 14,861 | 14.8% |
| 4+ Person Household | 21,449 | 21.3% |
| Total Housing Units | 100,701 | 100.0% |
Occupancy by Ownership by Household Size in St. Clair County
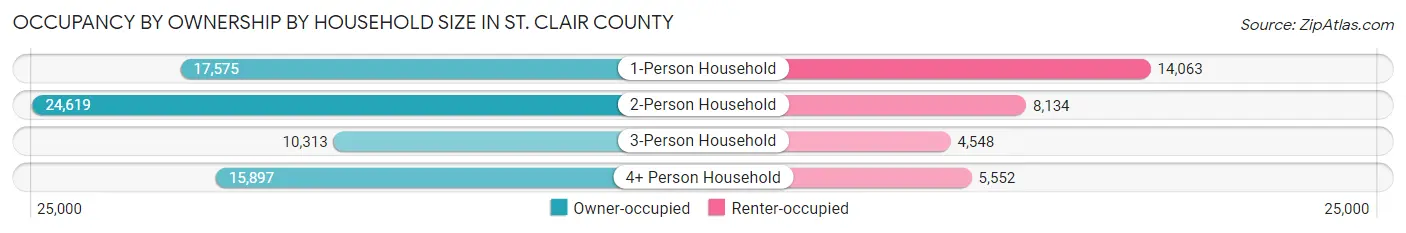
| Household Size | Owner-occupied | Renter-occupied |
| 1-Person Household | 17,575 (55.5%) | 14,063 (44.5%) |
| 2-Person Household | 24,619 (75.2%) | 8,134 (24.8%) |
| 3-Person Household | 10,313 (69.4%) | 4,548 (30.6%) |
| 4+ Person Household | 15,897 (74.1%) | 5,552 (25.9%) |
| Total Housing Units | 68,404 (67.9%) | 32,297 (32.1%) |
Occupancy by Educational Attainment in St. Clair County
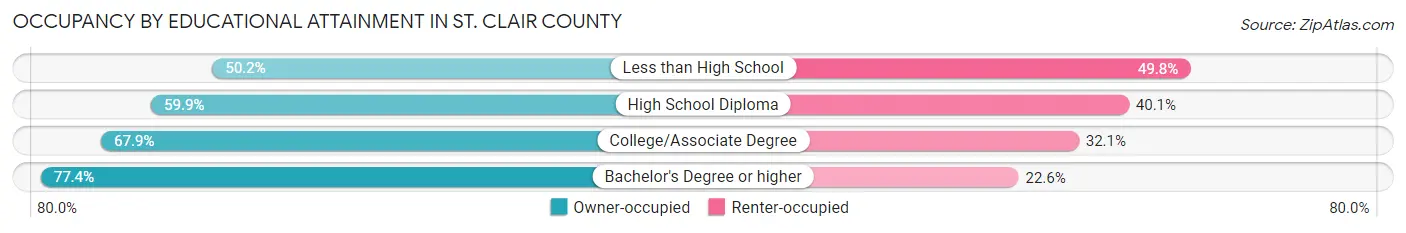
| Household Size | Owner-occupied | Renter-occupied |
| Less than High School | 3,460 (50.2%) | 3,430 (49.8%) |
| High School Diploma | 14,109 (59.9%) | 9,438 (40.1%) |
| College/Associate Degree | 25,303 (67.9%) | 11,984 (32.1%) |
| Bachelor's Degree or higher | 25,532 (77.4%) | 7,445 (22.6%) |
Occupancy by Age of Householder in St. Clair County
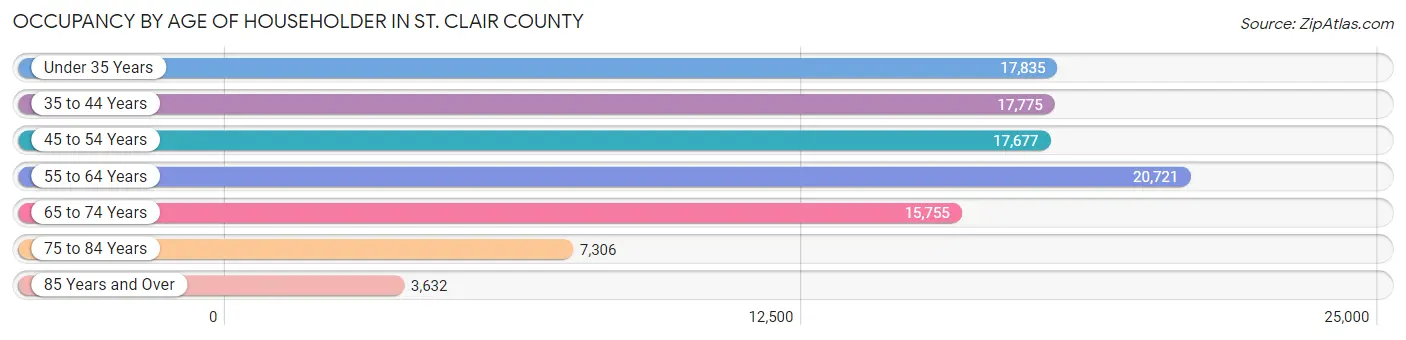
| Age Bracket | # Households | % Households |
| Under 35 Years | 17,835 | 17.7% |
| 35 to 44 Years | 17,775 | 17.6% |
| 45 to 54 Years | 17,677 | 17.5% |
| 55 to 64 Years | 20,721 | 20.6% |
| 65 to 74 Years | 15,755 | 15.7% |
| 75 to 84 Years | 7,306 | 7.3% |
| 85 Years and Over | 3,632 | 3.6% |
| Total | 100,701 | 100.0% |
Housing Finances in St. Clair County
Median Income by Occupancy in St. Clair County
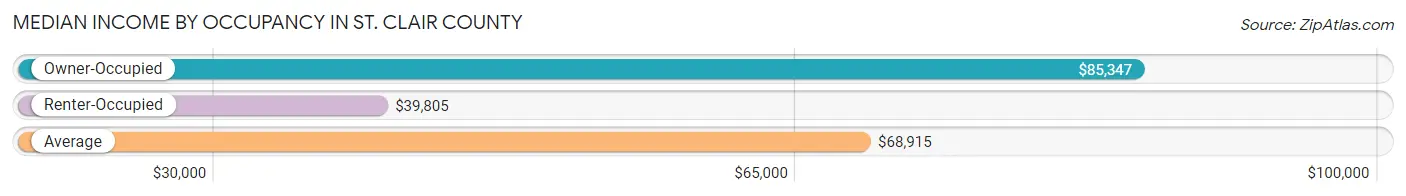
| Occupancy Type | # Households | Median Income |
| Owner-Occupied | 68,404 (67.9%) | $85,347 |
| Renter-Occupied | 32,297 (32.1%) | $39,805 |
| Average | 100,701 (100.0%) | $68,915 |
Occupancy by Householder Income Bracket in St. Clair County
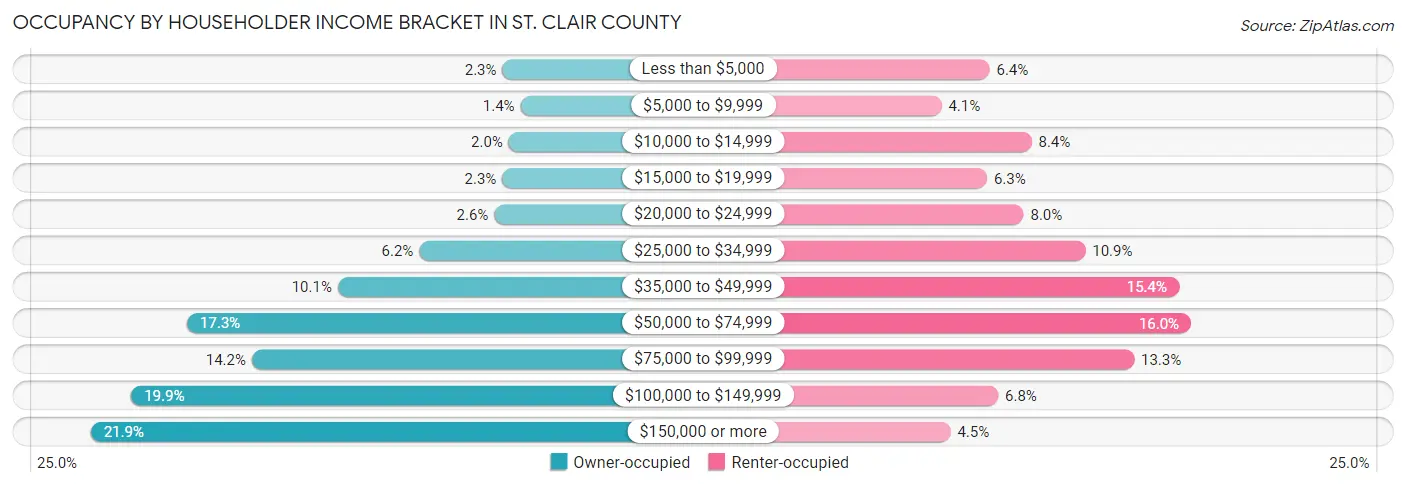
| Income Bracket | Owner-occupied | Renter-occupied |
| Less than $5,000 | 1,539 (2.2%) | 2,062 (6.4%) |
| $5,000 to $9,999 | 953 (1.4%) | 1,320 (4.1%) |
| $10,000 to $14,999 | 1,331 (1.9%) | 2,708 (8.4%) |
| $15,000 to $19,999 | 1,543 (2.3%) | 2,023 (6.3%) |
| $20,000 to $24,999 | 1,803 (2.6%) | 2,584 (8.0%) |
| $25,000 to $34,999 | 4,246 (6.2%) | 3,534 (10.9%) |
| $35,000 to $49,999 | 6,902 (10.1%) | 4,972 (15.4%) |
| $50,000 to $74,999 | 11,813 (17.3%) | 5,159 (16.0%) |
| $75,000 to $99,999 | 9,703 (14.2%) | 4,282 (13.3%) |
| $100,000 to $149,999 | 13,626 (19.9%) | 2,192 (6.8%) |
| $150,000 or more | 14,945 (21.8%) | 1,461 (4.5%) |
| Total | 68,404 (100.0%) | 32,297 (100.0%) |
Monthly Housing Cost Tiers in St. Clair County
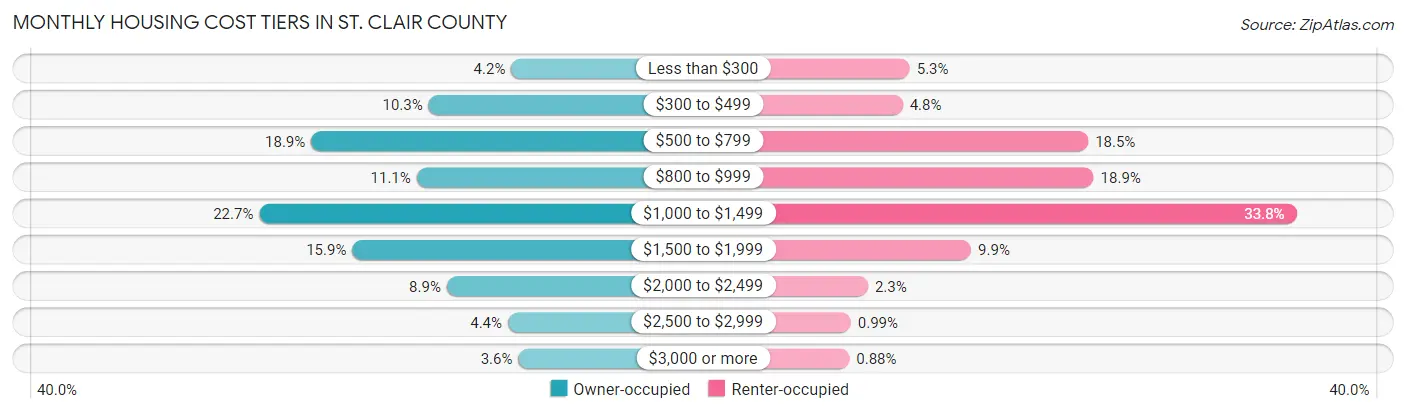
| Monthly Cost | Owner-occupied | Renter-occupied |
| Less than $300 | 2,843 (4.2%) | 1,720 (5.3%) |
| $300 to $499 | 7,011 (10.2%) | 1,555 (4.8%) |
| $500 to $799 | 12,930 (18.9%) | 5,966 (18.5%) |
| $800 to $999 | 7,613 (11.1%) | 6,094 (18.9%) |
| $1,000 to $1,499 | 15,543 (22.7%) | 10,916 (33.8%) |
| $1,500 to $1,999 | 10,859 (15.9%) | 3,181 (9.9%) |
| $2,000 to $2,499 | 6,097 (8.9%) | 728 (2.2%) |
| $2,500 to $2,999 | 3,016 (4.4%) | 321 (1.0%) |
| $3,000 or more | 2,492 (3.6%) | 285 (0.9%) |
| Total | 68,404 (100.0%) | 32,297 (100.0%) |
Physical Housing Characteristics in St. Clair County
Housing Structures in St. Clair County
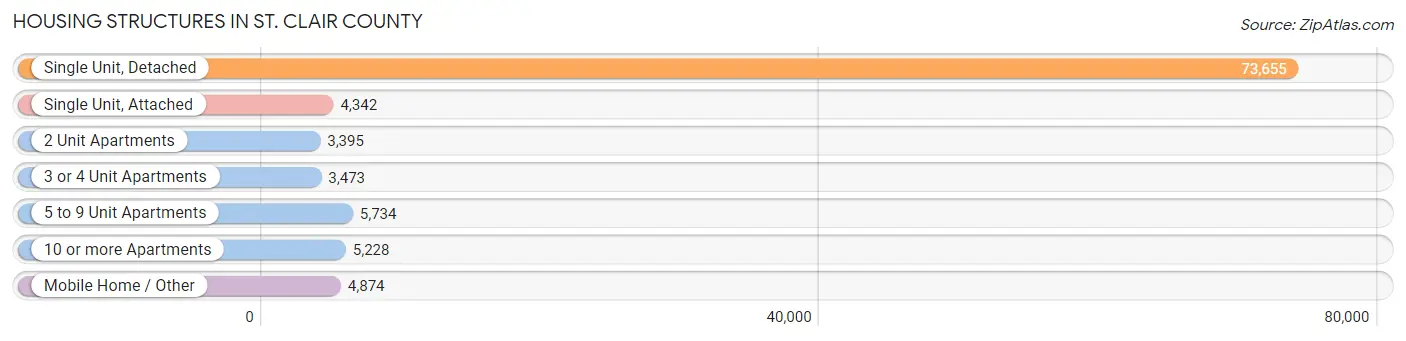
| Structure Type | # Housing Units | % Housing Units |
| Single Unit, Detached | 73,655 | 73.1% |
| Single Unit, Attached | 4,342 | 4.3% |
| 2 Unit Apartments | 3,395 | 3.4% |
| 3 or 4 Unit Apartments | 3,473 | 3.5% |
| 5 to 9 Unit Apartments | 5,734 | 5.7% |
| 10 or more Apartments | 5,228 | 5.2% |
| Mobile Home / Other | 4,874 | 4.8% |
| Total | 100,701 | 100.0% |
Housing Structures by Occupancy in St. Clair County
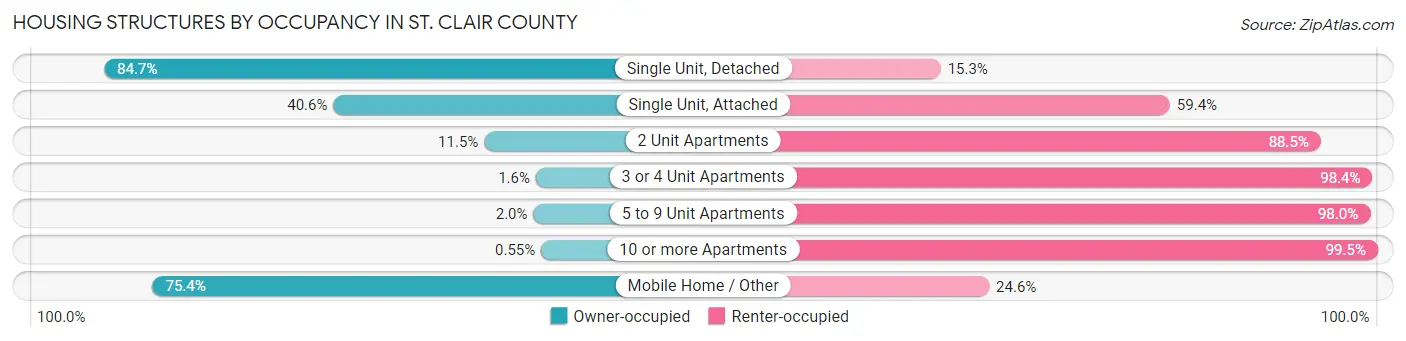
| Structure Type | Owner-occupied | Renter-occupied |
| Single Unit, Detached | 62,378 (84.7%) | 11,277 (15.3%) |
| Single Unit, Attached | 1,761 (40.6%) | 2,581 (59.4%) |
| 2 Unit Apartments | 391 (11.5%) | 3,004 (88.5%) |
| 3 or 4 Unit Apartments | 55 (1.6%) | 3,418 (98.4%) |
| 5 to 9 Unit Apartments | 117 (2.0%) | 5,617 (98.0%) |
| 10 or more Apartments | 29 (0.5%) | 5,199 (99.5%) |
| Mobile Home / Other | 3,673 (75.4%) | 1,201 (24.6%) |
| Total | 68,404 (67.9%) | 32,297 (32.1%) |
Housing Structures by Number of Rooms in St. Clair County
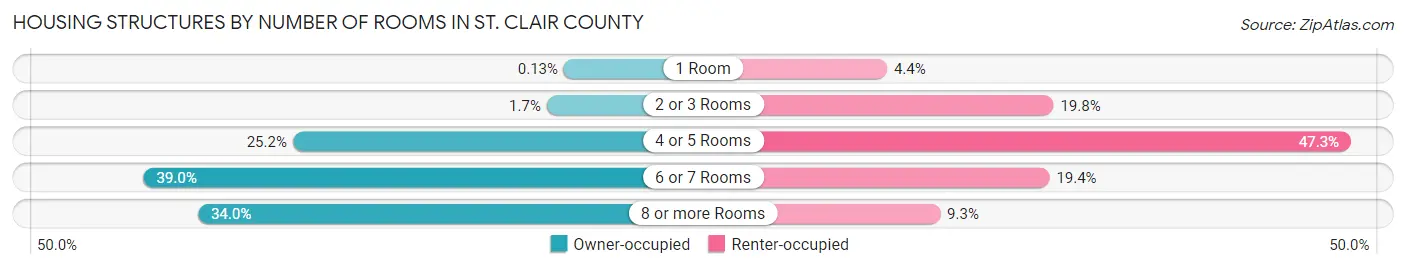
| Number of Rooms | Owner-occupied | Renter-occupied |
| 1 Room | 88 (0.1%) | 1,404 (4.3%) |
| 2 or 3 Rooms | 1,171 (1.7%) | 6,378 (19.8%) |
| 4 or 5 Rooms | 17,236 (25.2%) | 15,264 (47.3%) |
| 6 or 7 Rooms | 26,677 (39.0%) | 6,258 (19.4%) |
| 8 or more Rooms | 23,232 (34.0%) | 2,993 (9.3%) |
| Total | 68,404 (100.0%) | 32,297 (100.0%) |
Housing Structure by Heating Type in St. Clair County
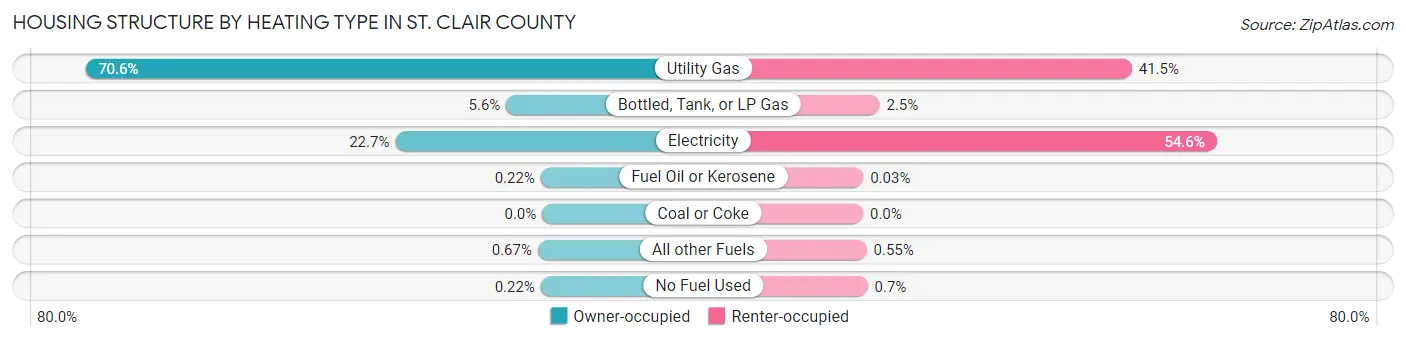
| Heating Type | Owner-occupied | Renter-occupied |
| Utility Gas | 48,316 (70.6%) | 13,415 (41.5%) |
| Bottled, Tank, or LP Gas | 3,799 (5.6%) | 821 (2.5%) |
| Electricity | 15,527 (22.7%) | 17,648 (54.6%) |
| Fuel Oil or Kerosene | 153 (0.2%) | 9 (0.0%) |
| Coal or Coke | 0 (0.0%) | 0 (0.0%) |
| All other Fuels | 460 (0.7%) | 177 (0.5%) |
| No Fuel Used | 149 (0.2%) | 227 (0.7%) |
| Total | 68,404 (100.0%) | 32,297 (100.0%) |
Household Vehicle Usage in St. Clair County
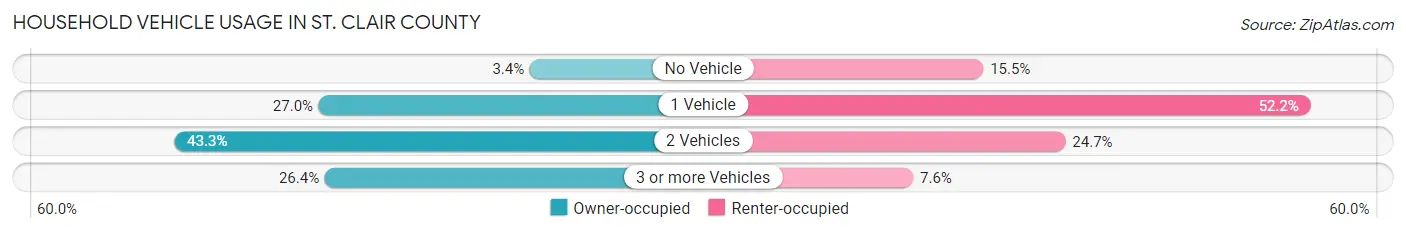
| Vehicles per Household | Owner-occupied | Renter-occupied |
| No Vehicle | 2,309 (3.4%) | 5,003 (15.5%) |
| 1 Vehicle | 18,487 (27.0%) | 16,850 (52.2%) |
| 2 Vehicles | 29,584 (43.2%) | 7,976 (24.7%) |
| 3 or more Vehicles | 18,024 (26.4%) | 2,468 (7.6%) |
| Total | 68,404 (100.0%) | 32,297 (100.0%) |
Real Estate & Mortgages in St. Clair County
Real Estate and Mortgage Overview in St. Clair County
| Characteristic | Without Mortgage | With Mortgage |
| Housing Units | 26,581 | 41,823 |
| Median Property Value | $115,100 | $181,300 |
| Median Household Income | $63,770 | $11,371 |
| Monthly Housing Costs | $592 | $2,480 |
| Real Estate Taxes | $2,690 | $1,798 |
Property Value by Mortgage Status in St. Clair County
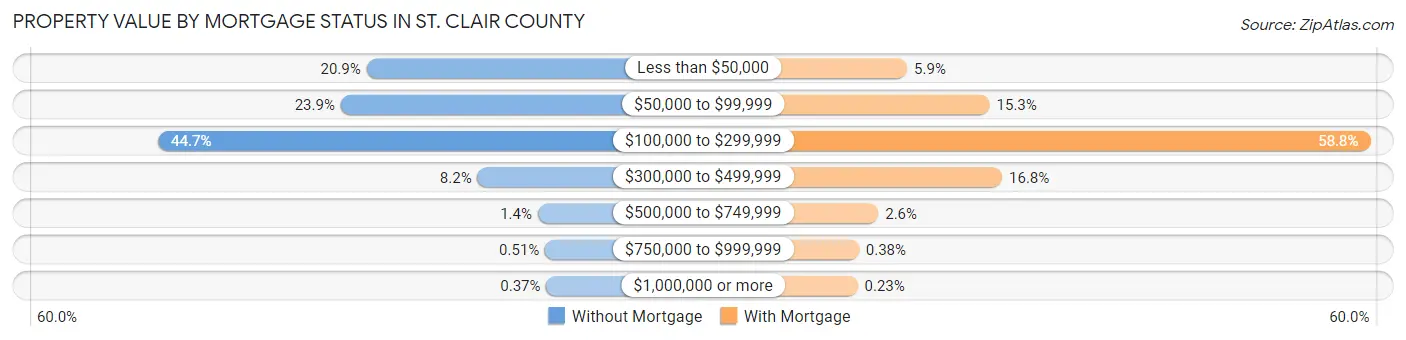
| Property Value | Without Mortgage | With Mortgage |
| Less than $50,000 | 5,562 (20.9%) | 2,467 (5.9%) |
| $50,000 to $99,999 | 6,346 (23.9%) | 6,407 (15.3%) |
| $100,000 to $299,999 | 11,889 (44.7%) | 24,604 (58.8%) |
| $300,000 to $499,999 | 2,189 (8.2%) | 7,004 (16.8%) |
| $500,000 to $749,999 | 360 (1.3%) | 1,086 (2.6%) |
| $750,000 to $999,999 | 136 (0.5%) | 157 (0.4%) |
| $1,000,000 or more | 99 (0.4%) | 98 (0.2%) |
| Total | 26,581 (100.0%) | 41,823 (100.0%) |
Household Income by Mortgage Status in St. Clair County
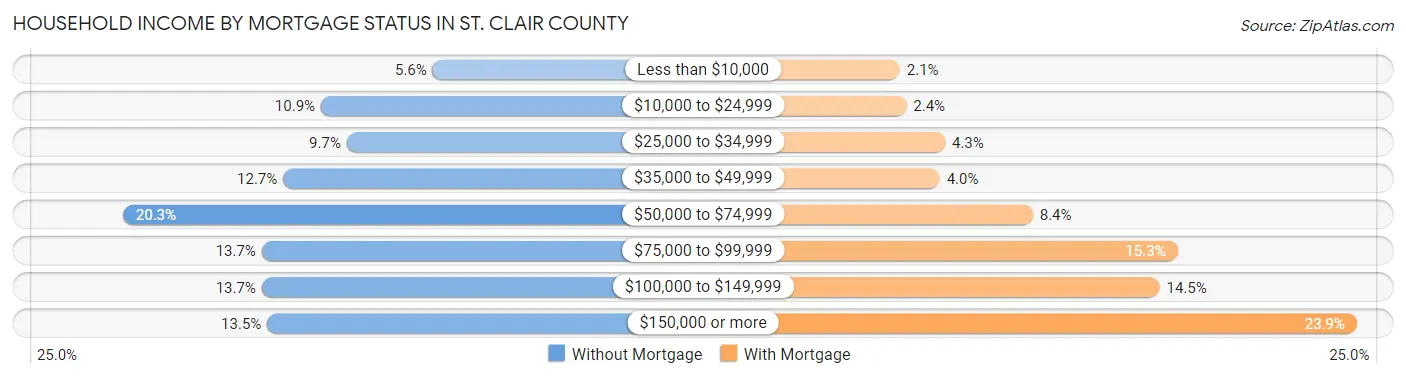
| Household Income | Without Mortgage | With Mortgage |
| Less than $10,000 | 1,480 (5.6%) | 882 (2.1%) |
| $10,000 to $24,999 | 2,895 (10.9%) | 1,012 (2.4%) |
| $25,000 to $34,999 | 2,569 (9.7%) | 1,782 (4.3%) |
| $35,000 to $49,999 | 3,372 (12.7%) | 1,677 (4.0%) |
| $50,000 to $74,999 | 5,402 (20.3%) | 3,530 (8.4%) |
| $75,000 to $99,999 | 3,645 (13.7%) | 6,411 (15.3%) |
| $100,000 to $149,999 | 3,644 (13.7%) | 6,058 (14.5%) |
| $150,000 or more | 3,574 (13.5%) | 9,982 (23.9%) |
| Total | 26,581 (100.0%) | 41,823 (100.0%) |
Property Value to Household Income Ratio in St. Clair County
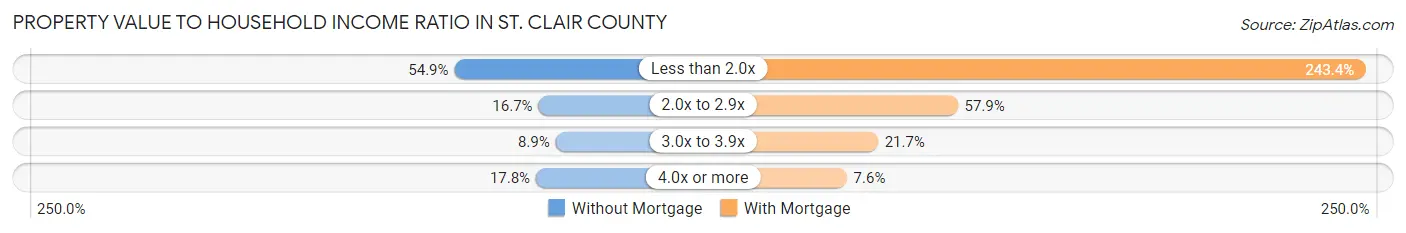
| Value-to-Income Ratio | Without Mortgage | With Mortgage |
| Less than 2.0x | 14,589 (54.9%) | 101,801 (243.4%) |
| 2.0x to 2.9x | 4,443 (16.7%) | 24,231 (57.9%) |
| 3.0x to 3.9x | 2,371 (8.9%) | 9,073 (21.7%) |
| 4.0x or more | 4,739 (17.8%) | 3,177 (7.6%) |
| Total | 26,581 (100.0%) | 41,823 (100.0%) |
Real Estate Taxes by Mortgage Status in St. Clair County
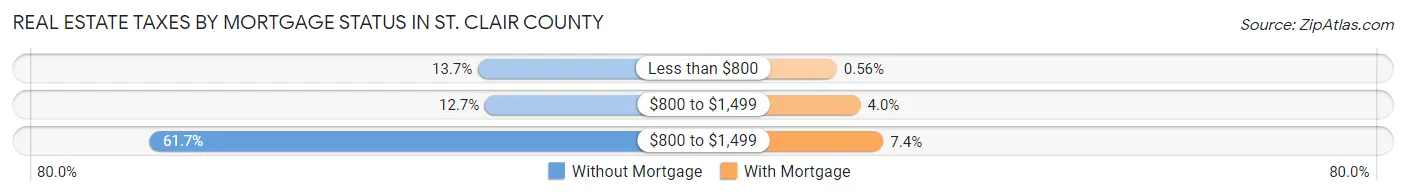
| Property Taxes | Without Mortgage | With Mortgage |
| Less than $800 | 3,651 (13.7%) | 236 (0.6%) |
| $800 to $1,499 | 3,378 (12.7%) | 1,686 (4.0%) |
| $800 to $1,499 | 16,394 (61.7%) | 3,077 (7.4%) |
| Total | 26,581 (100.0%) | 41,823 (100.0%) |
Health & Disability in St. Clair County
Health Insurance Coverage by Age in St. Clair County
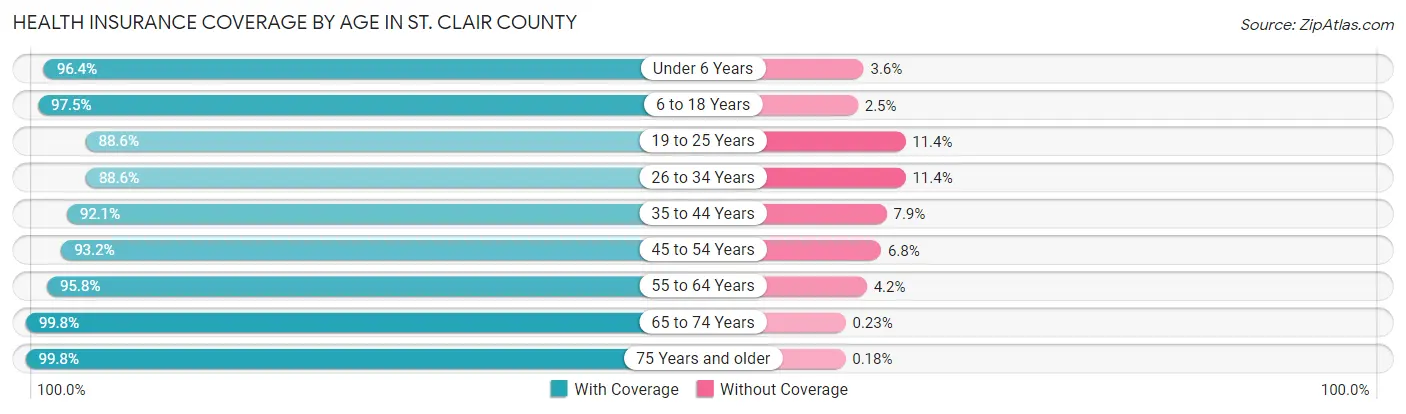
| Age Bracket | With Coverage | Without Coverage |
| Under 6 Years | 17,330 (96.4%) | 645 (3.6%) |
| 6 to 18 Years | 44,096 (97.5%) | 1,140 (2.5%) |
| 19 to 25 Years | 17,727 (88.6%) | 2,274 (11.4%) |
| 26 to 34 Years | 25,390 (88.6%) | 3,269 (11.4%) |
| 35 to 44 Years | 29,436 (92.1%) | 2,517 (7.9%) |
| 45 to 54 Years | 28,840 (93.2%) | 2,118 (6.8%) |
| 55 to 64 Years | 33,581 (95.8%) | 1,466 (4.2%) |
| 65 to 74 Years | 24,857 (99.8%) | 57 (0.2%) |
| 75 Years and older | 15,944 (99.8%) | 29 (0.2%) |
| Total | 237,201 (94.6%) | 13,515 (5.4%) |
Health Insurance Coverage by Citizenship Status in St. Clair County
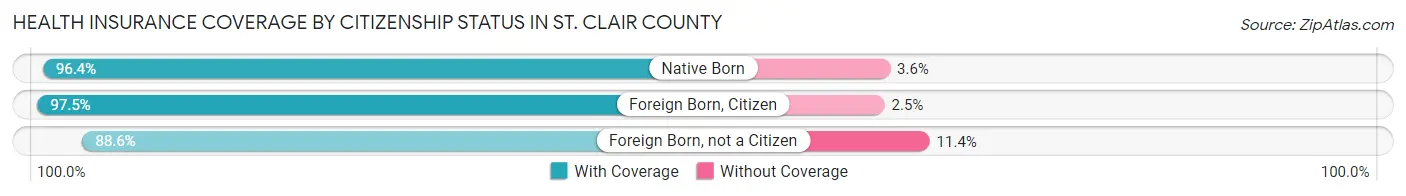
| Citizenship Status | With Coverage | Without Coverage |
| Native Born | 17,330 (96.4%) | 645 (3.6%) |
| Foreign Born, Citizen | 44,096 (97.5%) | 1,140 (2.5%) |
| Foreign Born, not a Citizen | 17,727 (88.6%) | 2,274 (11.4%) |
Health Insurance Coverage by Household Income in St. Clair County
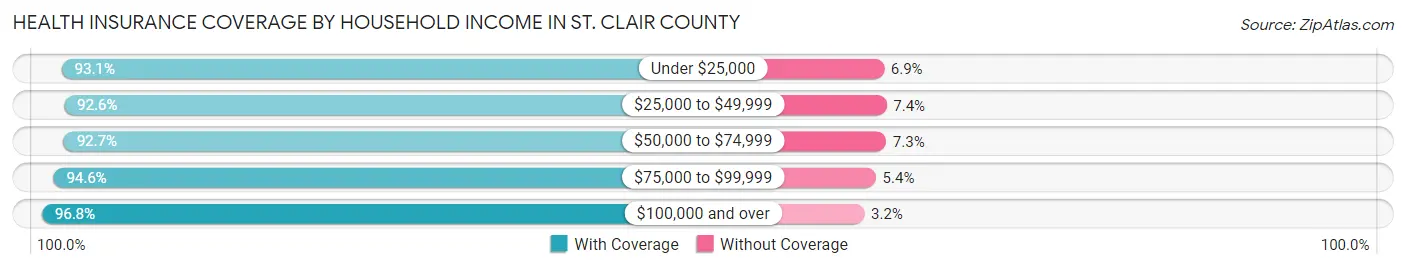
| Household Income | With Coverage | Without Coverage |
| Under $25,000 | 30,097 (93.1%) | 2,244 (6.9%) |
| $25,000 to $49,999 | 36,827 (92.6%) | 2,948 (7.4%) |
| $50,000 to $74,999 | 36,693 (92.7%) | 2,901 (7.3%) |
| $75,000 to $99,999 | 34,638 (94.6%) | 1,982 (5.4%) |
| $100,000 and over | 98,077 (96.8%) | 3,283 (3.2%) |
Public vs Private Health Insurance Coverage by Age in St. Clair County
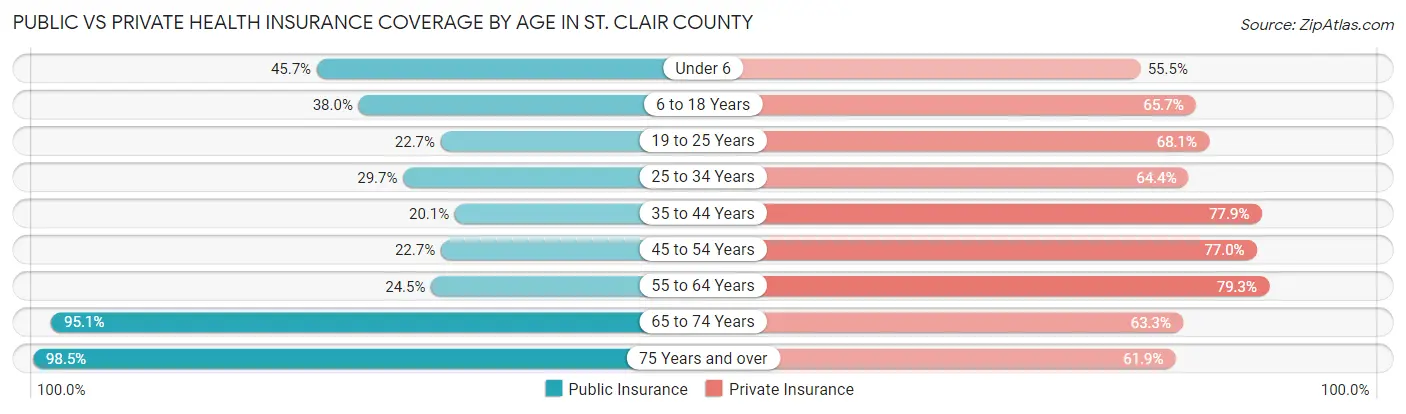
| Age Bracket | Public Insurance | Private Insurance |
| Under 6 | 8,222 (45.7%) | 9,974 (55.5%) |
| 6 to 18 Years | 17,182 (38.0%) | 29,697 (65.6%) |
| 19 to 25 Years | 4,548 (22.7%) | 13,625 (68.1%) |
| 25 to 34 Years | 8,515 (29.7%) | 18,441 (64.3%) |
| 35 to 44 Years | 6,422 (20.1%) | 24,877 (77.8%) |
| 45 to 54 Years | 7,031 (22.7%) | 23,826 (77.0%) |
| 55 to 64 Years | 8,590 (24.5%) | 27,773 (79.2%) |
| 65 to 74 Years | 23,685 (95.1%) | 15,769 (63.3%) |
| 75 Years and over | 15,726 (98.5%) | 9,888 (61.9%) |
| Total | 99,921 (39.9%) | 173,870 (69.4%) |
Disability Status by Sex by Age in St. Clair County
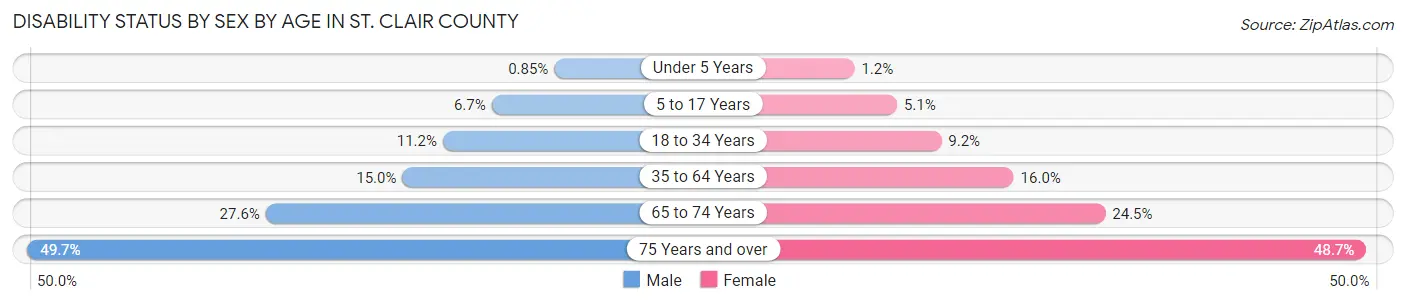
| Age Bracket | Male | Female |
| Under 5 Years | 67 (0.9%) | 89 (1.2%) |
| 5 to 17 Years | 1,514 (6.7%) | 1,102 (5.1%) |
| 18 to 34 Years | 2,838 (11.2%) | 2,477 (9.2%) |
| 35 to 64 Years | 6,960 (14.9%) | 8,198 (16.0%) |
| 65 to 74 Years | 3,195 (27.6%) | 3,265 (24.5%) |
| 75 Years and over | 3,121 (49.7%) | 4,720 (48.7%) |
Disability Class by Sex by Age in St. Clair County
Disability Class: Hearing Difficulty
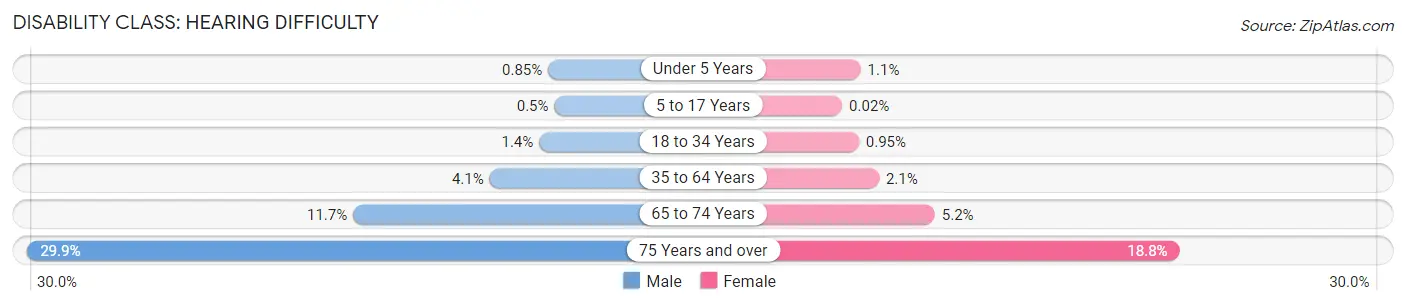
| Age Bracket | Male | Female |
| Under 5 Years | 67 (0.9%) | 79 (1.1%) |
| 5 to 17 Years | 114 (0.5%) | 5 (0.0%) |
| 18 to 34 Years | 342 (1.3%) | 255 (0.9%) |
| 35 to 64 Years | 1,913 (4.1%) | 1,062 (2.1%) |
| 65 to 74 Years | 1,354 (11.7%) | 691 (5.2%) |
| 75 Years and over | 1,873 (29.8%) | 1,823 (18.8%) |
Disability Class: Vision Difficulty
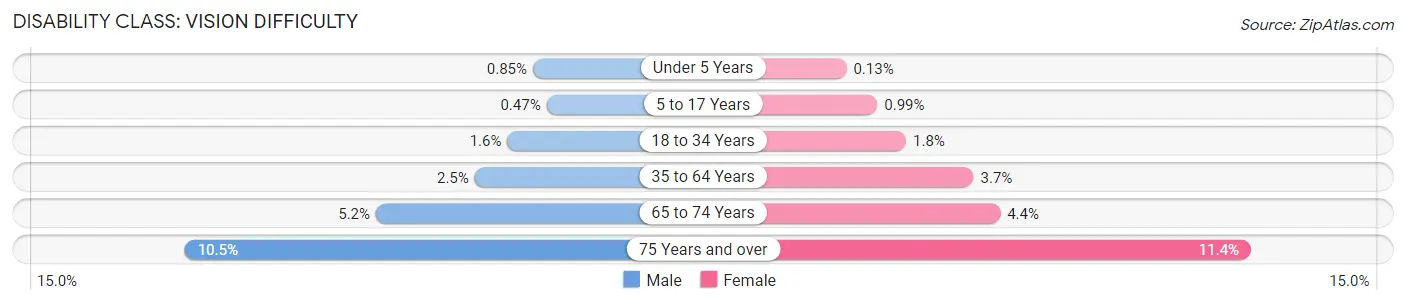
| Age Bracket | Male | Female |
| Under 5 Years | 67 (0.9%) | 10 (0.1%) |
| 5 to 17 Years | 108 (0.5%) | 213 (1.0%) |
| 18 to 34 Years | 395 (1.6%) | 481 (1.8%) |
| 35 to 64 Years | 1,149 (2.5%) | 1,886 (3.7%) |
| 65 to 74 Years | 604 (5.2%) | 589 (4.4%) |
| 75 Years and over | 661 (10.5%) | 1,105 (11.4%) |
Disability Class: Cognitive Difficulty
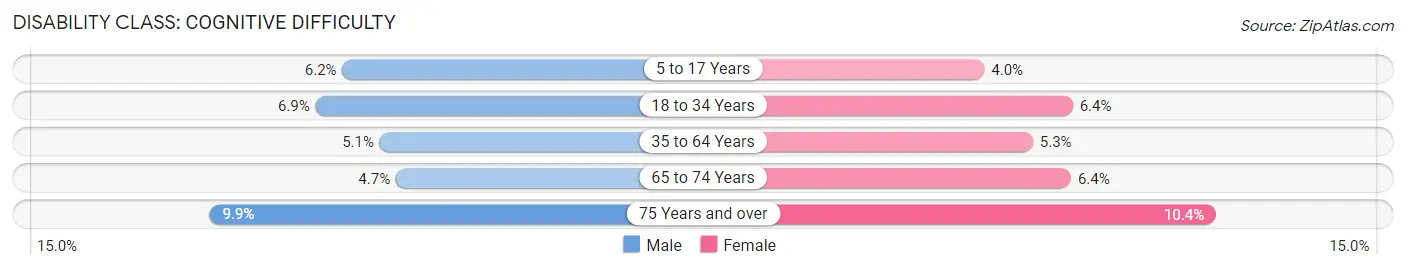
| Age Bracket | Male | Female |
| 5 to 17 Years | 1,399 (6.1%) | 854 (4.0%) |
| 18 to 34 Years | 1,751 (6.9%) | 1,724 (6.4%) |
| 35 to 64 Years | 2,377 (5.1%) | 2,734 (5.3%) |
| 65 to 74 Years | 539 (4.7%) | 852 (6.4%) |
| 75 Years and over | 618 (9.9%) | 1,011 (10.4%) |
Disability Class: Ambulatory Difficulty
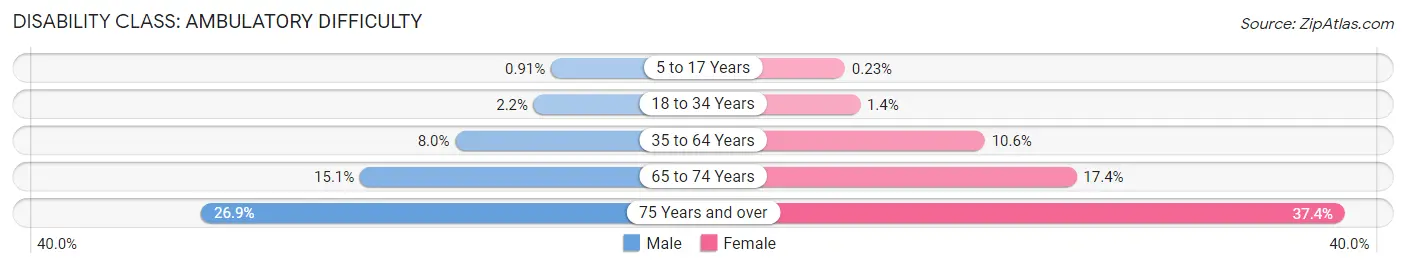
| Age Bracket | Male | Female |
| 5 to 17 Years | 206 (0.9%) | 49 (0.2%) |
| 18 to 34 Years | 555 (2.2%) | 361 (1.3%) |
| 35 to 64 Years | 3,735 (8.0%) | 5,451 (10.6%) |
| 65 to 74 Years | 1,745 (15.1%) | 2,325 (17.4%) |
| 75 Years and over | 1,687 (26.9%) | 3,623 (37.3%) |
Disability Class: Self-Care Difficulty
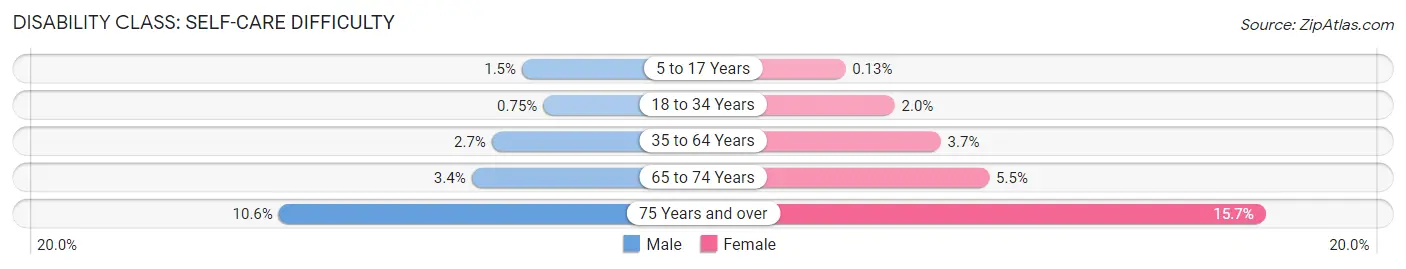
| Age Bracket | Male | Female |
| 5 to 17 Years | 350 (1.5%) | 27 (0.1%) |
| 18 to 34 Years | 190 (0.7%) | 527 (2.0%) |
| 35 to 64 Years | 1,238 (2.7%) | 1,884 (3.7%) |
| 65 to 74 Years | 394 (3.4%) | 730 (5.5%) |
| 75 Years and over | 663 (10.6%) | 1,526 (15.7%) |
Technology Access in St. Clair County
Computing Device Access in St. Clair County
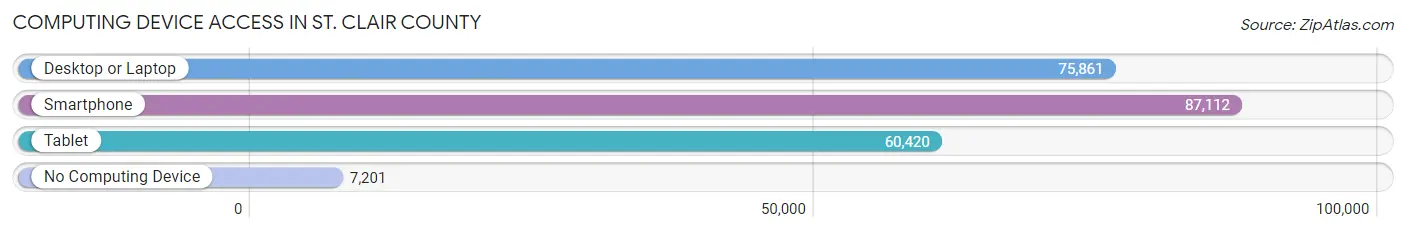
| Device Type | # Households | % Households |
| Desktop or Laptop | 75,861 | 75.3% |
| Smartphone | 87,112 | 86.5% |
| Tablet | 60,420 | 60.0% |
| No Computing Device | 7,201 | 7.1% |
| Total | 100,701 | 100.0% |
Internet Access in St. Clair County
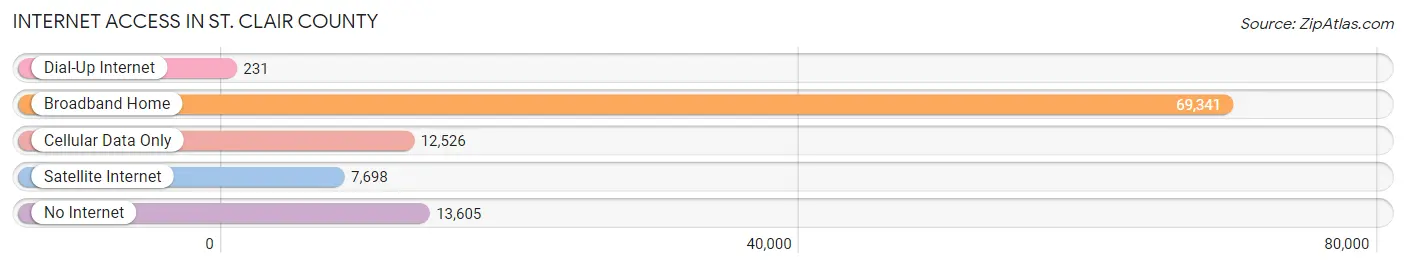
| Internet Type | # Households | % Households |
| Dial-Up Internet | 231 | 0.2% |
| Broadband Home | 69,341 | 68.9% |
| Cellular Data Only | 12,526 | 12.4% |
| Satellite Internet | 7,698 | 7.6% |
| No Internet | 13,605 | 13.5% |
| Total | 100,701 | 100.0% |
St. Clair County Summary
St. Clair County is located in the southwestern region of Illinois, and is part of the Metro East region of the St. Louis metropolitan area. It is the sixth most populous county in the state, with a population of 270,056 as of the 2010 census. The county seat is Belleville, and the largest city is East St. Louis.
History
St. Clair County was established in 1790, and was named after Arthur St. Clair, the first governor of the Northwest Territory. The county was originally part of Randolph County, and was later divided into two separate counties, St. Clair and Randolph. The county was initially populated by Native American tribes, including the Illiniwek, Kickapoo, and Potawatomi.
In the early 19th century, the county was settled by European immigrants, primarily from Germany and Ireland. The county was an important center of the coal mining industry, and the city of Belleville was an important hub for the Illinois Central Railroad.
Geography
St. Clair County covers an area of 586 square miles, and is located in the southwestern region of Illinois. It is bordered by Madison County to the north, Clinton County to the east, Monroe County to the south, and Randolph County to the west. The county is located in the Metro East region of the St. Louis metropolitan area.
The county is mostly flat, with some rolling hills in the northern and western parts of the county. The Kaskaskia River flows through the county, and the Cahokia Creek is a tributary of the Kaskaskia. The county is home to several parks, including the Carlyle Lake State Park, the Horseshoe Lake State Park, and the Cahokia Mounds State Historic Site.
Economy
St. Clair County has a diverse economy, with a mix of manufacturing, retail, and service industries. The county is home to several major employers, including Scott Air Force Base, Olin Corporation, and the St. Clair County Health Department.
The county is also home to several major shopping centers, including the St. Clair Square Mall in Fairview Heights, and the Belleville Crossing Shopping Center in Belleville. The county is also home to several wineries, including the St. Clair Winery in Belleville.
Demographics
As of the 2010 census, St. Clair County had a population of 270,056. The racial makeup of the county was 79.2% White, 17.3% African American, 0.5% Native American, 0.7% Asian, 0.1% Pacific Islander, 1.2% from other races, and 1.1% from two or more races. Hispanic or Latino of any race were 3.2% of the population.
The median income for a household in the county was $45,906, and the median income for a family was $54,844. The per capita income for the county was $21,945. About 11.2% of families and 14.3% of the population were below the poverty line, including 20.2% of those under age 18 and 8.2% of those age 65 or over.
Common Questions
What is the Total Population of St. Clair County?
Total Population of St. Clair County is 256,791.
What is the Total Male Population of St. Clair County?
Total Male Population of St. Clair County is 124,864.
What is the Total Female Population of St. Clair County?
Total Female Population of St. Clair County is 131,927.
What is the Ratio of Males per 100 Females in St. Clair County?
There are 94.65 Males per 100 Females in St. Clair County.
What is the Ratio of Females per 100 Males in St. Clair County?
There are 105.66 Females per 100 Males in St. Clair County.
What is the Median Population Age in St. Clair County?
Median Population Age in St. Clair County is 39.4 Years.
What is the Average Family Size in St. Clair County
Average Family Size in St. Clair County is 3.2 People.
What is the Average Household Size in St. Clair County
Average Household Size in St. Clair County is 2.5 People.
What is Per Capita Income in St. Clair County?
Per Capita income in St. Clair County is $36,010.
What is the Median Family Income in St. Clair County?
Median Family Income in St. Clair County is $88,951.
What is the Median Household income in St. Clair County?
Median Household Income in St. Clair County is $68,915.
What is Income or Wage Gap in St. Clair County?
Income or Wage Gap in St. Clair County is 31.8%.
Women in St. Clair County earn 68.2 cents for every dollar earned by a man.
What is Family Income Deficit in St. Clair County?
Family Income Deficit in St. Clair County is $12,741.
Families that are below poverty line in St. Clair County earn $12,741 less on average than the poverty threshold level.
What is Inequality or Gini Index in St. Clair County?
Inequality or Gini Index in St. Clair County is 0.45.
How Large is the Labor Force in St. Clair County?
There are 130,967 People in the Labor Forcein in St. Clair County.
What is the Percentage of People in the Labor Force in St. Clair County?
64.2% of People are in the Labor Force in St. Clair County.
What is the Unemployment Rate in St. Clair County?
Unemployment Rate in St. Clair County is 5.7%.