Shelby County, IL
Shelby County Map
Shelby County Overview
21,042
TOTAL POPULATION
10,434
MALE POPULATION
10,608
FEMALE POPULATION
98.36
MALES / 100 FEMALES
101.67
FEMALES / 100 MALES
44.9
MEDIAN AGE
2.9
AVG FAMILY SIZE
2.4
AVG HOUSEHOLD SIZE
$32,085
PER CAPITA INCOME
$78,188
AVG FAMILY INCOME
$65,585
AVG HOUSEHOLD INCOME
32.1%
WAGE / INCOME GAP [ % ]
67.9¢/ $1
WAGE / INCOME GAP [ $ ]
$8,804
FAMILY INCOME DEFICIT
0.39
INEQUALITY / GINI INDEX
10,631
LABOR FORCE [ PEOPLE ]
62.3%
PERCENT IN LABOR FORCE
4.0%
UNEMPLOYMENT RATE
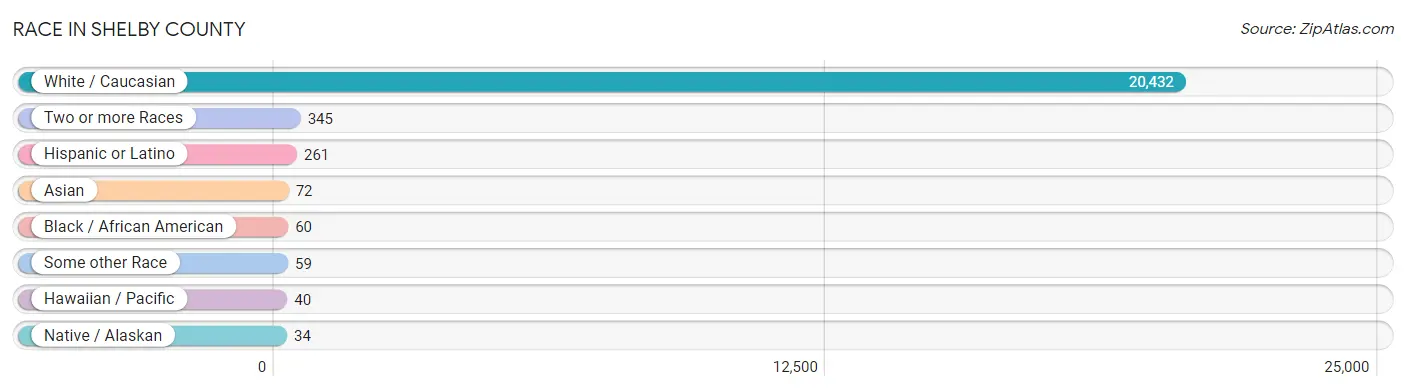
Race in Shelby County
The most populous races in Shelby County are White / Caucasian (20,432 | 97.1%), Two or more Races (345 | 1.6%), and Hispanic or Latino (261 | 1.2%).
| Race | # Population | % Population |
| Asian | 72 | 0.3% |
| Black / African American | 60 | 0.3% |
| Hawaiian / Pacific | 40 | 0.2% |
| Hispanic or Latino | 261 | 1.2% |
| Native / Alaskan | 34 | 0.2% |
| White / Caucasian | 20,432 | 97.1% |
| Two or more Races | 345 | 1.6% |
| Some other Race | 59 | 0.3% |
| Total | 21,042 | 100.0% |
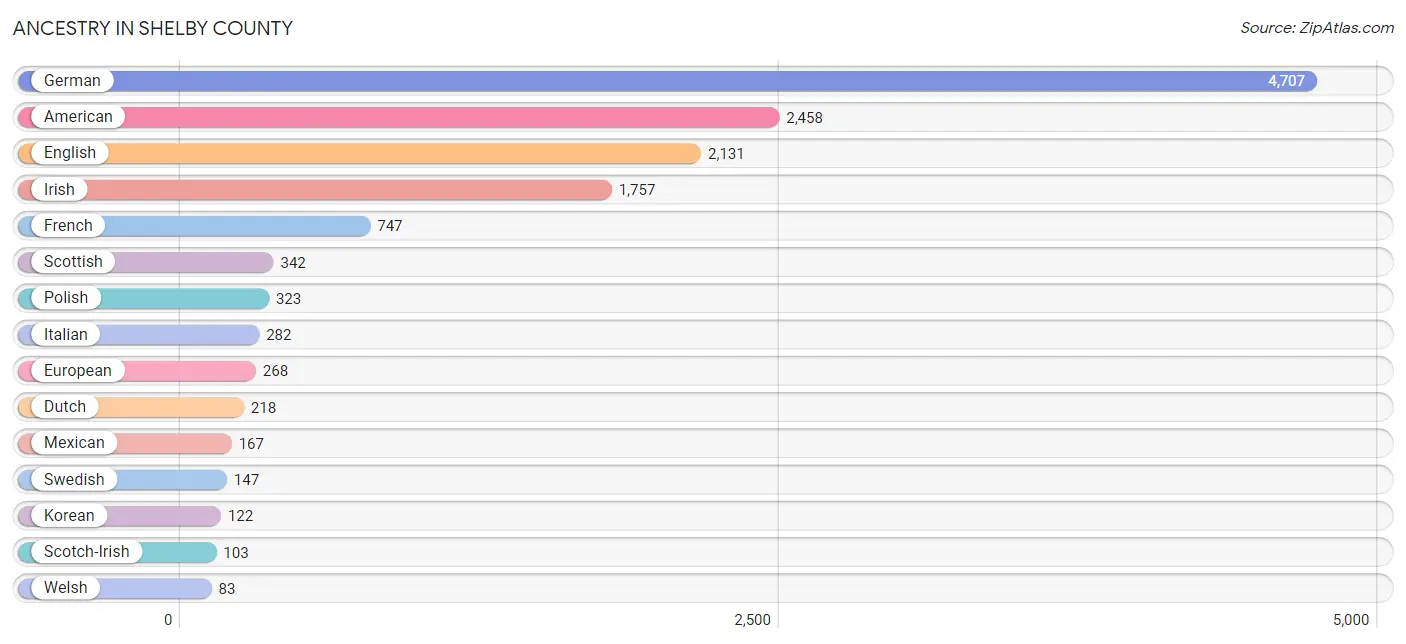
Ancestry in Shelby County
The most populous ancestries reported in Shelby County are German (4,707 | 22.4%), American (2,458 | 11.7%), English (2,131 | 10.1%), Irish (1,757 | 8.4%), and French (747 | 3.5%), together accounting for 56.1% of all Shelby County residents.
| Ancestry | # Population | % Population |
| American | 2,458 | 11.7% |
| Arab | 3 | 0.0% |
| Austrian | 4 | 0.0% |
| Belizean | 18 | 0.1% |
| Bhutanese | 10 | 0.1% |
| Blackfeet | 2 | 0.0% |
| British | 32 | 0.2% |
| Burmese | 6 | 0.0% |
| Canadian | 28 | 0.1% |
| Central American Indian | 18 | 0.1% |
| Cherokee | 59 | 0.3% |
| Chippewa | 8 | 0.0% |
| Colombian | 7 | 0.0% |
| Croatian | 13 | 0.1% |
| Cuban | 6 | 0.0% |
| Czech | 51 | 0.2% |
| Czechoslovakian | 3 | 0.0% |
| Danish | 15 | 0.1% |
| Dutch | 218 | 1.0% |
| Eastern European | 12 | 0.1% |
| English | 2,131 | 10.1% |
| European | 268 | 1.3% |
| Finnish | 6 | 0.0% |
| French | 747 | 3.5% |
| French Canadian | 7 | 0.0% |
| German | 4,707 | 22.4% |
| Greek | 23 | 0.1% |
| Guamanian / Chamorro | 70 | 0.3% |
| Haitian | 5 | 0.0% |
| Hungarian | 3 | 0.0% |
| Irish | 1,757 | 8.4% |
| Iroquois | 24 | 0.1% |
| Italian | 282 | 1.3% |
| Korean | 122 | 0.6% |
| Lebanese | 3 | 0.0% |
| Lithuanian | 21 | 0.1% |
| Malaysian | 1 | 0.0% |
| Mexican | 167 | 0.8% |
| Northern European | 5 | 0.0% |
| Norwegian | 60 | 0.3% |
| Pakistani | 2 | 0.0% |
| Pennsylvania German | 7 | 0.0% |
| Polish | 323 | 1.5% |
| Portuguese | 2 | 0.0% |
| Puerto Rican | 28 | 0.1% |
| Romanian | 8 | 0.0% |
| Russian | 11 | 0.1% |
| Samoan | 5 | 0.0% |
| Scandinavian | 15 | 0.1% |
| Scotch-Irish | 103 | 0.5% |
| Scottish | 342 | 1.6% |
| Slavic | 10 | 0.1% |
| Slovak | 18 | 0.1% |
| South American | 7 | 0.0% |
| Spanish | 1 | 0.0% |
| Sri Lankan | 5 | 0.0% |
| Swedish | 147 | 0.7% |
| Swiss | 28 | 0.1% |
| Tohono O'Odham | 3 | 0.0% |
| Ukrainian | 47 | 0.2% |
| Welsh | 83 | 0.4% |
| West Indian | 3 | 0.0% | View All 62 Rows |
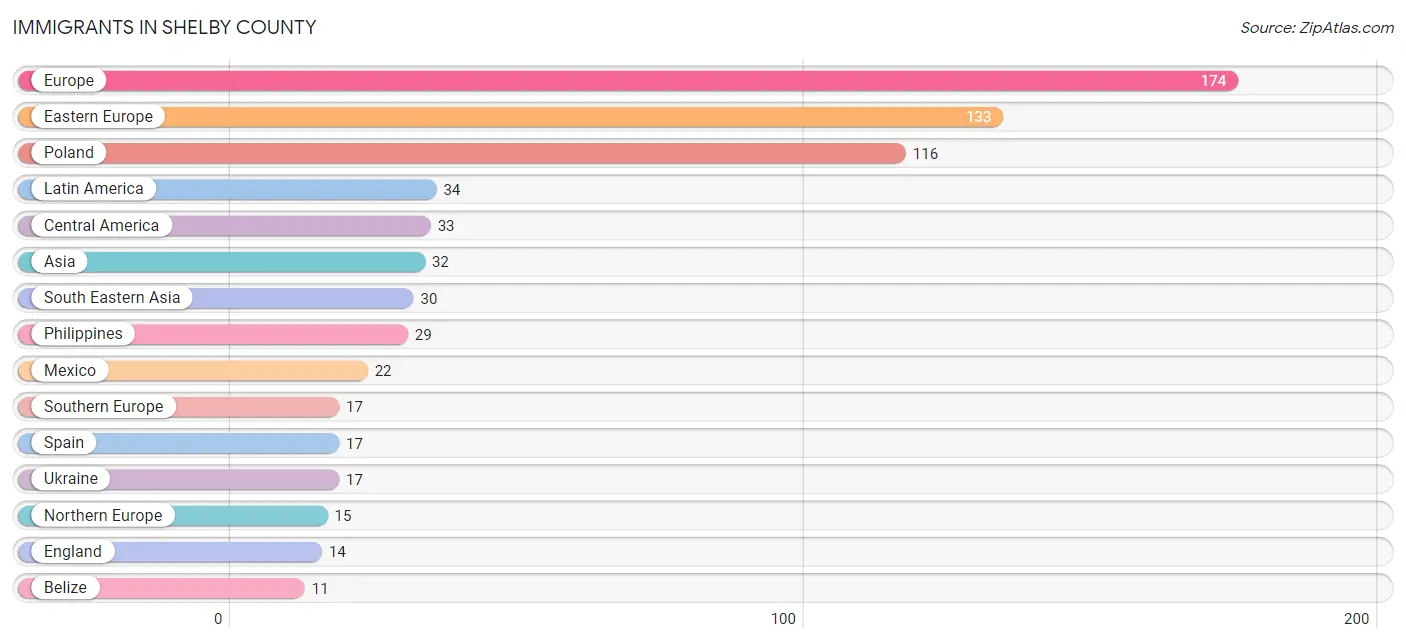
Immigrants in Shelby County
The most numerous immigrant groups reported in Shelby County came from Europe (174 | 0.8%), Eastern Europe (133 | 0.6%), Poland (116 | 0.5%), Latin America (34 | 0.2%), and Central America (33 | 0.2%), together accounting for 2.3% of all Shelby County residents.
| Immigration Origin | # Population | % Population |
| Asia | 32 | 0.2% |
| Belize | 11 | 0.1% |
| Canada | 3 | 0.0% |
| Central America | 33 | 0.2% |
| China | 2 | 0.0% |
| Eastern Asia | 2 | 0.0% |
| Eastern Europe | 133 | 0.6% |
| England | 14 | 0.1% |
| Europe | 174 | 0.8% |
| Germany | 9 | 0.0% |
| Laos | 1 | 0.0% |
| Latin America | 34 | 0.2% |
| Mexico | 22 | 0.1% |
| Northern Europe | 15 | 0.1% |
| Philippines | 29 | 0.1% |
| Poland | 116 | 0.5% |
| South America | 1 | 0.0% |
| South Eastern Asia | 30 | 0.1% |
| Southern Europe | 17 | 0.1% |
| Spain | 17 | 0.1% |
| Ukraine | 17 | 0.1% |
| Western Europe | 9 | 0.0% | View All 22 Rows |
Sex and Age in Shelby County
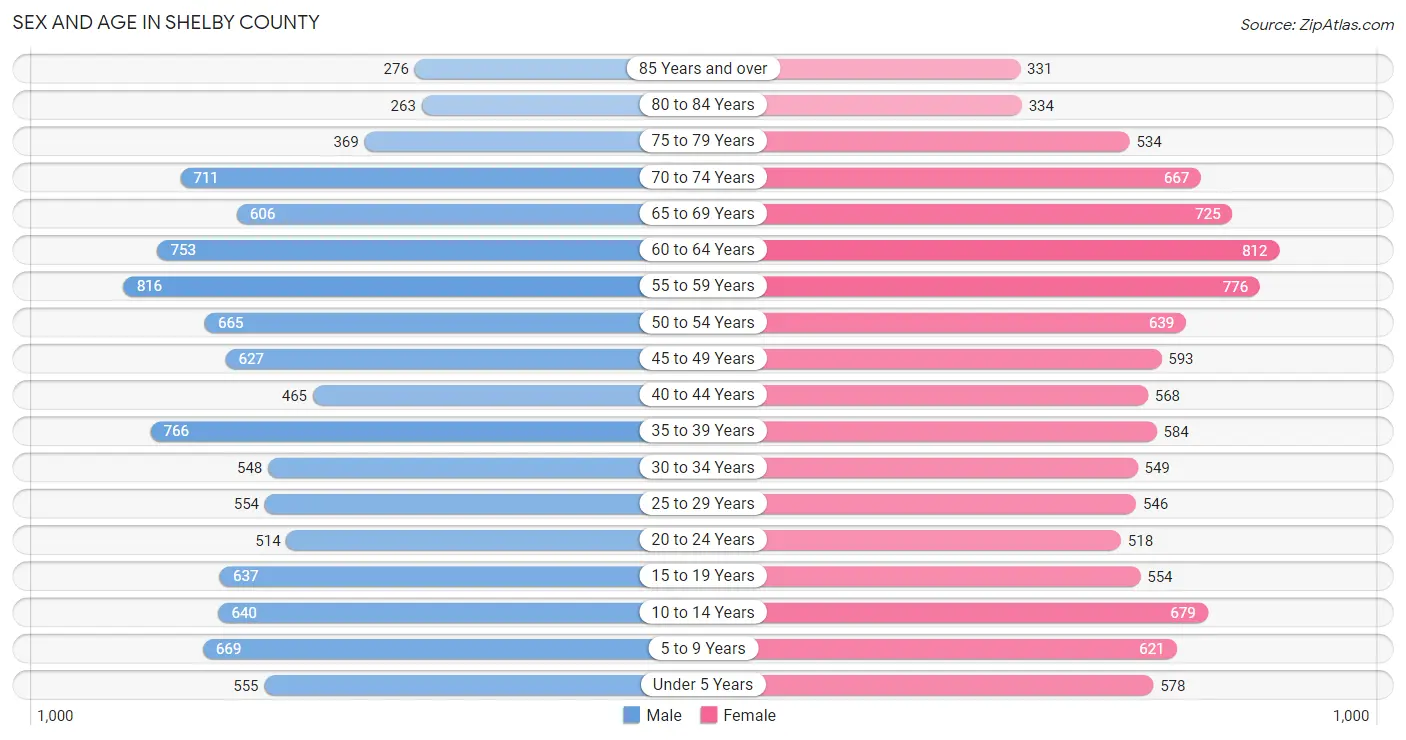
Sex and Age in Shelby County
The most populous age groups in Shelby County are 55 to 59 Years (816 | 7.8%) for men and 60 to 64 Years (812 | 7.6%) for women.
| Age Bracket | Male | Female |
| Under 5 Years | 555 (5.3%) | 578 (5.4%) |
| 5 to 9 Years | 669 (6.4%) | 621 (5.9%) |
| 10 to 14 Years | 640 (6.1%) | 679 (6.4%) |
| 15 to 19 Years | 637 (6.1%) | 554 (5.2%) |
| 20 to 24 Years | 514 (4.9%) | 518 (4.9%) |
| 25 to 29 Years | 554 (5.3%) | 546 (5.1%) |
| 30 to 34 Years | 548 (5.2%) | 549 (5.2%) |
| 35 to 39 Years | 766 (7.3%) | 584 (5.5%) |
| 40 to 44 Years | 465 (4.5%) | 568 (5.3%) |
| 45 to 49 Years | 627 (6.0%) | 593 (5.6%) |
| 50 to 54 Years | 665 (6.4%) | 639 (6.0%) |
| 55 to 59 Years | 816 (7.8%) | 776 (7.3%) |
| 60 to 64 Years | 753 (7.2%) | 812 (7.6%) |
| 65 to 69 Years | 606 (5.8%) | 725 (6.8%) |
| 70 to 74 Years | 711 (6.8%) | 667 (6.3%) |
| 75 to 79 Years | 369 (3.5%) | 534 (5.0%) |
| 80 to 84 Years | 263 (2.5%) | 334 (3.2%) |
| 85 Years and over | 276 (2.6%) | 331 (3.1%) |
| Total | 10,434 (100.0%) | 10,608 (100.0%) |
Families and Households in Shelby County
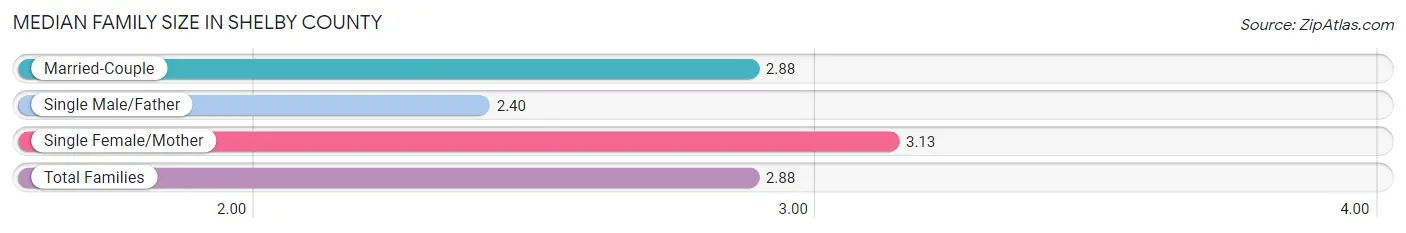
Median Family Size in Shelby County
The median family size in Shelby County is 2.88 persons per family, with single female/mother families (728 | 12.3%) accounting for the largest median family size of 3.13 persons per family. On the other hand, single male/father families (379 | 6.4%) represent the smallest median family size with 2.40 persons per family.
| Family Type | # Families | Family Size |
| Married-Couple | 4,831 (81.4%) | 2.88 |
| Single Male/Father | 379 (6.4%) | 2.40 |
| Single Female/Mother | 728 (12.3%) | 3.13 |
| Total Families | 5,938 (100.0%) | 2.88 |
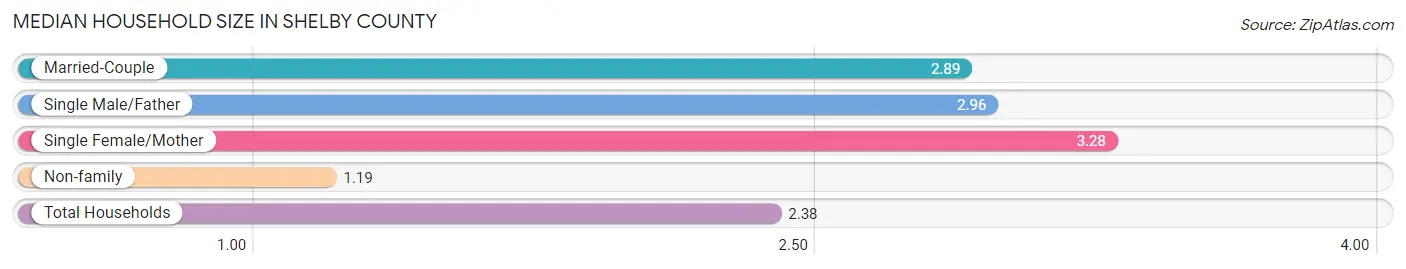
Median Household Size in Shelby County
The median household size in Shelby County is 2.38 persons per household, with single female/mother households (728 | 8.3%) accounting for the largest median household size of 3.28 persons per household. non-family households (2,824 | 32.2%) represent the smallest median household size with 1.19 persons per household.
| Household Type | # Households | Household Size |
| Married-Couple | 4,831 (55.1%) | 2.89 |
| Single Male/Father | 379 (4.3%) | 2.96 |
| Single Female/Mother | 728 (8.3%) | 3.28 |
| Non-family | 2,824 (32.2%) | 1.19 |
| Total Households | 8,762 (100.0%) | 2.38 |
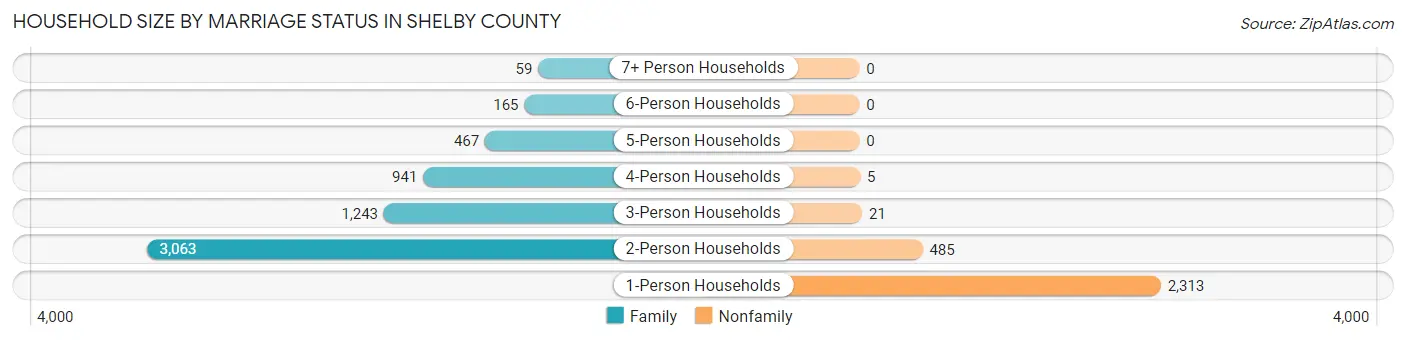
Household Size by Marriage Status in Shelby County
Out of a total of 8,762 households in Shelby County, 5,938 (67.8%) are family households, while 2,824 (32.2%) are nonfamily households. The most numerous type of family households are 2-person households, comprising 3,063, and the most common type of nonfamily households are 1-person households, comprising 2,313.
| Household Size | Family Households | Nonfamily Households |
| 1-Person Households | - | 2,313 (26.4%) |
| 2-Person Households | 3,063 (35.0%) | 485 (5.5%) |
| 3-Person Households | 1,243 (14.2%) | 21 (0.2%) |
| 4-Person Households | 941 (10.7%) | 5 (0.1%) |
| 5-Person Households | 467 (5.3%) | 0 (0.0%) |
| 6-Person Households | 165 (1.9%) | 0 (0.0%) |
| 7+ Person Households | 59 (0.7%) | 0 (0.0%) |
| Total | 5,938 (67.8%) | 2,824 (32.2%) |
Female Fertility in Shelby County
Fertility by Age in Shelby County
Average fertility rate in Shelby County is 40.0 births per 1,000 women. Women in the age bracket of 20 to 34 years have the highest fertility rate with 96.0 births per 1,000 women. Women in the age bracket of 20 to 34 years acount for 97.5% of all women with births.
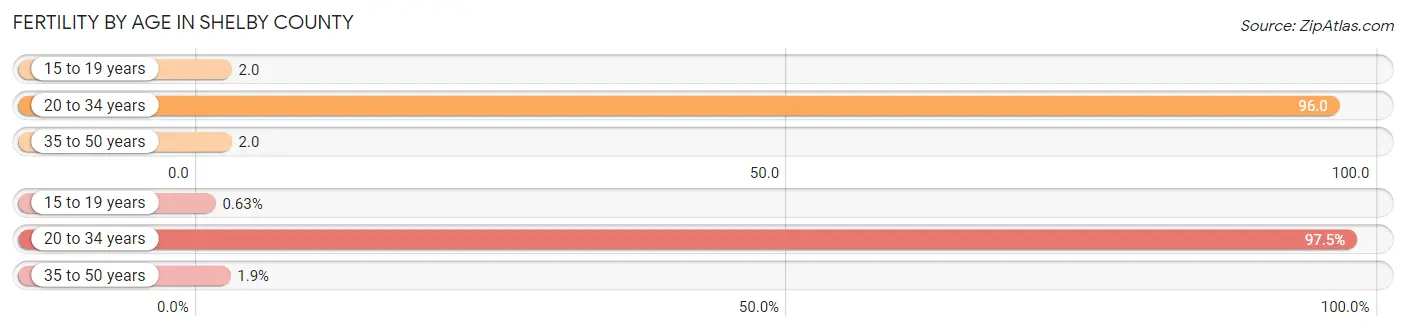
| Age Bracket | Women with Births | Births / 1,000 Women |
| 15 to 19 years | 1 (0.6%) | 2.0 |
| 20 to 34 years | 155 (97.5%) | 96.0 |
| 35 to 50 years | 3 (1.9%) | 2.0 |
| Total | 159 (100.0%) | 40.0 |
Fertility by Age by Marriage Status in Shelby County
78.6% of women with births (159) in Shelby County are married. The highest percentage of unmarried women with births falls into 15 to 19 years age bracket with 100.0% of them unmarried at the time of birth, while the lowest percentage of unmarried women with births belong to 35 to 50 years age bracket with 0.0% of them unmarried.
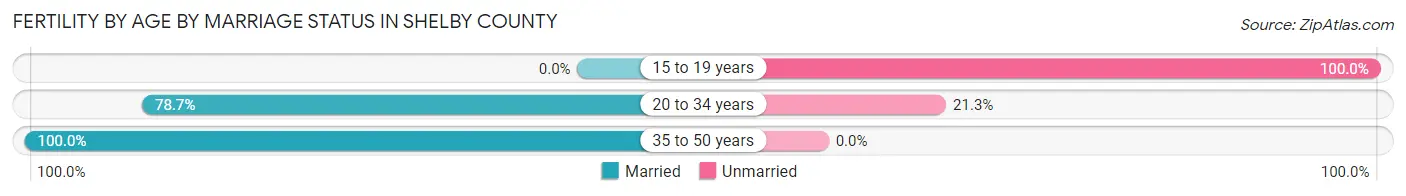
| Age Bracket | Married | Unmarried |
| 15 to 19 years | 0 (0.0%) | 1 (100.0%) |
| 20 to 34 years | 122 (78.7%) | 33 (21.3%) |
| 35 to 50 years | 3 (100.0%) | 0 (0.0%) |
| Total | 125 (78.6%) | 34 (21.4%) |
Fertility by Education in Shelby County
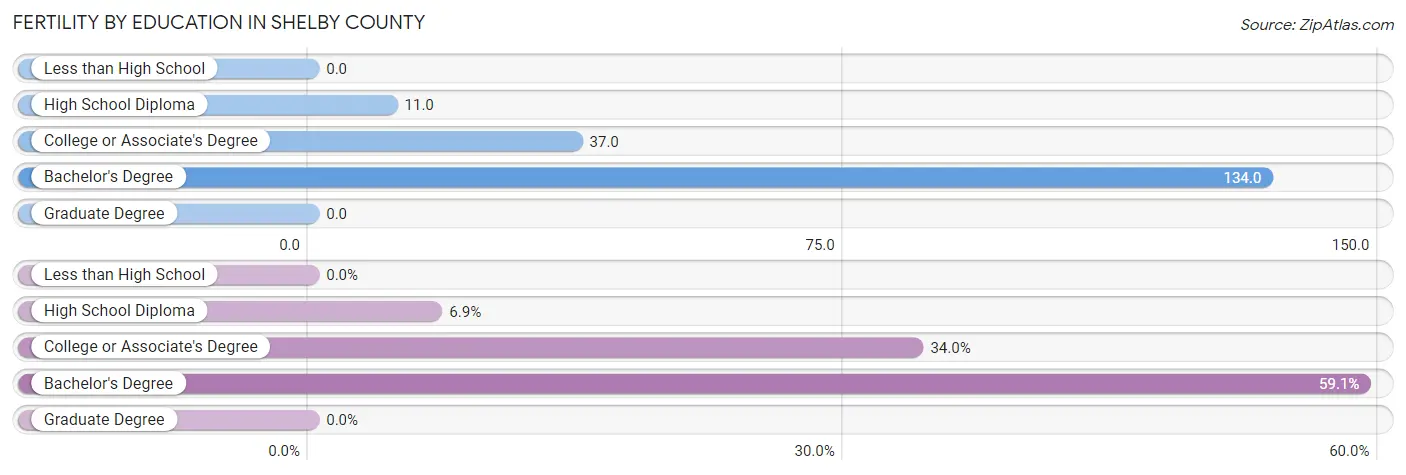
| Educational Attainment | Women with Births | Births / 1,000 Women |
| Less than High School | 0 (0.0%) | 0.0 |
| High School Diploma | 11 (6.9%) | 11.0 |
| College or Associate's Degree | 54 (34.0%) | 37.0 |
| Bachelor's Degree | 94 (59.1%) | 134.0 |
| Graduate Degree | 0 (0.0%) | 0.0 |
| Total | 159 (100.0%) | 40.0 |
Fertility by Education by Marriage Status in Shelby County
21.4% of women with births in Shelby County are unmarried. Women with the educational attainment of bachelor's degree are most likely to be married with 97.9% of them married at childbirth, while women with the educational attainment of college or associate's degree are least likely to be married with 50.0% of them unmarried at childbirth.
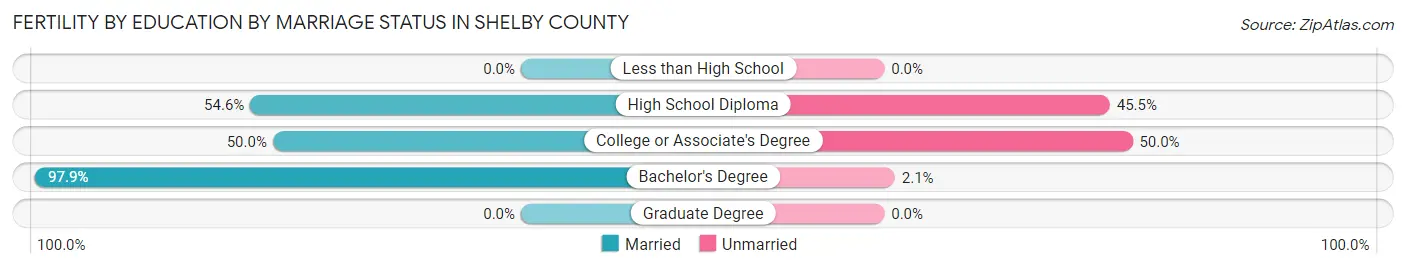
| Educational Attainment | Married | Unmarried |
| Less than High School | 0 (0.0%) | 0 (0.0%) |
| High School Diploma | 6 (54.5%) | 5 (45.5%) |
| College or Associate's Degree | 27 (50.0%) | 27 (50.0%) |
| Bachelor's Degree | 92 (97.9%) | 2 (2.1%) |
| Graduate Degree | 0 (0.0%) | 0 (0.0%) |
| Total | 125 (78.6%) | 34 (21.4%) |
Income in Shelby County
Income Overview in Shelby County
Per Capita Income in Shelby County is $32,085, while median incomes of families and households are $78,188 and $65,585 respectively.
| Characteristic | Number | Measure |
| Per Capita Income | 21,042 | $32,085 |
| Median Family Income | 5,938 | $78,188 |
| Mean Family Income | 5,938 | $89,357 |
| Median Household Income | 8,762 | $65,585 |
| Mean Household Income | 8,762 | $76,869 |
| Income Deficit | 5,938 | $8,804 |
| Wage / Income Gap (%) | 21,042 | 32.05% |
| Wage / Income Gap ($) | 21,042 | 67.95¢ per $1 |
| Gini / Inequality Index | 21,042 | 0.39 |
Earnings by Sex in Shelby County
Average Earnings in Shelby County are $39,194, $45,890 for men and $31,180 for women, a difference of 32.1%.
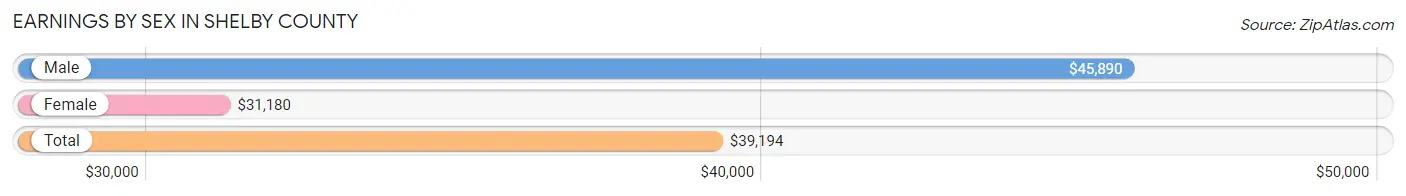
| Sex | Number | Average Earnings |
| Male | 5,770 (53.0%) | $45,890 |
| Female | 5,111 (47.0%) | $31,180 |
| Total | 10,881 (100.0%) | $39,194 |
Earnings by Sex by Income Bracket in Shelby County
The most common earnings brackets in Shelby County are $55,000 to $64,999 for men (605 | 10.5%) and $25,000 to $29,999 for women (452 | 8.8%).
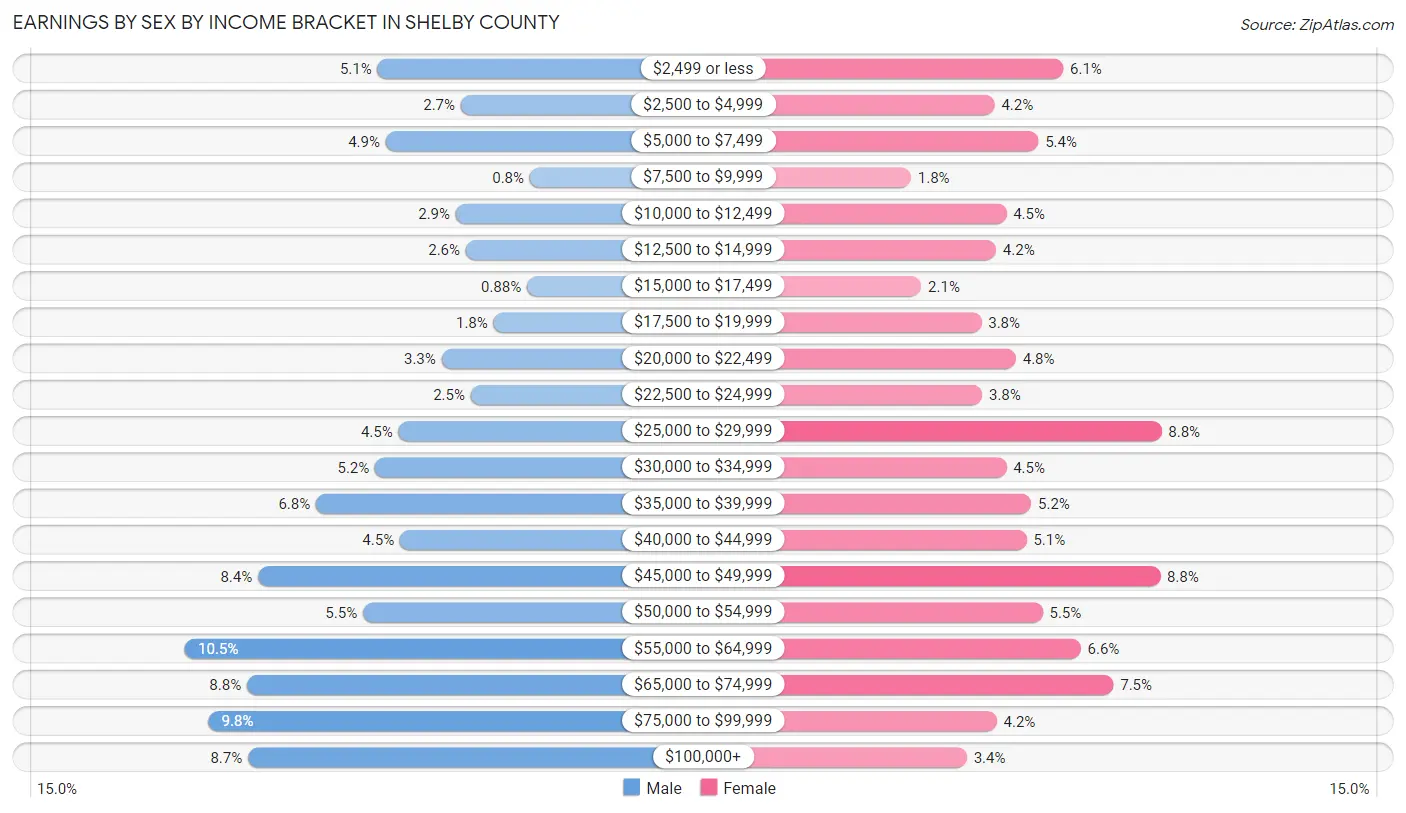
| Income | Male | Female |
| $2,499 or less | 293 (5.1%) | 311 (6.1%) |
| $2,500 to $4,999 | 158 (2.7%) | 212 (4.2%) |
| $5,000 to $7,499 | 280 (4.9%) | 275 (5.4%) |
| $7,500 to $9,999 | 46 (0.8%) | 92 (1.8%) |
| $10,000 to $12,499 | 166 (2.9%) | 229 (4.5%) |
| $12,500 to $14,999 | 150 (2.6%) | 214 (4.2%) |
| $15,000 to $17,499 | 51 (0.9%) | 107 (2.1%) |
| $17,500 to $19,999 | 105 (1.8%) | 193 (3.8%) |
| $20,000 to $22,499 | 189 (3.3%) | 243 (4.8%) |
| $22,500 to $24,999 | 142 (2.5%) | 194 (3.8%) |
| $25,000 to $29,999 | 259 (4.5%) | 452 (8.8%) |
| $30,000 to $34,999 | 297 (5.1%) | 229 (4.5%) |
| $35,000 to $39,999 | 393 (6.8%) | 265 (5.2%) |
| $40,000 to $44,999 | 257 (4.4%) | 258 (5.1%) |
| $45,000 to $49,999 | 487 (8.4%) | 450 (8.8%) |
| $50,000 to $54,999 | 317 (5.5%) | 281 (5.5%) |
| $55,000 to $64,999 | 605 (10.5%) | 336 (6.6%) |
| $65,000 to $74,999 | 505 (8.7%) | 383 (7.5%) |
| $75,000 to $99,999 | 567 (9.8%) | 215 (4.2%) |
| $100,000+ | 503 (8.7%) | 172 (3.4%) |
| Total | 5,770 (100.0%) | 5,111 (100.0%) |
Earnings by Sex by Educational Attainment in Shelby County
Average earnings in Shelby County are $48,398 for men and $36,560 for women, a difference of 24.5%. Men with an educational attainment of graduate degree enjoy the highest average annual earnings of $79,000, while those with bachelor's degree education earn the least with $47,004. Women with an educational attainment of graduate degree earn the most with the average annual earnings of $61,750, while those with less than high school education have the smallest earnings of $11,324.
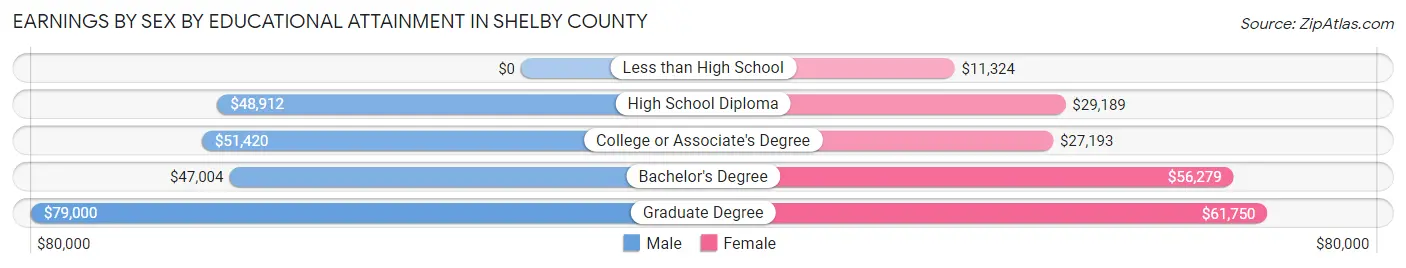
| Educational Attainment | Male Income | Female Income |
| Less than High School | - | - |
| High School Diploma | $48,912 | $29,189 |
| College or Associate's Degree | $51,420 | $27,193 |
| Bachelor's Degree | $47,004 | $56,279 |
| Graduate Degree | $79,000 | $61,750 |
| Total | $48,398 | $36,560 |
Family Income in Shelby County
Family Income Brackets in Shelby County
According to the Shelby County family income data, there are 1,360 families falling into the $100,000 to $149,999 income range, which is the most common income bracket and makes up 22.9% of all families. Conversely, the $10,000 to $14,999 income bracket is the least frequent group with only 65 families (1.1%) belonging to this category.
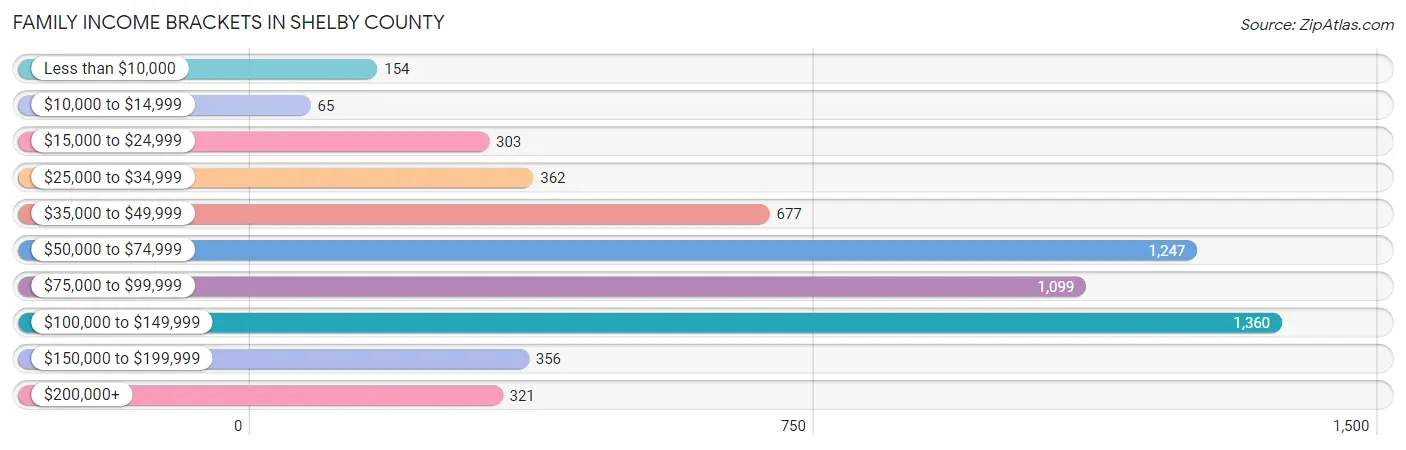
| Income Bracket | # Families | % Families |
| Less than $10,000 | 154 | 2.6% |
| $10,000 to $14,999 | 65 | 1.1% |
| $15,000 to $24,999 | 303 | 5.1% |
| $25,000 to $34,999 | 362 | 6.1% |
| $35,000 to $49,999 | 677 | 11.4% |
| $50,000 to $74,999 | 1,247 | 21.0% |
| $75,000 to $99,999 | 1,099 | 18.5% |
| $100,000 to $149,999 | 1,360 | 22.9% |
| $150,000 to $199,999 | 356 | 6.0% |
| $200,000+ | 321 | 5.4% |
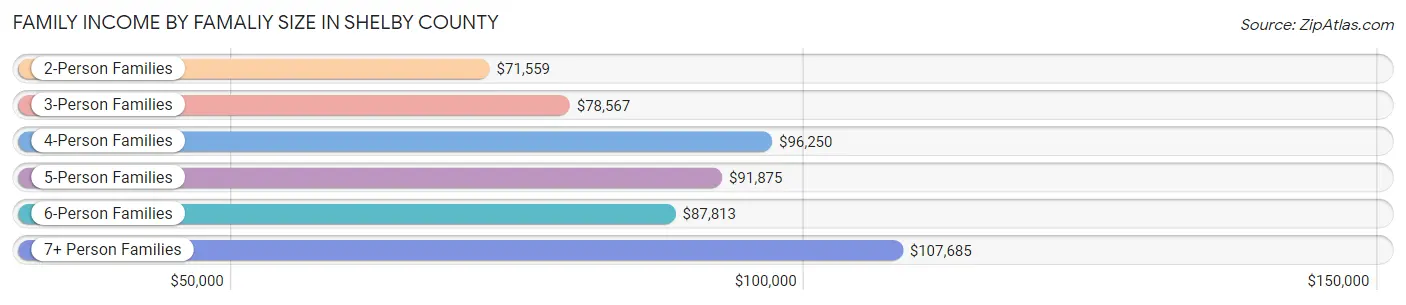
Family Income by Famaliy Size in Shelby County
7+ person families (56 | 0.9%) account for the highest median family income in Shelby County with $107,685 per family, while 2-person families (3,252 | 54.8%) have the highest median income of $35,780 per family member.
| Income Bracket | # Families | Median Income |
| 2-Person Families | 3,252 (54.8%) | $71,559 |
| 3-Person Families | 1,130 (19.0%) | $78,567 |
| 4-Person Families | 977 (16.5%) | $96,250 |
| 5-Person Families | 363 (6.1%) | $91,875 |
| 6-Person Families | 160 (2.7%) | $87,813 |
| 7+ Person Families | 56 (0.9%) | $107,685 |
| Total | 5,938 (100.0%) | $78,188 |
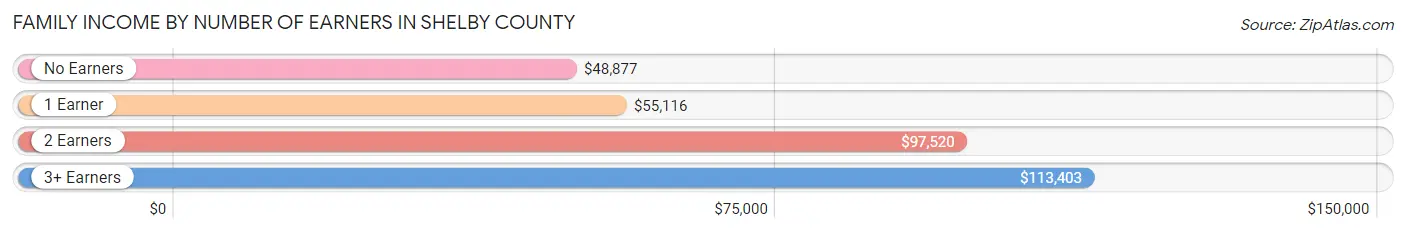
Family Income by Number of Earners in Shelby County
The median family income in Shelby County is $78,188, with families comprising 3+ earners (653) having the highest median family income of $113,403, while families with no earners (1,079) have the lowest median family income of $48,877, accounting for 11.0% and 18.2% of families, respectively.
| Number of Earners | # Families | Median Income |
| No Earners | 1,079 (18.2%) | $48,877 |
| 1 Earner | 1,671 (28.1%) | $55,116 |
| 2 Earners | 2,535 (42.7%) | $97,520 |
| 3+ Earners | 653 (11.0%) | $113,403 |
| Total | 5,938 (100.0%) | $78,188 |
Household Income in Shelby County
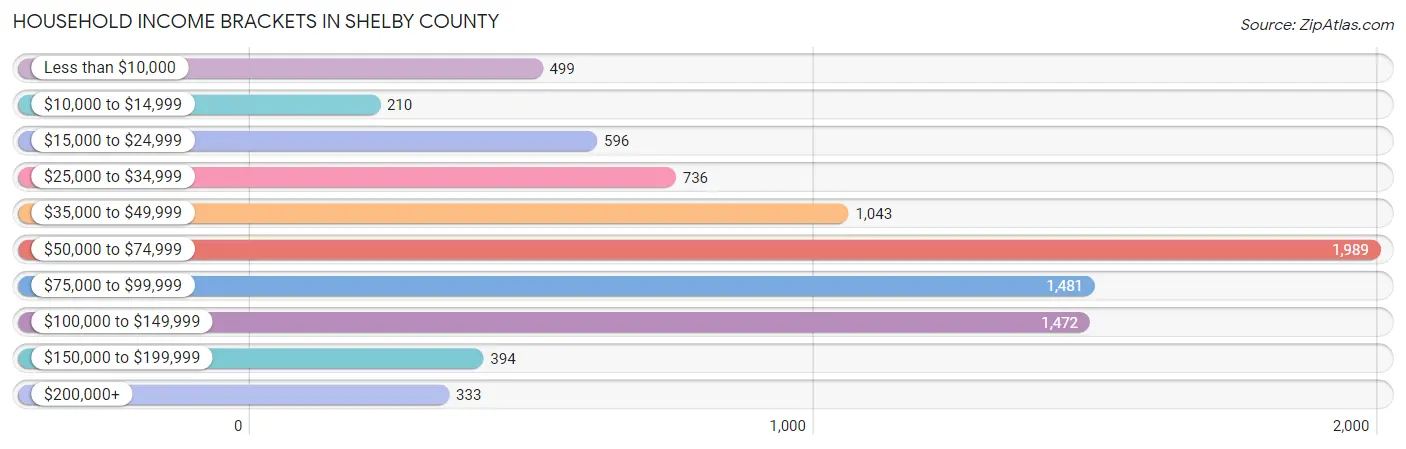
Household Income Brackets in Shelby County
With 1,989 households falling in the category, the $50,000 to $74,999 income range is the most frequent in Shelby County, accounting for 22.7% of all households. In contrast, only 210 households (2.4%) fall into the $10,000 to $14,999 income bracket, making it the least populous group.
| Income Bracket | # Households | % Households |
| Less than $10,000 | 499 | 5.7% |
| $10,000 to $14,999 | 210 | 2.4% |
| $15,000 to $24,999 | 596 | 6.8% |
| $25,000 to $34,999 | 736 | 8.4% |
| $35,000 to $49,999 | 1,043 | 11.9% |
| $50,000 to $74,999 | 1,989 | 22.7% |
| $75,000 to $99,999 | 1,481 | 16.9% |
| $100,000 to $149,999 | 1,472 | 16.8% |
| $150,000 to $199,999 | 394 | 4.5% |
| $200,000+ | 333 | 3.8% |
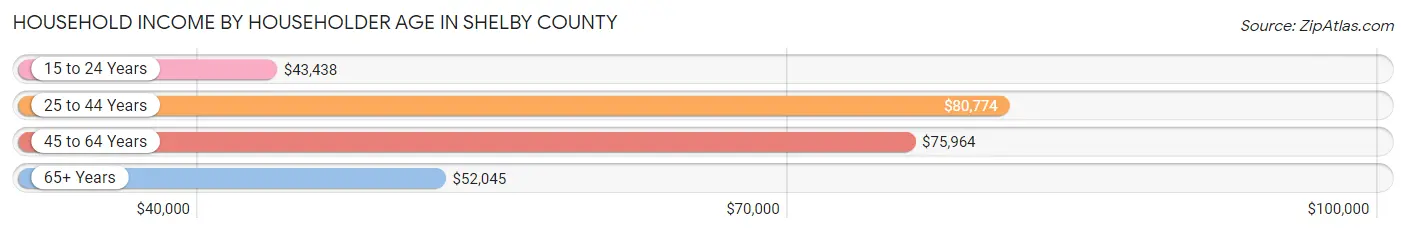
Household Income by Householder Age in Shelby County
The median household income in Shelby County is $65,585, with the highest median household income of $80,774 found in the 25 to 44 years age bracket for the primary householder. A total of 2,237 households (25.5%) fall into this category. Meanwhile, the 15 to 24 years age bracket for the primary householder has the lowest median household income of $43,438, with 258 households (2.9%) in this group.
| Income Bracket | # Households | Median Income |
| 15 to 24 Years | 258 (2.9%) | $43,438 |
| 25 to 44 Years | 2,237 (25.5%) | $80,774 |
| 45 to 64 Years | 3,199 (36.5%) | $75,964 |
| 65+ Years | 3,068 (35.0%) | $52,045 |
| Total | 8,762 (100.0%) | $65,585 |
Poverty in Shelby County
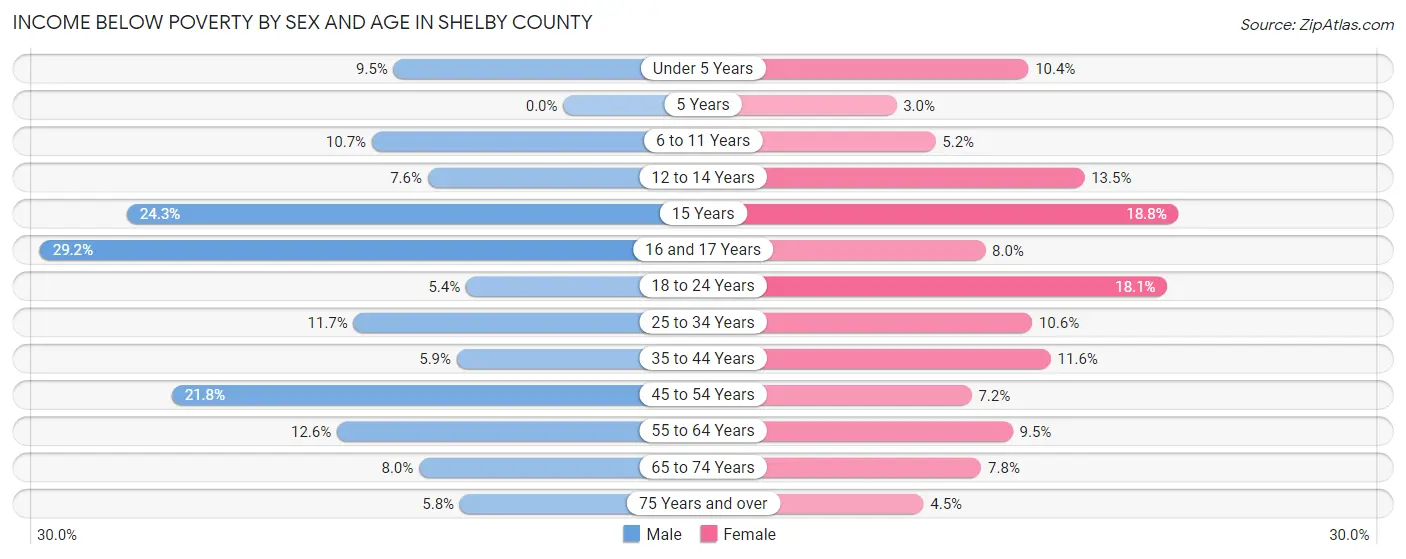
Income Below Poverty by Sex and Age in Shelby County
With 11.3% poverty level for males and 9.3% for females among the residents of Shelby County, 16 and 17 year old males and 15 year old females are the most vulnerable to poverty, with 93 males (29.1%) and 24 females (18.8%) in their respective age groups living below the poverty level.
| Age Bracket | Male | Female |
| Under 5 Years | 52 (9.5%) | 60 (10.4%) |
| 5 Years | 0 (0.0%) | 4 (3.0%) |
| 6 to 11 Years | 95 (10.7%) | 39 (5.2%) |
| 12 to 14 Years | 25 (7.5%) | 54 (13.5%) |
| 15 Years | 26 (24.3%) | 24 (18.8%) |
| 16 and 17 Years | 93 (29.1%) | 19 (8.0%) |
| 18 to 24 Years | 39 (5.4%) | 128 (18.1%) |
| 25 to 34 Years | 128 (11.7%) | 116 (10.6%) |
| 35 to 44 Years | 73 (5.9%) | 134 (11.6%) |
| 45 to 54 Years | 281 (21.8%) | 89 (7.2%) |
| 55 to 64 Years | 195 (12.6%) | 150 (9.5%) |
| 65 to 74 Years | 105 (8.0%) | 108 (7.8%) |
| 75 Years and over | 51 (5.8%) | 50 (4.5%) |
| Total | 1,163 (11.3%) | 975 (9.3%) |
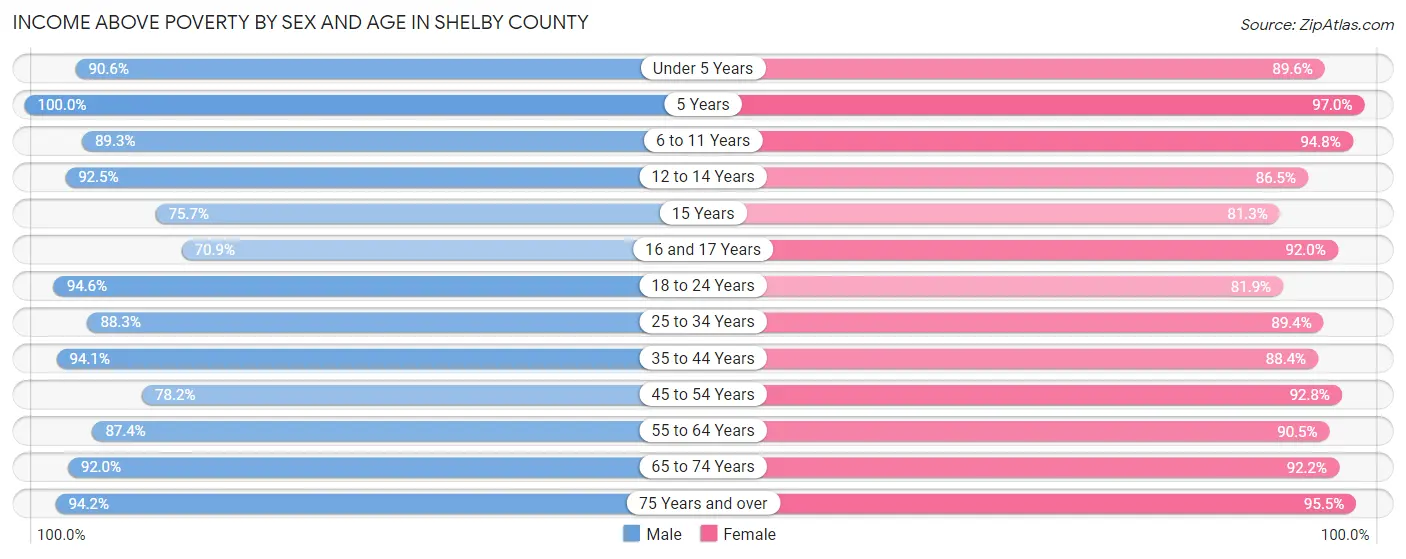
Income Above Poverty by Sex and Age in Shelby County
According to the poverty statistics in Shelby County, males aged 5 years and females aged 5 years are the age groups that are most secure financially, with 100.0% of males and 97.0% of females in these age groups living above the poverty line.
| Age Bracket | Male | Female |
| Under 5 Years | 498 (90.5%) | 518 (89.6%) |
| 5 Years | 62 (100.0%) | 128 (97.0%) |
| 6 to 11 Years | 796 (89.3%) | 709 (94.8%) |
| 12 to 14 Years | 306 (92.4%) | 346 (86.5%) |
| 15 Years | 81 (75.7%) | 104 (81.2%) |
| 16 and 17 Years | 226 (70.9%) | 219 (92.0%) |
| 18 to 24 Years | 680 (94.6%) | 578 (81.9%) |
| 25 to 34 Years | 968 (88.3%) | 979 (89.4%) |
| 35 to 44 Years | 1,157 (94.1%) | 1,018 (88.4%) |
| 45 to 54 Years | 1,008 (78.2%) | 1,143 (92.8%) |
| 55 to 64 Years | 1,353 (87.4%) | 1,427 (90.5%) |
| 65 to 74 Years | 1,203 (92.0%) | 1,284 (92.2%) |
| 75 Years and over | 835 (94.2%) | 1,052 (95.5%) |
| Total | 9,173 (88.7%) | 9,505 (90.7%) |
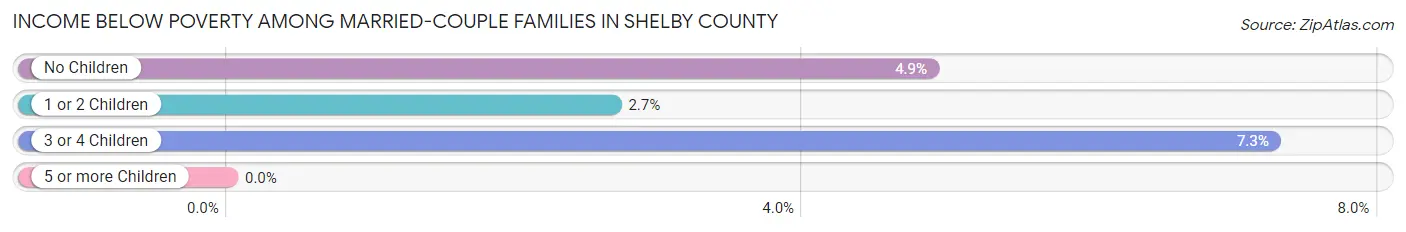
Income Below Poverty Among Married-Couple Families in Shelby County
The poverty statistics for married-couple families in Shelby County show that 4.5% or 216 of the total 4,831 families live below the poverty line. Families with 3 or 4 children have the highest poverty rate of 7.3%, comprising of 22 families. On the other hand, families with 5 or more children have the lowest poverty rate of 0.0%, which includes 0 families.
| Children | Above Poverty | Below Poverty |
| No Children | 3,161 (95.1%) | 162 (4.9%) |
| 1 or 2 Children | 1,168 (97.3%) | 32 (2.7%) |
| 3 or 4 Children | 281 (92.7%) | 22 (7.3%) |
| 5 or more Children | 5 (100.0%) | 0 (0.0%) |
| Total | 4,615 (95.5%) | 216 (4.5%) |
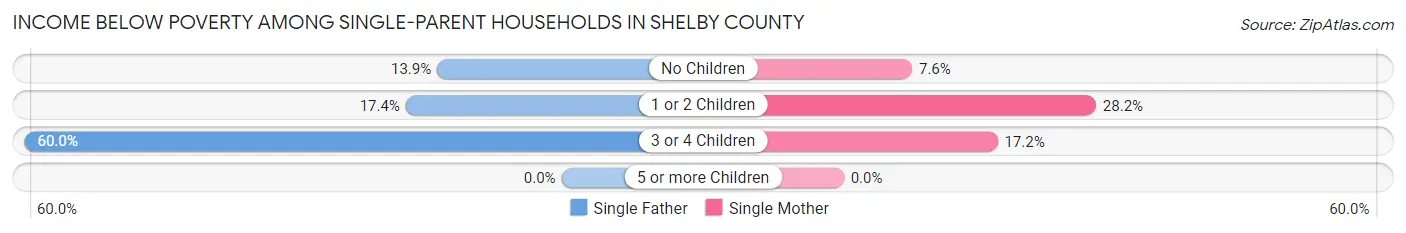
Income Below Poverty Among Single-Parent Households in Shelby County
According to the poverty data in Shelby County, 20.8% or 79 single-father households and 19.1% or 139 single-mother households are living below the poverty line. Among single-father households, those with 3 or 4 children have the highest poverty rate, with 24 households (60.0%) experiencing poverty. Likewise, among single-mother households, those with 1 or 2 children have the highest poverty rate, with 106 households (28.2%) falling below the poverty line.
| Children | Single Father | Single Mother |
| No Children | 16 (13.9%) | 22 (7.6%) |
| 1 or 2 Children | 39 (17.4%) | 106 (28.2%) |
| 3 or 4 Children | 24 (60.0%) | 11 (17.2%) |
| 5 or more Children | 0 (0.0%) | 0 (0.0%) |
| Total | 79 (20.8%) | 139 (19.1%) |
Income Below Poverty Among Married-Couple vs Single-Parent Households in Shelby County
The poverty data for Shelby County shows that 216 of the married-couple family households (4.5%) and 218 of the single-parent households (19.7%) are living below the poverty level. Within the married-couple family households, those with 3 or 4 children have the highest poverty rate, with 22 households (7.3%) falling below the poverty line. Among the single-parent households, those with 3 or 4 children have the highest poverty rate, with 35 household (33.7%) living below poverty.
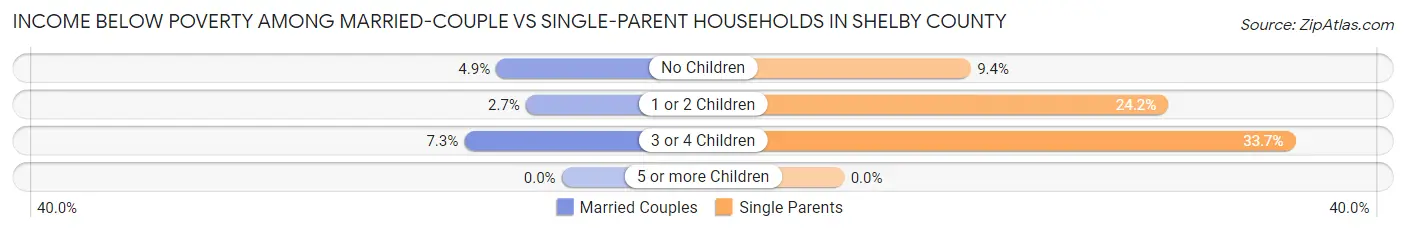
| Children | Married-Couple Families | Single-Parent Households |
| No Children | 162 (4.9%) | 38 (9.4%) |
| 1 or 2 Children | 32 (2.7%) | 145 (24.2%) |
| 3 or 4 Children | 22 (7.3%) | 35 (33.7%) |
| 5 or more Children | 0 (0.0%) | 0 (0.0%) |
| Total | 216 (4.5%) | 218 (19.7%) |
Employment Characteristics in Shelby County
Employment by Class of Employer in Shelby County
Among the 10,097 employed individuals in Shelby County, private company employees (6,620 | 65.6%), not-for-profit organizations (930 | 9.2%), and self-employed (not incorporated) (762 | 7.5%) make up the most common classes of employment.
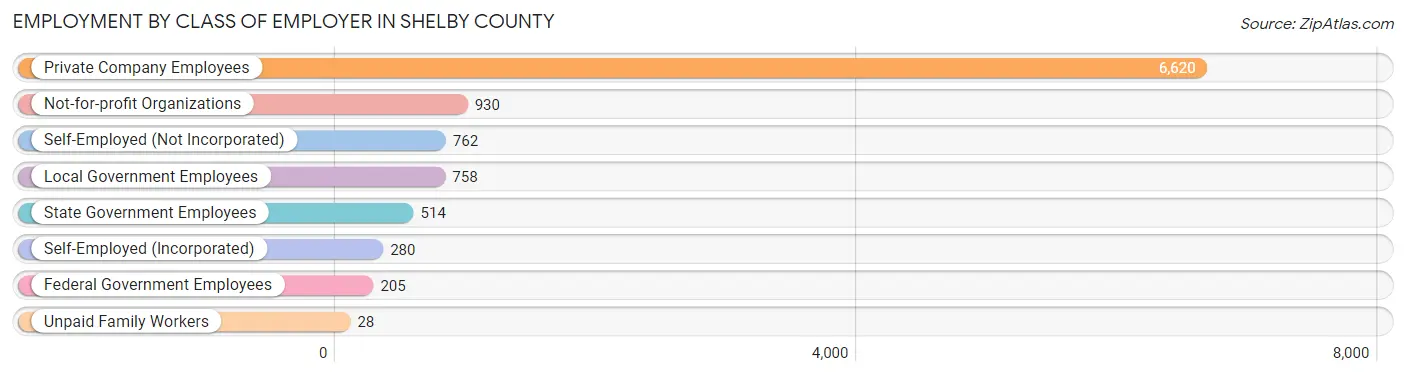
| Employer Class | # Employees | % Employees |
| Private Company Employees | 6,620 | 65.6% |
| Self-Employed (Incorporated) | 280 | 2.8% |
| Self-Employed (Not Incorporated) | 762 | 7.5% |
| Not-for-profit Organizations | 930 | 9.2% |
| Local Government Employees | 758 | 7.5% |
| State Government Employees | 514 | 5.1% |
| Federal Government Employees | 205 | 2.0% |
| Unpaid Family Workers | 28 | 0.3% |
| Total | 10,097 | 100.0% |
Employment Status by Age in Shelby County
According to the labor force statistics for Shelby County, out of the total population over 16 years of age (17,065), 62.3% or 10,631 individuals are in the labor force, with 4.0% or 425 of them unemployed. The age group with the highest labor force participation rate is 25 to 29 years, with 92.6% or 1,019 individuals in the labor force. Within the labor force, the 16 to 19 years age range has the highest percentage of unemployed individuals, with 16.1% or 66 of them being unemployed.
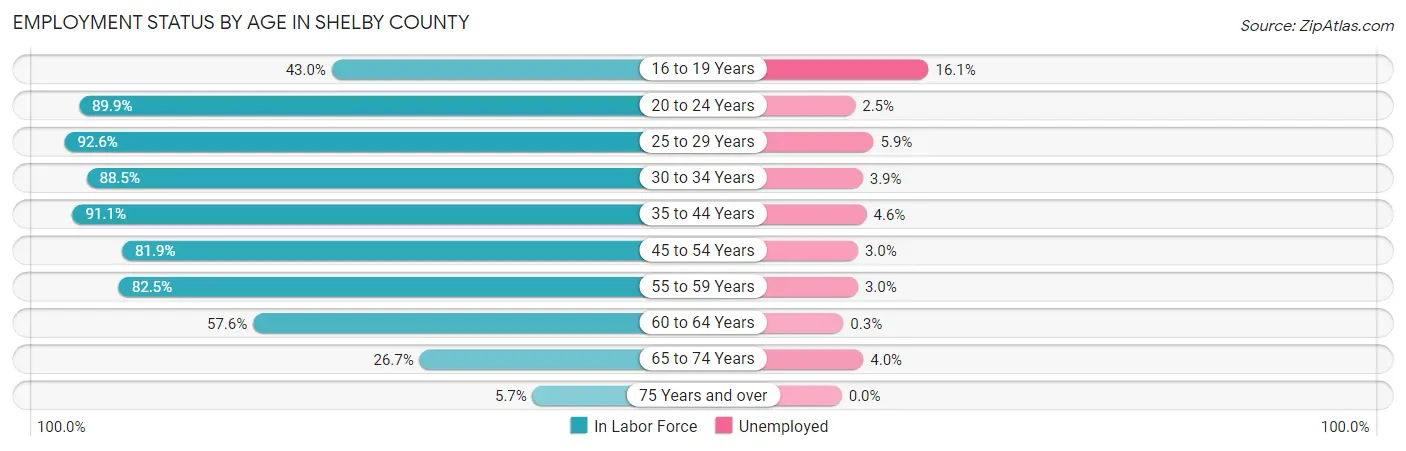
| Age Bracket | In Labor Force | Unemployed |
| 16 to 19 Years | 411 (43.0%) | 66 (16.1%) |
| 20 to 24 Years | 928 (89.9%) | 23 (2.5%) |
| 25 to 29 Years | 1,019 (92.6%) | 60 (5.9%) |
| 30 to 34 Years | 971 (88.5%) | 38 (3.9%) |
| 35 to 44 Years | 2,171 (91.1%) | 100 (4.6%) |
| 45 to 54 Years | 2,067 (81.9%) | 62 (3.0%) |
| 55 to 59 Years | 1,313 (82.5%) | 39 (3.0%) |
| 60 to 64 Years | 901 (57.6%) | 3 (0.3%) |
| 65 to 74 Years | 723 (26.7%) | 29 (4.0%) |
| 75 Years and over | 120 (5.7%) | 0 (0.0%) |
| Total | 10,631 (62.3%) | 425 (4.0%) |
Employment Status by Educational Attainment in Shelby County
According to labor force statistics for Shelby County, 82.3% of individuals (8,445) out of the total population between 25 and 64 years of age (10,261) are in the labor force, with 3.6% or 304 of them being unemployed. The group with the highest labor force participation rate are those with the educational attainment of bachelor's degree or higher, with 92.7% or 1,909 individuals in the labor force. Within the labor force, individuals with less than high school education have the highest percentage of unemployment, with 15.4% or 44 of them being unemployed.
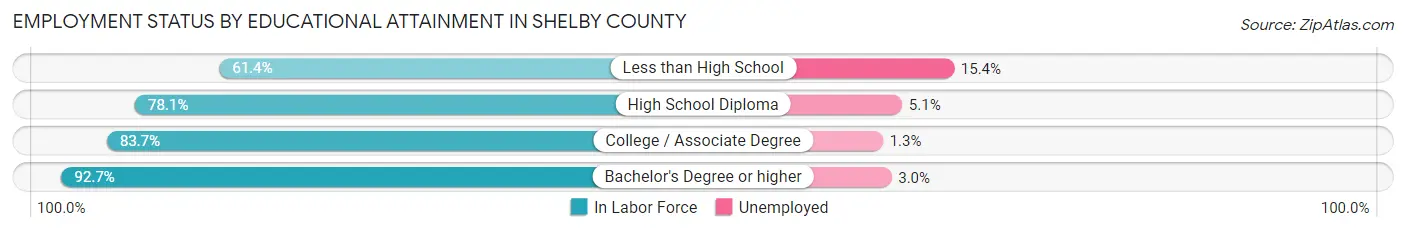
| Educational Attainment | In Labor Force | Unemployed |
| Less than High School | 285 (61.4%) | 71 (15.4%) |
| High School Diploma | 3,158 (78.1%) | 206 (5.1%) |
| College / Associate Degree | 3,092 (83.7%) | 48 (1.3%) |
| Bachelor's Degree or higher | 1,909 (92.7%) | 62 (3.0%) |
| Total | 8,445 (82.3%) | 369 (3.6%) |
Employment Occupations by Sex in Shelby County
Management, Business, Science and Arts Occupations
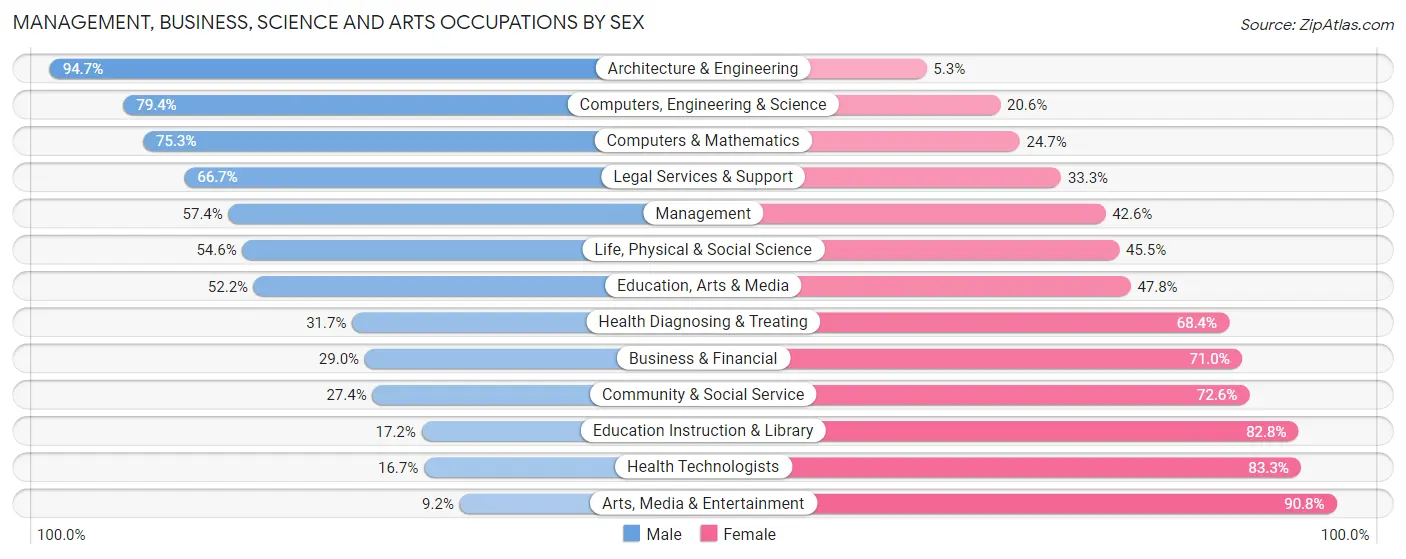
The most common Management, Business, Science and Arts occupations in Shelby County are Management (1,055 | 10.3%), Community & Social Service (700 | 6.9%), Health Diagnosing & Treating (613 | 6.0%), Education Instruction & Library (419 | 4.1%), and Business & Financial (355 | 3.5%).

Management, Business, Science and Arts Occupations by Sex
Within the Management, Business, Science and Arts occupations in Shelby County, the most male-oriented occupations are Architecture & Engineering (94.7%), Computers, Engineering & Science (79.4%), and Computers & Mathematics (75.3%), while the most female-oriented occupations are Arts, Media & Entertainment (90.8%), Health Technologists (83.3%), and Education Instruction & Library (82.8%).
| Occupation | Male | Female |
| Management | 606 (57.4%) | 449 (42.6%) |
| Business & Financial | 103 (29.0%) | 252 (71.0%) |
| Computers, Engineering & Science | 281 (79.4%) | 73 (20.6%) |
| Computers & Mathematics | 125 (75.3%) | 41 (24.7%) |
| Architecture & Engineering | 126 (94.7%) | 7 (5.3%) |
| Life, Physical & Social Science | 30 (54.5%) | 25 (45.5%) |
| Community & Social Service | 192 (27.4%) | 508 (72.6%) |
| Education, Arts & Media | 108 (52.2%) | 99 (47.8%) |
| Legal Services & Support | 6 (66.7%) | 3 (33.3%) |
| Education Instruction & Library | 72 (17.2%) | 347 (82.8%) |
| Arts, Media & Entertainment | 6 (9.2%) | 59 (90.8%) |
| Health Diagnosing & Treating | 194 (31.7%) | 419 (68.3%) |
| Health Technologists | 55 (16.7%) | 275 (83.3%) |
| Total (Category) | 1,376 (44.7%) | 1,701 (55.3%) |
| Total (Overall) | 5,334 (52.3%) | 4,865 (47.7%) |
Services Occupations
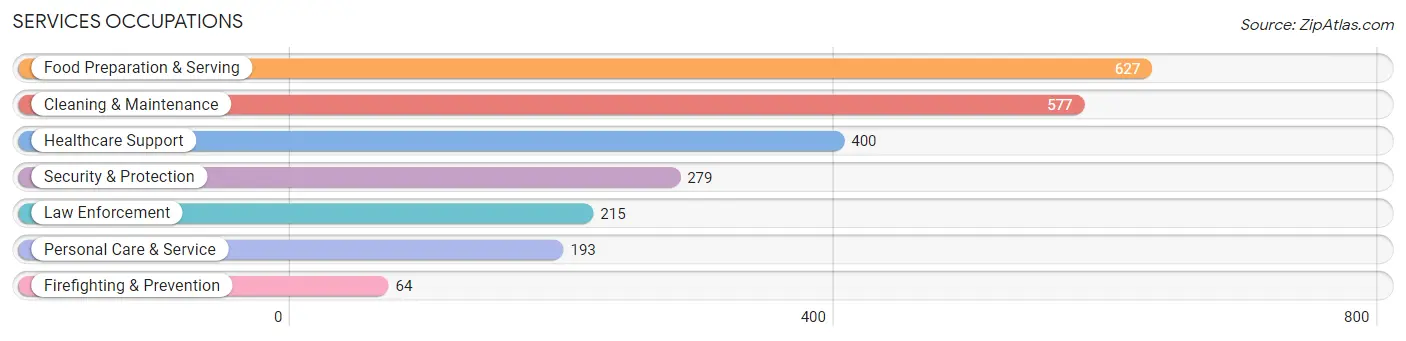
The most common Services occupations in Shelby County are Food Preparation & Serving (627 | 6.1%), Cleaning & Maintenance (577 | 5.7%), Healthcare Support (400 | 3.9%), Security & Protection (279 | 2.7%), and Law Enforcement (215 | 2.1%).
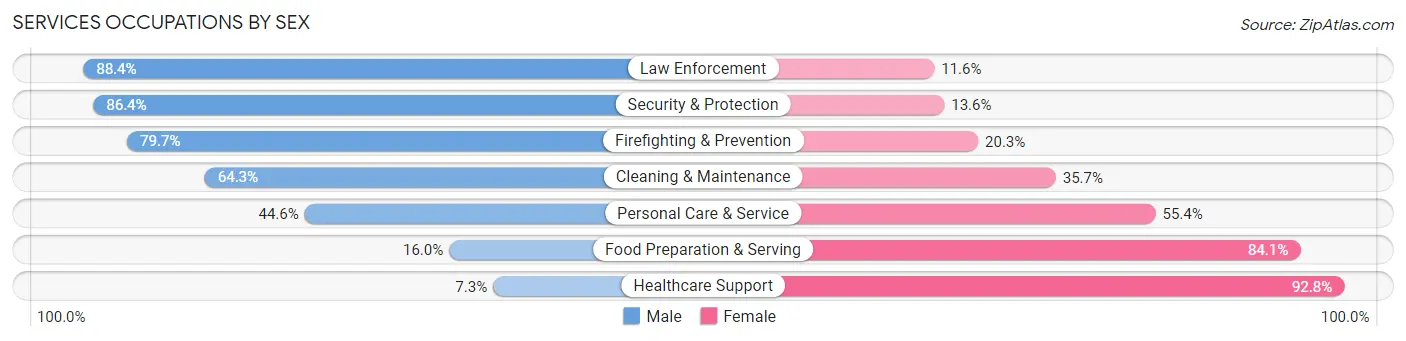
Services Occupations by Sex
Within the Services occupations in Shelby County, the most male-oriented occupations are Law Enforcement (88.4%), Security & Protection (86.4%), and Firefighting & Prevention (79.7%), while the most female-oriented occupations are Healthcare Support (92.7%), Food Preparation & Serving (84.1%), and Personal Care & Service (55.4%).
| Occupation | Male | Female |
| Healthcare Support | 29 (7.2%) | 371 (92.7%) |
| Security & Protection | 241 (86.4%) | 38 (13.6%) |
| Firefighting & Prevention | 51 (79.7%) | 13 (20.3%) |
| Law Enforcement | 190 (88.4%) | 25 (11.6%) |
| Food Preparation & Serving | 100 (16.0%) | 527 (84.1%) |
| Cleaning & Maintenance | 371 (64.3%) | 206 (35.7%) |
| Personal Care & Service | 86 (44.6%) | 107 (55.4%) |
| Total (Category) | 827 (39.8%) | 1,249 (60.2%) |
| Total (Overall) | 5,334 (52.3%) | 4,865 (47.7%) |
Sales and Office Occupations
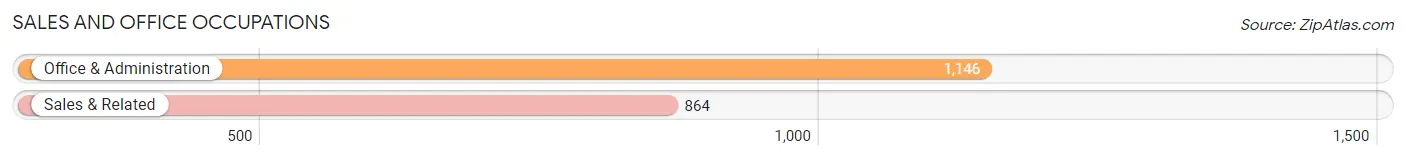
The most common Sales and Office occupations in Shelby County are Office & Administration (1,146 | 11.2%), and Sales & Related (864 | 8.5%).
Sales and Office Occupations by Sex
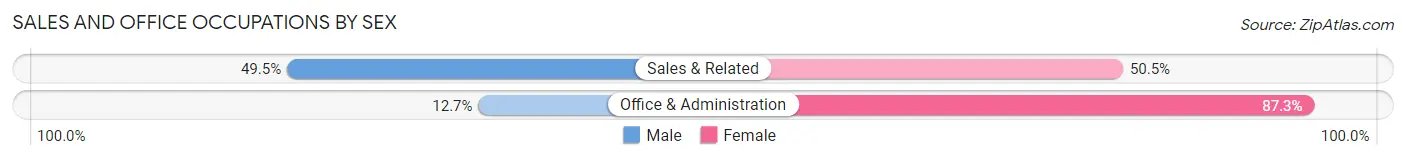
| Occupation | Male | Female |
| Sales & Related | 428 (49.5%) | 436 (50.5%) |
| Office & Administration | 146 (12.7%) | 1,000 (87.3%) |
| Total (Category) | 574 (28.6%) | 1,436 (71.4%) |
| Total (Overall) | 5,334 (52.3%) | 4,865 (47.7%) |
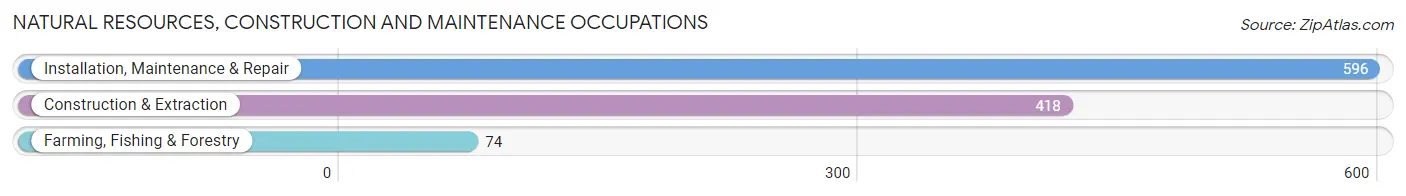
Natural Resources, Construction and Maintenance Occupations
The most common Natural Resources, Construction and Maintenance occupations in Shelby County are Installation, Maintenance & Repair (596 | 5.8%), Construction & Extraction (418 | 4.1%), and Farming, Fishing & Forestry (74 | 0.7%).
Natural Resources, Construction and Maintenance Occupations by Sex
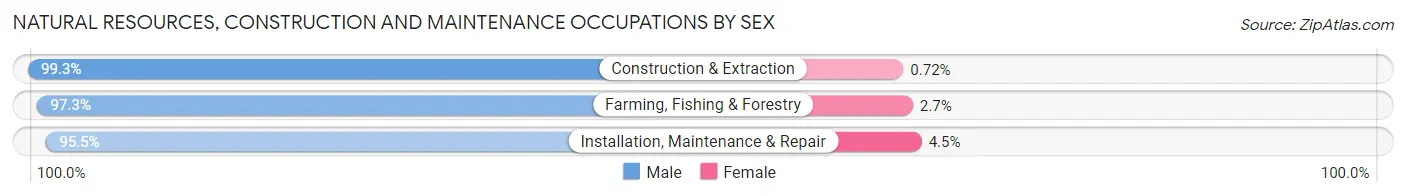
| Occupation | Male | Female |
| Farming, Fishing & Forestry | 72 (97.3%) | 2 (2.7%) |
| Construction & Extraction | 415 (99.3%) | 3 (0.7%) |
| Installation, Maintenance & Repair | 569 (95.5%) | 27 (4.5%) |
| Total (Category) | 1,056 (97.1%) | 32 (2.9%) |
| Total (Overall) | 5,334 (52.3%) | 4,865 (47.7%) |
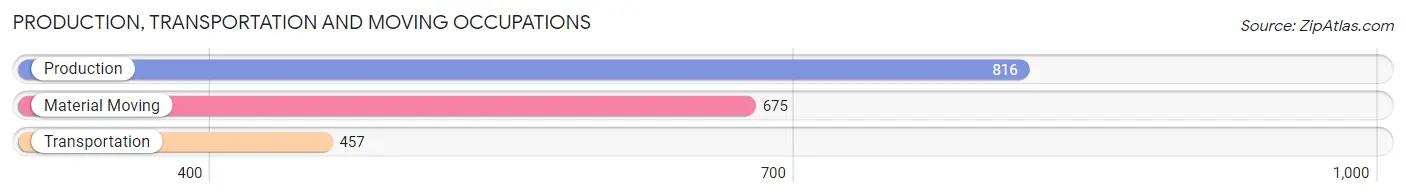
Production, Transportation and Moving Occupations
The most common Production, Transportation and Moving occupations in Shelby County are Production (816 | 8.0%), Material Moving (675 | 6.6%), and Transportation (457 | 4.5%).
Production, Transportation and Moving Occupations by Sex
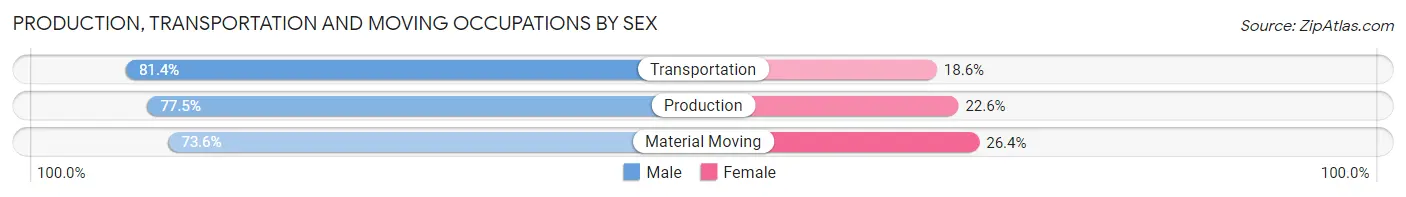
| Occupation | Male | Female |
| Production | 632 (77.4%) | 184 (22.6%) |
| Transportation | 372 (81.4%) | 85 (18.6%) |
| Material Moving | 497 (73.6%) | 178 (26.4%) |
| Total (Category) | 1,501 (77.0%) | 447 (23.0%) |
| Total (Overall) | 5,334 (52.3%) | 4,865 (47.7%) |
Employment Industries by Sex in Shelby County
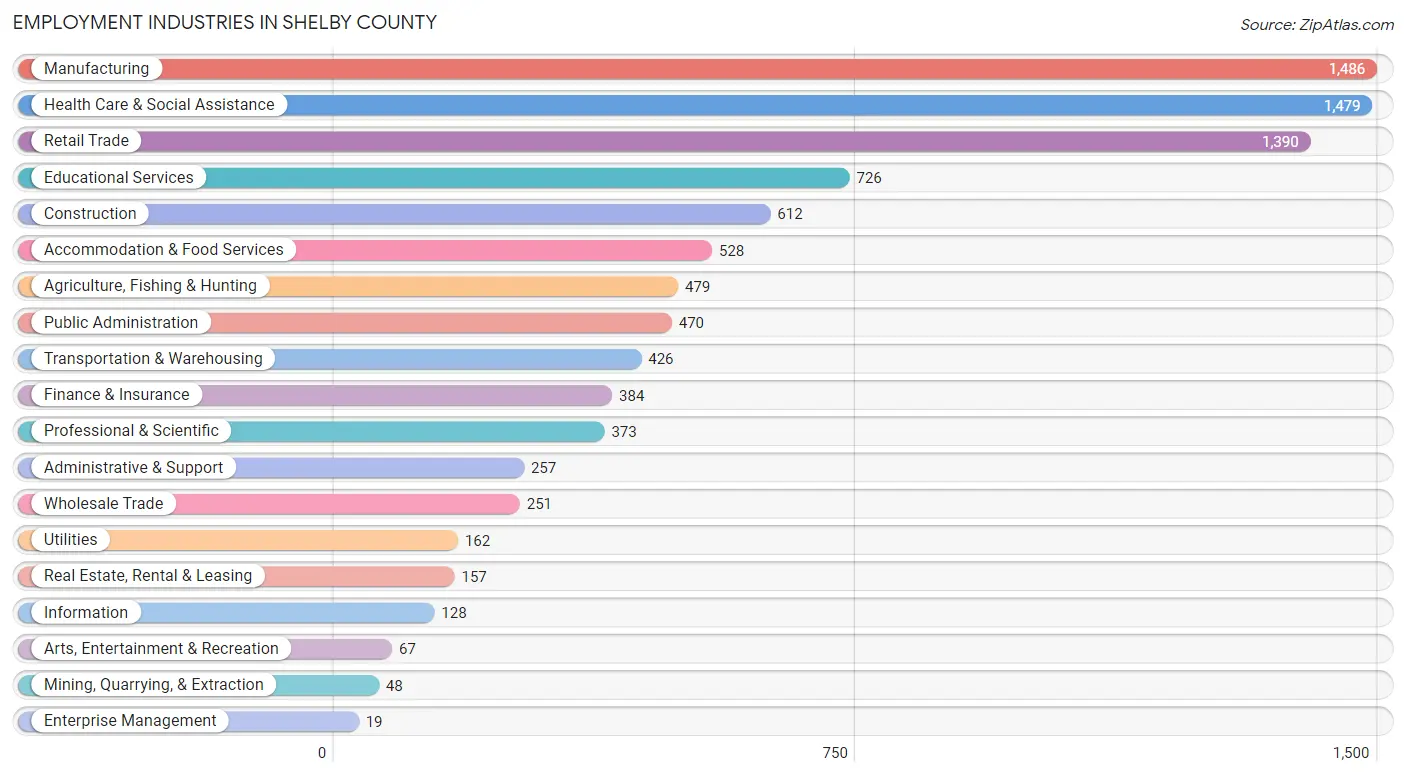
Employment Industries in Shelby County
The major employment industries in Shelby County include Manufacturing (1,486 | 14.6%), Health Care & Social Assistance (1,479 | 14.5%), Retail Trade (1,390 | 13.6%), Educational Services (726 | 7.1%), and Construction (612 | 6.0%).
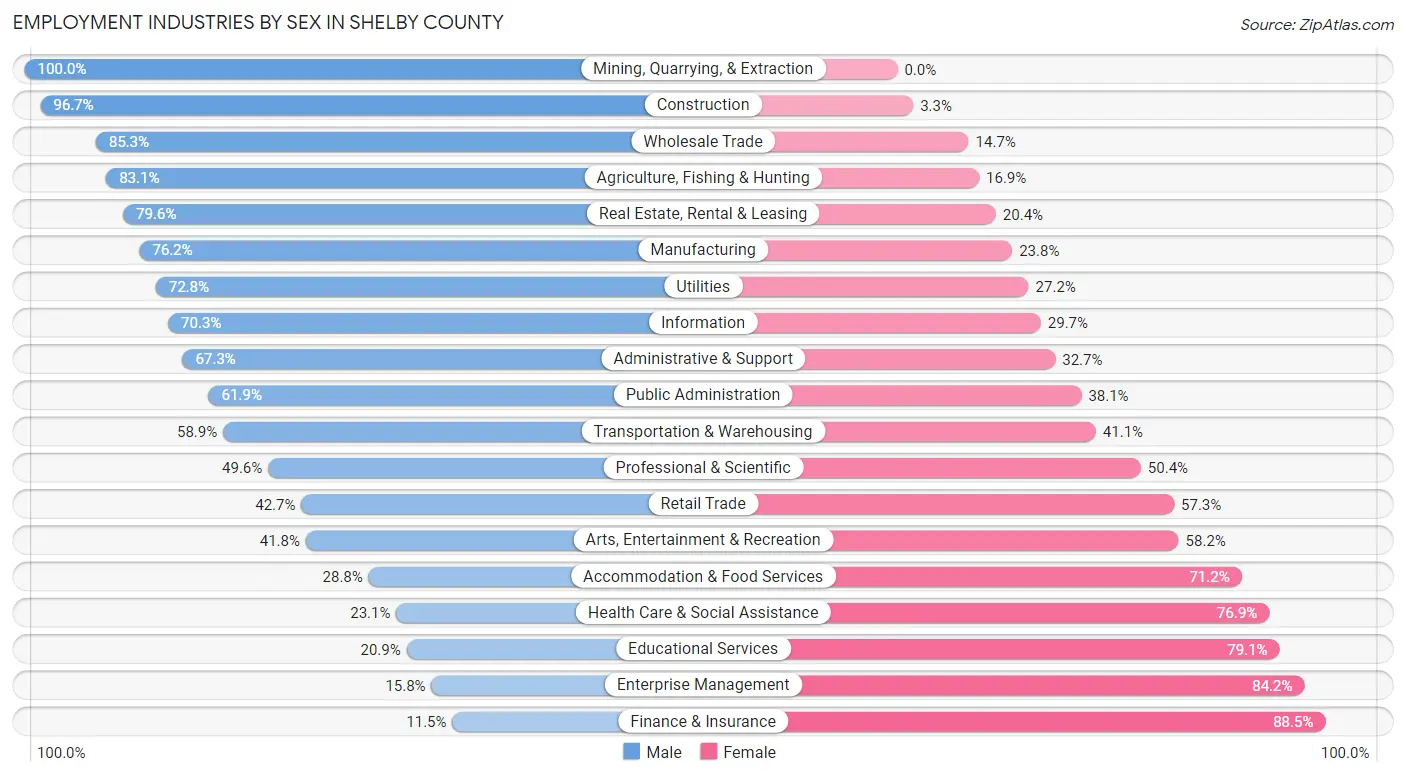
Employment Industries by Sex in Shelby County
The Shelby County industries that see more men than women are Mining, Quarrying, & Extraction (100.0%), Construction (96.7%), and Wholesale Trade (85.3%), whereas the industries that tend to have a higher number of women are Finance & Insurance (88.5%), Enterprise Management (84.2%), and Educational Services (79.1%).
| Industry | Male | Female |
| Agriculture, Fishing & Hunting | 398 (83.1%) | 81 (16.9%) |
| Mining, Quarrying, & Extraction | 48 (100.0%) | 0 (0.0%) |
| Construction | 592 (96.7%) | 20 (3.3%) |
| Manufacturing | 1,133 (76.2%) | 353 (23.8%) |
| Wholesale Trade | 214 (85.3%) | 37 (14.7%) |
| Retail Trade | 594 (42.7%) | 796 (57.3%) |
| Transportation & Warehousing | 251 (58.9%) | 175 (41.1%) |
| Utilities | 118 (72.8%) | 44 (27.2%) |
| Information | 90 (70.3%) | 38 (29.7%) |
| Finance & Insurance | 44 (11.5%) | 340 (88.5%) |
| Real Estate, Rental & Leasing | 125 (79.6%) | 32 (20.4%) |
| Professional & Scientific | 185 (49.6%) | 188 (50.4%) |
| Enterprise Management | 3 (15.8%) | 16 (84.2%) |
| Administrative & Support | 173 (67.3%) | 84 (32.7%) |
| Educational Services | 152 (20.9%) | 574 (79.1%) |
| Health Care & Social Assistance | 341 (23.1%) | 1,138 (76.9%) |
| Arts, Entertainment & Recreation | 28 (41.8%) | 39 (58.2%) |
| Accommodation & Food Services | 152 (28.8%) | 376 (71.2%) |
| Public Administration | 291 (61.9%) | 179 (38.1%) |
| Total | 5,334 (52.3%) | 4,865 (47.7%) |
Education in Shelby County
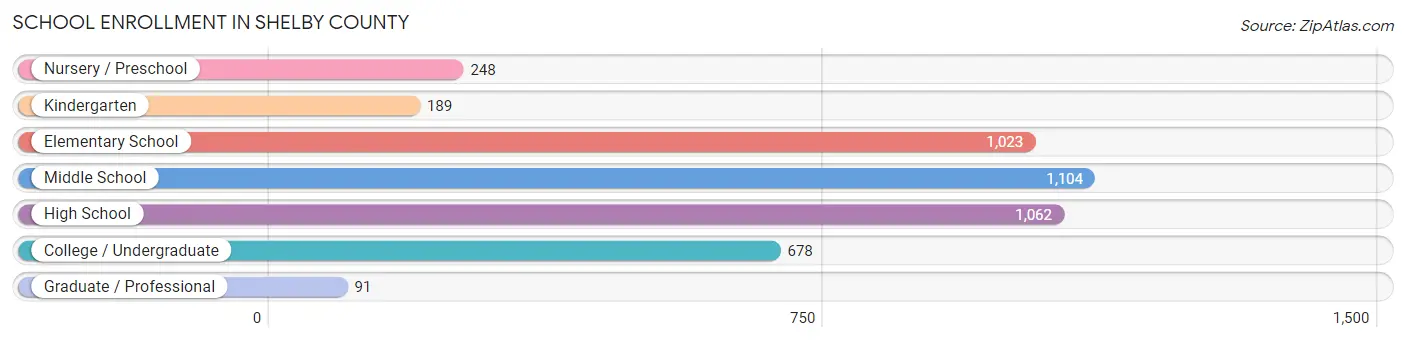
School Enrollment in Shelby County
The most common levels of schooling among the 4,395 students in Shelby County are middle school (1,104 | 25.1%), high school (1,062 | 24.2%), and elementary school (1,023 | 23.3%).
| School Level | # Students | % Students |
| Nursery / Preschool | 248 | 5.6% |
| Kindergarten | 189 | 4.3% |
| Elementary School | 1,023 | 23.3% |
| Middle School | 1,104 | 25.1% |
| High School | 1,062 | 24.2% |
| College / Undergraduate | 678 | 15.4% |
| Graduate / Professional | 91 | 2.1% |
| Total | 4,395 | 100.0% |
School Enrollment by Age by Funding Source in Shelby County
Out of a total of 4,395 students who are enrolled in schools in Shelby County, 523 (11.9%) attend a private institution, while the remaining 3,872 (88.1%) are enrolled in public schools. The age group of 3 to 4 year olds has the highest likelihood of being enrolled in private schools, with 77 (38.7% in the age bracket) enrolled. Conversely, the age group of 18 to 19 year olds has the lowest likelihood of being enrolled in a private school, with 316 (97.2% in the age bracket) attending a public institution.
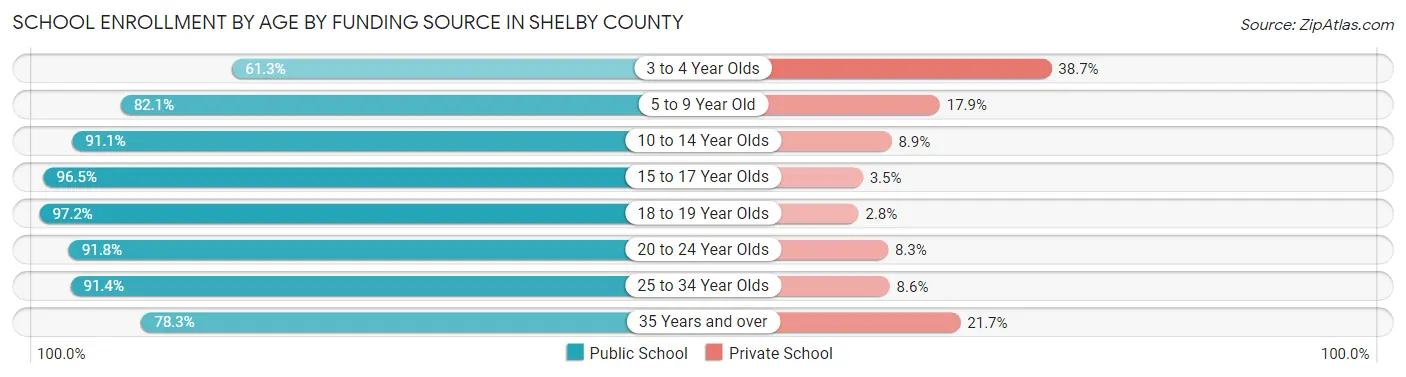
| Age Bracket | Public School | Private School |
| 3 to 4 Year Olds | 122 (61.3%) | 77 (38.7%) |
| 5 to 9 Year Old | 949 (82.1%) | 207 (17.9%) |
| 10 to 14 Year Olds | 1,188 (91.1%) | 116 (8.9%) |
| 15 to 17 Year Olds | 735 (96.5%) | 27 (3.5%) |
| 18 to 19 Year Olds | 316 (97.2%) | 9 (2.8%) |
| 20 to 24 Year Olds | 267 (91.7%) | 24 (8.3%) |
| 25 to 34 Year Olds | 96 (91.4%) | 9 (8.6%) |
| 35 Years and over | 198 (78.3%) | 55 (21.7%) |
| Total | 3,872 (88.1%) | 523 (11.9%) |
Educational Attainment by Field of Study in Shelby County
Education (665 | 23.1%), business (500 | 17.4%), science & technology (358 | 12.4%), arts & humanities (249 | 8.6%), and bio, nature & agricultural (238 | 8.3%) are the most common fields of study among 2,879 individuals in Shelby County who have obtained a bachelor's degree or higher.
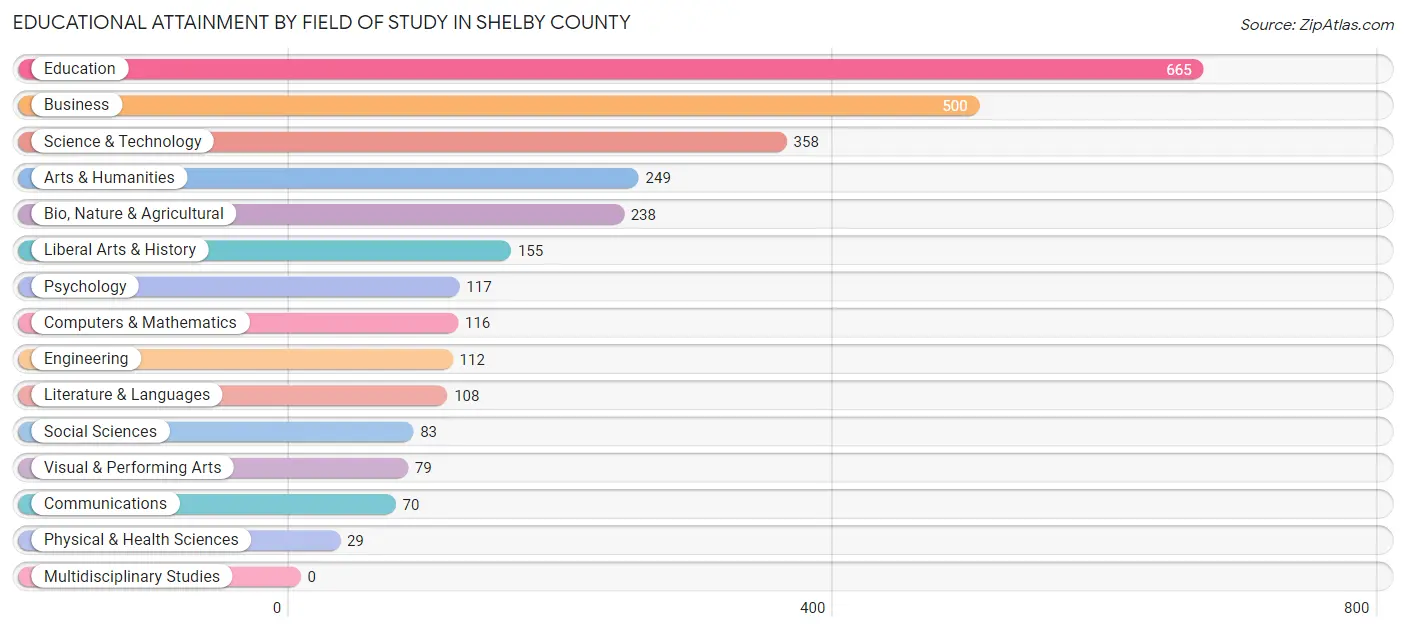
| Field of Study | # Graduates | % Graduates |
| Computers & Mathematics | 116 | 4.0% |
| Bio, Nature & Agricultural | 238 | 8.3% |
| Physical & Health Sciences | 29 | 1.0% |
| Psychology | 117 | 4.1% |
| Social Sciences | 83 | 2.9% |
| Engineering | 112 | 3.9% |
| Multidisciplinary Studies | 0 | 0.0% |
| Science & Technology | 358 | 12.4% |
| Business | 500 | 17.4% |
| Education | 665 | 23.1% |
| Literature & Languages | 108 | 3.7% |
| Liberal Arts & History | 155 | 5.4% |
| Visual & Performing Arts | 79 | 2.7% |
| Communications | 70 | 2.4% |
| Arts & Humanities | 249 | 8.6% |
| Total | 2,879 | 100.0% |
Transportation & Commute in Shelby County
Vehicle Availability by Sex in Shelby County
The most prevalent vehicle ownership categories in Shelby County are males with 2 vehicles (2,350, accounting for 44.4%) and females with 2 vehicles (1,878, making up 49.1%).
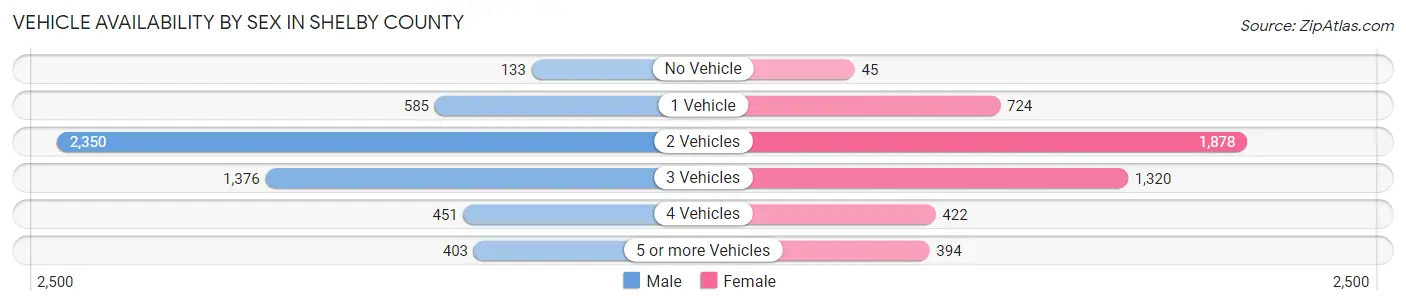
| Vehicles Available | Male | Female |
| No Vehicle | 133 (2.5%) | 45 (0.9%) |
| 1 Vehicle | 585 (11.0%) | 724 (15.1%) |
| 2 Vehicles | 2,350 (44.4%) | 1,878 (39.3%) |
| 3 Vehicles | 1,376 (26.0%) | 1,320 (27.6%) |
| 4 Vehicles | 451 (8.5%) | 422 (8.8%) |
| 5 or more Vehicles | 403 (7.6%) | 394 (8.2%) |
| Total | 5,298 (100.0%) | 4,783 (100.0%) |
Commute Time in Shelby County
The most frequently occuring commute durations in Shelby County are 5 to 9 minutes (1,424 commuters, 14.9%), 10 to 14 minutes (1,385 commuters, 14.5%), and less than 5 minutes (1,148 commuters, 12.0%).
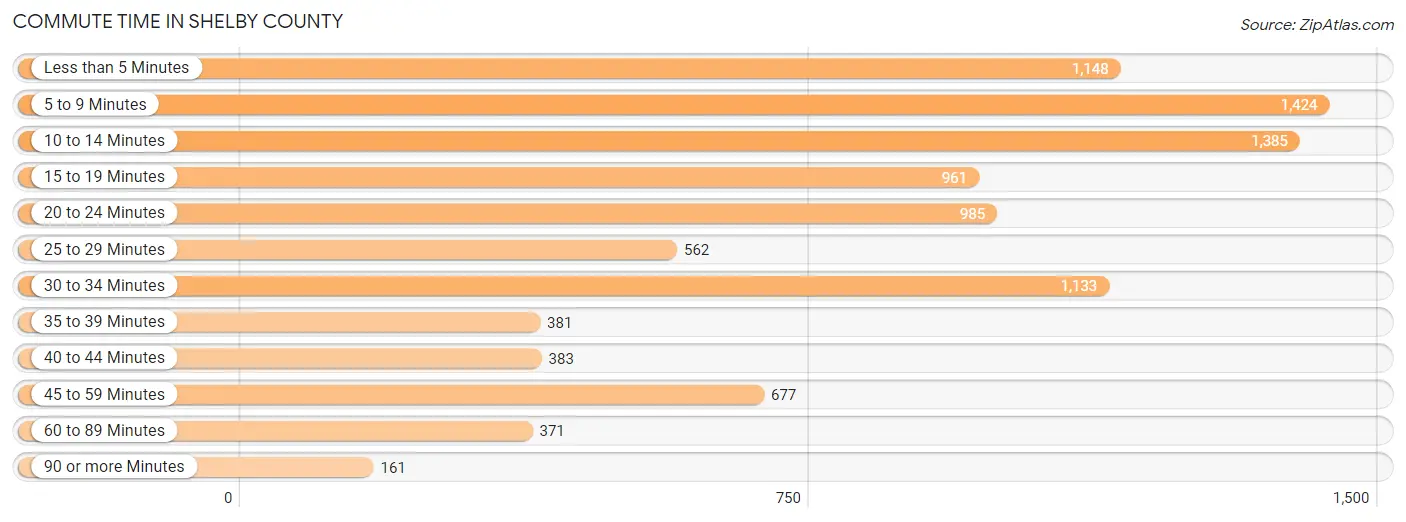
| Commute Time | # Commuters | % Commuters |
| Less than 5 Minutes | 1,148 | 12.0% |
| 5 to 9 Minutes | 1,424 | 14.9% |
| 10 to 14 Minutes | 1,385 | 14.5% |
| 15 to 19 Minutes | 961 | 10.0% |
| 20 to 24 Minutes | 985 | 10.3% |
| 25 to 29 Minutes | 562 | 5.9% |
| 30 to 34 Minutes | 1,133 | 11.8% |
| 35 to 39 Minutes | 381 | 4.0% |
| 40 to 44 Minutes | 383 | 4.0% |
| 45 to 59 Minutes | 677 | 7.1% |
| 60 to 89 Minutes | 371 | 3.9% |
| 90 or more Minutes | 161 | 1.7% |
Commute Time by Sex in Shelby County
The most common commute times in Shelby County are 5 to 9 minutes (703 commuters, 14.0%) for males and 10 to 14 minutes (859 commuters, 18.9%) for females.
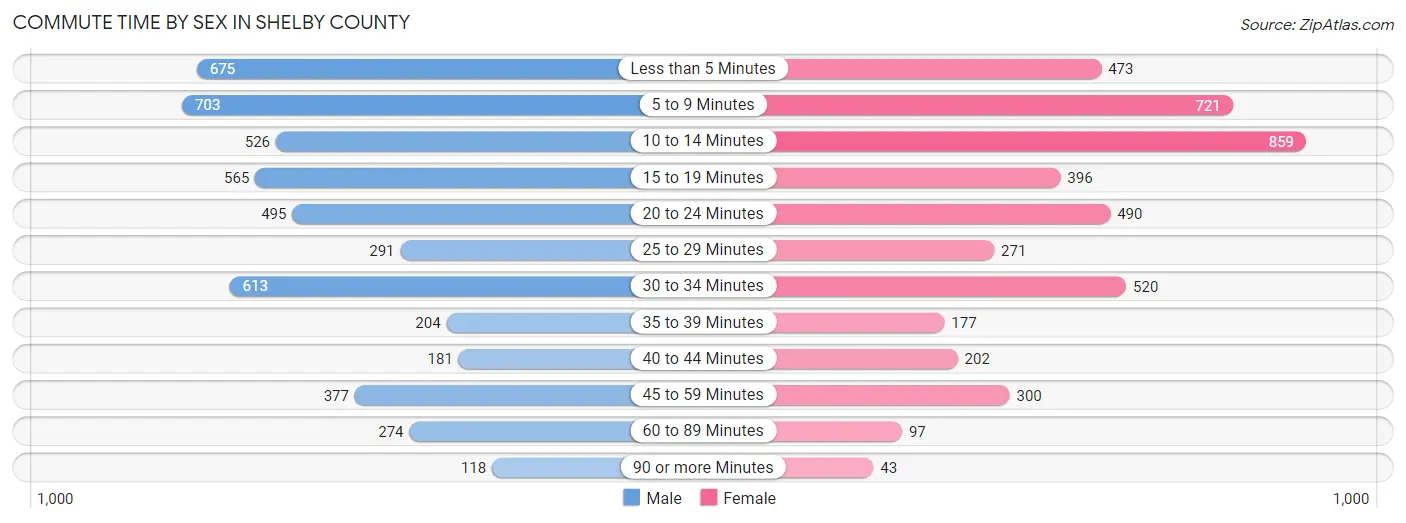
| Commute Time | Male | Female |
| Less than 5 Minutes | 675 (13.4%) | 473 (10.4%) |
| 5 to 9 Minutes | 703 (14.0%) | 721 (15.9%) |
| 10 to 14 Minutes | 526 (10.5%) | 859 (18.9%) |
| 15 to 19 Minutes | 565 (11.3%) | 396 (8.7%) |
| 20 to 24 Minutes | 495 (9.9%) | 490 (10.8%) |
| 25 to 29 Minutes | 291 (5.8%) | 271 (6.0%) |
| 30 to 34 Minutes | 613 (12.2%) | 520 (11.4%) |
| 35 to 39 Minutes | 204 (4.1%) | 177 (3.9%) |
| 40 to 44 Minutes | 181 (3.6%) | 202 (4.4%) |
| 45 to 59 Minutes | 377 (7.5%) | 300 (6.6%) |
| 60 to 89 Minutes | 274 (5.5%) | 97 (2.1%) |
| 90 or more Minutes | 118 (2.4%) | 43 (0.9%) |
Time of Departure to Work by Sex in Shelby County
The most frequent times of departure to work in Shelby County are 6:30 AM to 6:59 AM (742, 14.8%) for males and 7:30 AM to 7:59 AM (791, 17.4%) for females.
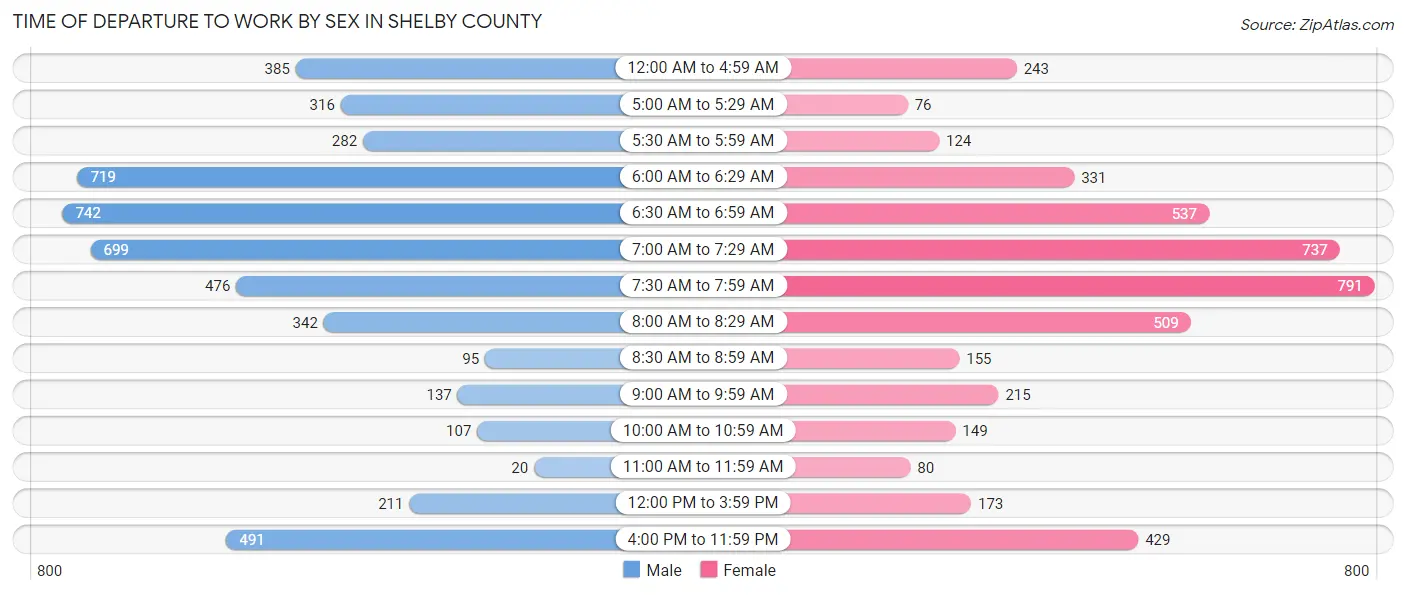
| Time of Departure | Male | Female |
| 12:00 AM to 4:59 AM | 385 (7.7%) | 243 (5.3%) |
| 5:00 AM to 5:29 AM | 316 (6.3%) | 76 (1.7%) |
| 5:30 AM to 5:59 AM | 282 (5.6%) | 124 (2.7%) |
| 6:00 AM to 6:29 AM | 719 (14.3%) | 331 (7.3%) |
| 6:30 AM to 6:59 AM | 742 (14.8%) | 537 (11.8%) |
| 7:00 AM to 7:29 AM | 699 (13.9%) | 737 (16.2%) |
| 7:30 AM to 7:59 AM | 476 (9.5%) | 791 (17.4%) |
| 8:00 AM to 8:29 AM | 342 (6.8%) | 509 (11.2%) |
| 8:30 AM to 8:59 AM | 95 (1.9%) | 155 (3.4%) |
| 9:00 AM to 9:59 AM | 137 (2.7%) | 215 (4.7%) |
| 10:00 AM to 10:59 AM | 107 (2.1%) | 149 (3.3%) |
| 11:00 AM to 11:59 AM | 20 (0.4%) | 80 (1.8%) |
| 12:00 PM to 3:59 PM | 211 (4.2%) | 173 (3.8%) |
| 4:00 PM to 11:59 PM | 491 (9.8%) | 429 (9.4%) |
| Total | 5,022 (100.0%) | 4,549 (100.0%) |
Housing Occupancy in Shelby County
Occupancy by Ownership in Shelby County
Of the total 8,762 dwellings in Shelby County, owner-occupied units account for 6,941 (79.2%), while renter-occupied units make up 1,821 (20.8%).
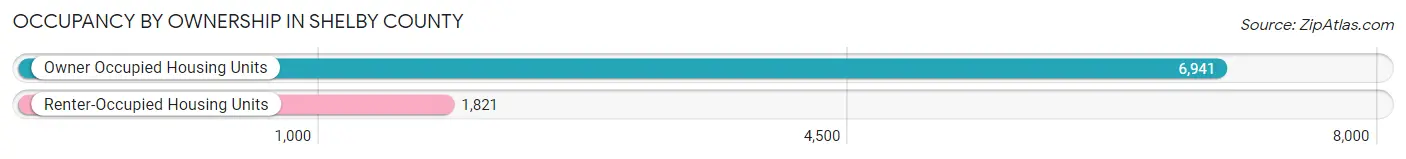
| Occupancy | # Housing Units | % Housing Units |
| Owner Occupied Housing Units | 6,941 | 79.2% |
| Renter-Occupied Housing Units | 1,821 | 20.8% |
| Total Occupied Housing Units | 8,762 | 100.0% |
Occupancy by Household Size in Shelby County
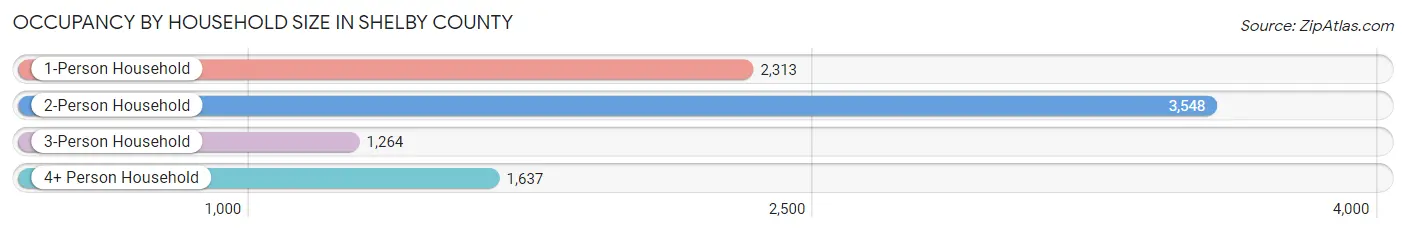
| Household Size | # Housing Units | % Housing Units |
| 1-Person Household | 2,313 | 26.4% |
| 2-Person Household | 3,548 | 40.5% |
| 3-Person Household | 1,264 | 14.4% |
| 4+ Person Household | 1,637 | 18.7% |
| Total Housing Units | 8,762 | 100.0% |
Occupancy by Ownership by Household Size in Shelby County
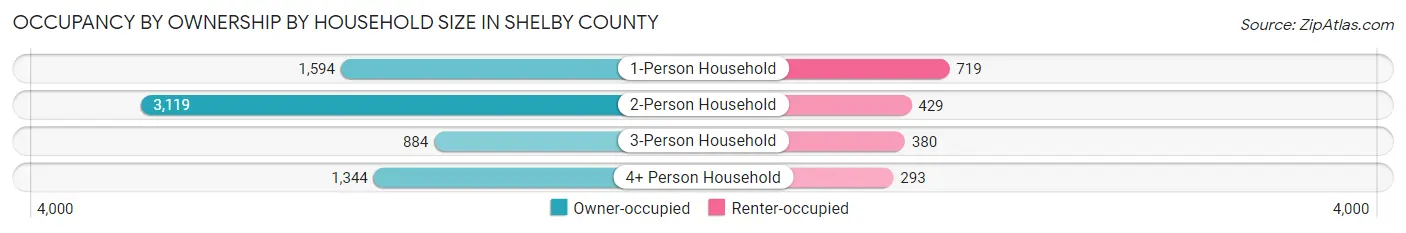
| Household Size | Owner-occupied | Renter-occupied |
| 1-Person Household | 1,594 (68.9%) | 719 (31.1%) |
| 2-Person Household | 3,119 (87.9%) | 429 (12.1%) |
| 3-Person Household | 884 (69.9%) | 380 (30.1%) |
| 4+ Person Household | 1,344 (82.1%) | 293 (17.9%) |
| Total Housing Units | 6,941 (79.2%) | 1,821 (20.8%) |
Occupancy by Educational Attainment in Shelby County
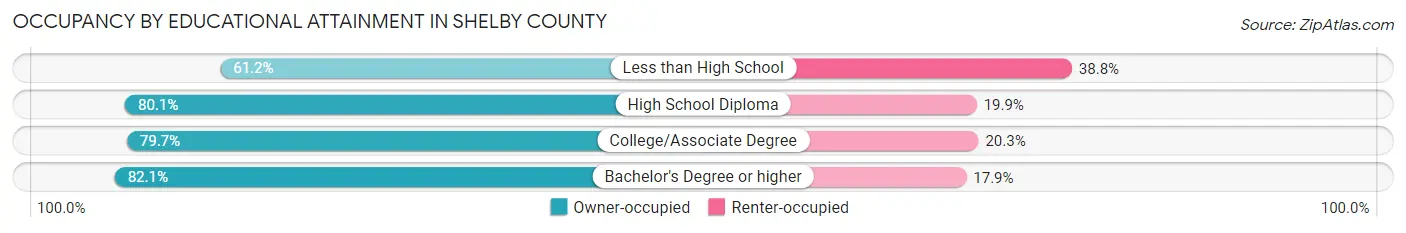
| Household Size | Owner-occupied | Renter-occupied |
| Less than High School | 309 (61.2%) | 196 (38.8%) |
| High School Diploma | 2,683 (80.1%) | 668 (19.9%) |
| College/Associate Degree | 2,658 (79.7%) | 676 (20.3%) |
| Bachelor's Degree or higher | 1,291 (82.1%) | 281 (17.9%) |
Occupancy by Age of Householder in Shelby County
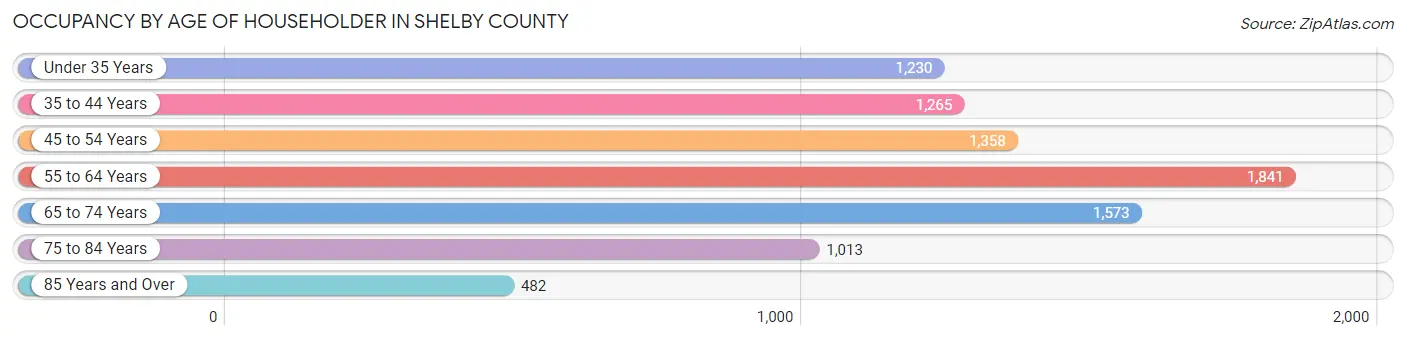
| Age Bracket | # Households | % Households |
| Under 35 Years | 1,230 | 14.0% |
| 35 to 44 Years | 1,265 | 14.4% |
| 45 to 54 Years | 1,358 | 15.5% |
| 55 to 64 Years | 1,841 | 21.0% |
| 65 to 74 Years | 1,573 | 17.9% |
| 75 to 84 Years | 1,013 | 11.6% |
| 85 Years and Over | 482 | 5.5% |
| Total | 8,762 | 100.0% |
Housing Finances in Shelby County
Median Income by Occupancy in Shelby County
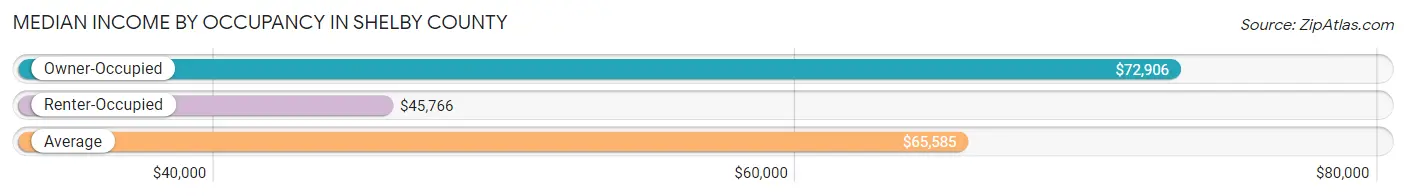
| Occupancy Type | # Households | Median Income |
| Owner-Occupied | 6,941 (79.2%) | $72,906 |
| Renter-Occupied | 1,821 (20.8%) | $45,766 |
| Average | 8,762 (100.0%) | $65,585 |
Occupancy by Householder Income Bracket in Shelby County
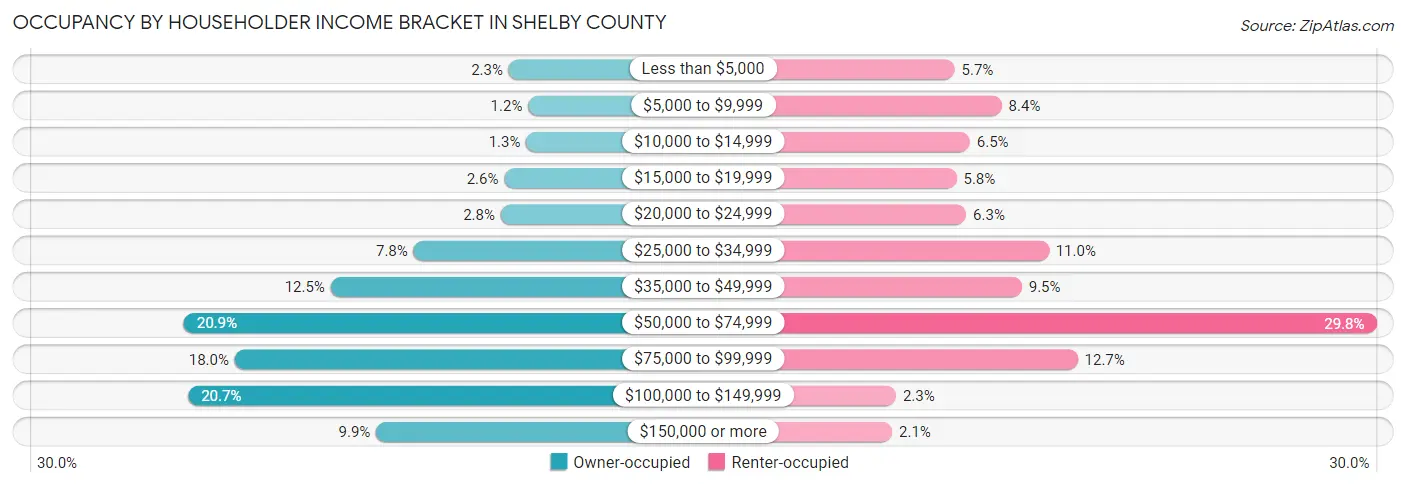
| Income Bracket | Owner-occupied | Renter-occupied |
| Less than $5,000 | 162 (2.3%) | 103 (5.7%) |
| $5,000 to $9,999 | 85 (1.2%) | 152 (8.4%) |
| $10,000 to $14,999 | 92 (1.3%) | 119 (6.5%) |
| $15,000 to $19,999 | 180 (2.6%) | 105 (5.8%) |
| $20,000 to $24,999 | 194 (2.8%) | 115 (6.3%) |
| $25,000 to $34,999 | 539 (7.8%) | 201 (11.0%) |
| $35,000 to $49,999 | 868 (12.5%) | 173 (9.5%) |
| $50,000 to $74,999 | 1,451 (20.9%) | 542 (29.8%) |
| $75,000 to $99,999 | 1,249 (18.0%) | 231 (12.7%) |
| $100,000 to $149,999 | 1,433 (20.6%) | 42 (2.3%) |
| $150,000 or more | 688 (9.9%) | 38 (2.1%) |
| Total | 6,941 (100.0%) | 1,821 (100.0%) |
Monthly Housing Cost Tiers in Shelby County
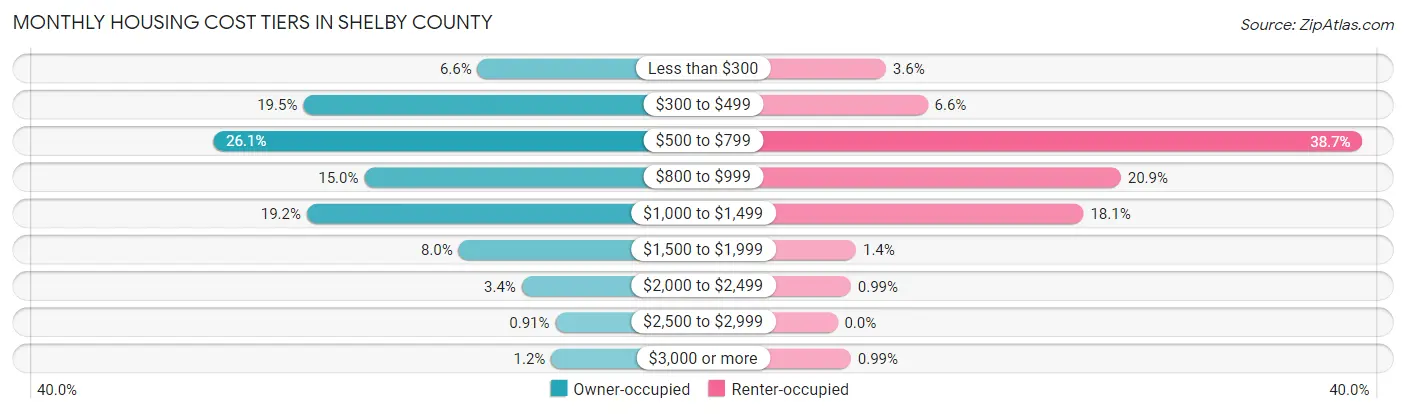
| Monthly Cost | Owner-occupied | Renter-occupied |
| Less than $300 | 461 (6.6%) | 65 (3.6%) |
| $300 to $499 | 1,352 (19.5%) | 121 (6.6%) |
| $500 to $799 | 1,813 (26.1%) | 704 (38.7%) |
| $800 to $999 | 1,040 (15.0%) | 380 (20.9%) |
| $1,000 to $1,499 | 1,334 (19.2%) | 330 (18.1%) |
| $1,500 to $1,999 | 558 (8.0%) | 25 (1.4%) |
| $2,000 to $2,499 | 235 (3.4%) | 18 (1.0%) |
| $2,500 to $2,999 | 63 (0.9%) | 0 (0.0%) |
| $3,000 or more | 85 (1.2%) | 18 (1.0%) |
| Total | 6,941 (100.0%) | 1,821 (100.0%) |
Physical Housing Characteristics in Shelby County
Housing Structures in Shelby County
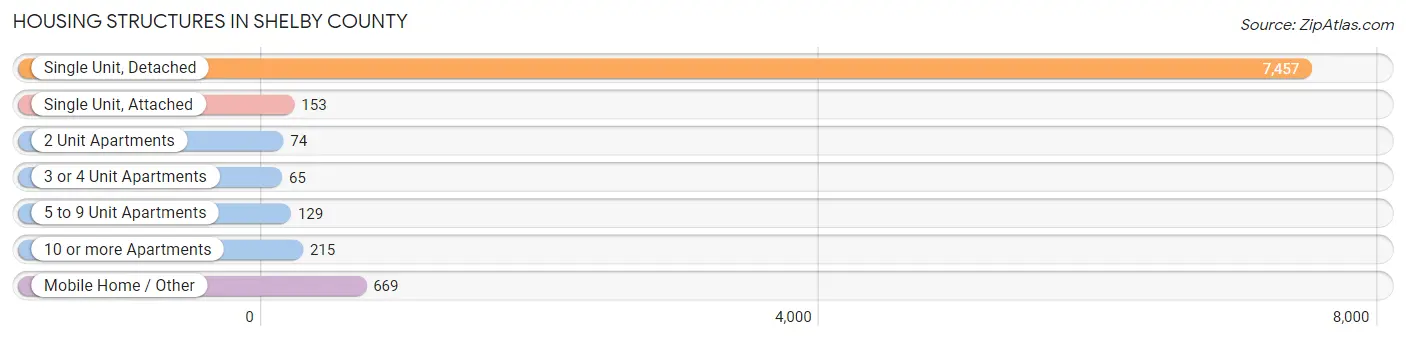
| Structure Type | # Housing Units | % Housing Units |
| Single Unit, Detached | 7,457 | 85.1% |
| Single Unit, Attached | 153 | 1.8% |
| 2 Unit Apartments | 74 | 0.8% |
| 3 or 4 Unit Apartments | 65 | 0.7% |
| 5 to 9 Unit Apartments | 129 | 1.5% |
| 10 or more Apartments | 215 | 2.5% |
| Mobile Home / Other | 669 | 7.6% |
| Total | 8,762 | 100.0% |
Housing Structures by Occupancy in Shelby County
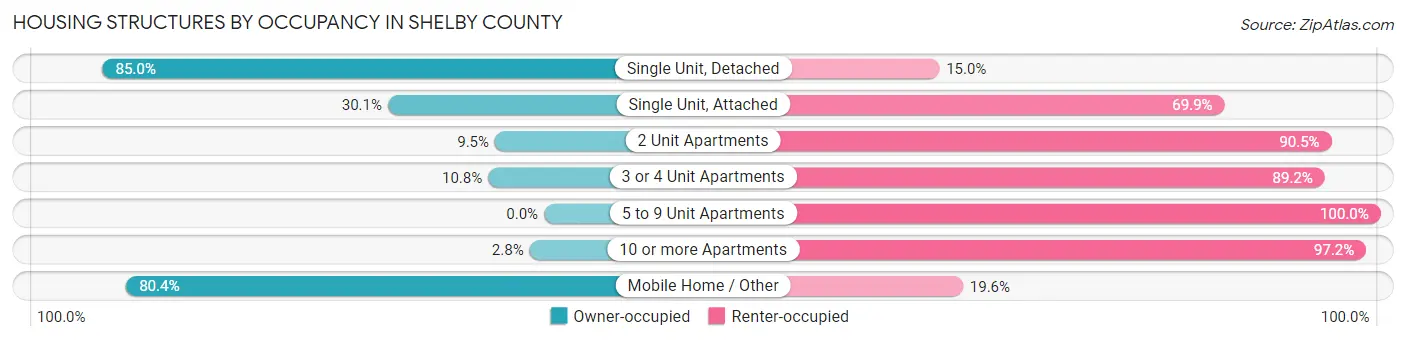
| Structure Type | Owner-occupied | Renter-occupied |
| Single Unit, Detached | 6,337 (85.0%) | 1,120 (15.0%) |
| Single Unit, Attached | 46 (30.1%) | 107 (69.9%) |
| 2 Unit Apartments | 7 (9.5%) | 67 (90.5%) |
| 3 or 4 Unit Apartments | 7 (10.8%) | 58 (89.2%) |
| 5 to 9 Unit Apartments | 0 (0.0%) | 129 (100.0%) |
| 10 or more Apartments | 6 (2.8%) | 209 (97.2%) |
| Mobile Home / Other | 538 (80.4%) | 131 (19.6%) |
| Total | 6,941 (79.2%) | 1,821 (20.8%) |
Housing Structures by Number of Rooms in Shelby County
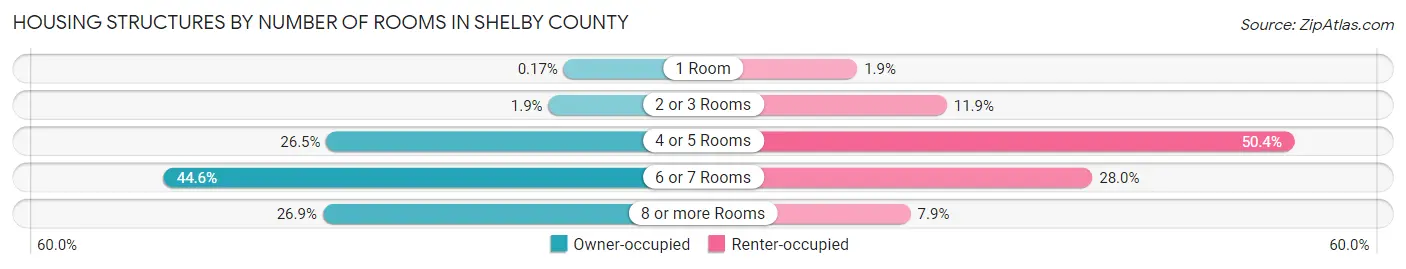
| Number of Rooms | Owner-occupied | Renter-occupied |
| 1 Room | 12 (0.2%) | 35 (1.9%) |
| 2 or 3 Rooms | 129 (1.9%) | 216 (11.9%) |
| 4 or 5 Rooms | 1,840 (26.5%) | 917 (50.4%) |
| 6 or 7 Rooms | 3,092 (44.6%) | 510 (28.0%) |
| 8 or more Rooms | 1,868 (26.9%) | 143 (7.9%) |
| Total | 6,941 (100.0%) | 1,821 (100.0%) |
Housing Structure by Heating Type in Shelby County
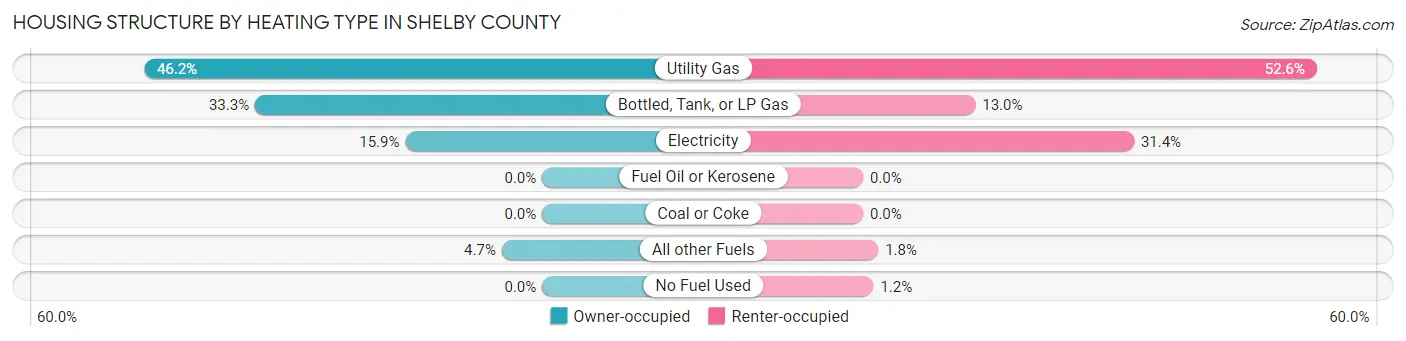
| Heating Type | Owner-occupied | Renter-occupied |
| Utility Gas | 3,204 (46.2%) | 958 (52.6%) |
| Bottled, Tank, or LP Gas | 2,311 (33.3%) | 237 (13.0%) |
| Electricity | 1,101 (15.9%) | 572 (31.4%) |
| Fuel Oil or Kerosene | 0 (0.0%) | 0 (0.0%) |
| Coal or Coke | 0 (0.0%) | 0 (0.0%) |
| All other Fuels | 325 (4.7%) | 32 (1.8%) |
| No Fuel Used | 0 (0.0%) | 22 (1.2%) |
| Total | 6,941 (100.0%) | 1,821 (100.0%) |
Household Vehicle Usage in Shelby County
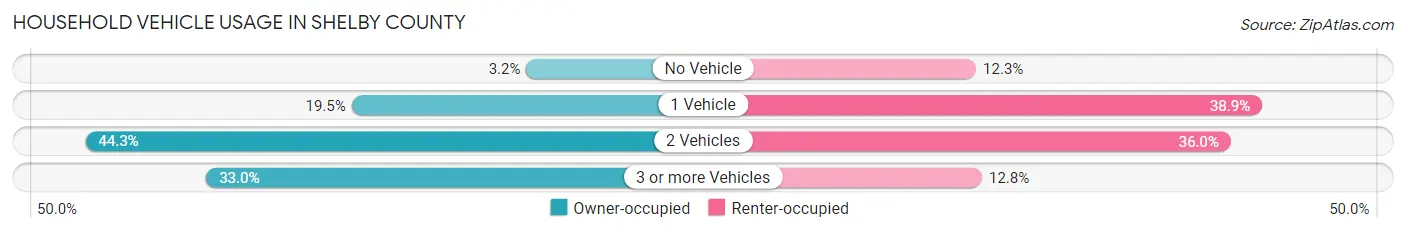
| Vehicles per Household | Owner-occupied | Renter-occupied |
| No Vehicle | 220 (3.2%) | 223 (12.2%) |
| 1 Vehicle | 1,352 (19.5%) | 709 (38.9%) |
| 2 Vehicles | 3,076 (44.3%) | 656 (36.0%) |
| 3 or more Vehicles | 2,293 (33.0%) | 233 (12.8%) |
| Total | 6,941 (100.0%) | 1,821 (100.0%) |
Real Estate & Mortgages in Shelby County
Real Estate and Mortgage Overview in Shelby County
| Characteristic | Without Mortgage | With Mortgage |
| Housing Units | 3,704 | 3,237 |
| Median Property Value | $120,000 | $130,700 |
| Median Household Income | $63,103 | $416 |
| Monthly Housing Costs | $521 | $61 |
| Real Estate Taxes | $1,884 | $59 |
Property Value by Mortgage Status in Shelby County
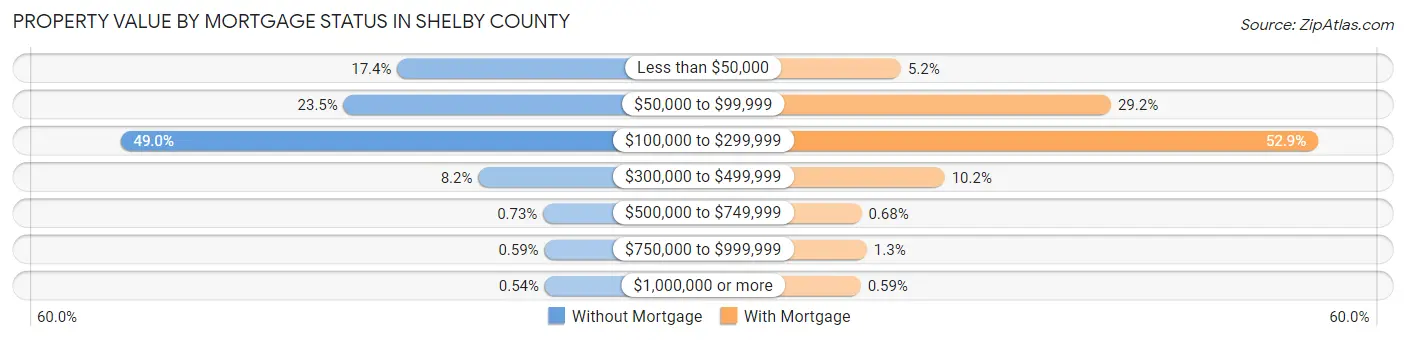
| Property Value | Without Mortgage | With Mortgage |
| Less than $50,000 | 645 (17.4%) | 168 (5.2%) |
| $50,000 to $99,999 | 872 (23.5%) | 945 (29.2%) |
| $100,000 to $299,999 | 1,816 (49.0%) | 1,711 (52.9%) |
| $300,000 to $499,999 | 302 (8.2%) | 330 (10.2%) |
| $500,000 to $749,999 | 27 (0.7%) | 22 (0.7%) |
| $750,000 to $999,999 | 22 (0.6%) | 42 (1.3%) |
| $1,000,000 or more | 20 (0.5%) | 19 (0.6%) |
| Total | 3,704 (100.0%) | 3,237 (100.0%) |
Household Income by Mortgage Status in Shelby County
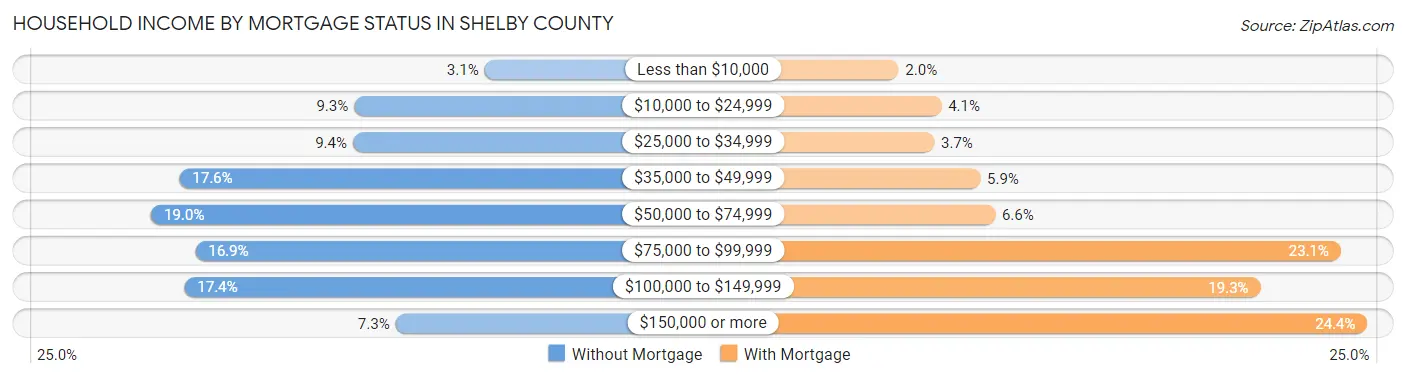
| Household Income | Without Mortgage | With Mortgage |
| Less than $10,000 | 115 (3.1%) | 66 (2.0%) |
| $10,000 to $24,999 | 345 (9.3%) | 132 (4.1%) |
| $25,000 to $34,999 | 347 (9.4%) | 121 (3.7%) |
| $35,000 to $49,999 | 653 (17.6%) | 192 (5.9%) |
| $50,000 to $74,999 | 703 (19.0%) | 215 (6.6%) |
| $75,000 to $99,999 | 625 (16.9%) | 748 (23.1%) |
| $100,000 to $149,999 | 644 (17.4%) | 624 (19.3%) |
| $150,000 or more | 272 (7.3%) | 789 (24.4%) |
| Total | 3,704 (100.0%) | 3,237 (100.0%) |
Property Value to Household Income Ratio in Shelby County
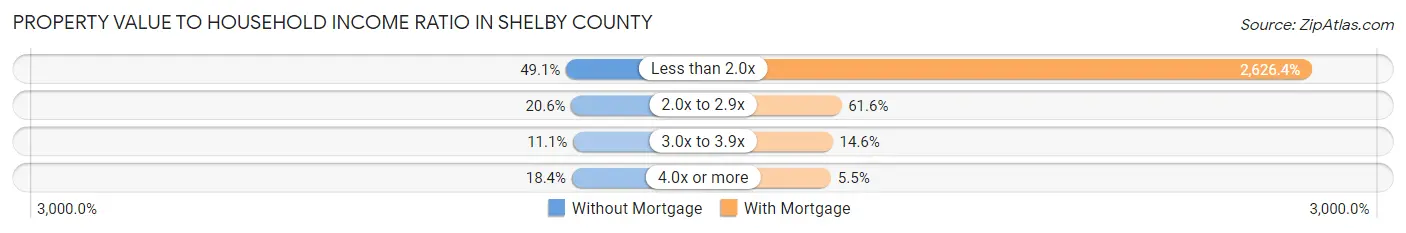
| Value-to-Income Ratio | Without Mortgage | With Mortgage |
| Less than 2.0x | 1,820 (49.1%) | 85,018 (2,626.4%) |
| 2.0x to 2.9x | 763 (20.6%) | 1,995 (61.6%) |
| 3.0x to 3.9x | 412 (11.1%) | 473 (14.6%) |
| 4.0x or more | 680 (18.4%) | 179 (5.5%) |
| Total | 3,704 (100.0%) | 3,237 (100.0%) |
Real Estate Taxes by Mortgage Status in Shelby County
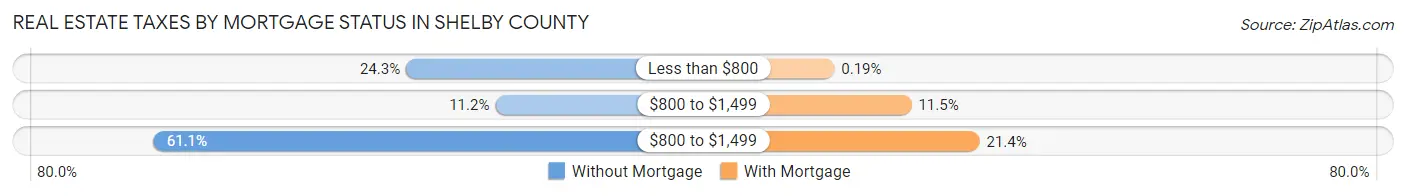
| Property Taxes | Without Mortgage | With Mortgage |
| Less than $800 | 899 (24.3%) | 6 (0.2%) |
| $800 to $1,499 | 416 (11.2%) | 371 (11.5%) |
| $800 to $1,499 | 2,264 (61.1%) | 693 (21.4%) |
| Total | 3,704 (100.0%) | 3,237 (100.0%) |
Health & Disability in Shelby County
Health Insurance Coverage by Age in Shelby County
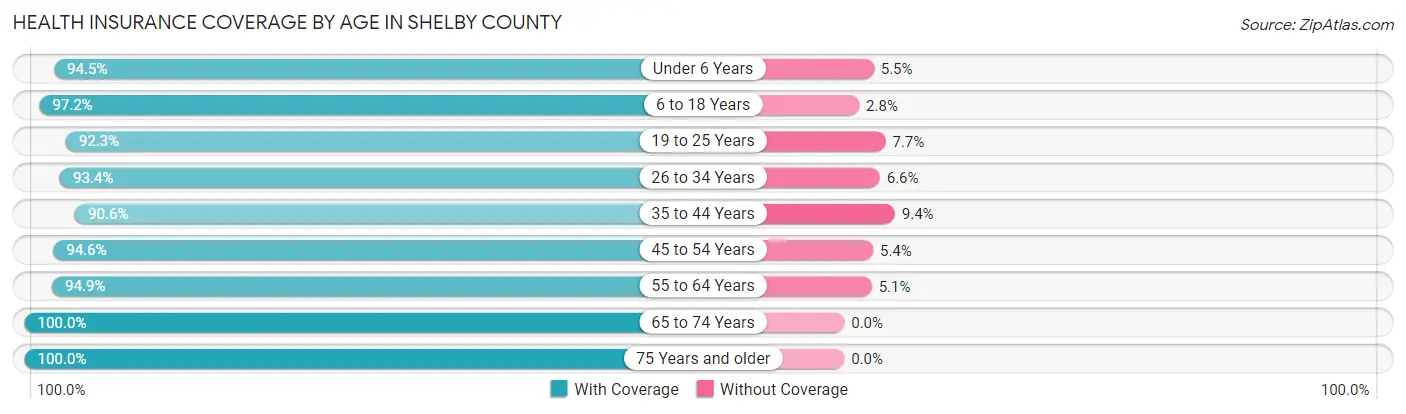
| Age Bracket | With Coverage | Without Coverage |
| Under 6 Years | 1,254 (94.5%) | 73 (5.5%) |
| 6 to 18 Years | 3,369 (97.2%) | 96 (2.8%) |
| 19 to 25 Years | 1,344 (92.3%) | 112 (7.7%) |
| 26 to 34 Years | 1,776 (93.4%) | 126 (6.6%) |
| 35 to 44 Years | 2,151 (90.6%) | 224 (9.4%) |
| 45 to 54 Years | 2,386 (94.6%) | 135 (5.4%) |
| 55 to 64 Years | 2,965 (94.9%) | 160 (5.1%) |
| 65 to 74 Years | 2,700 (100.0%) | 0 (0.0%) |
| 75 Years and older | 1,988 (100.0%) | 0 (0.0%) |
| Total | 19,933 (95.6%) | 926 (4.4%) |
Health Insurance Coverage by Citizenship Status in Shelby County
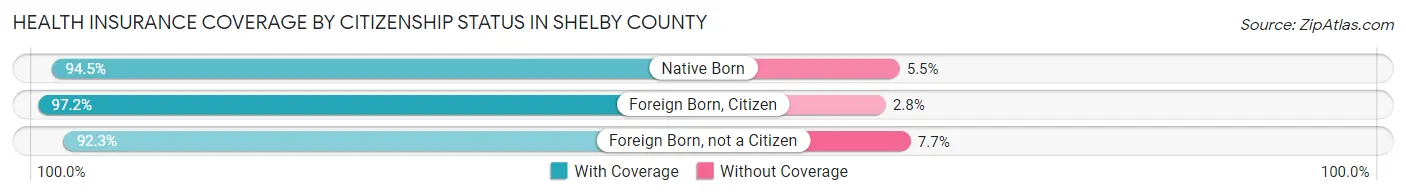
| Citizenship Status | With Coverage | Without Coverage |
| Native Born | 1,254 (94.5%) | 73 (5.5%) |
| Foreign Born, Citizen | 3,369 (97.2%) | 96 (2.8%) |
| Foreign Born, not a Citizen | 1,344 (92.3%) | 112 (7.7%) |
Health Insurance Coverage by Household Income in Shelby County

| Household Income | With Coverage | Without Coverage |
| Under $25,000 | 2,060 (96.4%) | 76 (3.6%) |
| $25,000 to $49,999 | 3,389 (94.4%) | 200 (5.6%) |
| $50,000 to $74,999 | 4,184 (93.3%) | 299 (6.7%) |
| $75,000 to $99,999 | 3,733 (95.5%) | 175 (4.5%) |
| $100,000 and over | 6,533 (97.4%) | 176 (2.6%) |
Public vs Private Health Insurance Coverage by Age in Shelby County
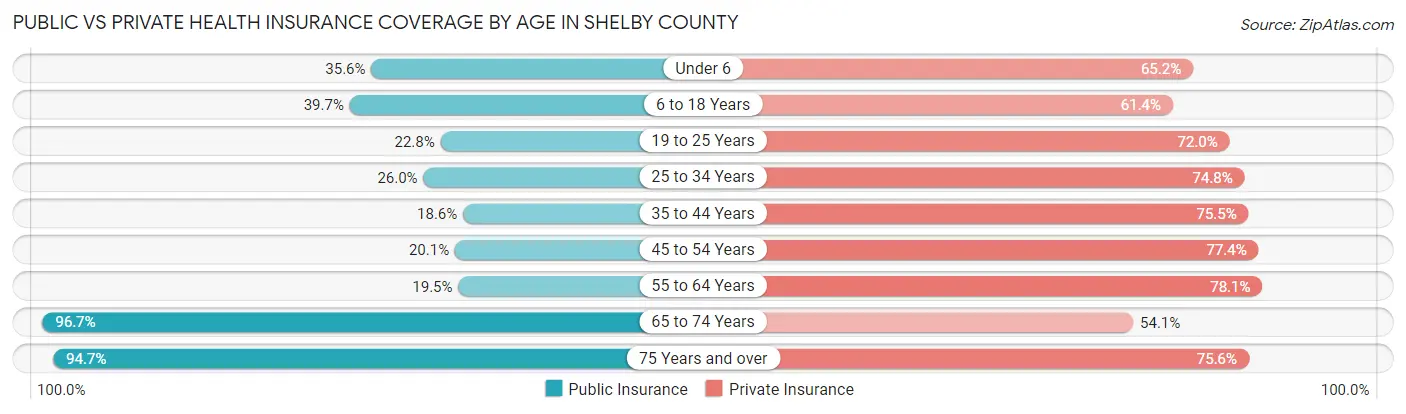
| Age Bracket | Public Insurance | Private Insurance |
| Under 6 | 473 (35.6%) | 865 (65.2%) |
| 6 to 18 Years | 1,374 (39.7%) | 2,129 (61.4%) |
| 19 to 25 Years | 332 (22.8%) | 1,048 (72.0%) |
| 25 to 34 Years | 494 (26.0%) | 1,422 (74.8%) |
| 35 to 44 Years | 442 (18.6%) | 1,793 (75.5%) |
| 45 to 54 Years | 507 (20.1%) | 1,950 (77.3%) |
| 55 to 64 Years | 609 (19.5%) | 2,439 (78.0%) |
| 65 to 74 Years | 2,611 (96.7%) | 1,460 (54.1%) |
| 75 Years and over | 1,883 (94.7%) | 1,502 (75.5%) |
| Total | 8,725 (41.8%) | 14,608 (70.0%) |
Disability Status by Sex by Age in Shelby County
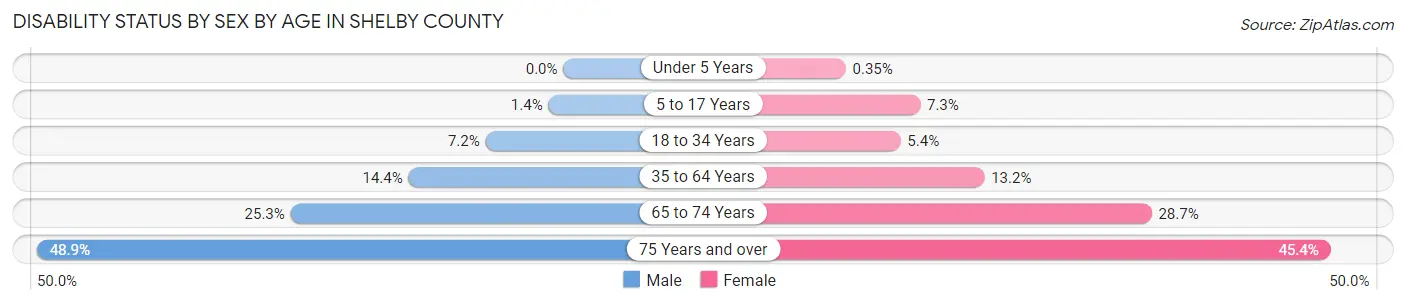
| Age Bracket | Male | Female |
| Under 5 Years | 0 (0.0%) | 2 (0.4%) |
| 5 to 17 Years | 24 (1.4%) | 121 (7.3%) |
| 18 to 34 Years | 131 (7.2%) | 98 (5.4%) |
| 35 to 64 Years | 584 (14.4%) | 523 (13.2%) |
| 65 to 74 Years | 331 (25.3%) | 400 (28.7%) |
| 75 Years and over | 433 (48.9%) | 500 (45.4%) |
Disability Class by Sex by Age in Shelby County
Disability Class: Hearing Difficulty
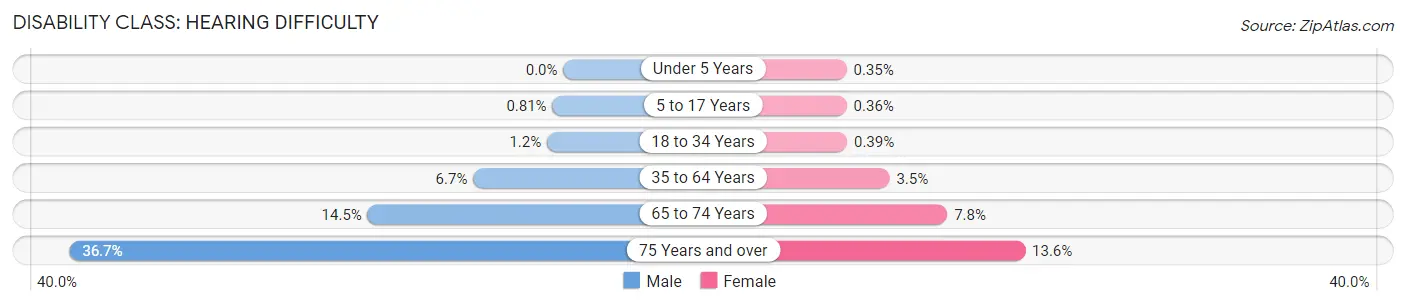
| Age Bracket | Male | Female |
| Under 5 Years | 0 (0.0%) | 2 (0.4%) |
| 5 to 17 Years | 14 (0.8%) | 6 (0.4%) |
| 18 to 34 Years | 22 (1.2%) | 7 (0.4%) |
| 35 to 64 Years | 272 (6.7%) | 140 (3.5%) |
| 65 to 74 Years | 190 (14.5%) | 109 (7.8%) |
| 75 Years and over | 325 (36.7%) | 150 (13.6%) |
Disability Class: Vision Difficulty
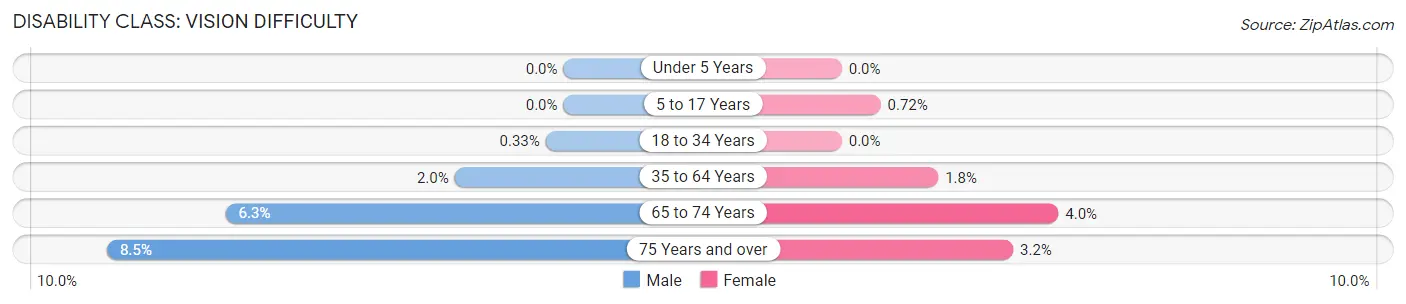
| Age Bracket | Male | Female |
| Under 5 Years | 0 (0.0%) | 0 (0.0%) |
| 5 to 17 Years | 0 (0.0%) | 12 (0.7%) |
| 18 to 34 Years | 6 (0.3%) | 0 (0.0%) |
| 35 to 64 Years | 82 (2.0%) | 71 (1.8%) |
| 65 to 74 Years | 82 (6.3%) | 56 (4.0%) |
| 75 Years and over | 75 (8.5%) | 35 (3.2%) |
Disability Class: Cognitive Difficulty

| Age Bracket | Male | Female |
| 5 to 17 Years | 10 (0.6%) | 72 (4.3%) |
| 18 to 34 Years | 97 (5.3%) | 74 (4.1%) |
| 35 to 64 Years | 178 (4.4%) | 154 (3.9%) |
| 65 to 74 Years | 62 (4.7%) | 38 (2.7%) |
| 75 Years and over | 53 (6.0%) | 60 (5.4%) |
Disability Class: Ambulatory Difficulty

| Age Bracket | Male | Female |
| 5 to 17 Years | 4 (0.2%) | 0 (0.0%) |
| 18 to 34 Years | 27 (1.5%) | 27 (1.5%) |
| 35 to 64 Years | 266 (6.6%) | 255 (6.4%) |
| 65 to 74 Years | 141 (10.8%) | 332 (23.8%) |
| 75 Years and over | 173 (19.5%) | 366 (33.2%) |
Disability Class: Self-Care Difficulty
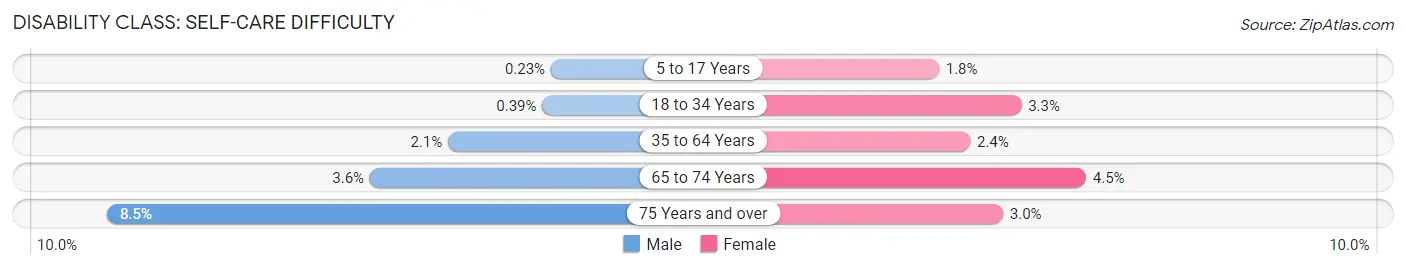
| Age Bracket | Male | Female |
| 5 to 17 Years | 4 (0.2%) | 30 (1.8%) |
| 18 to 34 Years | 7 (0.4%) | 60 (3.3%) |
| 35 to 64 Years | 87 (2.1%) | 94 (2.4%) |
| 65 to 74 Years | 47 (3.6%) | 63 (4.5%) |
| 75 Years and over | 75 (8.5%) | 33 (3.0%) |
Technology Access in Shelby County
Computing Device Access in Shelby County
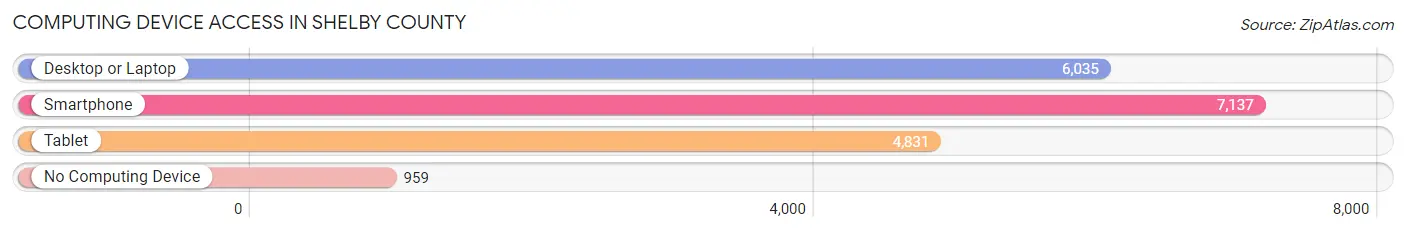
| Device Type | # Households | % Households |
| Desktop or Laptop | 6,035 | 68.9% |
| Smartphone | 7,137 | 81.5% |
| Tablet | 4,831 | 55.1% |
| No Computing Device | 959 | 10.9% |
| Total | 8,762 | 100.0% |
Internet Access in Shelby County
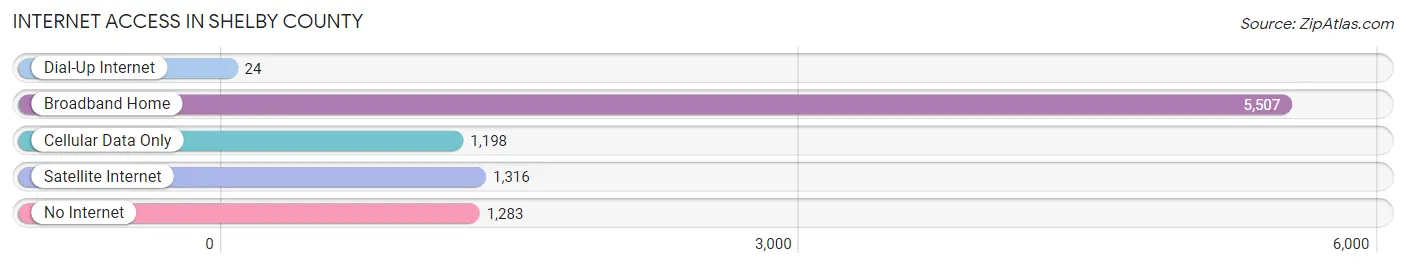
| Internet Type | # Households | % Households |
| Dial-Up Internet | 24 | 0.3% |
| Broadband Home | 5,507 | 62.8% |
| Cellular Data Only | 1,198 | 13.7% |
| Satellite Internet | 1,316 | 15.0% |
| No Internet | 1,283 | 14.6% |
| Total | 8,762 | 100.0% |
Shelby County Summary
Shelby County is located in the central part of the state of Illinois, in the United States. It is bordered by Effingham County to the north, Fayette County to the east, Christian County to the south, and Macon County to the west. The county seat is Shelbyville, and the largest city is Windsor. The county was established in 1827 and named after Isaac Shelby, the first governor of Kentucky.
Geography
Shelby County covers an area of 576 square miles, of which 574 square miles is land and 2 square miles is water. The county is located in the Central Till Plains region of Illinois, and is mostly flat with some rolling hills. The Kaskaskia River flows through the county, and there are several small lakes and ponds. The highest point in the county is located in the northwest corner, at an elevation of 830 feet.
The climate of Shelby County is humid continental, with hot, humid summers and cold, dry winters. The average annual temperature is around 54°F, and the average annual precipitation is around 40 inches.
Demographics
As of the 2010 United States Census, there were 22,363 people, 8,845 households, and 6,093 families living in Shelby County. The population density was 39.1 people per square mile. The racial makeup of the county was 97.3% White, 0.7% Black or African American, 0.2% Native American, 0.2% Asian, 0.2% from other races, and 1.4% from two or more races. Hispanic or Latino of any race were 1.2% of the population.
The median income for a household in Shelby County was $45,945, and the median income for a family was $54,945. The per capita income for the county was $21,945. About 8.7% of families and 11.2% of the population were below the poverty line, including 15.2% of those under age 18 and 8.2% of those age 65 or over.
Economy
Shelby County has a diverse economy, with a mix of agriculture, manufacturing, and services. The county is home to several large employers, including the Shelbyville-based agricultural equipment manufacturer AGCO, the Windsor-based automotive parts manufacturer Autoliv, and the Shelbyville-based food processing company Tyson Foods.
Agriculture is a major part of the Shelby County economy, with corn, soybeans, and wheat being the main crops. Livestock production is also important, with beef cattle, dairy cattle, and hogs being the main animals raised.
Manufacturing is also an important part of the Shelby County economy, with the automotive, food processing, and agricultural equipment industries being the main employers.
The service sector is also an important part of the Shelby County economy, with healthcare, education, and retail being the main employers.
History
Shelby County was first settled in the early 1800s, and was officially established in 1827. The county was named after Isaac Shelby, the first governor of Kentucky.
The county was largely agricultural in the early years, with corn, wheat, and livestock being the main crops. In the late 1800s, the railroad came to the county, bringing with it new industry and economic growth.
In the early 1900s, the county saw a population boom, as people moved to the area for the new jobs and opportunities. The county continued to grow and develop throughout the 20th century, and today it is a thriving and diverse economy.
Common Questions
What is the Total Population of Shelby County?
Total Population of Shelby County is 21,042.
What is the Total Male Population of Shelby County?
Total Male Population of Shelby County is 10,434.
What is the Total Female Population of Shelby County?
Total Female Population of Shelby County is 10,608.
What is the Ratio of Males per 100 Females in Shelby County?
There are 98.36 Males per 100 Females in Shelby County.
What is the Ratio of Females per 100 Males in Shelby County?
There are 101.67 Females per 100 Males in Shelby County.
What is the Median Population Age in Shelby County?
Median Population Age in Shelby County is 44.9 Years.
What is the Average Family Size in Shelby County
Average Family Size in Shelby County is 2.9 People.
What is the Average Household Size in Shelby County
Average Household Size in Shelby County is 2.4 People.
What is Per Capita Income in Shelby County?
Per Capita income in Shelby County is $32,085.
What is the Median Family Income in Shelby County?
Median Family Income in Shelby County is $78,188.
What is the Median Household income in Shelby County?
Median Household Income in Shelby County is $65,585.
What is Income or Wage Gap in Shelby County?
Income or Wage Gap in Shelby County is 32.1%.
Women in Shelby County earn 67.9 cents for every dollar earned by a man.
What is Family Income Deficit in Shelby County?
Family Income Deficit in Shelby County is $8,804.
Families that are below poverty line in Shelby County earn $8,804 less on average than the poverty threshold level.
What is Inequality or Gini Index in Shelby County?
Inequality or Gini Index in Shelby County is 0.39.
How Large is the Labor Force in Shelby County?
There are 10,631 People in the Labor Forcein in Shelby County.
What is the Percentage of People in the Labor Force in Shelby County?
62.3% of People are in the Labor Force in Shelby County.
What is the Unemployment Rate in Shelby County?
Unemployment Rate in Shelby County is 4.0%.