Sangamon County, IL
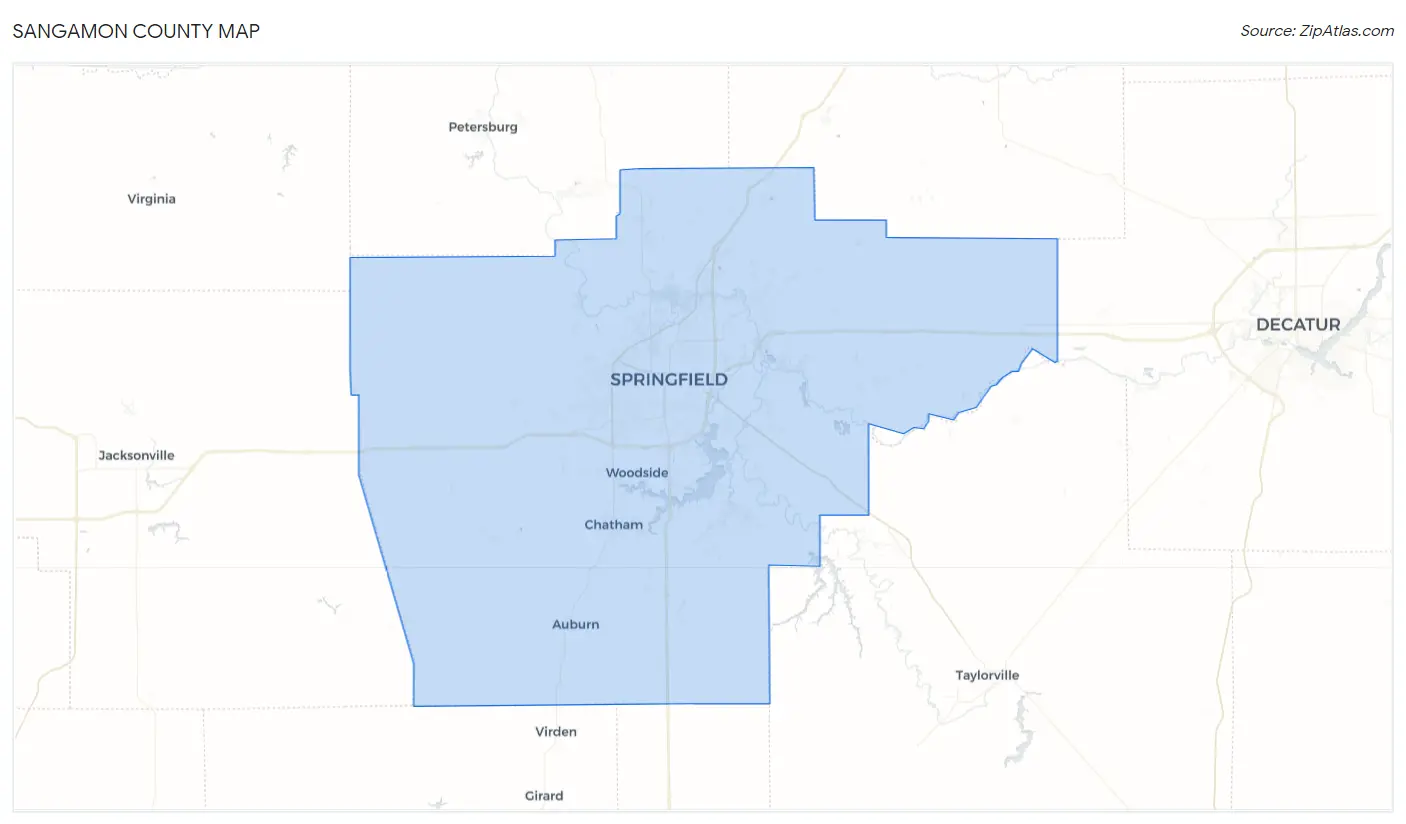
Sangamon County Map
Sangamon County Overview
196,122
TOTAL POPULATION
94,848
MALE POPULATION
101,274
FEMALE POPULATION
93.65
MALES / 100 FEMALES
106.78
FEMALES / 100 MALES
40.6
MEDIAN AGE
3.0
AVG FAMILY SIZE
2.3
AVG HOUSEHOLD SIZE
$41,387
PER CAPITA INCOME
$96,427
AVG FAMILY INCOME
$71,653
AVG HOUSEHOLD INCOME
23.9%
WAGE / INCOME GAP [ % ]
76.1¢/ $1
WAGE / INCOME GAP [ $ ]
$11,132
FAMILY INCOME DEFICIT
0.46
INEQUALITY / GINI INDEX
98,156
LABOR FORCE [ PEOPLE ]
62.1%
PERCENT IN LABOR FORCE
5.2%
UNEMPLOYMENT RATE
Sangamon County Area Codes
Race in Sangamon County
The most populous races in Sangamon County are White / Caucasian (156,663 | 79.9%), Black / African American (24,902 | 12.7%), and Two or more Races (9,022 | 4.6%).
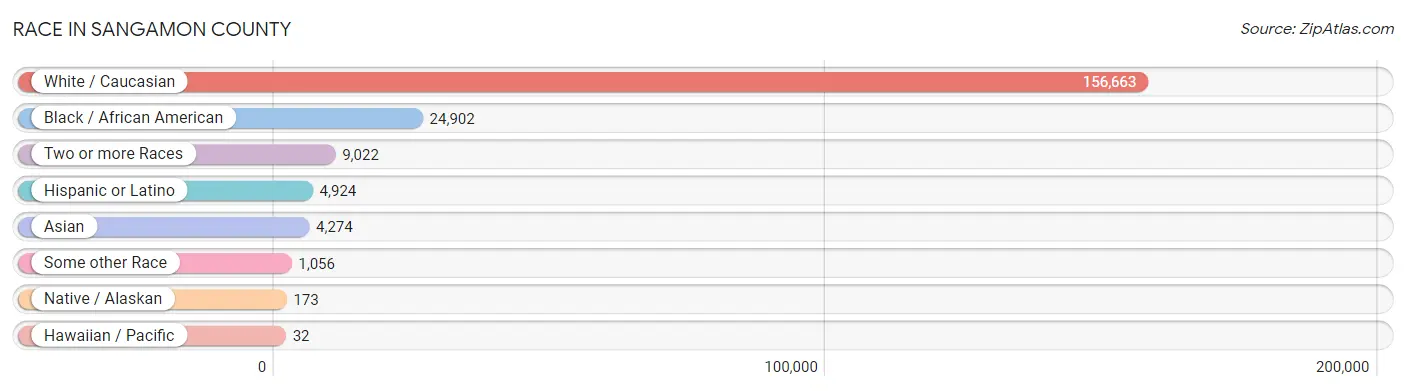
| Race | # Population | % Population |
| Asian | 4,274 | 2.2% |
| Black / African American | 24,902 | 12.7% |
| Hawaiian / Pacific | 32 | 0.0% |
| Hispanic or Latino | 4,924 | 2.5% |
| Native / Alaskan | 173 | 0.1% |
| White / Caucasian | 156,663 | 79.9% |
| Two or more Races | 9,022 | 4.6% |
| Some other Race | 1,056 | 0.5% |
| Total | 196,122 | 100.0% |
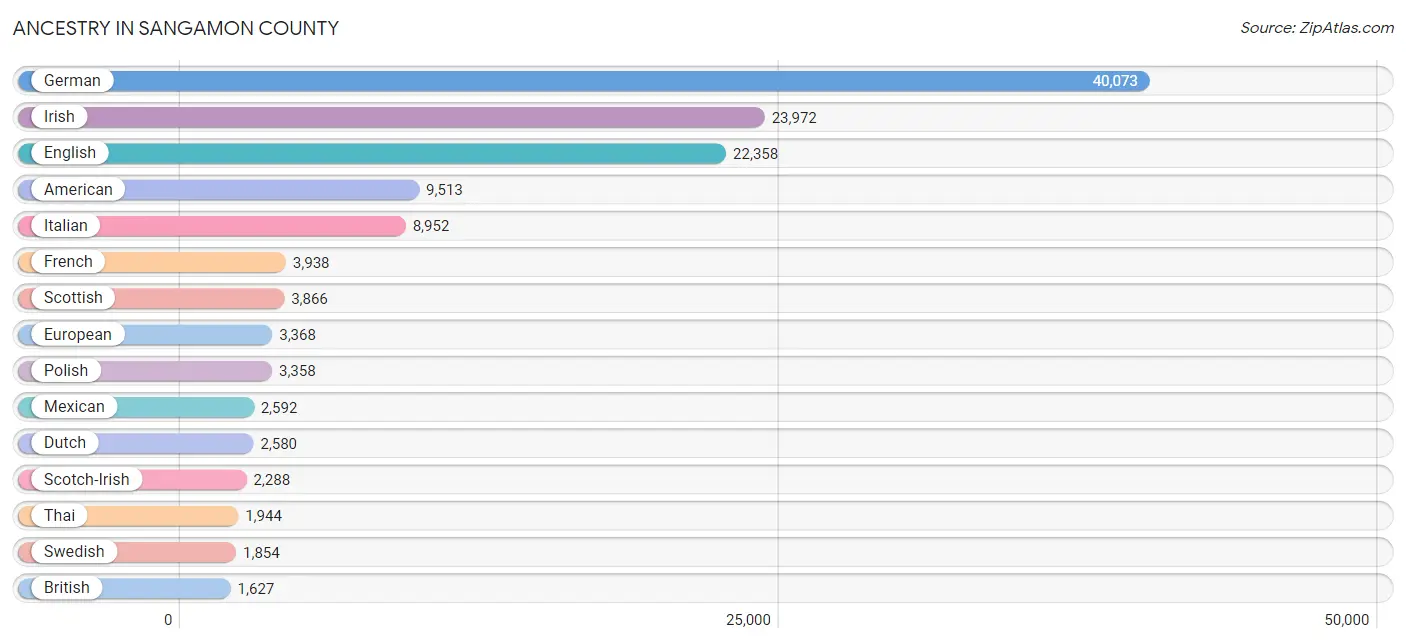
Ancestry in Sangamon County
The most populous ancestries reported in Sangamon County are German (40,073 | 20.4%), Irish (23,972 | 12.2%), English (22,358 | 11.4%), American (9,513 | 4.9%), and Italian (8,952 | 4.6%), together accounting for 53.5% of all Sangamon County residents.
| Ancestry | # Population | % Population |
| Afghan | 36 | 0.0% |
| African | 715 | 0.4% |
| American | 9,513 | 4.9% |
| Apache | 47 | 0.0% |
| Arab | 450 | 0.2% |
| Argentinean | 35 | 0.0% |
| Armenian | 65 | 0.0% |
| Australian | 40 | 0.0% |
| Austrian | 476 | 0.2% |
| Basque | 13 | 0.0% |
| Belgian | 152 | 0.1% |
| Belizean | 79 | 0.0% |
| Bhutanese | 192 | 0.1% |
| Blackfeet | 72 | 0.0% |
| Bolivian | 15 | 0.0% |
| Brazilian | 56 | 0.0% |
| British | 1,627 | 0.8% |
| Bulgarian | 14 | 0.0% |
| Burmese | 306 | 0.2% |
| Cajun | 55 | 0.0% |
| Canadian | 105 | 0.1% |
| Celtic | 3 | 0.0% |
| Central American | 152 | 0.1% |
| Cherokee | 325 | 0.2% |
| Chickasaw | 9 | 0.0% |
| Chilean | 51 | 0.0% |
| Chippewa | 11 | 0.0% |
| Choctaw | 64 | 0.0% |
| Colombian | 159 | 0.1% |
| Comanche | 2 | 0.0% |
| Costa Rican | 5 | 0.0% |
| Cree | 2 | 0.0% |
| Creek | 44 | 0.0% |
| Croatian | 230 | 0.1% |
| Crow | 1 | 0.0% |
| Cuban | 188 | 0.1% |
| Czech | 557 | 0.3% |
| Czechoslovakian | 300 | 0.2% |
| Danish | 413 | 0.2% |
| Dominican | 50 | 0.0% |
| Dutch | 2,580 | 1.3% |
| Eastern European | 294 | 0.2% |
| Egyptian | 14 | 0.0% |
| English | 22,358 | 11.4% |
| European | 3,368 | 1.7% |
| Filipino | 168 | 0.1% |
| Finnish | 147 | 0.1% |
| French | 3,938 | 2.0% |
| French American Indian | 10 | 0.0% |
| French Canadian | 555 | 0.3% |
| German | 40,073 | 20.4% |
| Ghanaian | 12 | 0.0% |
| Greek | 357 | 0.2% |
| Guamanian / Chamorro | 15 | 0.0% |
| Guatemalan | 40 | 0.0% |
| Haitian | 92 | 0.1% |
| Honduran | 26 | 0.0% |
| Hopi | 1 | 0.0% |
| Hungarian | 466 | 0.2% |
| Icelander | 23 | 0.0% |
| Indian (Asian) | 717 | 0.4% |
| Indonesian | 37 | 0.0% |
| Inupiat | 13 | 0.0% |
| Iranian | 61 | 0.0% |
| Iraqi | 15 | 0.0% |
| Irish | 23,972 | 12.2% |
| Iroquois | 6 | 0.0% |
| Israeli | 9 | 0.0% |
| Italian | 8,952 | 4.6% |
| Jamaican | 47 | 0.0% |
| Japanese | 22 | 0.0% |
| Jordanian | 70 | 0.0% |
| Korean | 1,187 | 0.6% |
| Latvian | 43 | 0.0% |
| Lebanese | 183 | 0.1% |
| Lithuanian | 918 | 0.5% |
| Macedonian | 27 | 0.0% |
| Malaysian | 120 | 0.1% |
| Mexican | 2,592 | 1.3% |
| Mexican American Indian | 134 | 0.1% |
| Moroccan | 11 | 0.0% |
| Native Hawaiian | 122 | 0.1% |
| Navajo | 17 | 0.0% |
| New Zealander | 21 | 0.0% |
| Nicaraguan | 81 | 0.0% |
| Nigerian | 444 | 0.2% |
| Northern European | 232 | 0.1% |
| Norwegian | 1,230 | 0.6% |
| Osage | 7 | 0.0% |
| Pakistani | 150 | 0.1% |
| Palestinian | 22 | 0.0% |
| Pennsylvania German | 40 | 0.0% |
| Peruvian | 16 | 0.0% |
| Polish | 3,358 | 1.7% |
| Portuguese | 611 | 0.3% |
| Potawatomi | 2 | 0.0% |
| Pueblo | 15 | 0.0% |
| Puerto Rican | 910 | 0.5% |
| Romanian | 25 | 0.0% |
| Russian | 308 | 0.2% |
| Samoan | 15 | 0.0% |
| Scandinavian | 700 | 0.4% |
| Scotch-Irish | 2,288 | 1.2% |
| Scottish | 3,866 | 2.0% |
| Seminole | 5 | 0.0% |
| Serbian | 40 | 0.0% |
| Sierra Leonean | 12 | 0.0% |
| Sioux | 40 | 0.0% |
| Slavic | 109 | 0.1% |
| Slovak | 719 | 0.4% |
| Slovene | 111 | 0.1% |
| Somali | 8 | 0.0% |
| South African | 93 | 0.1% |
| South American | 340 | 0.2% |
| Spaniard | 67 | 0.0% |
| Spanish | 156 | 0.1% |
| Sri Lankan | 362 | 0.2% |
| Subsaharan African | 1,548 | 0.8% |
| Sudanese | 22 | 0.0% |
| Swedish | 1,854 | 0.9% |
| Swiss | 695 | 0.4% |
| Syrian | 27 | 0.0% |
| Thai | 1,944 | 1.0% |
| Trinidadian and Tobagonian | 12 | 0.0% |
| Turkish | 121 | 0.1% |
| Ugandan | 1 | 0.0% |
| Ukrainian | 210 | 0.1% |
| Venezuelan | 64 | 0.0% |
| Welsh | 1,260 | 0.6% |
| Yugoslavian | 127 | 0.1% | View All 130 Rows |
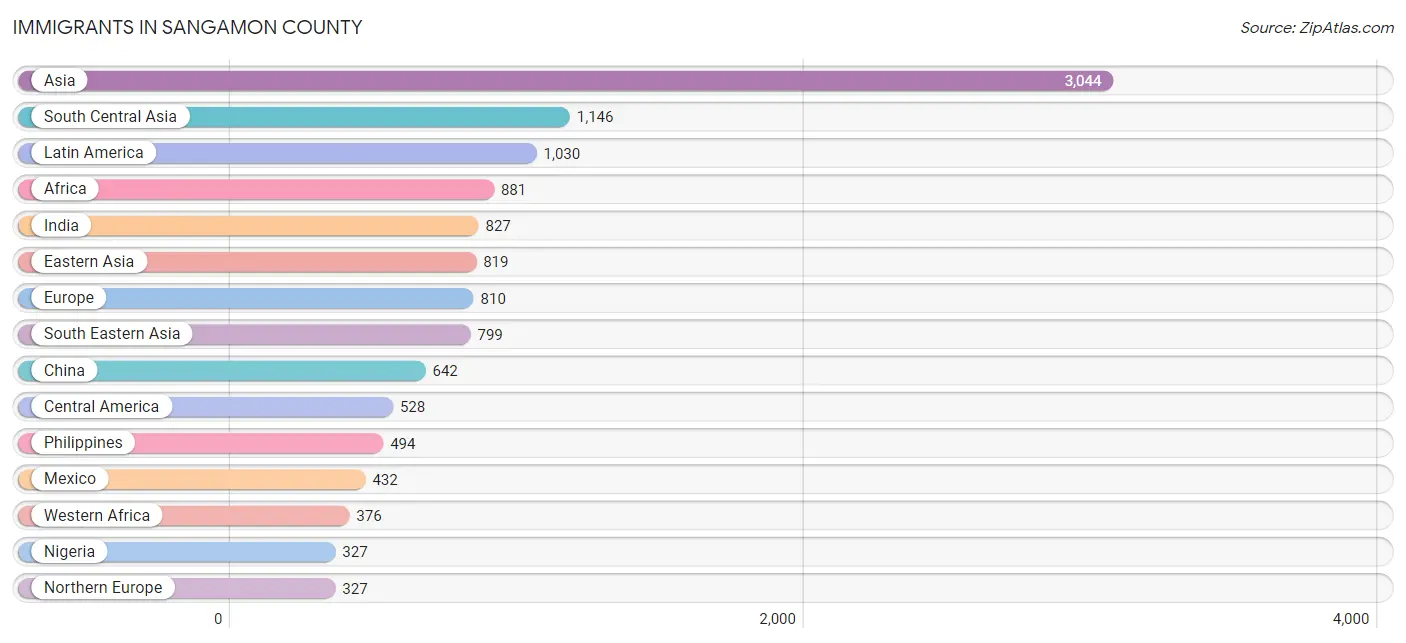
Immigrants in Sangamon County
The most numerous immigrant groups reported in Sangamon County came from Asia (3,044 | 1.5%), South Central Asia (1,146 | 0.6%), Latin America (1,030 | 0.5%), Africa (881 | 0.4%), and India (827 | 0.4%), together accounting for 3.5% of all Sangamon County residents.
| Immigration Origin | # Population | % Population |
| Afghanistan | 15 | 0.0% |
| Africa | 881 | 0.4% |
| Argentina | 35 | 0.0% |
| Asia | 3,044 | 1.5% |
| Australia | 13 | 0.0% |
| Austria | 13 | 0.0% |
| Belarus | 19 | 0.0% |
| Belgium | 1 | 0.0% |
| Belize | 17 | 0.0% |
| Brazil | 54 | 0.0% |
| Bulgaria | 14 | 0.0% |
| Cambodia | 3 | 0.0% |
| Cameroon | 136 | 0.1% |
| Canada | 116 | 0.1% |
| Caribbean | 189 | 0.1% |
| Central America | 528 | 0.3% |
| Chile | 51 | 0.0% |
| China | 642 | 0.3% |
| Colombia | 105 | 0.1% |
| Congo | 35 | 0.0% |
| Costa Rica | 5 | 0.0% |
| Croatia | 14 | 0.0% |
| Cuba | 37 | 0.0% |
| Czechoslovakia | 20 | 0.0% |
| Dominican Republic | 50 | 0.0% |
| Eastern Africa | 46 | 0.0% |
| Eastern Asia | 819 | 0.4% |
| Eastern Europe | 220 | 0.1% |
| Egypt | 14 | 0.0% |
| England | 154 | 0.1% |
| Eritrea | 4 | 0.0% |
| Europe | 810 | 0.4% |
| Fiji | 12 | 0.0% |
| France | 51 | 0.0% |
| Germany | 117 | 0.1% |
| Ghana | 49 | 0.0% |
| Greece | 2 | 0.0% |
| Guatemala | 46 | 0.0% |
| Guyana | 7 | 0.0% |
| Haiti | 61 | 0.0% |
| Honduras | 11 | 0.0% |
| India | 827 | 0.4% |
| Iran | 13 | 0.0% |
| Iraq | 9 | 0.0% |
| Ireland | 34 | 0.0% |
| Israel | 3 | 0.0% |
| Italy | 58 | 0.0% |
| Jamaica | 23 | 0.0% |
| Japan | 20 | 0.0% |
| Jordan | 62 | 0.0% |
| Kazakhstan | 2 | 0.0% |
| Korea | 157 | 0.1% |
| Kuwait | 6 | 0.0% |
| Laos | 29 | 0.0% |
| Latin America | 1,030 | 0.5% |
| Lebanon | 26 | 0.0% |
| Mexico | 432 | 0.2% |
| Middle Africa | 234 | 0.1% |
| Morocco | 11 | 0.0% |
| Nepal | 139 | 0.1% |
| Nicaragua | 3 | 0.0% |
| Nigeria | 327 | 0.2% |
| Northern Africa | 30 | 0.0% |
| Northern Europe | 327 | 0.2% |
| Norway | 12 | 0.0% |
| Oceania | 25 | 0.0% |
| Pakistan | 143 | 0.1% |
| Panama | 14 | 0.0% |
| Peru | 4 | 0.0% |
| Philippines | 494 | 0.3% |
| Poland | 25 | 0.0% |
| Russia | 48 | 0.0% |
| Saudi Arabia | 90 | 0.1% |
| Scotland | 20 | 0.0% |
| Serbia | 10 | 0.0% |
| Somalia | 8 | 0.0% |
| South Africa | 93 | 0.1% |
| South America | 313 | 0.2% |
| South Central Asia | 1,146 | 0.6% |
| South Eastern Asia | 799 | 0.4% |
| Southern Europe | 81 | 0.0% |
| Spain | 21 | 0.0% |
| Sri Lanka | 7 | 0.0% |
| Sudan | 5 | 0.0% |
| Syria | 8 | 0.0% |
| Taiwan | 156 | 0.1% |
| Thailand | 75 | 0.0% |
| Trinidad and Tobago | 18 | 0.0% |
| Turkey | 64 | 0.0% |
| Uganda | 1 | 0.0% |
| Ukraine | 70 | 0.0% |
| Venezuela | 57 | 0.0% |
| Vietnam | 164 | 0.1% |
| Western Africa | 376 | 0.2% |
| Western Asia | 280 | 0.1% |
| Western Europe | 182 | 0.1% |
| Zaire | 32 | 0.0% | View All 97 Rows |
Sex and Age in Sangamon County
Sex and Age in Sangamon County
The most populous age groups in Sangamon County are 55 to 59 Years (7,041 | 7.4%) for men and 55 to 59 Years (7,435 | 7.3%) for women.

| Age Bracket | Male | Female |
| Under 5 Years | 5,666 (6.0%) | 5,398 (5.3%) |
| 5 to 9 Years | 6,262 (6.6%) | 5,672 (5.6%) |
| 10 to 14 Years | 6,169 (6.5%) | 6,094 (6.0%) |
| 15 to 19 Years | 6,438 (6.8%) | 6,032 (6.0%) |
| 20 to 24 Years | 5,813 (6.1%) | 5,795 (5.7%) |
| 25 to 29 Years | 5,715 (6.0%) | 6,155 (6.1%) |
| 30 to 34 Years | 5,876 (6.2%) | 6,298 (6.2%) |
| 35 to 39 Years | 6,259 (6.6%) | 6,672 (6.6%) |
| 40 to 44 Years | 5,861 (6.2%) | 5,980 (5.9%) |
| 45 to 49 Years | 5,824 (6.1%) | 5,959 (5.9%) |
| 50 to 54 Years | 6,100 (6.4%) | 6,316 (6.2%) |
| 55 to 59 Years | 7,041 (7.4%) | 7,435 (7.3%) |
| 60 to 64 Years | 6,232 (6.6%) | 6,744 (6.7%) |
| 65 to 69 Years | 5,846 (6.2%) | 6,328 (6.2%) |
| 70 to 74 Years | 4,123 (4.3%) | 5,395 (5.3%) |
| 75 to 79 Years | 2,406 (2.5%) | 3,420 (3.4%) |
| 80 to 84 Years | 1,830 (1.9%) | 2,597 (2.6%) |
| 85 Years and over | 1,387 (1.5%) | 2,984 (2.9%) |
| Total | 94,848 (100.0%) | 101,274 (100.0%) |
Families and Households in Sangamon County
Median Family Size in Sangamon County
The median family size in Sangamon County is 2.96 persons per family, with single female/mother families (10,474 | 21.1%) accounting for the largest median family size of 3.04 persons per family. On the other hand, single male/father families (3,346 | 6.8%) represent the smallest median family size with 2.73 persons per family.
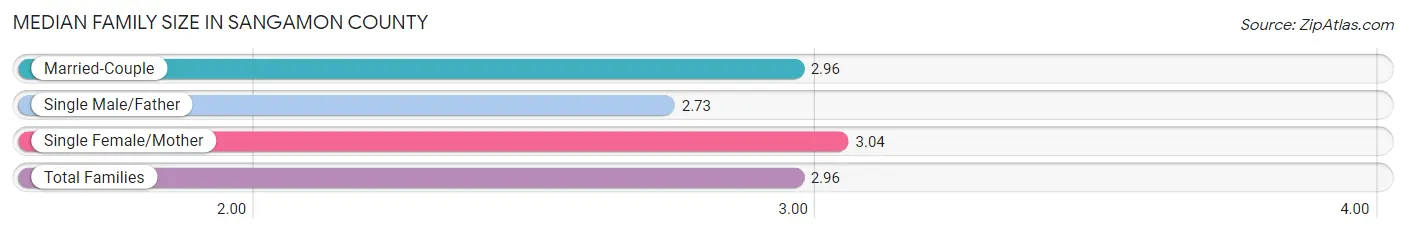
| Family Type | # Families | Family Size |
| Married-Couple | 35,728 (72.1%) | 2.96 |
| Single Male/Father | 3,346 (6.8%) | 2.73 |
| Single Female/Mother | 10,474 (21.1%) | 3.04 |
| Total Families | 49,548 (100.0%) | 2.96 |
Median Household Size in Sangamon County
The median household size in Sangamon County is 2.29 persons per household, with single female/mother households (10,474 | 12.5%) accounting for the largest median household size of 3.29 persons per household. non-family households (34,469 | 41.0%) represent the smallest median household size with 1.19 persons per household.
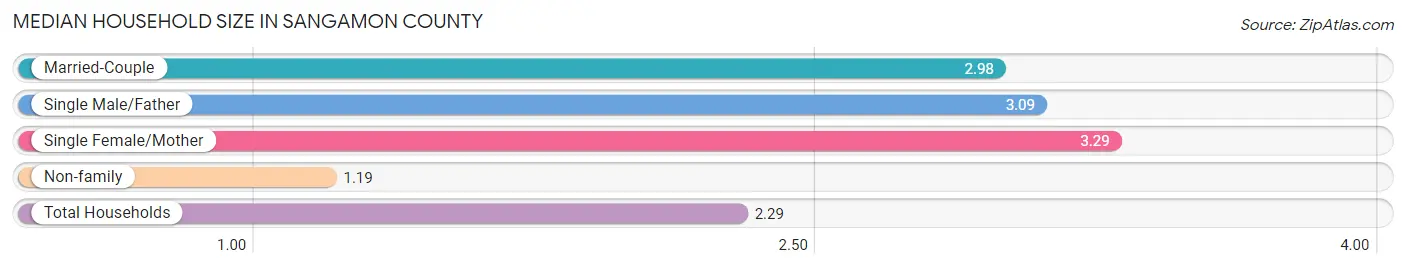
| Household Type | # Households | Household Size |
| Married-Couple | 35,728 (42.5%) | 2.98 |
| Single Male/Father | 3,346 (4.0%) | 3.09 |
| Single Female/Mother | 10,474 (12.5%) | 3.29 |
| Non-family | 34,469 (41.0%) | 1.19 |
| Total Households | 84,017 (100.0%) | 2.29 |
Household Size by Marriage Status in Sangamon County
Out of a total of 84,017 households in Sangamon County, 49,548 (59.0%) are family households, while 34,469 (41.0%) are nonfamily households. The most numerous type of family households are 2-person households, comprising 24,717, and the most common type of nonfamily households are 1-person households, comprising 29,179.
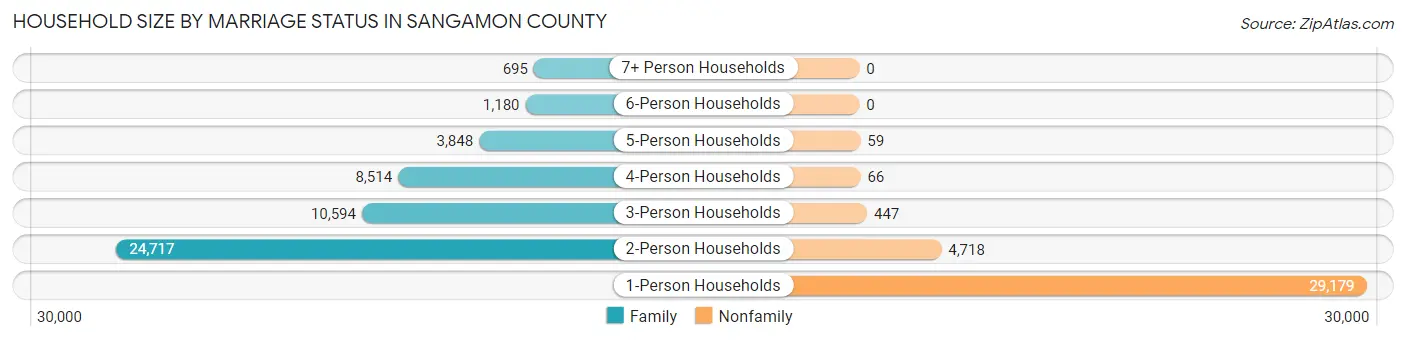
| Household Size | Family Households | Nonfamily Households |
| 1-Person Households | - | 29,179 (34.7%) |
| 2-Person Households | 24,717 (29.4%) | 4,718 (5.6%) |
| 3-Person Households | 10,594 (12.6%) | 447 (0.5%) |
| 4-Person Households | 8,514 (10.1%) | 66 (0.1%) |
| 5-Person Households | 3,848 (4.6%) | 59 (0.1%) |
| 6-Person Households | 1,180 (1.4%) | 0 (0.0%) |
| 7+ Person Households | 695 (0.8%) | 0 (0.0%) |
| Total | 49,548 (59.0%) | 34,469 (41.0%) |
Female Fertility in Sangamon County
Fertility by Age in Sangamon County
Average fertility rate in Sangamon County is 59.0 births per 1,000 women. Women in the age bracket of 20 to 34 years have the highest fertility rate with 100.0 births per 1,000 women. Women in the age bracket of 20 to 34 years acount for 69.0% of all women with births.
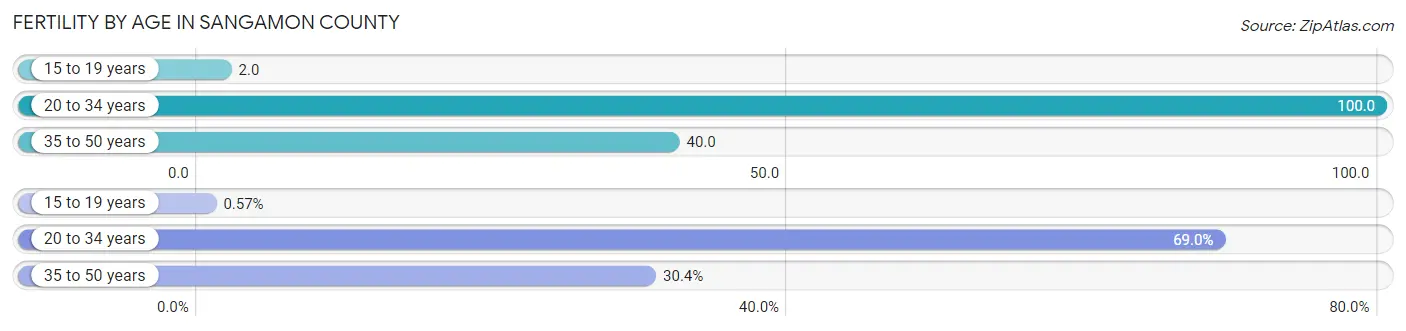
| Age Bracket | Women with Births | Births / 1,000 Women |
| 15 to 19 years | 15 (0.6%) | 2.0 |
| 20 to 34 years | 1,823 (69.0%) | 100.0 |
| 35 to 50 years | 803 (30.4%) | 40.0 |
| Total | 2,641 (100.0%) | 59.0 |
Fertility by Age by Marriage Status in Sangamon County
56.7% of women with births (2,641) in Sangamon County are married. The highest percentage of unmarried women with births falls into 15 to 19 years age bracket with 100.0% of them unmarried at the time of birth, while the lowest percentage of unmarried women with births belong to 35 to 50 years age bracket with 29.5% of them unmarried.
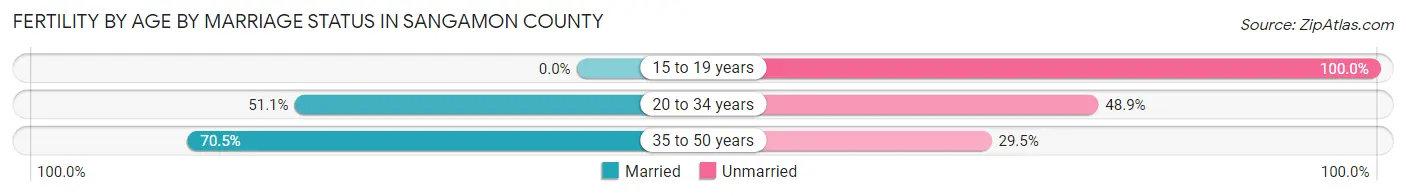
| Age Bracket | Married | Unmarried |
| 15 to 19 years | 0 (0.0%) | 15 (100.0%) |
| 20 to 34 years | 932 (51.1%) | 891 (48.9%) |
| 35 to 50 years | 566 (70.5%) | 237 (29.5%) |
| Total | 1,497 (56.7%) | 1,144 (43.3%) |
Fertility by Education in Sangamon County
Average fertility rate in Sangamon County is 59.0 births per 1,000 women. Women with the education attainment of bachelor's degree have the highest fertility rate of 88.0 births per 1,000 women, while women with the education attainment of less than high school have the lowest fertility at 24.0 births per 1,000 women. Women with the education attainment of bachelor's degree represent 31.7% of all women with births.
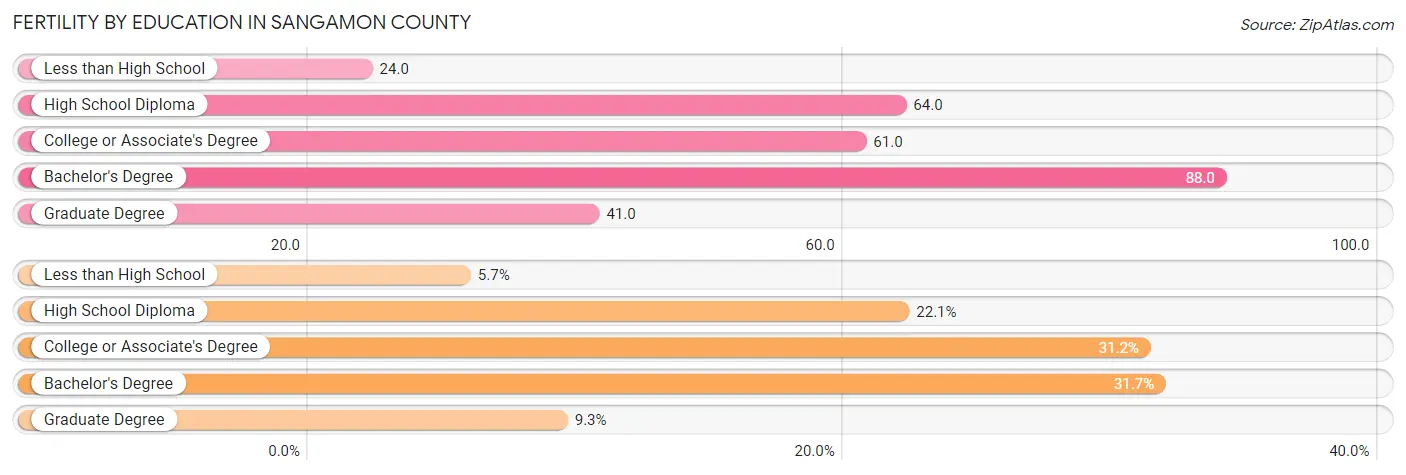
| Educational Attainment | Women with Births | Births / 1,000 Women |
| Less than High School | 150 (5.7%) | 24.0 |
| High School Diploma | 584 (22.1%) | 64.0 |
| College or Associate's Degree | 823 (31.2%) | 61.0 |
| Bachelor's Degree | 838 (31.7%) | 88.0 |
| Graduate Degree | 246 (9.3%) | 41.0 |
| Total | 2,641 (100.0%) | 59.0 |
Fertility by Education by Marriage Status in Sangamon County
43.3% of women with births in Sangamon County are unmarried. Women with the educational attainment of graduate degree are most likely to be married with 100.0% of them married at childbirth, while women with the educational attainment of less than high school are least likely to be married with 94.7% of them unmarried at childbirth.
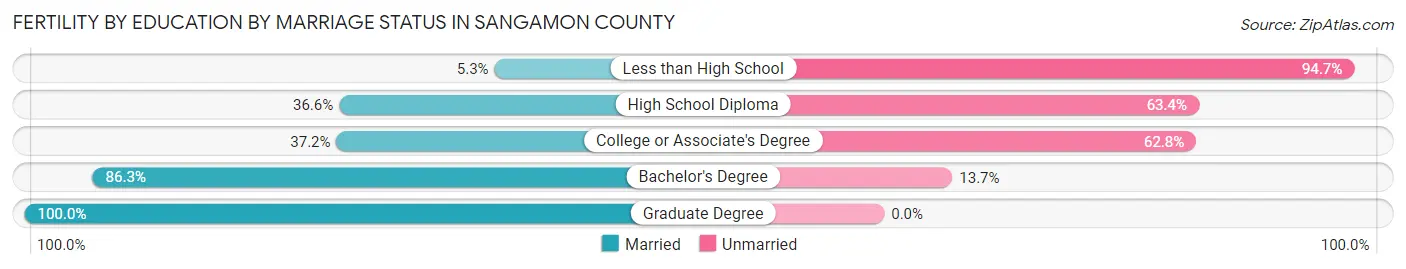
| Educational Attainment | Married | Unmarried |
| Less than High School | 8 (5.3%) | 142 (94.7%) |
| High School Diploma | 214 (36.6%) | 370 (63.4%) |
| College or Associate's Degree | 306 (37.2%) | 517 (62.8%) |
| Bachelor's Degree | 723 (86.3%) | 115 (13.7%) |
| Graduate Degree | 246 (100.0%) | 0 (0.0%) |
| Total | 1,497 (56.7%) | 1,144 (43.3%) |
Income in Sangamon County
Income Overview in Sangamon County
Per Capita Income in Sangamon County is $41,387, while median incomes of families and households are $96,427 and $71,653 respectively.
| Characteristic | Number | Measure |
| Per Capita Income | 196,122 | $41,387 |
| Median Family Income | 49,548 | $96,427 |
| Mean Family Income | 49,548 | $119,058 |
| Median Household Income | 84,017 | $71,653 |
| Mean Household Income | 84,017 | $94,790 |
| Income Deficit | 49,548 | $11,132 |
| Wage / Income Gap (%) | 196,122 | 23.94% |
| Wage / Income Gap ($) | 196,122 | 76.06¢ per $1 |
| Gini / Inequality Index | 196,122 | 0.46 |
Earnings by Sex in Sangamon County
Average Earnings in Sangamon County are $44,043, $50,806 for men and $38,643 for women, a difference of 23.9%.
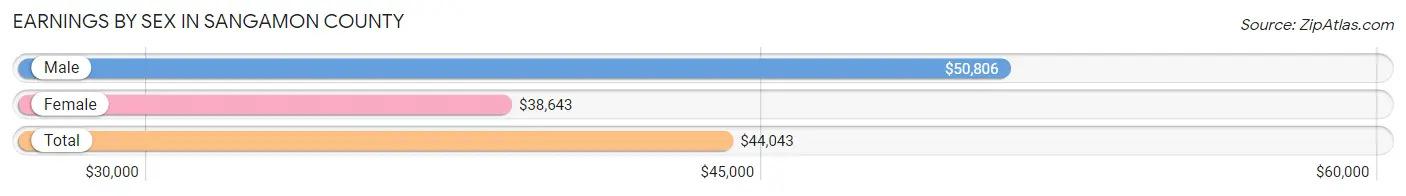
| Sex | Number | Average Earnings |
| Male | 51,009 (50.4%) | $50,806 |
| Female | 50,182 (49.6%) | $38,643 |
| Total | 101,191 (100.0%) | $44,043 |
Earnings by Sex by Income Bracket in Sangamon County
The most common earnings brackets in Sangamon County are $100,000+ for men (8,330 | 16.3%) and $100,000+ for women (4,710 | 9.4%).
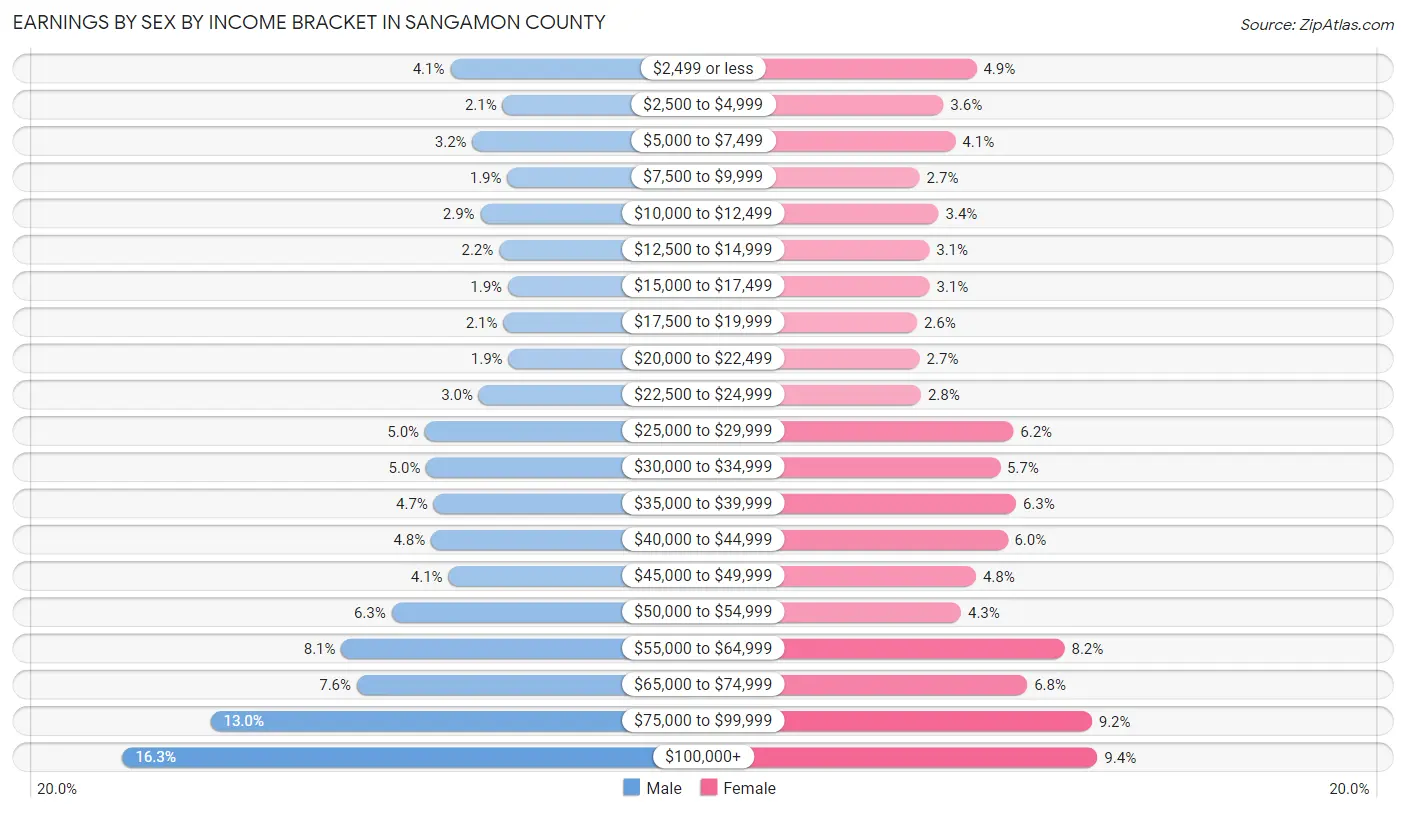
| Income | Male | Female |
| $2,499 or less | 2,067 (4.1%) | 2,441 (4.9%) |
| $2,500 to $4,999 | 1,068 (2.1%) | 1,816 (3.6%) |
| $5,000 to $7,499 | 1,642 (3.2%) | 2,041 (4.1%) |
| $7,500 to $9,999 | 972 (1.9%) | 1,370 (2.7%) |
| $10,000 to $12,499 | 1,488 (2.9%) | 1,728 (3.4%) |
| $12,500 to $14,999 | 1,133 (2.2%) | 1,551 (3.1%) |
| $15,000 to $17,499 | 965 (1.9%) | 1,556 (3.1%) |
| $17,500 to $19,999 | 1,052 (2.1%) | 1,322 (2.6%) |
| $20,000 to $22,499 | 952 (1.9%) | 1,370 (2.7%) |
| $22,500 to $24,999 | 1,518 (3.0%) | 1,393 (2.8%) |
| $25,000 to $29,999 | 2,552 (5.0%) | 3,133 (6.2%) |
| $30,000 to $34,999 | 2,523 (5.0%) | 2,879 (5.7%) |
| $35,000 to $39,999 | 2,380 (4.7%) | 3,183 (6.3%) |
| $40,000 to $44,999 | 2,432 (4.8%) | 3,022 (6.0%) |
| $45,000 to $49,999 | 2,103 (4.1%) | 2,429 (4.8%) |
| $50,000 to $54,999 | 3,187 (6.2%) | 2,146 (4.3%) |
| $55,000 to $64,999 | 4,148 (8.1%) | 4,093 (8.2%) |
| $65,000 to $74,999 | 3,849 (7.5%) | 3,390 (6.8%) |
| $75,000 to $99,999 | 6,648 (13.0%) | 4,609 (9.2%) |
| $100,000+ | 8,330 (16.3%) | 4,710 (9.4%) |
| Total | 51,009 (100.0%) | 50,182 (100.0%) |
Earnings by Sex by Educational Attainment in Sangamon County
Average earnings in Sangamon County are $56,924 for men and $43,918 for women, a difference of 22.9%. Men with an educational attainment of graduate degree enjoy the highest average annual earnings of $89,380, while those with less than high school education earn the least with $32,556. Women with an educational attainment of graduate degree earn the most with the average annual earnings of $75,227, while those with less than high school education have the smallest earnings of $20,423.

| Educational Attainment | Male Income | Female Income |
| Less than High School | $32,556 | $20,423 |
| High School Diploma | $45,120 | $31,135 |
| College or Associate's Degree | $52,418 | $38,470 |
| Bachelor's Degree | $73,052 | $51,914 |
| Graduate Degree | $89,380 | $75,227 |
| Total | $56,924 | $43,918 |
Family Income in Sangamon County
Family Income Brackets in Sangamon County
According to the Sangamon County family income data, there are 11,545 families falling into the $100,000 to $149,999 income range, which is the most common income bracket and makes up 23.3% of all families. Conversely, the $10,000 to $14,999 income bracket is the least frequent group with only 991 families (2.0%) belonging to this category.
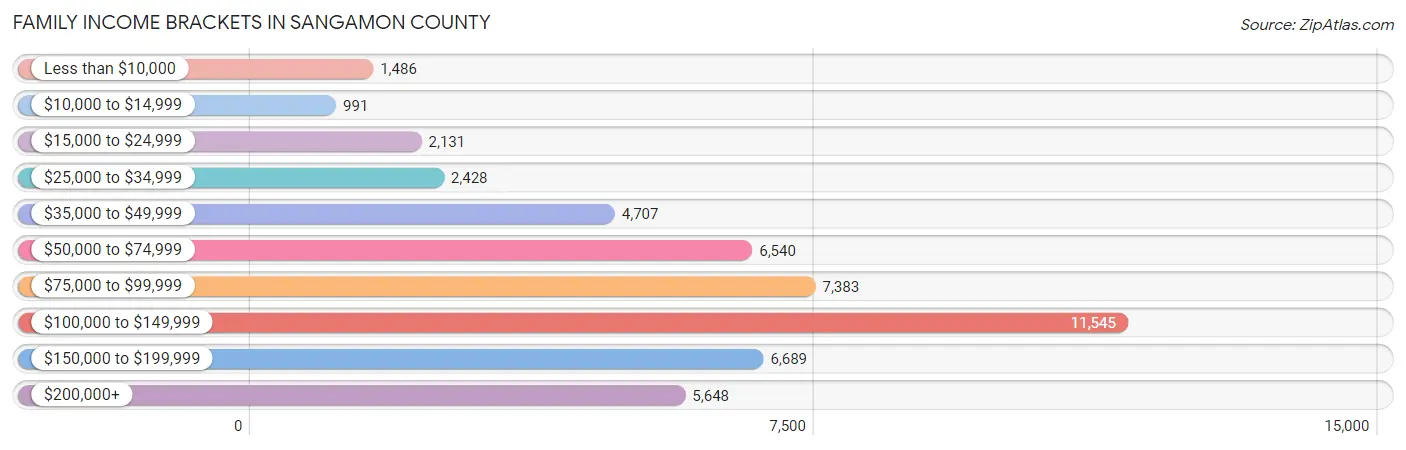
| Income Bracket | # Families | % Families |
| Less than $10,000 | 1,486 | 3.0% |
| $10,000 to $14,999 | 991 | 2.0% |
| $15,000 to $24,999 | 2,131 | 4.3% |
| $25,000 to $34,999 | 2,428 | 4.9% |
| $35,000 to $49,999 | 4,707 | 9.5% |
| $50,000 to $74,999 | 6,540 | 13.2% |
| $75,000 to $99,999 | 7,383 | 14.9% |
| $100,000 to $149,999 | 11,545 | 23.3% |
| $150,000 to $199,999 | 6,689 | 13.5% |
| $200,000+ | 5,648 | 11.4% |
Family Income by Famaliy Size in Sangamon County
4-person families (7,977 | 16.1%) account for the highest median family income in Sangamon County with $122,236 per family, while 2-person families (26,369 | 53.2%) have the highest median income of $43,706 per family member.
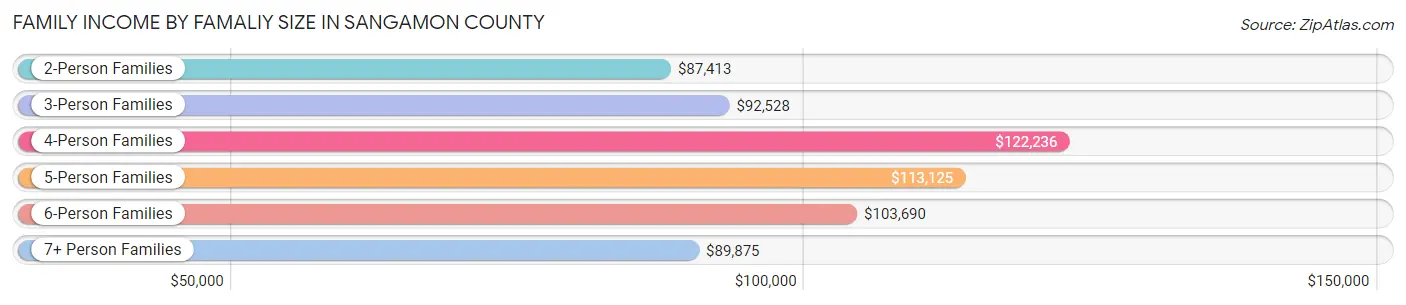
| Income Bracket | # Families | Median Income |
| 2-Person Families | 26,369 (53.2%) | $87,413 |
| 3-Person Families | 10,224 (20.6%) | $92,528 |
| 4-Person Families | 7,977 (16.1%) | $122,236 |
| 5-Person Families | 3,319 (6.7%) | $113,125 |
| 6-Person Families | 1,256 (2.5%) | $103,690 |
| 7+ Person Families | 403 (0.8%) | $89,875 |
| Total | 49,548 (100.0%) | $96,427 |
Family Income by Number of Earners in Sangamon County
The median family income in Sangamon County is $96,427, with families comprising 3+ earners (4,314) having the highest median family income of $153,614, while families with 1 earner (15,995) have the lowest median family income of $61,951, accounting for 8.7% and 32.3% of families, respectively.
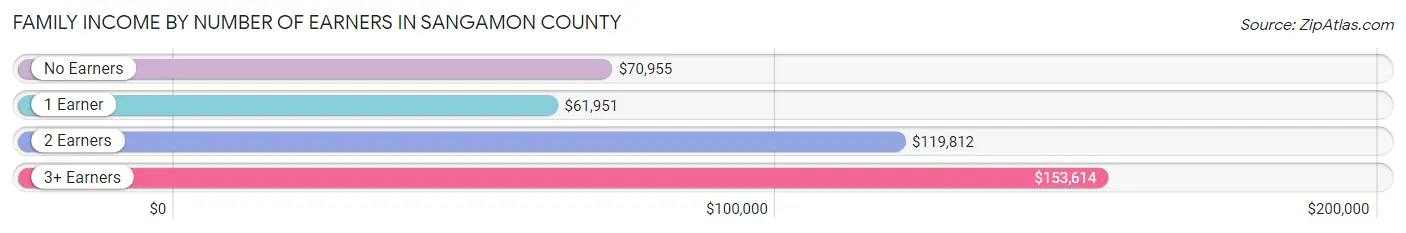
| Number of Earners | # Families | Median Income |
| No Earners | 8,716 (17.6%) | $70,955 |
| 1 Earner | 15,995 (32.3%) | $61,951 |
| 2 Earners | 20,523 (41.4%) | $119,812 |
| 3+ Earners | 4,314 (8.7%) | $153,614 |
| Total | 49,548 (100.0%) | $96,427 |
Household Income in Sangamon County
Household Income Brackets in Sangamon County
With 15,039 households falling in the category, the $100,000 to $149,999 income range is the most frequent in Sangamon County, accounting for 17.9% of all households. In contrast, only 3,697 households (4.4%) fall into the $10,000 to $14,999 income bracket, making it the least populous group.
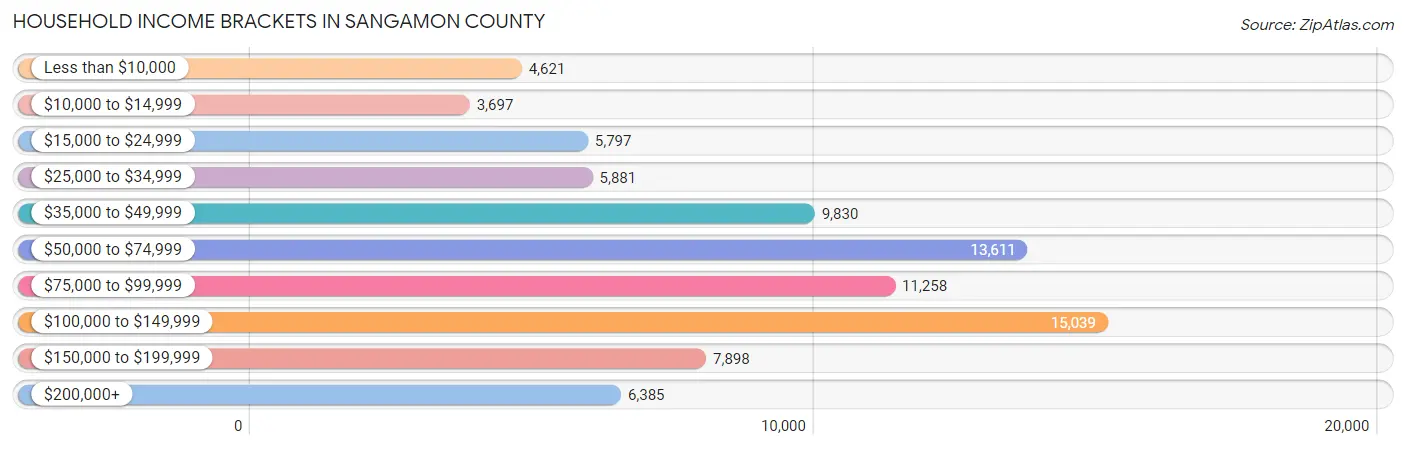
| Income Bracket | # Households | % Households |
| Less than $10,000 | 4,621 | 5.5% |
| $10,000 to $14,999 | 3,697 | 4.4% |
| $15,000 to $24,999 | 5,797 | 6.9% |
| $25,000 to $34,999 | 5,881 | 7.0% |
| $35,000 to $49,999 | 9,830 | 11.7% |
| $50,000 to $74,999 | 13,611 | 16.2% |
| $75,000 to $99,999 | 11,258 | 13.4% |
| $100,000 to $149,999 | 15,039 | 17.9% |
| $150,000 to $199,999 | 7,898 | 9.4% |
| $200,000+ | 6,385 | 7.6% |
Household Income by Householder Age in Sangamon County
The median household income in Sangamon County is $71,653, with the highest median household income of $86,228 found in the 45 to 64 years age bracket for the primary householder. A total of 31,469 households (37.5%) fall into this category. Meanwhile, the 15 to 24 years age bracket for the primary householder has the lowest median household income of $37,894, with 3,058 households (3.6%) in this group.
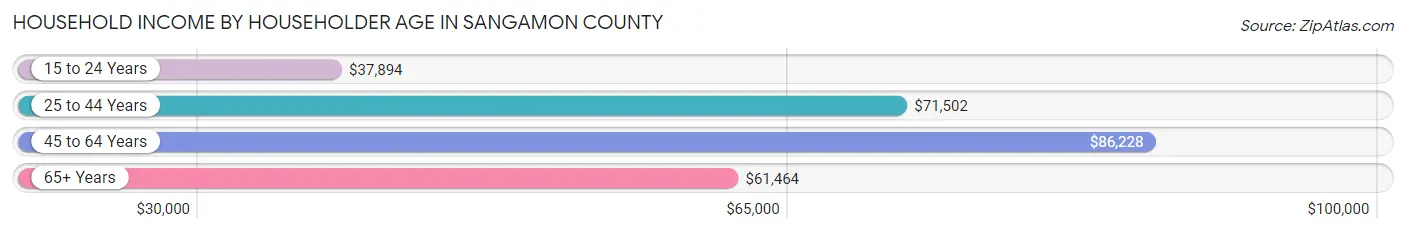
| Income Bracket | # Households | Median Income |
| 15 to 24 Years | 3,058 (3.6%) | $37,894 |
| 25 to 44 Years | 26,090 (31.0%) | $71,502 |
| 45 to 64 Years | 31,469 (37.5%) | $86,228 |
| 65+ Years | 23,400 (27.9%) | $61,464 |
| Total | 84,017 (100.0%) | $71,653 |
Poverty in Sangamon County
Income Below Poverty by Sex and Age in Sangamon County
With 11.7% poverty level for males and 14.1% for females among the residents of Sangamon County, under 5 year old males and under 5 year old females are the most vulnerable to poverty, with 1,266 males (23.0%) and 1,289 females (24.3%) in their respective age groups living below the poverty level.
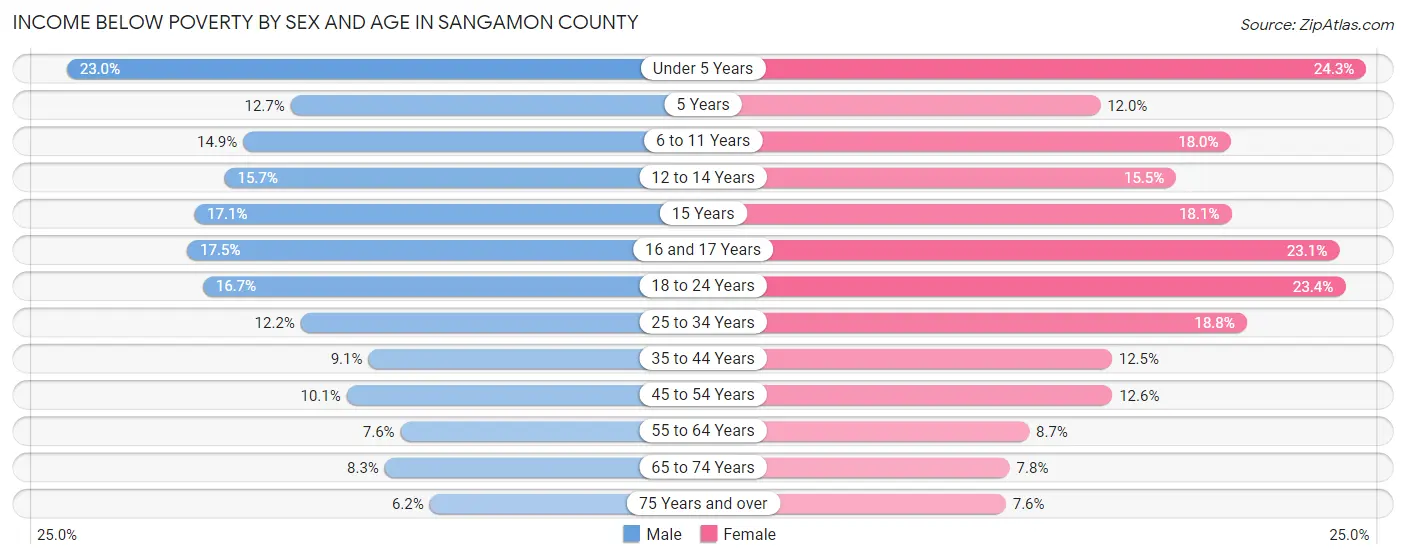
| Age Bracket | Male | Female |
| Under 5 Years | 1,266 (23.0%) | 1,289 (24.3%) |
| 5 Years | 102 (12.7%) | 132 (12.0%) |
| 6 to 11 Years | 1,115 (14.9%) | 1,295 (18.0%) |
| 12 to 14 Years | 603 (15.7%) | 505 (15.5%) |
| 15 Years | 217 (17.1%) | 275 (18.1%) |
| 16 and 17 Years | 475 (17.5%) | 523 (23.1%) |
| 18 to 24 Years | 1,246 (16.7%) | 1,747 (23.4%) |
| 25 to 34 Years | 1,390 (12.2%) | 2,327 (18.8%) |
| 35 to 44 Years | 1,088 (9.0%) | 1,584 (12.5%) |
| 45 to 54 Years | 1,191 (10.1%) | 1,540 (12.6%) |
| 55 to 64 Years | 993 (7.6%) | 1,220 (8.7%) |
| 65 to 74 Years | 817 (8.3%) | 901 (7.8%) |
| 75 Years and over | 342 (6.2%) | 651 (7.6%) |
| Total | 10,845 (11.7%) | 13,989 (14.1%) |
Income Above Poverty by Sex and Age in Sangamon County
According to the poverty statistics in Sangamon County, males aged 75 years and over and females aged 75 years and over are the age groups that are most secure financially, with 93.8% of males and 92.4% of females in these age groups living above the poverty line.
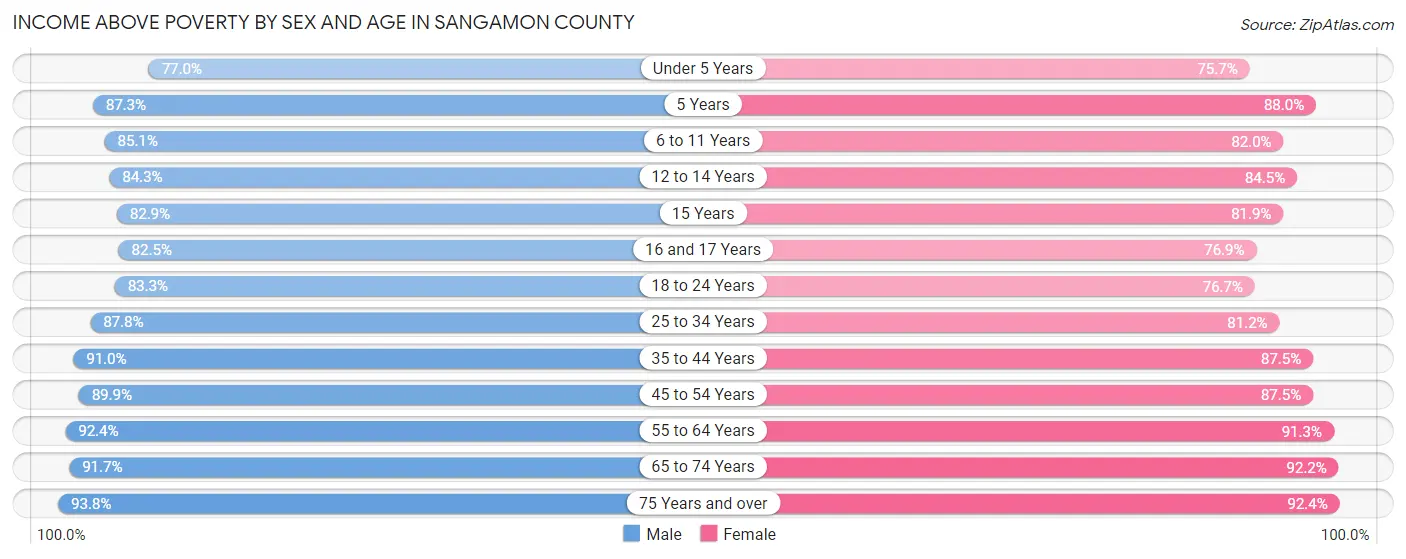
| Age Bracket | Male | Female |
| Under 5 Years | 4,228 (77.0%) | 4,010 (75.7%) |
| 5 Years | 704 (87.3%) | 969 (88.0%) |
| 6 to 11 Years | 6,387 (85.1%) | 5,887 (82.0%) |
| 12 to 14 Years | 3,232 (84.3%) | 2,752 (84.5%) |
| 15 Years | 1,050 (82.9%) | 1,247 (81.9%) |
| 16 and 17 Years | 2,246 (82.5%) | 1,744 (76.9%) |
| 18 to 24 Years | 6,200 (83.3%) | 5,734 (76.6%) |
| 25 to 34 Years | 10,009 (87.8%) | 10,061 (81.2%) |
| 35 to 44 Years | 10,938 (90.9%) | 11,061 (87.5%) |
| 45 to 54 Years | 10,650 (89.9%) | 10,727 (87.5%) |
| 55 to 64 Years | 12,140 (92.4%) | 12,818 (91.3%) |
| 65 to 74 Years | 9,035 (91.7%) | 10,663 (92.2%) |
| 75 Years and over | 5,166 (93.8%) | 7,908 (92.4%) |
| Total | 81,985 (88.3%) | 85,581 (86.0%) |
Income Below Poverty Among Married-Couple Families in Sangamon County
The poverty statistics for married-couple families in Sangamon County show that 2.5% or 884 of the total 35,728 families live below the poverty line. Families with 5 or more children have the highest poverty rate of 11.0%, comprising of 15 families. On the other hand, families with no children have the lowest poverty rate of 2.1%, which includes 461 families.
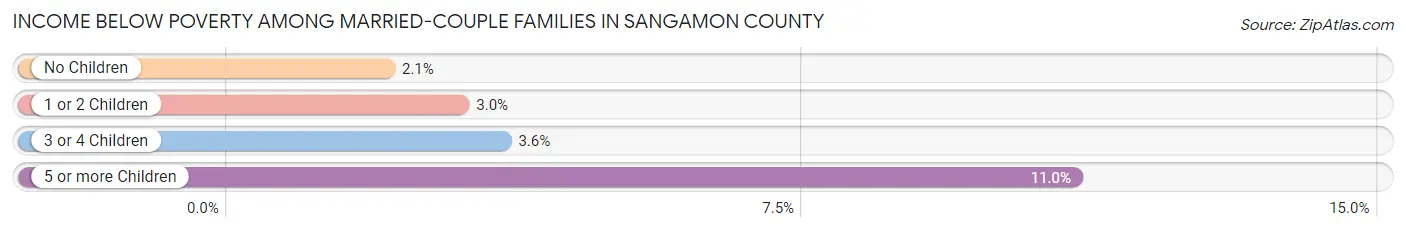
| Children | Above Poverty | Below Poverty |
| No Children | 22,073 (98.0%) | 461 (2.1%) |
| 1 or 2 Children | 10,220 (97.0%) | 318 (3.0%) |
| 3 or 4 Children | 2,430 (96.4%) | 90 (3.6%) |
| 5 or more Children | 121 (89.0%) | 15 (11.0%) |
| Total | 34,844 (97.5%) | 884 (2.5%) |
Income Below Poverty Among Single-Parent Households in Sangamon County
According to the poverty data in Sangamon County, 18.3% or 611 single-father households and 27.3% or 2,858 single-mother households are living below the poverty line. Among single-father households, those with 3 or 4 children have the highest poverty rate, with 97 households (43.9%) experiencing poverty. Likewise, among single-mother households, those with 3 or 4 children have the highest poverty rate, with 703 households (70.4%) falling below the poverty line.
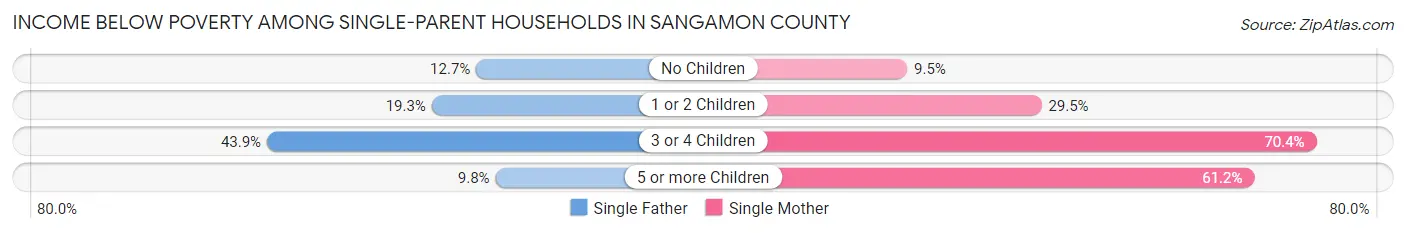
| Children | Single Father | Single Mother |
| No Children | 162 (12.7%) | 339 (9.5%) |
| 1 or 2 Children | 346 (19.3%) | 1,660 (29.5%) |
| 3 or 4 Children | 97 (43.9%) | 703 (70.4%) |
| 5 or more Children | 6 (9.8%) | 156 (61.2%) |
| Total | 611 (18.3%) | 2,858 (27.3%) |
Income Below Poverty Among Married-Couple vs Single-Parent Households in Sangamon County
The poverty data for Sangamon County shows that 884 of the married-couple family households (2.5%) and 3,469 of the single-parent households (25.1%) are living below the poverty level. Within the married-couple family households, those with 5 or more children have the highest poverty rate, with 15 households (11.0%) falling below the poverty line. Among the single-parent households, those with 3 or 4 children have the highest poverty rate, with 800 household (65.6%) living below poverty.
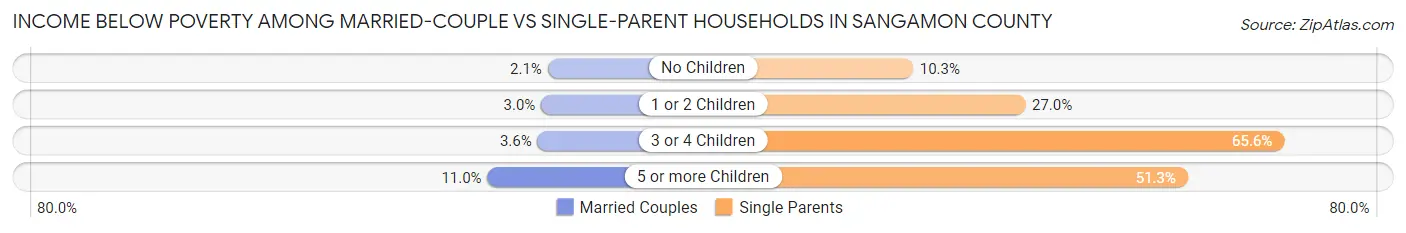
| Children | Married-Couple Families | Single-Parent Households |
| No Children | 461 (2.1%) | 501 (10.3%) |
| 1 or 2 Children | 318 (3.0%) | 2,006 (27.0%) |
| 3 or 4 Children | 90 (3.6%) | 800 (65.6%) |
| 5 or more Children | 15 (11.0%) | 162 (51.3%) |
| Total | 884 (2.5%) | 3,469 (25.1%) |
Employment Characteristics in Sangamon County
Employment by Class of Employer in Sangamon County
Among the 91,961 employed individuals in Sangamon County, private company employees (51,700 | 56.2%), state government employees (13,166 | 14.3%), and not-for-profit organizations (10,567 | 11.5%) make up the most common classes of employment.
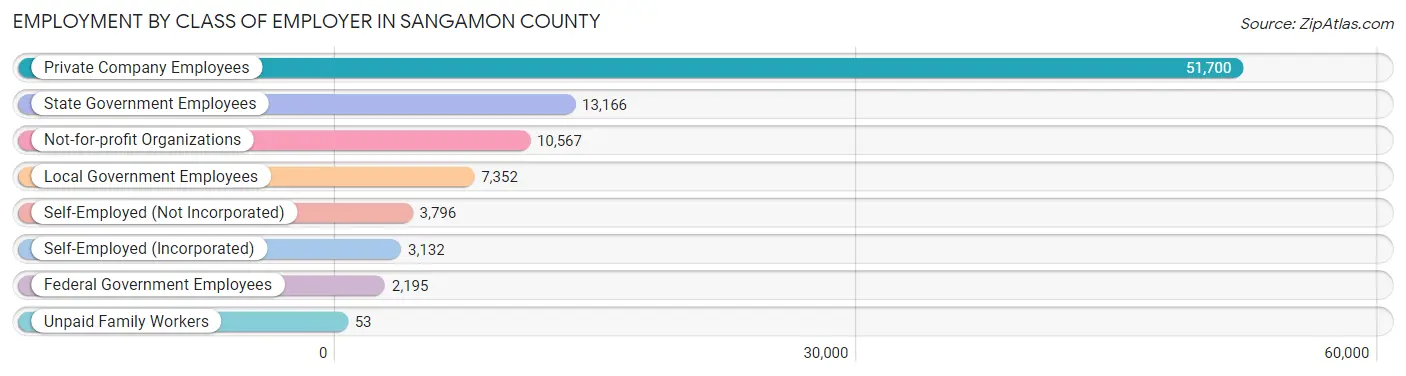
| Employer Class | # Employees | % Employees |
| Private Company Employees | 51,700 | 56.2% |
| Self-Employed (Incorporated) | 3,132 | 3.4% |
| Self-Employed (Not Incorporated) | 3,796 | 4.1% |
| Not-for-profit Organizations | 10,567 | 11.5% |
| Local Government Employees | 7,352 | 8.0% |
| State Government Employees | 13,166 | 14.3% |
| Federal Government Employees | 2,195 | 2.4% |
| Unpaid Family Workers | 53 | 0.1% |
| Total | 91,961 | 100.0% |
Employment Status by Age in Sangamon County
According to the labor force statistics for Sangamon County, out of the total population over 16 years of age (158,061), 62.1% or 98,156 individuals are in the labor force, with 5.2% or 5,104 of them unemployed. The age group with the highest labor force participation rate is 30 to 34 years, with 87.7% or 10,677 individuals in the labor force. Within the labor force, the 16 to 19 years age range has the highest percentage of unemployed individuals, with 14.8% or 588 of them being unemployed.
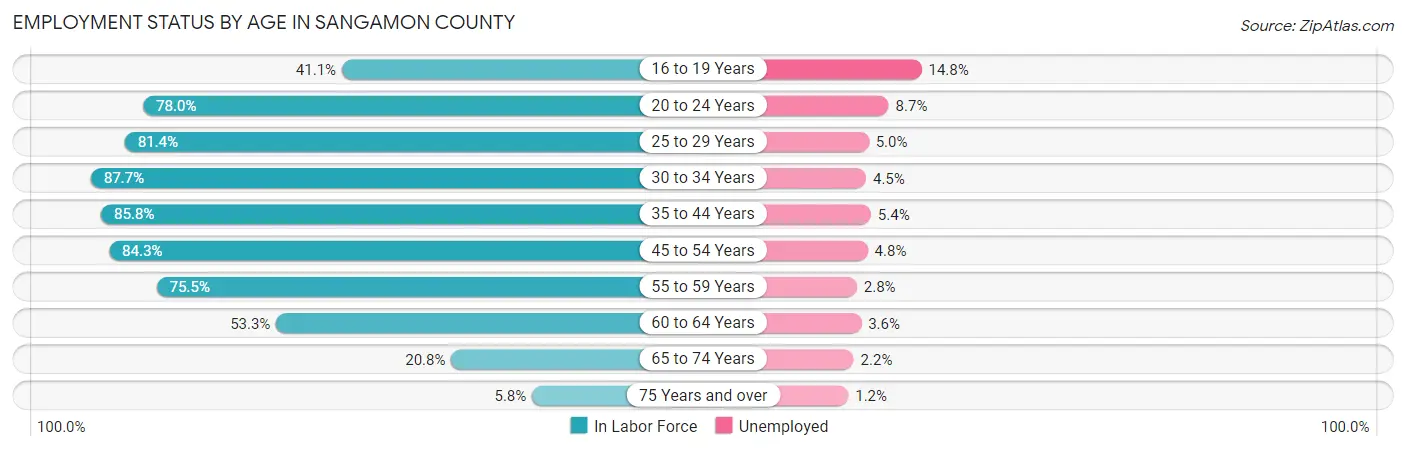
| Age Bracket | In Labor Force | Unemployed |
| 16 to 19 Years | 3,974 (41.1%) | 588 (14.8%) |
| 20 to 24 Years | 9,054 (78.0%) | 788 (8.7%) |
| 25 to 29 Years | 9,662 (81.4%) | 483 (5.0%) |
| 30 to 34 Years | 10,677 (87.7%) | 480 (4.5%) |
| 35 to 44 Years | 21,254 (85.8%) | 1,148 (5.4%) |
| 45 to 54 Years | 20,400 (84.3%) | 979 (4.8%) |
| 55 to 59 Years | 10,929 (75.5%) | 306 (2.8%) |
| 60 to 64 Years | 6,916 (53.3%) | 249 (3.6%) |
| 65 to 74 Years | 4,512 (20.8%) | 99 (2.2%) |
| 75 Years and over | 848 (5.8%) | 10 (1.2%) |
| Total | 98,156 (62.1%) | 5,104 (5.2%) |
Employment Status by Educational Attainment in Sangamon County
According to labor force statistics for Sangamon County, 79.4% of individuals (79,771) out of the total population between 25 and 64 years of age (100,467) are in the labor force, with 4.6% or 3,669 of them being unemployed. The group with the highest labor force participation rate are those with the educational attainment of bachelor's degree or higher, with 87.5% or 31,341 individuals in the labor force. Within the labor force, individuals with less than high school education have the highest percentage of unemployment, with 19.7% or 647 of them being unemployed.
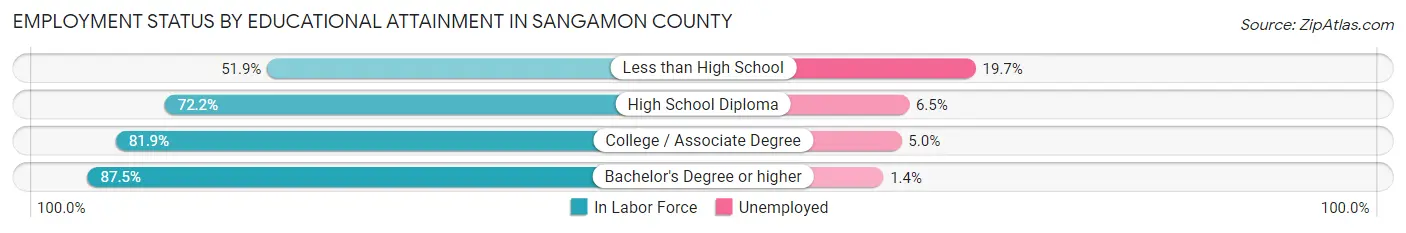
| Educational Attainment | In Labor Force | Unemployed |
| Less than High School | 3,283 (51.9%) | 1,246 (19.7%) |
| High School Diploma | 19,207 (72.2%) | 1,729 (6.5%) |
| College / Associate Degree | 25,979 (81.9%) | 1,586 (5.0%) |
| Bachelor's Degree or higher | 31,341 (87.5%) | 501 (1.4%) |
| Total | 79,771 (79.4%) | 4,621 (4.6%) |
Employment Occupations by Sex in Sangamon County
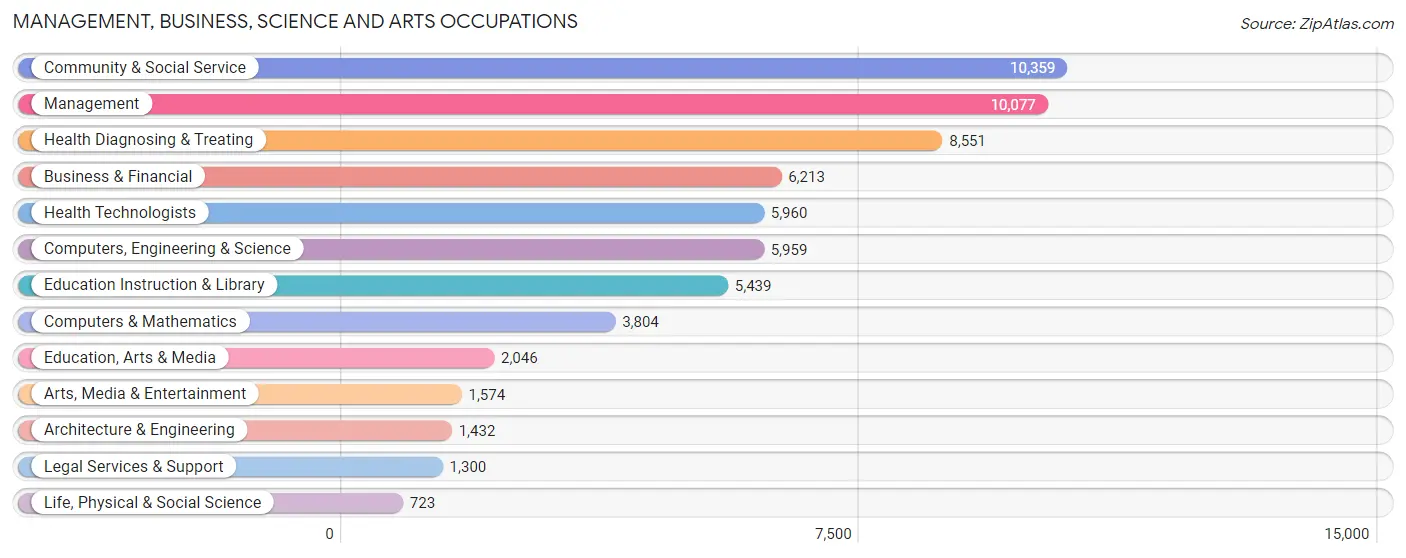
Management, Business, Science and Arts Occupations
The most common Management, Business, Science and Arts occupations in Sangamon County are Community & Social Service (10,359 | 11.2%), Management (10,077 | 10.9%), Health Diagnosing & Treating (8,551 | 9.2%), Business & Financial (6,213 | 6.7%), and Health Technologists (5,960 | 6.4%).
Management, Business, Science and Arts Occupations by Sex
Within the Management, Business, Science and Arts occupations in Sangamon County, the most male-oriented occupations are Architecture & Engineering (88.0%), Computers, Engineering & Science (71.8%), and Computers & Mathematics (69.3%), while the most female-oriented occupations are Health Diagnosing & Treating (76.1%), Health Technologists (74.3%), and Education Instruction & Library (70.3%).
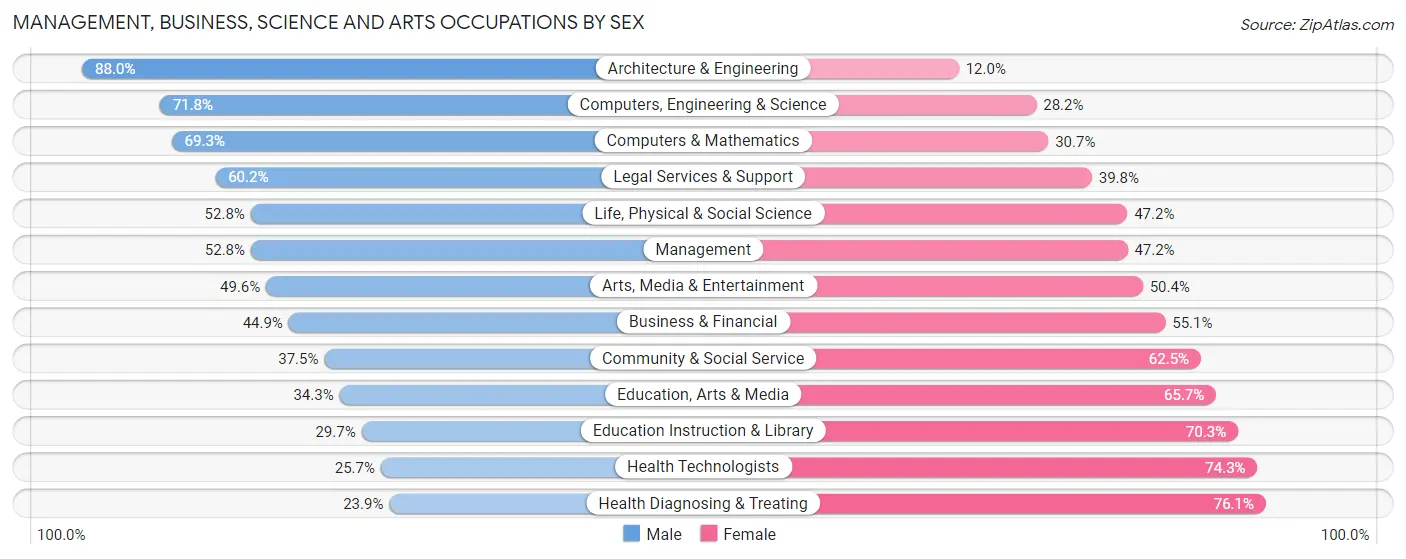
| Occupation | Male | Female |
| Management | 5,321 (52.8%) | 4,756 (47.2%) |
| Business & Financial | 2,790 (44.9%) | 3,423 (55.1%) |
| Computers, Engineering & Science | 4,279 (71.8%) | 1,680 (28.2%) |
| Computers & Mathematics | 2,637 (69.3%) | 1,167 (30.7%) |
| Architecture & Engineering | 1,260 (88.0%) | 172 (12.0%) |
| Life, Physical & Social Science | 382 (52.8%) | 341 (47.2%) |
| Community & Social Service | 3,883 (37.5%) | 6,476 (62.5%) |
| Education, Arts & Media | 702 (34.3%) | 1,344 (65.7%) |
| Legal Services & Support | 783 (60.2%) | 517 (39.8%) |
| Education Instruction & Library | 1,617 (29.7%) | 3,822 (70.3%) |
| Arts, Media & Entertainment | 781 (49.6%) | 793 (50.4%) |
| Health Diagnosing & Treating | 2,047 (23.9%) | 6,504 (76.1%) |
| Health Technologists | 1,531 (25.7%) | 4,429 (74.3%) |
| Total (Category) | 18,320 (44.5%) | 22,839 (55.5%) |
| Total (Overall) | 46,574 (50.2%) | 46,147 (49.8%) |
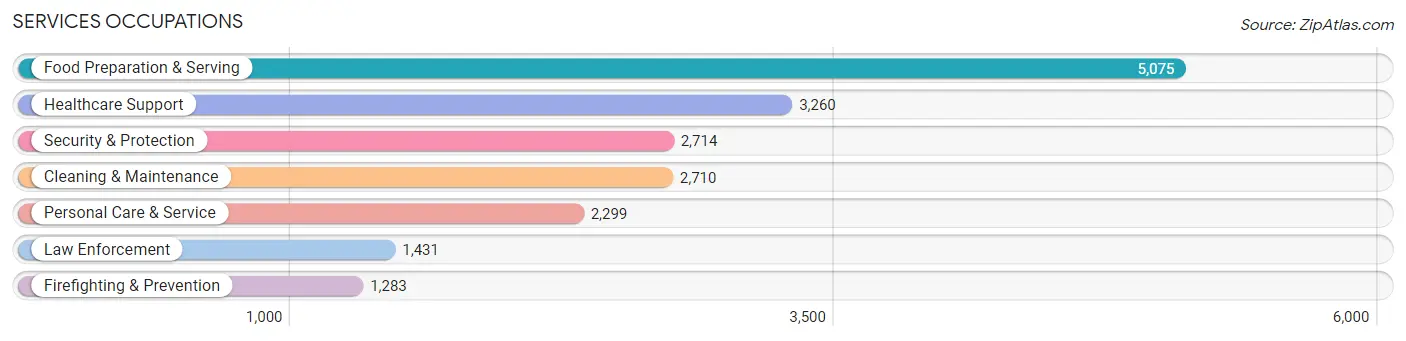
Services Occupations
The most common Services occupations in Sangamon County are Food Preparation & Serving (5,075 | 5.5%), Healthcare Support (3,260 | 3.5%), Security & Protection (2,714 | 2.9%), Cleaning & Maintenance (2,710 | 2.9%), and Personal Care & Service (2,299 | 2.5%).
Services Occupations by Sex
Within the Services occupations in Sangamon County, the most male-oriented occupations are Firefighting & Prevention (75.8%), Security & Protection (74.9%), and Law Enforcement (74.1%), while the most female-oriented occupations are Healthcare Support (89.2%), Personal Care & Service (79.1%), and Food Preparation & Serving (52.7%).
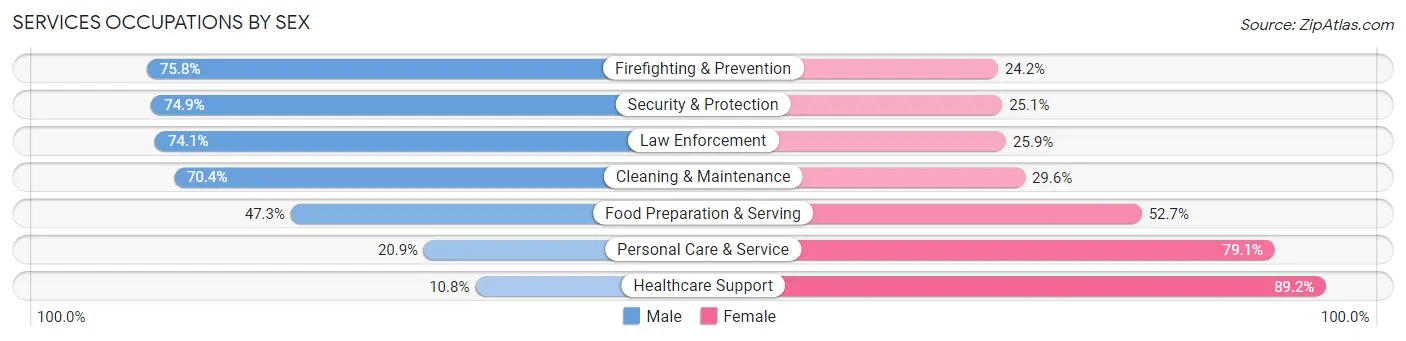
| Occupation | Male | Female |
| Healthcare Support | 351 (10.8%) | 2,909 (89.2%) |
| Security & Protection | 2,033 (74.9%) | 681 (25.1%) |
| Firefighting & Prevention | 972 (75.8%) | 311 (24.2%) |
| Law Enforcement | 1,061 (74.1%) | 370 (25.9%) |
| Food Preparation & Serving | 2,400 (47.3%) | 2,675 (52.7%) |
| Cleaning & Maintenance | 1,908 (70.4%) | 802 (29.6%) |
| Personal Care & Service | 481 (20.9%) | 1,818 (79.1%) |
| Total (Category) | 7,173 (44.7%) | 8,885 (55.3%) |
| Total (Overall) | 46,574 (50.2%) | 46,147 (49.8%) |
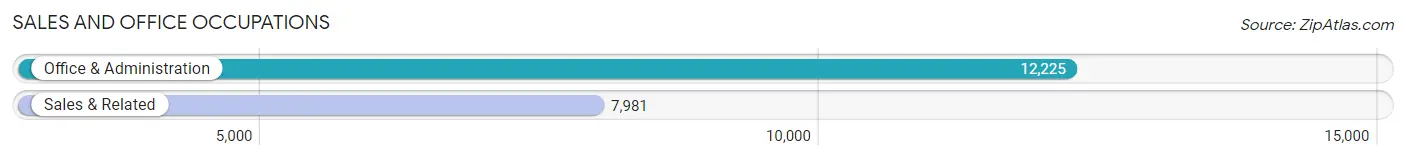
Sales and Office Occupations
The most common Sales and Office occupations in Sangamon County are Office & Administration (12,225 | 13.2%), and Sales & Related (7,981 | 8.6%).
Sales and Office Occupations by Sex
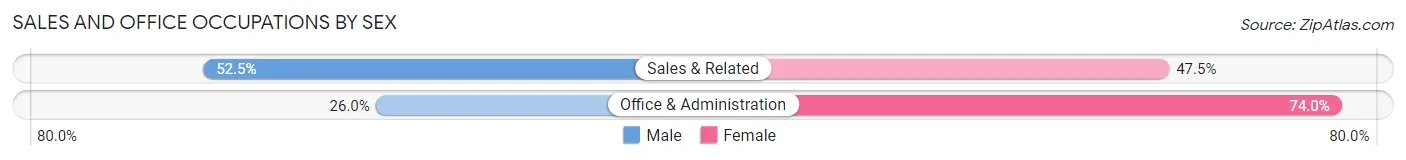
| Occupation | Male | Female |
| Sales & Related | 4,191 (52.5%) | 3,790 (47.5%) |
| Office & Administration | 3,179 (26.0%) | 9,046 (74.0%) |
| Total (Category) | 7,370 (36.5%) | 12,836 (63.5%) |
| Total (Overall) | 46,574 (50.2%) | 46,147 (49.8%) |
Natural Resources, Construction and Maintenance Occupations
The most common Natural Resources, Construction and Maintenance occupations in Sangamon County are Construction & Extraction (2,860 | 3.1%), Installation, Maintenance & Repair (2,588 | 2.8%), and Farming, Fishing & Forestry (314 | 0.3%).
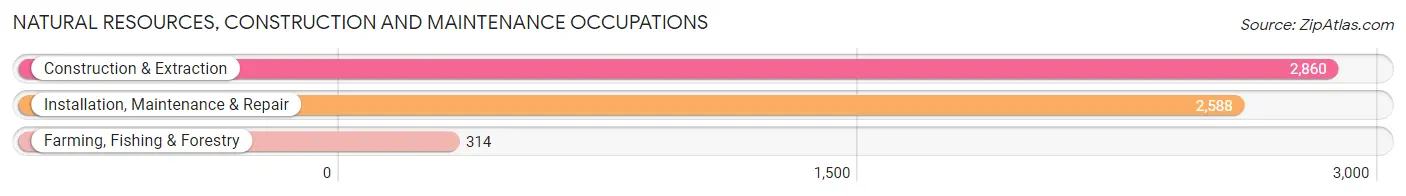
Natural Resources, Construction and Maintenance Occupations by Sex
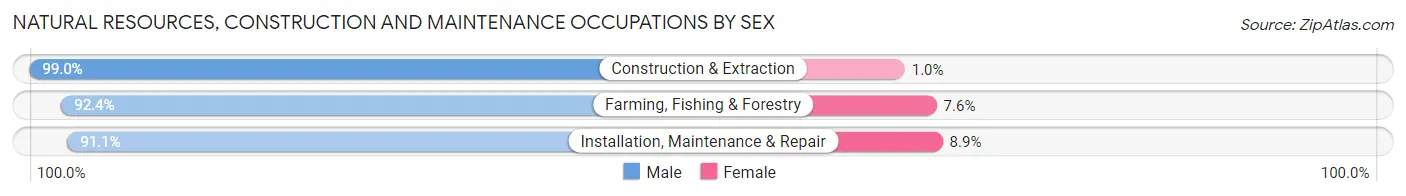
| Occupation | Male | Female |
| Farming, Fishing & Forestry | 290 (92.4%) | 24 (7.6%) |
| Construction & Extraction | 2,831 (99.0%) | 29 (1.0%) |
| Installation, Maintenance & Repair | 2,358 (91.1%) | 230 (8.9%) |
| Total (Category) | 5,479 (95.1%) | 283 (4.9%) |
| Total (Overall) | 46,574 (50.2%) | 46,147 (49.8%) |
Production, Transportation and Moving Occupations
The most common Production, Transportation and Moving occupations in Sangamon County are Production (3,734 | 4.0%), Transportation (3,421 | 3.7%), and Material Moving (2,381 | 2.6%).
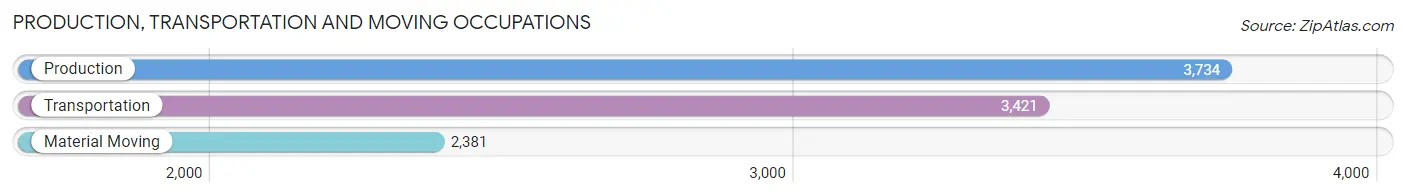
Production, Transportation and Moving Occupations by Sex
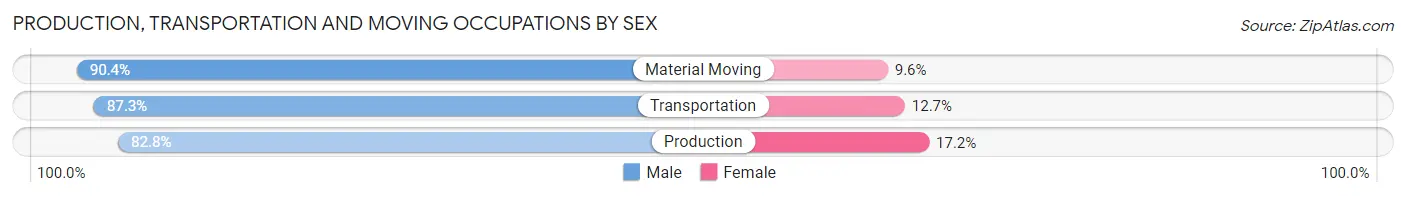
| Occupation | Male | Female |
| Production | 3,093 (82.8%) | 641 (17.2%) |
| Transportation | 2,986 (87.3%) | 435 (12.7%) |
| Material Moving | 2,153 (90.4%) | 228 (9.6%) |
| Total (Category) | 8,232 (86.3%) | 1,304 (13.7%) |
| Total (Overall) | 46,574 (50.2%) | 46,147 (49.8%) |
Employment Industries by Sex in Sangamon County
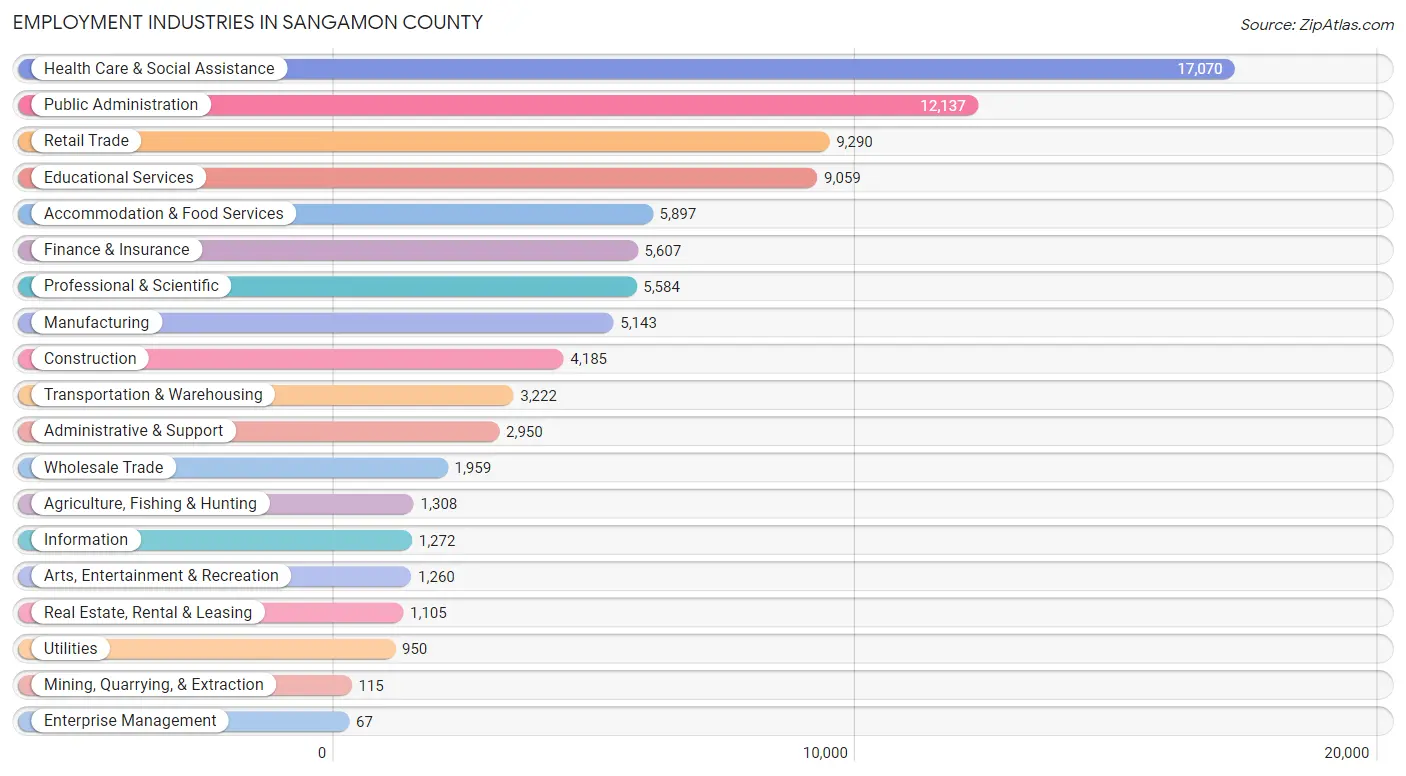
Employment Industries in Sangamon County
The major employment industries in Sangamon County include Health Care & Social Assistance (17,070 | 18.4%), Public Administration (12,137 | 13.1%), Retail Trade (9,290 | 10.0%), Educational Services (9,059 | 9.8%), and Accommodation & Food Services (5,897 | 6.4%).
Employment Industries by Sex in Sangamon County
The Sangamon County industries that see more men than women are Construction (92.7%), Mining, Quarrying, & Extraction (87.8%), and Agriculture, Fishing & Hunting (86.9%), whereas the industries that tend to have a higher number of women are Health Care & Social Assistance (75.3%), Educational Services (67.2%), and Finance & Insurance (61.0%).
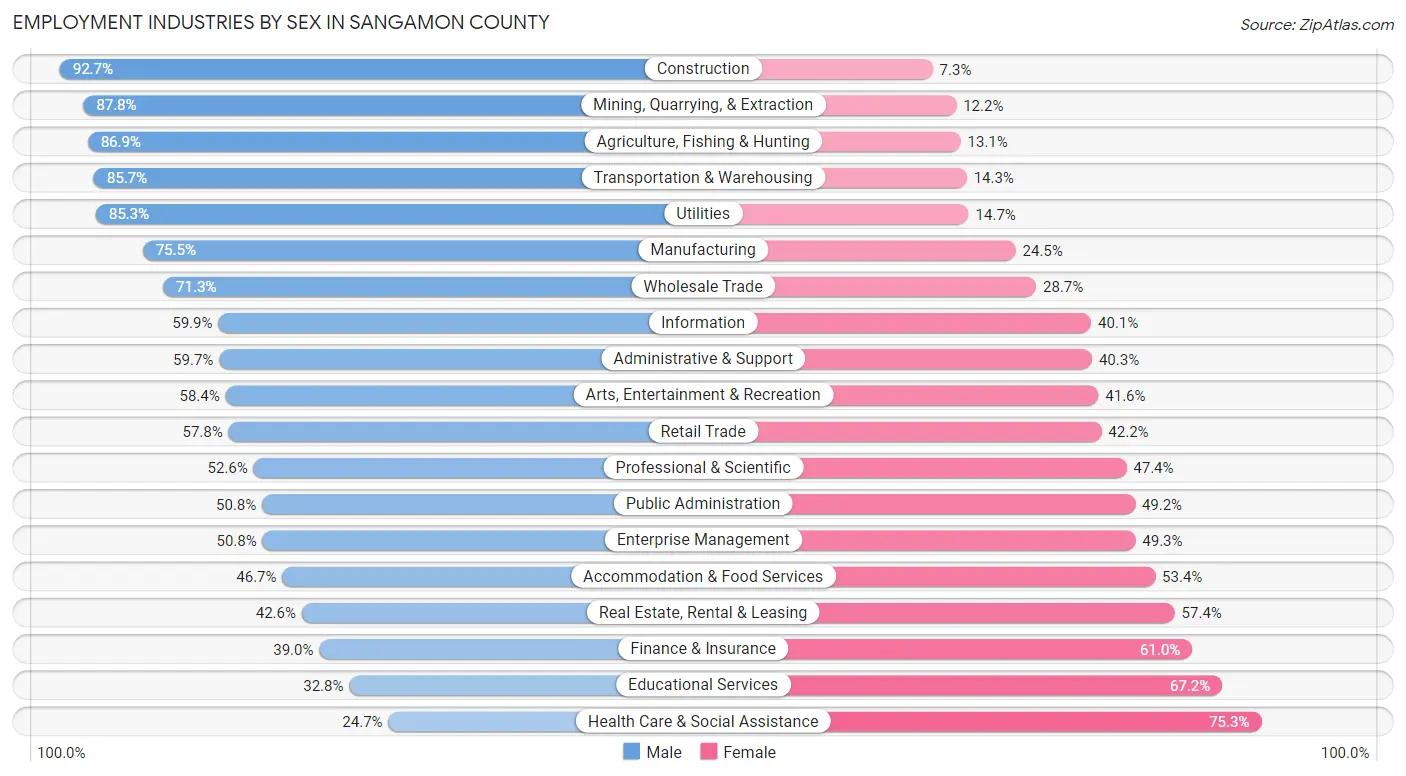
| Industry | Male | Female |
| Agriculture, Fishing & Hunting | 1,137 (86.9%) | 171 (13.1%) |
| Mining, Quarrying, & Extraction | 101 (87.8%) | 14 (12.2%) |
| Construction | 3,880 (92.7%) | 305 (7.3%) |
| Manufacturing | 3,885 (75.5%) | 1,258 (24.5%) |
| Wholesale Trade | 1,397 (71.3%) | 562 (28.7%) |
| Retail Trade | 5,368 (57.8%) | 3,922 (42.2%) |
| Transportation & Warehousing | 2,760 (85.7%) | 462 (14.3%) |
| Utilities | 810 (85.3%) | 140 (14.7%) |
| Information | 762 (59.9%) | 510 (40.1%) |
| Finance & Insurance | 2,187 (39.0%) | 3,420 (61.0%) |
| Real Estate, Rental & Leasing | 471 (42.6%) | 634 (57.4%) |
| Professional & Scientific | 2,938 (52.6%) | 2,646 (47.4%) |
| Enterprise Management | 34 (50.7%) | 33 (49.2%) |
| Administrative & Support | 1,762 (59.7%) | 1,188 (40.3%) |
| Educational Services | 2,971 (32.8%) | 6,088 (67.2%) |
| Health Care & Social Assistance | 4,217 (24.7%) | 12,853 (75.3%) |
| Arts, Entertainment & Recreation | 736 (58.4%) | 524 (41.6%) |
| Accommodation & Food Services | 2,751 (46.7%) | 3,146 (53.3%) |
| Public Administration | 6,170 (50.8%) | 5,967 (49.2%) |
| Total | 46,574 (50.2%) | 46,147 (49.8%) |
Education in Sangamon County
School Enrollment in Sangamon County
The most common levels of schooling among the 44,719 students in Sangamon County are high school (10,299 | 23.0%), elementary school (10,143 | 22.7%), and middle school (9,253 | 20.7%).
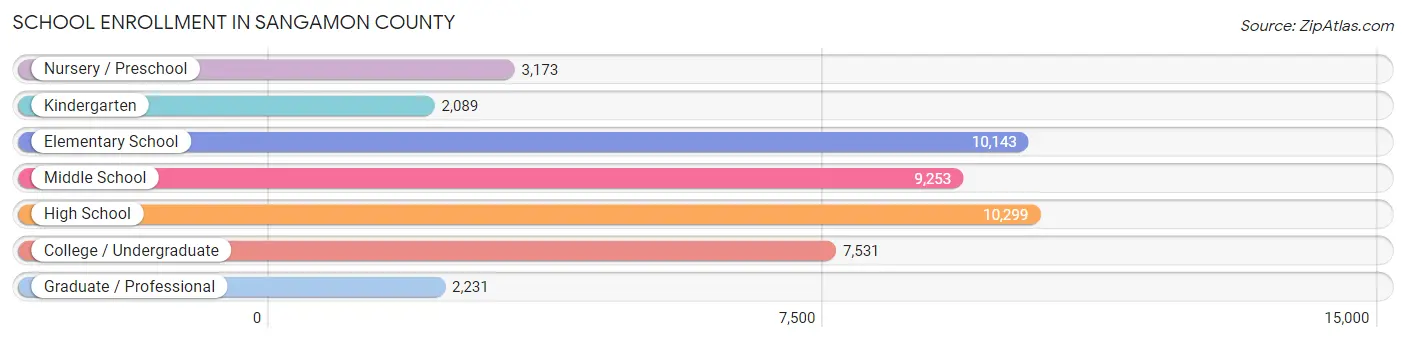
| School Level | # Students | % Students |
| Nursery / Preschool | 3,173 | 7.1% |
| Kindergarten | 2,089 | 4.7% |
| Elementary School | 10,143 | 22.7% |
| Middle School | 9,253 | 20.7% |
| High School | 10,299 | 23.0% |
| College / Undergraduate | 7,531 | 16.8% |
| Graduate / Professional | 2,231 | 5.0% |
| Total | 44,719 | 100.0% |
School Enrollment by Age by Funding Source in Sangamon County
Out of a total of 44,719 students who are enrolled in schools in Sangamon County, 7,736 (17.3%) attend a private institution, while the remaining 36,983 (82.7%) are enrolled in public schools. The age group of 3 to 4 year olds has the highest likelihood of being enrolled in private schools, with 1,029 (43.3% in the age bracket) enrolled. Conversely, the age group of 15 to 17 year olds has the lowest likelihood of being enrolled in a private school, with 6,918 (91.5% in the age bracket) attending a public institution.
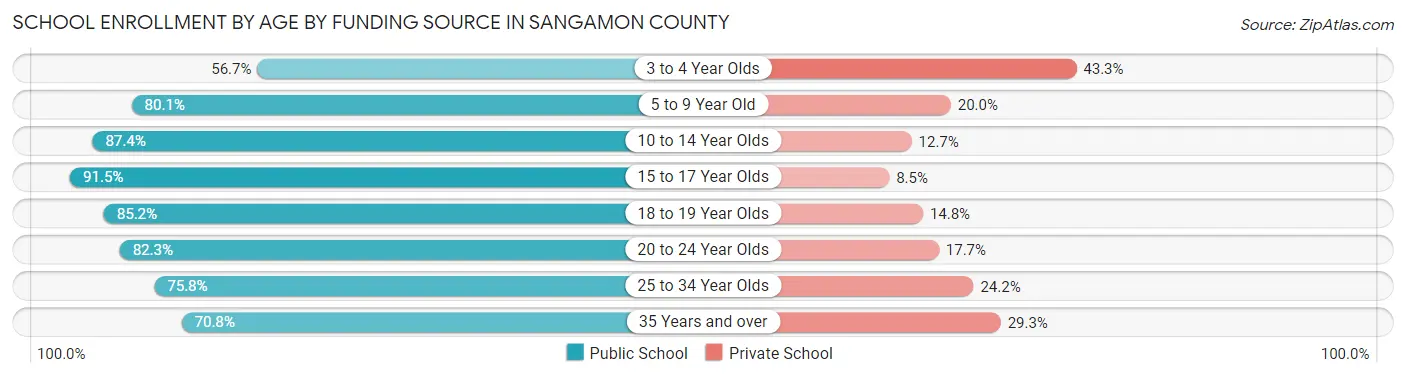
| Age Bracket | Public School | Private School |
| 3 to 4 Year Olds | 1,345 (56.7%) | 1,029 (43.3%) |
| 5 to 9 Year Old | 9,097 (80.0%) | 2,267 (20.0%) |
| 10 to 14 Year Olds | 10,528 (87.4%) | 1,525 (12.7%) |
| 15 to 17 Year Olds | 6,918 (91.5%) | 642 (8.5%) |
| 18 to 19 Year Olds | 2,943 (85.2%) | 510 (14.8%) |
| 20 to 24 Year Olds | 3,007 (82.3%) | 648 (17.7%) |
| 25 to 34 Year Olds | 1,812 (75.8%) | 578 (24.2%) |
| 35 Years and over | 1,323 (70.8%) | 547 (29.2%) |
| Total | 36,983 (82.7%) | 7,736 (17.3%) |
Educational Attainment by Field of Study in Sangamon County
Business (9,292 | 18.1%), education (6,941 | 13.5%), science & technology (5,879 | 11.5%), arts & humanities (4,187 | 8.2%), and social sciences (4,107 | 8.0%) are the most common fields of study among 51,266 individuals in Sangamon County who have obtained a bachelor's degree or higher.
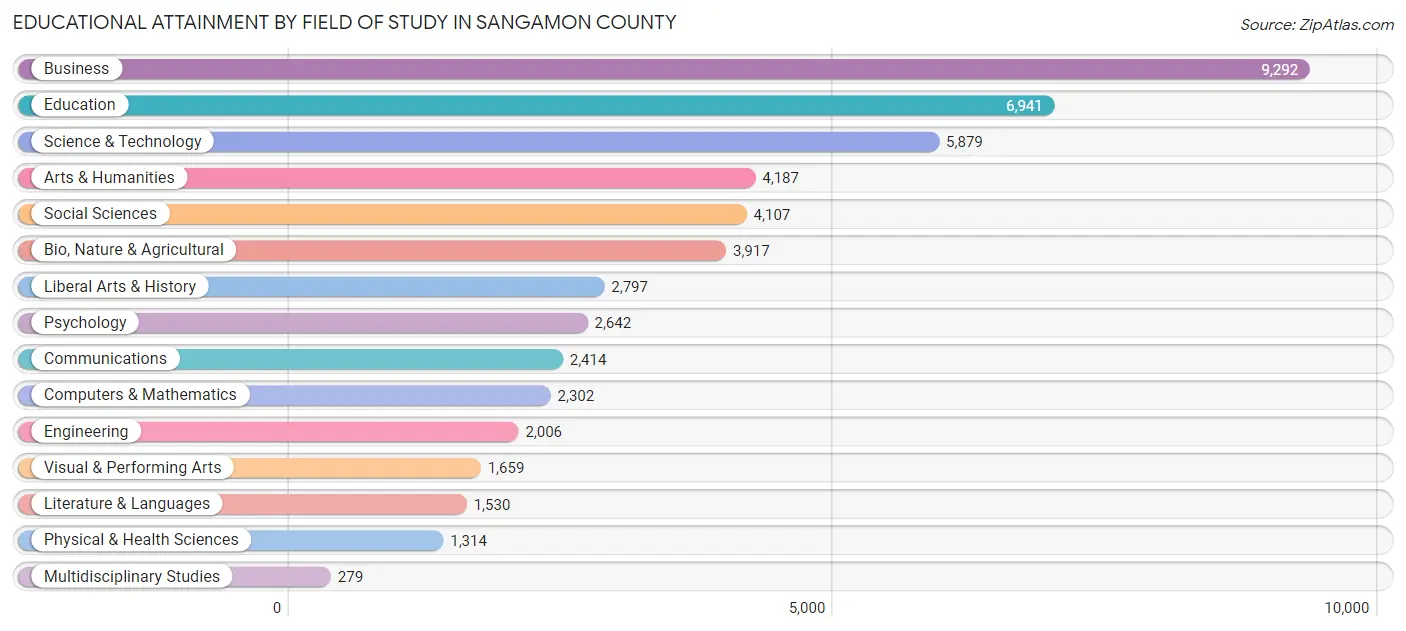
| Field of Study | # Graduates | % Graduates |
| Computers & Mathematics | 2,302 | 4.5% |
| Bio, Nature & Agricultural | 3,917 | 7.6% |
| Physical & Health Sciences | 1,314 | 2.6% |
| Psychology | 2,642 | 5.1% |
| Social Sciences | 4,107 | 8.0% |
| Engineering | 2,006 | 3.9% |
| Multidisciplinary Studies | 279 | 0.5% |
| Science & Technology | 5,879 | 11.5% |
| Business | 9,292 | 18.1% |
| Education | 6,941 | 13.5% |
| Literature & Languages | 1,530 | 3.0% |
| Liberal Arts & History | 2,797 | 5.5% |
| Visual & Performing Arts | 1,659 | 3.2% |
| Communications | 2,414 | 4.7% |
| Arts & Humanities | 4,187 | 8.2% |
| Total | 51,266 | 100.0% |
Transportation & Commute in Sangamon County
Vehicle Availability by Sex in Sangamon County
The most prevalent vehicle ownership categories in Sangamon County are males with 2 vehicles (20,318, accounting for 43.9%) and females with 2 vehicles (18,565, making up 44.7%).
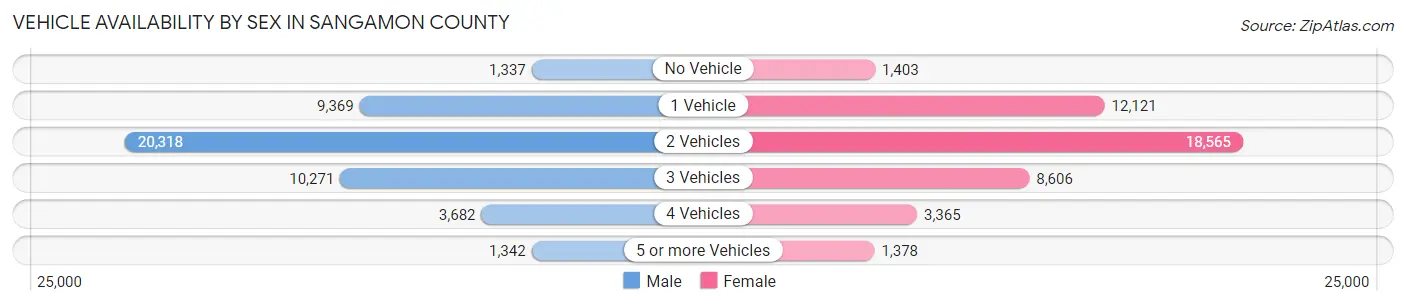
| Vehicles Available | Male | Female |
| No Vehicle | 1,337 (2.9%) | 1,403 (3.1%) |
| 1 Vehicle | 9,369 (20.2%) | 12,121 (26.7%) |
| 2 Vehicles | 20,318 (43.9%) | 18,565 (40.9%) |
| 3 Vehicles | 10,271 (22.2%) | 8,606 (18.9%) |
| 4 Vehicles | 3,682 (8.0%) | 3,365 (7.4%) |
| 5 or more Vehicles | 1,342 (2.9%) | 1,378 (3.0%) |
| Total | 46,319 (100.0%) | 45,438 (100.0%) |
Commute Time in Sangamon County
The most frequently occuring commute durations in Sangamon County are 15 to 19 minutes (21,574 commuters, 26.1%), 10 to 14 minutes (16,362 commuters, 19.8%), and 20 to 24 minutes (14,136 commuters, 17.1%).
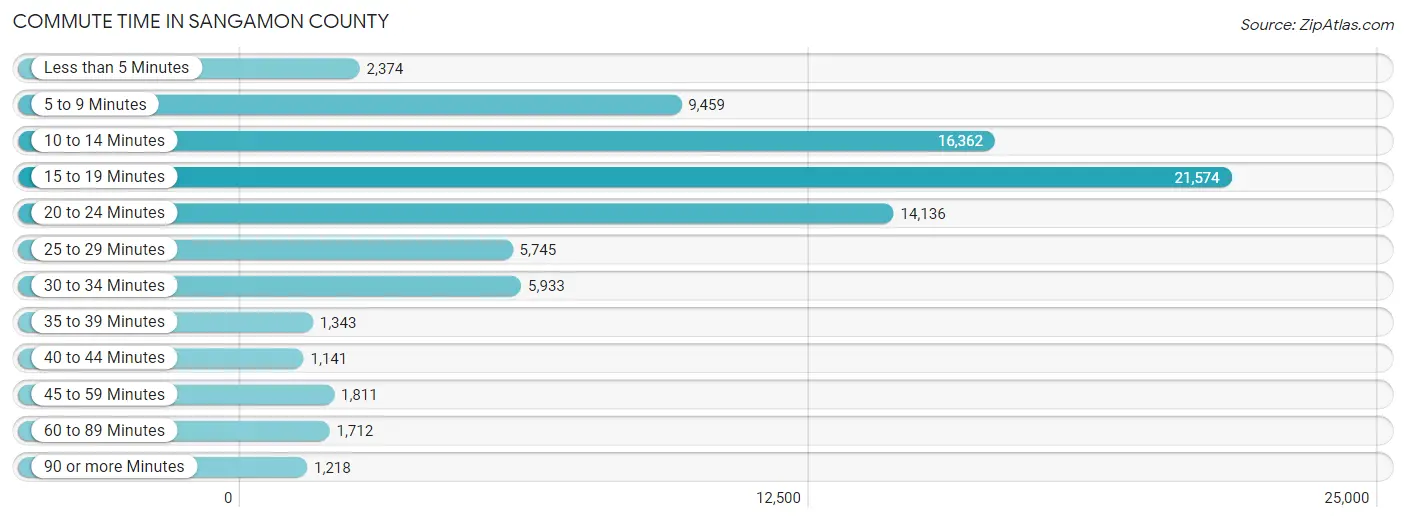
| Commute Time | # Commuters | % Commuters |
| Less than 5 Minutes | 2,374 | 2.9% |
| 5 to 9 Minutes | 9,459 | 11.4% |
| 10 to 14 Minutes | 16,362 | 19.8% |
| 15 to 19 Minutes | 21,574 | 26.1% |
| 20 to 24 Minutes | 14,136 | 17.1% |
| 25 to 29 Minutes | 5,745 | 6.9% |
| 30 to 34 Minutes | 5,933 | 7.2% |
| 35 to 39 Minutes | 1,343 | 1.6% |
| 40 to 44 Minutes | 1,141 | 1.4% |
| 45 to 59 Minutes | 1,811 | 2.2% |
| 60 to 89 Minutes | 1,712 | 2.1% |
| 90 or more Minutes | 1,218 | 1.5% |
Commute Time by Sex in Sangamon County
The most common commute times in Sangamon County are 15 to 19 minutes (11,022 commuters, 25.9%) for males and 15 to 19 minutes (10,552 commuters, 26.3%) for females.
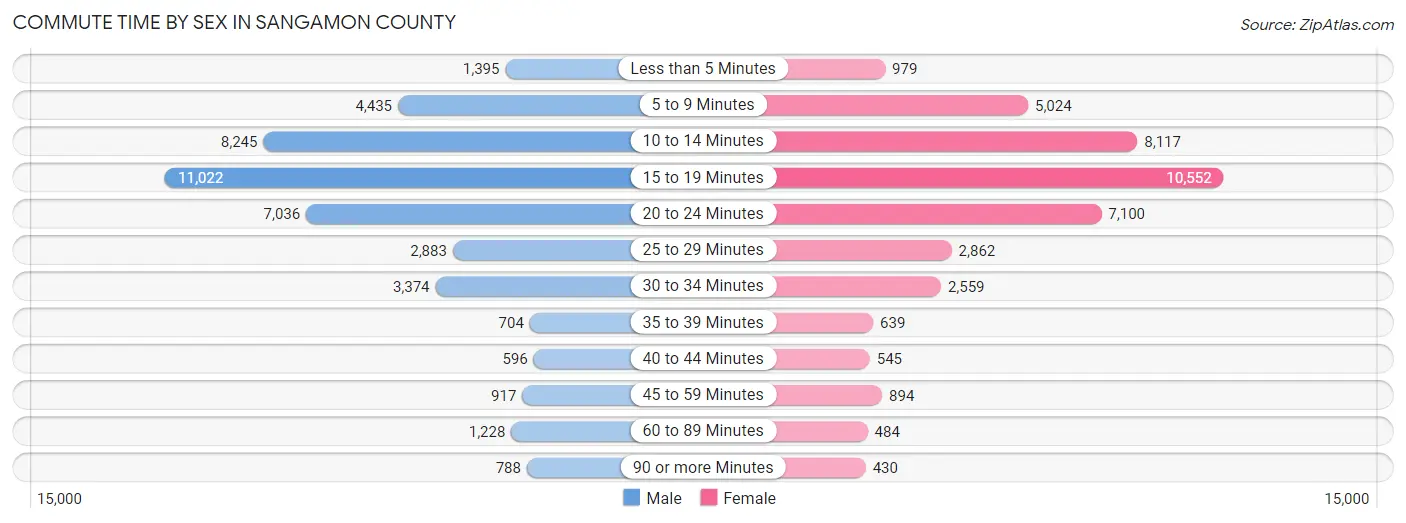
| Commute Time | Male | Female |
| Less than 5 Minutes | 1,395 (3.3%) | 979 (2.4%) |
| 5 to 9 Minutes | 4,435 (10.4%) | 5,024 (12.5%) |
| 10 to 14 Minutes | 8,245 (19.3%) | 8,117 (20.2%) |
| 15 to 19 Minutes | 11,022 (25.9%) | 10,552 (26.3%) |
| 20 to 24 Minutes | 7,036 (16.5%) | 7,100 (17.7%) |
| 25 to 29 Minutes | 2,883 (6.8%) | 2,862 (7.1%) |
| 30 to 34 Minutes | 3,374 (7.9%) | 2,559 (6.4%) |
| 35 to 39 Minutes | 704 (1.7%) | 639 (1.6%) |
| 40 to 44 Minutes | 596 (1.4%) | 545 (1.4%) |
| 45 to 59 Minutes | 917 (2.1%) | 894 (2.2%) |
| 60 to 89 Minutes | 1,228 (2.9%) | 484 (1.2%) |
| 90 or more Minutes | 788 (1.8%) | 430 (1.1%) |
Time of Departure to Work by Sex in Sangamon County
The most frequent times of departure to work in Sangamon County are 7:30 AM to 7:59 AM (6,981, 16.4%) for males and 7:30 AM to 7:59 AM (8,512, 21.2%) for females.
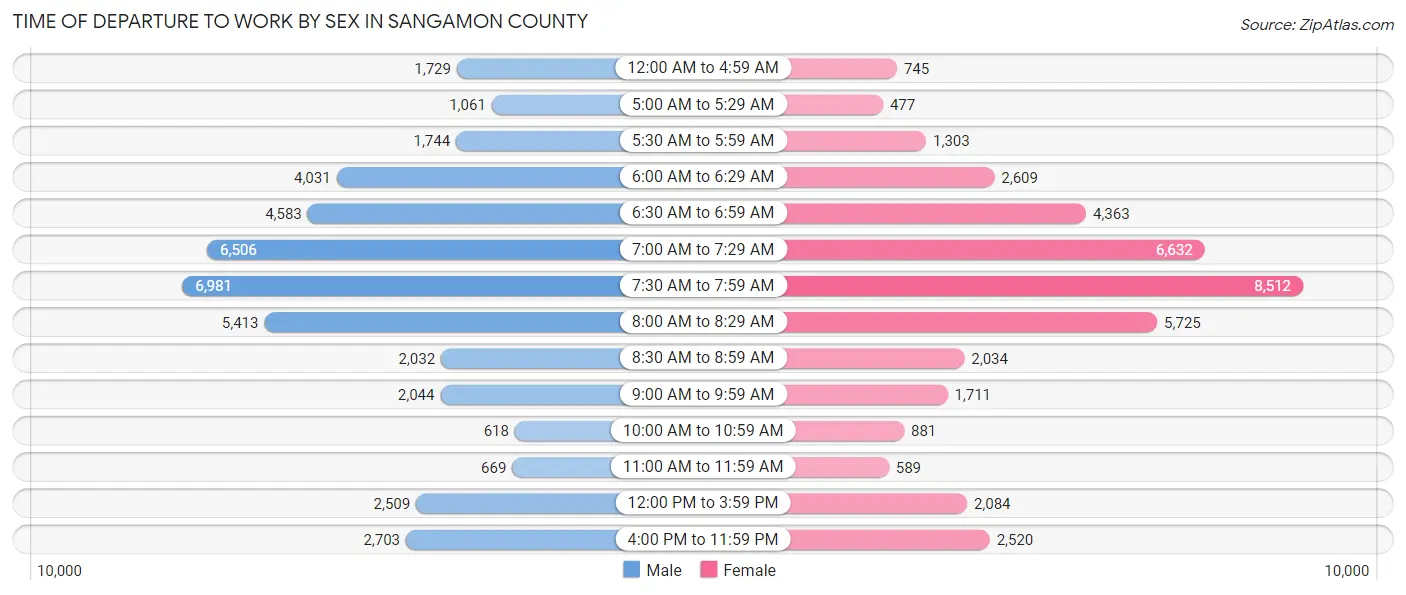
| Time of Departure | Male | Female |
| 12:00 AM to 4:59 AM | 1,729 (4.1%) | 745 (1.8%) |
| 5:00 AM to 5:29 AM | 1,061 (2.5%) | 477 (1.2%) |
| 5:30 AM to 5:59 AM | 1,744 (4.1%) | 1,303 (3.2%) |
| 6:00 AM to 6:29 AM | 4,031 (9.5%) | 2,609 (6.5%) |
| 6:30 AM to 6:59 AM | 4,583 (10.7%) | 4,363 (10.9%) |
| 7:00 AM to 7:29 AM | 6,506 (15.3%) | 6,632 (16.5%) |
| 7:30 AM to 7:59 AM | 6,981 (16.4%) | 8,512 (21.2%) |
| 8:00 AM to 8:29 AM | 5,413 (12.7%) | 5,725 (14.2%) |
| 8:30 AM to 8:59 AM | 2,032 (4.8%) | 2,034 (5.1%) |
| 9:00 AM to 9:59 AM | 2,044 (4.8%) | 1,711 (4.3%) |
| 10:00 AM to 10:59 AM | 618 (1.5%) | 881 (2.2%) |
| 11:00 AM to 11:59 AM | 669 (1.6%) | 589 (1.5%) |
| 12:00 PM to 3:59 PM | 2,509 (5.9%) | 2,084 (5.2%) |
| 4:00 PM to 11:59 PM | 2,703 (6.3%) | 2,520 (6.3%) |
| Total | 42,623 (100.0%) | 40,185 (100.0%) |
Housing Occupancy in Sangamon County
Occupancy by Ownership in Sangamon County
Of the total 84,017 dwellings in Sangamon County, owner-occupied units account for 58,870 (70.1%), while renter-occupied units make up 25,147 (29.9%).
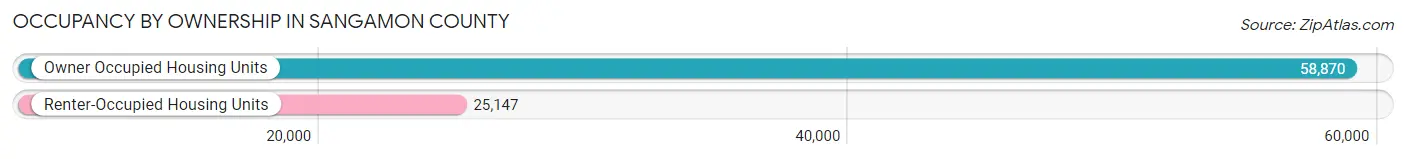
| Occupancy | # Housing Units | % Housing Units |
| Owner Occupied Housing Units | 58,870 | 70.1% |
| Renter-Occupied Housing Units | 25,147 | 29.9% |
| Total Occupied Housing Units | 84,017 | 100.0% |
Occupancy by Household Size in Sangamon County
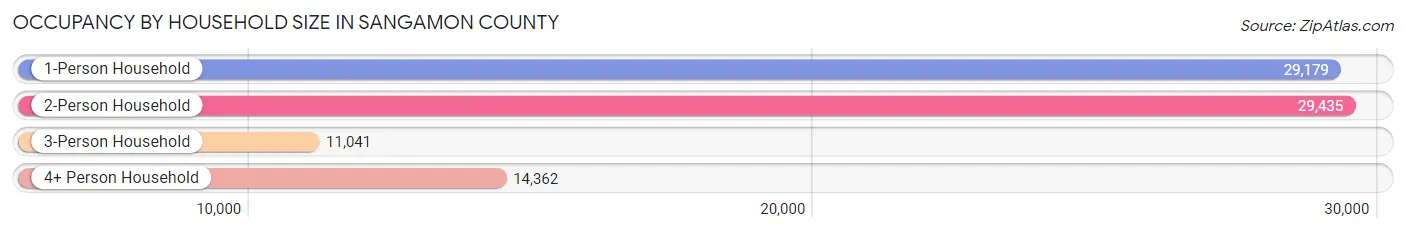
| Household Size | # Housing Units | % Housing Units |
| 1-Person Household | 29,179 | 34.7% |
| 2-Person Household | 29,435 | 35.0% |
| 3-Person Household | 11,041 | 13.1% |
| 4+ Person Household | 14,362 | 17.1% |
| Total Housing Units | 84,017 | 100.0% |
Occupancy by Ownership by Household Size in Sangamon County
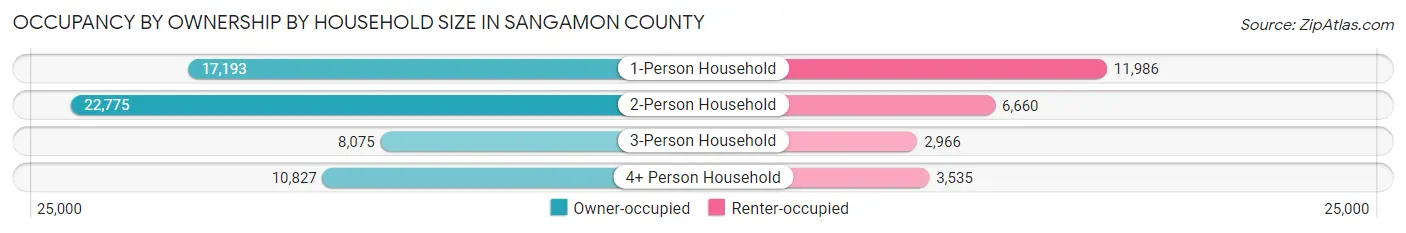
| Household Size | Owner-occupied | Renter-occupied |
| 1-Person Household | 17,193 (58.9%) | 11,986 (41.1%) |
| 2-Person Household | 22,775 (77.4%) | 6,660 (22.6%) |
| 3-Person Household | 8,075 (73.1%) | 2,966 (26.9%) |
| 4+ Person Household | 10,827 (75.4%) | 3,535 (24.6%) |
| Total Housing Units | 58,870 (70.1%) | 25,147 (29.9%) |
Occupancy by Educational Attainment in Sangamon County
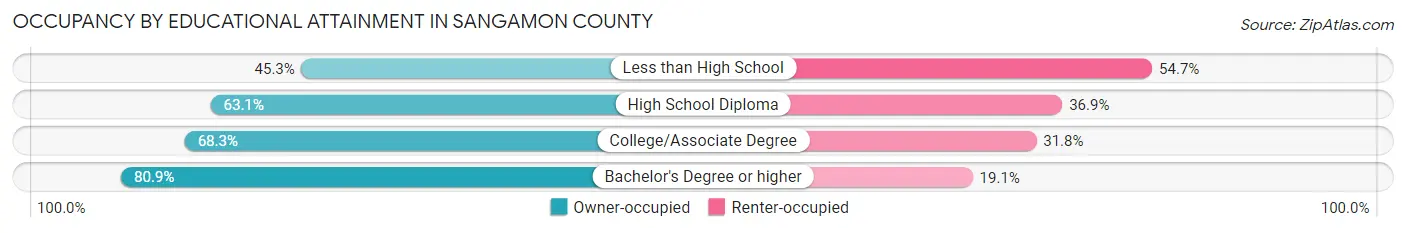
| Household Size | Owner-occupied | Renter-occupied |
| Less than High School | 2,288 (45.3%) | 2,765 (54.7%) |
| High School Diploma | 14,211 (63.1%) | 8,308 (36.9%) |
| College/Associate Degree | 17,717 (68.2%) | 8,242 (31.8%) |
| Bachelor's Degree or higher | 24,654 (80.9%) | 5,832 (19.1%) |
Occupancy by Age of Householder in Sangamon County
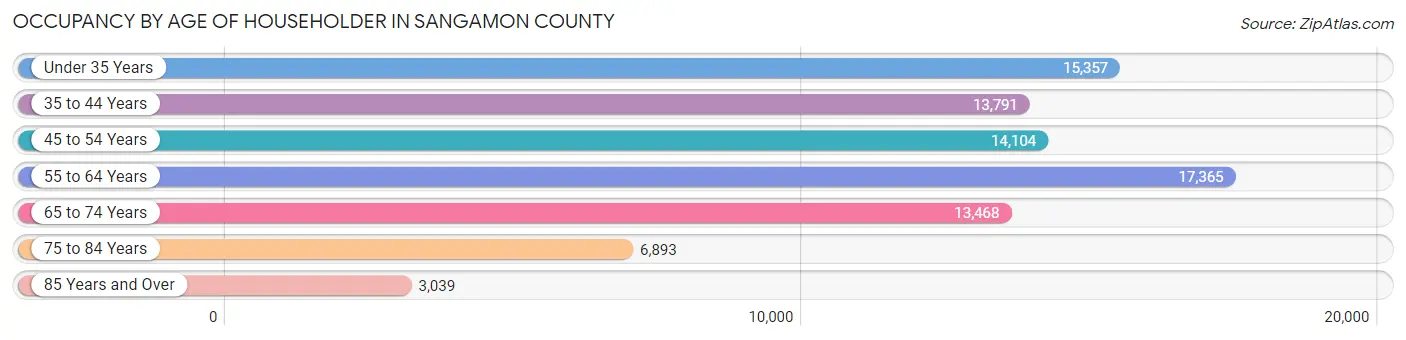
| Age Bracket | # Households | % Households |
| Under 35 Years | 15,357 | 18.3% |
| 35 to 44 Years | 13,791 | 16.4% |
| 45 to 54 Years | 14,104 | 16.8% |
| 55 to 64 Years | 17,365 | 20.7% |
| 65 to 74 Years | 13,468 | 16.0% |
| 75 to 84 Years | 6,893 | 8.2% |
| 85 Years and Over | 3,039 | 3.6% |
| Total | 84,017 | 100.0% |
Housing Finances in Sangamon County
Median Income by Occupancy in Sangamon County
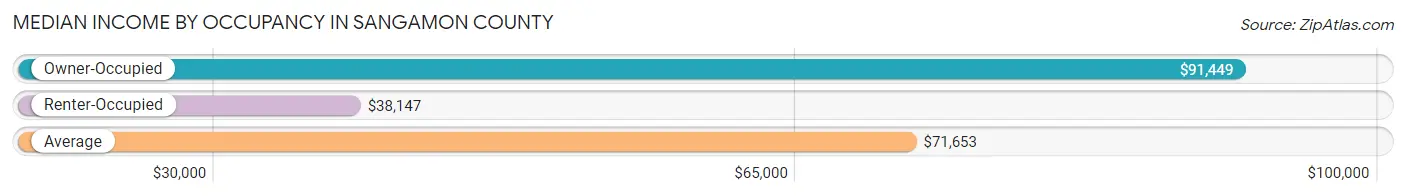
| Occupancy Type | # Households | Median Income |
| Owner-Occupied | 58,870 (70.1%) | $91,449 |
| Renter-Occupied | 25,147 (29.9%) | $38,147 |
| Average | 84,017 (100.0%) | $71,653 |
Occupancy by Householder Income Bracket in Sangamon County
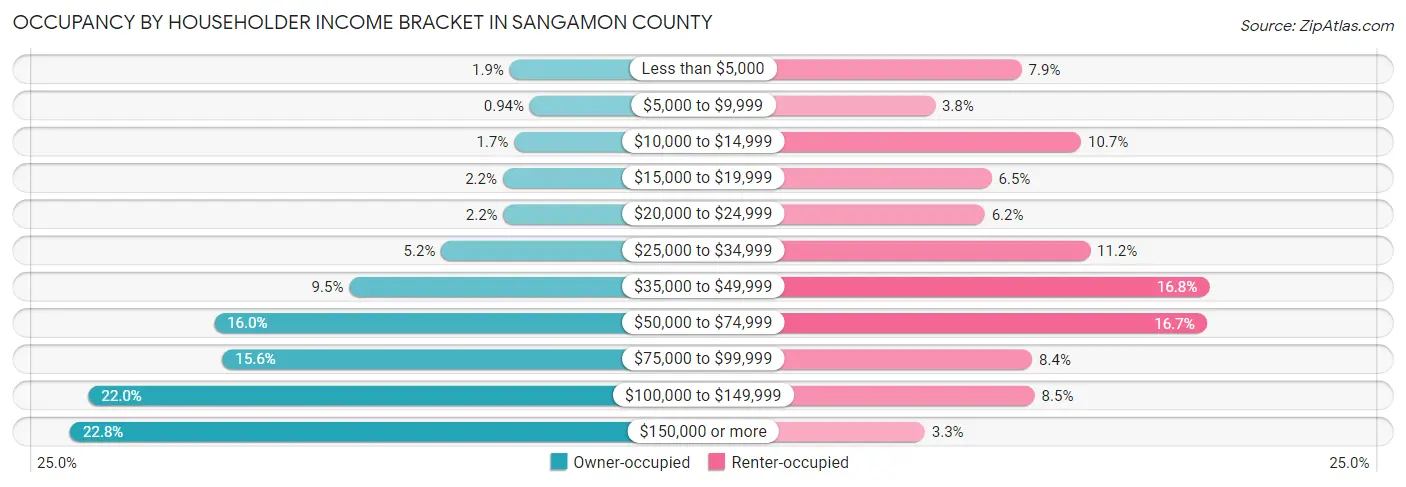
| Income Bracket | Owner-occupied | Renter-occupied |
| Less than $5,000 | 1,117 (1.9%) | 1,990 (7.9%) |
| $5,000 to $9,999 | 552 (0.9%) | 950 (3.8%) |
| $10,000 to $14,999 | 996 (1.7%) | 2,700 (10.7%) |
| $15,000 to $19,999 | 1,312 (2.2%) | 1,630 (6.5%) |
| $20,000 to $24,999 | 1,295 (2.2%) | 1,547 (6.1%) |
| $25,000 to $34,999 | 3,037 (5.2%) | 2,808 (11.2%) |
| $35,000 to $49,999 | 5,616 (9.5%) | 4,231 (16.8%) |
| $50,000 to $74,999 | 9,402 (16.0%) | 4,203 (16.7%) |
| $75,000 to $99,999 | 9,170 (15.6%) | 2,114 (8.4%) |
| $100,000 to $149,999 | 12,926 (22.0%) | 2,145 (8.5%) |
| $150,000 or more | 13,447 (22.8%) | 829 (3.3%) |
| Total | 58,870 (100.0%) | 25,147 (100.0%) |
Monthly Housing Cost Tiers in Sangamon County
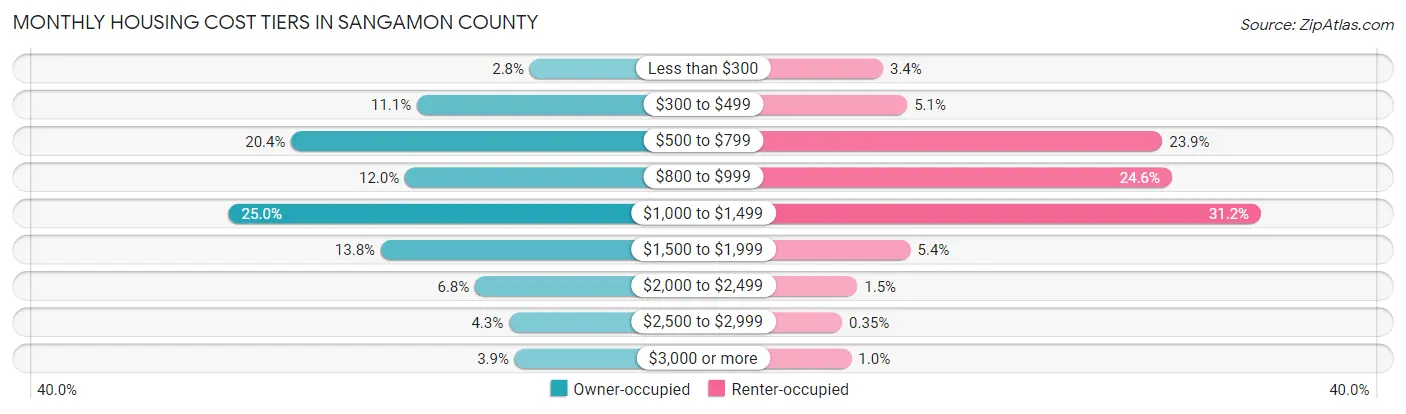
| Monthly Cost | Owner-occupied | Renter-occupied |
| Less than $300 | 1,645 (2.8%) | 845 (3.4%) |
| $300 to $499 | 6,534 (11.1%) | 1,293 (5.1%) |
| $500 to $799 | 11,985 (20.4%) | 6,018 (23.9%) |
| $800 to $999 | 7,054 (12.0%) | 6,193 (24.6%) |
| $1,000 to $1,499 | 14,702 (25.0%) | 7,844 (31.2%) |
| $1,500 to $1,999 | 8,103 (13.8%) | 1,356 (5.4%) |
| $2,000 to $2,499 | 4,012 (6.8%) | 370 (1.5%) |
| $2,500 to $2,999 | 2,542 (4.3%) | 88 (0.4%) |
| $3,000 or more | 2,293 (3.9%) | 258 (1.0%) |
| Total | 58,870 (100.0%) | 25,147 (100.0%) |
Physical Housing Characteristics in Sangamon County
Housing Structures in Sangamon County
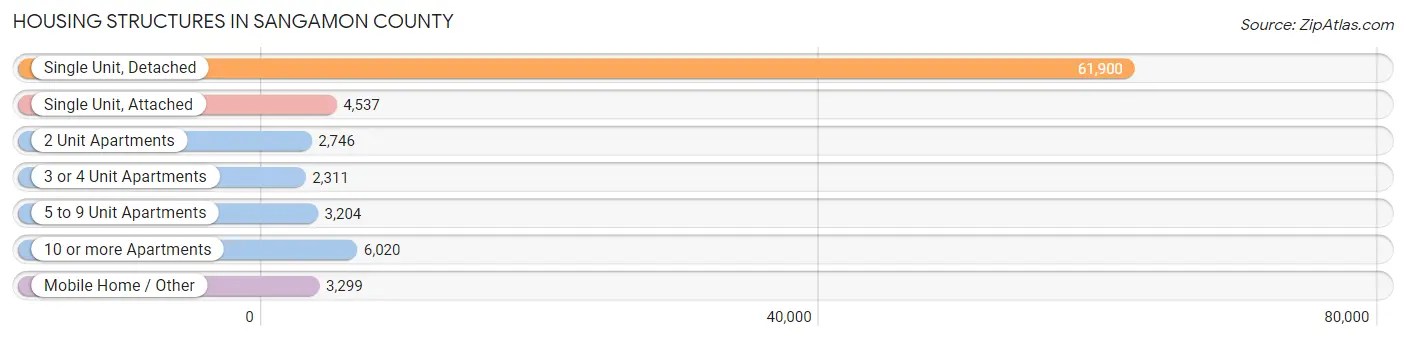
| Structure Type | # Housing Units | % Housing Units |
| Single Unit, Detached | 61,900 | 73.7% |
| Single Unit, Attached | 4,537 | 5.4% |
| 2 Unit Apartments | 2,746 | 3.3% |
| 3 or 4 Unit Apartments | 2,311 | 2.8% |
| 5 to 9 Unit Apartments | 3,204 | 3.8% |
| 10 or more Apartments | 6,020 | 7.2% |
| Mobile Home / Other | 3,299 | 3.9% |
| Total | 84,017 | 100.0% |
Housing Structures by Occupancy in Sangamon County
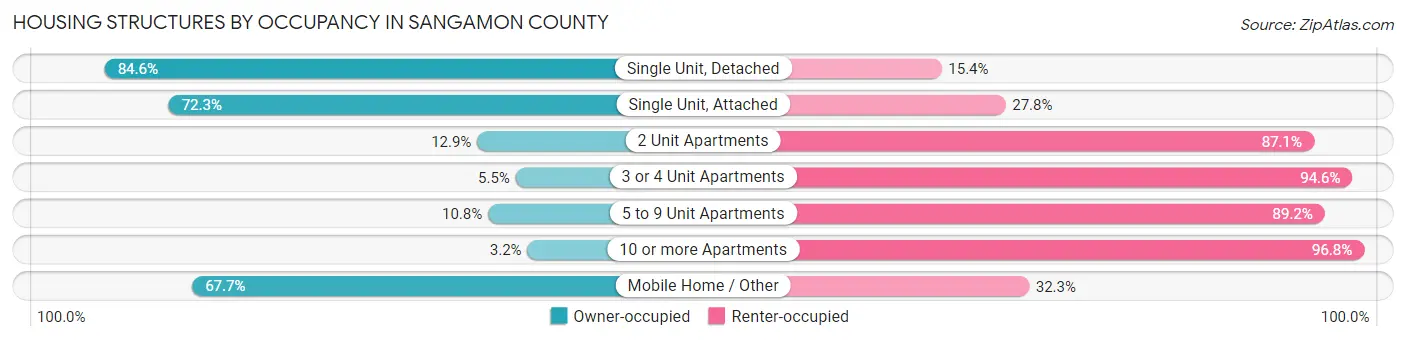
| Structure Type | Owner-occupied | Renter-occupied |
| Single Unit, Detached | 52,342 (84.6%) | 9,558 (15.4%) |
| Single Unit, Attached | 3,278 (72.3%) | 1,259 (27.8%) |
| 2 Unit Apartments | 353 (12.9%) | 2,393 (87.1%) |
| 3 or 4 Unit Apartments | 126 (5.4%) | 2,185 (94.6%) |
| 5 to 9 Unit Apartments | 345 (10.8%) | 2,859 (89.2%) |
| 10 or more Apartments | 192 (3.2%) | 5,828 (96.8%) |
| Mobile Home / Other | 2,234 (67.7%) | 1,065 (32.3%) |
| Total | 58,870 (70.1%) | 25,147 (29.9%) |
Housing Structures by Number of Rooms in Sangamon County
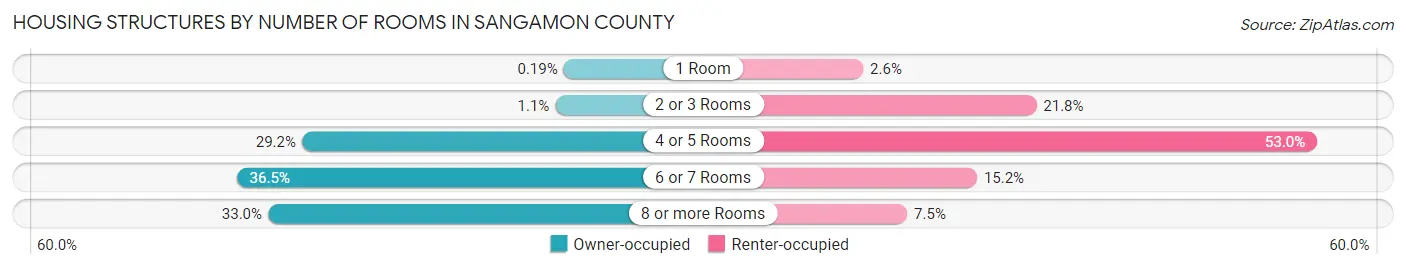
| Number of Rooms | Owner-occupied | Renter-occupied |
| 1 Room | 114 (0.2%) | 649 (2.6%) |
| 2 or 3 Rooms | 655 (1.1%) | 5,483 (21.8%) |
| 4 or 5 Rooms | 17,214 (29.2%) | 13,316 (52.9%) |
| 6 or 7 Rooms | 21,462 (36.5%) | 3,824 (15.2%) |
| 8 or more Rooms | 19,425 (33.0%) | 1,875 (7.5%) |
| Total | 58,870 (100.0%) | 25,147 (100.0%) |
Housing Structure by Heating Type in Sangamon County
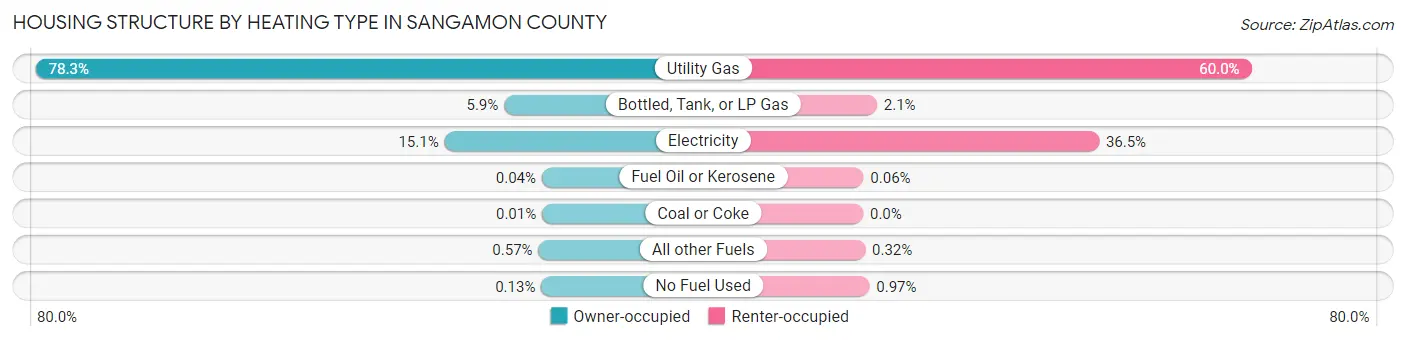
| Heating Type | Owner-occupied | Renter-occupied |
| Utility Gas | 46,087 (78.3%) | 15,097 (60.0%) |
| Bottled, Tank, or LP Gas | 3,456 (5.9%) | 538 (2.1%) |
| Electricity | 8,885 (15.1%) | 9,172 (36.5%) |
| Fuel Oil or Kerosene | 21 (0.0%) | 15 (0.1%) |
| Coal or Coke | 7 (0.0%) | 0 (0.0%) |
| All other Fuels | 338 (0.6%) | 80 (0.3%) |
| No Fuel Used | 76 (0.1%) | 245 (1.0%) |
| Total | 58,870 (100.0%) | 25,147 (100.0%) |
Household Vehicle Usage in Sangamon County
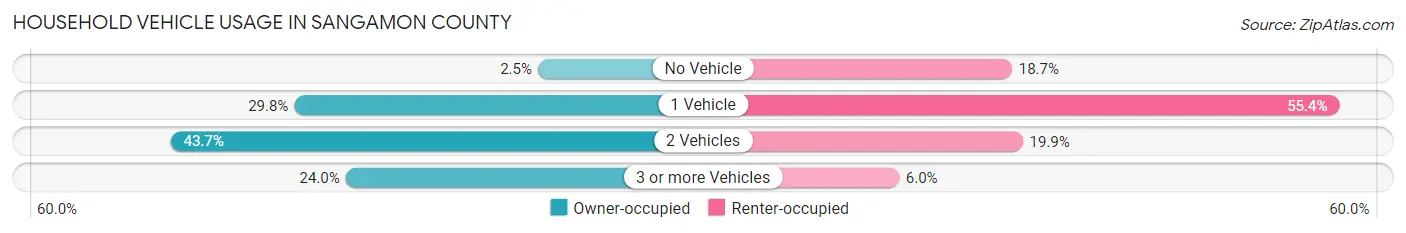
| Vehicles per Household | Owner-occupied | Renter-occupied |
| No Vehicle | 1,475 (2.5%) | 4,701 (18.7%) |
| 1 Vehicle | 17,546 (29.8%) | 13,923 (55.4%) |
| 2 Vehicles | 25,697 (43.6%) | 5,005 (19.9%) |
| 3 or more Vehicles | 14,152 (24.0%) | 1,518 (6.0%) |
| Total | 58,870 (100.0%) | 25,147 (100.0%) |
Real Estate & Mortgages in Sangamon County
Real Estate and Mortgage Overview in Sangamon County
| Characteristic | Without Mortgage | With Mortgage |
| Housing Units | 23,501 | 35,369 |
| Median Property Value | $147,400 | $172,100 |
| Median Household Income | $76,508 | $9,172 |
| Monthly Housing Costs | $604 | $2,184 |
| Real Estate Taxes | $2,857 | $318 |
Property Value by Mortgage Status in Sangamon County
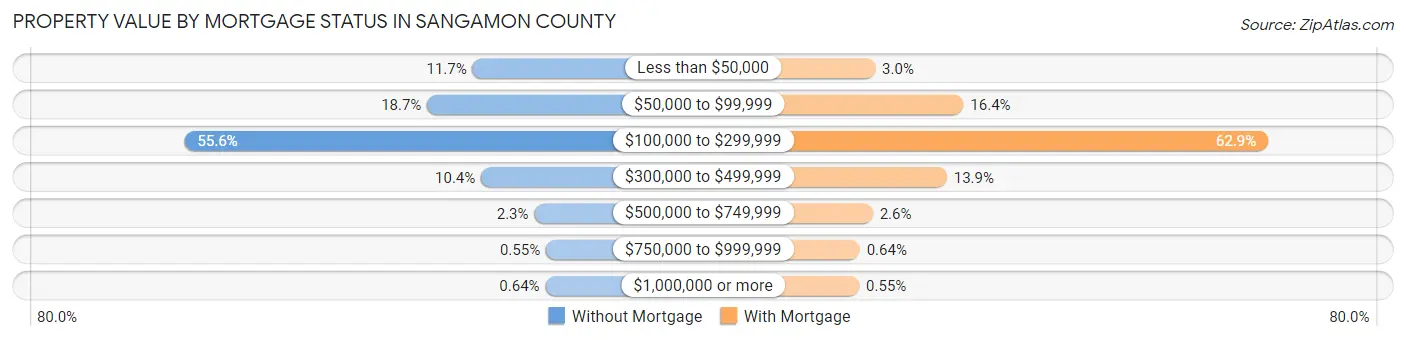
| Property Value | Without Mortgage | With Mortgage |
| Less than $50,000 | 2,760 (11.7%) | 1,057 (3.0%) |
| $50,000 to $99,999 | 4,384 (18.6%) | 5,813 (16.4%) |
| $100,000 to $299,999 | 13,076 (55.6%) | 22,231 (62.8%) |
| $300,000 to $499,999 | 2,454 (10.4%) | 4,921 (13.9%) |
| $500,000 to $749,999 | 546 (2.3%) | 925 (2.6%) |
| $750,000 to $999,999 | 130 (0.5%) | 227 (0.6%) |
| $1,000,000 or more | 151 (0.6%) | 195 (0.5%) |
| Total | 23,501 (100.0%) | 35,369 (100.0%) |
Household Income by Mortgage Status in Sangamon County
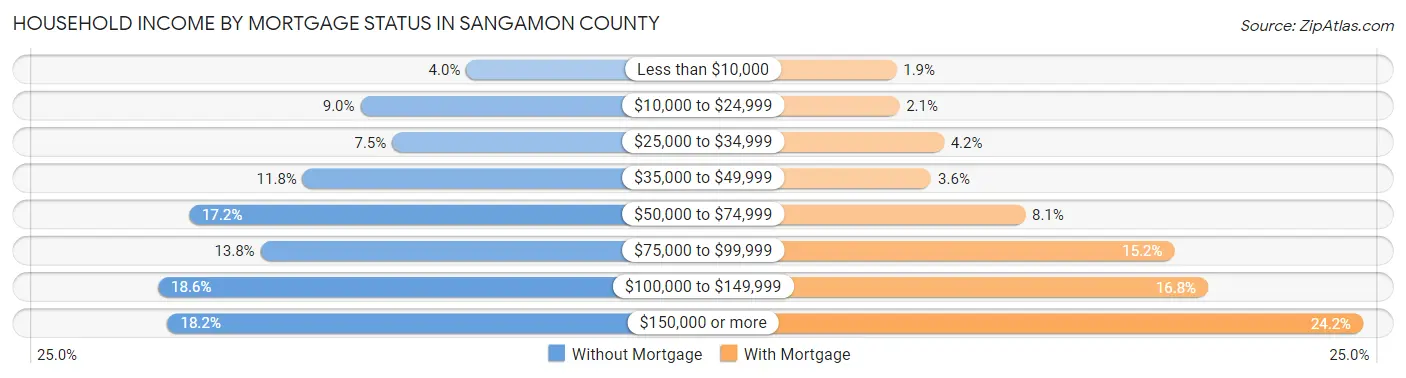
| Household Income | Without Mortgage | With Mortgage |
| Less than $10,000 | 932 (4.0%) | 685 (1.9%) |
| $10,000 to $24,999 | 2,118 (9.0%) | 737 (2.1%) |
| $25,000 to $34,999 | 1,763 (7.5%) | 1,485 (4.2%) |
| $35,000 to $49,999 | 2,763 (11.8%) | 1,274 (3.6%) |
| $50,000 to $74,999 | 4,034 (17.2%) | 2,853 (8.1%) |
| $75,000 to $99,999 | 3,235 (13.8%) | 5,368 (15.2%) |
| $100,000 to $149,999 | 4,381 (18.6%) | 5,935 (16.8%) |
| $150,000 or more | 4,275 (18.2%) | 8,545 (24.2%) |
| Total | 23,501 (100.0%) | 35,369 (100.0%) |
Property Value to Household Income Ratio in Sangamon County
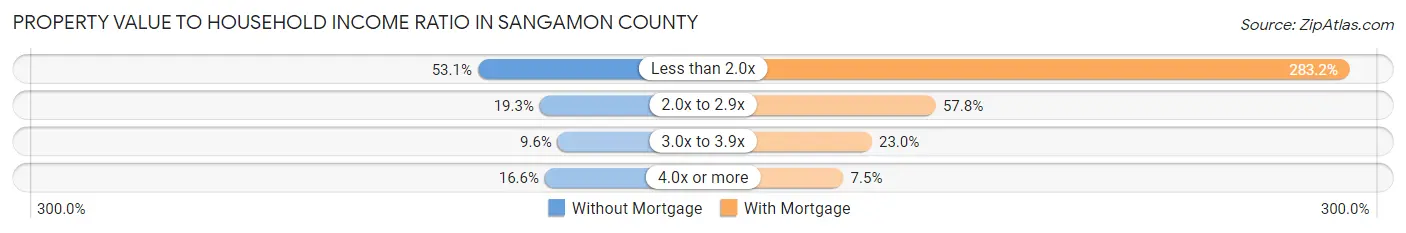
| Value-to-Income Ratio | Without Mortgage | With Mortgage |
| Less than 2.0x | 12,481 (53.1%) | 100,165 (283.2%) |
| 2.0x to 2.9x | 4,544 (19.3%) | 20,437 (57.8%) |
| 3.0x to 3.9x | 2,250 (9.6%) | 8,121 (23.0%) |
| 4.0x or more | 3,891 (16.6%) | 2,644 (7.5%) |
| Total | 23,501 (100.0%) | 35,369 (100.0%) |
Real Estate Taxes by Mortgage Status in Sangamon County
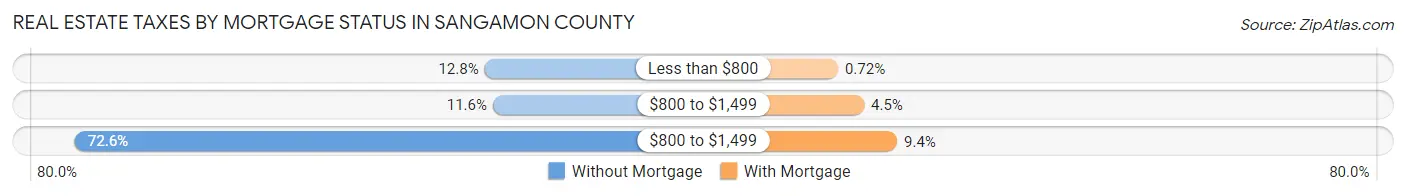
| Property Taxes | Without Mortgage | With Mortgage |
| Less than $800 | 3,009 (12.8%) | 253 (0.7%) |
| $800 to $1,499 | 2,724 (11.6%) | 1,605 (4.5%) |
| $800 to $1,499 | 17,072 (72.6%) | 3,309 (9.4%) |
| Total | 23,501 (100.0%) | 35,369 (100.0%) |
Health & Disability in Sangamon County
Health Insurance Coverage by Age in Sangamon County
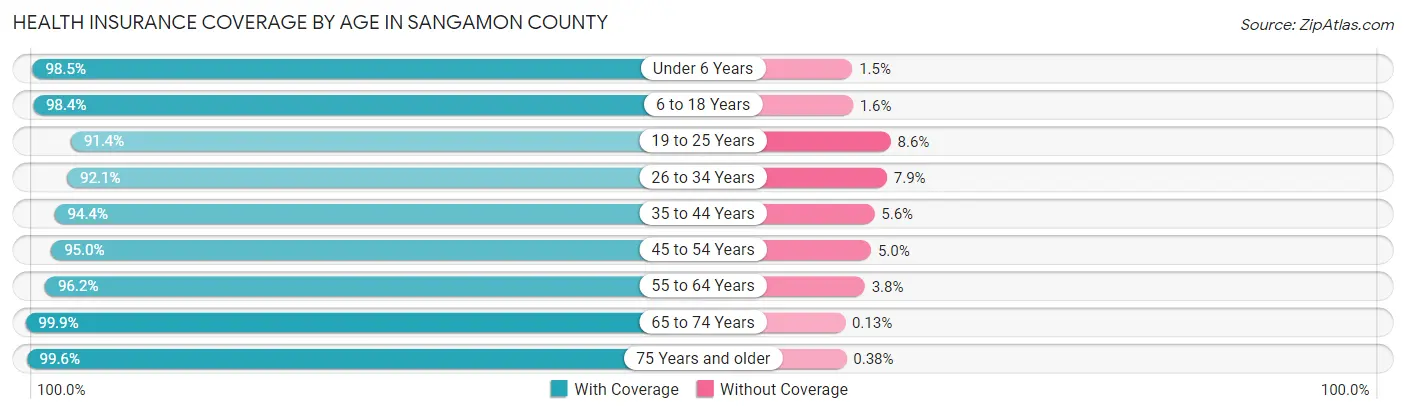
| Age Bracket | With Coverage | Without Coverage |
| Under 6 Years | 12,821 (98.5%) | 193 (1.5%) |
| 6 to 18 Years | 31,820 (98.4%) | 506 (1.6%) |
| 19 to 25 Years | 14,650 (91.4%) | 1,384 (8.6%) |
| 26 to 34 Years | 19,754 (92.1%) | 1,703 (7.9%) |
| 35 to 44 Years | 23,188 (94.4%) | 1,375 (5.6%) |
| 45 to 54 Years | 22,831 (95.0%) | 1,195 (5.0%) |
| 55 to 64 Years | 26,127 (96.2%) | 1,035 (3.8%) |
| 65 to 74 Years | 21,389 (99.9%) | 27 (0.1%) |
| 75 Years and older | 14,014 (99.6%) | 53 (0.4%) |
| Total | 186,594 (96.2%) | 7,471 (3.8%) |
Health Insurance Coverage by Citizenship Status in Sangamon County
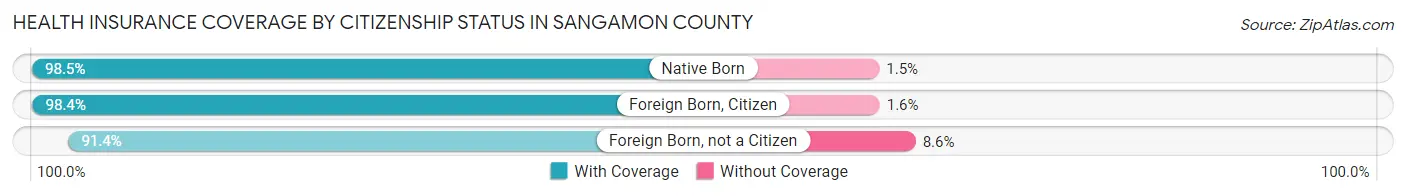
| Citizenship Status | With Coverage | Without Coverage |
| Native Born | 12,821 (98.5%) | 193 (1.5%) |
| Foreign Born, Citizen | 31,820 (98.4%) | 506 (1.6%) |
| Foreign Born, not a Citizen | 14,650 (91.4%) | 1,384 (8.6%) |
Health Insurance Coverage by Household Income in Sangamon County
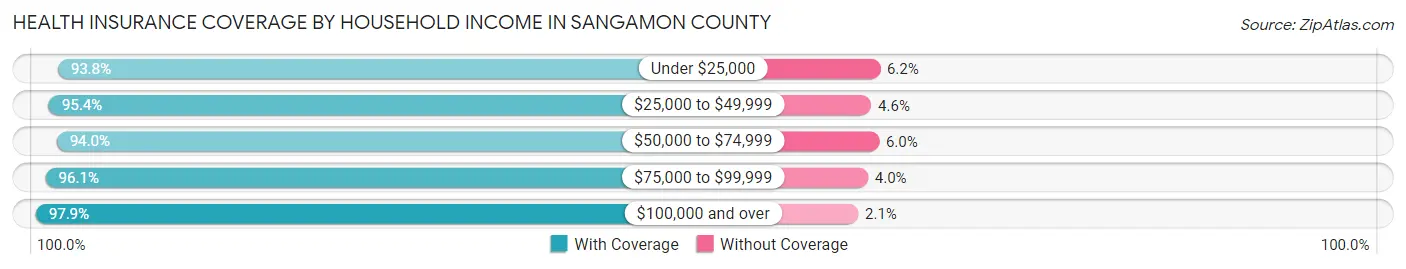
| Household Income | With Coverage | Without Coverage |
| Under $25,000 | 22,208 (93.8%) | 1,473 (6.2%) |
| $25,000 to $49,999 | 27,637 (95.4%) | 1,319 (4.6%) |
| $50,000 to $74,999 | 26,263 (94.0%) | 1,681 (6.0%) |
| $75,000 to $99,999 | 26,139 (96.1%) | 1,076 (4.0%) |
| $100,000 and over | 82,381 (97.9%) | 1,788 (2.1%) |
Public vs Private Health Insurance Coverage by Age in Sangamon County
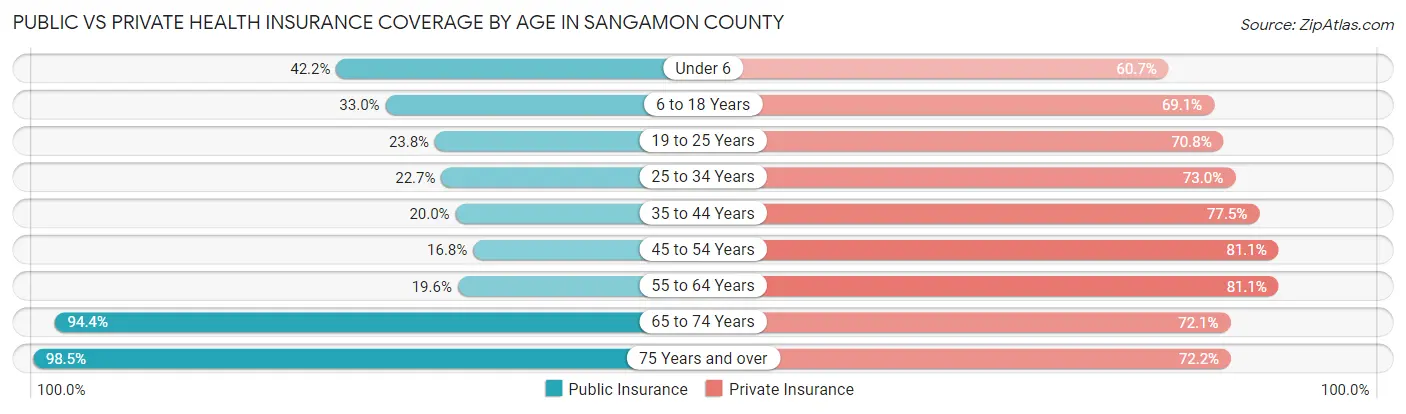
| Age Bracket | Public Insurance | Private Insurance |
| Under 6 | 5,485 (42.1%) | 7,894 (60.7%) |
| 6 to 18 Years | 10,676 (33.0%) | 22,329 (69.1%) |
| 19 to 25 Years | 3,821 (23.8%) | 11,358 (70.8%) |
| 25 to 34 Years | 4,859 (22.7%) | 15,658 (73.0%) |
| 35 to 44 Years | 4,919 (20.0%) | 19,027 (77.5%) |
| 45 to 54 Years | 4,024 (16.8%) | 19,475 (81.1%) |
| 55 to 64 Years | 5,325 (19.6%) | 22,026 (81.1%) |
| 65 to 74 Years | 20,220 (94.4%) | 15,446 (72.1%) |
| 75 Years and over | 13,853 (98.5%) | 10,160 (72.2%) |
| Total | 73,182 (37.7%) | 143,373 (73.9%) |
Disability Status by Sex by Age in Sangamon County
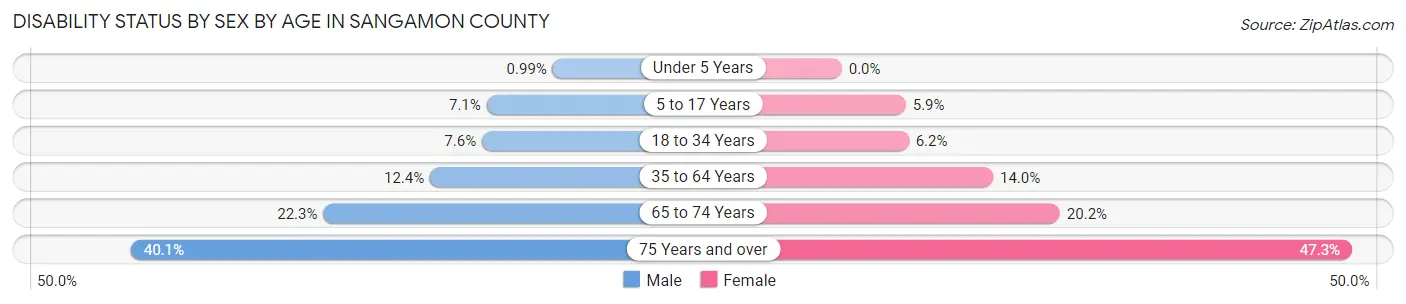
| Age Bracket | Male | Female |
| Under 5 Years | 56 (1.0%) | 0 (0.0%) |
| 5 to 17 Years | 1,169 (7.1%) | 923 (5.9%) |
| 18 to 34 Years | 1,469 (7.5%) | 1,265 (6.2%) |
| 35 to 64 Years | 4,557 (12.4%) | 5,461 (14.0%) |
| 65 to 74 Years | 2,195 (22.3%) | 2,341 (20.2%) |
| 75 Years and over | 2,211 (40.1%) | 4,052 (47.3%) |
Disability Class by Sex by Age in Sangamon County
Disability Class: Hearing Difficulty
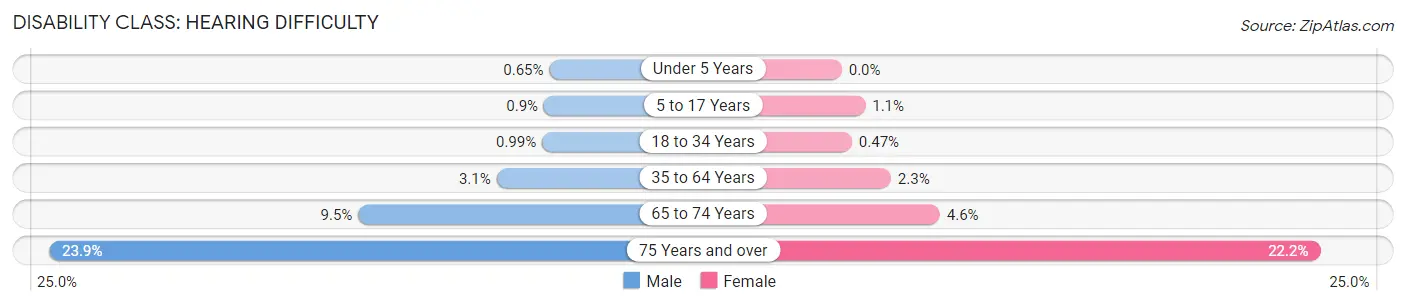
| Age Bracket | Male | Female |
| Under 5 Years | 37 (0.6%) | 0 (0.0%) |
| 5 to 17 Years | 148 (0.9%) | 170 (1.1%) |
| 18 to 34 Years | 193 (1.0%) | 95 (0.5%) |
| 35 to 64 Years | 1,144 (3.1%) | 887 (2.3%) |
| 65 to 74 Years | 938 (9.5%) | 526 (4.5%) |
| 75 Years and over | 1,314 (23.9%) | 1,900 (22.2%) |
Disability Class: Vision Difficulty
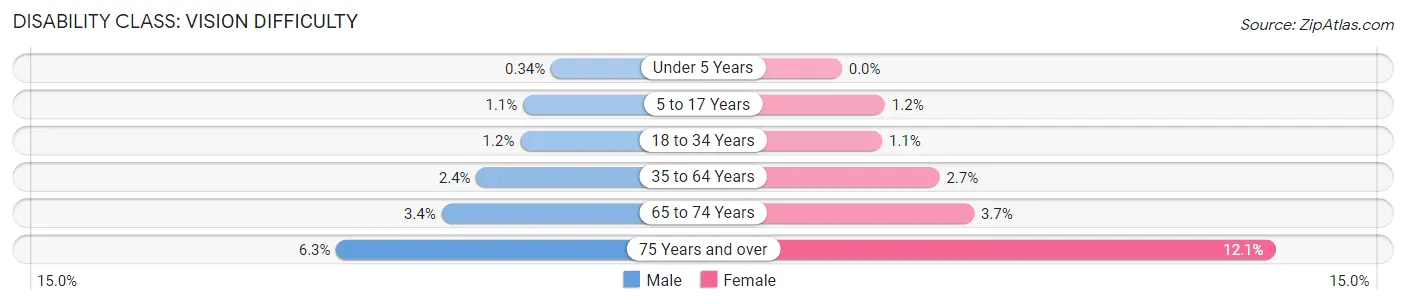
| Age Bracket | Male | Female |
| Under 5 Years | 19 (0.3%) | 0 (0.0%) |
| 5 to 17 Years | 184 (1.1%) | 186 (1.2%) |
| 18 to 34 Years | 233 (1.2%) | 228 (1.1%) |
| 35 to 64 Years | 893 (2.4%) | 1,057 (2.7%) |
| 65 to 74 Years | 334 (3.4%) | 426 (3.7%) |
| 75 Years and over | 348 (6.3%) | 1,033 (12.1%) |
Disability Class: Cognitive Difficulty
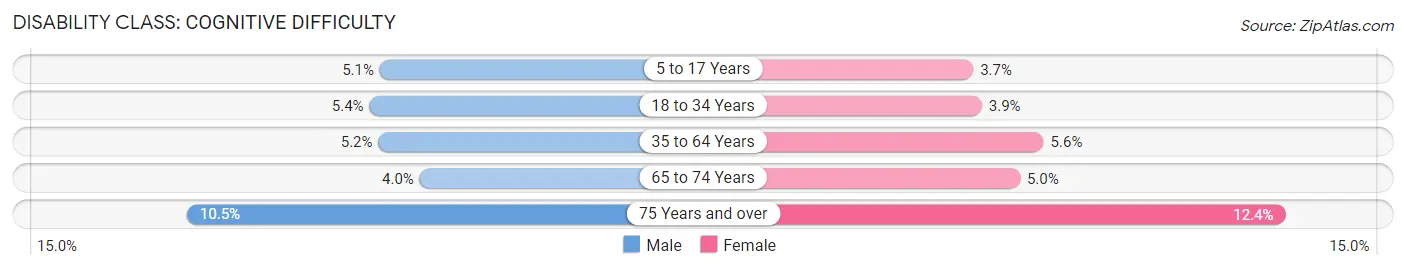
| Age Bracket | Male | Female |
| 5 to 17 Years | 839 (5.1%) | 569 (3.7%) |
| 18 to 34 Years | 1,051 (5.4%) | 793 (3.9%) |
| 35 to 64 Years | 1,899 (5.1%) | 2,187 (5.6%) |
| 65 to 74 Years | 394 (4.0%) | 573 (5.0%) |
| 75 Years and over | 577 (10.5%) | 1,057 (12.3%) |
Disability Class: Ambulatory Difficulty
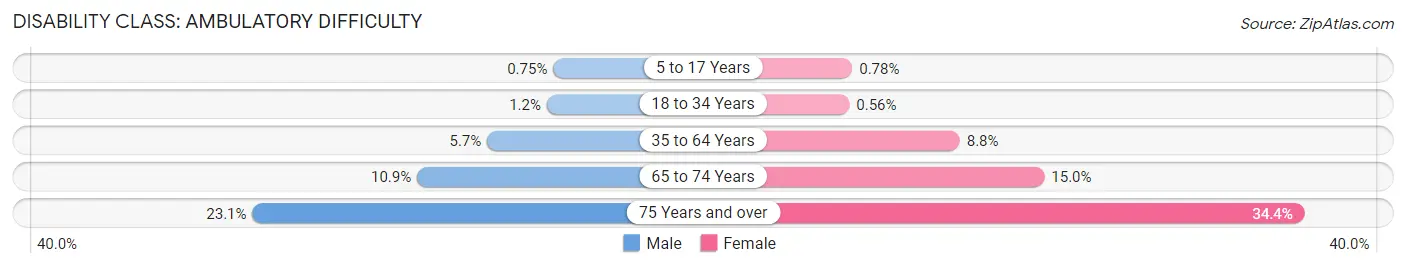
| Age Bracket | Male | Female |
| 5 to 17 Years | 123 (0.7%) | 121 (0.8%) |
| 18 to 34 Years | 239 (1.2%) | 115 (0.6%) |
| 35 to 64 Years | 2,087 (5.7%) | 3,408 (8.8%) |
| 65 to 74 Years | 1,070 (10.9%) | 1,739 (15.0%) |
| 75 Years and over | 1,272 (23.1%) | 2,941 (34.4%) |
Disability Class: Self-Care Difficulty
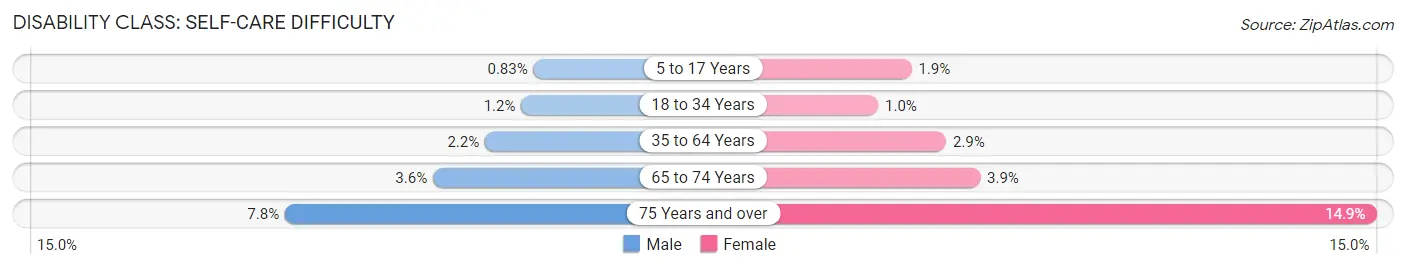
| Age Bracket | Male | Female |
| 5 to 17 Years | 136 (0.8%) | 302 (1.9%) |
| 18 to 34 Years | 227 (1.2%) | 206 (1.0%) |
| 35 to 64 Years | 802 (2.2%) | 1,130 (2.9%) |
| 65 to 74 Years | 358 (3.6%) | 445 (3.8%) |
| 75 Years and over | 427 (7.7%) | 1,276 (14.9%) |
Technology Access in Sangamon County
Computing Device Access in Sangamon County
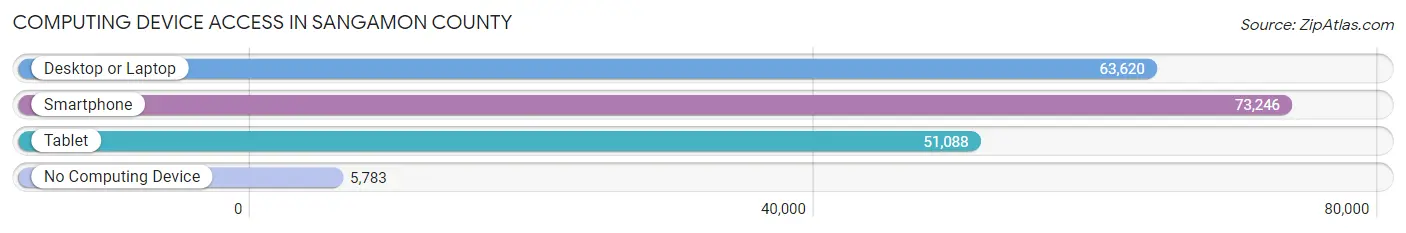
| Device Type | # Households | % Households |
| Desktop or Laptop | 63,620 | 75.7% |
| Smartphone | 73,246 | 87.2% |
| Tablet | 51,088 | 60.8% |
| No Computing Device | 5,783 | 6.9% |
| Total | 84,017 | 100.0% |
Internet Access in Sangamon County
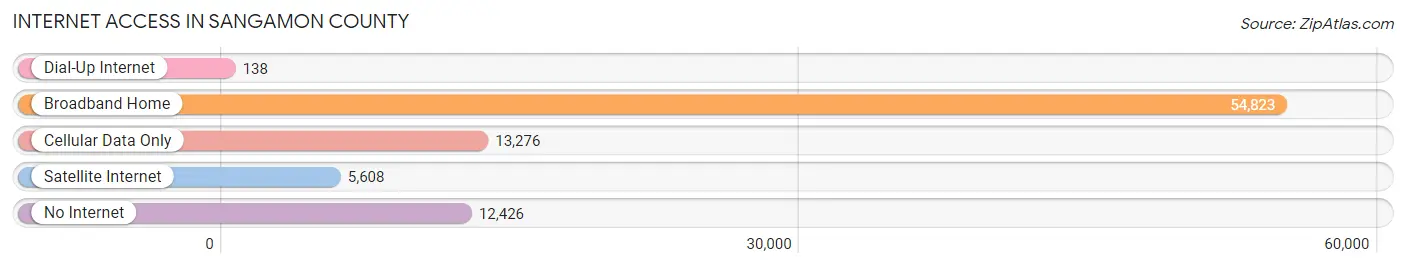
| Internet Type | # Households | % Households |
| Dial-Up Internet | 138 | 0.2% |
| Broadband Home | 54,823 | 65.2% |
| Cellular Data Only | 13,276 | 15.8% |
| Satellite Internet | 5,608 | 6.7% |
| No Internet | 12,426 | 14.8% |
| Total | 84,017 | 100.0% |
Sangamon County Summary
Sangamon County is located in the central part of the state of Illinois, in the United States. It is part of the Springfield Metropolitan Statistical Area and is the county seat of Sangamon County. The county was established in 1821 and named after the Sangamon River, which runs through the county. As of the 2010 census, the population of the county was 197,465.
Geography
Sangamon County is located in the central part of the state of Illinois, in the United States. It is part of the Springfield Metropolitan Statistical Area and is the county seat of Sangamon County. The county is bordered by Macon County to the north, Logan County to the east, Christian County to the south, and Menard County to the west. The county has a total area of 845 square miles, of which 835 square miles is land and 10 square miles is water. The county is drained by the Sangamon River and its tributaries.
The terrain of the county is generally flat, with some rolling hills in the northern and western parts of the county. The highest point in the county is located in the northwest corner, at an elevation of 890 feet. The county is located in the Central Till Plains region of the state, and is mostly covered in prairie grasslands.
Economy
Sangamon County has a diverse economy, with a mix of manufacturing, services, and agriculture. The county is home to several large employers, including the University of Illinois at Springfield, the State of Illinois, and the City of Springfield. The county is also home to several large manufacturing companies, including Caterpillar, Inc., and Mitsubishi Motors.
Agriculture is an important part of the county's economy, with corn, soybeans, and wheat being the primary crops. Livestock production is also important, with cattle, hogs, and poultry being the primary animals raised.
Demographics
As of the 2010 census, the population of the county was 197,465. The racial makeup of the county was 87.3% White, 8.2% African American, 0.5% Native American, 1.3% Asian, 0.1% Pacific Islander, 1.2% from other races, and 1.4% from two or more races. Hispanic or Latino of any race were 3.7% of the population.
The median income for a household in the county was $50,945, and the median income for a family was $62,917. The per capita income for the county was $25,945. About 8.7% of families and 11.7% of the population were below the poverty line, including 16.2% of those under age 18 and 6.7% of those age 65 or over.
Conclusion
Sangamon County is located in the central part of the state of Illinois, in the United States. It is part of the Springfield Metropolitan Statistical Area and is the county seat of Sangamon County. The county was established in 1821 and named after the Sangamon River, which runs through the county. As of the 2010 census, the population of the county was 197,465. The county has a diverse economy, with a mix of manufacturing, services, and agriculture. The racial makeup of the county was 87.3% White, 8.2% African American, 0.5% Native American, 1.3% Asian, 0.1% Pacific Islander, 1.2% from other races, and 1.4% from two or more races. The median income for a household in the county was $50,945, and the median income for a family was $62,917. Sangamon County is an important part of the state of Illinois, with a rich history, diverse economy, and vibrant population.
Common Questions
What is the Total Population of Sangamon County?
Total Population of Sangamon County is 196,122.
What is the Total Male Population of Sangamon County?
Total Male Population of Sangamon County is 94,848.
What is the Total Female Population of Sangamon County?
Total Female Population of Sangamon County is 101,274.
What is the Ratio of Males per 100 Females in Sangamon County?
There are 93.65 Males per 100 Females in Sangamon County.
What is the Ratio of Females per 100 Males in Sangamon County?
There are 106.78 Females per 100 Males in Sangamon County.
What is the Median Population Age in Sangamon County?
Median Population Age in Sangamon County is 40.6 Years.
What is the Average Family Size in Sangamon County
Average Family Size in Sangamon County is 3.0 People.
What is the Average Household Size in Sangamon County
Average Household Size in Sangamon County is 2.3 People.
What is Per Capita Income in Sangamon County?
Per Capita income in Sangamon County is $41,387.
What is the Median Family Income in Sangamon County?
Median Family Income in Sangamon County is $96,427.
What is the Median Household income in Sangamon County?
Median Household Income in Sangamon County is $71,653.
What is Income or Wage Gap in Sangamon County?
Income or Wage Gap in Sangamon County is 23.9%.
Women in Sangamon County earn 76.1 cents for every dollar earned by a man.
What is Family Income Deficit in Sangamon County?
Family Income Deficit in Sangamon County is $11,132.
Families that are below poverty line in Sangamon County earn $11,132 less on average than the poverty threshold level.
What is Inequality or Gini Index in Sangamon County?
Inequality or Gini Index in Sangamon County is 0.46.
How Large is the Labor Force in Sangamon County?
There are 98,156 People in the Labor Forcein in Sangamon County.
What is the Percentage of People in the Labor Force in Sangamon County?
62.1% of People are in the Labor Force in Sangamon County.
What is the Unemployment Rate in Sangamon County?
Unemployment Rate in Sangamon County is 5.2%.