Rock Island County, IL
Rock Island County Map

Rock Island County Overview
143,819
TOTAL POPULATION
71,318
MALE POPULATION
72,501
FEMALE POPULATION
98.37
MALES / 100 FEMALES
101.66
FEMALES / 100 MALES
40.2
MEDIAN AGE
2.9
AVG FAMILY SIZE
2.3
AVG HOUSEHOLD SIZE
$34,233
PER CAPITA INCOME
$83,401
AVG FAMILY INCOME
$64,435
AVG HOUSEHOLD INCOME
32.5%
WAGE / INCOME GAP [ % ]
67.5¢/ $1
WAGE / INCOME GAP [ $ ]
$11,377
FAMILY INCOME DEFICIT
0.43
INEQUALITY / GINI INDEX
71,465
LABOR FORCE [ PEOPLE ]
61.9%
PERCENT IN LABOR FORCE
6.2%
UNEMPLOYMENT RATE
Rock Island County Area Codes
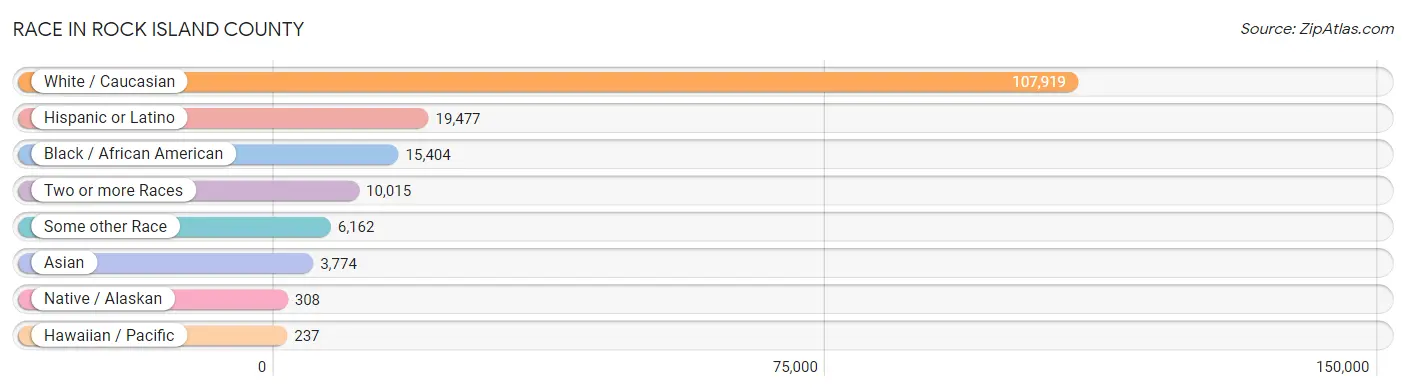
Race in Rock Island County
The most populous races in Rock Island County are White / Caucasian (107,919 | 75.0%), Hispanic or Latino (19,477 | 13.5%), and Black / African American (15,404 | 10.7%).
| Race | # Population | % Population |
| Asian | 3,774 | 2.6% |
| Black / African American | 15,404 | 10.7% |
| Hawaiian / Pacific | 237 | 0.2% |
| Hispanic or Latino | 19,477 | 13.5% |
| Native / Alaskan | 308 | 0.2% |
| White / Caucasian | 107,919 | 75.0% |
| Two or more Races | 10,015 | 7.0% |
| Some other Race | 6,162 | 4.3% |
| Total | 143,819 | 100.0% |
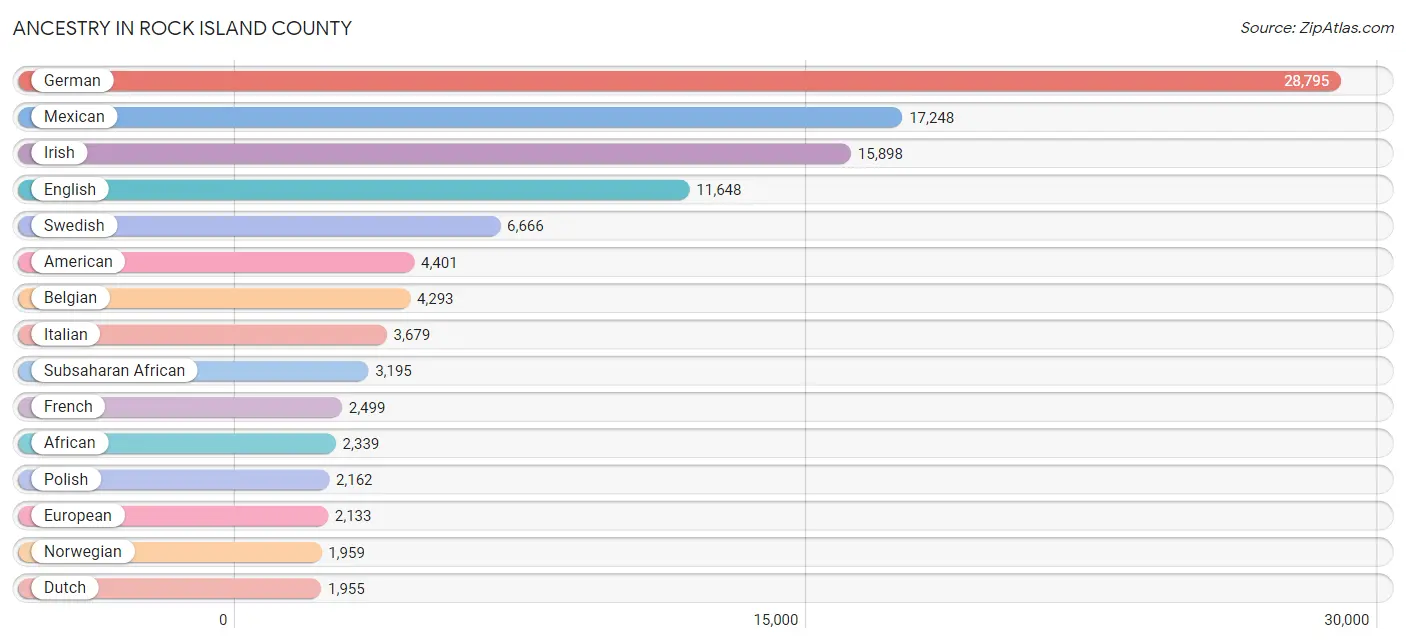
Ancestry in Rock Island County
The most populous ancestries reported in Rock Island County are German (28,795 | 20.0%), Mexican (17,248 | 12.0%), Irish (15,898 | 11.1%), English (11,648 | 8.1%), and Swedish (6,666 | 4.6%), together accounting for 55.8% of all Rock Island County residents.
| Ancestry | # Population | % Population |
| African | 2,339 | 1.6% |
| Alaska Native | 31 | 0.0% |
| Albanian | 36 | 0.0% |
| American | 4,401 | 3.1% |
| Apache | 44 | 0.0% |
| Arab | 302 | 0.2% |
| Arapaho | 5 | 0.0% |
| Armenian | 20 | 0.0% |
| Australian | 6 | 0.0% |
| Austrian | 126 | 0.1% |
| Belgian | 4,293 | 3.0% |
| Belizean | 18 | 0.0% |
| Bhutanese | 33 | 0.0% |
| Blackfeet | 96 | 0.1% |
| Brazilian | 28 | 0.0% |
| British | 766 | 0.5% |
| Bulgarian | 49 | 0.0% |
| Burmese | 218 | 0.2% |
| Cambodian | 155 | 0.1% |
| Canadian | 415 | 0.3% |
| Central American | 384 | 0.3% |
| Central American Indian | 57 | 0.0% |
| Cherokee | 211 | 0.2% |
| Cheyenne | 11 | 0.0% |
| Chickasaw | 7 | 0.0% |
| Chilean | 36 | 0.0% |
| Chippewa | 26 | 0.0% |
| Choctaw | 65 | 0.1% |
| Colombian | 42 | 0.0% |
| Cree | 7 | 0.0% |
| Croatian | 190 | 0.1% |
| Cuban | 168 | 0.1% |
| Czech | 746 | 0.5% |
| Czechoslovakian | 96 | 0.1% |
| Danish | 543 | 0.4% |
| Delaware | 5 | 0.0% |
| Dominican | 10 | 0.0% |
| Dutch | 1,955 | 1.4% |
| Eastern European | 179 | 0.1% |
| Ecuadorian | 73 | 0.1% |
| English | 11,648 | 8.1% |
| Ethiopian | 79 | 0.1% |
| European | 2,133 | 1.5% |
| Filipino | 33 | 0.0% |
| Finnish | 132 | 0.1% |
| French | 2,499 | 1.7% |
| French American Indian | 2 | 0.0% |
| French Canadian | 211 | 0.2% |
| German | 28,795 | 20.0% |
| German Russian | 11 | 0.0% |
| Ghanaian | 20 | 0.0% |
| Greek | 519 | 0.4% |
| Guamanian / Chamorro | 87 | 0.1% |
| Guatemalan | 195 | 0.1% |
| Haitian | 16 | 0.0% |
| Honduran | 107 | 0.1% |
| Hungarian | 155 | 0.1% |
| Indian (Asian) | 522 | 0.4% |
| Indonesian | 1,468 | 1.0% |
| Iranian | 8 | 0.0% |
| Iraqi | 25 | 0.0% |
| Irish | 15,898 | 11.1% |
| Italian | 3,679 | 2.6% |
| Jamaican | 50 | 0.0% |
| Japanese | 8 | 0.0% |
| Kiowa | 15 | 0.0% |
| Korean | 673 | 0.5% |
| Latvian | 14 | 0.0% |
| Lebanese | 53 | 0.0% |
| Liberian | 18 | 0.0% |
| Lithuanian | 339 | 0.2% |
| Lumbee | 2 | 0.0% |
| Macedonian | 6 | 0.0% |
| Malaysian | 101 | 0.1% |
| Mexican | 17,248 | 12.0% |
| Mexican American Indian | 101 | 0.1% |
| Mongolian | 12 | 0.0% |
| Moroccan | 73 | 0.1% |
| Native Hawaiian | 285 | 0.2% |
| Navajo | 20 | 0.0% |
| Nicaraguan | 14 | 0.0% |
| Nigerian | 37 | 0.0% |
| Northern European | 223 | 0.2% |
| Norwegian | 1,959 | 1.4% |
| Pakistani | 57 | 0.0% |
| Palestinian | 13 | 0.0% |
| Panamanian | 33 | 0.0% |
| Pennsylvania German | 27 | 0.0% |
| Peruvian | 154 | 0.1% |
| Polish | 2,162 | 1.5% |
| Portuguese | 104 | 0.1% |
| Potawatomi | 1 | 0.0% |
| Puerto Rican | 572 | 0.4% |
| Romanian | 99 | 0.1% |
| Russian | 463 | 0.3% |
| Salvadoran | 35 | 0.0% |
| Samoan | 8 | 0.0% |
| Scandinavian | 687 | 0.5% |
| Scotch-Irish | 945 | 0.7% |
| Scottish | 1,656 | 1.1% |
| Serbian | 67 | 0.1% |
| Sioux | 62 | 0.0% |
| Slavic | 34 | 0.0% |
| Slovak | 47 | 0.0% |
| Slovene | 63 | 0.0% |
| South American | 381 | 0.3% |
| South American Indian | 21 | 0.0% |
| Spaniard | 262 | 0.2% |
| Spanish | 103 | 0.1% |
| Sri Lankan | 170 | 0.1% |
| Subsaharan African | 3,195 | 2.2% |
| Sudanese | 7 | 0.0% |
| Swedish | 6,666 | 4.6% |
| Swiss | 246 | 0.2% |
| Syrian | 111 | 0.1% |
| Thai | 1,076 | 0.7% |
| Turkish | 23 | 0.0% |
| Ugandan | 1 | 0.0% |
| Ukrainian | 63 | 0.0% |
| Venezuelan | 76 | 0.1% |
| Welsh | 888 | 0.6% |
| Yugoslavian | 61 | 0.0% | View All 122 Rows |
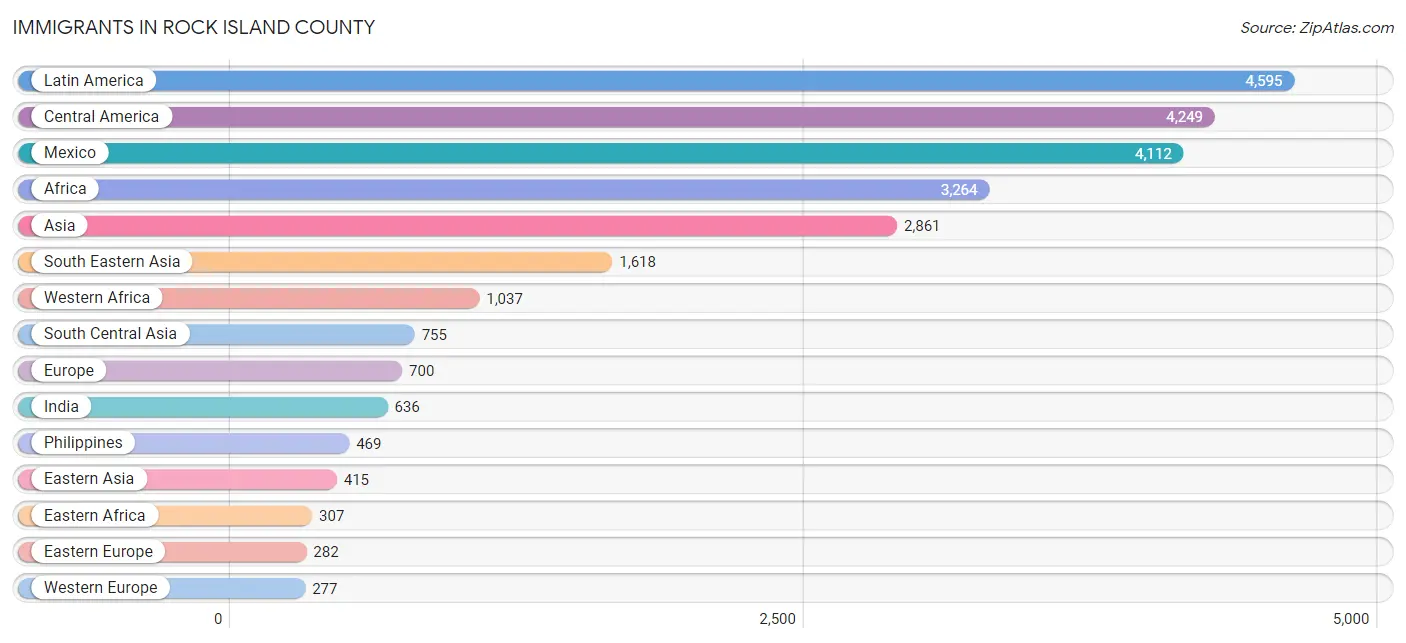
Immigrants in Rock Island County
The most numerous immigrant groups reported in Rock Island County came from Latin America (4,595 | 3.2%), Central America (4,249 | 2.9%), Mexico (4,112 | 2.9%), Africa (3,264 | 2.3%), and Asia (2,861 | 2.0%), together accounting for 13.3% of all Rock Island County residents.
| Immigration Origin | # Population | % Population |
| Africa | 3,264 | 2.3% |
| Asia | 2,861 | 2.0% |
| Australia | 15 | 0.0% |
| Belarus | 38 | 0.0% |
| Belgium | 14 | 0.0% |
| Belize | 21 | 0.0% |
| Bosnia and Herzegovina | 10 | 0.0% |
| Brazil | 38 | 0.0% |
| Bulgaria | 31 | 0.0% |
| Cambodia | 1 | 0.0% |
| Canada | 70 | 0.1% |
| Caribbean | 134 | 0.1% |
| Central America | 4,249 | 2.9% |
| Chile | 16 | 0.0% |
| China | 261 | 0.2% |
| Colombia | 25 | 0.0% |
| Congo | 22 | 0.0% |
| Cuba | 54 | 0.0% |
| Dominican Republic | 31 | 0.0% |
| Eastern Africa | 307 | 0.2% |
| Eastern Asia | 415 | 0.3% |
| Eastern Europe | 282 | 0.2% |
| Ecuador | 44 | 0.0% |
| England | 81 | 0.1% |
| Ethiopia | 55 | 0.0% |
| Europe | 700 | 0.5% |
| France | 99 | 0.1% |
| Germany | 147 | 0.1% |
| Ghana | 34 | 0.0% |
| Greece | 23 | 0.0% |
| Guatemala | 47 | 0.0% |
| Guyana | 51 | 0.0% |
| Honduras | 22 | 0.0% |
| India | 636 | 0.4% |
| Iraq | 31 | 0.0% |
| Italy | 14 | 0.0% |
| Jamaica | 9 | 0.0% |
| Japan | 27 | 0.0% |
| Korea | 43 | 0.0% |
| Laos | 92 | 0.1% |
| Latin America | 4,595 | 3.2% |
| Liberia | 80 | 0.1% |
| Lithuania | 4 | 0.0% |
| Malaysia | 77 | 0.1% |
| Mexico | 4,112 | 2.9% |
| Middle Africa | 90 | 0.1% |
| Moldova | 5 | 0.0% |
| Morocco | 62 | 0.0% |
| Nepal | 28 | 0.0% |
| Netherlands | 17 | 0.0% |
| Nicaragua | 34 | 0.0% |
| Nigeria | 30 | 0.0% |
| North Macedonia | 12 | 0.0% |
| Northern Africa | 82 | 0.1% |
| Northern Europe | 104 | 0.1% |
| Oceania | 15 | 0.0% |
| Pakistan | 91 | 0.1% |
| Panama | 13 | 0.0% |
| Philippines | 469 | 0.3% |
| Poland | 121 | 0.1% |
| Russia | 28 | 0.0% |
| Scotland | 13 | 0.0% |
| Senegal | 117 | 0.1% |
| Serbia | 21 | 0.0% |
| South America | 212 | 0.2% |
| South Central Asia | 755 | 0.5% |
| South Eastern Asia | 1,618 | 1.1% |
| Southern Europe | 37 | 0.0% |
| St. Vincent and the Grenadines | 18 | 0.0% |
| Sudan | 20 | 0.0% |
| Syria | 30 | 0.0% |
| Taiwan | 31 | 0.0% |
| Thailand | 139 | 0.1% |
| Trinidad and Tobago | 22 | 0.0% |
| Turkey | 12 | 0.0% |
| Uganda | 1 | 0.0% |
| Ukraine | 12 | 0.0% |
| Venezuela | 38 | 0.0% |
| Vietnam | 110 | 0.1% |
| Western Africa | 1,037 | 0.7% |
| Western Asia | 73 | 0.1% |
| Western Europe | 277 | 0.2% |
| Zaire | 56 | 0.0% | View All 83 Rows |
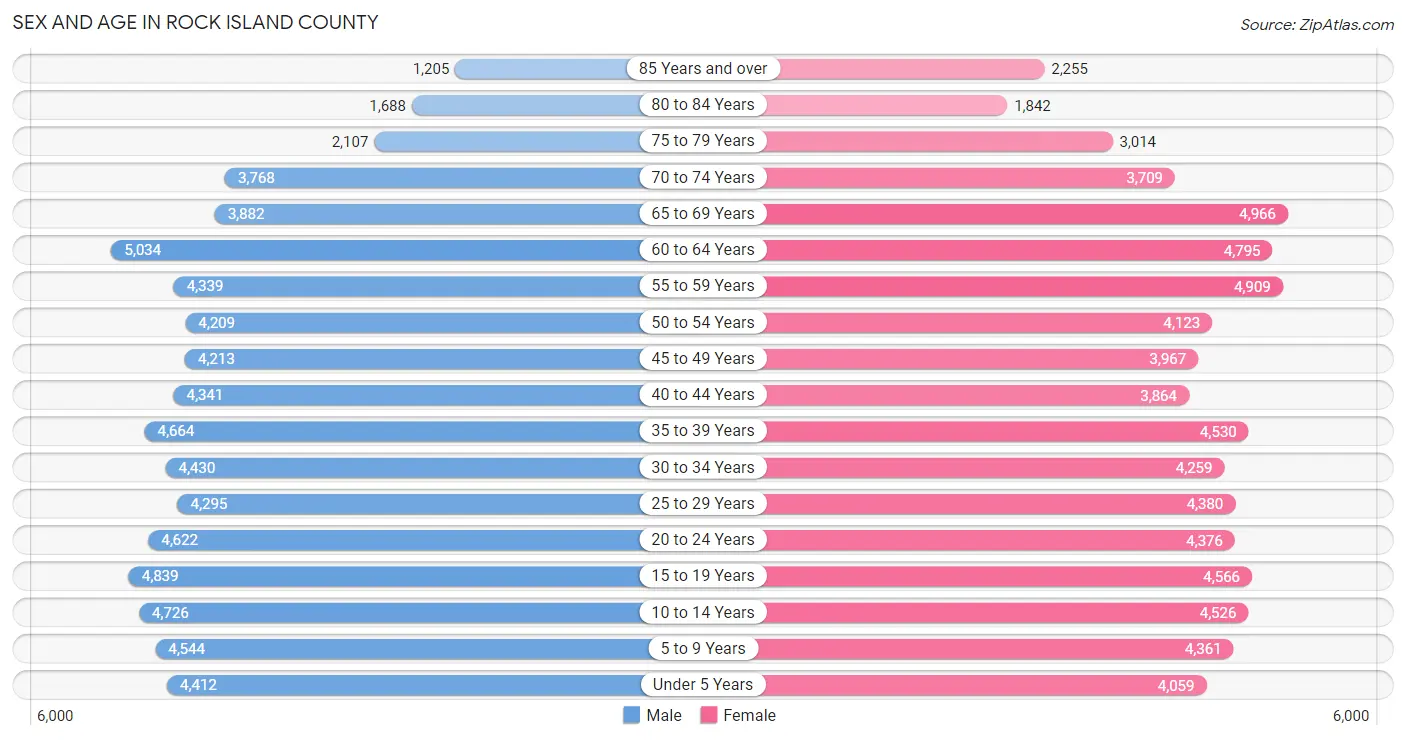
Sex and Age in Rock Island County
Sex and Age in Rock Island County
The most populous age groups in Rock Island County are 60 to 64 Years (5,034 | 7.1%) for men and 65 to 69 Years (4,966 | 6.9%) for women.
| Age Bracket | Male | Female |
| Under 5 Years | 4,412 (6.2%) | 4,059 (5.6%) |
| 5 to 9 Years | 4,544 (6.4%) | 4,361 (6.0%) |
| 10 to 14 Years | 4,726 (6.6%) | 4,526 (6.2%) |
| 15 to 19 Years | 4,839 (6.8%) | 4,566 (6.3%) |
| 20 to 24 Years | 4,622 (6.5%) | 4,376 (6.0%) |
| 25 to 29 Years | 4,295 (6.0%) | 4,380 (6.0%) |
| 30 to 34 Years | 4,430 (6.2%) | 4,259 (5.9%) |
| 35 to 39 Years | 4,664 (6.5%) | 4,530 (6.2%) |
| 40 to 44 Years | 4,341 (6.1%) | 3,864 (5.3%) |
| 45 to 49 Years | 4,213 (5.9%) | 3,967 (5.5%) |
| 50 to 54 Years | 4,209 (5.9%) | 4,123 (5.7%) |
| 55 to 59 Years | 4,339 (6.1%) | 4,909 (6.8%) |
| 60 to 64 Years | 5,034 (7.1%) | 4,795 (6.6%) |
| 65 to 69 Years | 3,882 (5.4%) | 4,966 (6.9%) |
| 70 to 74 Years | 3,768 (5.3%) | 3,709 (5.1%) |
| 75 to 79 Years | 2,107 (2.9%) | 3,014 (4.2%) |
| 80 to 84 Years | 1,688 (2.4%) | 1,842 (2.5%) |
| 85 Years and over | 1,205 (1.7%) | 2,255 (3.1%) |
| Total | 71,318 (100.0%) | 72,501 (100.0%) |
Families and Households in Rock Island County
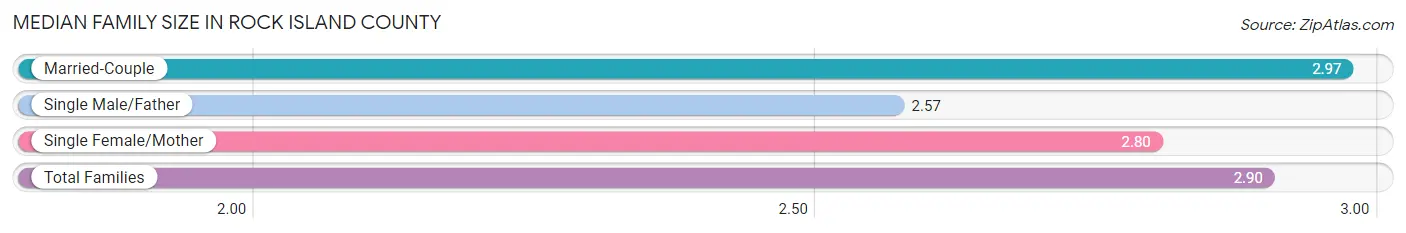
Median Family Size in Rock Island County
The median family size in Rock Island County is 2.90 persons per family, with married-couple families (26,832 | 72.1%) accounting for the largest median family size of 2.97 persons per family. On the other hand, single male/father families (2,859 | 7.7%) represent the smallest median family size with 2.57 persons per family.
| Family Type | # Families | Family Size |
| Married-Couple | 26,832 (72.1%) | 2.97 |
| Single Male/Father | 2,859 (7.7%) | 2.57 |
| Single Female/Mother | 7,525 (20.2%) | 2.80 |
| Total Families | 37,216 (100.0%) | 2.90 |
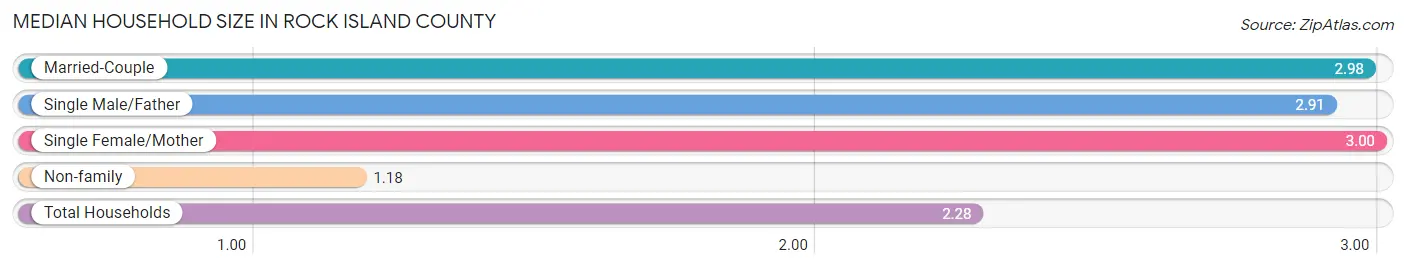
Median Household Size in Rock Island County
The median household size in Rock Island County is 2.28 persons per household, with single female/mother households (7,525 | 12.3%) accounting for the largest median household size of 3 persons per household. non-family households (23,798 | 39.0%) represent the smallest median household size with 1.18 persons per household.
| Household Type | # Households | Household Size |
| Married-Couple | 26,832 (44.0%) | 2.98 |
| Single Male/Father | 2,859 (4.7%) | 2.91 |
| Single Female/Mother | 7,525 (12.3%) | 3.00 |
| Non-family | 23,798 (39.0%) | 1.18 |
| Total Households | 61,014 (100.0%) | 2.28 |
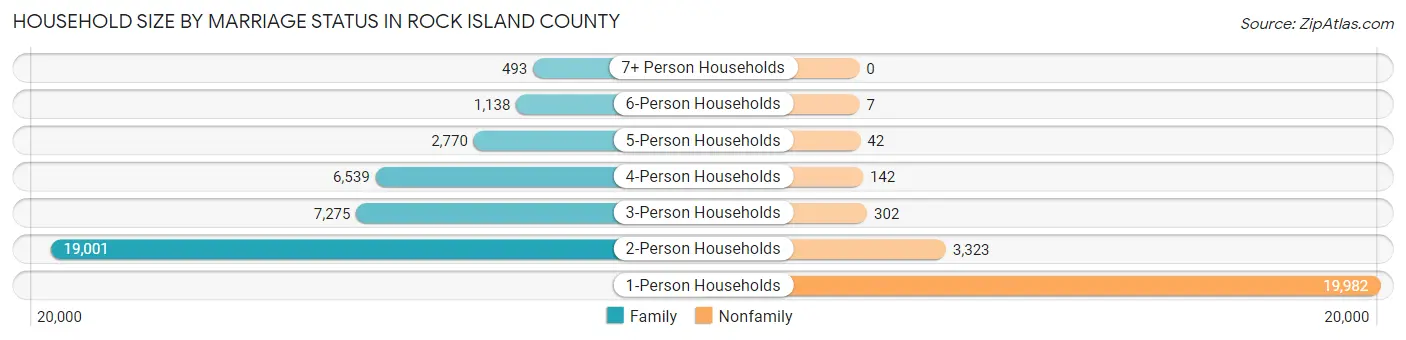
Household Size by Marriage Status in Rock Island County
Out of a total of 61,014 households in Rock Island County, 37,216 (61.0%) are family households, while 23,798 (39.0%) are nonfamily households. The most numerous type of family households are 2-person households, comprising 19,001, and the most common type of nonfamily households are 1-person households, comprising 19,982.
| Household Size | Family Households | Nonfamily Households |
| 1-Person Households | - | 19,982 (32.8%) |
| 2-Person Households | 19,001 (31.1%) | 3,323 (5.4%) |
| 3-Person Households | 7,275 (11.9%) | 302 (0.5%) |
| 4-Person Households | 6,539 (10.7%) | 142 (0.2%) |
| 5-Person Households | 2,770 (4.5%) | 42 (0.1%) |
| 6-Person Households | 1,138 (1.9%) | 7 (0.0%) |
| 7+ Person Households | 493 (0.8%) | 0 (0.0%) |
| Total | 37,216 (61.0%) | 23,798 (39.0%) |
Female Fertility in Rock Island County
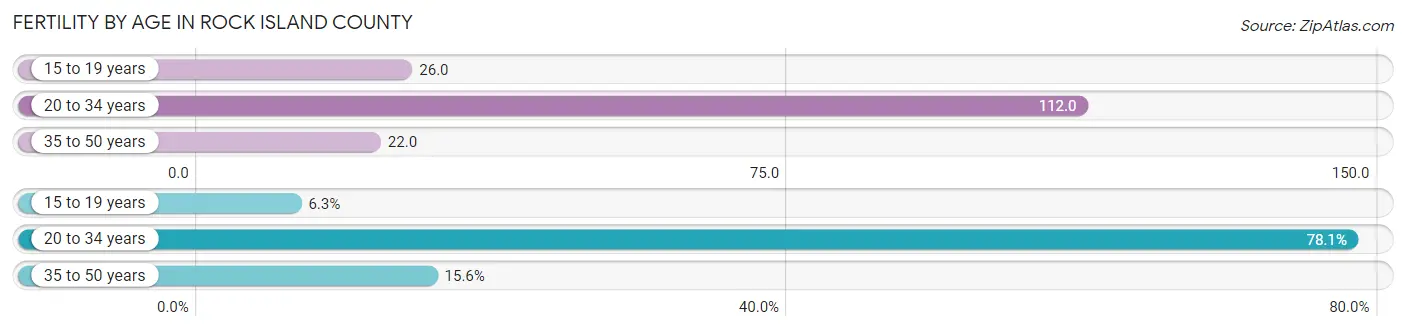
Fertility by Age in Rock Island County
Average fertility rate in Rock Island County is 60.0 births per 1,000 women. Women in the age bracket of 20 to 34 years have the highest fertility rate with 112.0 births per 1,000 women. Women in the age bracket of 20 to 34 years acount for 78.1% of all women with births.
| Age Bracket | Women with Births | Births / 1,000 Women |
| 15 to 19 years | 118 (6.3%) | 26.0 |
| 20 to 34 years | 1,453 (78.1%) | 112.0 |
| 35 to 50 years | 290 (15.6%) | 22.0 |
| Total | 1,861 (100.0%) | 60.0 |
Fertility by Age by Marriage Status in Rock Island County
48.2% of women with births (1,861) in Rock Island County are married. The highest percentage of unmarried women with births falls into 15 to 19 years age bracket with 100.0% of them unmarried at the time of birth, while the lowest percentage of unmarried women with births belong to 20 to 34 years age bracket with 47.8% of them unmarried.
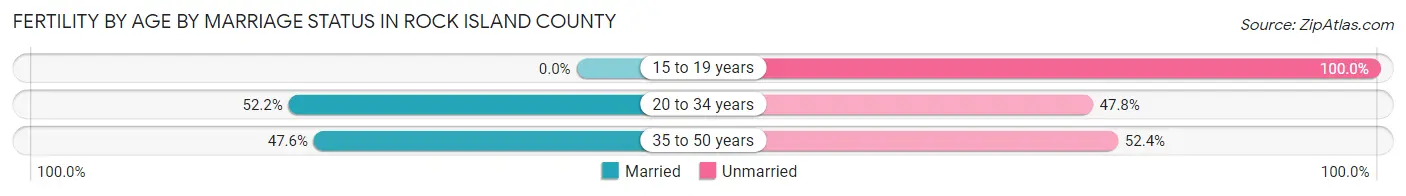
| Age Bracket | Married | Unmarried |
| 15 to 19 years | 0 (0.0%) | 118 (100.0%) |
| 20 to 34 years | 758 (52.2%) | 695 (47.8%) |
| 35 to 50 years | 138 (47.6%) | 152 (52.4%) |
| Total | 897 (48.2%) | 964 (51.8%) |
Fertility by Education in Rock Island County
Average fertility rate in Rock Island County is 60.0 births per 1,000 women. Women with the education attainment of high school diploma have the highest fertility rate of 100.0 births per 1,000 women, while women with the education attainment of graduate degree have the lowest fertility at 24.0 births per 1,000 women. Women with the education attainment of high school diploma represent 38.0% of all women with births.
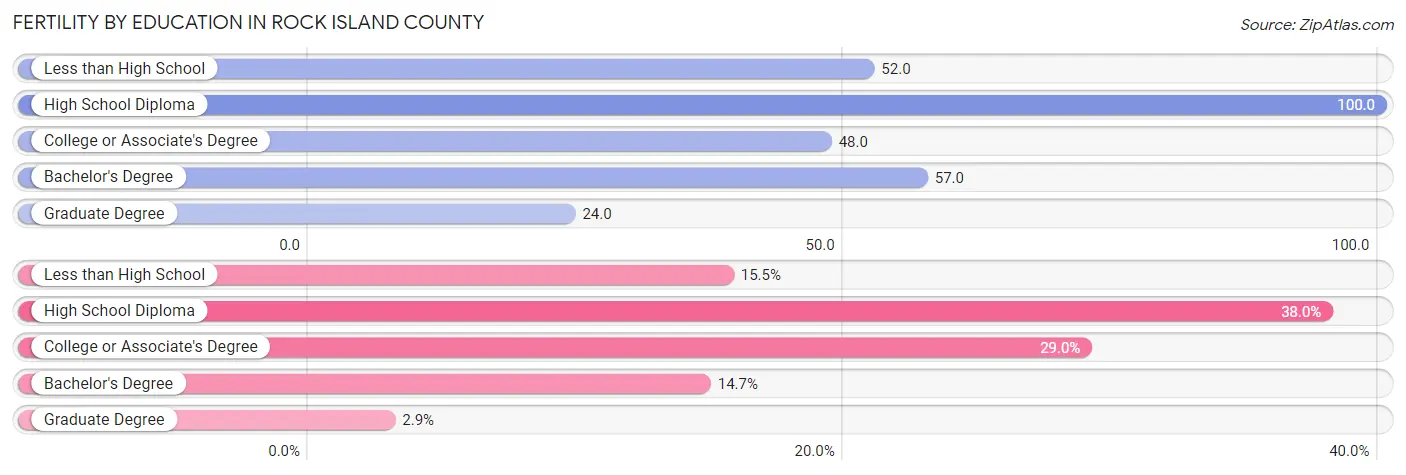
| Educational Attainment | Women with Births | Births / 1,000 Women |
| Less than High School | 289 (15.5%) | 52.0 |
| High School Diploma | 707 (38.0%) | 100.0 |
| College or Associate's Degree | 539 (29.0%) | 48.0 |
| Bachelor's Degree | 273 (14.7%) | 57.0 |
| Graduate Degree | 53 (2.9%) | 24.0 |
| Total | 1,861 (100.0%) | 60.0 |
Fertility by Education by Marriage Status in Rock Island County
51.8% of women with births in Rock Island County are unmarried. Women with the educational attainment of bachelor's degree are most likely to be married with 85.4% of them married at childbirth, while women with the educational attainment of high school diploma are least likely to be married with 62.0% of them unmarried at childbirth.
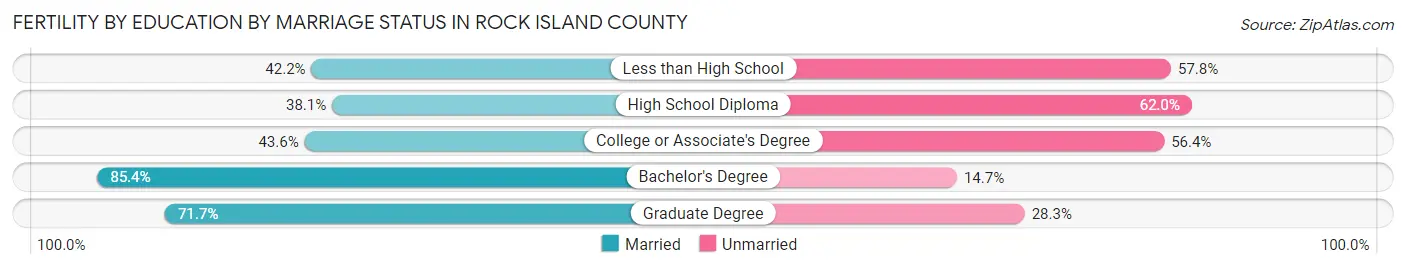
| Educational Attainment | Married | Unmarried |
| Less than High School | 122 (42.2%) | 167 (57.8%) |
| High School Diploma | 269 (38.1%) | 438 (62.0%) |
| College or Associate's Degree | 235 (43.6%) | 304 (56.4%) |
| Bachelor's Degree | 233 (85.4%) | 40 (14.6%) |
| Graduate Degree | 38 (71.7%) | 15 (28.3%) |
| Total | 897 (48.2%) | 964 (51.8%) |
Income in Rock Island County
Income Overview in Rock Island County
Per Capita Income in Rock Island County is $34,233, while median incomes of families and households are $83,401 and $64,435 respectively.
| Characteristic | Number | Measure |
| Per Capita Income | 143,819 | $34,233 |
| Median Family Income | 37,216 | $83,401 |
| Mean Family Income | 37,216 | $97,387 |
| Median Household Income | 61,014 | $64,435 |
| Mean Household Income | 61,014 | $80,579 |
| Income Deficit | 37,216 | $11,377 |
| Wage / Income Gap (%) | 143,819 | 32.45% |
| Wage / Income Gap ($) | 143,819 | 67.55¢ per $1 |
| Gini / Inequality Index | 143,819 | 0.43 |
Earnings by Sex in Rock Island County
Average Earnings in Rock Island County are $37,109, $45,025 for men and $30,413 for women, a difference of 32.5%.
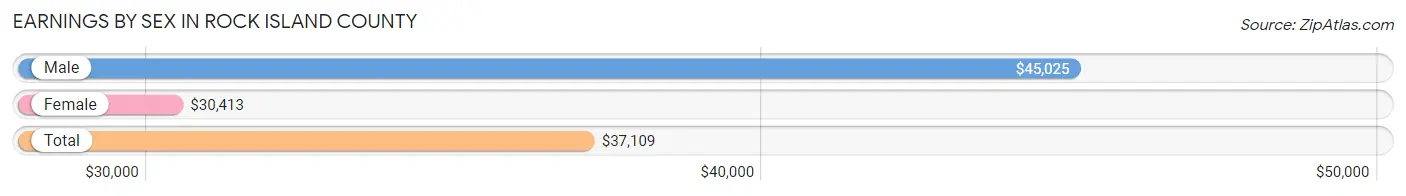
| Sex | Number | Average Earnings |
| Male | 39,336 (52.2%) | $45,025 |
| Female | 36,000 (47.8%) | $30,413 |
| Total | 75,336 (100.0%) | $37,109 |
Earnings by Sex by Income Bracket in Rock Island County
The most common earnings brackets in Rock Island County are $100,000+ for men (4,842 | 12.3%) and $2,499 or less for women (2,611 | 7.2%).
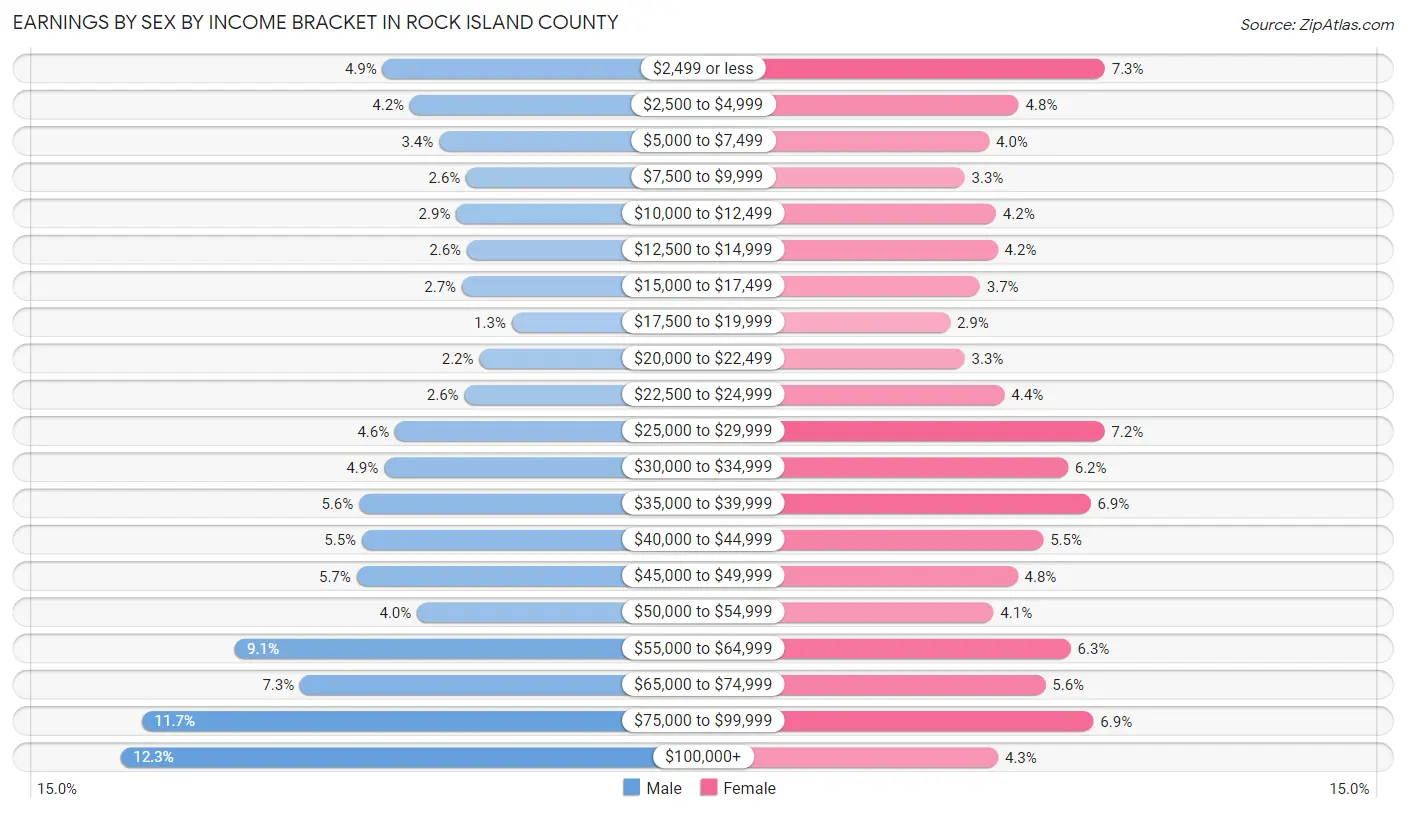
| Income | Male | Female |
| $2,499 or less | 1,942 (4.9%) | 2,611 (7.2%) |
| $2,500 to $4,999 | 1,642 (4.2%) | 1,740 (4.8%) |
| $5,000 to $7,499 | 1,317 (3.4%) | 1,441 (4.0%) |
| $7,500 to $9,999 | 1,018 (2.6%) | 1,191 (3.3%) |
| $10,000 to $12,499 | 1,130 (2.9%) | 1,510 (4.2%) |
| $12,500 to $14,999 | 1,012 (2.6%) | 1,525 (4.2%) |
| $15,000 to $17,499 | 1,065 (2.7%) | 1,348 (3.7%) |
| $17,500 to $19,999 | 514 (1.3%) | 1,045 (2.9%) |
| $20,000 to $22,499 | 872 (2.2%) | 1,190 (3.3%) |
| $22,500 to $24,999 | 1,038 (2.6%) | 1,594 (4.4%) |
| $25,000 to $29,999 | 1,806 (4.6%) | 2,608 (7.2%) |
| $30,000 to $34,999 | 1,927 (4.9%) | 2,235 (6.2%) |
| $35,000 to $39,999 | 2,203 (5.6%) | 2,467 (6.9%) |
| $40,000 to $44,999 | 2,170 (5.5%) | 1,986 (5.5%) |
| $45,000 to $49,999 | 2,232 (5.7%) | 1,729 (4.8%) |
| $50,000 to $54,999 | 1,562 (4.0%) | 1,485 (4.1%) |
| $55,000 to $64,999 | 3,584 (9.1%) | 2,265 (6.3%) |
| $65,000 to $74,999 | 2,855 (7.3%) | 2,007 (5.6%) |
| $75,000 to $99,999 | 4,605 (11.7%) | 2,493 (6.9%) |
| $100,000+ | 4,842 (12.3%) | 1,530 (4.3%) |
| Total | 39,336 (100.0%) | 36,000 (100.0%) |
Earnings by Sex by Educational Attainment in Rock Island County
Average earnings in Rock Island County are $52,558 for men and $36,296 for women, a difference of 30.9%. Men with an educational attainment of graduate degree enjoy the highest average annual earnings of $83,724, while those with less than high school education earn the least with $32,979. Women with an educational attainment of graduate degree earn the most with the average annual earnings of $71,399, while those with less than high school education have the smallest earnings of $23,942.
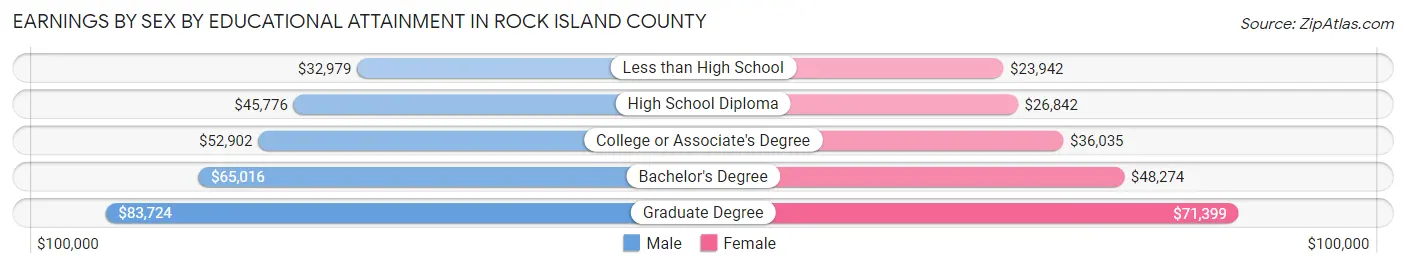
| Educational Attainment | Male Income | Female Income |
| Less than High School | $32,979 | $23,942 |
| High School Diploma | $45,776 | $26,842 |
| College or Associate's Degree | $52,902 | $36,035 |
| Bachelor's Degree | $65,016 | $48,274 |
| Graduate Degree | $83,724 | $71,399 |
| Total | $52,558 | $36,296 |
Family Income in Rock Island County
Family Income Brackets in Rock Island County
According to the Rock Island County family income data, there are 8,746 families falling into the $100,000 to $149,999 income range, which is the most common income bracket and makes up 23.5% of all families. Conversely, the $10,000 to $14,999 income bracket is the least frequent group with only 782 families (2.1%) belonging to this category.
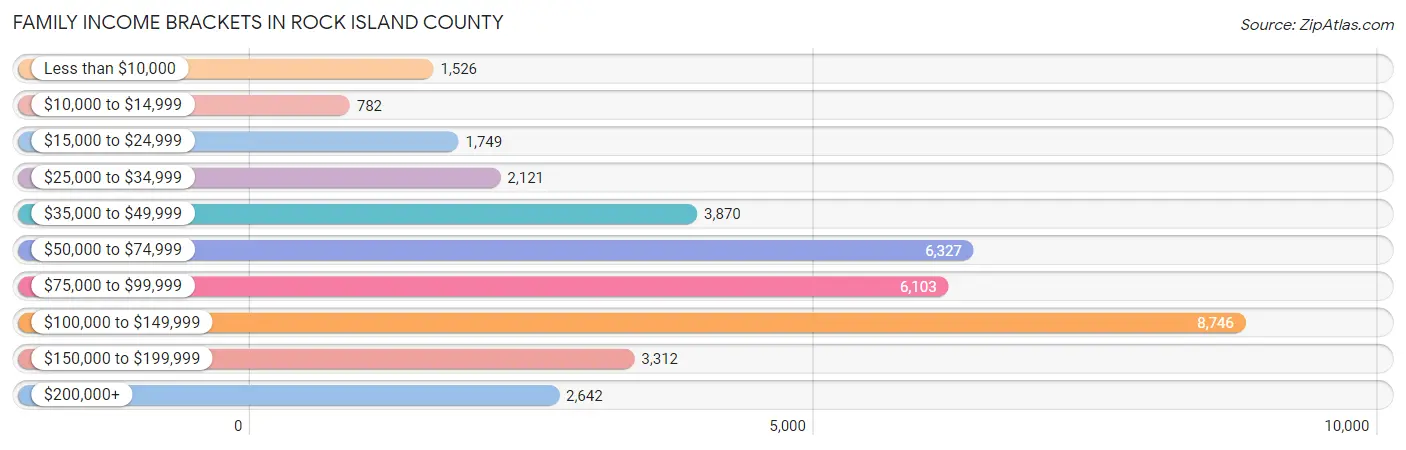
| Income Bracket | # Families | % Families |
| Less than $10,000 | 1,526 | 4.1% |
| $10,000 to $14,999 | 782 | 2.1% |
| $15,000 to $24,999 | 1,749 | 4.7% |
| $25,000 to $34,999 | 2,121 | 5.7% |
| $35,000 to $49,999 | 3,870 | 10.4% |
| $50,000 to $74,999 | 6,327 | 17.0% |
| $75,000 to $99,999 | 6,103 | 16.4% |
| $100,000 to $149,999 | 8,746 | 23.5% |
| $150,000 to $199,999 | 3,312 | 8.9% |
| $200,000+ | 2,642 | 7.1% |
Family Income by Famaliy Size in Rock Island County
5-person families (2,586 | 7.0%) account for the highest median family income in Rock Island County with $103,717 per family, while 2-person families (20,178 | 54.2%) have the highest median income of $39,720 per family member.
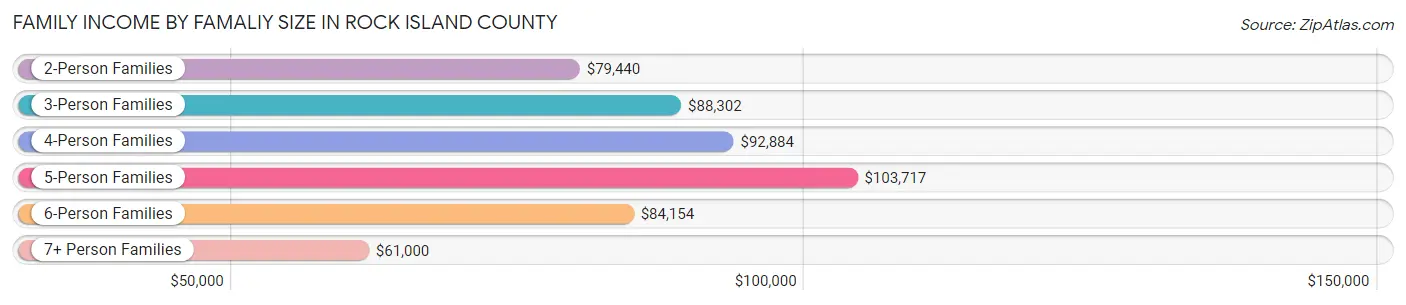
| Income Bracket | # Families | Median Income |
| 2-Person Families | 20,178 (54.2%) | $79,440 |
| 3-Person Families | 6,940 (18.6%) | $88,302 |
| 4-Person Families | 6,137 (16.5%) | $92,884 |
| 5-Person Families | 2,586 (7.0%) | $103,717 |
| 6-Person Families | 923 (2.5%) | $84,154 |
| 7+ Person Families | 452 (1.2%) | $61,000 |
| Total | 37,216 (100.0%) | $83,401 |
Family Income by Number of Earners in Rock Island County
The median family income in Rock Island County is $83,401, with families comprising 3+ earners (4,071) having the highest median family income of $121,621, while families with 1 earner (11,842) have the lowest median family income of $54,902, accounting for 10.9% and 31.8% of families, respectively.
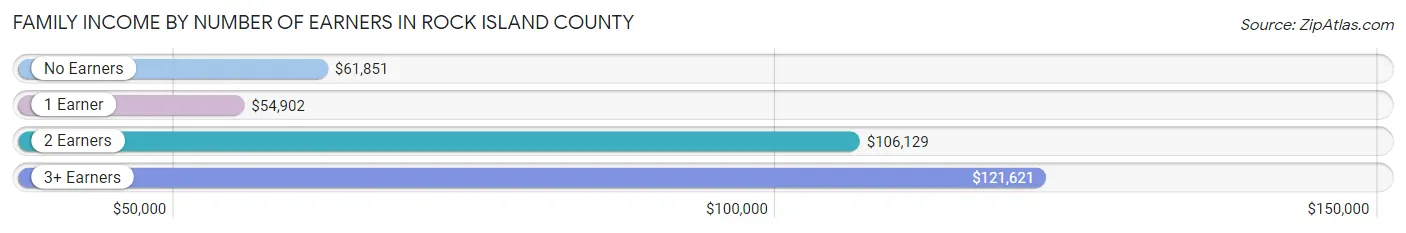
| Number of Earners | # Families | Median Income |
| No Earners | 6,414 (17.2%) | $61,851 |
| 1 Earner | 11,842 (31.8%) | $54,902 |
| 2 Earners | 14,889 (40.0%) | $106,129 |
| 3+ Earners | 4,071 (10.9%) | $121,621 |
| Total | 37,216 (100.0%) | $83,401 |
Household Income in Rock Island County
Household Income Brackets in Rock Island County
With 10,738 households falling in the category, the $100,000 to $149,999 income range is the most frequent in Rock Island County, accounting for 17.6% of all households. In contrast, only 2,502 households (4.1%) fall into the $10,000 to $14,999 income bracket, making it the least populous group.
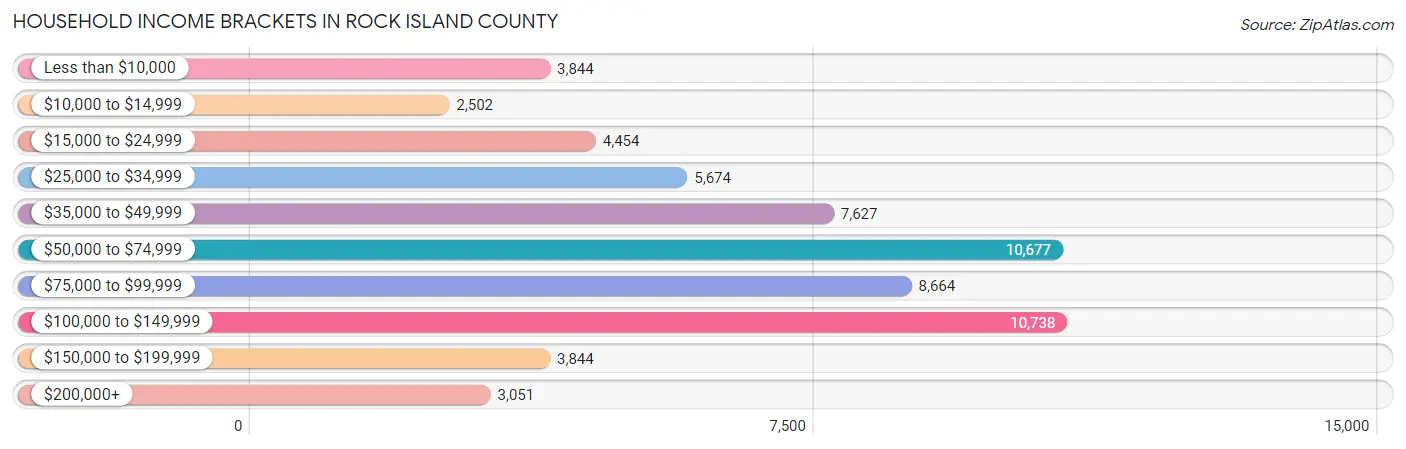
| Income Bracket | # Households | % Households |
| Less than $10,000 | 3,844 | 6.3% |
| $10,000 to $14,999 | 2,502 | 4.1% |
| $15,000 to $24,999 | 4,454 | 7.3% |
| $25,000 to $34,999 | 5,674 | 9.3% |
| $35,000 to $49,999 | 7,627 | 12.5% |
| $50,000 to $74,999 | 10,677 | 17.5% |
| $75,000 to $99,999 | 8,664 | 14.2% |
| $100,000 to $149,999 | 10,738 | 17.6% |
| $150,000 to $199,999 | 3,844 | 6.3% |
| $200,000+ | 3,051 | 5.0% |
Household Income by Householder Age in Rock Island County
The median household income in Rock Island County is $64,435, with the highest median household income of $79,472 found in the 45 to 64 years age bracket for the primary householder. A total of 20,653 households (33.9%) fall into this category. Meanwhile, the 15 to 24 years age bracket for the primary householder has the lowest median household income of $40,506, with 2,900 households (4.8%) in this group.
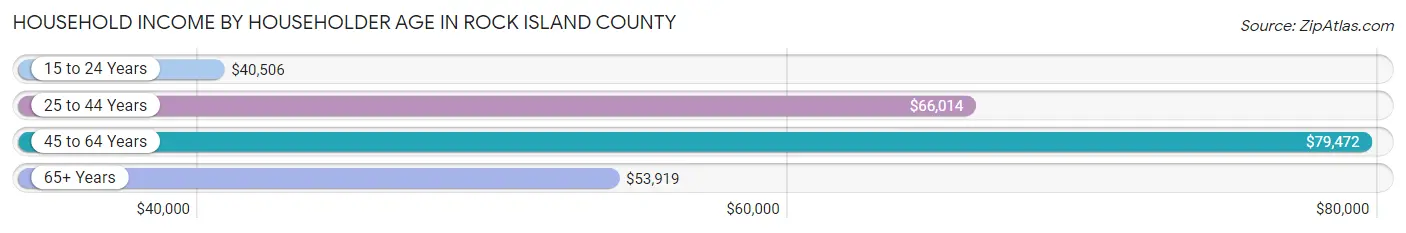
| Income Bracket | # Households | Median Income |
| 15 to 24 Years | 2,900 (4.8%) | $40,506 |
| 25 to 44 Years | 18,532 (30.4%) | $66,014 |
| 45 to 64 Years | 20,653 (33.9%) | $79,472 |
| 65+ Years | 18,929 (31.0%) | $53,919 |
| Total | 61,014 (100.0%) | $64,435 |
Poverty in Rock Island County
Income Below Poverty by Sex and Age in Rock Island County
With 14.5% poverty level for males and 15.8% for females among the residents of Rock Island County, under 5 year old males and 5 year old females are the most vulnerable to poverty, with 1,560 males (35.7%) and 384 females (49.0%) in their respective age groups living below the poverty level.
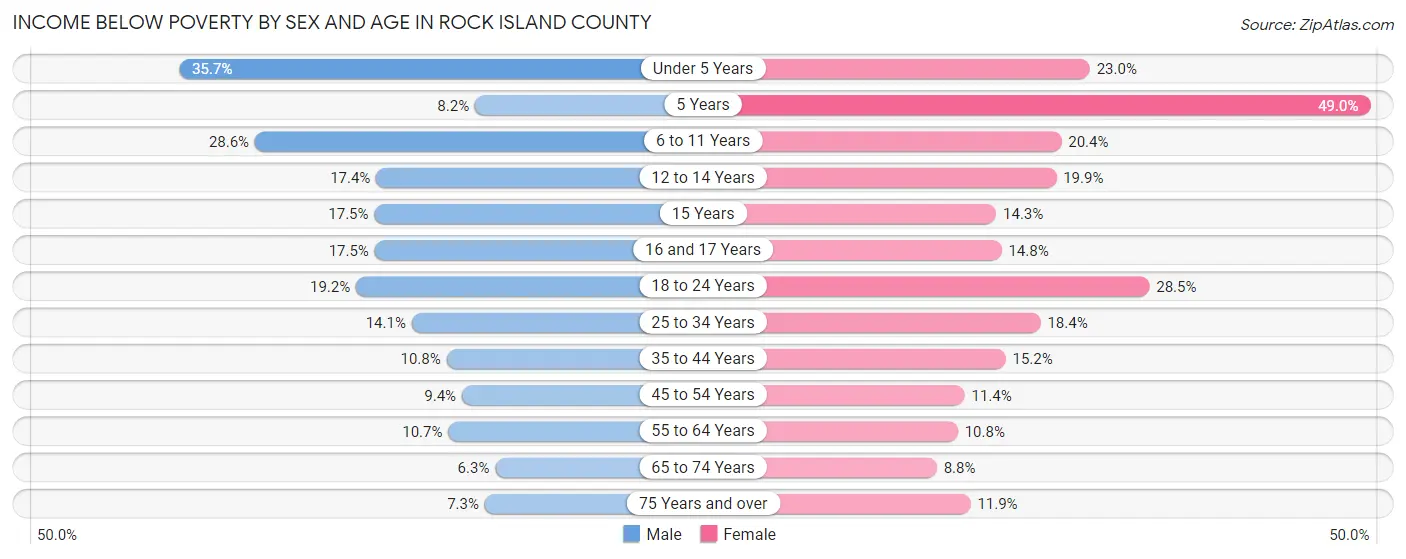
| Age Bracket | Male | Female |
| Under 5 Years | 1,560 (35.7%) | 907 (23.0%) |
| 5 Years | 69 (8.2%) | 384 (49.0%) |
| 6 to 11 Years | 1,566 (28.6%) | 1,038 (20.4%) |
| 12 to 14 Years | 491 (17.4%) | 578 (19.9%) |
| 15 Years | 170 (17.5%) | 110 (14.3%) |
| 16 and 17 Years | 323 (17.5%) | 278 (14.8%) |
| 18 to 24 Years | 1,048 (19.2%) | 1,500 (28.5%) |
| 25 to 34 Years | 1,174 (14.1%) | 1,592 (18.4%) |
| 35 to 44 Years | 922 (10.8%) | 1,274 (15.2%) |
| 45 to 54 Years | 774 (9.4%) | 920 (11.4%) |
| 55 to 64 Years | 980 (10.7%) | 1,042 (10.8%) |
| 65 to 74 Years | 472 (6.3%) | 749 (8.8%) |
| 75 Years and over | 356 (7.3%) | 807 (11.9%) |
| Total | 9,905 (14.5%) | 11,179 (15.8%) |
Income Above Poverty by Sex and Age in Rock Island County
According to the poverty statistics in Rock Island County, males aged 65 to 74 years and females aged 65 to 74 years are the age groups that are most secure financially, with 93.7% of males and 91.2% of females in these age groups living above the poverty line.
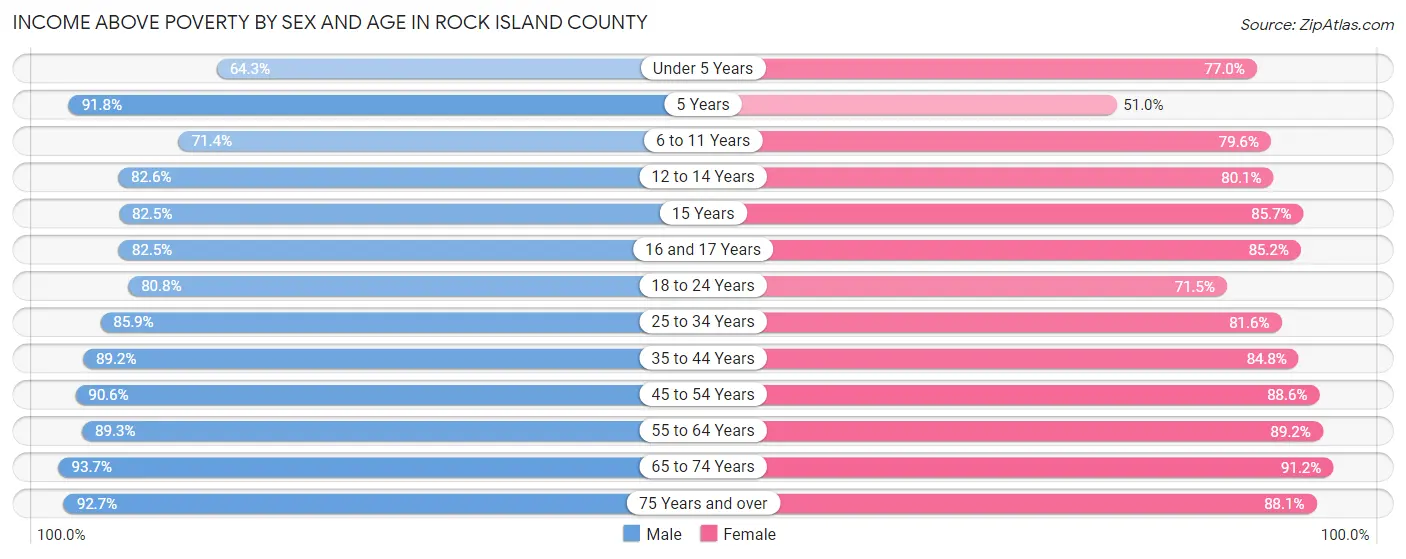
| Age Bracket | Male | Female |
| Under 5 Years | 2,814 (64.3%) | 3,035 (77.0%) |
| 5 Years | 772 (91.8%) | 399 (51.0%) |
| 6 to 11 Years | 3,905 (71.4%) | 4,058 (79.6%) |
| 12 to 14 Years | 2,335 (82.6%) | 2,327 (80.1%) |
| 15 Years | 799 (82.5%) | 658 (85.7%) |
| 16 and 17 Years | 1,522 (82.5%) | 1,598 (85.2%) |
| 18 to 24 Years | 4,398 (80.8%) | 3,756 (71.5%) |
| 25 to 34 Years | 7,171 (85.9%) | 7,040 (81.6%) |
| 35 to 44 Years | 7,584 (89.2%) | 7,105 (84.8%) |
| 45 to 54 Years | 7,448 (90.6%) | 7,157 (88.6%) |
| 55 to 64 Years | 8,200 (89.3%) | 8,644 (89.2%) |
| 65 to 74 Years | 6,991 (93.7%) | 7,753 (91.2%) |
| 75 Years and over | 4,525 (92.7%) | 5,951 (88.1%) |
| Total | 58,464 (85.5%) | 59,481 (84.2%) |
Income Below Poverty Among Married-Couple Families in Rock Island County
The poverty statistics for married-couple families in Rock Island County show that 4.9% or 1,311 of the total 26,832 families live below the poverty line. Families with 5 or more children have the highest poverty rate of 38.5%, comprising of 102 families. On the other hand, families with no children have the lowest poverty rate of 3.1%, which includes 532 families.
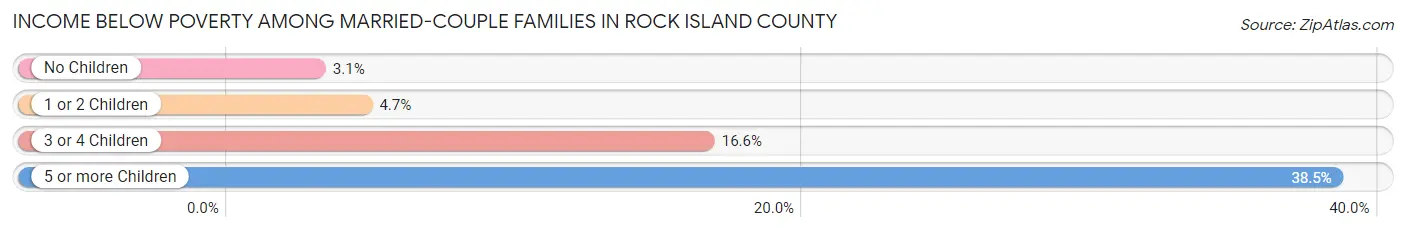
| Children | Above Poverty | Below Poverty |
| No Children | 16,851 (96.9%) | 532 (3.1%) |
| 1 or 2 Children | 6,779 (95.3%) | 333 (4.7%) |
| 3 or 4 Children | 1,728 (83.4%) | 344 (16.6%) |
| 5 or more Children | 163 (61.5%) | 102 (38.5%) |
| Total | 25,521 (95.1%) | 1,311 (4.9%) |
Income Below Poverty Among Single-Parent Households in Rock Island County
According to the poverty data in Rock Island County, 16.0% or 456 single-father households and 30.4% or 2,287 single-mother households are living below the poverty line. Among single-father households, those with 3 or 4 children have the highest poverty rate, with 144 households (48.2%) experiencing poverty. Likewise, among single-mother households, those with 5 or more children have the highest poverty rate, with 32 households (82.1%) falling below the poverty line.
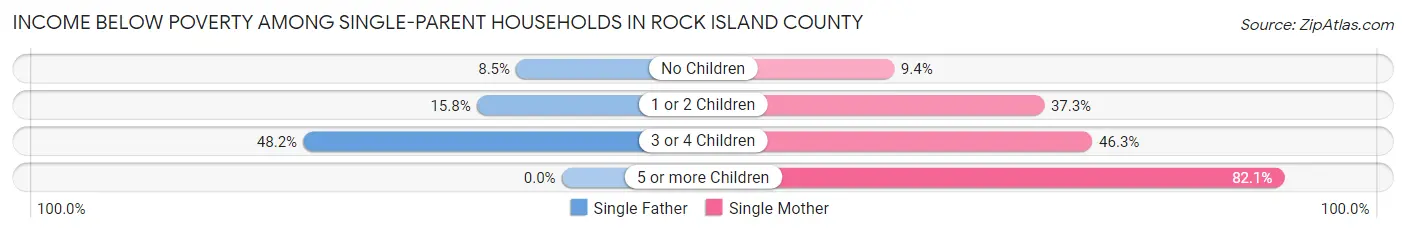
| Children | Single Father | Single Mother |
| No Children | 108 (8.5%) | 216 (9.4%) |
| 1 or 2 Children | 204 (15.8%) | 1,486 (37.3%) |
| 3 or 4 Children | 144 (48.2%) | 553 (46.3%) |
| 5 or more Children | 0 (0.0%) | 32 (82.1%) |
| Total | 456 (16.0%) | 2,287 (30.4%) |
Income Below Poverty Among Married-Couple vs Single-Parent Households in Rock Island County
The poverty data for Rock Island County shows that 1,311 of the married-couple family households (4.9%) and 2,743 of the single-parent households (26.4%) are living below the poverty level. Within the married-couple family households, those with 5 or more children have the highest poverty rate, with 102 households (38.5%) falling below the poverty line. Among the single-parent households, those with 5 or more children have the highest poverty rate, with 32 household (82.1%) living below poverty.
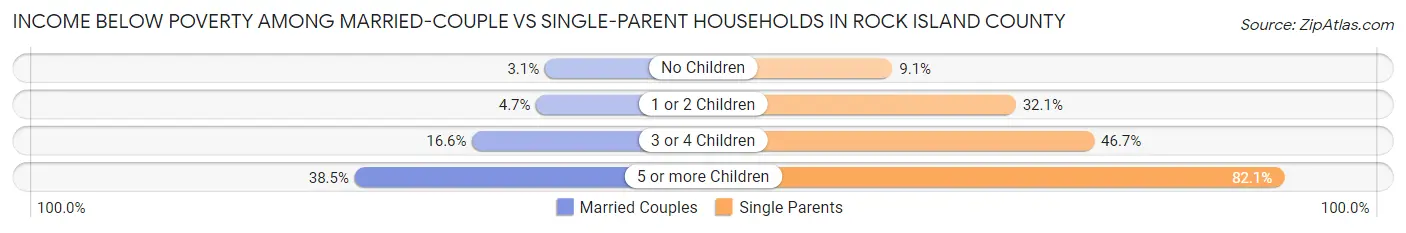
| Children | Married-Couple Families | Single-Parent Households |
| No Children | 532 (3.1%) | 324 (9.1%) |
| 1 or 2 Children | 333 (4.7%) | 1,690 (32.1%) |
| 3 or 4 Children | 344 (16.6%) | 697 (46.7%) |
| 5 or more Children | 102 (38.5%) | 32 (82.1%) |
| Total | 1,311 (4.9%) | 2,743 (26.4%) |
Employment Characteristics in Rock Island County
Employment by Class of Employer in Rock Island County
Among the 65,172 employed individuals in Rock Island County, private company employees (46,374 | 71.2%), not-for-profit organizations (5,740 | 8.8%), and local government employees (4,716 | 7.2%) make up the most common classes of employment.
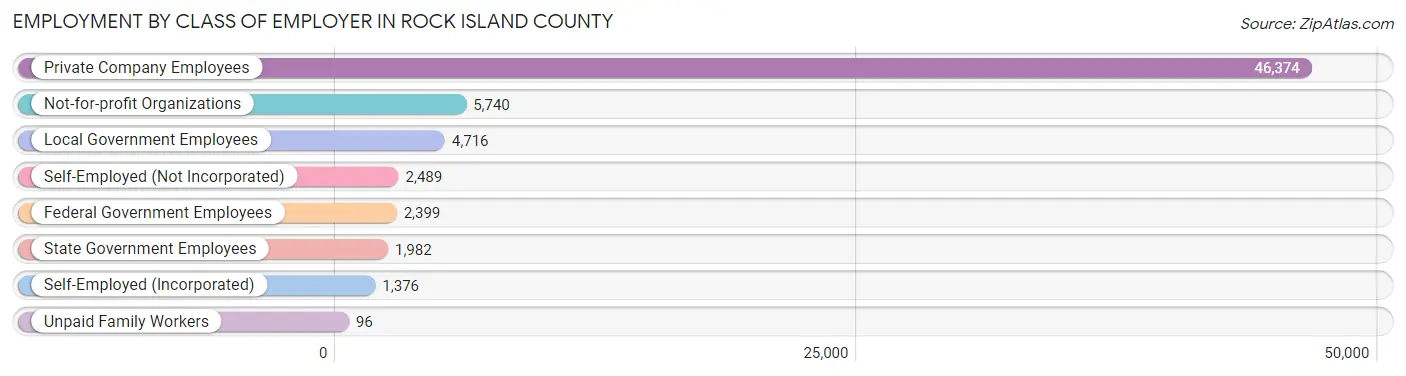
| Employer Class | # Employees | % Employees |
| Private Company Employees | 46,374 | 71.2% |
| Self-Employed (Incorporated) | 1,376 | 2.1% |
| Self-Employed (Not Incorporated) | 2,489 | 3.8% |
| Not-for-profit Organizations | 5,740 | 8.8% |
| Local Government Employees | 4,716 | 7.2% |
| State Government Employees | 1,982 | 3.0% |
| Federal Government Employees | 2,399 | 3.7% |
| Unpaid Family Workers | 96 | 0.2% |
| Total | 65,172 | 100.0% |
Employment Status by Age in Rock Island County
According to the labor force statistics for Rock Island County, out of the total population over 16 years of age (115,453), 61.9% or 71,465 individuals are in the labor force, with 6.2% or 4,431 of them unemployed. The age group with the highest labor force participation rate is 25 to 29 years, with 86.2% or 7,478 individuals in the labor force. Within the labor force, the 16 to 19 years age range has the highest percentage of unemployed individuals, with 10.7% or 472 of them being unemployed.
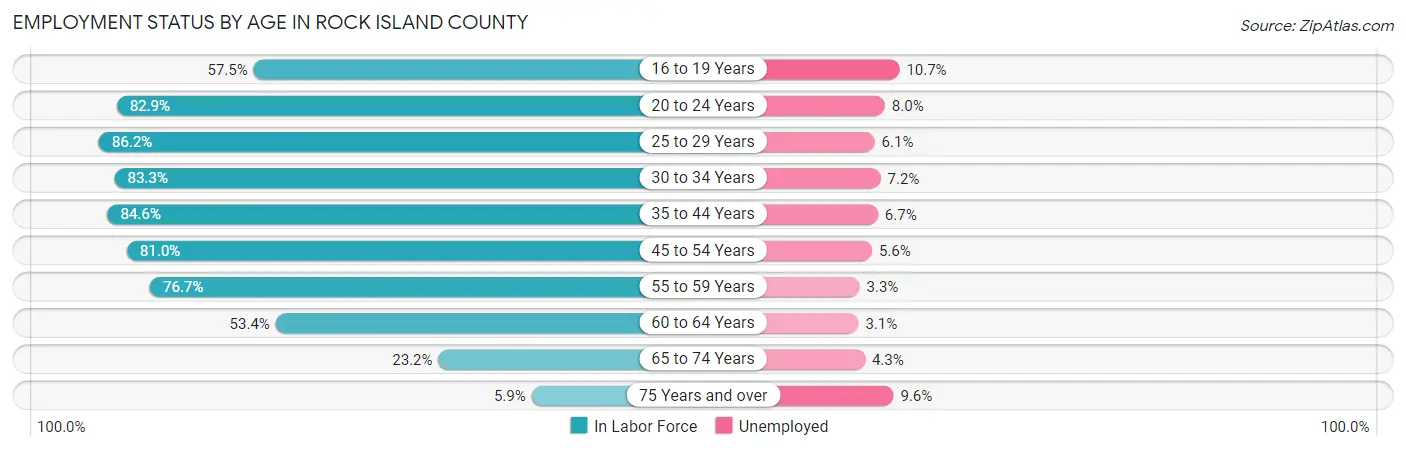
| Age Bracket | In Labor Force | Unemployed |
| 16 to 19 Years | 4,409 (57.5%) | 472 (10.7%) |
| 20 to 24 Years | 7,459 (82.9%) | 597 (8.0%) |
| 25 to 29 Years | 7,478 (86.2%) | 456 (6.1%) |
| 30 to 34 Years | 7,238 (83.3%) | 521 (7.2%) |
| 35 to 44 Years | 14,720 (84.6%) | 986 (6.7%) |
| 45 to 54 Years | 13,375 (81.0%) | 749 (5.6%) |
| 55 to 59 Years | 7,093 (76.7%) | 234 (3.3%) |
| 60 to 64 Years | 5,249 (53.4%) | 163 (3.1%) |
| 65 to 74 Years | 3,787 (23.2%) | 163 (4.3%) |
| 75 Years and over | 715 (5.9%) | 69 (9.6%) |
| Total | 71,465 (61.9%) | 4,431 (6.2%) |
Employment Status by Educational Attainment in Rock Island County
According to labor force statistics for Rock Island County, 78.4% of individuals (55,156) out of the total population between 25 and 64 years of age (70,352) are in the labor force, with 5.7% or 3,144 of them being unemployed. The group with the highest labor force participation rate are those with the educational attainment of bachelor's degree or higher, with 88.2% or 15,207 individuals in the labor force. Within the labor force, individuals with less than high school education have the highest percentage of unemployment, with 15.4% or 715 of them being unemployed.
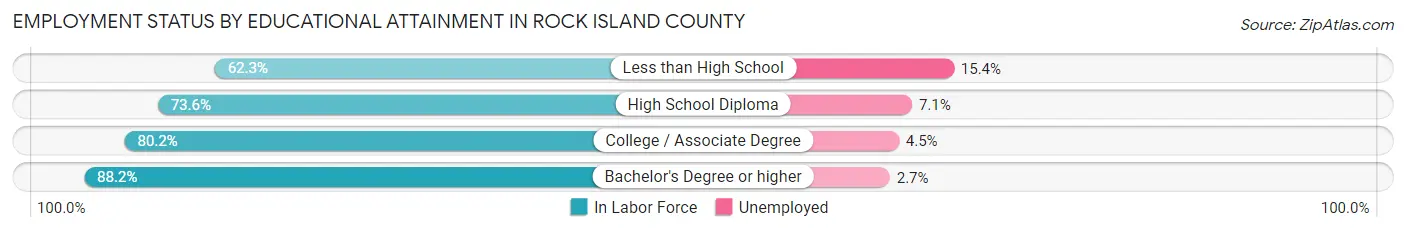
| Educational Attainment | In Labor Force | Unemployed |
| Less than High School | 4,644 (62.3%) | 1,148 (15.4%) |
| High School Diploma | 14,769 (73.6%) | 1,425 (7.1%) |
| College / Associate Degree | 20,522 (80.2%) | 1,152 (4.5%) |
| Bachelor's Degree or higher | 15,207 (88.2%) | 466 (2.7%) |
| Total | 55,156 (78.4%) | 4,010 (5.7%) |
Employment Occupations by Sex in Rock Island County
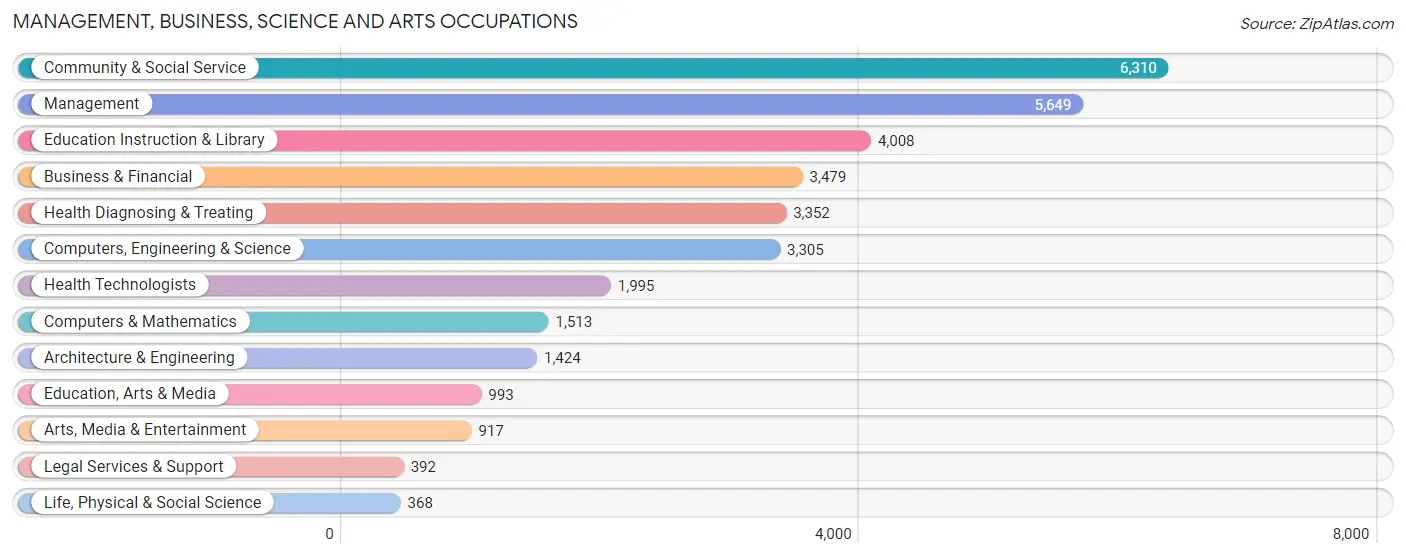
Management, Business, Science and Arts Occupations
The most common Management, Business, Science and Arts occupations in Rock Island County are Community & Social Service (6,310 | 9.4%), Management (5,649 | 8.4%), Education Instruction & Library (4,008 | 6.0%), Business & Financial (3,479 | 5.2%), and Health Diagnosing & Treating (3,352 | 5.0%).
Management, Business, Science and Arts Occupations by Sex
Within the Management, Business, Science and Arts occupations in Rock Island County, the most male-oriented occupations are Architecture & Engineering (90.0%), Computers, Engineering & Science (76.3%), and Computers & Mathematics (70.2%), while the most female-oriented occupations are Health Diagnosing & Treating (83.1%), Health Technologists (82.9%), and Education Instruction & Library (80.5%).
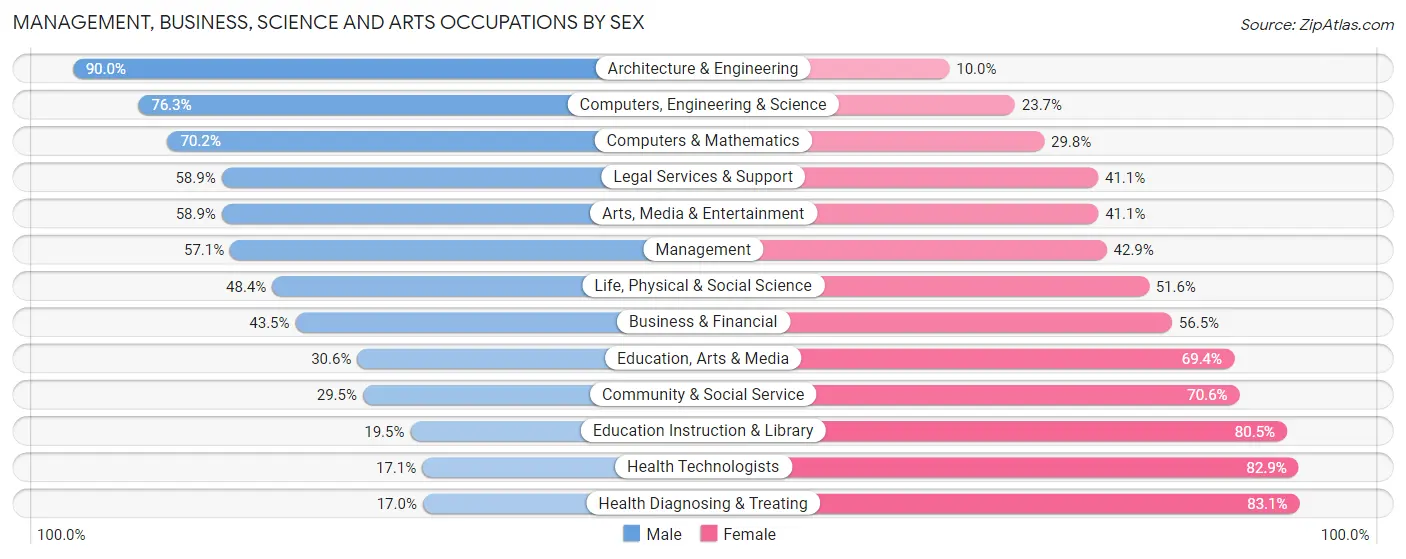
| Occupation | Male | Female |
| Management | 3,228 (57.1%) | 2,421 (42.9%) |
| Business & Financial | 1,514 (43.5%) | 1,965 (56.5%) |
| Computers, Engineering & Science | 2,521 (76.3%) | 784 (23.7%) |
| Computers & Mathematics | 1,062 (70.2%) | 451 (29.8%) |
| Architecture & Engineering | 1,281 (90.0%) | 143 (10.0%) |
| Life, Physical & Social Science | 178 (48.4%) | 190 (51.6%) |
| Community & Social Service | 1,858 (29.4%) | 4,452 (70.6%) |
| Education, Arts & Media | 304 (30.6%) | 689 (69.4%) |
| Legal Services & Support | 231 (58.9%) | 161 (41.1%) |
| Education Instruction & Library | 783 (19.5%) | 3,225 (80.5%) |
| Arts, Media & Entertainment | 540 (58.9%) | 377 (41.1%) |
| Health Diagnosing & Treating | 568 (17.0%) | 2,784 (83.1%) |
| Health Technologists | 341 (17.1%) | 1,654 (82.9%) |
| Total (Category) | 9,689 (43.9%) | 12,406 (56.1%) |
| Total (Overall) | 34,691 (51.9%) | 32,204 (48.1%) |
Services Occupations
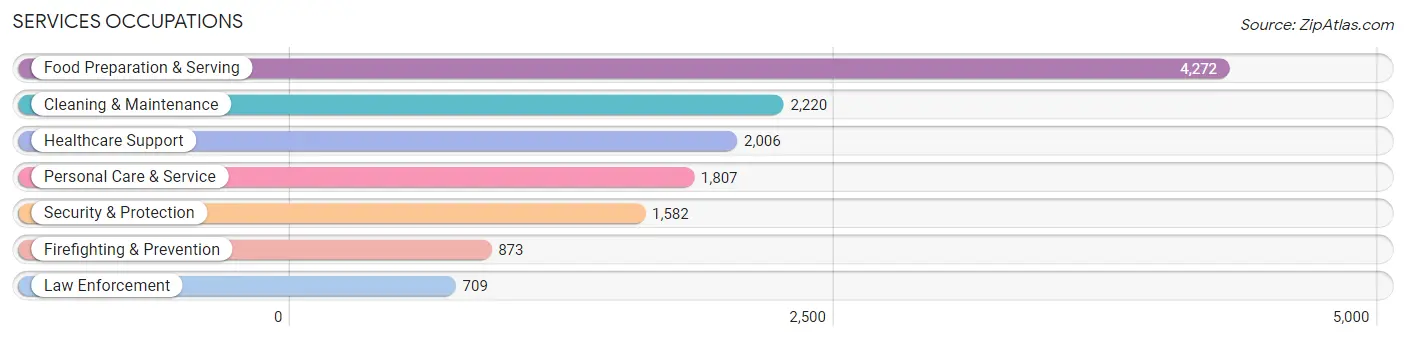
The most common Services occupations in Rock Island County are Food Preparation & Serving (4,272 | 6.4%), Cleaning & Maintenance (2,220 | 3.3%), Healthcare Support (2,006 | 3.0%), Personal Care & Service (1,807 | 2.7%), and Security & Protection (1,582 | 2.4%).
Services Occupations by Sex
Within the Services occupations in Rock Island County, the most male-oriented occupations are Law Enforcement (80.1%), Security & Protection (76.0%), and Firefighting & Prevention (72.7%), while the most female-oriented occupations are Healthcare Support (89.6%), Personal Care & Service (79.2%), and Food Preparation & Serving (61.1%).
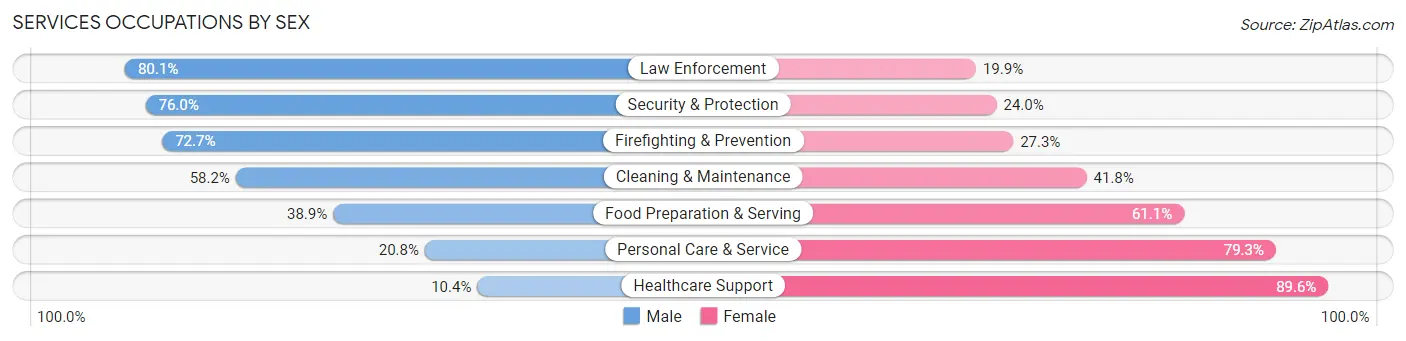
| Occupation | Male | Female |
| Healthcare Support | 208 (10.4%) | 1,798 (89.6%) |
| Security & Protection | 1,203 (76.0%) | 379 (24.0%) |
| Firefighting & Prevention | 635 (72.7%) | 238 (27.3%) |
| Law Enforcement | 568 (80.1%) | 141 (19.9%) |
| Food Preparation & Serving | 1,663 (38.9%) | 2,609 (61.1%) |
| Cleaning & Maintenance | 1,292 (58.2%) | 928 (41.8%) |
| Personal Care & Service | 375 (20.7%) | 1,432 (79.2%) |
| Total (Category) | 4,741 (39.9%) | 7,146 (60.1%) |
| Total (Overall) | 34,691 (51.9%) | 32,204 (48.1%) |
Sales and Office Occupations
The most common Sales and Office occupations in Rock Island County are Office & Administration (7,694 | 11.5%), and Sales & Related (6,194 | 9.3%).

Sales and Office Occupations by Sex
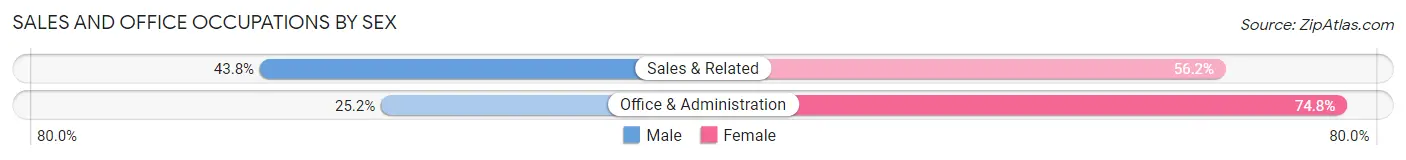
| Occupation | Male | Female |
| Sales & Related | 2,713 (43.8%) | 3,481 (56.2%) |
| Office & Administration | 1,936 (25.2%) | 5,758 (74.8%) |
| Total (Category) | 4,649 (33.5%) | 9,239 (66.5%) |
| Total (Overall) | 34,691 (51.9%) | 32,204 (48.1%) |
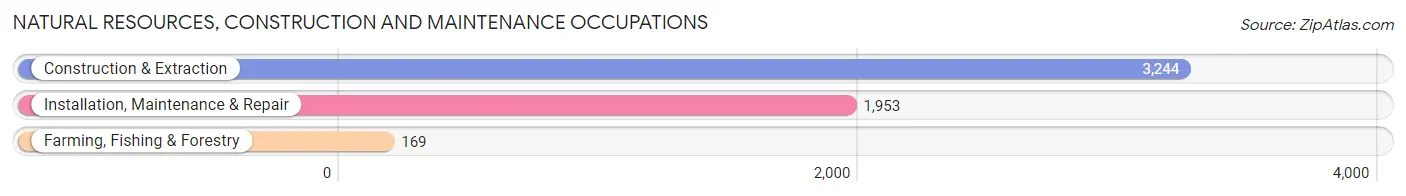
Natural Resources, Construction and Maintenance Occupations
The most common Natural Resources, Construction and Maintenance occupations in Rock Island County are Construction & Extraction (3,244 | 4.9%), Installation, Maintenance & Repair (1,953 | 2.9%), and Farming, Fishing & Forestry (169 | 0.3%).
Natural Resources, Construction and Maintenance Occupations by Sex
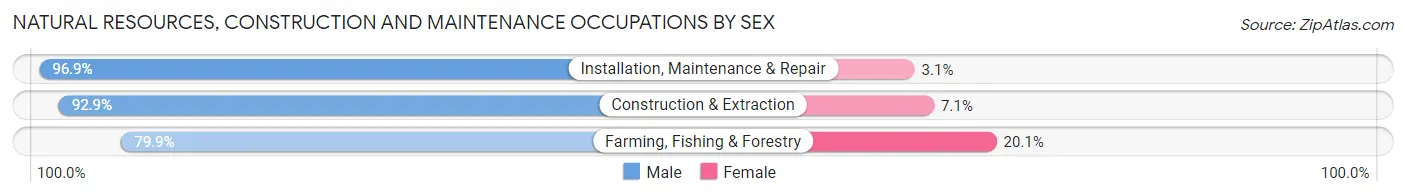
| Occupation | Male | Female |
| Farming, Fishing & Forestry | 135 (79.9%) | 34 (20.1%) |
| Construction & Extraction | 3,013 (92.9%) | 231 (7.1%) |
| Installation, Maintenance & Repair | 1,893 (96.9%) | 60 (3.1%) |
| Total (Category) | 5,041 (93.9%) | 325 (6.1%) |
| Total (Overall) | 34,691 (51.9%) | 32,204 (48.1%) |
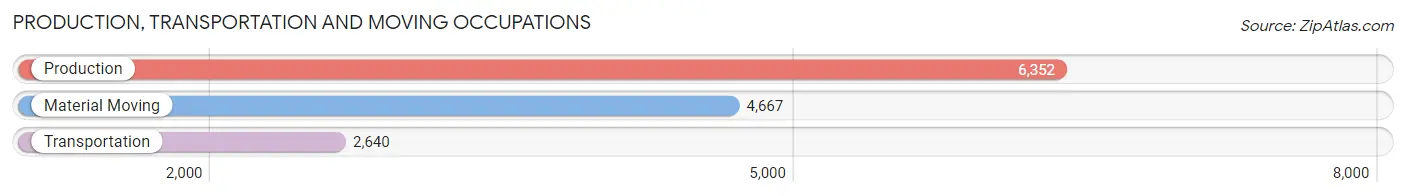
Production, Transportation and Moving Occupations
The most common Production, Transportation and Moving occupations in Rock Island County are Production (6,352 | 9.5%), Material Moving (4,667 | 7.0%), and Transportation (2,640 | 4.0%).
Production, Transportation and Moving Occupations by Sex
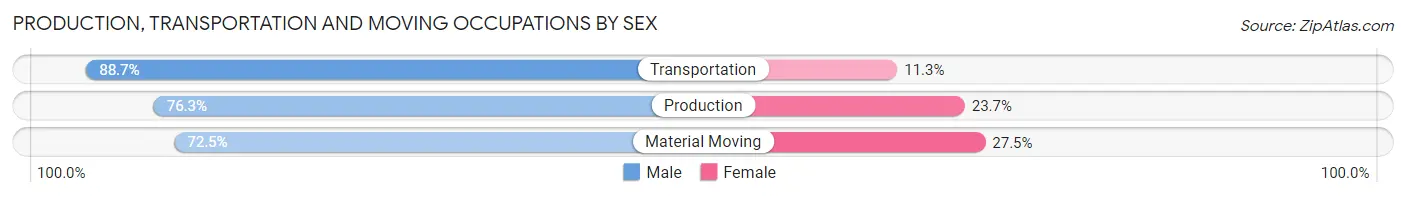
| Occupation | Male | Female |
| Production | 4,846 (76.3%) | 1,506 (23.7%) |
| Transportation | 2,341 (88.7%) | 299 (11.3%) |
| Material Moving | 3,384 (72.5%) | 1,283 (27.5%) |
| Total (Category) | 10,571 (77.4%) | 3,088 (22.6%) |
| Total (Overall) | 34,691 (51.9%) | 32,204 (48.1%) |
Employment Industries by Sex in Rock Island County
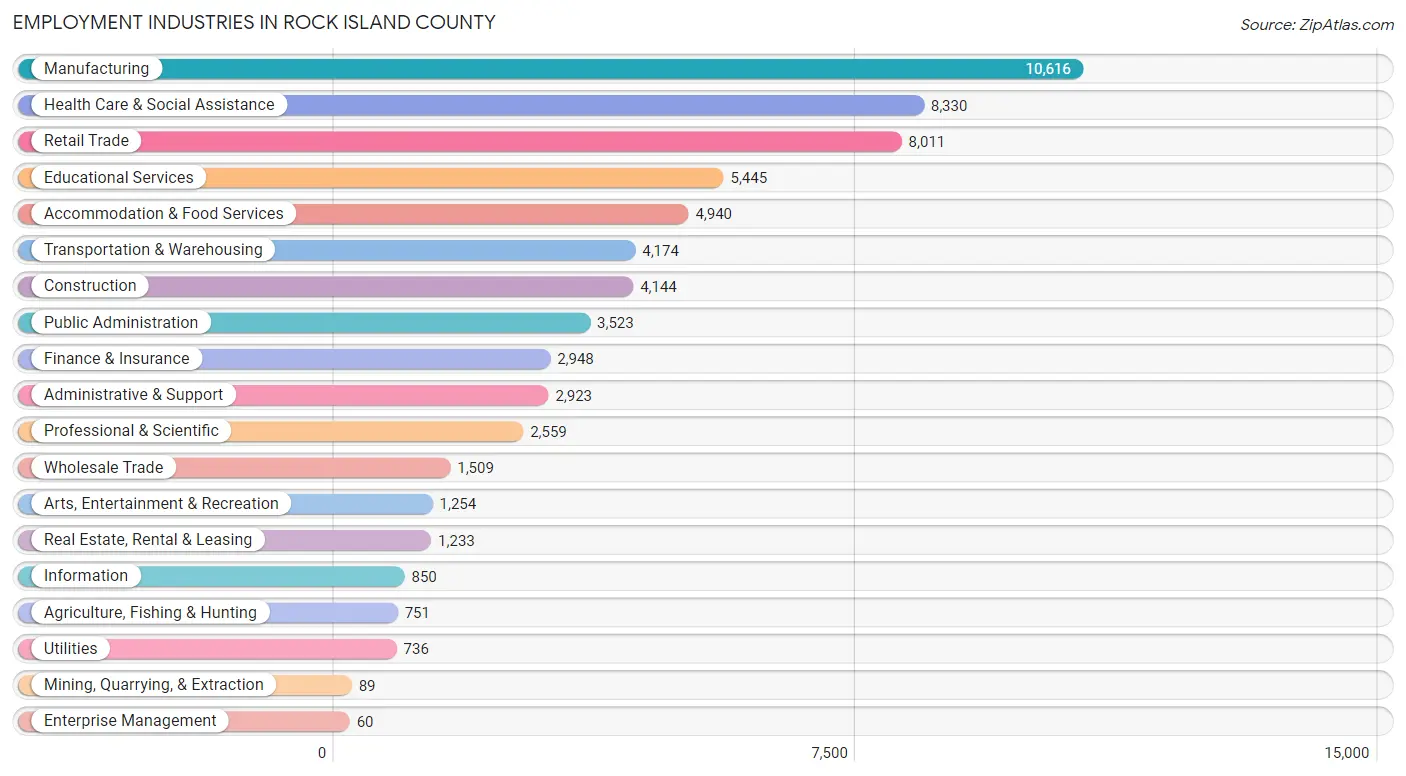
Employment Industries in Rock Island County
The major employment industries in Rock Island County include Manufacturing (10,616 | 15.9%), Health Care & Social Assistance (8,330 | 12.4%), Retail Trade (8,011 | 12.0%), Educational Services (5,445 | 8.1%), and Accommodation & Food Services (4,940 | 7.4%).
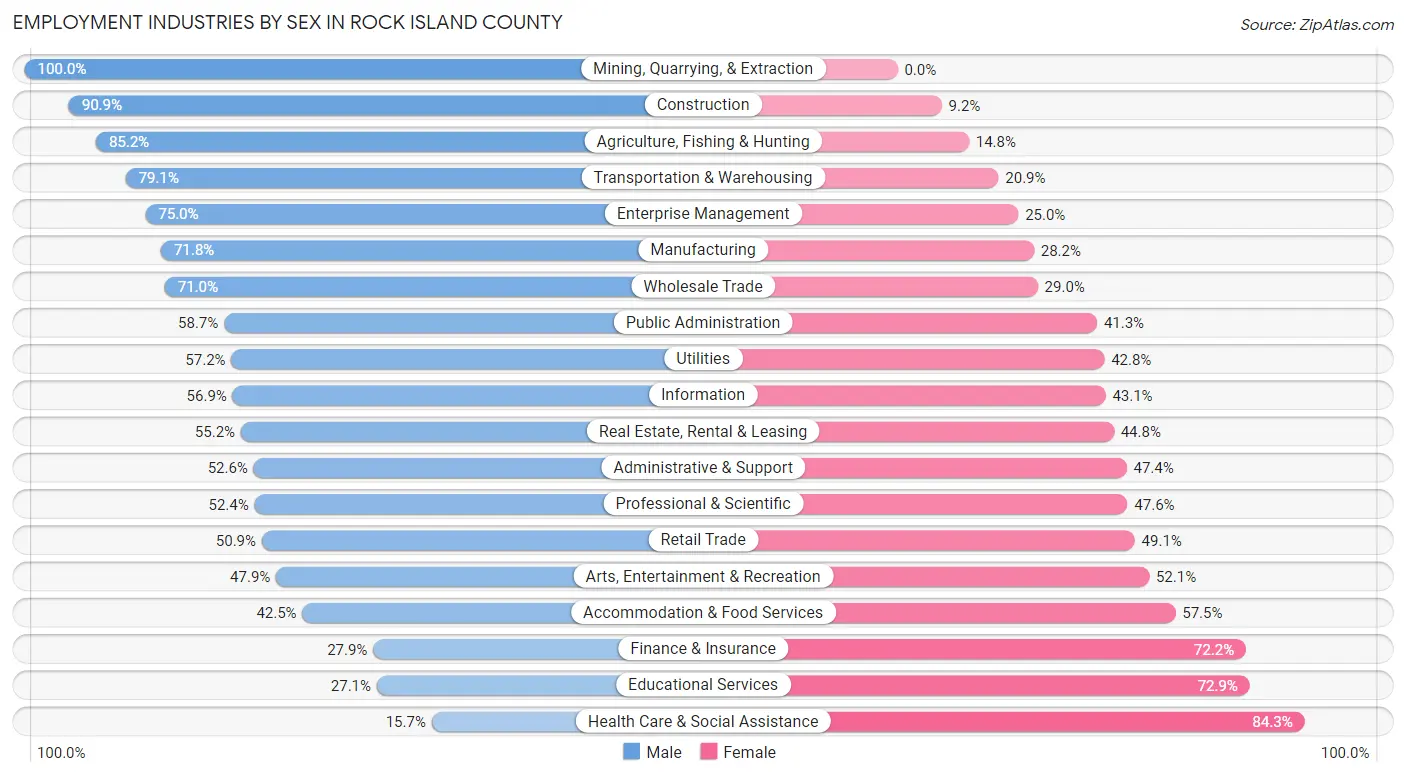
Employment Industries by Sex in Rock Island County
The Rock Island County industries that see more men than women are Mining, Quarrying, & Extraction (100.0%), Construction (90.8%), and Agriculture, Fishing & Hunting (85.2%), whereas the industries that tend to have a higher number of women are Health Care & Social Assistance (84.3%), Educational Services (72.9%), and Finance & Insurance (72.2%).
| Industry | Male | Female |
| Agriculture, Fishing & Hunting | 640 (85.2%) | 111 (14.8%) |
| Mining, Quarrying, & Extraction | 89 (100.0%) | 0 (0.0%) |
| Construction | 3,765 (90.8%) | 379 (9.1%) |
| Manufacturing | 7,619 (71.8%) | 2,997 (28.2%) |
| Wholesale Trade | 1,071 (71.0%) | 438 (29.0%) |
| Retail Trade | 4,077 (50.9%) | 3,934 (49.1%) |
| Transportation & Warehousing | 3,302 (79.1%) | 872 (20.9%) |
| Utilities | 421 (57.2%) | 315 (42.8%) |
| Information | 484 (56.9%) | 366 (43.1%) |
| Finance & Insurance | 821 (27.9%) | 2,127 (72.2%) |
| Real Estate, Rental & Leasing | 681 (55.2%) | 552 (44.8%) |
| Professional & Scientific | 1,341 (52.4%) | 1,218 (47.6%) |
| Enterprise Management | 45 (75.0%) | 15 (25.0%) |
| Administrative & Support | 1,537 (52.6%) | 1,386 (47.4%) |
| Educational Services | 1,475 (27.1%) | 3,970 (72.9%) |
| Health Care & Social Assistance | 1,310 (15.7%) | 7,020 (84.3%) |
| Arts, Entertainment & Recreation | 601 (47.9%) | 653 (52.1%) |
| Accommodation & Food Services | 2,099 (42.5%) | 2,841 (57.5%) |
| Public Administration | 2,068 (58.7%) | 1,455 (41.3%) |
| Total | 34,691 (51.9%) | 32,204 (48.1%) |
Education in Rock Island County
School Enrollment in Rock Island County
The most common levels of schooling among the 33,013 students in Rock Island County are middle school (7,503 | 22.7%), high school (6,901 | 20.9%), and elementary school (6,575 | 19.9%).

| School Level | # Students | % Students |
| Nursery / Preschool | 2,397 | 7.3% |
| Kindergarten | 1,853 | 5.6% |
| Elementary School | 6,575 | 19.9% |
| Middle School | 7,503 | 22.7% |
| High School | 6,901 | 20.9% |
| College / Undergraduate | 6,472 | 19.6% |
| Graduate / Professional | 1,312 | 4.0% |
| Total | 33,013 | 100.0% |
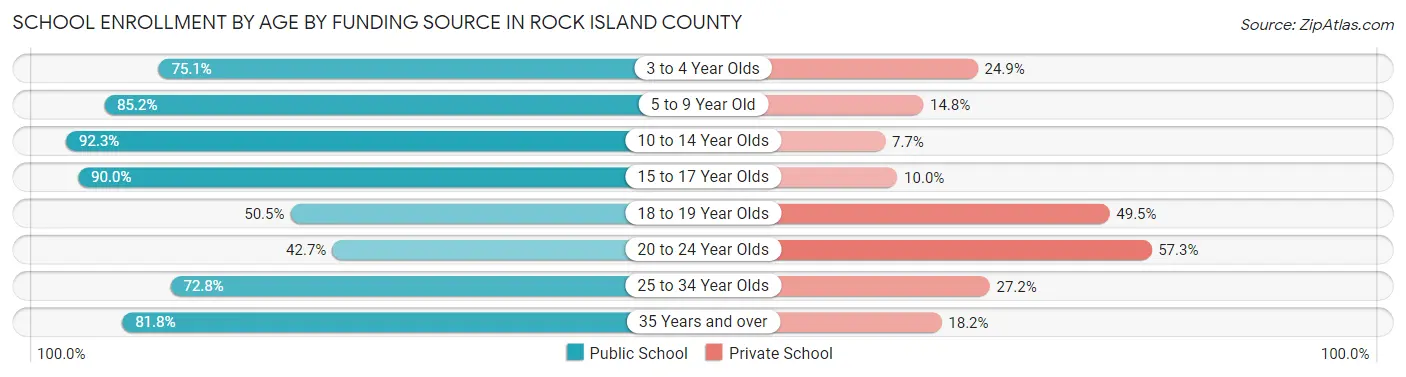
School Enrollment by Age by Funding Source in Rock Island County
Out of a total of 33,013 students who are enrolled in schools in Rock Island County, 6,669 (20.2%) attend a private institution, while the remaining 26,344 (79.8%) are enrolled in public schools. The age group of 20 to 24 year olds has the highest likelihood of being enrolled in private schools, with 1,830 (57.3% in the age bracket) enrolled. Conversely, the age group of 10 to 14 year olds has the lowest likelihood of being enrolled in a private school, with 8,300 (92.3% in the age bracket) attending a public institution.
| Age Bracket | Public School | Private School |
| 3 to 4 Year Olds | 1,300 (75.1%) | 432 (24.9%) |
| 5 to 9 Year Old | 7,214 (85.2%) | 1,252 (14.8%) |
| 10 to 14 Year Olds | 8,300 (92.3%) | 692 (7.7%) |
| 15 to 17 Year Olds | 4,627 (90.0%) | 512 (10.0%) |
| 18 to 19 Year Olds | 1,325 (50.5%) | 1,298 (49.5%) |
| 20 to 24 Year Olds | 1,364 (42.7%) | 1,830 (57.3%) |
| 25 to 34 Year Olds | 1,115 (72.8%) | 416 (27.2%) |
| 35 Years and over | 1,093 (81.8%) | 243 (18.2%) |
| Total | 26,344 (79.8%) | 6,669 (20.2%) |
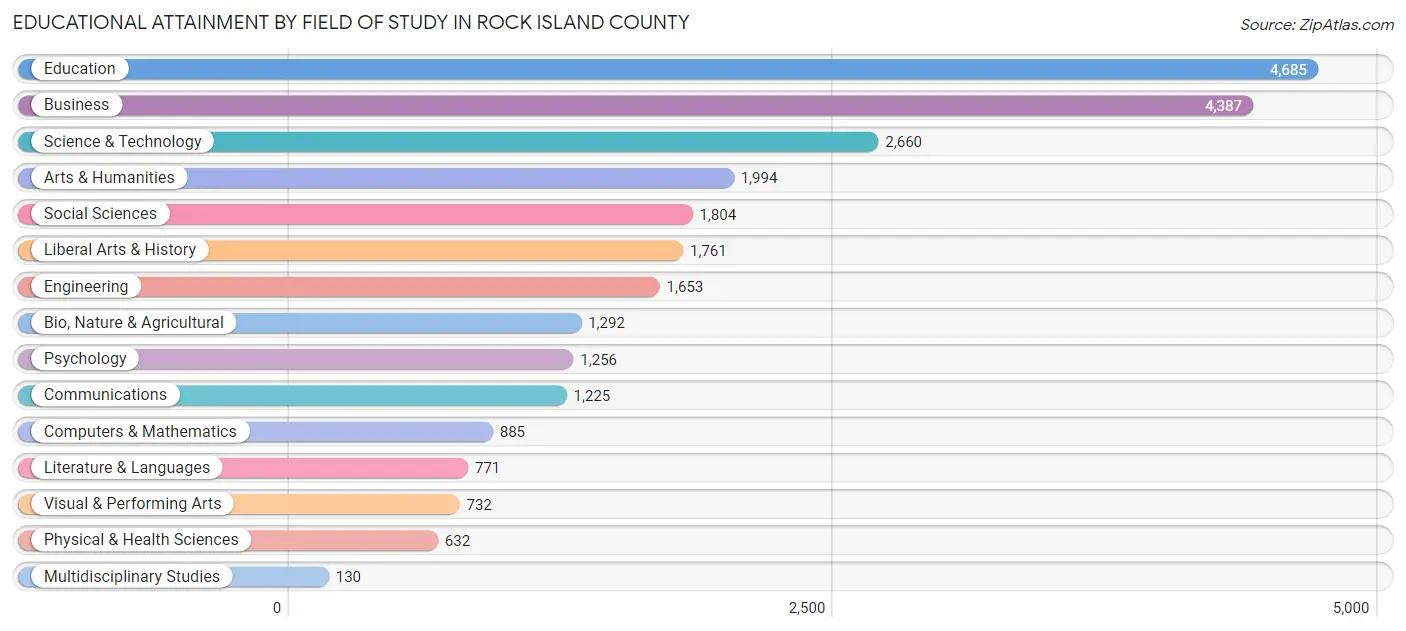
Educational Attainment by Field of Study in Rock Island County
Education (4,685 | 18.1%), business (4,387 | 17.0%), science & technology (2,660 | 10.3%), arts & humanities (1,994 | 7.7%), and social sciences (1,804 | 7.0%) are the most common fields of study among 25,867 individuals in Rock Island County who have obtained a bachelor's degree or higher.
| Field of Study | # Graduates | % Graduates |
| Computers & Mathematics | 885 | 3.4% |
| Bio, Nature & Agricultural | 1,292 | 5.0% |
| Physical & Health Sciences | 632 | 2.4% |
| Psychology | 1,256 | 4.9% |
| Social Sciences | 1,804 | 7.0% |
| Engineering | 1,653 | 6.4% |
| Multidisciplinary Studies | 130 | 0.5% |
| Science & Technology | 2,660 | 10.3% |
| Business | 4,387 | 17.0% |
| Education | 4,685 | 18.1% |
| Literature & Languages | 771 | 3.0% |
| Liberal Arts & History | 1,761 | 6.8% |
| Visual & Performing Arts | 732 | 2.8% |
| Communications | 1,225 | 4.7% |
| Arts & Humanities | 1,994 | 7.7% |
| Total | 25,867 | 100.0% |
Transportation & Commute in Rock Island County
Vehicle Availability by Sex in Rock Island County
The most prevalent vehicle ownership categories in Rock Island County are males with 2 vehicles (16,388, accounting for 48.6%) and females with 2 vehicles (13,768, making up 53.9%).
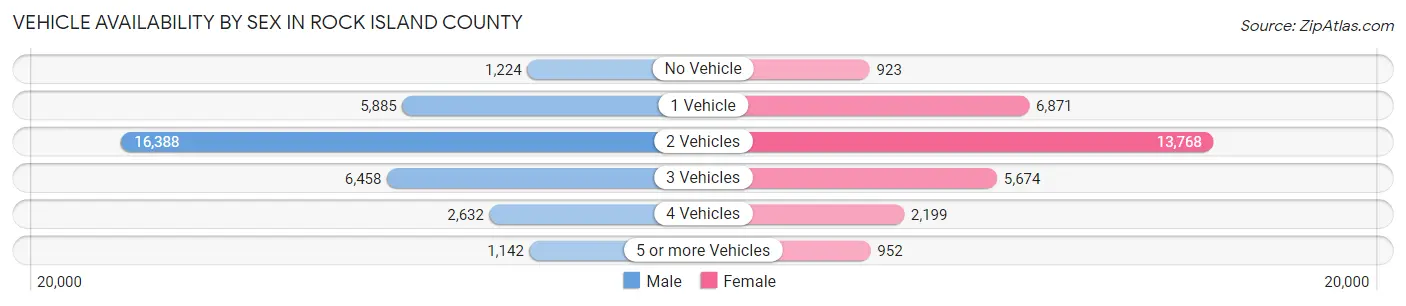
| Vehicles Available | Male | Female |
| No Vehicle | 1,224 (3.6%) | 923 (3.0%) |
| 1 Vehicle | 5,885 (17.4%) | 6,871 (22.6%) |
| 2 Vehicles | 16,388 (48.6%) | 13,768 (45.3%) |
| 3 Vehicles | 6,458 (19.2%) | 5,674 (18.7%) |
| 4 Vehicles | 2,632 (7.8%) | 2,199 (7.2%) |
| 5 or more Vehicles | 1,142 (3.4%) | 952 (3.1%) |
| Total | 33,729 (100.0%) | 30,387 (100.0%) |
Commute Time in Rock Island County
The most frequently occuring commute durations in Rock Island County are 15 to 19 minutes (13,631 commuters, 22.1%), 20 to 24 minutes (11,097 commuters, 18.0%), and 10 to 14 minutes (9,857 commuters, 16.0%).
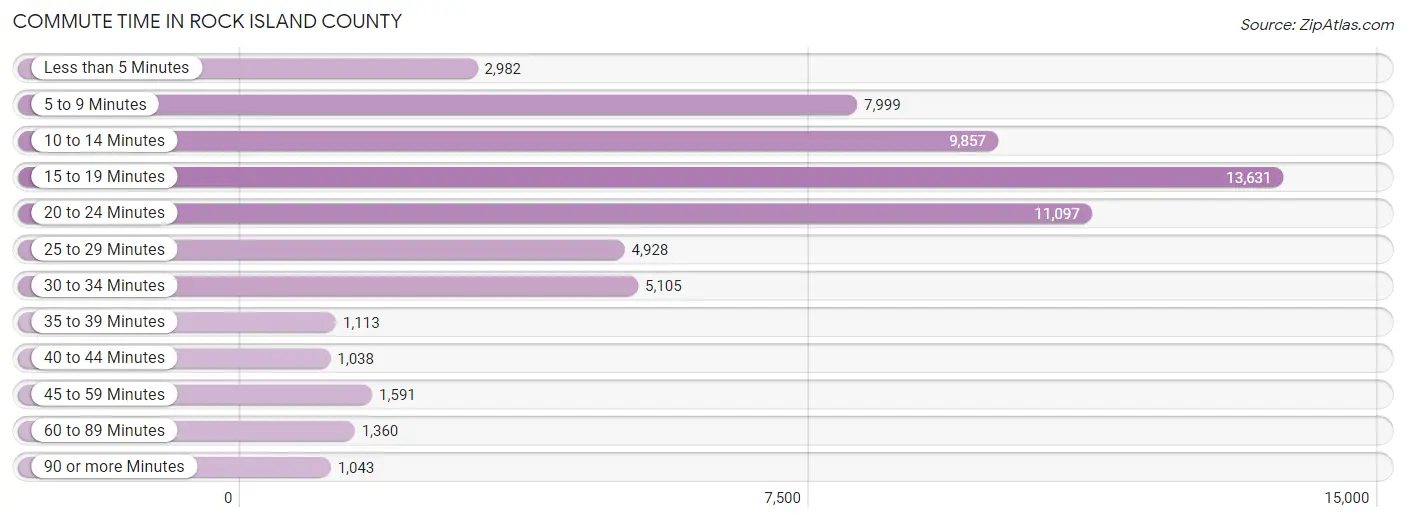
| Commute Time | # Commuters | % Commuters |
| Less than 5 Minutes | 2,982 | 4.8% |
| 5 to 9 Minutes | 7,999 | 13.0% |
| 10 to 14 Minutes | 9,857 | 16.0% |
| 15 to 19 Minutes | 13,631 | 22.1% |
| 20 to 24 Minutes | 11,097 | 18.0% |
| 25 to 29 Minutes | 4,928 | 8.0% |
| 30 to 34 Minutes | 5,105 | 8.3% |
| 35 to 39 Minutes | 1,113 | 1.8% |
| 40 to 44 Minutes | 1,038 | 1.7% |
| 45 to 59 Minutes | 1,591 | 2.6% |
| 60 to 89 Minutes | 1,360 | 2.2% |
| 90 or more Minutes | 1,043 | 1.7% |
Commute Time by Sex in Rock Island County
The most common commute times in Rock Island County are 15 to 19 minutes (7,199 commuters, 22.0%) for males and 15 to 19 minutes (6,432 commuters, 22.2%) for females.
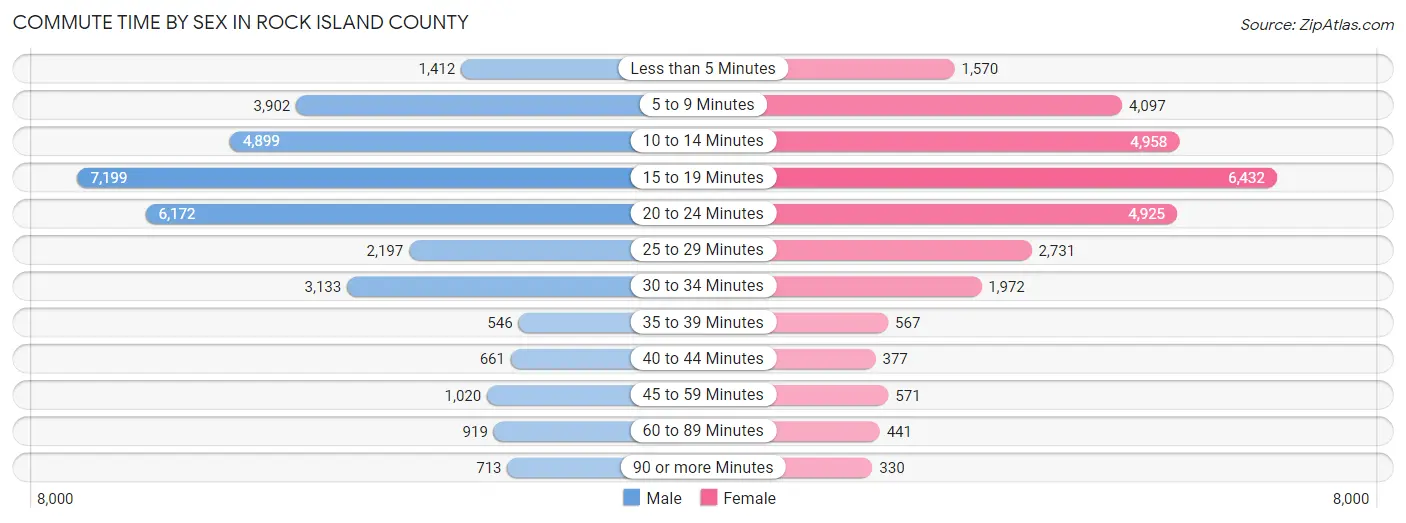
| Commute Time | Male | Female |
| Less than 5 Minutes | 1,412 (4.3%) | 1,570 (5.4%) |
| 5 to 9 Minutes | 3,902 (11.9%) | 4,097 (14.1%) |
| 10 to 14 Minutes | 4,899 (14.9%) | 4,958 (17.1%) |
| 15 to 19 Minutes | 7,199 (22.0%) | 6,432 (22.2%) |
| 20 to 24 Minutes | 6,172 (18.8%) | 4,925 (17.0%) |
| 25 to 29 Minutes | 2,197 (6.7%) | 2,731 (9.4%) |
| 30 to 34 Minutes | 3,133 (9.6%) | 1,972 (6.8%) |
| 35 to 39 Minutes | 546 (1.7%) | 567 (2.0%) |
| 40 to 44 Minutes | 661 (2.0%) | 377 (1.3%) |
| 45 to 59 Minutes | 1,020 (3.1%) | 571 (2.0%) |
| 60 to 89 Minutes | 919 (2.8%) | 441 (1.5%) |
| 90 or more Minutes | 713 (2.2%) | 330 (1.1%) |
Time of Departure to Work by Sex in Rock Island County
The most frequent times of departure to work in Rock Island County are 6:30 AM to 6:59 AM (3,573, 10.9%) for males and 7:30 AM to 7:59 AM (4,698, 16.2%) for females.
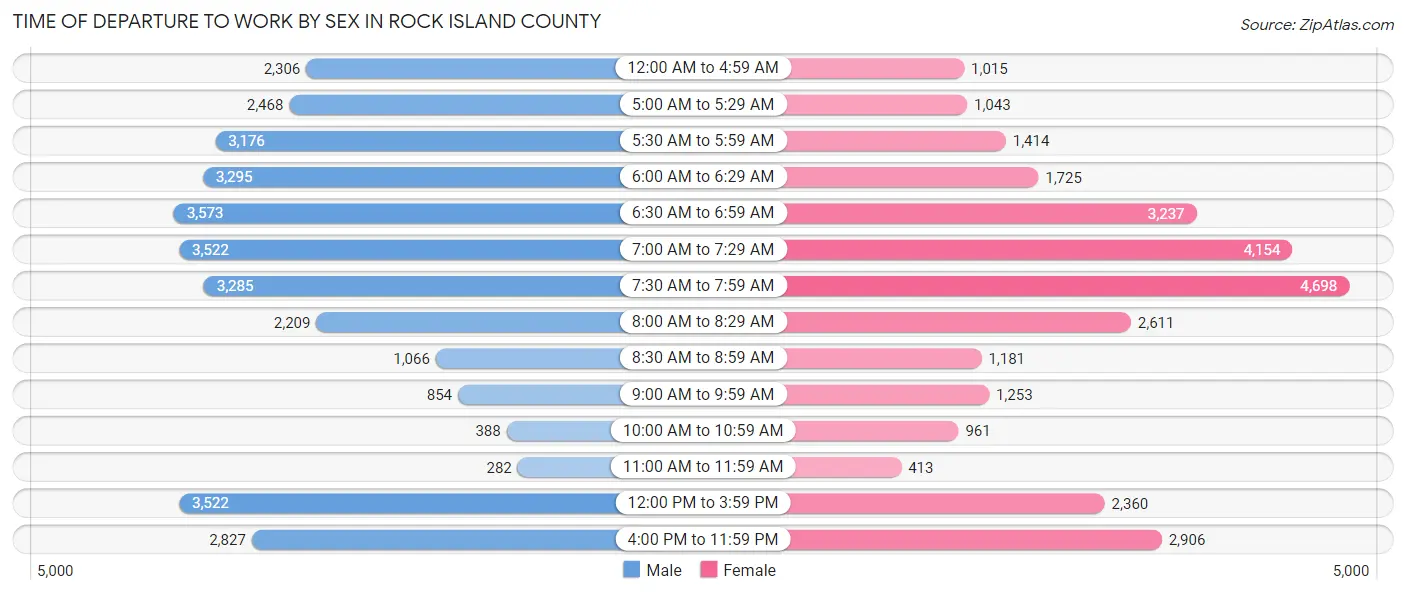
| Time of Departure | Male | Female |
| 12:00 AM to 4:59 AM | 2,306 (7.0%) | 1,015 (3.5%) |
| 5:00 AM to 5:29 AM | 2,468 (7.5%) | 1,043 (3.6%) |
| 5:30 AM to 5:59 AM | 3,176 (9.7%) | 1,414 (4.9%) |
| 6:00 AM to 6:29 AM | 3,295 (10.1%) | 1,725 (5.9%) |
| 6:30 AM to 6:59 AM | 3,573 (10.9%) | 3,237 (11.2%) |
| 7:00 AM to 7:29 AM | 3,522 (10.7%) | 4,154 (14.3%) |
| 7:30 AM to 7:59 AM | 3,285 (10.0%) | 4,698 (16.2%) |
| 8:00 AM to 8:29 AM | 2,209 (6.7%) | 2,611 (9.0%) |
| 8:30 AM to 8:59 AM | 1,066 (3.3%) | 1,181 (4.1%) |
| 9:00 AM to 9:59 AM | 854 (2.6%) | 1,253 (4.3%) |
| 10:00 AM to 10:59 AM | 388 (1.2%) | 961 (3.3%) |
| 11:00 AM to 11:59 AM | 282 (0.9%) | 413 (1.4%) |
| 12:00 PM to 3:59 PM | 3,522 (10.7%) | 2,360 (8.2%) |
| 4:00 PM to 11:59 PM | 2,827 (8.6%) | 2,906 (10.0%) |
| Total | 32,773 (100.0%) | 28,971 (100.0%) |
Housing Occupancy in Rock Island County
Occupancy by Ownership in Rock Island County
Of the total 61,014 dwellings in Rock Island County, owner-occupied units account for 41,853 (68.6%), while renter-occupied units make up 19,161 (31.4%).
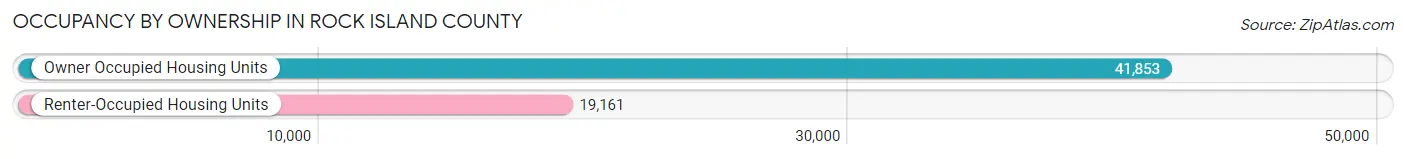
| Occupancy | # Housing Units | % Housing Units |
| Owner Occupied Housing Units | 41,853 | 68.6% |
| Renter-Occupied Housing Units | 19,161 | 31.4% |
| Total Occupied Housing Units | 61,014 | 100.0% |
Occupancy by Household Size in Rock Island County
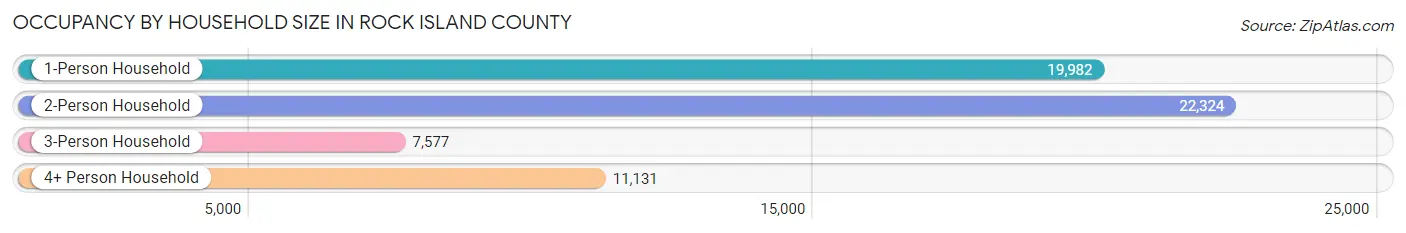
| Household Size | # Housing Units | % Housing Units |
| 1-Person Household | 19,982 | 32.8% |
| 2-Person Household | 22,324 | 36.6% |
| 3-Person Household | 7,577 | 12.4% |
| 4+ Person Household | 11,131 | 18.2% |
| Total Housing Units | 61,014 | 100.0% |
Occupancy by Ownership by Household Size in Rock Island County
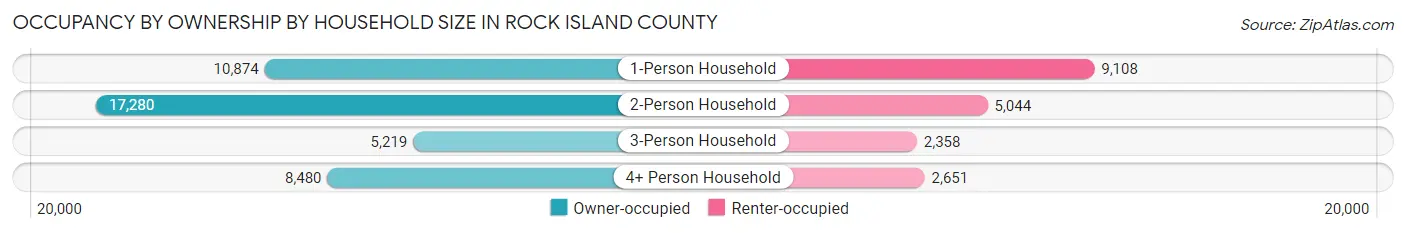
| Household Size | Owner-occupied | Renter-occupied |
| 1-Person Household | 10,874 (54.4%) | 9,108 (45.6%) |
| 2-Person Household | 17,280 (77.4%) | 5,044 (22.6%) |
| 3-Person Household | 5,219 (68.9%) | 2,358 (31.1%) |
| 4+ Person Household | 8,480 (76.2%) | 2,651 (23.8%) |
| Total Housing Units | 41,853 (68.6%) | 19,161 (31.4%) |
Occupancy by Educational Attainment in Rock Island County
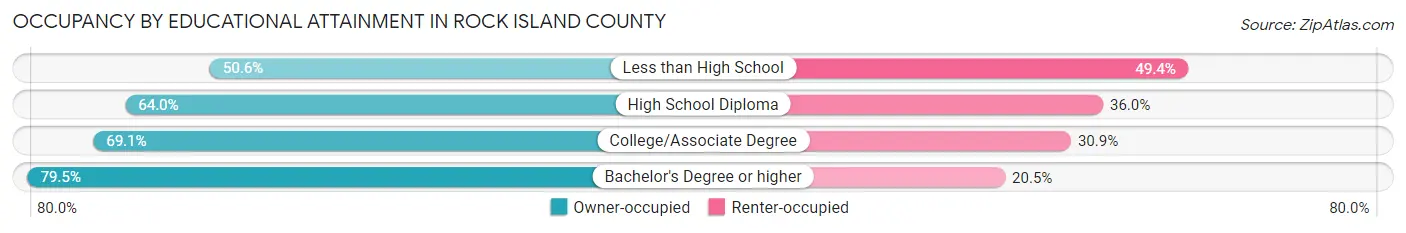
| Household Size | Owner-occupied | Renter-occupied |
| Less than High School | 2,851 (50.6%) | 2,783 (49.4%) |
| High School Diploma | 10,907 (64.0%) | 6,132 (36.0%) |
| College/Associate Degree | 15,885 (69.1%) | 7,105 (30.9%) |
| Bachelor's Degree or higher | 12,210 (79.5%) | 3,141 (20.5%) |
Occupancy by Age of Householder in Rock Island County
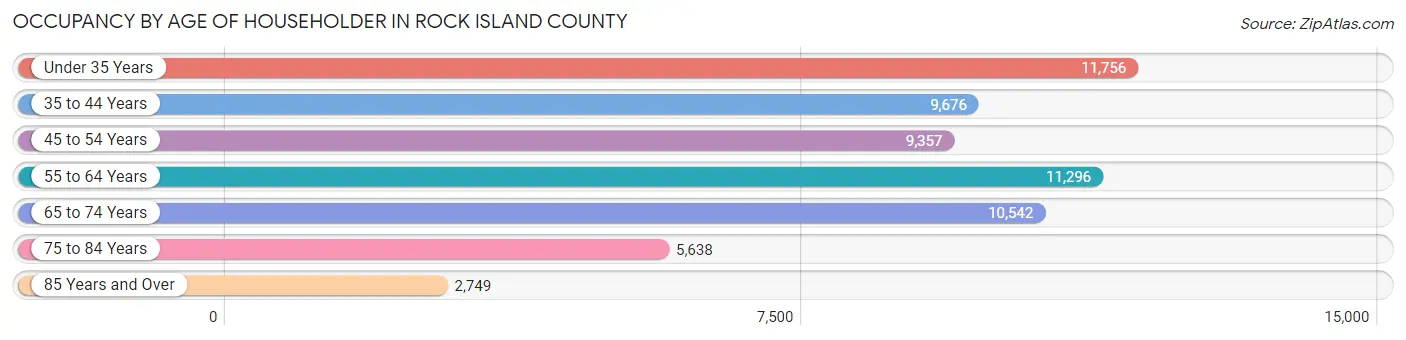
| Age Bracket | # Households | % Households |
| Under 35 Years | 11,756 | 19.3% |
| 35 to 44 Years | 9,676 | 15.9% |
| 45 to 54 Years | 9,357 | 15.3% |
| 55 to 64 Years | 11,296 | 18.5% |
| 65 to 74 Years | 10,542 | 17.3% |
| 75 to 84 Years | 5,638 | 9.2% |
| 85 Years and Over | 2,749 | 4.5% |
| Total | 61,014 | 100.0% |
Housing Finances in Rock Island County
Median Income by Occupancy in Rock Island County
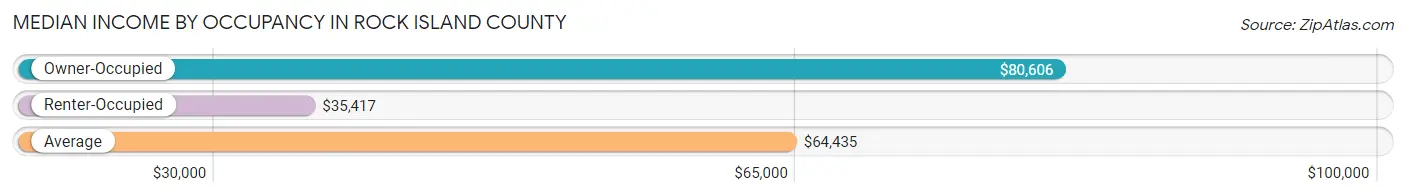
| Occupancy Type | # Households | Median Income |
| Owner-Occupied | 41,853 (68.6%) | $80,606 |
| Renter-Occupied | 19,161 (31.4%) | $35,417 |
| Average | 61,014 (100.0%) | $64,435 |
Occupancy by Householder Income Bracket in Rock Island County
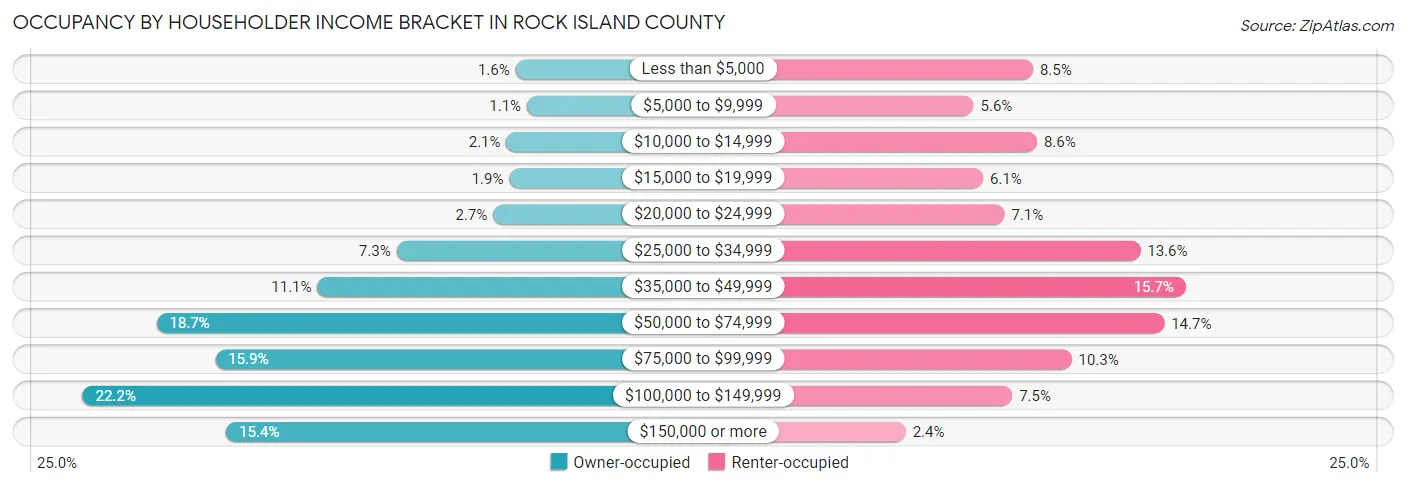
| Income Bracket | Owner-occupied | Renter-occupied |
| Less than $5,000 | 678 (1.6%) | 1,620 (8.5%) |
| $5,000 to $9,999 | 453 (1.1%) | 1,077 (5.6%) |
| $10,000 to $14,999 | 861 (2.1%) | 1,655 (8.6%) |
| $15,000 to $19,999 | 802 (1.9%) | 1,164 (6.1%) |
| $20,000 to $24,999 | 1,126 (2.7%) | 1,358 (7.1%) |
| $25,000 to $34,999 | 3,053 (7.3%) | 2,599 (13.6%) |
| $35,000 to $49,999 | 4,628 (11.1%) | 3,012 (15.7%) |
| $50,000 to $74,999 | 7,835 (18.7%) | 2,817 (14.7%) |
| $75,000 to $99,999 | 6,665 (15.9%) | 1,972 (10.3%) |
| $100,000 to $149,999 | 9,307 (22.2%) | 1,430 (7.5%) |
| $150,000 or more | 6,445 (15.4%) | 457 (2.4%) |
| Total | 41,853 (100.0%) | 19,161 (100.0%) |
Monthly Housing Cost Tiers in Rock Island County
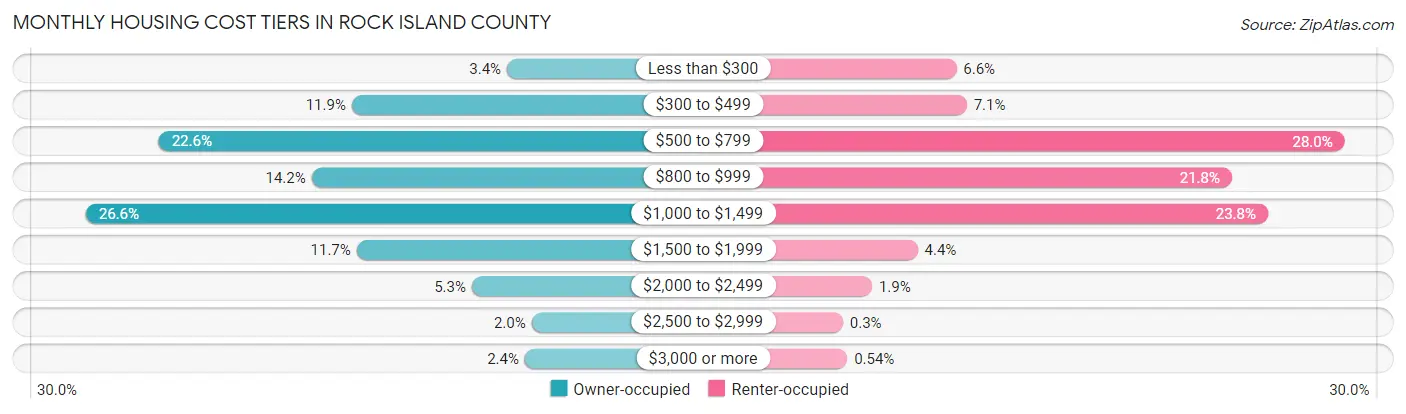
| Monthly Cost | Owner-occupied | Renter-occupied |
| Less than $300 | 1,407 (3.4%) | 1,259 (6.6%) |
| $300 to $499 | 4,993 (11.9%) | 1,368 (7.1%) |
| $500 to $799 | 9,456 (22.6%) | 5,367 (28.0%) |
| $800 to $999 | 5,923 (14.1%) | 4,173 (21.8%) |
| $1,000 to $1,499 | 11,143 (26.6%) | 4,555 (23.8%) |
| $1,500 to $1,999 | 4,882 (11.7%) | 849 (4.4%) |
| $2,000 to $2,499 | 2,218 (5.3%) | 366 (1.9%) |
| $2,500 to $2,999 | 838 (2.0%) | 58 (0.3%) |
| $3,000 or more | 993 (2.4%) | 104 (0.5%) |
| Total | 41,853 (100.0%) | 19,161 (100.0%) |
Physical Housing Characteristics in Rock Island County
Housing Structures in Rock Island County
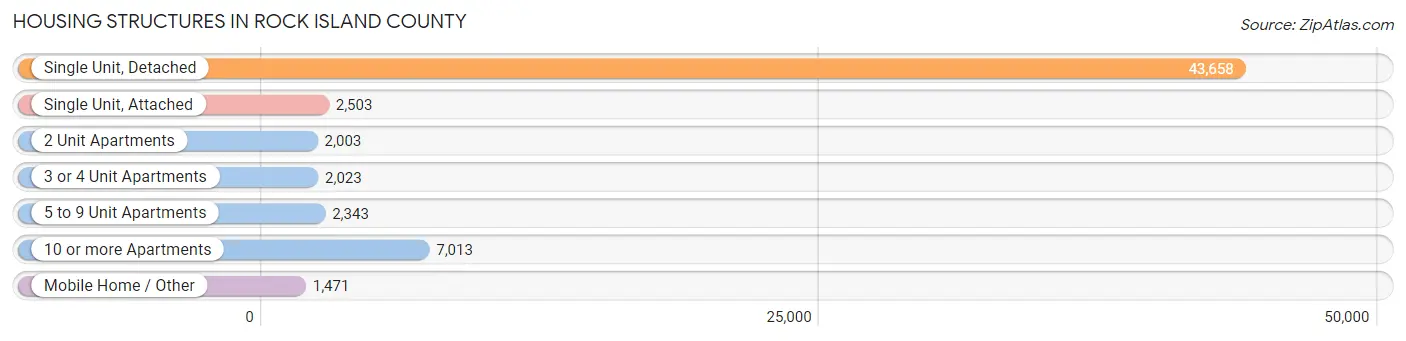
| Structure Type | # Housing Units | % Housing Units |
| Single Unit, Detached | 43,658 | 71.6% |
| Single Unit, Attached | 2,503 | 4.1% |
| 2 Unit Apartments | 2,003 | 3.3% |
| 3 or 4 Unit Apartments | 2,023 | 3.3% |
| 5 to 9 Unit Apartments | 2,343 | 3.8% |
| 10 or more Apartments | 7,013 | 11.5% |
| Mobile Home / Other | 1,471 | 2.4% |
| Total | 61,014 | 100.0% |
Housing Structures by Occupancy in Rock Island County
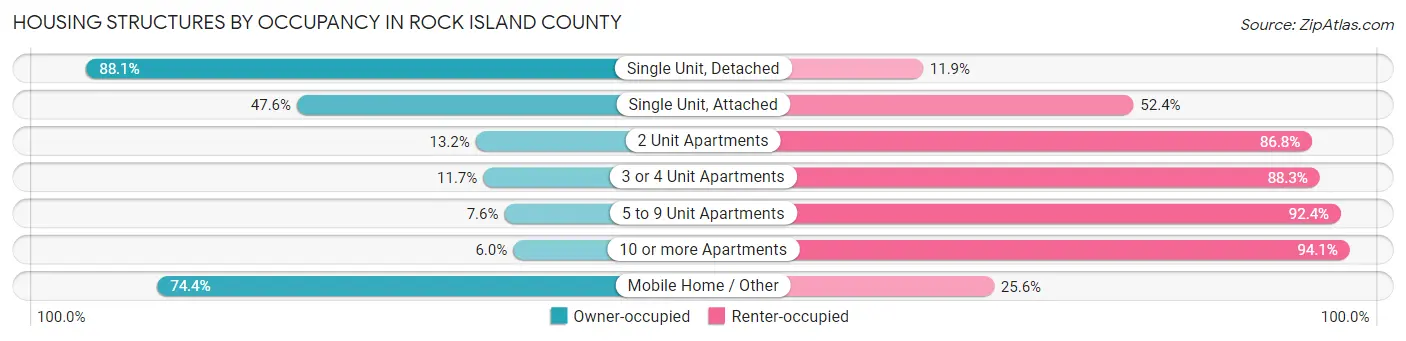
| Structure Type | Owner-occupied | Renter-occupied |
| Single Unit, Detached | 38,470 (88.1%) | 5,188 (11.9%) |
| Single Unit, Attached | 1,191 (47.6%) | 1,312 (52.4%) |
| 2 Unit Apartments | 264 (13.2%) | 1,739 (86.8%) |
| 3 or 4 Unit Apartments | 237 (11.7%) | 1,786 (88.3%) |
| 5 to 9 Unit Apartments | 179 (7.6%) | 2,164 (92.4%) |
| 10 or more Apartments | 417 (5.9%) | 6,596 (94.1%) |
| Mobile Home / Other | 1,095 (74.4%) | 376 (25.6%) |
| Total | 41,853 (68.6%) | 19,161 (31.4%) |
Housing Structures by Number of Rooms in Rock Island County
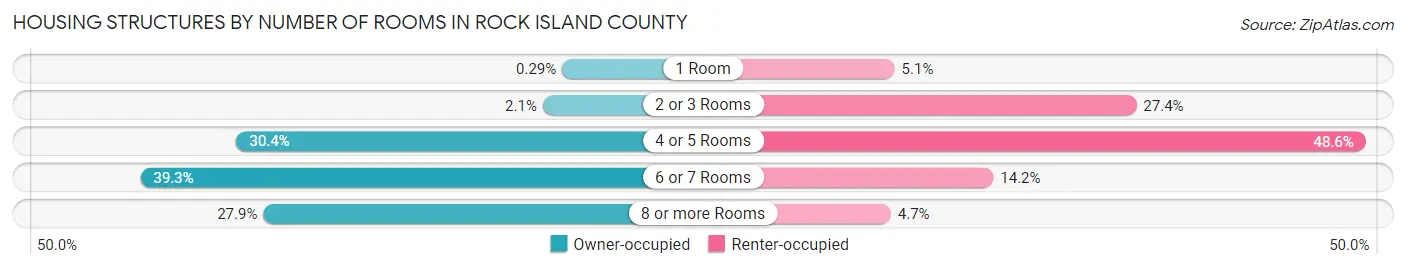
| Number of Rooms | Owner-occupied | Renter-occupied |
| 1 Room | 122 (0.3%) | 970 (5.1%) |
| 2 or 3 Rooms | 871 (2.1%) | 5,254 (27.4%) |
| 4 or 5 Rooms | 12,727 (30.4%) | 9,316 (48.6%) |
| 6 or 7 Rooms | 16,443 (39.3%) | 2,718 (14.2%) |
| 8 or more Rooms | 11,690 (27.9%) | 903 (4.7%) |
| Total | 41,853 (100.0%) | 19,161 (100.0%) |
Housing Structure by Heating Type in Rock Island County
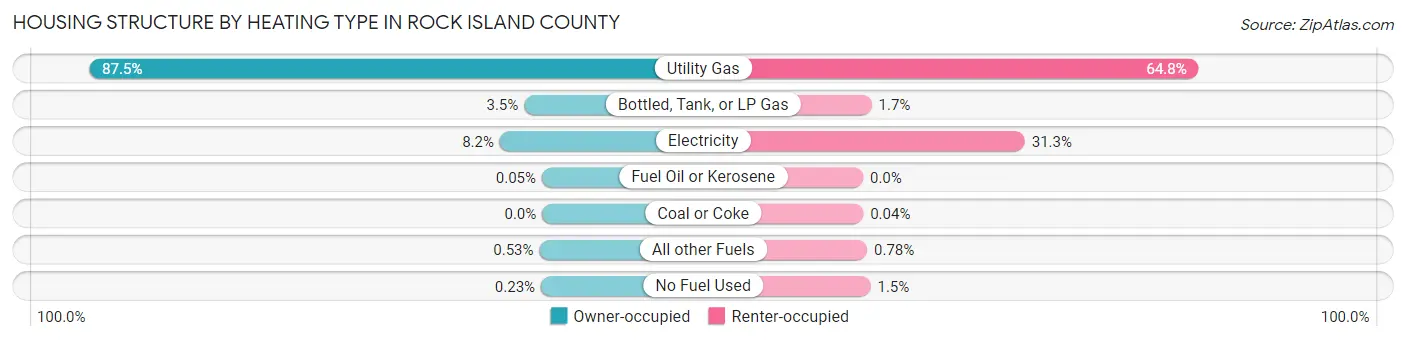
| Heating Type | Owner-occupied | Renter-occupied |
| Utility Gas | 36,640 (87.5%) | 12,421 (64.8%) |
| Bottled, Tank, or LP Gas | 1,451 (3.5%) | 319 (1.7%) |
| Electricity | 3,420 (8.2%) | 5,987 (31.2%) |
| Fuel Oil or Kerosene | 23 (0.1%) | 0 (0.0%) |
| Coal or Coke | 0 (0.0%) | 7 (0.0%) |
| All other Fuels | 222 (0.5%) | 150 (0.8%) |
| No Fuel Used | 97 (0.2%) | 277 (1.5%) |
| Total | 41,853 (100.0%) | 19,161 (100.0%) |
Household Vehicle Usage in Rock Island County
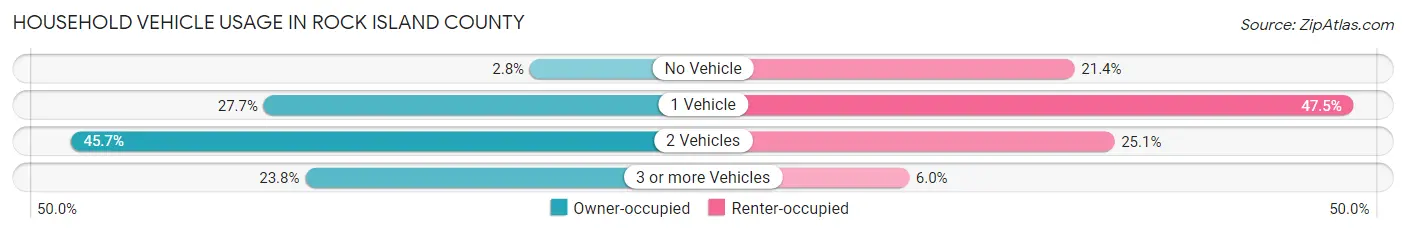
| Vehicles per Household | Owner-occupied | Renter-occupied |
| No Vehicle | 1,185 (2.8%) | 4,104 (21.4%) |
| 1 Vehicle | 11,579 (27.7%) | 9,097 (47.5%) |
| 2 Vehicles | 19,129 (45.7%) | 4,817 (25.1%) |
| 3 or more Vehicles | 9,960 (23.8%) | 1,143 (6.0%) |
| Total | 41,853 (100.0%) | 19,161 (100.0%) |
Real Estate & Mortgages in Rock Island County
Real Estate and Mortgage Overview in Rock Island County
| Characteristic | Without Mortgage | With Mortgage |
| Housing Units | 17,423 | 24,430 |
| Median Property Value | $137,400 | $141,200 |
| Median Household Income | $62,464 | $4,426 |
| Monthly Housing Costs | $585 | $941 |
| Real Estate Taxes | $3,051 | $572 |
Property Value by Mortgage Status in Rock Island County
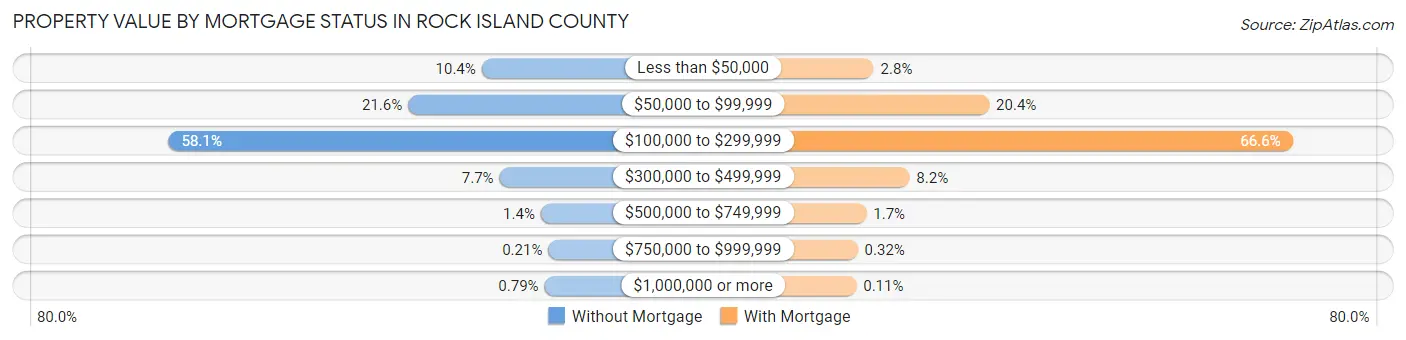
| Property Value | Without Mortgage | With Mortgage |
| Less than $50,000 | 1,805 (10.4%) | 675 (2.8%) |
| $50,000 to $99,999 | 3,759 (21.6%) | 4,975 (20.4%) |
| $100,000 to $299,999 | 10,118 (58.1%) | 16,265 (66.6%) |
| $300,000 to $499,999 | 1,332 (7.6%) | 2,006 (8.2%) |
| $500,000 to $749,999 | 235 (1.3%) | 404 (1.7%) |
| $750,000 to $999,999 | 36 (0.2%) | 79 (0.3%) |
| $1,000,000 or more | 138 (0.8%) | 26 (0.1%) |
| Total | 17,423 (100.0%) | 24,430 (100.0%) |
Household Income by Mortgage Status in Rock Island County
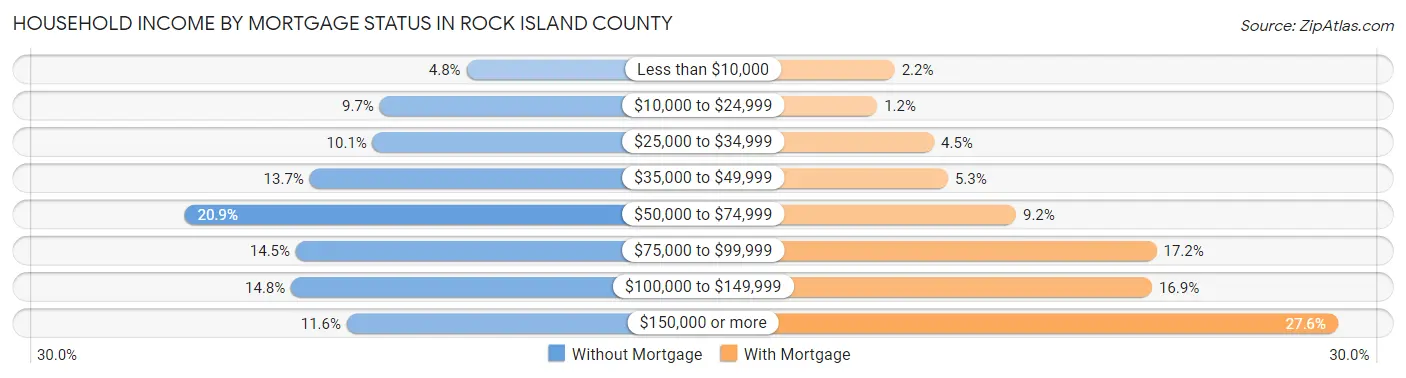
| Household Income | Without Mortgage | With Mortgage |
| Less than $10,000 | 828 (4.8%) | 547 (2.2%) |
| $10,000 to $24,999 | 1,692 (9.7%) | 303 (1.2%) |
| $25,000 to $34,999 | 1,762 (10.1%) | 1,097 (4.5%) |
| $35,000 to $49,999 | 2,388 (13.7%) | 1,291 (5.3%) |
| $50,000 to $74,999 | 3,634 (20.9%) | 2,240 (9.2%) |
| $75,000 to $99,999 | 2,526 (14.5%) | 4,201 (17.2%) |
| $100,000 to $149,999 | 2,574 (14.8%) | 4,139 (16.9%) |
| $150,000 or more | 2,019 (11.6%) | 6,733 (27.6%) |
| Total | 17,423 (100.0%) | 24,430 (100.0%) |
Property Value to Household Income Ratio in Rock Island County
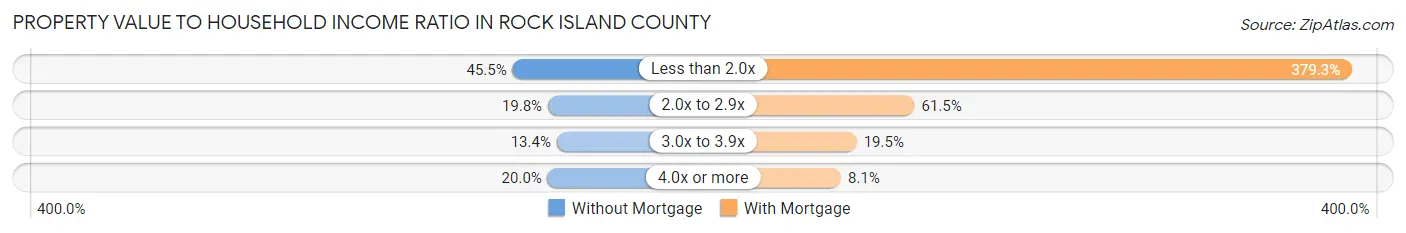
| Value-to-Income Ratio | Without Mortgage | With Mortgage |
| Less than 2.0x | 7,932 (45.5%) | 92,660 (379.3%) |
| 2.0x to 2.9x | 3,452 (19.8%) | 15,021 (61.5%) |
| 3.0x to 3.9x | 2,340 (13.4%) | 4,759 (19.5%) |
| 4.0x or more | 3,491 (20.0%) | 1,988 (8.1%) |
| Total | 17,423 (100.0%) | 24,430 (100.0%) |
Real Estate Taxes by Mortgage Status in Rock Island County
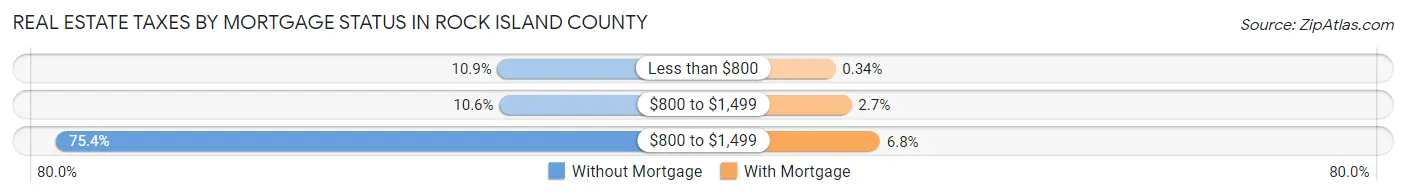
| Property Taxes | Without Mortgage | With Mortgage |
| Less than $800 | 1,897 (10.9%) | 83 (0.3%) |
| $800 to $1,499 | 1,852 (10.6%) | 654 (2.7%) |
| $800 to $1,499 | 13,133 (75.4%) | 1,671 (6.8%) |
| Total | 17,423 (100.0%) | 24,430 (100.0%) |
Health & Disability in Rock Island County
Health Insurance Coverage by Age in Rock Island County
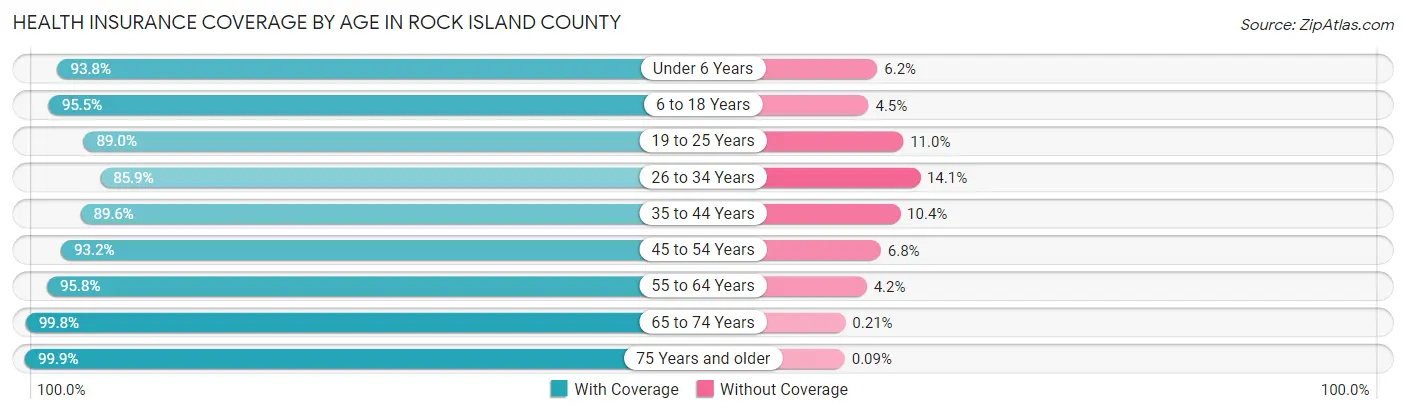
| Age Bracket | With Coverage | Without Coverage |
| Under 6 Years | 9,497 (93.8%) | 623 (6.2%) |
| 6 to 18 Years | 22,788 (95.5%) | 1,079 (4.5%) |
| 19 to 25 Years | 11,102 (89.0%) | 1,371 (11.0%) |
| 26 to 34 Years | 13,190 (85.9%) | 2,166 (14.1%) |
| 35 to 44 Years | 14,997 (89.6%) | 1,745 (10.4%) |
| 45 to 54 Years | 15,149 (93.2%) | 1,109 (6.8%) |
| 55 to 64 Years | 18,077 (95.8%) | 789 (4.2%) |
| 65 to 74 Years | 15,931 (99.8%) | 34 (0.2%) |
| 75 Years and older | 11,628 (99.9%) | 11 (0.1%) |
| Total | 132,359 (93.7%) | 8,927 (6.3%) |
Health Insurance Coverage by Citizenship Status in Rock Island County
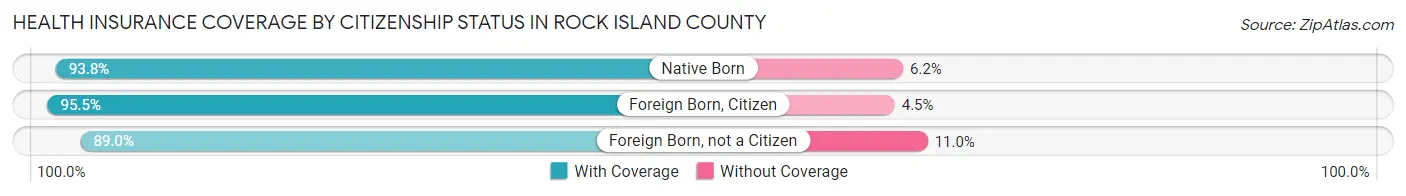
| Citizenship Status | With Coverage | Without Coverage |
| Native Born | 9,497 (93.8%) | 623 (6.2%) |
| Foreign Born, Citizen | 22,788 (95.5%) | 1,079 (4.5%) |
| Foreign Born, not a Citizen | 11,102 (89.0%) | 1,371 (11.0%) |
Health Insurance Coverage by Household Income in Rock Island County

| Household Income | With Coverage | Without Coverage |
| Under $25,000 | 16,734 (92.4%) | 1,369 (7.6%) |
| $25,000 to $49,999 | 23,681 (89.4%) | 2,820 (10.6%) |
| $50,000 to $74,999 | 21,905 (93.0%) | 1,652 (7.0%) |
| $75,000 to $99,999 | 19,607 (93.3%) | 1,409 (6.7%) |
| $100,000 and over | 48,115 (96.8%) | 1,606 (3.2%) |
Public vs Private Health Insurance Coverage by Age in Rock Island County

| Age Bracket | Public Insurance | Private Insurance |
| Under 6 | 4,955 (49.0%) | 4,955 (49.0%) |
| 6 to 18 Years | 9,188 (38.5%) | 14,710 (61.6%) |
| 19 to 25 Years | 2,271 (18.2%) | 9,316 (74.7%) |
| 25 to 34 Years | 3,618 (23.6%) | 9,970 (64.9%) |
| 35 to 44 Years | 3,658 (21.8%) | 11,964 (71.5%) |
| 45 to 54 Years | 2,792 (17.2%) | 12,886 (79.3%) |
| 55 to 64 Years | 3,750 (19.9%) | 15,011 (79.6%) |
| 65 to 74 Years | 15,424 (96.6%) | 9,857 (61.7%) |
| 75 Years and over | 11,371 (97.7%) | 8,048 (69.2%) |
| Total | 57,027 (40.4%) | 96,717 (68.4%) |
Disability Status by Sex by Age in Rock Island County
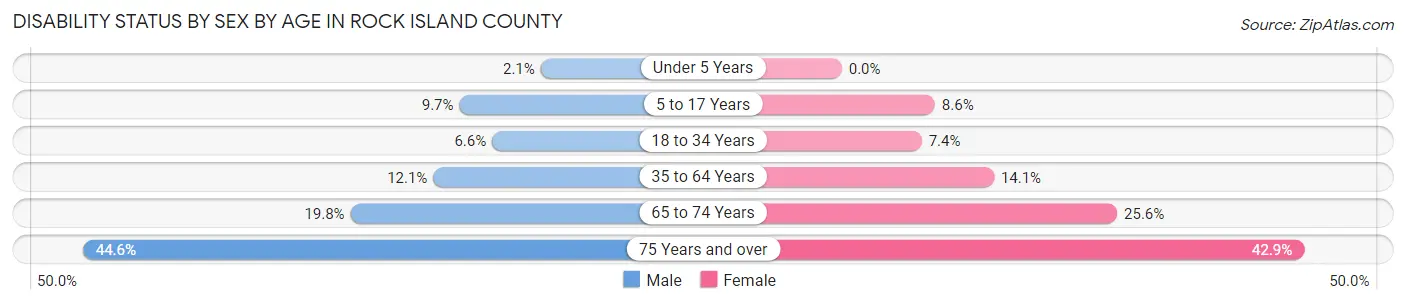
| Age Bracket | Male | Female |
| Under 5 Years | 93 (2.1%) | 0 (0.0%) |
| 5 to 17 Years | 1,166 (9.7%) | 996 (8.6%) |
| 18 to 34 Years | 980 (6.6%) | 1,108 (7.4%) |
| 35 to 64 Years | 3,113 (12.1%) | 3,685 (14.1%) |
| 65 to 74 Years | 1,475 (19.8%) | 2,172 (25.6%) |
| 75 Years and over | 2,177 (44.6%) | 2,899 (42.9%) |
Disability Class by Sex by Age in Rock Island County
Disability Class: Hearing Difficulty
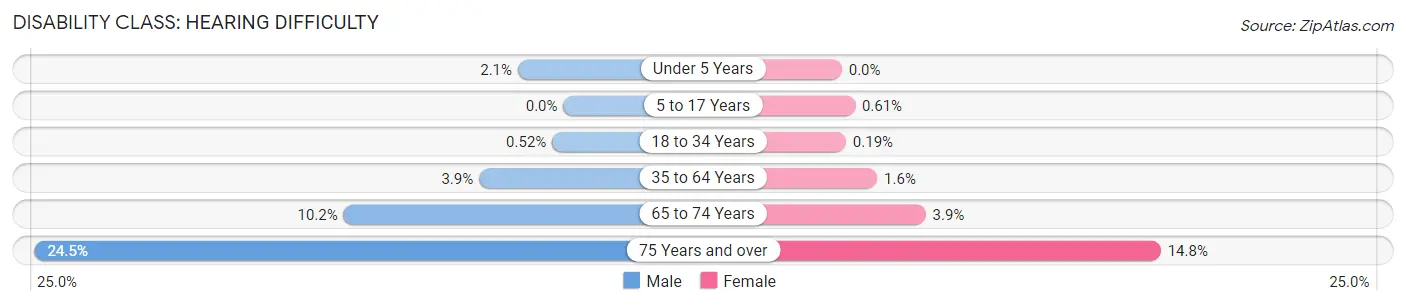
| Age Bracket | Male | Female |
| Under 5 Years | 93 (2.1%) | 0 (0.0%) |
| 5 to 17 Years | 0 (0.0%) | 70 (0.6%) |
| 18 to 34 Years | 77 (0.5%) | 28 (0.2%) |
| 35 to 64 Years | 1,008 (3.9%) | 429 (1.6%) |
| 65 to 74 Years | 761 (10.2%) | 331 (3.9%) |
| 75 Years and over | 1,198 (24.5%) | 1,000 (14.8%) |
Disability Class: Vision Difficulty
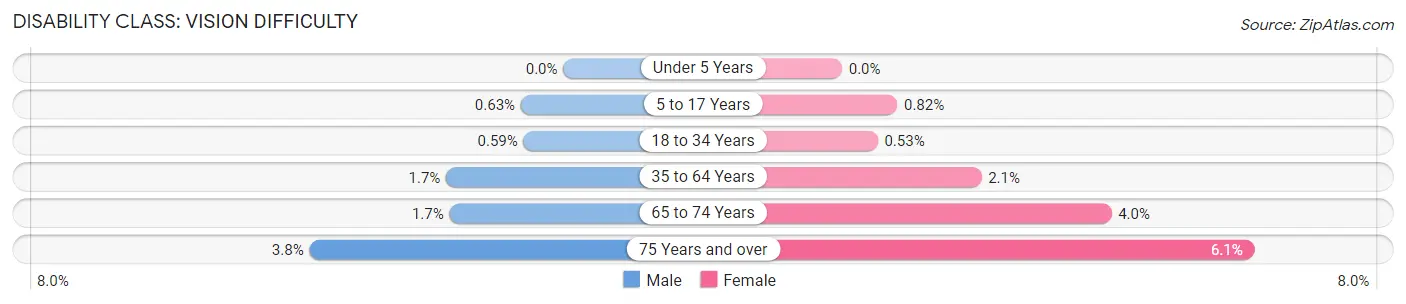
| Age Bracket | Male | Female |
| Under 5 Years | 0 (0.0%) | 0 (0.0%) |
| 5 to 17 Years | 76 (0.6%) | 95 (0.8%) |
| 18 to 34 Years | 87 (0.6%) | 79 (0.5%) |
| 35 to 64 Years | 448 (1.7%) | 539 (2.1%) |
| 65 to 74 Years | 126 (1.7%) | 340 (4.0%) |
| 75 Years and over | 184 (3.8%) | 414 (6.1%) |
Disability Class: Cognitive Difficulty
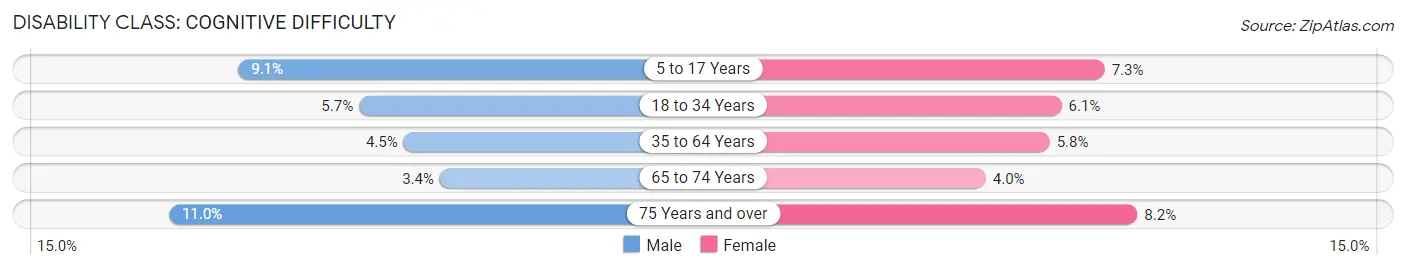
| Age Bracket | Male | Female |
| 5 to 17 Years | 1,093 (9.0%) | 844 (7.3%) |
| 18 to 34 Years | 842 (5.7%) | 914 (6.1%) |
| 35 to 64 Years | 1,146 (4.4%) | 1,511 (5.8%) |
| 65 to 74 Years | 257 (3.4%) | 341 (4.0%) |
| 75 Years and over | 536 (11.0%) | 556 (8.2%) |
Disability Class: Ambulatory Difficulty
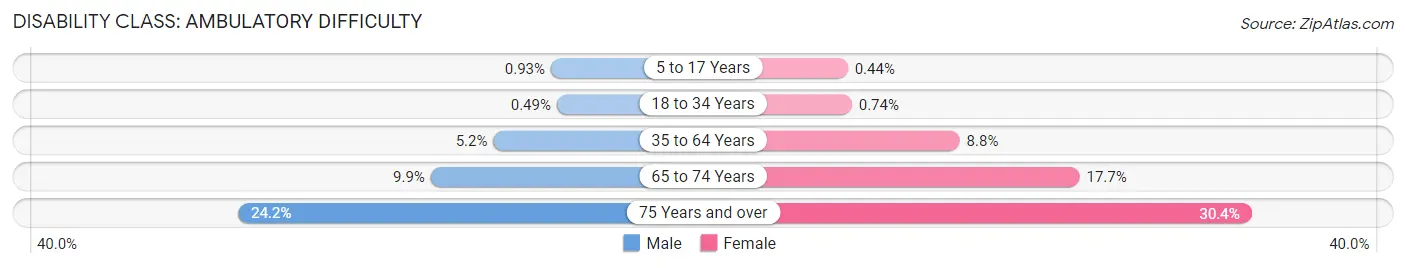
| Age Bracket | Male | Female |
| 5 to 17 Years | 112 (0.9%) | 51 (0.4%) |
| 18 to 34 Years | 72 (0.5%) | 110 (0.7%) |
| 35 to 64 Years | 1,339 (5.2%) | 2,285 (8.7%) |
| 65 to 74 Years | 735 (9.9%) | 1,501 (17.6%) |
| 75 Years and over | 1,179 (24.1%) | 2,056 (30.4%) |
Disability Class: Self-Care Difficulty
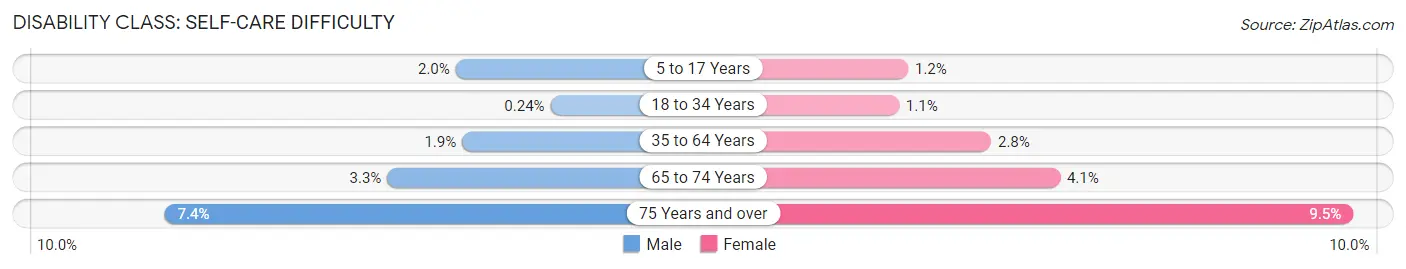
| Age Bracket | Male | Female |
| 5 to 17 Years | 242 (2.0%) | 142 (1.2%) |
| 18 to 34 Years | 36 (0.2%) | 158 (1.1%) |
| 35 to 64 Years | 485 (1.9%) | 722 (2.8%) |
| 65 to 74 Years | 244 (3.3%) | 344 (4.1%) |
| 75 Years and over | 361 (7.4%) | 641 (9.5%) |
Technology Access in Rock Island County
Computing Device Access in Rock Island County
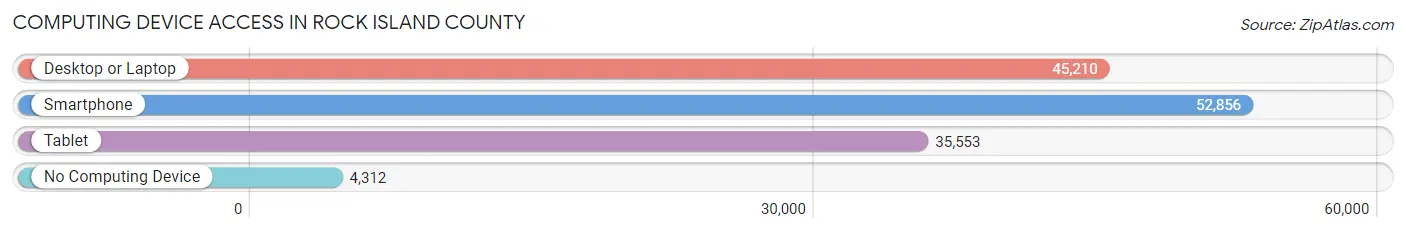
| Device Type | # Households | % Households |
| Desktop or Laptop | 45,210 | 74.1% |
| Smartphone | 52,856 | 86.6% |
| Tablet | 35,553 | 58.3% |
| No Computing Device | 4,312 | 7.1% |
| Total | 61,014 | 100.0% |
Internet Access in Rock Island County
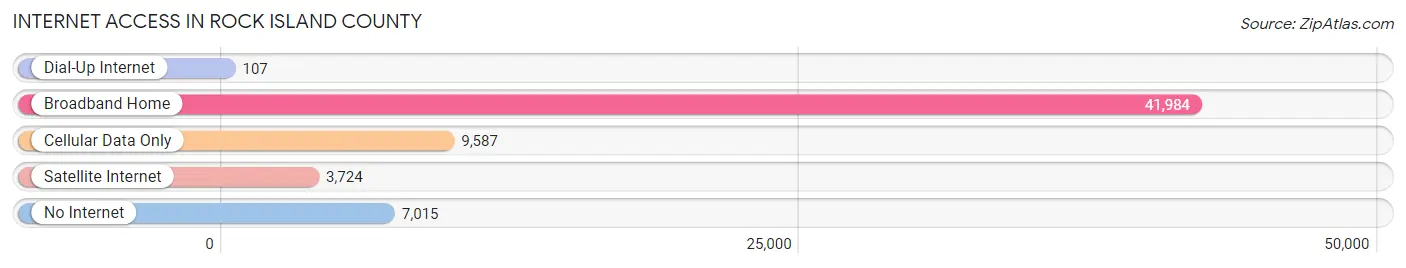
| Internet Type | # Households | % Households |
| Dial-Up Internet | 107 | 0.2% |
| Broadband Home | 41,984 | 68.8% |
| Cellular Data Only | 9,587 | 15.7% |
| Satellite Internet | 3,724 | 6.1% |
| No Internet | 7,015 | 11.5% |
| Total | 61,014 | 100.0% |
Rock Island County Summary
Rock Island County is located in the northwestern corner of the state of Illinois, along the Mississippi River. It is bordered by Whiteside County to the north, Henry County to the east, Mercer County to the south, and Scott County, Iowa to the west. The county seat is Rock Island, and the largest city is Moline. The county has a total area of 476 square miles, of which 463 square miles is land and 13 square miles is water.
Rock Island County was established in 1831 and was named after Rock Island, an island in the Mississippi River. The county was originally part of the Northwest Territory, and was part of the Black Hawk Purchase in 1832. The county was organized in 1837, and the first county seat was established in Buffalo. The county seat was moved to Rock Island in 1841.
The population of Rock Island County was 147,546 in 2000, an increase of 8.3% since 1990. The population is spread out with a median age of 35.7 years. The racial makeup of the county is 87.3% White, 8.2% African American, 0.7% Native American, 1.3% Asian, 0.1% Pacific Islander, 1.2% from other races, and 1.2% from two or more races. Hispanic or Latino of any race were 3.3% of the population.
The economy of Rock Island County is largely based on manufacturing and agriculture. The county is home to several large manufacturing companies, including John Deere, Case IH, and Caterpillar. The county is also home to several agricultural businesses, including grain and livestock farms. The county is also home to several educational institutions, including Augustana College, Black Hawk College, and Western Illinois University.
Rock Island County is served by several major highways, including Interstate 80, Interstate 74, and U.S. Route 6. The county is also served by several railroads, including the Burlington Northern Santa Fe, the Canadian National, and the Union Pacific. The county is also served by several airports, including the Quad City International Airport, the Moline Airport, and the Rock Island Airport.
Rock Island County is home to several parks and recreational areas, including the Rock Island County Forest Preserve, the Rock Island State Park, and the Rock Island Arsenal. The county is also home to several museums, including the Rock Island County Historical Society Museum, the Rock Island County Courthouse Museum, and the Rock Island County Jail Museum.
Rock Island County is a diverse and vibrant county with a rich history and a bright future. The county is home to a variety of businesses, educational institutions, and recreational areas, making it an ideal place to live, work, and play.
Common Questions
What is the Total Population of Rock Island County?
Total Population of Rock Island County is 143,819.
What is the Total Male Population of Rock Island County?
Total Male Population of Rock Island County is 71,318.
What is the Total Female Population of Rock Island County?
Total Female Population of Rock Island County is 72,501.
What is the Ratio of Males per 100 Females in Rock Island County?
There are 98.37 Males per 100 Females in Rock Island County.
What is the Ratio of Females per 100 Males in Rock Island County?
There are 101.66 Females per 100 Males in Rock Island County.
What is the Median Population Age in Rock Island County?
Median Population Age in Rock Island County is 40.2 Years.
What is the Average Family Size in Rock Island County
Average Family Size in Rock Island County is 2.9 People.
What is the Average Household Size in Rock Island County
Average Household Size in Rock Island County is 2.3 People.
What is Per Capita Income in Rock Island County?
Per Capita income in Rock Island County is $34,233.
What is the Median Family Income in Rock Island County?
Median Family Income in Rock Island County is $83,401.
What is the Median Household income in Rock Island County?
Median Household Income in Rock Island County is $64,435.
What is Income or Wage Gap in Rock Island County?
Income or Wage Gap in Rock Island County is 32.5%.
Women in Rock Island County earn 67.5 cents for every dollar earned by a man.
What is Family Income Deficit in Rock Island County?
Family Income Deficit in Rock Island County is $11,377.
Families that are below poverty line in Rock Island County earn $11,377 less on average than the poverty threshold level.
What is Inequality or Gini Index in Rock Island County?
Inequality or Gini Index in Rock Island County is 0.43.
How Large is the Labor Force in Rock Island County?
There are 71,465 People in the Labor Forcein in Rock Island County.
What is the Percentage of People in the Labor Force in Rock Island County?
61.9% of People are in the Labor Force in Rock Island County.
What is the Unemployment Rate in Rock Island County?
Unemployment Rate in Rock Island County is 6.2%.