Richland County, IL
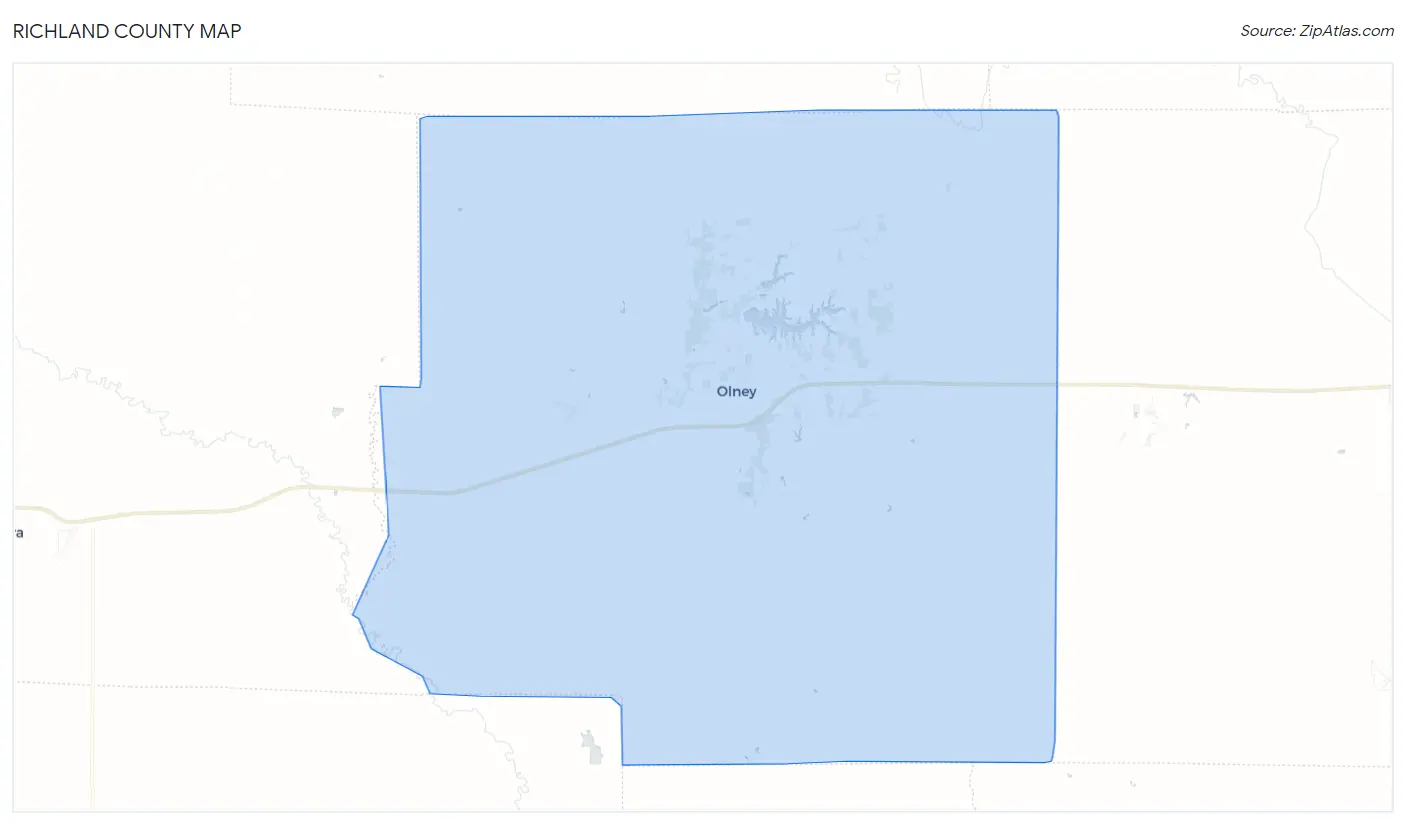
Richland County Map
Richland County Overview
15,716
TOTAL POPULATION
7,847
MALE POPULATION
7,869
FEMALE POPULATION
99.72
MALES / 100 FEMALES
100.28
FEMALES / 100 MALES
42.2
MEDIAN AGE
2.9
AVG FAMILY SIZE
2.4
AVG HOUSEHOLD SIZE
$30,975
PER CAPITA INCOME
$75,169
AVG FAMILY INCOME
$61,607
AVG HOUSEHOLD INCOME
23.9%
WAGE / INCOME GAP [ % ]
76.1¢/ $1
WAGE / INCOME GAP [ $ ]
$8,878
FAMILY INCOME DEFICIT
0.40
INEQUALITY / GINI INDEX
7,915
LABOR FORCE [ PEOPLE ]
62.7%
PERCENT IN LABOR FORCE
4.2%
UNEMPLOYMENT RATE
Richland County Area Codes
Race in Richland County
The most populous races in Richland County are White / Caucasian (14,892 | 94.8%), Two or more Races (421 | 2.7%), and Hispanic or Latino (283 | 1.8%).
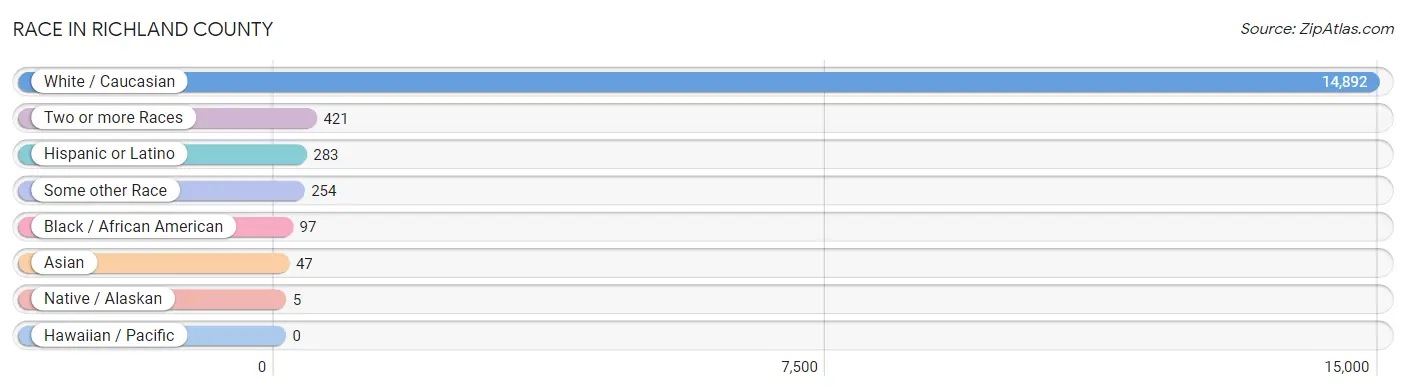
| Race | # Population | % Population |
| Asian | 47 | 0.3% |
| Black / African American | 97 | 0.6% |
| Hawaiian / Pacific | 0 | 0.0% |
| Hispanic or Latino | 283 | 1.8% |
| Native / Alaskan | 5 | 0.0% |
| White / Caucasian | 14,892 | 94.8% |
| Two or more Races | 421 | 2.7% |
| Some other Race | 254 | 1.6% |
| Total | 15,716 | 100.0% |
Ancestry in Richland County
The most populous ancestries reported in Richland County are German (5,253 | 33.4%), Irish (1,716 | 10.9%), American (1,413 | 9.0%), English (1,403 | 8.9%), and European (333 | 2.1%), together accounting for 64.4% of all Richland County residents.
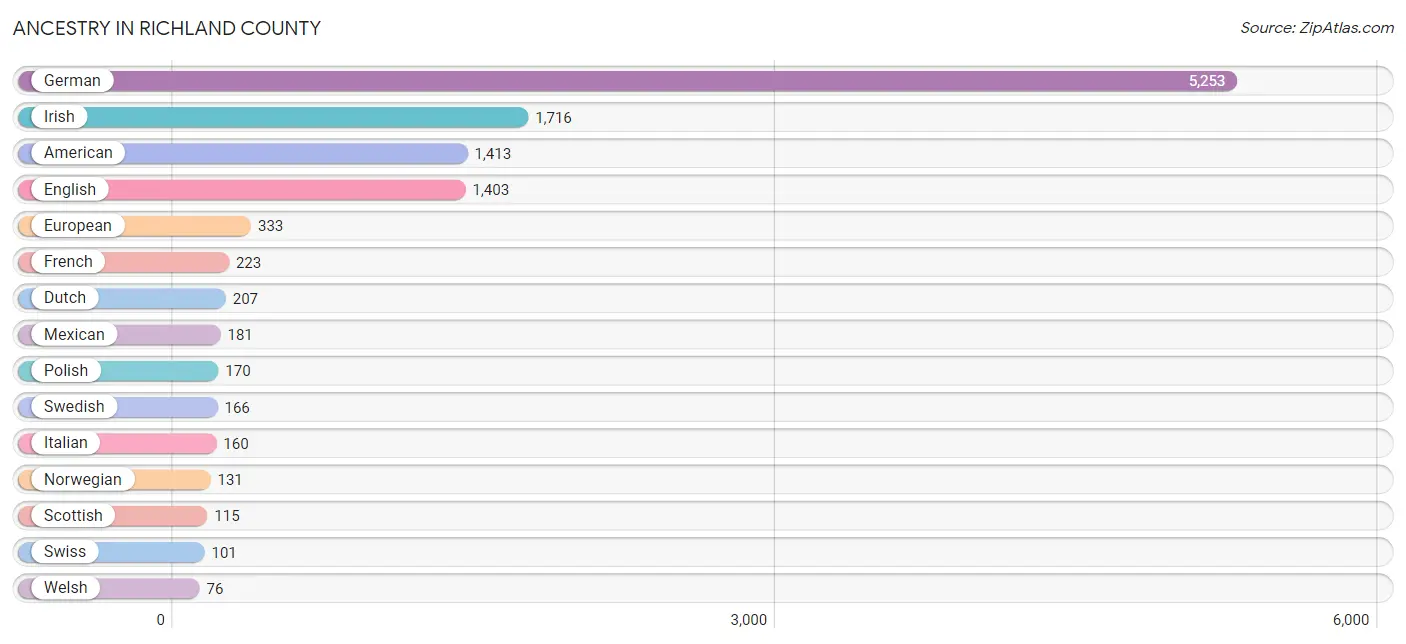
| Ancestry | # Population | % Population |
| American | 1,413 | 9.0% |
| Apache | 10 | 0.1% |
| Argentinean | 17 | 0.1% |
| Austrian | 8 | 0.1% |
| Belgian | 6 | 0.0% |
| Bhutanese | 16 | 0.1% |
| Blackfeet | 5 | 0.0% |
| British | 72 | 0.5% |
| Burmese | 28 | 0.2% |
| Central American Indian | 19 | 0.1% |
| Cherokee | 33 | 0.2% |
| Chippewa | 3 | 0.0% |
| Croatian | 35 | 0.2% |
| Cuban | 9 | 0.1% |
| Czech | 31 | 0.2% |
| Dutch | 207 | 1.3% |
| Dutch West Indian | 7 | 0.0% |
| Eastern European | 8 | 0.1% |
| English | 1,403 | 8.9% |
| European | 333 | 2.1% |
| French | 223 | 1.4% |
| German | 5,253 | 33.4% |
| Greek | 24 | 0.2% |
| Hungarian | 45 | 0.3% |
| Icelander | 13 | 0.1% |
| Indian (Asian) | 17 | 0.1% |
| Irish | 1,716 | 10.9% |
| Italian | 160 | 1.0% |
| Korean | 41 | 0.3% |
| Mexican | 181 | 1.1% |
| Navajo | 1 | 0.0% |
| Northern European | 8 | 0.1% |
| Norwegian | 131 | 0.8% |
| Paraguayan | 12 | 0.1% |
| Pennsylvania German | 6 | 0.0% |
| Polish | 170 | 1.1% |
| Portuguese | 20 | 0.1% |
| Puerto Rican | 60 | 0.4% |
| Romanian | 12 | 0.1% |
| Scandinavian | 41 | 0.3% |
| Scotch-Irish | 28 | 0.2% |
| Scottish | 115 | 0.7% |
| Sioux | 24 | 0.2% |
| Slovak | 8 | 0.1% |
| South African | 14 | 0.1% |
| South American | 29 | 0.2% |
| Sri Lankan | 66 | 0.4% |
| Subsaharan African | 14 | 0.1% |
| Swedish | 166 | 1.1% |
| Swiss | 101 | 0.6% |
| Ukrainian | 17 | 0.1% |
| Welsh | 76 | 0.5% |
| West Indian | 8 | 0.1% |
| Yugoslavian | 9 | 0.1% | View All 54 Rows |
Immigrants in Richland County
The most numerous immigrant groups reported in Richland County came from Latin America (164 | 1.0%), Central America (135 | 0.9%), Mexico (135 | 0.9%), Europe (56 | 0.4%), and Asia (47 | 0.3%), together accounting for 3.4% of all Richland County residents.
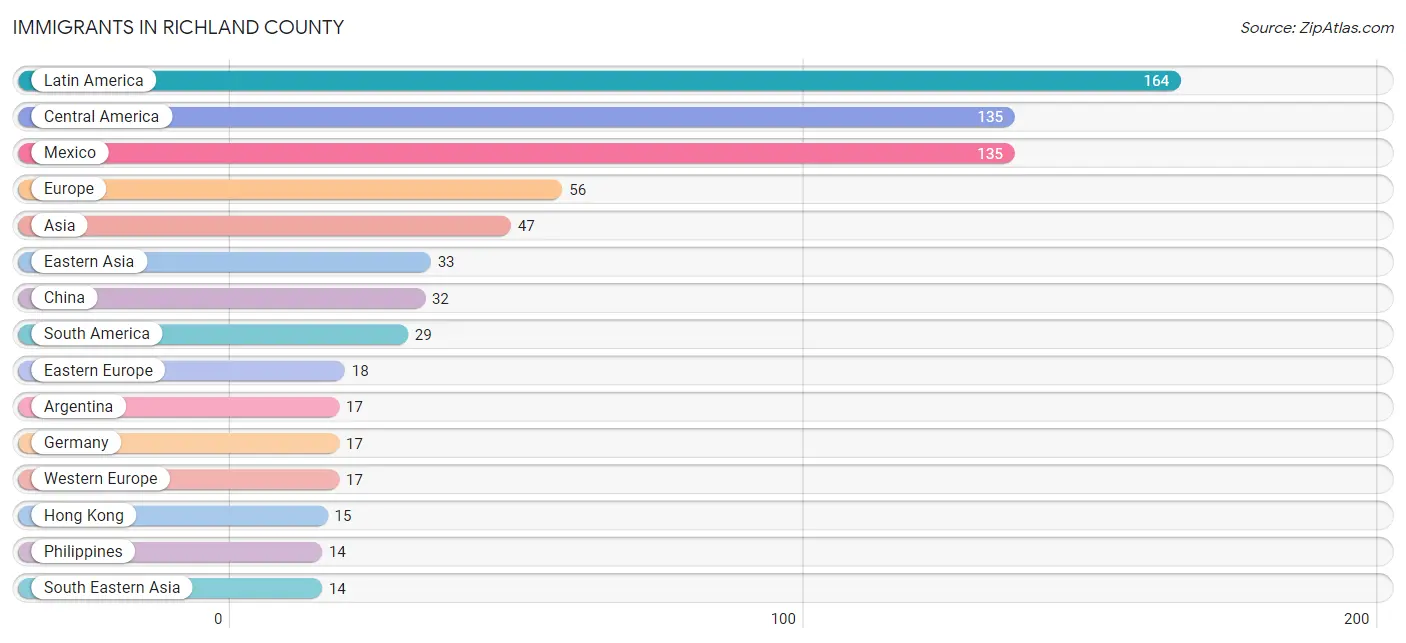
| Immigration Origin | # Population | % Population |
| Argentina | 17 | 0.1% |
| Asia | 47 | 0.3% |
| Central America | 135 | 0.9% |
| China | 32 | 0.2% |
| Czechoslovakia | 2 | 0.0% |
| Eastern Asia | 33 | 0.2% |
| Eastern Europe | 18 | 0.1% |
| Europe | 56 | 0.4% |
| Germany | 17 | 0.1% |
| Hong Kong | 15 | 0.1% |
| Ireland | 9 | 0.1% |
| Italy | 12 | 0.1% |
| Japan | 1 | 0.0% |
| Latin America | 164 | 1.0% |
| Mexico | 135 | 0.9% |
| Northern Europe | 9 | 0.1% |
| Philippines | 14 | 0.1% |
| Romania | 12 | 0.1% |
| South America | 29 | 0.2% |
| South Eastern Asia | 14 | 0.1% |
| Southern Europe | 12 | 0.1% |
| Western Europe | 17 | 0.1% | View All 22 Rows |
Sex and Age in Richland County
Sex and Age in Richland County
The most populous age groups in Richland County are 40 to 44 Years (631 | 8.0%) for men and 55 to 59 Years (614 | 7.8%) for women.
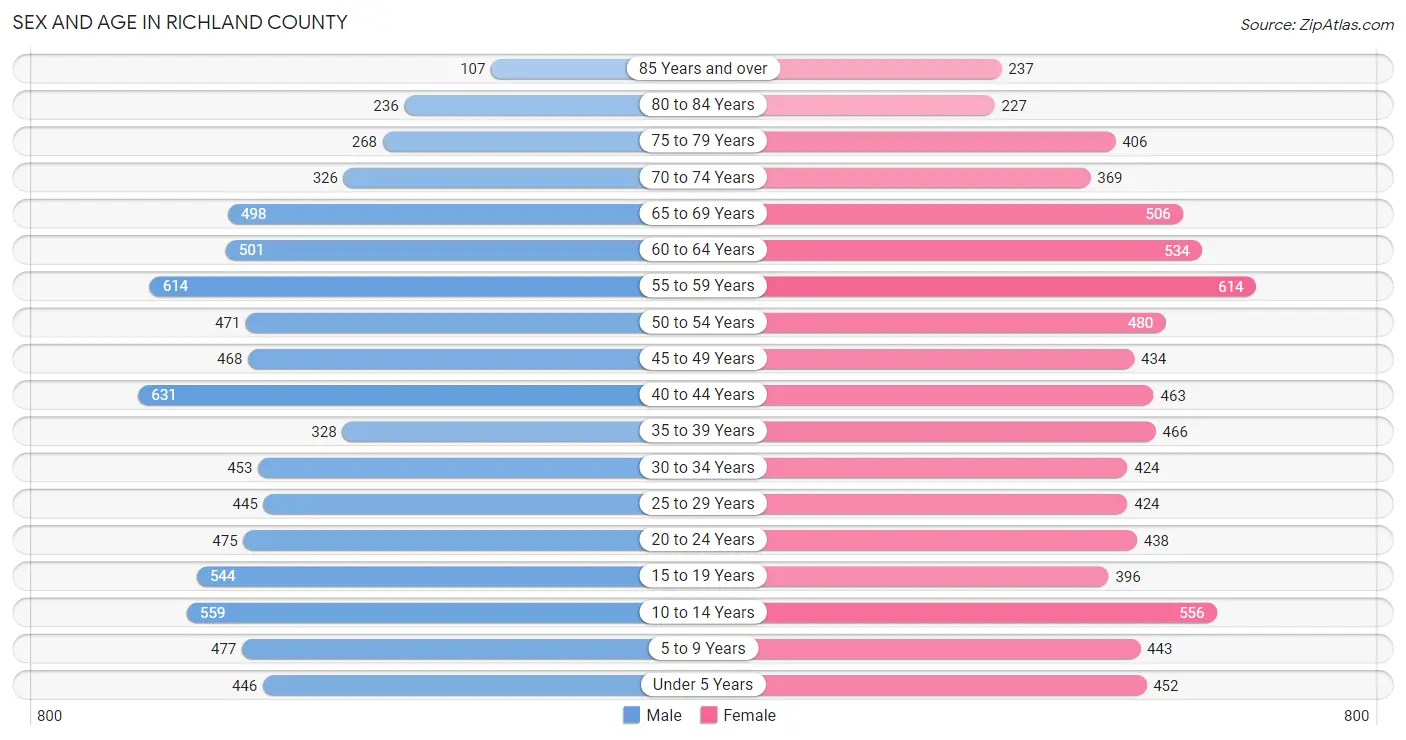
| Age Bracket | Male | Female |
| Under 5 Years | 446 (5.7%) | 452 (5.7%) |
| 5 to 9 Years | 477 (6.1%) | 443 (5.6%) |
| 10 to 14 Years | 559 (7.1%) | 556 (7.1%) |
| 15 to 19 Years | 544 (6.9%) | 396 (5.0%) |
| 20 to 24 Years | 475 (6.0%) | 438 (5.6%) |
| 25 to 29 Years | 445 (5.7%) | 424 (5.4%) |
| 30 to 34 Years | 453 (5.8%) | 424 (5.4%) |
| 35 to 39 Years | 328 (4.2%) | 466 (5.9%) |
| 40 to 44 Years | 631 (8.0%) | 463 (5.9%) |
| 45 to 49 Years | 468 (6.0%) | 434 (5.5%) |
| 50 to 54 Years | 471 (6.0%) | 480 (6.1%) |
| 55 to 59 Years | 614 (7.8%) | 614 (7.8%) |
| 60 to 64 Years | 501 (6.4%) | 534 (6.8%) |
| 65 to 69 Years | 498 (6.4%) | 506 (6.4%) |
| 70 to 74 Years | 326 (4.2%) | 369 (4.7%) |
| 75 to 79 Years | 268 (3.4%) | 406 (5.2%) |
| 80 to 84 Years | 236 (3.0%) | 227 (2.9%) |
| 85 Years and over | 107 (1.4%) | 237 (3.0%) |
| Total | 7,847 (100.0%) | 7,869 (100.0%) |
Families and Households in Richland County
Median Family Size in Richland County
The median family size in Richland County is 2.88 persons per family, with married-couple families (3,105 | 74.3%) accounting for the largest median family size of 2.94 persons per family. On the other hand, single male/father families (443 | 10.6%) represent the smallest median family size with 2.58 persons per family.
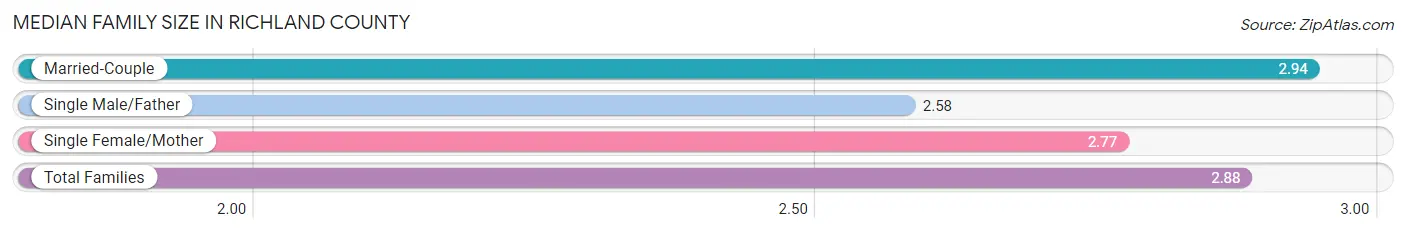
| Family Type | # Families | Family Size |
| Married-Couple | 3,105 (74.3%) | 2.94 |
| Single Male/Father | 443 (10.6%) | 2.58 |
| Single Female/Mother | 630 (15.1%) | 2.77 |
| Total Families | 4,178 (100.0%) | 2.88 |
Median Household Size in Richland County
The median household size in Richland County is 2.37 persons per household, with single male/father households (443 | 6.8%) accounting for the largest median household size of 3.18 persons per household. non-family households (2,307 | 35.6%) represent the smallest median household size with 1.23 persons per household.
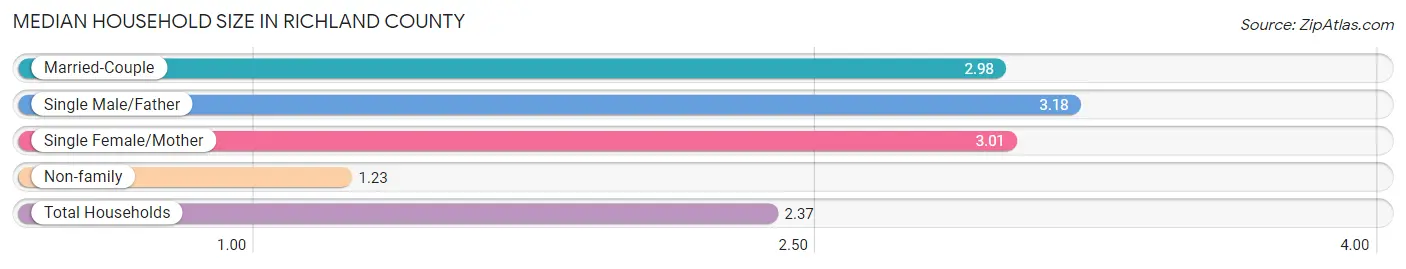
| Household Type | # Households | Household Size |
| Married-Couple | 3,105 (47.9%) | 2.98 |
| Single Male/Father | 443 (6.8%) | 3.18 |
| Single Female/Mother | 630 (9.7%) | 3.01 |
| Non-family | 2,307 (35.6%) | 1.23 |
| Total Households | 6,485 (100.0%) | 2.37 |
Household Size by Marriage Status in Richland County
Out of a total of 6,485 households in Richland County, 4,178 (64.4%) are family households, while 2,307 (35.6%) are nonfamily households. The most numerous type of family households are 2-person households, comprising 2,098, and the most common type of nonfamily households are 1-person households, comprising 1,933.
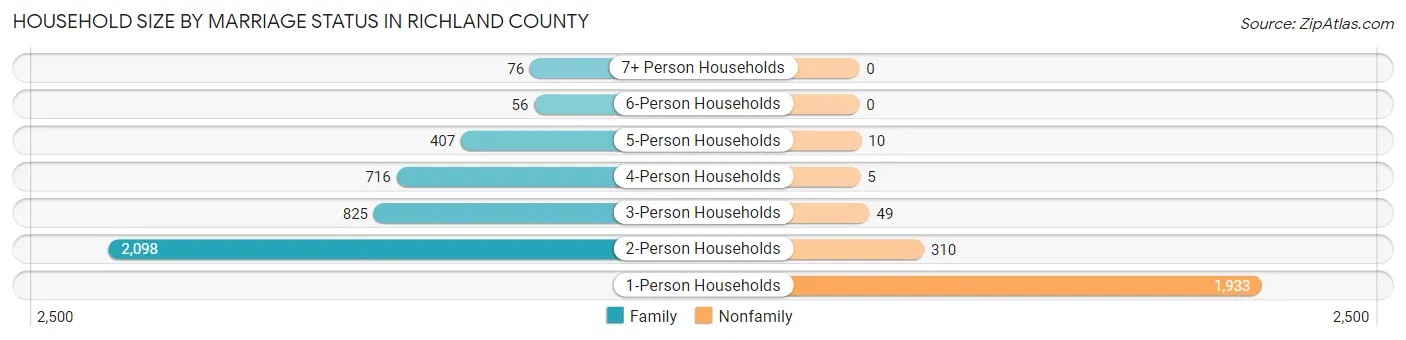
| Household Size | Family Households | Nonfamily Households |
| 1-Person Households | - | 1,933 (29.8%) |
| 2-Person Households | 2,098 (32.4%) | 310 (4.8%) |
| 3-Person Households | 825 (12.7%) | 49 (0.8%) |
| 4-Person Households | 716 (11.0%) | 5 (0.1%) |
| 5-Person Households | 407 (6.3%) | 10 (0.2%) |
| 6-Person Households | 56 (0.9%) | 0 (0.0%) |
| 7+ Person Households | 76 (1.2%) | 0 (0.0%) |
| Total | 4,178 (64.4%) | 2,307 (35.6%) |
Female Fertility in Richland County
Fertility by Age in Richland County
Average fertility rate in Richland County is 45.0 births per 1,000 women. Women in the age bracket of 20 to 34 years have the highest fertility rate with 100.0 births per 1,000 women. Women in the age bracket of 20 to 34 years acount for 90.8% of all women with births.
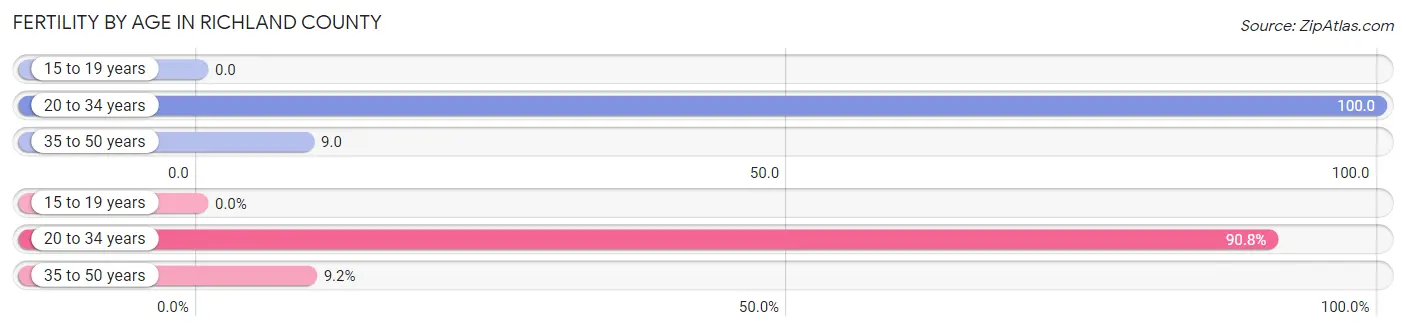
| Age Bracket | Women with Births | Births / 1,000 Women |
| 15 to 19 years | 0 (0.0%) | 0.0 |
| 20 to 34 years | 128 (90.8%) | 100.0 |
| 35 to 50 years | 13 (9.2%) | 9.0 |
| Total | 141 (100.0%) | 45.0 |
Fertility by Age by Marriage Status in Richland County
56.7% of women with births (141) in Richland County are married. The highest percentage of unmarried women with births falls into 35 to 50 years age bracket with 100.0% of them unmarried at the time of birth, while the lowest percentage of unmarried women with births belong to 20 to 34 years age bracket with 37.5% of them unmarried.
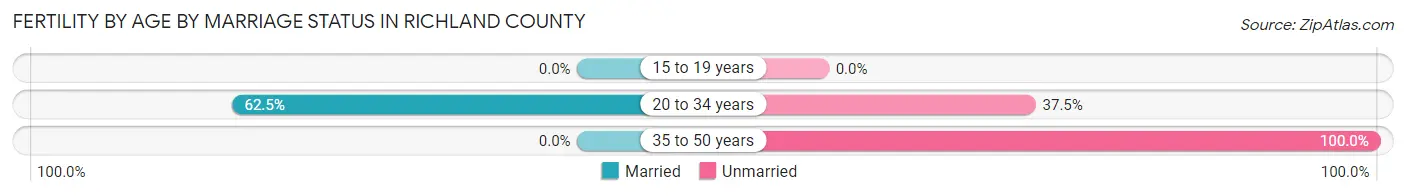
| Age Bracket | Married | Unmarried |
| 15 to 19 years | 0 (0.0%) | 0 (0.0%) |
| 20 to 34 years | 80 (62.5%) | 48 (37.5%) |
| 35 to 50 years | 0 (0.0%) | 13 (100.0%) |
| Total | 80 (56.7%) | 61 (43.3%) |
Fertility by Education in Richland County
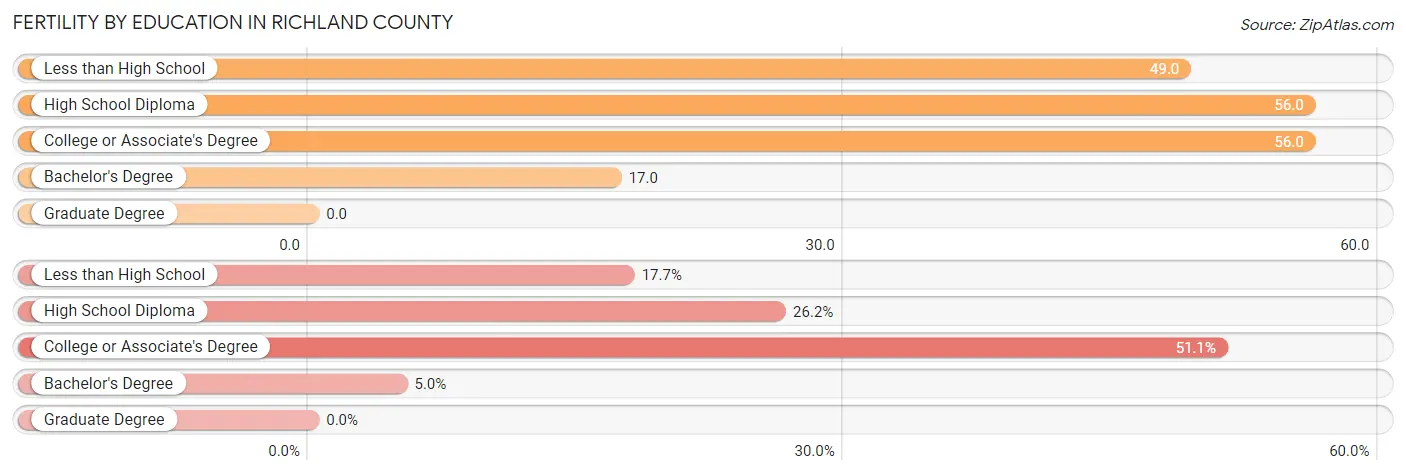
| Educational Attainment | Women with Births | Births / 1,000 Women |
| Less than High School | 25 (17.7%) | 49.0 |
| High School Diploma | 37 (26.2%) | 56.0 |
| College or Associate's Degree | 72 (51.1%) | 56.0 |
| Bachelor's Degree | 7 (5.0%) | 17.0 |
| Graduate Degree | 0 (0.0%) | 0.0 |
| Total | 141 (100.0%) | 45.0 |
Fertility by Education by Marriage Status in Richland County
43.3% of women with births in Richland County are unmarried. Women with the educational attainment of bachelor's degree are most likely to be married with 100.0% of them married at childbirth, while women with the educational attainment of less than high school are least likely to be married with 100.0% of them unmarried at childbirth.
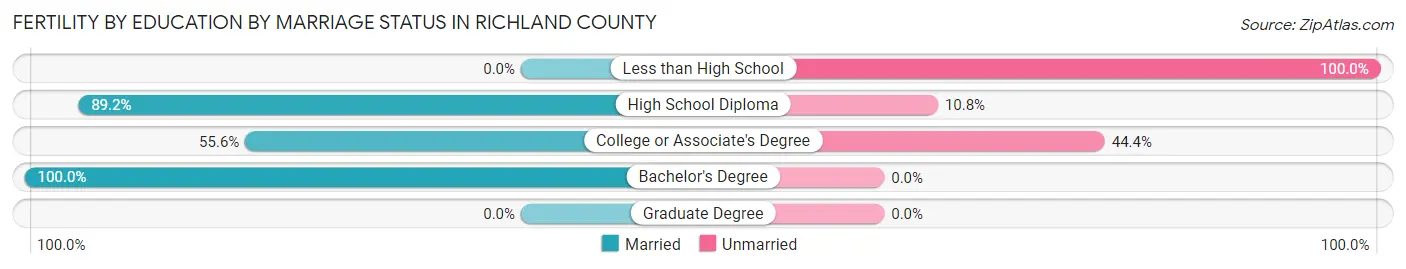
| Educational Attainment | Married | Unmarried |
| Less than High School | 0 (0.0%) | 25 (100.0%) |
| High School Diploma | 33 (89.2%) | 4 (10.8%) |
| College or Associate's Degree | 40 (55.6%) | 32 (44.4%) |
| Bachelor's Degree | 7 (100.0%) | 0 (0.0%) |
| Graduate Degree | 0 (0.0%) | 0 (0.0%) |
| Total | 80 (56.7%) | 61 (43.3%) |
Income in Richland County
Income Overview in Richland County
Per Capita Income in Richland County is $30,975, while median incomes of families and households are $75,169 and $61,607 respectively.
| Characteristic | Number | Measure |
| Per Capita Income | 15,716 | $30,975 |
| Median Family Income | 4,178 | $75,169 |
| Mean Family Income | 4,178 | $87,964 |
| Median Household Income | 6,485 | $61,607 |
| Mean Household Income | 6,485 | $72,845 |
| Income Deficit | 4,178 | $8,878 |
| Wage / Income Gap (%) | 15,716 | 23.93% |
| Wage / Income Gap ($) | 15,716 | 76.07¢ per $1 |
| Gini / Inequality Index | 15,716 | 0.40 |
Earnings by Sex in Richland County
Average Earnings in Richland County are $37,762, $42,793 for men and $32,554 for women, a difference of 23.9%.
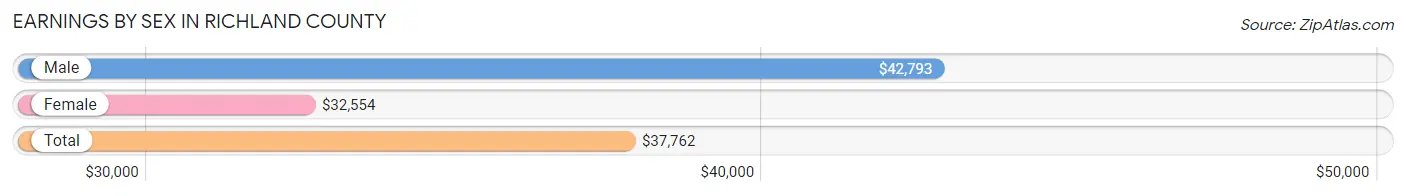
| Sex | Number | Average Earnings |
| Male | 4,366 (52.8%) | $42,793 |
| Female | 3,904 (47.2%) | $32,554 |
| Total | 8,270 (100.0%) | $37,762 |
Earnings by Sex by Income Bracket in Richland County
The most common earnings brackets in Richland County are $55,000 to $64,999 for men (460 | 10.5%) and $55,000 to $64,999 for women (345 | 8.8%).
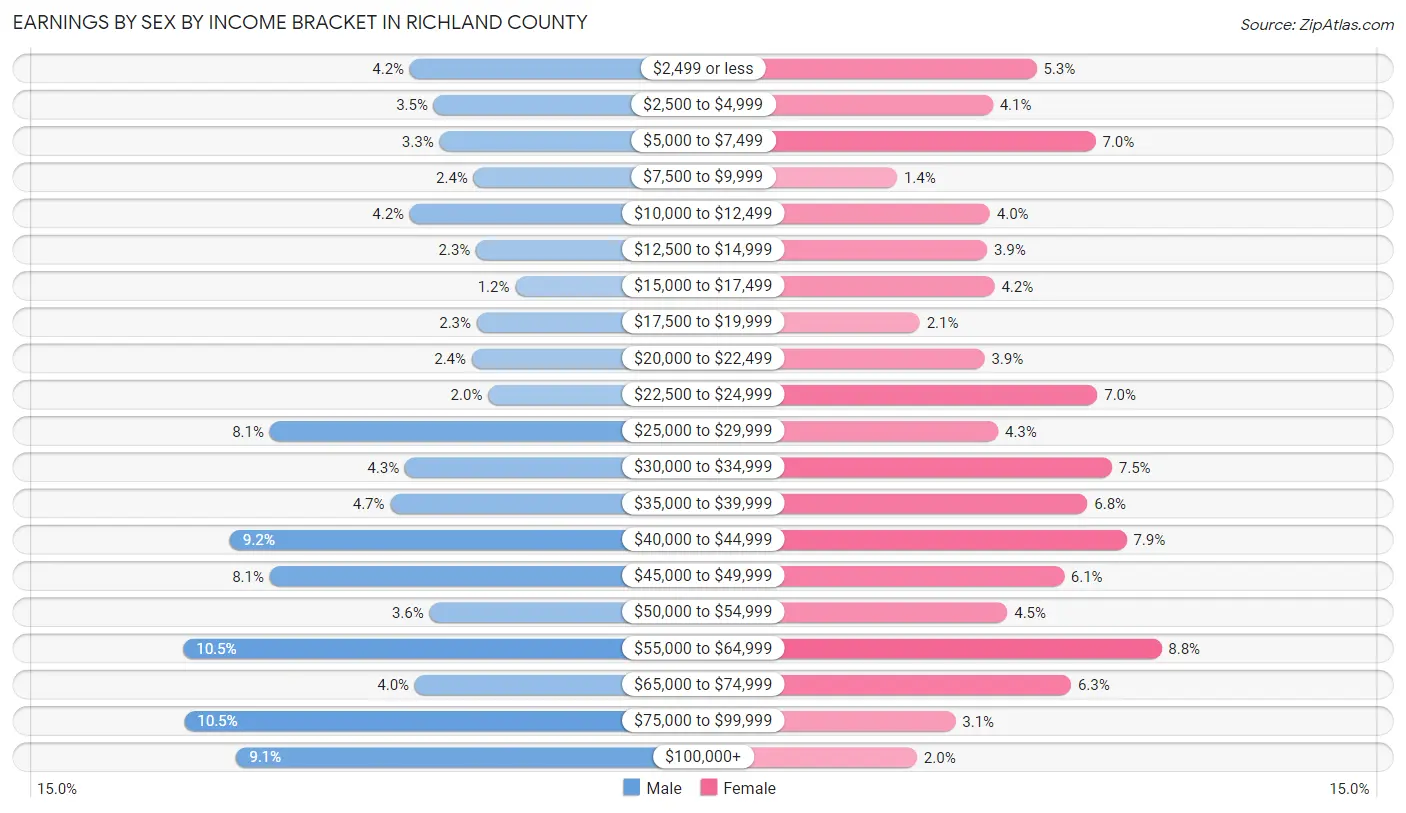
| Income | Male | Female |
| $2,499 or less | 182 (4.2%) | 208 (5.3%) |
| $2,500 to $4,999 | 153 (3.5%) | 160 (4.1%) |
| $5,000 to $7,499 | 146 (3.3%) | 273 (7.0%) |
| $7,500 to $9,999 | 104 (2.4%) | 55 (1.4%) |
| $10,000 to $12,499 | 182 (4.2%) | 157 (4.0%) |
| $12,500 to $14,999 | 101 (2.3%) | 154 (3.9%) |
| $15,000 to $17,499 | 53 (1.2%) | 162 (4.2%) |
| $17,500 to $19,999 | 100 (2.3%) | 80 (2.1%) |
| $20,000 to $22,499 | 106 (2.4%) | 151 (3.9%) |
| $22,500 to $24,999 | 86 (2.0%) | 275 (7.0%) |
| $25,000 to $29,999 | 354 (8.1%) | 166 (4.3%) |
| $30,000 to $34,999 | 188 (4.3%) | 291 (7.4%) |
| $35,000 to $39,999 | 206 (4.7%) | 264 (6.8%) |
| $40,000 to $44,999 | 403 (9.2%) | 307 (7.9%) |
| $45,000 to $49,999 | 354 (8.1%) | 238 (6.1%) |
| $50,000 to $54,999 | 158 (3.6%) | 176 (4.5%) |
| $55,000 to $64,999 | 460 (10.5%) | 345 (8.8%) |
| $65,000 to $74,999 | 176 (4.0%) | 246 (6.3%) |
| $75,000 to $99,999 | 459 (10.5%) | 119 (3.0%) |
| $100,000+ | 395 (9.0%) | 77 (2.0%) |
| Total | 4,366 (100.0%) | 3,904 (100.0%) |
Earnings by Sex by Educational Attainment in Richland County
Average earnings in Richland County are $46,818 for men and $36,108 for women, a difference of 22.9%. Men with an educational attainment of graduate degree enjoy the highest average annual earnings of $96,250, while those with less than high school education earn the least with $34,236. Women with an educational attainment of graduate degree earn the most with the average annual earnings of $58,045, while those with less than high school education have the smallest earnings of $24,231.
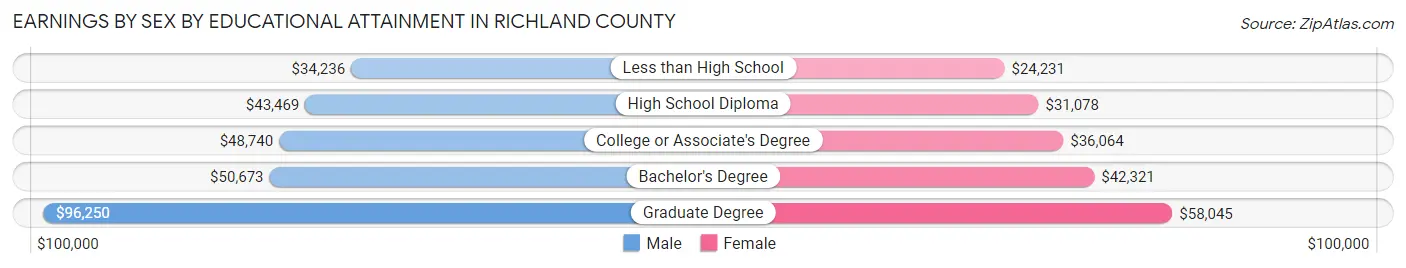
| Educational Attainment | Male Income | Female Income |
| Less than High School | $34,236 | $24,231 |
| High School Diploma | $43,469 | $31,078 |
| College or Associate's Degree | $48,740 | $36,064 |
| Bachelor's Degree | $50,673 | $42,321 |
| Graduate Degree | $96,250 | $58,045 |
| Total | $46,818 | $36,108 |
Family Income in Richland County
Family Income Brackets in Richland County
According to the Richland County family income data, there are 1,007 families falling into the $100,000 to $149,999 income range, which is the most common income bracket and makes up 24.1% of all families. Conversely, the $10,000 to $14,999 income bracket is the least frequent group with only 54 families (1.3%) belonging to this category.
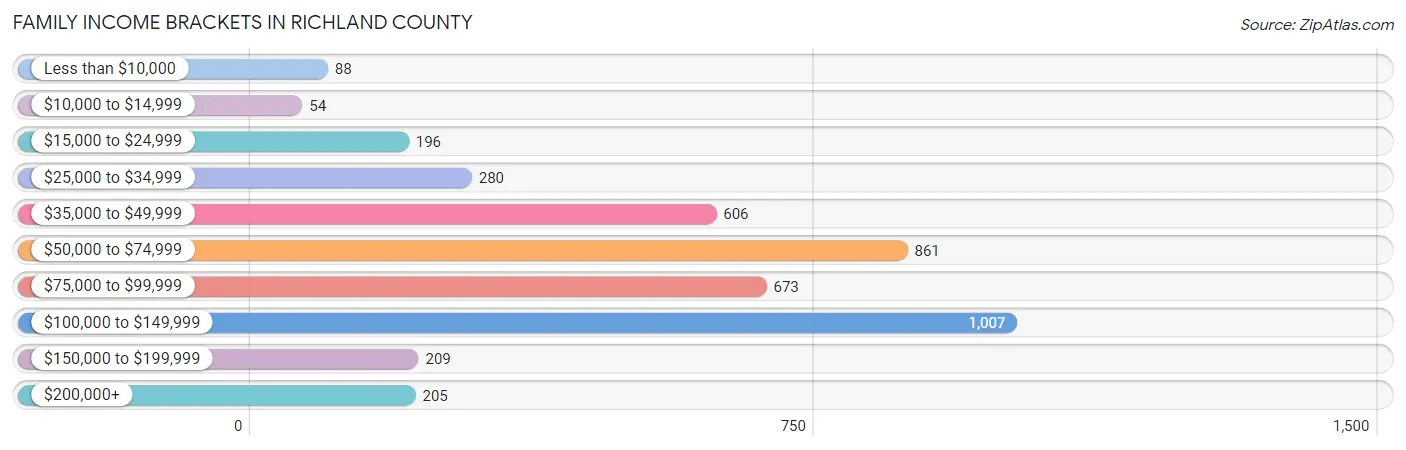
| Income Bracket | # Families | % Families |
| Less than $10,000 | 88 | 2.1% |
| $10,000 to $14,999 | 54 | 1.3% |
| $15,000 to $24,999 | 196 | 4.7% |
| $25,000 to $34,999 | 280 | 6.7% |
| $35,000 to $49,999 | 606 | 14.5% |
| $50,000 to $74,999 | 861 | 20.6% |
| $75,000 to $99,999 | 673 | 16.1% |
| $100,000 to $149,999 | 1,007 | 24.1% |
| $150,000 to $199,999 | 209 | 5.0% |
| $200,000+ | 205 | 4.9% |
Family Income by Famaliy Size in Richland County
5-person families (347 | 8.3%) account for the highest median family income in Richland County with $121,378 per family, while 2-person families (2,304 | 55.1%) have the highest median income of $36,402 per family member.
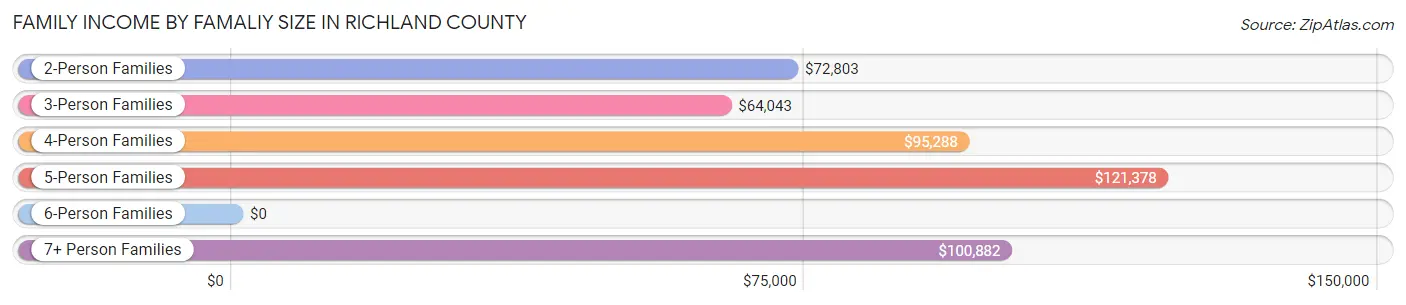
| Income Bracket | # Families | Median Income |
| 2-Person Families | 2,304 (55.1%) | $72,803 |
| 3-Person Families | 824 (19.7%) | $64,043 |
| 4-Person Families | 619 (14.8%) | $95,288 |
| 5-Person Families | 347 (8.3%) | $121,378 |
| 6-Person Families | 58 (1.4%) | $0 |
| 7+ Person Families | 26 (0.6%) | $100,882 |
| Total | 4,178 (100.0%) | $75,169 |
Family Income by Number of Earners in Richland County
The median family income in Richland County is $75,169, with families comprising 3+ earners (409) having the highest median family income of $121,891, while families with no earners (546) have the lowest median family income of $45,521, accounting for 9.8% and 13.1% of families, respectively.
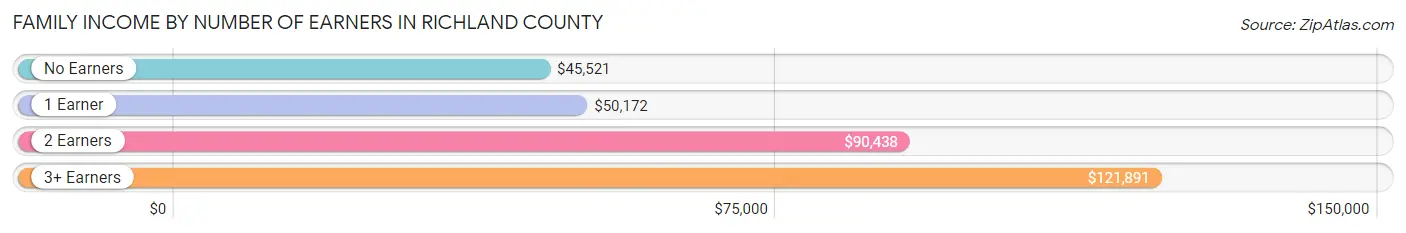
| Number of Earners | # Families | Median Income |
| No Earners | 546 (13.1%) | $45,521 |
| 1 Earner | 1,430 (34.2%) | $50,172 |
| 2 Earners | 1,793 (42.9%) | $90,438 |
| 3+ Earners | 409 (9.8%) | $121,891 |
| Total | 4,178 (100.0%) | $75,169 |
Household Income in Richland County
Household Income Brackets in Richland County
With 1,245 households falling in the category, the $50,000 to $74,999 income range is the most frequent in Richland County, accounting for 19.2% of all households. In contrast, only 214 households (3.3%) fall into the $200,000+ income bracket, making it the least populous group.
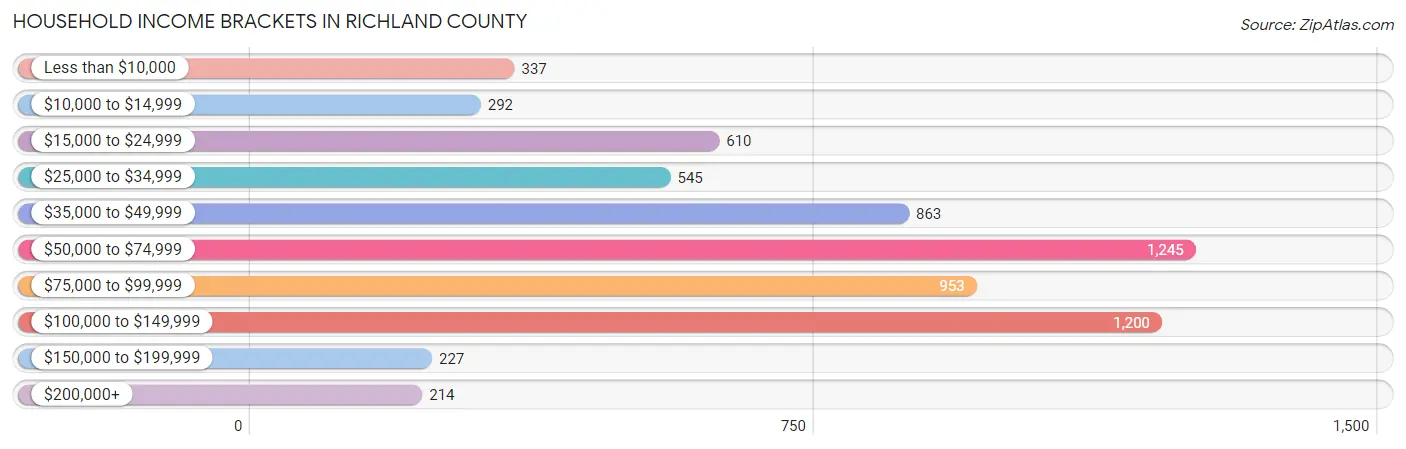
| Income Bracket | # Households | % Households |
| Less than $10,000 | 337 | 5.2% |
| $10,000 to $14,999 | 292 | 4.5% |
| $15,000 to $24,999 | 610 | 9.4% |
| $25,000 to $34,999 | 545 | 8.4% |
| $35,000 to $49,999 | 863 | 13.3% |
| $50,000 to $74,999 | 1,245 | 19.2% |
| $75,000 to $99,999 | 953 | 14.7% |
| $100,000 to $149,999 | 1,200 | 18.5% |
| $150,000 to $199,999 | 227 | 3.5% |
| $200,000+ | 214 | 3.3% |
Household Income by Householder Age in Richland County
The median household income in Richland County is $61,607, with the highest median household income of $73,642 found in the 45 to 64 years age bracket for the primary householder. A total of 2,476 households (38.2%) fall into this category. Meanwhile, the 15 to 24 years age bracket for the primary householder has the lowest median household income of $44,306, with 227 households (3.5%) in this group.
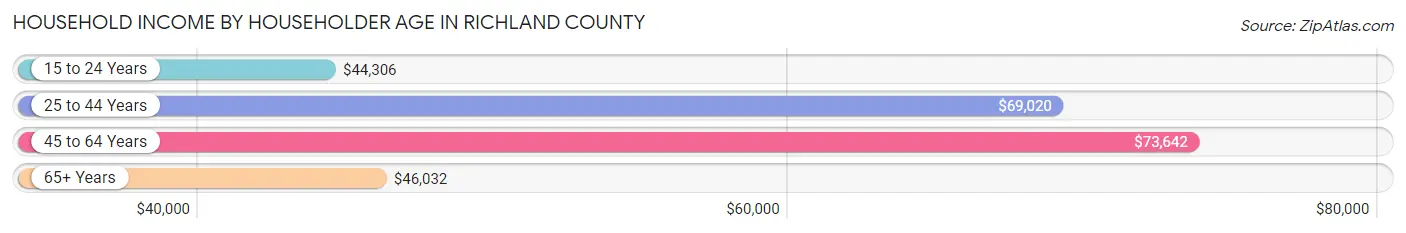
| Income Bracket | # Households | Median Income |
| 15 to 24 Years | 227 (3.5%) | $44,306 |
| 25 to 44 Years | 1,723 (26.6%) | $69,020 |
| 45 to 64 Years | 2,476 (38.2%) | $73,642 |
| 65+ Years | 2,059 (31.8%) | $46,032 |
| Total | 6,485 (100.0%) | $61,607 |
Poverty in Richland County
Income Below Poverty by Sex and Age in Richland County
With 11.4% poverty level for males and 16.1% for females among the residents of Richland County, 6 to 11 year old males and 55 to 64 year old females are the most vulnerable to poverty, with 145 males (23.0%) and 252 females (22.1%) in their respective age groups living below the poverty level.
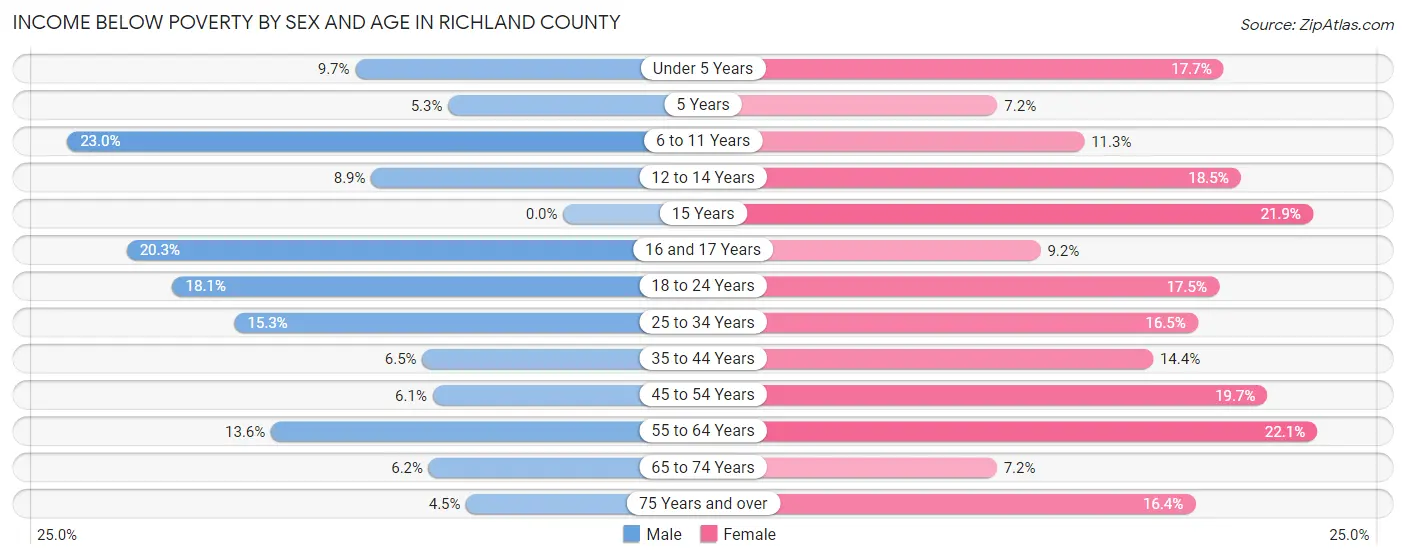
| Age Bracket | Male | Female |
| Under 5 Years | 41 (9.7%) | 79 (17.7%) |
| 5 Years | 7 (5.3%) | 7 (7.2%) |
| 6 to 11 Years | 145 (23.0%) | 54 (11.3%) |
| 12 to 14 Years | 23 (8.9%) | 64 (18.5%) |
| 15 Years | 0 (0.0%) | 26 (21.8%) |
| 16 and 17 Years | 63 (20.3%) | 19 (9.2%) |
| 18 to 24 Years | 120 (18.1%) | 89 (17.5%) |
| 25 to 34 Years | 137 (15.3%) | 140 (16.5%) |
| 35 to 44 Years | 62 (6.5%) | 134 (14.4%) |
| 45 to 54 Years | 56 (6.1%) | 179 (19.7%) |
| 55 to 64 Years | 150 (13.6%) | 252 (22.1%) |
| 65 to 74 Years | 50 (6.2%) | 61 (7.2%) |
| 75 Years and over | 26 (4.5%) | 129 (16.4%) |
| Total | 880 (11.4%) | 1,233 (16.1%) |
Income Above Poverty by Sex and Age in Richland County
According to the poverty statistics in Richland County, males aged 15 years and females aged 65 to 74 years are the age groups that are most secure financially, with 100.0% of males and 92.8% of females in these age groups living above the poverty line.
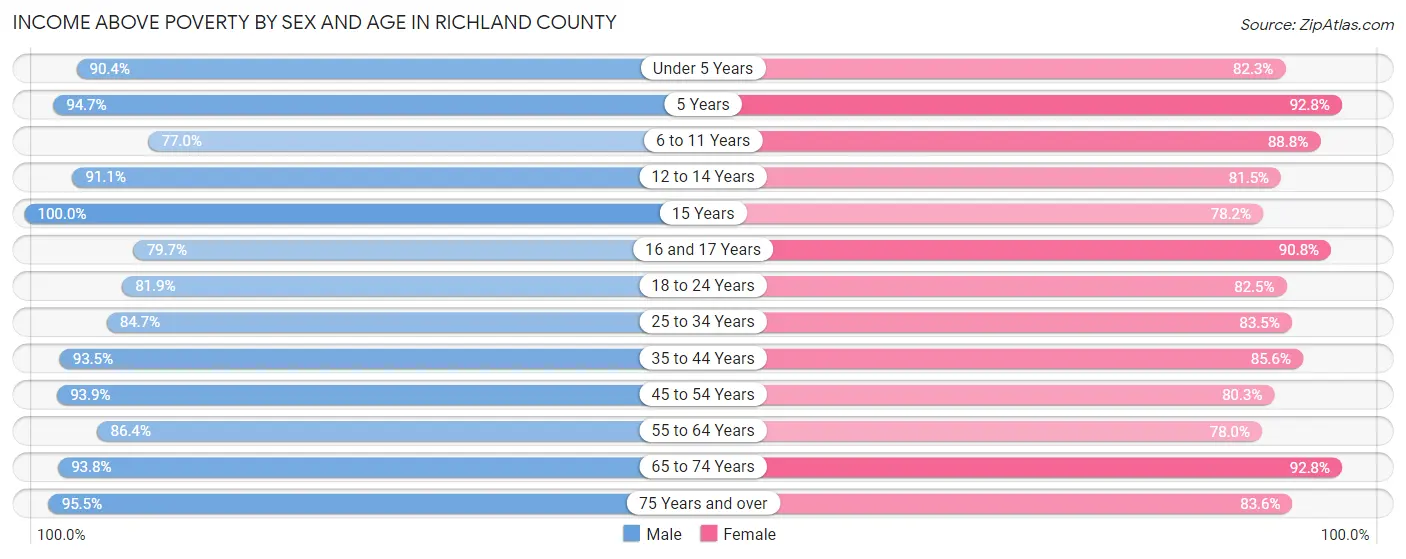
| Age Bracket | Male | Female |
| Under 5 Years | 384 (90.3%) | 367 (82.3%) |
| 5 Years | 124 (94.7%) | 90 (92.8%) |
| 6 to 11 Years | 485 (77.0%) | 426 (88.7%) |
| 12 to 14 Years | 235 (91.1%) | 282 (81.5%) |
| 15 Years | 40 (100.0%) | 93 (78.1%) |
| 16 and 17 Years | 248 (79.7%) | 187 (90.8%) |
| 18 to 24 Years | 542 (81.9%) | 420 (82.5%) |
| 25 to 34 Years | 761 (84.7%) | 708 (83.5%) |
| 35 to 44 Years | 886 (93.5%) | 794 (85.6%) |
| 45 to 54 Years | 868 (93.9%) | 728 (80.3%) |
| 55 to 64 Years | 956 (86.4%) | 891 (77.9%) |
| 65 to 74 Years | 751 (93.8%) | 787 (92.8%) |
| 75 Years and over | 552 (95.5%) | 658 (83.6%) |
| Total | 6,832 (88.6%) | 6,431 (83.9%) |
Income Below Poverty Among Married-Couple Families in Richland County
The poverty statistics for married-couple families in Richland County show that 3.0% or 94 of the total 3,105 families live below the poverty line. Families with 1 or 2 children have the highest poverty rate of 8.6%, comprising of 75 families. On the other hand, families with 3 or 4 children have the lowest poverty rate of 0.0%, which includes 0 families.
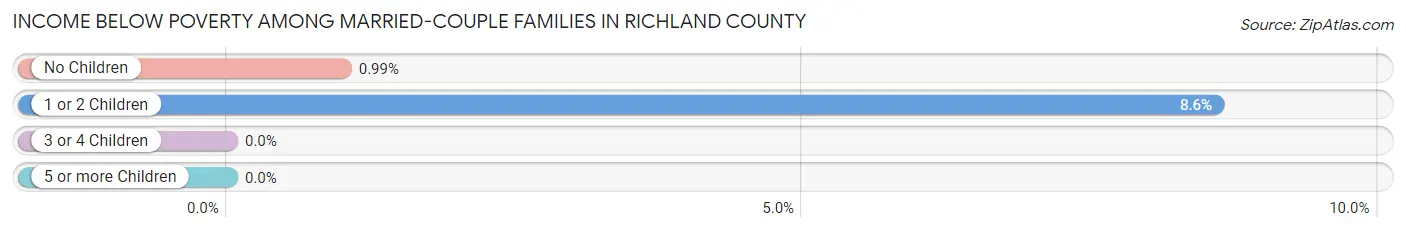
| Children | Above Poverty | Below Poverty |
| No Children | 1,908 (99.0%) | 19 (1.0%) |
| 1 or 2 Children | 799 (91.4%) | 75 (8.6%) |
| 3 or 4 Children | 287 (100.0%) | 0 (0.0%) |
| 5 or more Children | 17 (100.0%) | 0 (0.0%) |
| Total | 3,011 (97.0%) | 94 (3.0%) |
Income Below Poverty Among Single-Parent Households in Richland County
According to the poverty data in Richland County, 10.4% or 46 single-father households and 27.1% or 171 single-mother households are living below the poverty line. Among single-father households, those with 3 or 4 children have the highest poverty rate, with 4 households (28.6%) experiencing poverty. Likewise, among single-mother households, those with 3 or 4 children have the highest poverty rate, with 18 households (94.7%) falling below the poverty line.
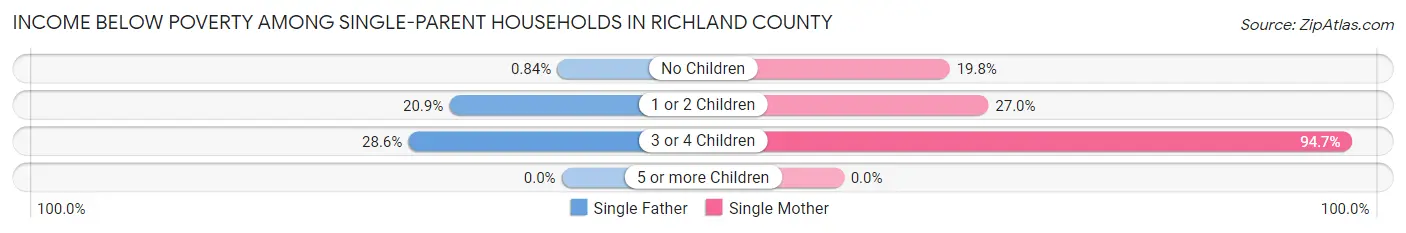
| Children | Single Father | Single Mother |
| No Children | 2 (0.8%) | 32 (19.8%) |
| 1 or 2 Children | 40 (20.9%) | 121 (27.0%) |
| 3 or 4 Children | 4 (28.6%) | 18 (94.7%) |
| 5 or more Children | 0 (0.0%) | 0 (0.0%) |
| Total | 46 (10.4%) | 171 (27.1%) |
Income Below Poverty Among Married-Couple vs Single-Parent Households in Richland County
The poverty data for Richland County shows that 94 of the married-couple family households (3.0%) and 217 of the single-parent households (20.2%) are living below the poverty level. Within the married-couple family households, those with 1 or 2 children have the highest poverty rate, with 75 households (8.6%) falling below the poverty line. Among the single-parent households, those with 3 or 4 children have the highest poverty rate, with 22 household (66.7%) living below poverty.
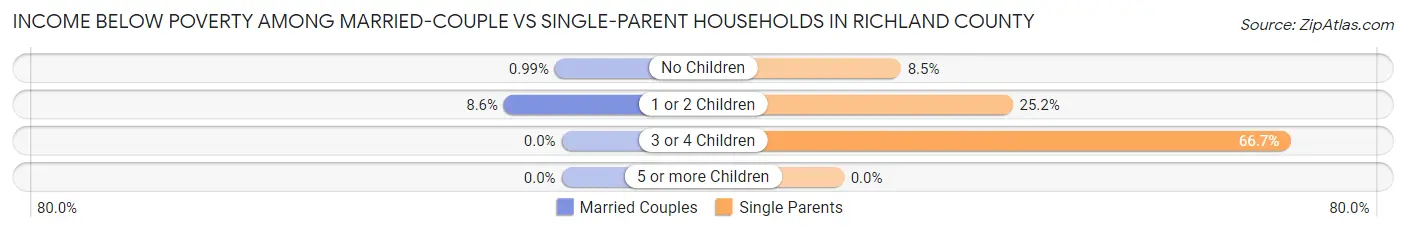
| Children | Married-Couple Families | Single-Parent Households |
| No Children | 19 (1.0%) | 34 (8.5%) |
| 1 or 2 Children | 75 (8.6%) | 161 (25.2%) |
| 3 or 4 Children | 0 (0.0%) | 22 (66.7%) |
| 5 or more Children | 0 (0.0%) | 0 (0.0%) |
| Total | 94 (3.0%) | 217 (20.2%) |
Employment Characteristics in Richland County
Employment by Class of Employer in Richland County
Among the 7,529 employed individuals in Richland County, private company employees (5,522 | 73.3%), self-employed (not incorporated) (524 | 7.0%), and not-for-profit organizations (436 | 5.8%) make up the most common classes of employment.
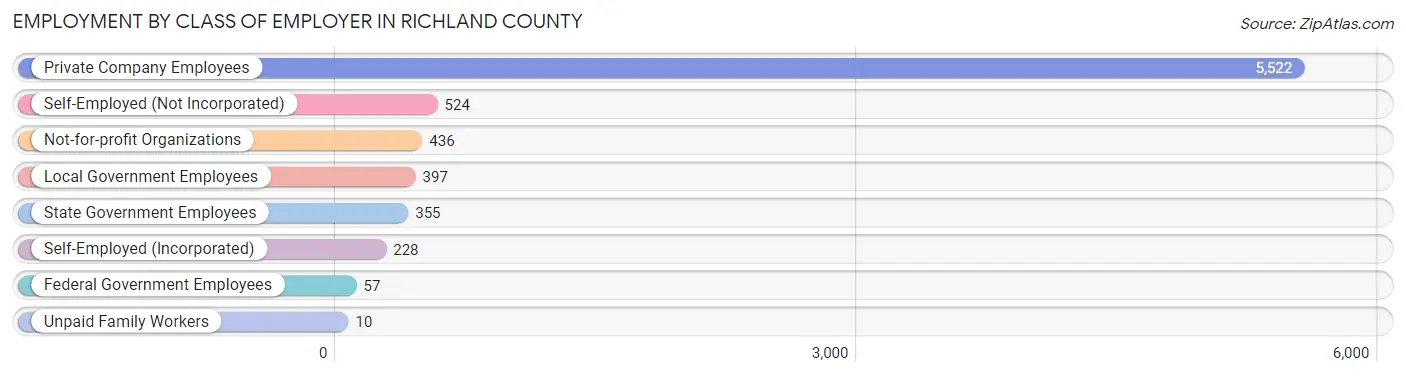
| Employer Class | # Employees | % Employees |
| Private Company Employees | 5,522 | 73.3% |
| Self-Employed (Incorporated) | 228 | 3.0% |
| Self-Employed (Not Incorporated) | 524 | 7.0% |
| Not-for-profit Organizations | 436 | 5.8% |
| Local Government Employees | 397 | 5.3% |
| State Government Employees | 355 | 4.7% |
| Federal Government Employees | 57 | 0.8% |
| Unpaid Family Workers | 10 | 0.1% |
| Total | 7,529 | 100.0% |
Employment Status by Age in Richland County
According to the labor force statistics for Richland County, out of the total population over 16 years of age (12,624), 62.7% or 7,915 individuals are in the labor force, with 4.2% or 332 of them unemployed. The age group with the highest labor force participation rate is 35 to 44 years, with 90.7% or 1,712 individuals in the labor force. Within the labor force, the 65 to 74 years age range has the highest percentage of unemployed individuals, with 16.0% or 64 of them being unemployed.
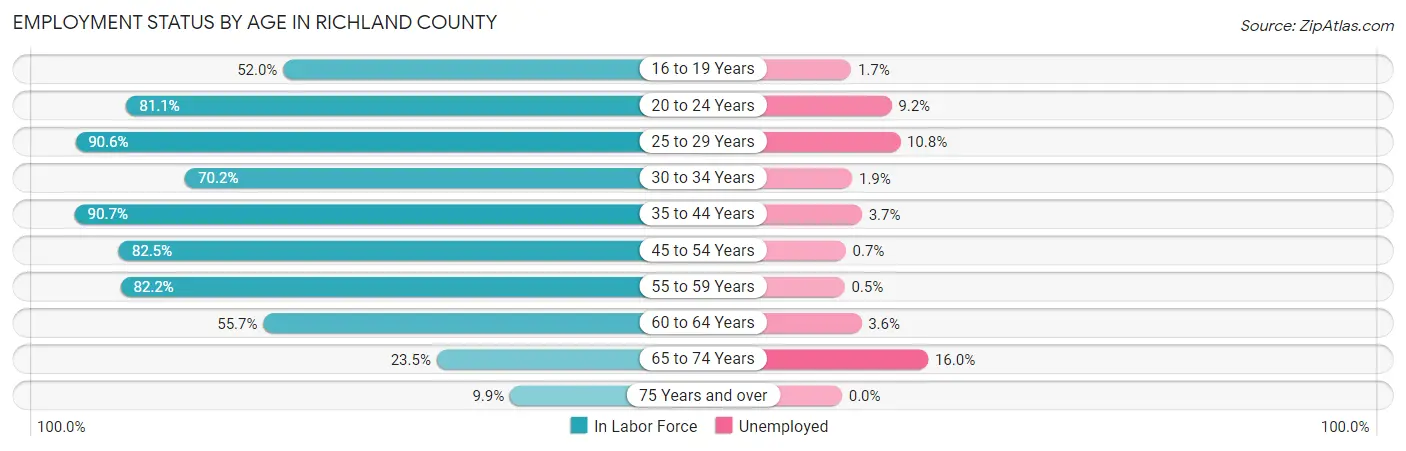
| Age Bracket | In Labor Force | Unemployed |
| 16 to 19 Years | 406 (52.0%) | 7 (1.7%) |
| 20 to 24 Years | 740 (81.1%) | 68 (9.2%) |
| 25 to 29 Years | 787 (90.6%) | 85 (10.8%) |
| 30 to 34 Years | 616 (70.2%) | 12 (1.9%) |
| 35 to 44 Years | 1,712 (90.7%) | 63 (3.7%) |
| 45 to 54 Years | 1,529 (82.5%) | 11 (0.7%) |
| 55 to 59 Years | 1,009 (82.2%) | 5 (0.5%) |
| 60 to 64 Years | 576 (55.7%) | 21 (3.6%) |
| 65 to 74 Years | 399 (23.5%) | 64 (16.0%) |
| 75 Years and over | 147 (9.9%) | 0 (0.0%) |
| Total | 7,915 (62.7%) | 332 (4.2%) |
Employment Status by Educational Attainment in Richland County
According to labor force statistics for Richland County, 80.4% of individuals (6,231) out of the total population between 25 and 64 years of age (7,750) are in the labor force, with 3.2% or 199 of them being unemployed. The group with the highest labor force participation rate are those with the educational attainment of bachelor's degree or higher, with 92.7% or 1,469 individuals in the labor force. Within the labor force, individuals with less than high school education have the highest percentage of unemployment, with 10.5% or 24 of them being unemployed.
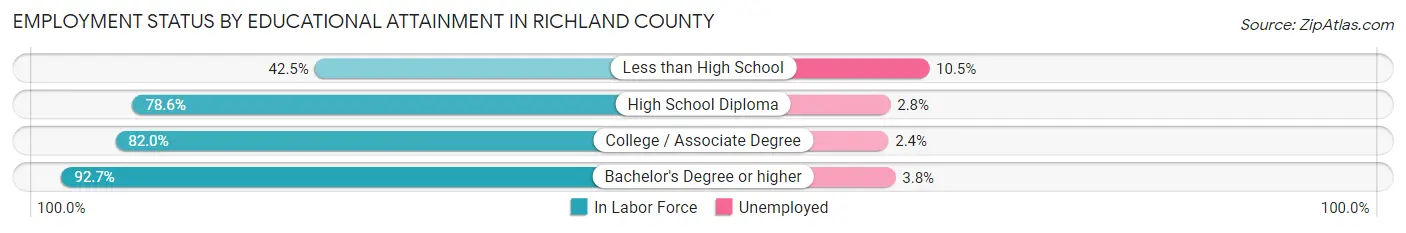
| Educational Attainment | In Labor Force | Unemployed |
| Less than High School | 228 (42.5%) | 56 (10.5%) |
| High School Diploma | 1,903 (78.6%) | 68 (2.8%) |
| College / Associate Degree | 2,631 (82.0%) | 77 (2.4%) |
| Bachelor's Degree or higher | 1,469 (92.7%) | 60 (3.8%) |
| Total | 6,231 (80.4%) | 248 (3.2%) |
Employment Occupations by Sex in Richland County
Management, Business, Science and Arts Occupations
The most common Management, Business, Science and Arts occupations in Richland County are Management (848 | 11.2%), Community & Social Service (508 | 6.7%), Health Diagnosing & Treating (483 | 6.4%), Education Instruction & Library (303 | 4.0%), and Health Technologists (290 | 3.8%).
Management, Business, Science and Arts Occupations by Sex
Within the Management, Business, Science and Arts occupations in Richland County, the most male-oriented occupations are Legal Services & Support (100.0%), Arts, Media & Entertainment (90.9%), and Architecture & Engineering (79.1%), while the most female-oriented occupations are Health Technologists (99.7%), Education, Arts & Media (91.1%), and Health Diagnosing & Treating (88.2%).
| Occupation | Male | Female |
| Management | 536 (63.2%) | 312 (36.8%) |
| Business & Financial | 70 (27.9%) | 181 (72.1%) |
| Computers, Engineering & Science | 103 (58.5%) | 73 (41.5%) |
| Computers & Mathematics | 48 (78.7%) | 13 (21.3%) |
| Architecture & Engineering | 34 (79.1%) | 9 (20.9%) |
| Life, Physical & Social Science | 21 (29.2%) | 51 (70.8%) |
| Community & Social Service | 150 (29.5%) | 358 (70.5%) |
| Education, Arts & Media | 10 (8.8%) | 103 (91.1%) |
| Legal Services & Support | 15 (100.0%) | 0 (0.0%) |
| Education Instruction & Library | 55 (18.1%) | 248 (81.9%) |
| Arts, Media & Entertainment | 70 (90.9%) | 7 (9.1%) |
| Health Diagnosing & Treating | 57 (11.8%) | 426 (88.2%) |
| Health Technologists | 1 (0.3%) | 289 (99.7%) |
| Total (Category) | 916 (40.4%) | 1,350 (59.6%) |
| Total (Overall) | 3,964 (52.3%) | 3,621 (47.7%) |
Services Occupations
The most common Services occupations in Richland County are Food Preparation & Serving (467 | 6.2%), Cleaning & Maintenance (408 | 5.4%), Healthcare Support (239 | 3.2%), Security & Protection (161 | 2.1%), and Personal Care & Service (138 | 1.8%).
Services Occupations by Sex
Within the Services occupations in Richland County, the most male-oriented occupations are Law Enforcement (98.3%), Security & Protection (74.5%), and Cleaning & Maintenance (60.8%), while the most female-oriented occupations are Personal Care & Service (97.1%), Healthcare Support (92.9%), and Firefighting & Prevention (88.6%).
| Occupation | Male | Female |
| Healthcare Support | 17 (7.1%) | 222 (92.9%) |
| Security & Protection | 120 (74.5%) | 41 (25.5%) |
| Firefighting & Prevention | 5 (11.4%) | 39 (88.6%) |
| Law Enforcement | 115 (98.3%) | 2 (1.7%) |
| Food Preparation & Serving | 263 (56.3%) | 204 (43.7%) |
| Cleaning & Maintenance | 248 (60.8%) | 160 (39.2%) |
| Personal Care & Service | 4 (2.9%) | 134 (97.1%) |
| Total (Category) | 652 (46.1%) | 761 (53.9%) |
| Total (Overall) | 3,964 (52.3%) | 3,621 (47.7%) |
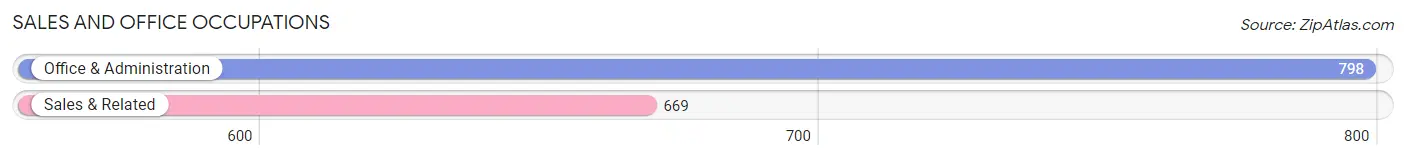
Sales and Office Occupations
The most common Sales and Office occupations in Richland County are Office & Administration (798 | 10.5%), and Sales & Related (669 | 8.8%).
Sales and Office Occupations by Sex
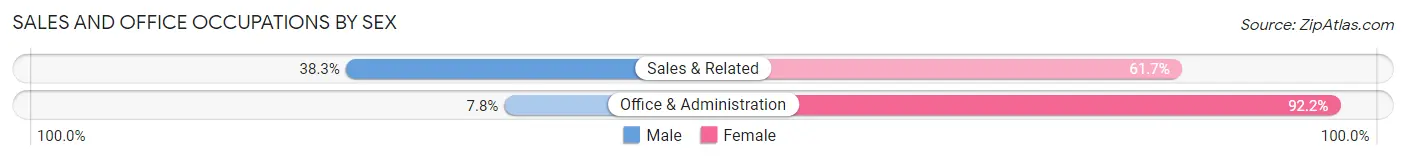
| Occupation | Male | Female |
| Sales & Related | 256 (38.3%) | 413 (61.7%) |
| Office & Administration | 62 (7.8%) | 736 (92.2%) |
| Total (Category) | 318 (21.7%) | 1,149 (78.3%) |
| Total (Overall) | 3,964 (52.3%) | 3,621 (47.7%) |
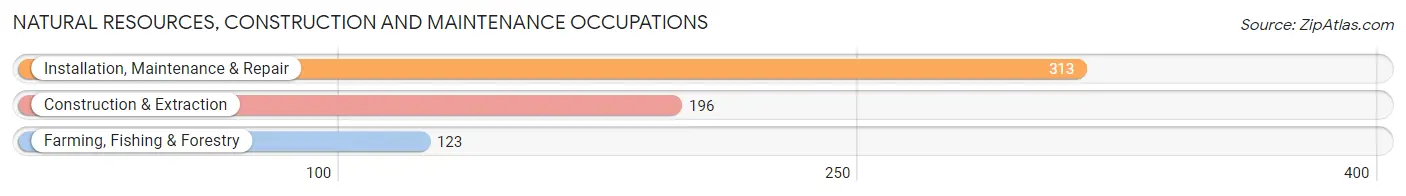
Natural Resources, Construction and Maintenance Occupations
The most common Natural Resources, Construction and Maintenance occupations in Richland County are Installation, Maintenance & Repair (313 | 4.1%), Construction & Extraction (196 | 2.6%), and Farming, Fishing & Forestry (123 | 1.6%).
Natural Resources, Construction and Maintenance Occupations by Sex
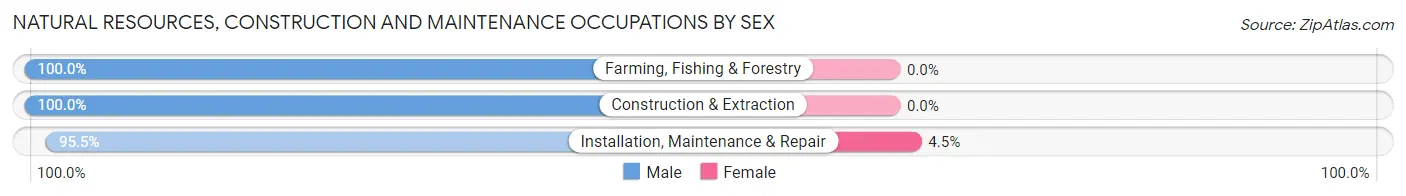
| Occupation | Male | Female |
| Farming, Fishing & Forestry | 123 (100.0%) | 0 (0.0%) |
| Construction & Extraction | 196 (100.0%) | 0 (0.0%) |
| Installation, Maintenance & Repair | 299 (95.5%) | 14 (4.5%) |
| Total (Category) | 618 (97.8%) | 14 (2.2%) |
| Total (Overall) | 3,964 (52.3%) | 3,621 (47.7%) |
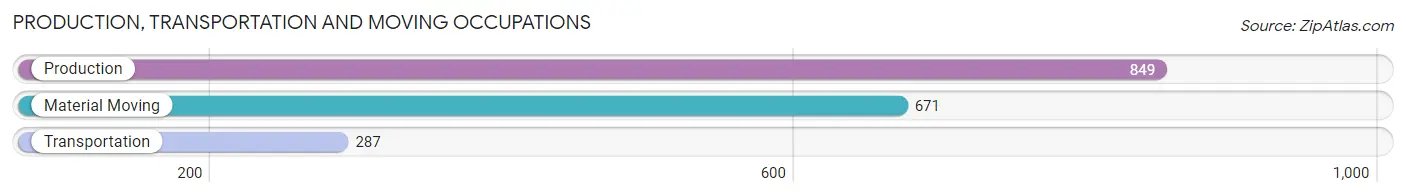
Production, Transportation and Moving Occupations
The most common Production, Transportation and Moving occupations in Richland County are Production (849 | 11.2%), Material Moving (671 | 8.8%), and Transportation (287 | 3.8%).
Production, Transportation and Moving Occupations by Sex
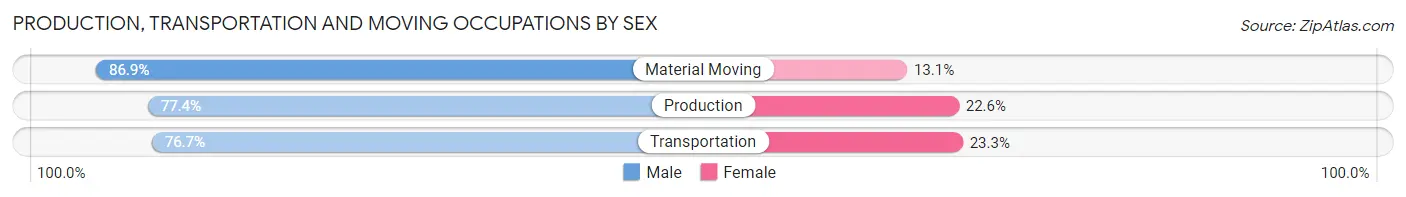
| Occupation | Male | Female |
| Production | 657 (77.4%) | 192 (22.6%) |
| Transportation | 220 (76.7%) | 67 (23.3%) |
| Material Moving | 583 (86.9%) | 88 (13.1%) |
| Total (Category) | 1,460 (80.8%) | 347 (19.2%) |
| Total (Overall) | 3,964 (52.3%) | 3,621 (47.7%) |
Employment Industries by Sex in Richland County
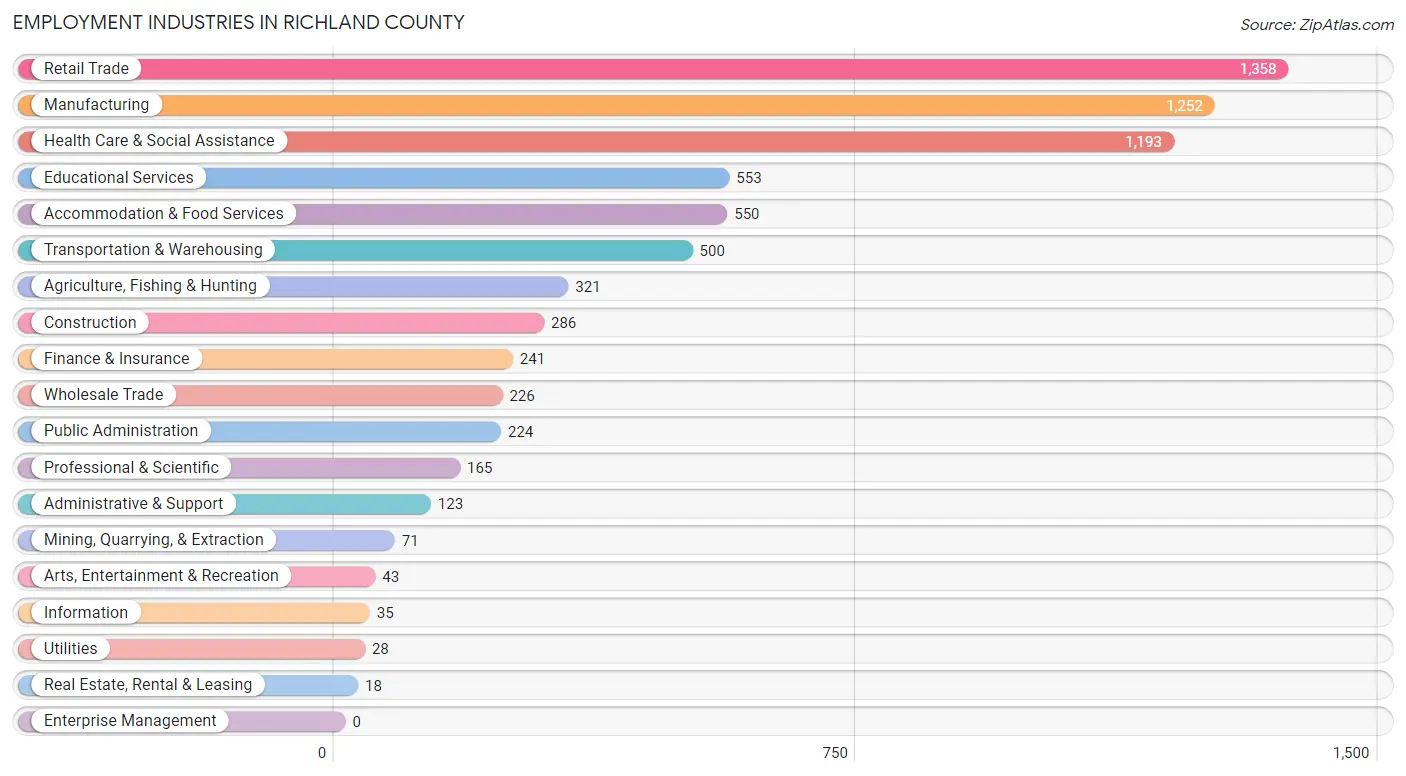
Employment Industries in Richland County
The major employment industries in Richland County include Retail Trade (1,358 | 17.9%), Manufacturing (1,252 | 16.5%), Health Care & Social Assistance (1,193 | 15.7%), Educational Services (553 | 7.3%), and Accommodation & Food Services (550 | 7.2%).
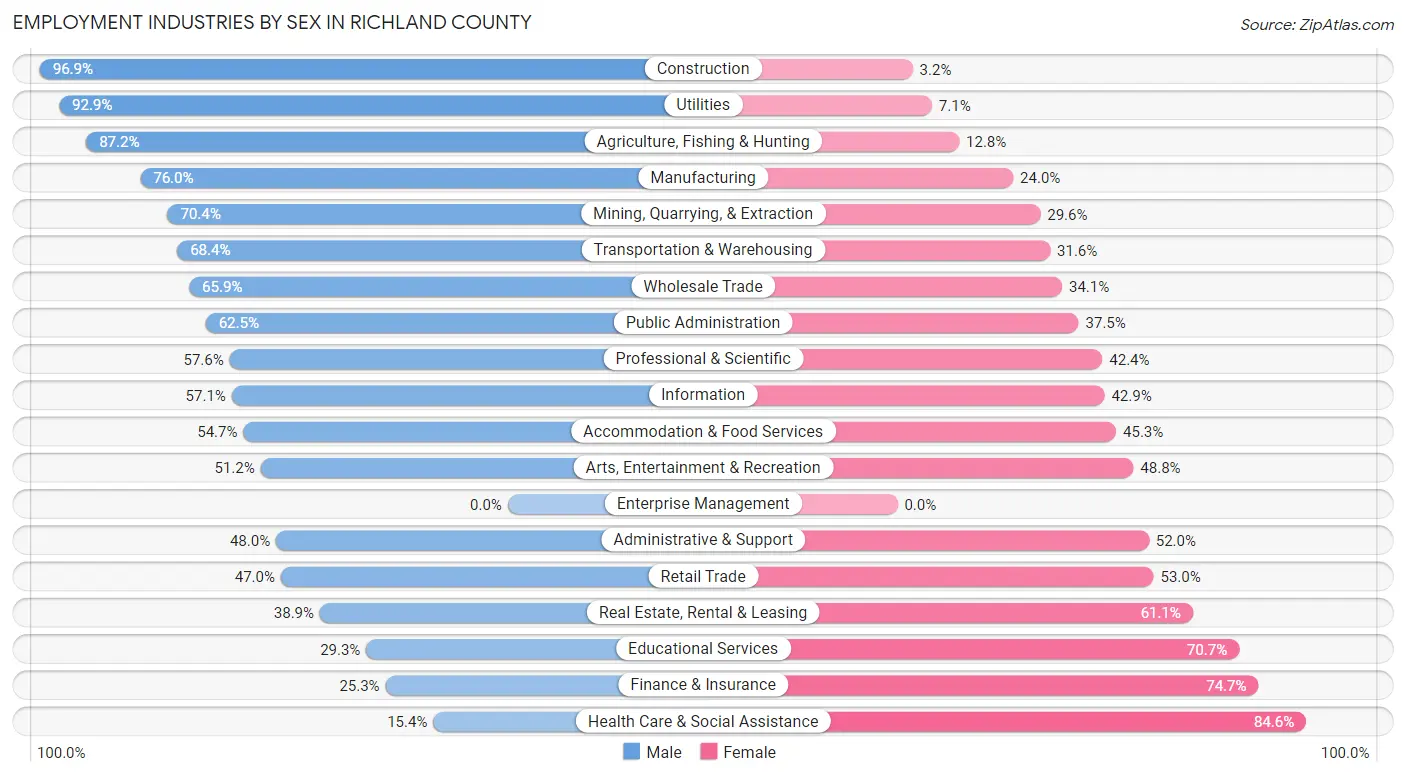
Employment Industries by Sex in Richland County
The Richland County industries that see more men than women are Construction (96.9%), Utilities (92.9%), and Agriculture, Fishing & Hunting (87.2%), whereas the industries that tend to have a higher number of women are Health Care & Social Assistance (84.6%), Finance & Insurance (74.7%), and Educational Services (70.7%).
| Industry | Male | Female |
| Agriculture, Fishing & Hunting | 280 (87.2%) | 41 (12.8%) |
| Mining, Quarrying, & Extraction | 50 (70.4%) | 21 (29.6%) |
| Construction | 277 (96.9%) | 9 (3.2%) |
| Manufacturing | 952 (76.0%) | 300 (24.0%) |
| Wholesale Trade | 149 (65.9%) | 77 (34.1%) |
| Retail Trade | 638 (47.0%) | 720 (53.0%) |
| Transportation & Warehousing | 342 (68.4%) | 158 (31.6%) |
| Utilities | 26 (92.9%) | 2 (7.1%) |
| Information | 20 (57.1%) | 15 (42.9%) |
| Finance & Insurance | 61 (25.3%) | 180 (74.7%) |
| Real Estate, Rental & Leasing | 7 (38.9%) | 11 (61.1%) |
| Professional & Scientific | 95 (57.6%) | 70 (42.4%) |
| Enterprise Management | 0 (0.0%) | 0 (0.0%) |
| Administrative & Support | 59 (48.0%) | 64 (52.0%) |
| Educational Services | 162 (29.3%) | 391 (70.7%) |
| Health Care & Social Assistance | 184 (15.4%) | 1,009 (84.6%) |
| Arts, Entertainment & Recreation | 22 (51.2%) | 21 (48.8%) |
| Accommodation & Food Services | 301 (54.7%) | 249 (45.3%) |
| Public Administration | 140 (62.5%) | 84 (37.5%) |
| Total | 3,964 (52.3%) | 3,621 (47.7%) |
Education in Richland County
School Enrollment in Richland County
The most common levels of schooling among the 3,412 students in Richland County are middle school (848 | 24.8%), high school (755 | 22.1%), and elementary school (637 | 18.7%).
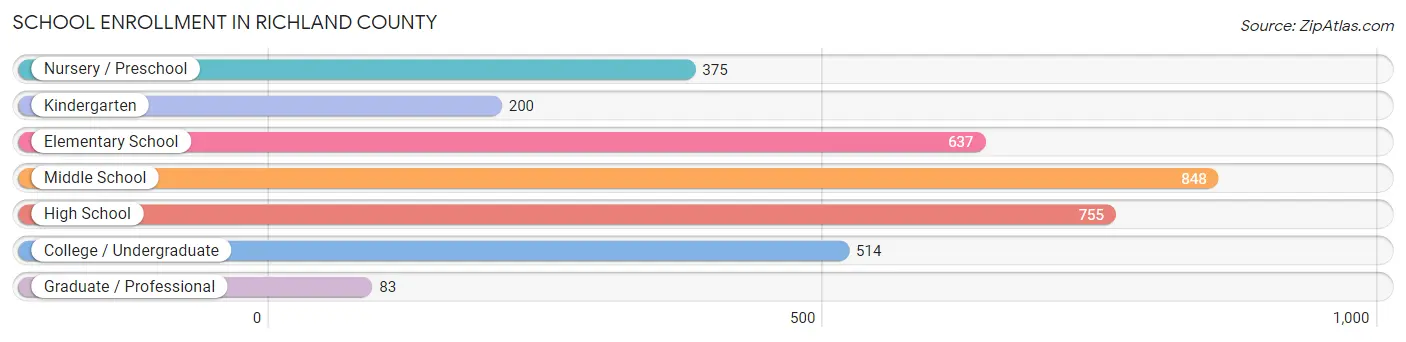
| School Level | # Students | % Students |
| Nursery / Preschool | 375 | 11.0% |
| Kindergarten | 200 | 5.9% |
| Elementary School | 637 | 18.7% |
| Middle School | 848 | 24.8% |
| High School | 755 | 22.1% |
| College / Undergraduate | 514 | 15.1% |
| Graduate / Professional | 83 | 2.4% |
| Total | 3,412 | 100.0% |
School Enrollment by Age by Funding Source in Richland County
Out of a total of 3,412 students who are enrolled in schools in Richland County, 624 (18.3%) attend a private institution, while the remaining 2,788 (81.7%) are enrolled in public schools. The age group of 3 to 4 year olds has the highest likelihood of being enrolled in private schools, with 157 (55.5% in the age bracket) enrolled. Conversely, the age group of 15 to 17 year olds has the lowest likelihood of being enrolled in a private school, with 558 (94.1% in the age bracket) attending a public institution.
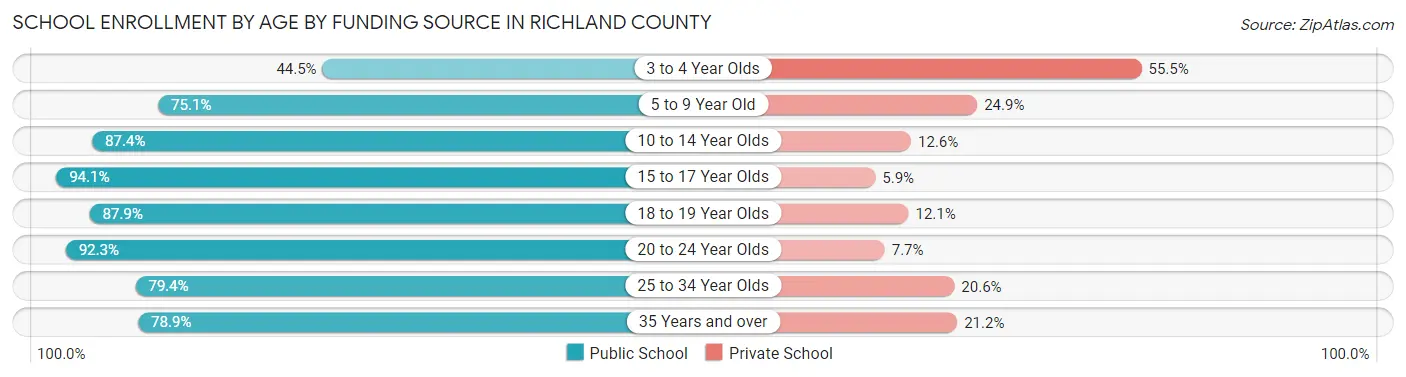
| Age Bracket | Public School | Private School |
| 3 to 4 Year Olds | 126 (44.5%) | 157 (55.5%) |
| 5 to 9 Year Old | 604 (75.1%) | 200 (24.9%) |
| 10 to 14 Year Olds | 919 (87.4%) | 132 (12.6%) |
| 15 to 17 Year Olds | 558 (94.1%) | 35 (5.9%) |
| 18 to 19 Year Olds | 160 (87.9%) | 22 (12.1%) |
| 20 to 24 Year Olds | 193 (92.3%) | 16 (7.7%) |
| 25 to 34 Year Olds | 50 (79.4%) | 13 (20.6%) |
| 35 Years and over | 179 (78.8%) | 48 (21.1%) |
| Total | 2,788 (81.7%) | 624 (18.3%) |
Educational Attainment by Field of Study in Richland County
Business (494 | 22.1%), education (413 | 18.5%), science & technology (312 | 14.0%), psychology (154 | 6.9%), and arts & humanities (140 | 6.3%) are the most common fields of study among 2,236 individuals in Richland County who have obtained a bachelor's degree or higher.
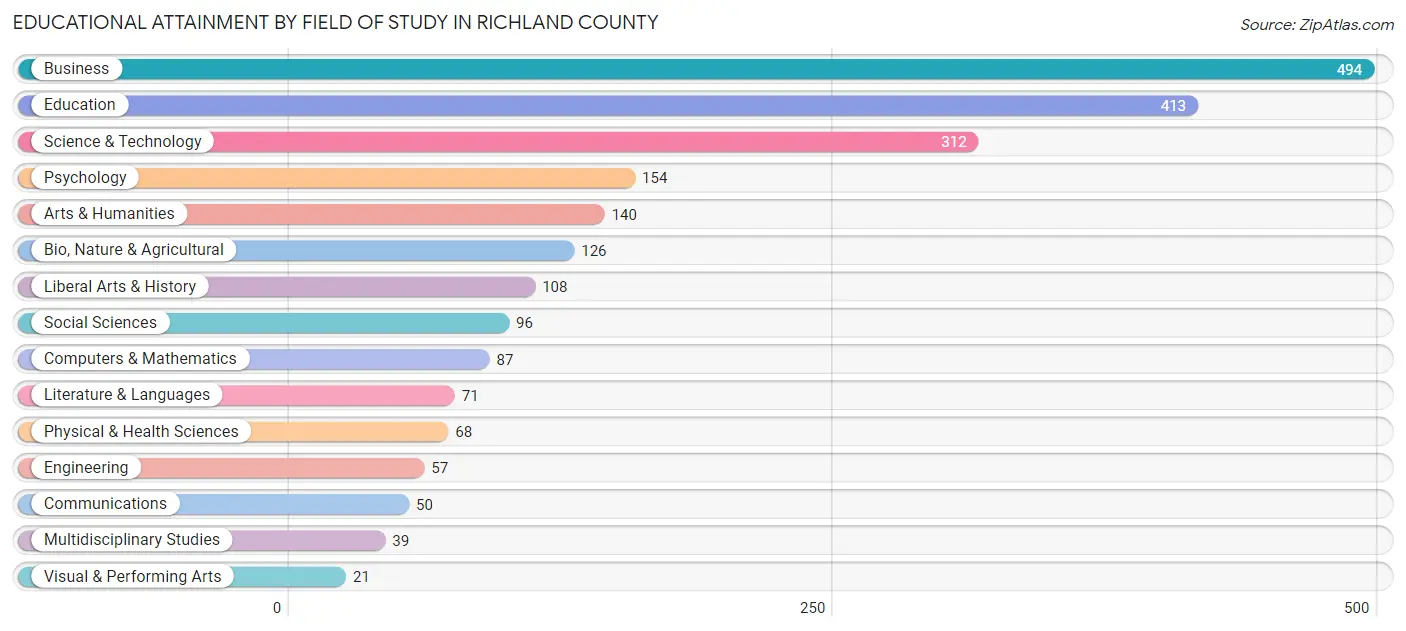
| Field of Study | # Graduates | % Graduates |
| Computers & Mathematics | 87 | 3.9% |
| Bio, Nature & Agricultural | 126 | 5.6% |
| Physical & Health Sciences | 68 | 3.0% |
| Psychology | 154 | 6.9% |
| Social Sciences | 96 | 4.3% |
| Engineering | 57 | 2.5% |
| Multidisciplinary Studies | 39 | 1.7% |
| Science & Technology | 312 | 14.0% |
| Business | 494 | 22.1% |
| Education | 413 | 18.5% |
| Literature & Languages | 71 | 3.2% |
| Liberal Arts & History | 108 | 4.8% |
| Visual & Performing Arts | 21 | 0.9% |
| Communications | 50 | 2.2% |
| Arts & Humanities | 140 | 6.3% |
| Total | 2,236 | 100.0% |
Transportation & Commute in Richland County
Vehicle Availability by Sex in Richland County
The most prevalent vehicle ownership categories in Richland County are males with 2 vehicles (1,509, accounting for 38.4%) and females with 2 vehicles (1,222, making up 41.9%).
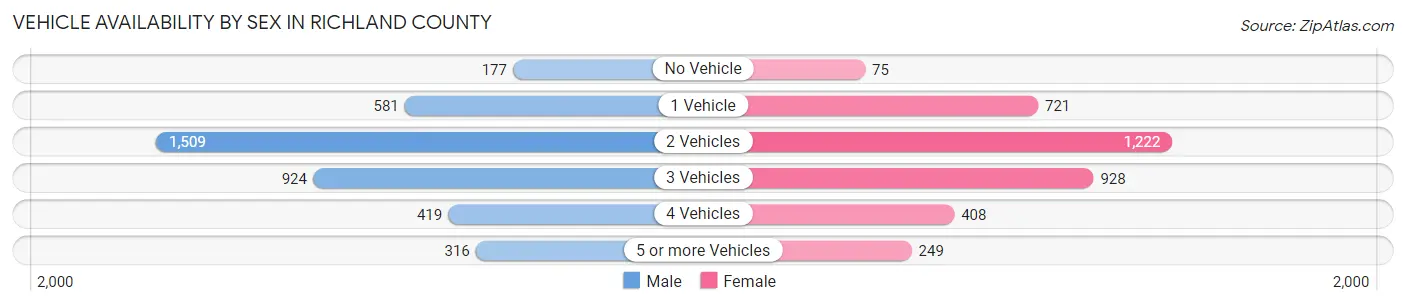
| Vehicles Available | Male | Female |
| No Vehicle | 177 (4.5%) | 75 (2.1%) |
| 1 Vehicle | 581 (14.8%) | 721 (20.0%) |
| 2 Vehicles | 1,509 (38.4%) | 1,222 (33.9%) |
| 3 Vehicles | 924 (23.5%) | 928 (25.8%) |
| 4 Vehicles | 419 (10.7%) | 408 (11.3%) |
| 5 or more Vehicles | 316 (8.1%) | 249 (6.9%) |
| Total | 3,926 (100.0%) | 3,603 (100.0%) |
Commute Time in Richland County
The most frequently occuring commute durations in Richland County are 5 to 9 minutes (1,758 commuters, 24.8%), 10 to 14 minutes (1,406 commuters, 19.9%), and 15 to 19 minutes (672 commuters, 9.5%).
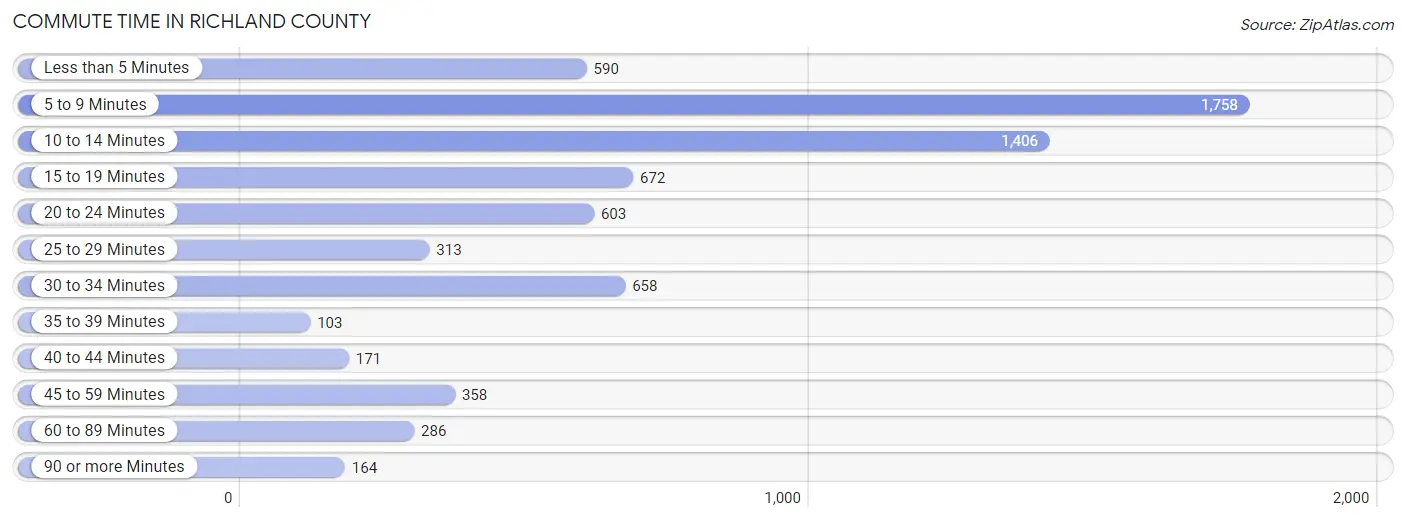
| Commute Time | # Commuters | % Commuters |
| Less than 5 Minutes | 590 | 8.3% |
| 5 to 9 Minutes | 1,758 | 24.8% |
| 10 to 14 Minutes | 1,406 | 19.9% |
| 15 to 19 Minutes | 672 | 9.5% |
| 20 to 24 Minutes | 603 | 8.5% |
| 25 to 29 Minutes | 313 | 4.4% |
| 30 to 34 Minutes | 658 | 9.3% |
| 35 to 39 Minutes | 103 | 1.5% |
| 40 to 44 Minutes | 171 | 2.4% |
| 45 to 59 Minutes | 358 | 5.1% |
| 60 to 89 Minutes | 286 | 4.0% |
| 90 or more Minutes | 164 | 2.3% |
Commute Time by Sex in Richland County
The most common commute times in Richland County are 5 to 9 minutes (948 commuters, 25.6%) for males and 10 to 14 minutes (813 commuters, 24.0%) for females.
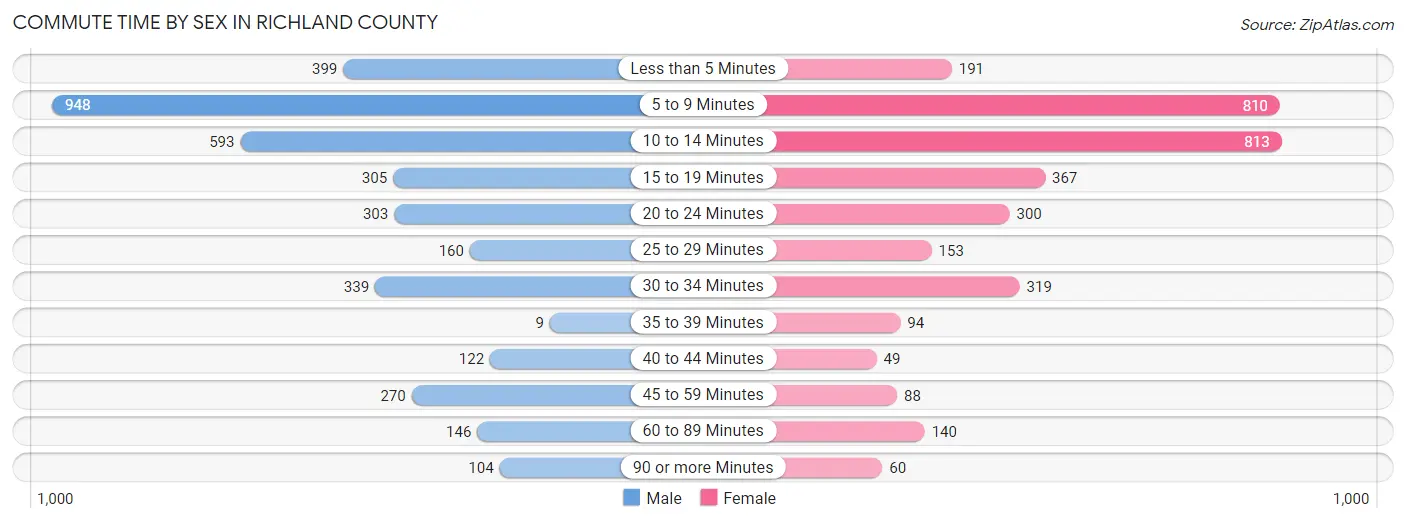
| Commute Time | Male | Female |
| Less than 5 Minutes | 399 (10.8%) | 191 (5.6%) |
| 5 to 9 Minutes | 948 (25.6%) | 810 (23.9%) |
| 10 to 14 Minutes | 593 (16.0%) | 813 (24.0%) |
| 15 to 19 Minutes | 305 (8.3%) | 367 (10.8%) |
| 20 to 24 Minutes | 303 (8.2%) | 300 (8.9%) |
| 25 to 29 Minutes | 160 (4.3%) | 153 (4.5%) |
| 30 to 34 Minutes | 339 (9.2%) | 319 (9.4%) |
| 35 to 39 Minutes | 9 (0.2%) | 94 (2.8%) |
| 40 to 44 Minutes | 122 (3.3%) | 49 (1.5%) |
| 45 to 59 Minutes | 270 (7.3%) | 88 (2.6%) |
| 60 to 89 Minutes | 146 (4.0%) | 140 (4.1%) |
| 90 or more Minutes | 104 (2.8%) | 60 (1.8%) |
Time of Departure to Work by Sex in Richland County
The most frequent times of departure to work in Richland County are 12:00 AM to 4:59 AM (726, 19.6%) for males and 7:30 AM to 7:59 AM (775, 22.9%) for females.
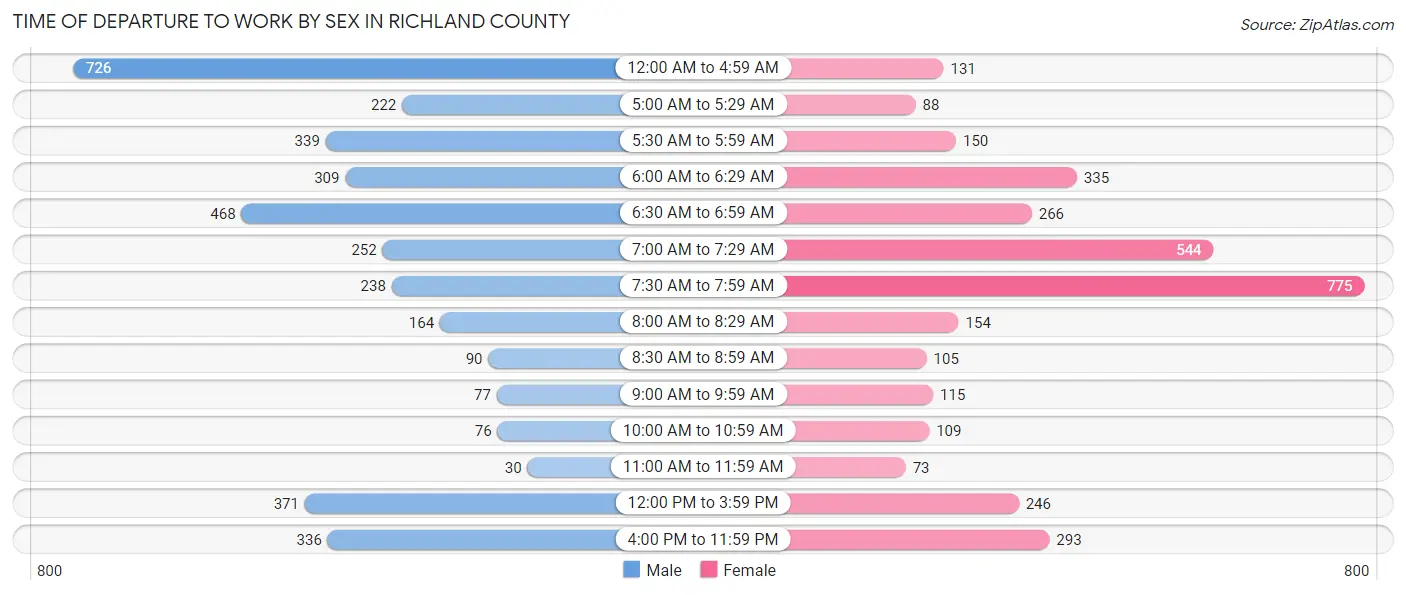
| Time of Departure | Male | Female |
| 12:00 AM to 4:59 AM | 726 (19.6%) | 131 (3.9%) |
| 5:00 AM to 5:29 AM | 222 (6.0%) | 88 (2.6%) |
| 5:30 AM to 5:59 AM | 339 (9.2%) | 150 (4.4%) |
| 6:00 AM to 6:29 AM | 309 (8.4%) | 335 (9.9%) |
| 6:30 AM to 6:59 AM | 468 (12.7%) | 266 (7.9%) |
| 7:00 AM to 7:29 AM | 252 (6.8%) | 544 (16.1%) |
| 7:30 AM to 7:59 AM | 238 (6.4%) | 775 (22.9%) |
| 8:00 AM to 8:29 AM | 164 (4.4%) | 154 (4.5%) |
| 8:30 AM to 8:59 AM | 90 (2.4%) | 105 (3.1%) |
| 9:00 AM to 9:59 AM | 77 (2.1%) | 115 (3.4%) |
| 10:00 AM to 10:59 AM | 76 (2.1%) | 109 (3.2%) |
| 11:00 AM to 11:59 AM | 30 (0.8%) | 73 (2.2%) |
| 12:00 PM to 3:59 PM | 371 (10.0%) | 246 (7.3%) |
| 4:00 PM to 11:59 PM | 336 (9.1%) | 293 (8.7%) |
| Total | 3,698 (100.0%) | 3,384 (100.0%) |
Housing Occupancy in Richland County
Occupancy by Ownership in Richland County
Of the total 6,485 dwellings in Richland County, owner-occupied units account for 4,740 (73.1%), while renter-occupied units make up 1,745 (26.9%).
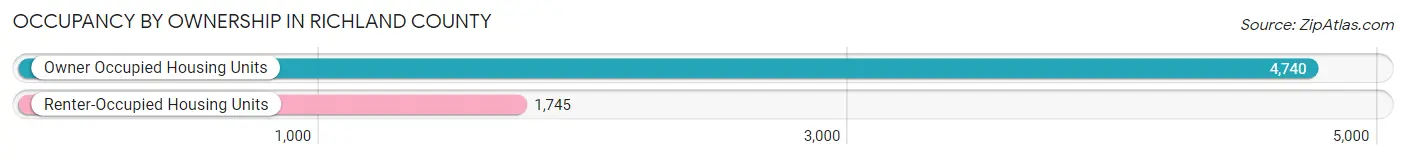
| Occupancy | # Housing Units | % Housing Units |
| Owner Occupied Housing Units | 4,740 | 73.1% |
| Renter-Occupied Housing Units | 1,745 | 26.9% |
| Total Occupied Housing Units | 6,485 | 100.0% |
Occupancy by Household Size in Richland County
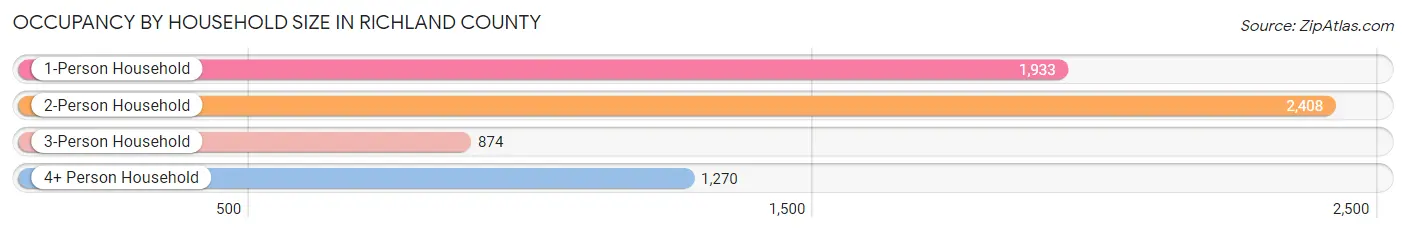
| Household Size | # Housing Units | % Housing Units |
| 1-Person Household | 1,933 | 29.8% |
| 2-Person Household | 2,408 | 37.1% |
| 3-Person Household | 874 | 13.5% |
| 4+ Person Household | 1,270 | 19.6% |
| Total Housing Units | 6,485 | 100.0% |
Occupancy by Ownership by Household Size in Richland County
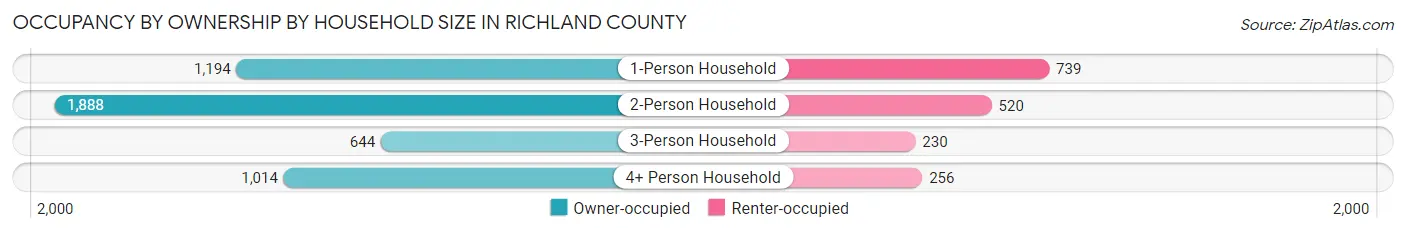
| Household Size | Owner-occupied | Renter-occupied |
| 1-Person Household | 1,194 (61.8%) | 739 (38.2%) |
| 2-Person Household | 1,888 (78.4%) | 520 (21.6%) |
| 3-Person Household | 644 (73.7%) | 230 (26.3%) |
| 4+ Person Household | 1,014 (79.8%) | 256 (20.2%) |
| Total Housing Units | 4,740 (73.1%) | 1,745 (26.9%) |
Occupancy by Educational Attainment in Richland County
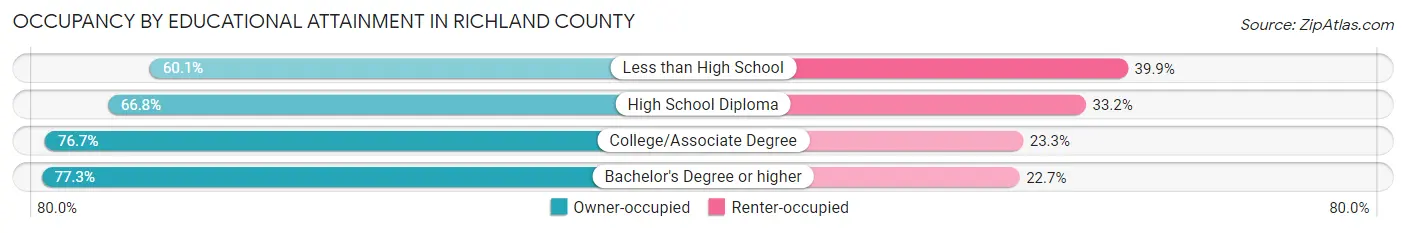
| Household Size | Owner-occupied | Renter-occupied |
| Less than High School | 196 (60.1%) | 130 (39.9%) |
| High School Diploma | 1,271 (66.8%) | 632 (33.2%) |
| College/Associate Degree | 2,336 (76.7%) | 708 (23.3%) |
| Bachelor's Degree or higher | 937 (77.3%) | 275 (22.7%) |
Occupancy by Age of Householder in Richland County
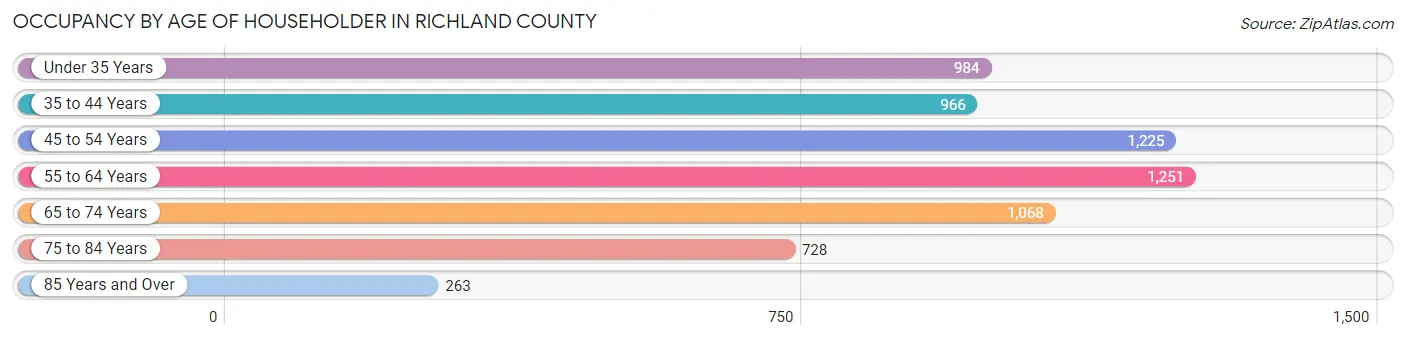
| Age Bracket | # Households | % Households |
| Under 35 Years | 984 | 15.2% |
| 35 to 44 Years | 966 | 14.9% |
| 45 to 54 Years | 1,225 | 18.9% |
| 55 to 64 Years | 1,251 | 19.3% |
| 65 to 74 Years | 1,068 | 16.5% |
| 75 to 84 Years | 728 | 11.2% |
| 85 Years and Over | 263 | 4.1% |
| Total | 6,485 | 100.0% |
Housing Finances in Richland County
Median Income by Occupancy in Richland County
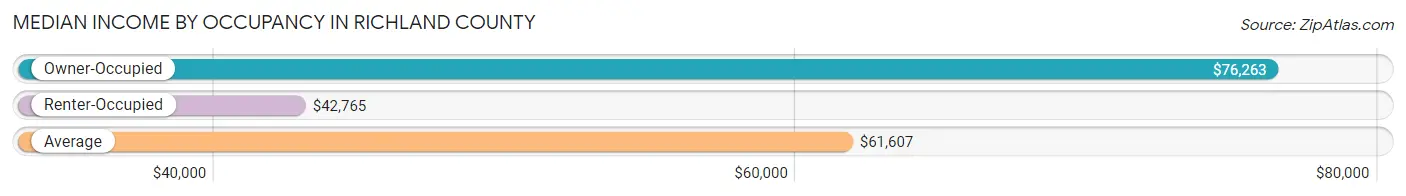
| Occupancy Type | # Households | Median Income |
| Owner-Occupied | 4,740 (73.1%) | $76,263 |
| Renter-Occupied | 1,745 (26.9%) | $42,765 |
| Average | 6,485 (100.0%) | $61,607 |
Occupancy by Householder Income Bracket in Richland County
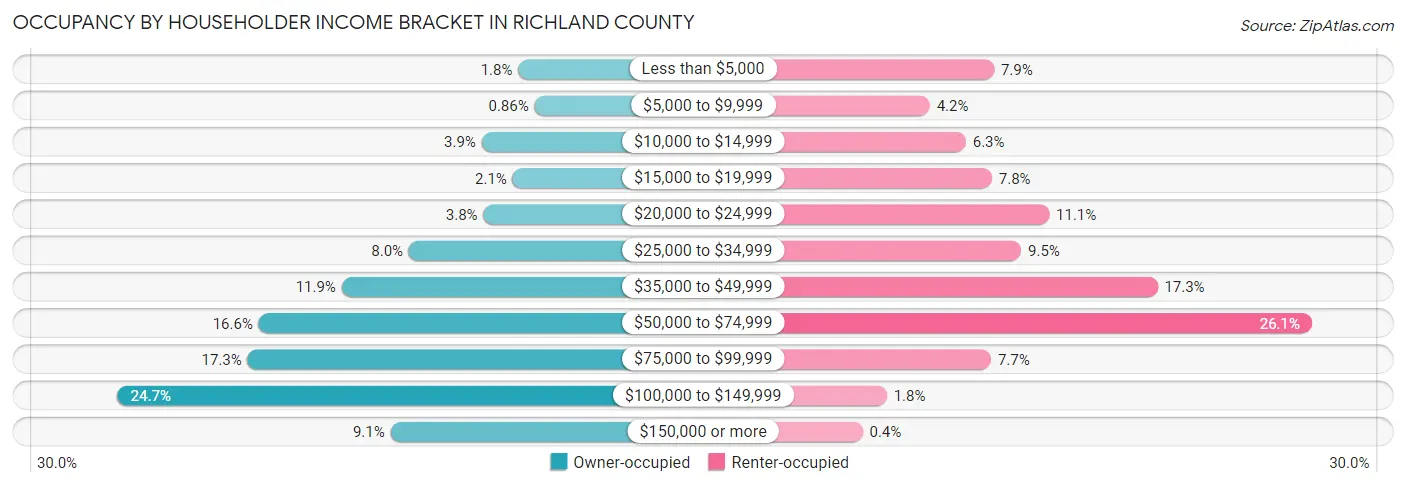
| Income Bracket | Owner-occupied | Renter-occupied |
| Less than $5,000 | 85 (1.8%) | 138 (7.9%) |
| $5,000 to $9,999 | 41 (0.9%) | 74 (4.2%) |
| $10,000 to $14,999 | 184 (3.9%) | 110 (6.3%) |
| $15,000 to $19,999 | 100 (2.1%) | 136 (7.8%) |
| $20,000 to $24,999 | 179 (3.8%) | 193 (11.1%) |
| $25,000 to $34,999 | 381 (8.0%) | 165 (9.5%) |
| $35,000 to $49,999 | 563 (11.9%) | 301 (17.2%) |
| $50,000 to $74,999 | 788 (16.6%) | 455 (26.1%) |
| $75,000 to $99,999 | 818 (17.3%) | 135 (7.7%) |
| $100,000 to $149,999 | 1,170 (24.7%) | 31 (1.8%) |
| $150,000 or more | 431 (9.1%) | 7 (0.4%) |
| Total | 4,740 (100.0%) | 1,745 (100.0%) |
Monthly Housing Cost Tiers in Richland County
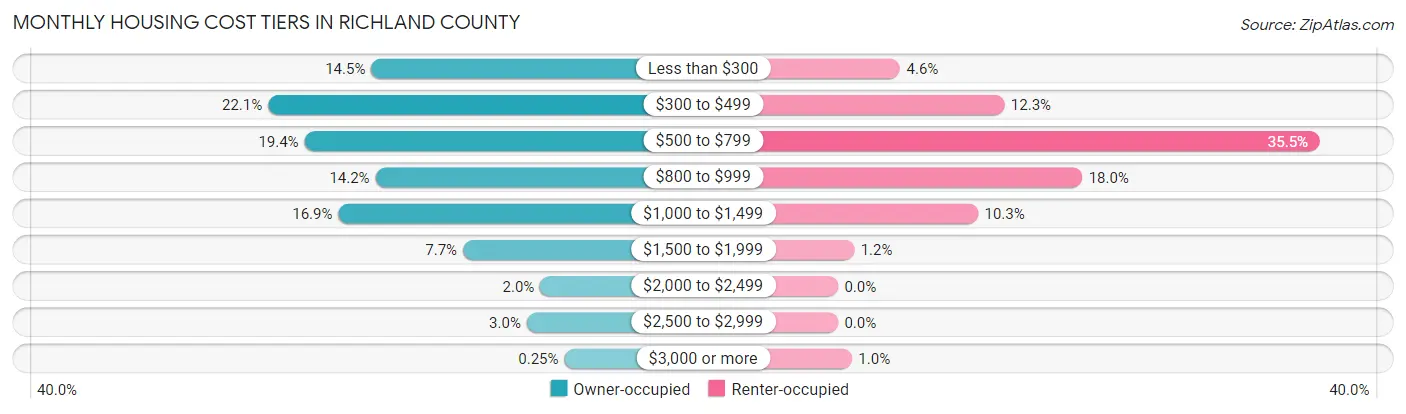
| Monthly Cost | Owner-occupied | Renter-occupied |
| Less than $300 | 686 (14.5%) | 80 (4.6%) |
| $300 to $499 | 1,046 (22.1%) | 214 (12.3%) |
| $500 to $799 | 919 (19.4%) | 620 (35.5%) |
| $800 to $999 | 671 (14.2%) | 314 (18.0%) |
| $1,000 to $1,499 | 801 (16.9%) | 180 (10.3%) |
| $1,500 to $1,999 | 366 (7.7%) | 21 (1.2%) |
| $2,000 to $2,499 | 96 (2.0%) | 0 (0.0%) |
| $2,500 to $2,999 | 143 (3.0%) | 0 (0.0%) |
| $3,000 or more | 12 (0.3%) | 18 (1.0%) |
| Total | 4,740 (100.0%) | 1,745 (100.0%) |
Physical Housing Characteristics in Richland County
Housing Structures in Richland County
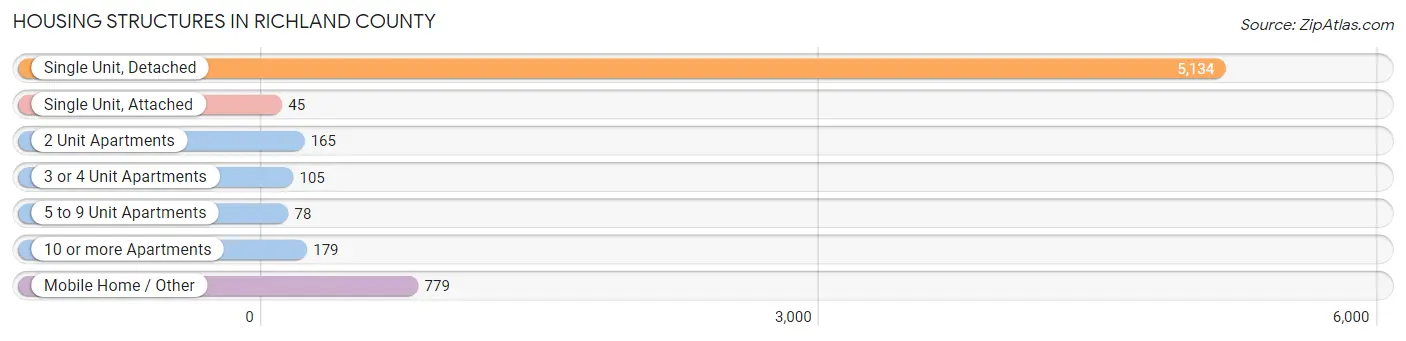
| Structure Type | # Housing Units | % Housing Units |
| Single Unit, Detached | 5,134 | 79.2% |
| Single Unit, Attached | 45 | 0.7% |
| 2 Unit Apartments | 165 | 2.5% |
| 3 or 4 Unit Apartments | 105 | 1.6% |
| 5 to 9 Unit Apartments | 78 | 1.2% |
| 10 or more Apartments | 179 | 2.8% |
| Mobile Home / Other | 779 | 12.0% |
| Total | 6,485 | 100.0% |
Housing Structures by Occupancy in Richland County
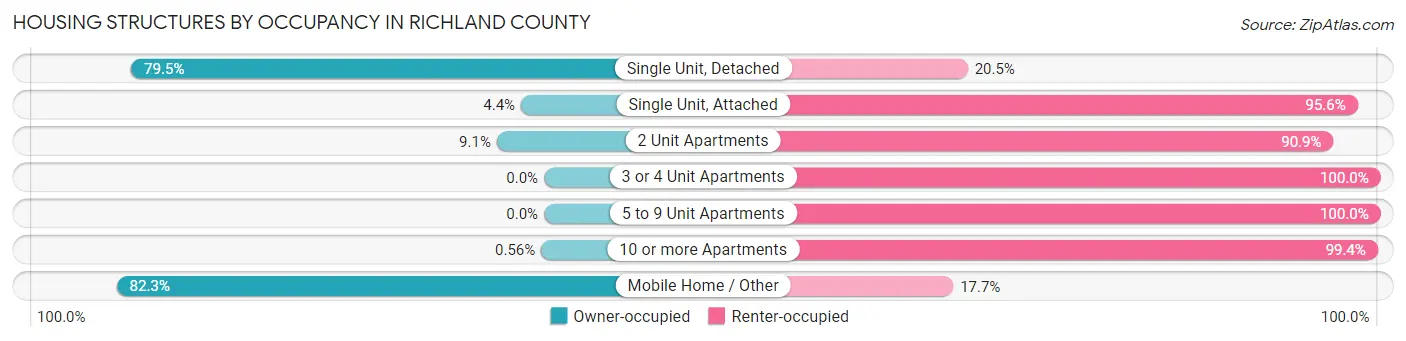
| Structure Type | Owner-occupied | Renter-occupied |
| Single Unit, Detached | 4,081 (79.5%) | 1,053 (20.5%) |
| Single Unit, Attached | 2 (4.4%) | 43 (95.6%) |
| 2 Unit Apartments | 15 (9.1%) | 150 (90.9%) |
| 3 or 4 Unit Apartments | 0 (0.0%) | 105 (100.0%) |
| 5 to 9 Unit Apartments | 0 (0.0%) | 78 (100.0%) |
| 10 or more Apartments | 1 (0.6%) | 178 (99.4%) |
| Mobile Home / Other | 641 (82.3%) | 138 (17.7%) |
| Total | 4,740 (73.1%) | 1,745 (26.9%) |
Housing Structures by Number of Rooms in Richland County
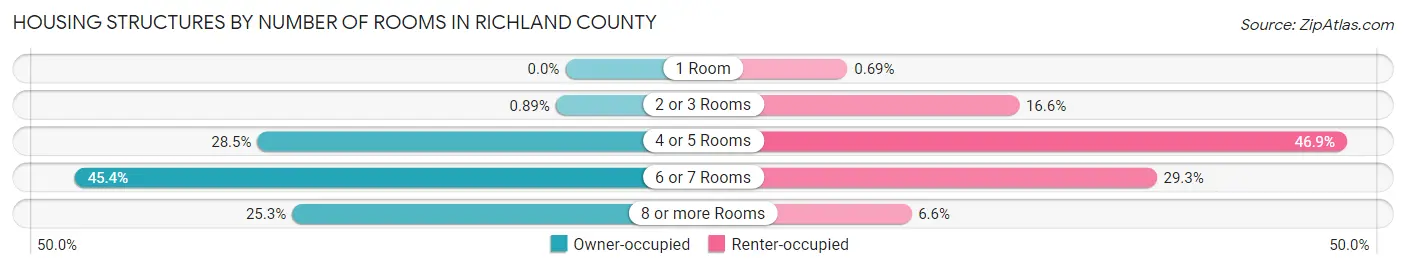
| Number of Rooms | Owner-occupied | Renter-occupied |
| 1 Room | 0 (0.0%) | 12 (0.7%) |
| 2 or 3 Rooms | 42 (0.9%) | 289 (16.6%) |
| 4 or 5 Rooms | 1,350 (28.5%) | 818 (46.9%) |
| 6 or 7 Rooms | 2,150 (45.4%) | 511 (29.3%) |
| 8 or more Rooms | 1,198 (25.3%) | 115 (6.6%) |
| Total | 4,740 (100.0%) | 1,745 (100.0%) |
Housing Structure by Heating Type in Richland County
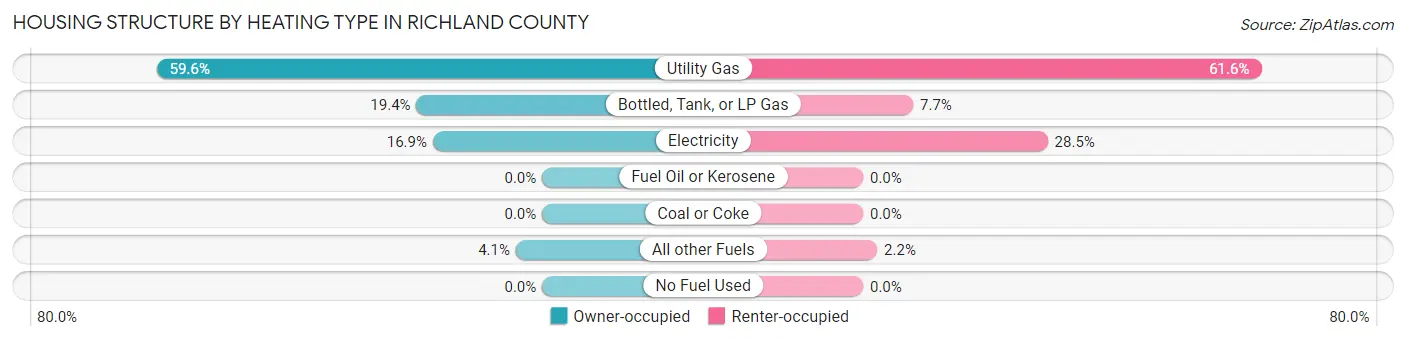
| Heating Type | Owner-occupied | Renter-occupied |
| Utility Gas | 2,825 (59.6%) | 1,074 (61.6%) |
| Bottled, Tank, or LP Gas | 921 (19.4%) | 135 (7.7%) |
| Electricity | 801 (16.9%) | 498 (28.5%) |
| Fuel Oil or Kerosene | 0 (0.0%) | 0 (0.0%) |
| Coal or Coke | 0 (0.0%) | 0 (0.0%) |
| All other Fuels | 193 (4.1%) | 38 (2.2%) |
| No Fuel Used | 0 (0.0%) | 0 (0.0%) |
| Total | 4,740 (100.0%) | 1,745 (100.0%) |
Household Vehicle Usage in Richland County
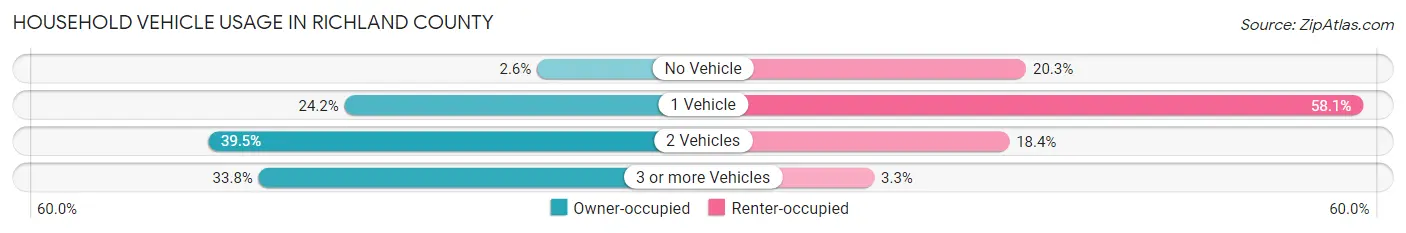
| Vehicles per Household | Owner-occupied | Renter-occupied |
| No Vehicle | 123 (2.6%) | 354 (20.3%) |
| 1 Vehicle | 1,145 (24.2%) | 1,013 (58.1%) |
| 2 Vehicles | 1,871 (39.5%) | 321 (18.4%) |
| 3 or more Vehicles | 1,601 (33.8%) | 57 (3.3%) |
| Total | 4,740 (100.0%) | 1,745 (100.0%) |
Real Estate & Mortgages in Richland County
Real Estate and Mortgage Overview in Richland County
| Characteristic | Without Mortgage | With Mortgage |
| Housing Units | 2,655 | 2,085 |
| Median Property Value | $95,800 | $119,500 |
| Median Household Income | $62,524 | $252 |
| Monthly Housing Costs | $415 | $12 |
| Real Estate Taxes | $1,397 | $111 |
Property Value by Mortgage Status in Richland County
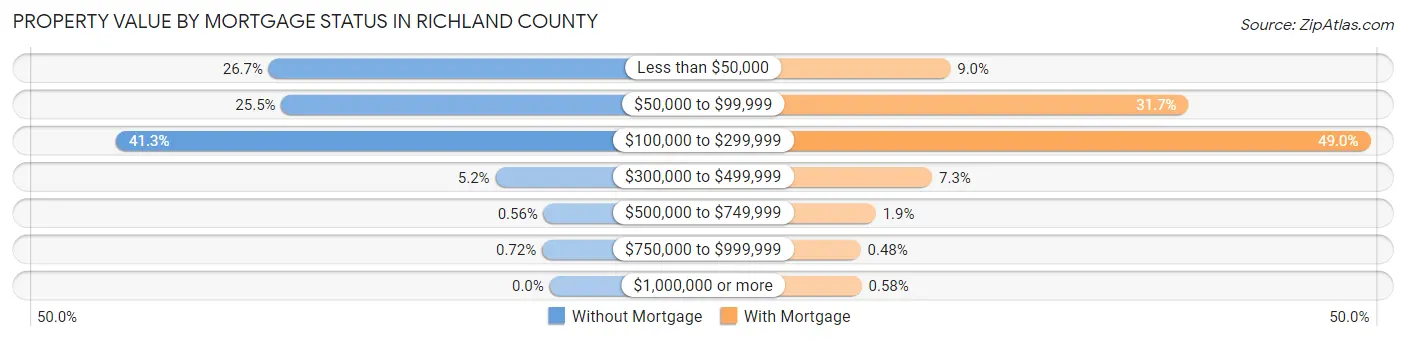
| Property Value | Without Mortgage | With Mortgage |
| Less than $50,000 | 710 (26.7%) | 188 (9.0%) |
| $50,000 to $99,999 | 678 (25.5%) | 661 (31.7%) |
| $100,000 to $299,999 | 1,096 (41.3%) | 1,022 (49.0%) |
| $300,000 to $499,999 | 137 (5.2%) | 152 (7.3%) |
| $500,000 to $749,999 | 15 (0.6%) | 40 (1.9%) |
| $750,000 to $999,999 | 19 (0.7%) | 10 (0.5%) |
| $1,000,000 or more | 0 (0.0%) | 12 (0.6%) |
| Total | 2,655 (100.0%) | 2,085 (100.0%) |
Household Income by Mortgage Status in Richland County
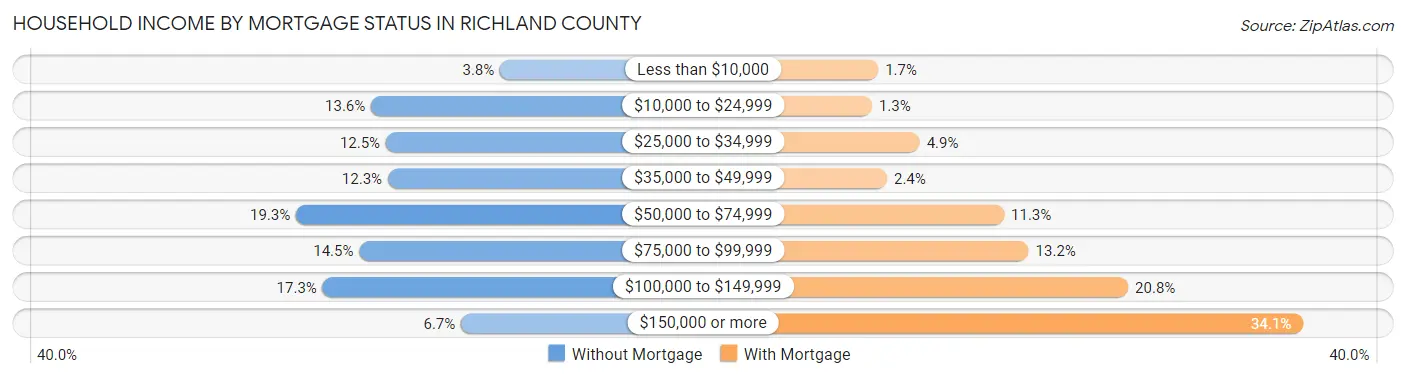
| Household Income | Without Mortgage | With Mortgage |
| Less than $10,000 | 100 (3.8%) | 36 (1.7%) |
| $10,000 to $24,999 | 361 (13.6%) | 26 (1.3%) |
| $25,000 to $34,999 | 331 (12.5%) | 102 (4.9%) |
| $35,000 to $49,999 | 327 (12.3%) | 50 (2.4%) |
| $50,000 to $74,999 | 513 (19.3%) | 236 (11.3%) |
| $75,000 to $99,999 | 385 (14.5%) | 275 (13.2%) |
| $100,000 to $149,999 | 459 (17.3%) | 433 (20.8%) |
| $150,000 or more | 179 (6.7%) | 711 (34.1%) |
| Total | 2,655 (100.0%) | 2,085 (100.0%) |
Property Value to Household Income Ratio in Richland County
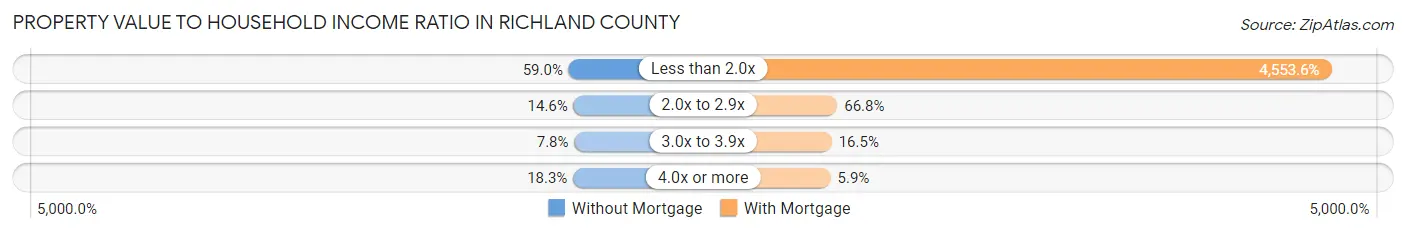
| Value-to-Income Ratio | Without Mortgage | With Mortgage |
| Less than 2.0x | 1,565 (59.0%) | 94,943 (4,553.6%) |
| 2.0x to 2.9x | 388 (14.6%) | 1,393 (66.8%) |
| 3.0x to 3.9x | 206 (7.8%) | 344 (16.5%) |
| 4.0x or more | 485 (18.3%) | 123 (5.9%) |
| Total | 2,655 (100.0%) | 2,085 (100.0%) |
Real Estate Taxes by Mortgage Status in Richland County
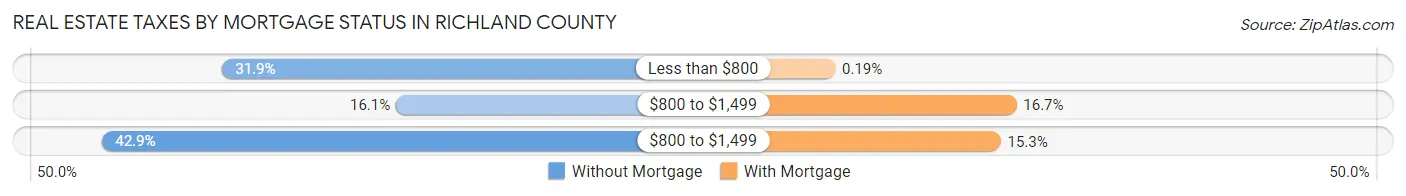
| Property Taxes | Without Mortgage | With Mortgage |
| Less than $800 | 848 (31.9%) | 4 (0.2%) |
| $800 to $1,499 | 427 (16.1%) | 349 (16.7%) |
| $800 to $1,499 | 1,139 (42.9%) | 319 (15.3%) |
| Total | 2,655 (100.0%) | 2,085 (100.0%) |
Health & Disability in Richland County
Health Insurance Coverage by Age in Richland County
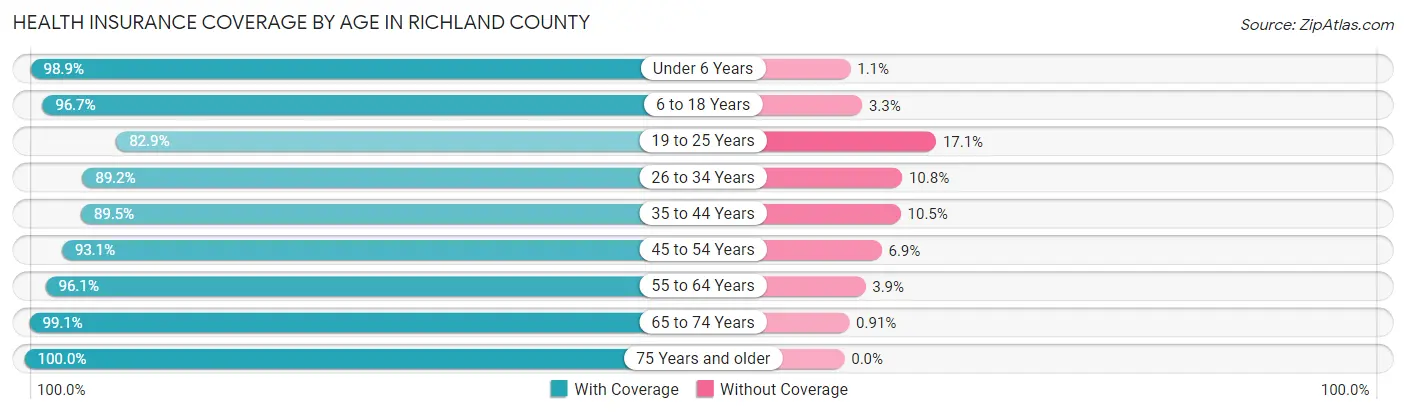
| Age Bracket | With Coverage | Without Coverage |
| Under 6 Years | 1,145 (98.9%) | 13 (1.1%) |
| 6 to 18 Years | 2,547 (96.7%) | 87 (3.3%) |
| 19 to 25 Years | 941 (82.9%) | 194 (17.1%) |
| 26 to 34 Years | 1,427 (89.2%) | 172 (10.8%) |
| 35 to 44 Years | 1,679 (89.5%) | 197 (10.5%) |
| 45 to 54 Years | 1,704 (93.1%) | 127 (6.9%) |
| 55 to 64 Years | 2,161 (96.1%) | 88 (3.9%) |
| 65 to 74 Years | 1,634 (99.1%) | 15 (0.9%) |
| 75 Years and older | 1,365 (100.0%) | 0 (0.0%) |
| Total | 14,603 (94.2%) | 893 (5.8%) |
Health Insurance Coverage by Citizenship Status in Richland County
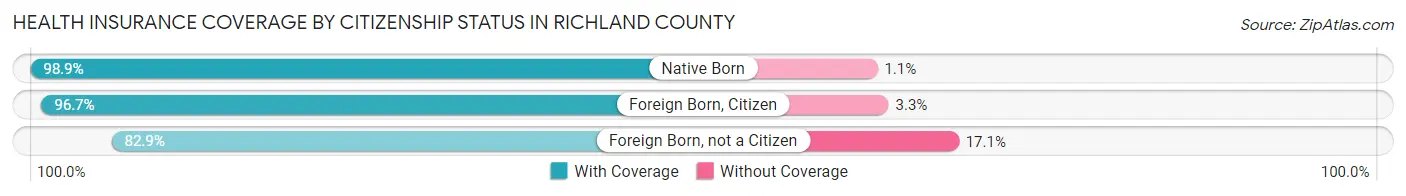
| Citizenship Status | With Coverage | Without Coverage |
| Native Born | 1,145 (98.9%) | 13 (1.1%) |
| Foreign Born, Citizen | 2,547 (96.7%) | 87 (3.3%) |
| Foreign Born, not a Citizen | 941 (82.9%) | 194 (17.1%) |
Health Insurance Coverage by Household Income in Richland County
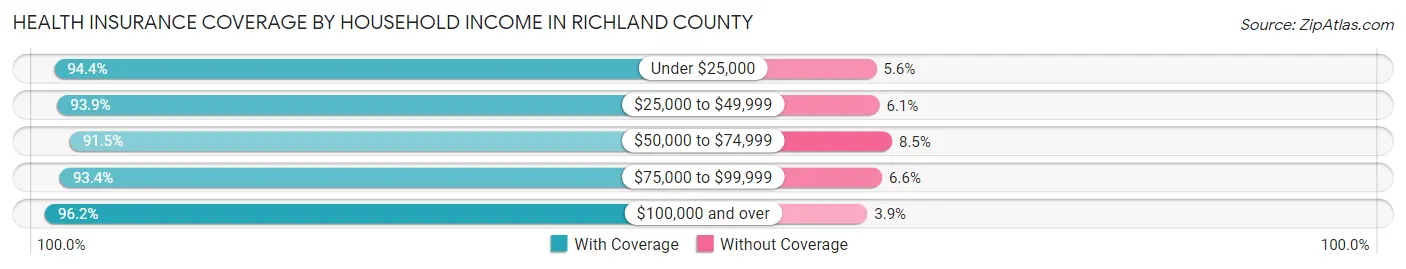
| Household Income | With Coverage | Without Coverage |
| Under $25,000 | 1,938 (94.4%) | 114 (5.6%) |
| $25,000 to $49,999 | 2,741 (93.9%) | 179 (6.1%) |
| $50,000 to $74,999 | 2,472 (91.5%) | 229 (8.5%) |
| $75,000 to $99,999 | 2,477 (93.4%) | 176 (6.6%) |
| $100,000 and over | 4,874 (96.2%) | 195 (3.8%) |
Public vs Private Health Insurance Coverage by Age in Richland County
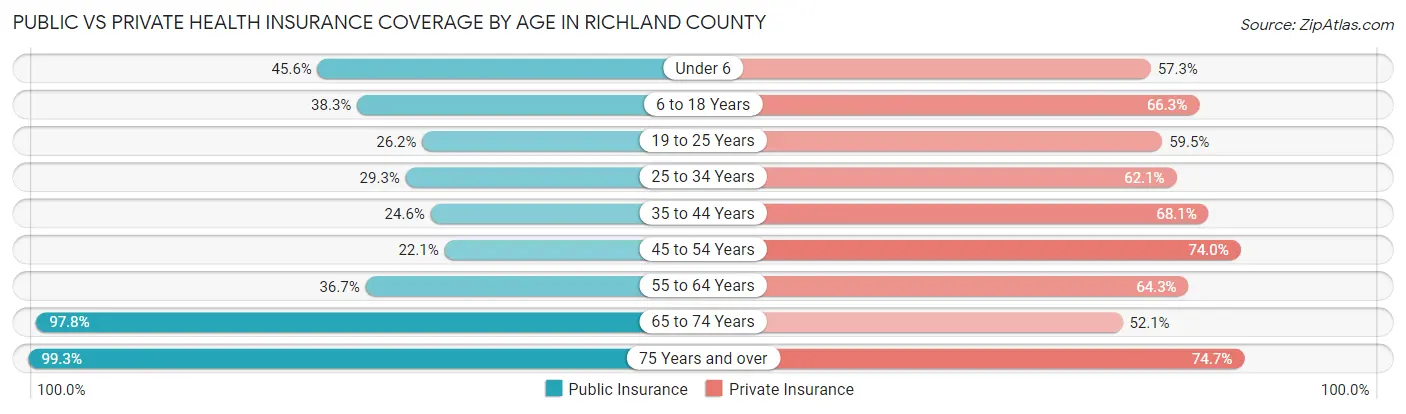
| Age Bracket | Public Insurance | Private Insurance |
| Under 6 | 528 (45.6%) | 664 (57.3%) |
| 6 to 18 Years | 1,008 (38.3%) | 1,746 (66.3%) |
| 19 to 25 Years | 297 (26.2%) | 675 (59.5%) |
| 25 to 34 Years | 468 (29.3%) | 993 (62.1%) |
| 35 to 44 Years | 462 (24.6%) | 1,277 (68.1%) |
| 45 to 54 Years | 404 (22.1%) | 1,355 (74.0%) |
| 55 to 64 Years | 826 (36.7%) | 1,447 (64.3%) |
| 65 to 74 Years | 1,613 (97.8%) | 859 (52.1%) |
| 75 Years and over | 1,355 (99.3%) | 1,019 (74.7%) |
| Total | 6,961 (44.9%) | 10,035 (64.8%) |
Disability Status by Sex by Age in Richland County
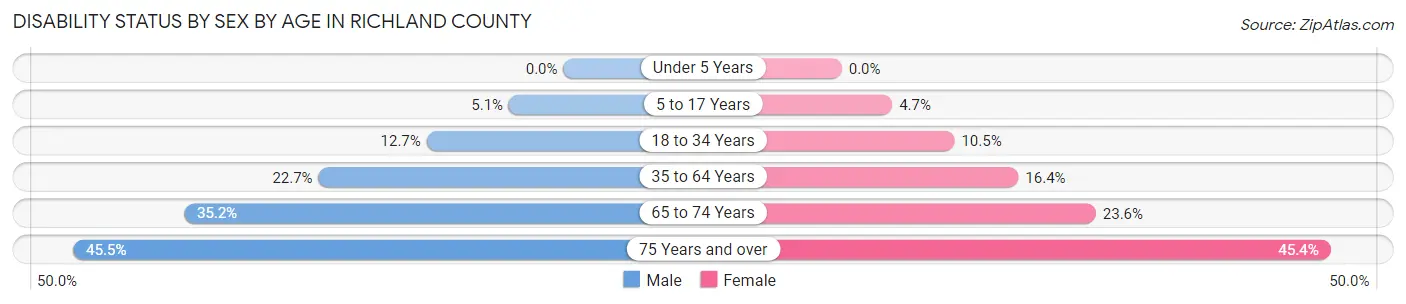
| Age Bracket | Male | Female |
| Under 5 Years | 0 (0.0%) | 0 (0.0%) |
| 5 to 17 Years | 70 (5.1%) | 62 (4.7%) |
| 18 to 34 Years | 198 (12.7%) | 142 (10.5%) |
| 35 to 64 Years | 677 (22.7%) | 488 (16.4%) |
| 65 to 74 Years | 282 (35.2%) | 200 (23.6%) |
| 75 Years and over | 263 (45.5%) | 357 (45.4%) |
Disability Class by Sex by Age in Richland County
Disability Class: Hearing Difficulty
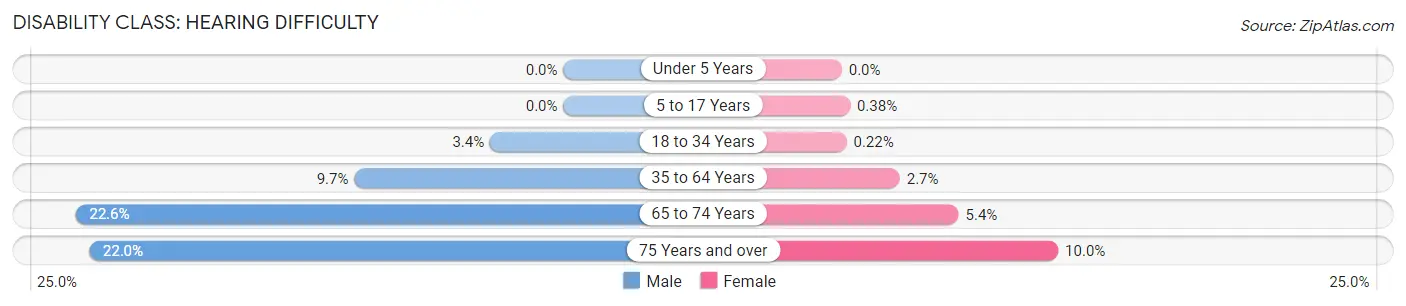
| Age Bracket | Male | Female |
| Under 5 Years | 0 (0.0%) | 0 (0.0%) |
| 5 to 17 Years | 0 (0.0%) | 5 (0.4%) |
| 18 to 34 Years | 53 (3.4%) | 3 (0.2%) |
| 35 to 64 Years | 289 (9.7%) | 80 (2.7%) |
| 65 to 74 Years | 181 (22.6%) | 46 (5.4%) |
| 75 Years and over | 127 (22.0%) | 79 (10.0%) |
Disability Class: Vision Difficulty
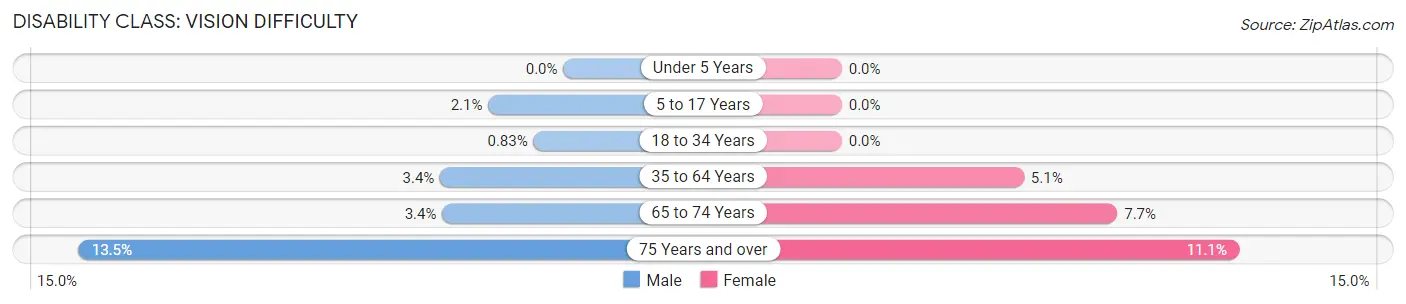
| Age Bracket | Male | Female |
| Under 5 Years | 0 (0.0%) | 0 (0.0%) |
| 5 to 17 Years | 29 (2.1%) | 0 (0.0%) |
| 18 to 34 Years | 13 (0.8%) | 0 (0.0%) |
| 35 to 64 Years | 102 (3.4%) | 151 (5.1%) |
| 65 to 74 Years | 27 (3.4%) | 65 (7.7%) |
| 75 Years and over | 78 (13.5%) | 87 (11.1%) |
Disability Class: Cognitive Difficulty
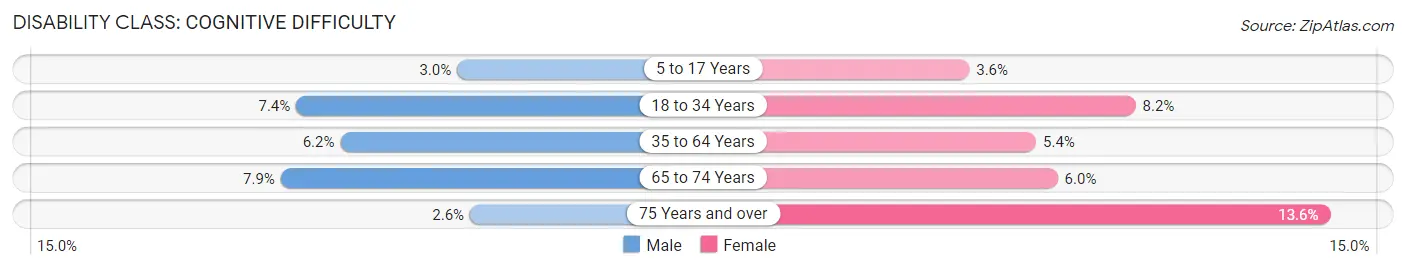
| Age Bracket | Male | Female |
| 5 to 17 Years | 41 (3.0%) | 47 (3.5%) |
| 18 to 34 Years | 116 (7.4%) | 111 (8.2%) |
| 35 to 64 Years | 185 (6.2%) | 161 (5.4%) |
| 65 to 74 Years | 63 (7.9%) | 51 (6.0%) |
| 75 Years and over | 15 (2.6%) | 107 (13.6%) |
Disability Class: Ambulatory Difficulty
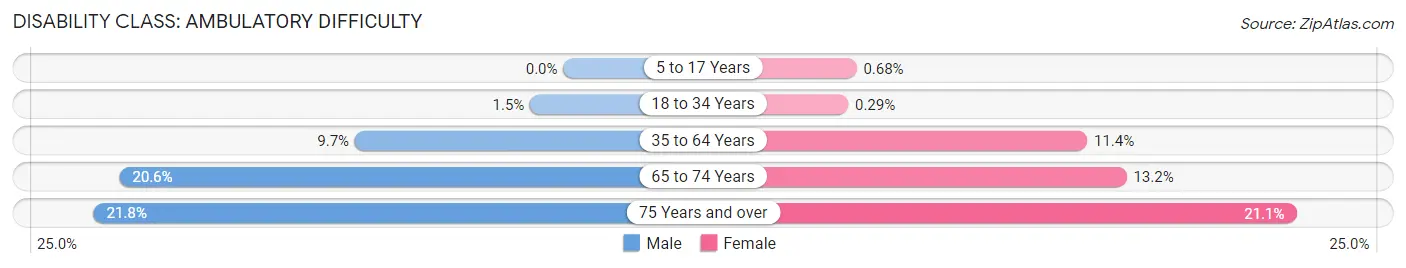
| Age Bracket | Male | Female |
| 5 to 17 Years | 0 (0.0%) | 9 (0.7%) |
| 18 to 34 Years | 24 (1.5%) | 4 (0.3%) |
| 35 to 64 Years | 288 (9.7%) | 339 (11.4%) |
| 65 to 74 Years | 165 (20.6%) | 112 (13.2%) |
| 75 Years and over | 126 (21.8%) | 166 (21.1%) |
Disability Class: Self-Care Difficulty
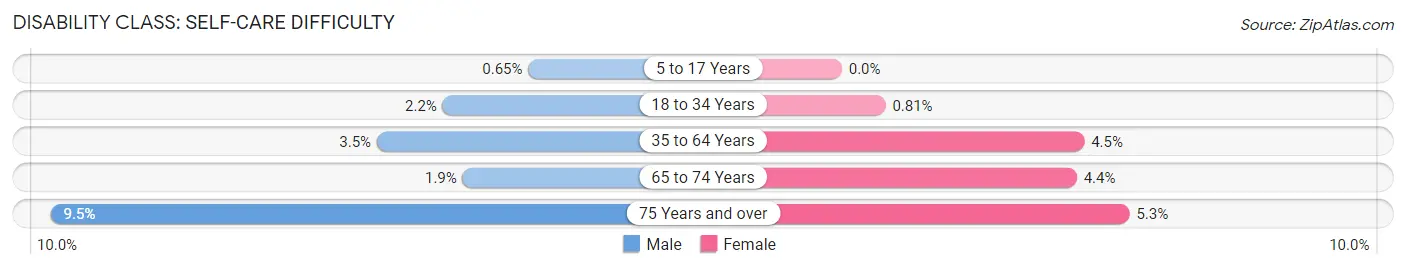
| Age Bracket | Male | Female |
| 5 to 17 Years | 9 (0.6%) | 0 (0.0%) |
| 18 to 34 Years | 35 (2.2%) | 11 (0.8%) |
| 35 to 64 Years | 103 (3.5%) | 134 (4.5%) |
| 65 to 74 Years | 15 (1.9%) | 37 (4.4%) |
| 75 Years and over | 55 (9.5%) | 42 (5.3%) |
Technology Access in Richland County
Computing Device Access in Richland County
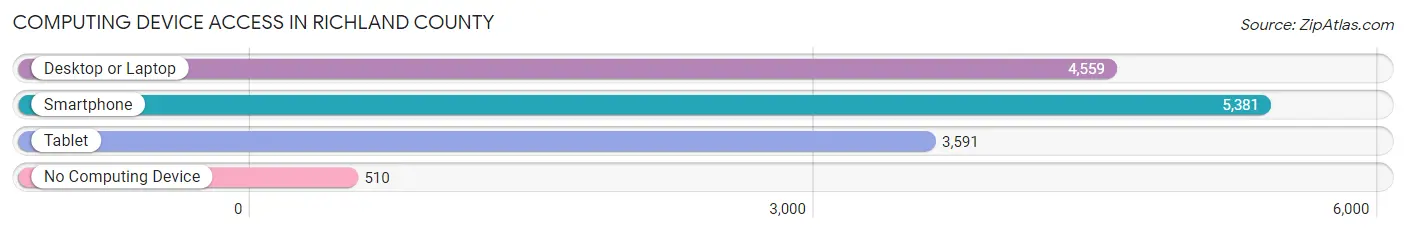
| Device Type | # Households | % Households |
| Desktop or Laptop | 4,559 | 70.3% |
| Smartphone | 5,381 | 83.0% |
| Tablet | 3,591 | 55.4% |
| No Computing Device | 510 | 7.9% |
| Total | 6,485 | 100.0% |
Internet Access in Richland County
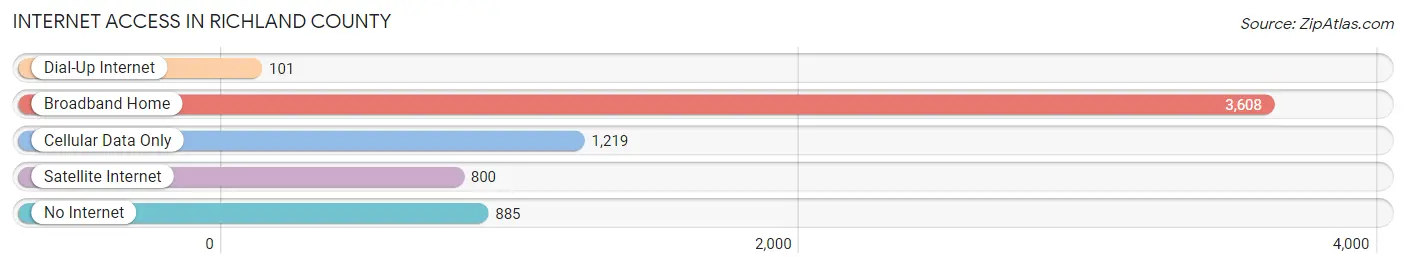
| Internet Type | # Households | % Households |
| Dial-Up Internet | 101 | 1.6% |
| Broadband Home | 3,608 | 55.6% |
| Cellular Data Only | 1,219 | 18.8% |
| Satellite Internet | 800 | 12.3% |
| No Internet | 885 | 13.7% |
| Total | 6,485 | 100.0% |
Richland County Summary
Richland County is located in the southeastern corner of Illinois, and is part of the Centralia-Mount Vernon-Salem Metropolitan Statistical Area. The county was established in 1841 and is named after the Richland Creek, which flows through the county. The county seat is Olney, and the county has a total area of 545 square miles. As of the 2010 census, the population was 16,233, making it the second least populous county in Illinois.
Geography
Richland County is located in the southeastern corner of Illinois, and is bordered by Clay County to the north, Lawrence County to the east, Wabash County to the south, and Edwards County to the west. The county is mostly flat, with some rolling hills in the northern and western parts of the county. The highest point in the county is located in the northwest corner, at an elevation of 890 feet. The county is drained by the Little Wabash River, which flows through the center of the county, and by Richland Creek, which flows through the western part of the county.
The county is mostly rural, with the majority of the land being used for agricultural purposes. The main crops grown in the county are corn, soybeans, and wheat. There are also some small towns in the county, including Olney, the county seat, and Noble, the largest town in the county.
Demographics
As of the 2010 census, there were 16,233 people, 6,541 households, and 4,541 families residing in the county. The population density was 30 people per square mile. There were 7,093 housing units at an average density of 13 per square mile. The racial makeup of the county was 97.3% White, 0.7% African American, 0.2% Native American, 0.3% Asian, 0.2% from other races, and 1.4% from two or more races. Hispanic or Latino of any race were 1.2% of the population.
There were 6,541 households, out of which 30.2% had children under the age of 18 living with them, 56.2% were married couples living together, 9.2% had a female householder with no husband present, and 30.7% were non-families. 26.7% of all households were made up of individuals, and 12.7% had someone living alone who was 65 years of age or older. The average household size was 2.45 and the average family size was 2.95.
The median income for a household in the county was $41,845, and the median income for a family was $50,845. Males had a median income of $37,945 versus $25,945 for females. The per capita income for the county was $20,845. About 8.2% of families and 11.2% of the population were below the poverty line, including 14.2% of those under age 18 and 8.7% of those age 65 or over.
Economy
Richland County is primarily an agricultural county, with the majority of the land being used for farming. The main crops grown in the county are corn, soybeans, and wheat. There are also some small businesses in the county, including manufacturing, retail, and service industries. The county is also home to several state parks, including the Olney State Park, which is the largest state park in the county.
The county is served by two major highways, Interstate 70 and U.S. Route 50. The county also has a small airport, the Olney-Noble Airport, which is used for general aviation.
Richland County is also home to several higher education institutions, including Olney Central College, a two-year community college, and Richland Community College, a four-year college.
Conclusion
Richland County is a rural county located in the southeastern corner of Illinois. The county is mostly agricultural, with the main crops being corn, soybeans, and wheat. The county is also home to several small towns, state parks, and higher education institutions. The county has a population of 16,233, and the median household income is $41,845. Richland County is served by two major highways and a small airport, and is part of the Centralia-Mount Vernon-Salem Metropolitan Statistical Area.
Common Questions
What is the Total Population of Richland County?
Total Population of Richland County is 15,716.
What is the Total Male Population of Richland County?
Total Male Population of Richland County is 7,847.
What is the Total Female Population of Richland County?
Total Female Population of Richland County is 7,869.
What is the Ratio of Males per 100 Females in Richland County?
There are 99.72 Males per 100 Females in Richland County.
What is the Ratio of Females per 100 Males in Richland County?
There are 100.28 Females per 100 Males in Richland County.
What is the Median Population Age in Richland County?
Median Population Age in Richland County is 42.2 Years.
What is the Average Family Size in Richland County
Average Family Size in Richland County is 2.9 People.
What is the Average Household Size in Richland County
Average Household Size in Richland County is 2.4 People.
What is Per Capita Income in Richland County?
Per Capita income in Richland County is $30,975.
What is the Median Family Income in Richland County?
Median Family Income in Richland County is $75,169.
What is the Median Household income in Richland County?
Median Household Income in Richland County is $61,607.
What is Income or Wage Gap in Richland County?
Income or Wage Gap in Richland County is 23.9%.
Women in Richland County earn 76.1 cents for every dollar earned by a man.
What is Family Income Deficit in Richland County?
Family Income Deficit in Richland County is $8,878.
Families that are below poverty line in Richland County earn $8,878 less on average than the poverty threshold level.
What is Inequality or Gini Index in Richland County?
Inequality or Gini Index in Richland County is 0.40.
How Large is the Labor Force in Richland County?
There are 7,915 People in the Labor Forcein in Richland County.
What is the Percentage of People in the Labor Force in Richland County?
62.7% of People are in the Labor Force in Richland County.
What is the Unemployment Rate in Richland County?
Unemployment Rate in Richland County is 4.2%.