Peoria County, IL
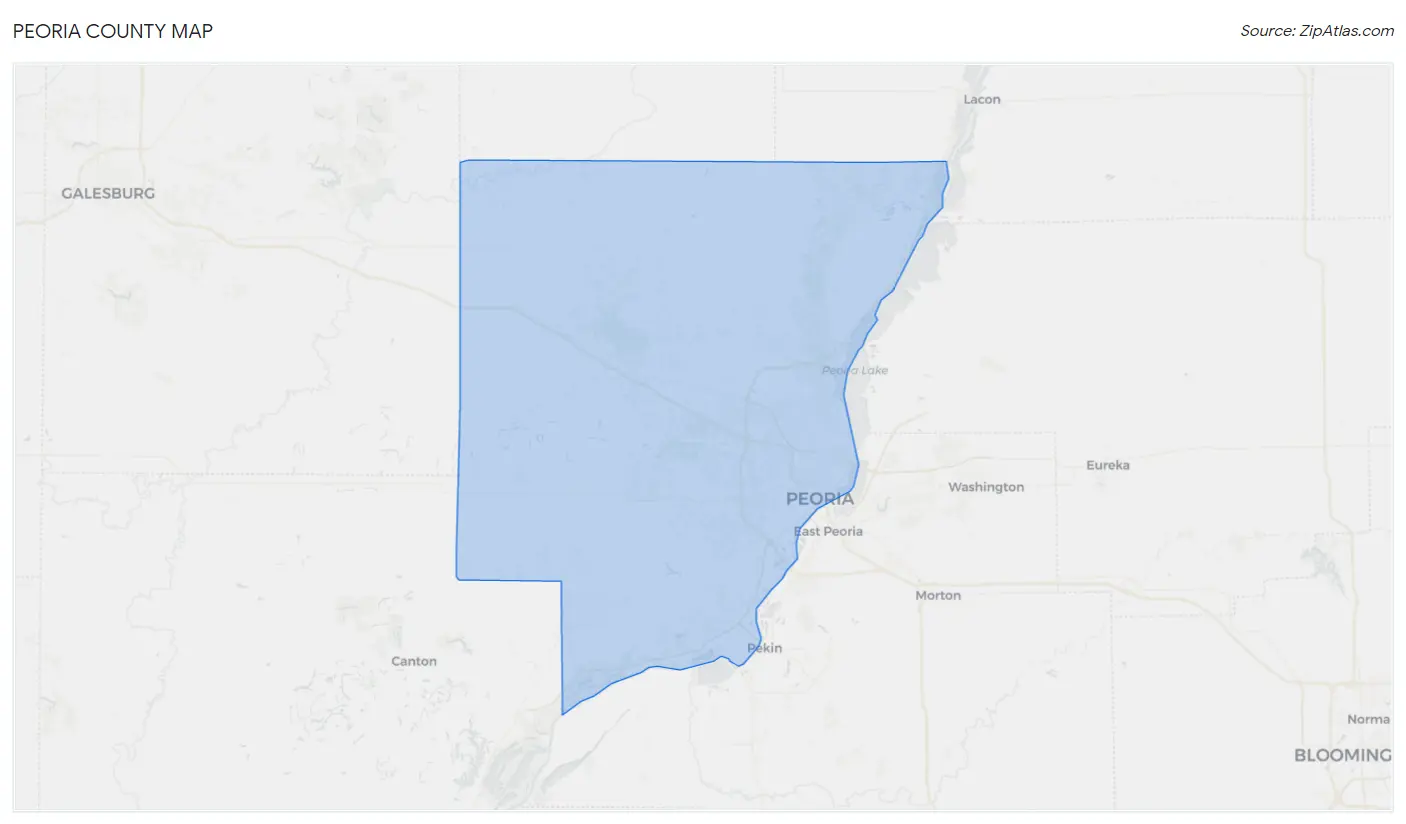
Peoria County Map
Peoria County Overview
181,186
TOTAL POPULATION
88,477
MALE POPULATION
92,709
FEMALE POPULATION
95.44
MALES / 100 FEMALES
104.78
FEMALES / 100 MALES
38.1
MEDIAN AGE
3.0
AVG FAMILY SIZE
2.3
AVG HOUSEHOLD SIZE
$38,581
PER CAPITA INCOME
$85,683
AVG FAMILY INCOME
$63,409
AVG HOUSEHOLD INCOME
32.7%
WAGE / INCOME GAP [ % ]
67.3¢/ $1
WAGE / INCOME GAP [ $ ]
$11,427
FAMILY INCOME DEFICIT
0.49
INEQUALITY / GINI INDEX
87,885
LABOR FORCE [ PEOPLE ]
61.6%
PERCENT IN LABOR FORCE
6.6%
UNEMPLOYMENT RATE
Peoria County Area Codes
Race in Peoria County
The most populous races in Peoria County are White / Caucasian (126,959 | 70.1%), Black / African American (31,848 | 17.6%), and Two or more Races (10,518 | 5.8%).
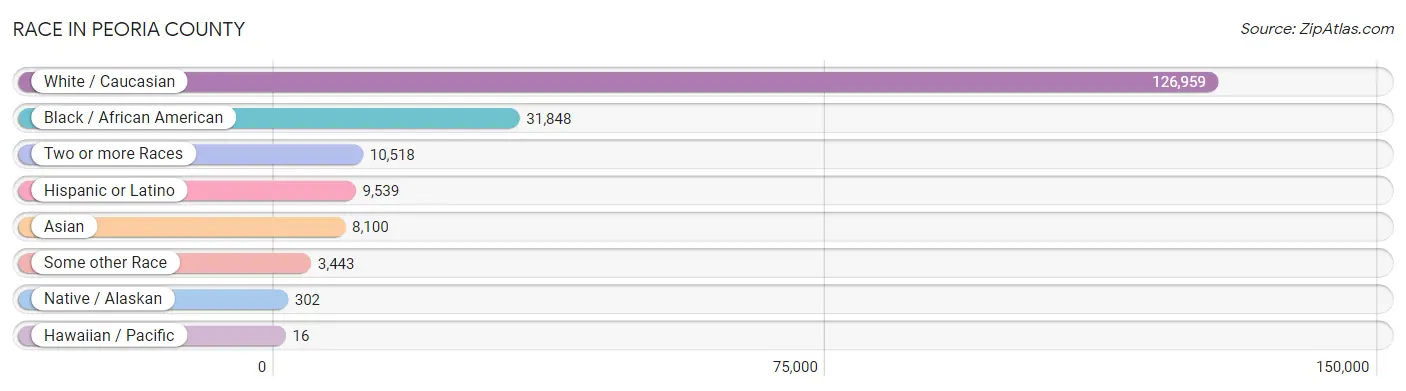
| Race | # Population | % Population |
| Asian | 8,100 | 4.5% |
| Black / African American | 31,848 | 17.6% |
| Hawaiian / Pacific | 16 | 0.0% |
| Hispanic or Latino | 9,539 | 5.3% |
| Native / Alaskan | 302 | 0.2% |
| White / Caucasian | 126,959 | 70.1% |
| Two or more Races | 10,518 | 5.8% |
| Some other Race | 3,443 | 1.9% |
| Total | 181,186 | 100.0% |
Ancestry in Peoria County
The most populous ancestries reported in Peoria County are German (36,953 | 20.4%), Irish (21,317 | 11.8%), English (18,075 | 10.0%), American (7,440 | 4.1%), and Mexican (6,257 | 3.5%), together accounting for 49.7% of all Peoria County residents.
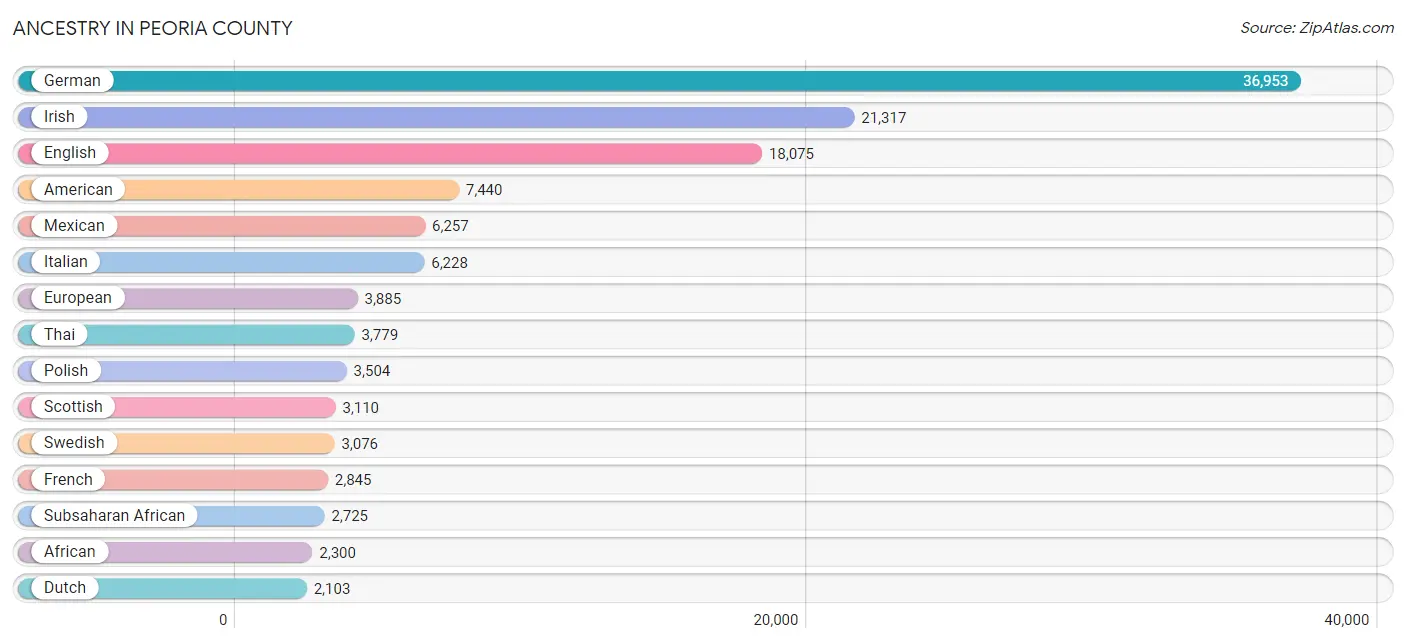
| Ancestry | # Population | % Population |
| African | 2,300 | 1.3% |
| Albanian | 5 | 0.0% |
| Aleut | 8 | 0.0% |
| Alsatian | 10 | 0.0% |
| American | 7,440 | 4.1% |
| Apache | 12 | 0.0% |
| Arab | 1,696 | 0.9% |
| Armenian | 364 | 0.2% |
| Australian | 53 | 0.0% |
| Austrian | 162 | 0.1% |
| Bahamian | 4 | 0.0% |
| Bangladeshi | 4 | 0.0% |
| Belgian | 312 | 0.2% |
| Bhutanese | 364 | 0.2% |
| Blackfeet | 44 | 0.0% |
| Bolivian | 9 | 0.0% |
| Brazilian | 32 | 0.0% |
| British | 1,087 | 0.6% |
| Bulgarian | 21 | 0.0% |
| Burmese | 520 | 0.3% |
| Cambodian | 18 | 0.0% |
| Canadian | 82 | 0.1% |
| Cape Verdean | 11 | 0.0% |
| Celtic | 7 | 0.0% |
| Central American | 937 | 0.5% |
| Cherokee | 541 | 0.3% |
| Chilean | 7 | 0.0% |
| Chippewa | 24 | 0.0% |
| Choctaw | 53 | 0.0% |
| Colombian | 78 | 0.0% |
| Costa Rican | 128 | 0.1% |
| Creek | 4 | 0.0% |
| Croatian | 533 | 0.3% |
| Crow | 1 | 0.0% |
| Cuban | 77 | 0.0% |
| Czech | 432 | 0.2% |
| Czechoslovakian | 278 | 0.2% |
| Danish | 663 | 0.4% |
| Dominican | 8 | 0.0% |
| Dutch | 2,103 | 1.2% |
| Eastern European | 336 | 0.2% |
| Ecuadorian | 75 | 0.0% |
| Egyptian | 119 | 0.1% |
| English | 18,075 | 10.0% |
| Estonian | 14 | 0.0% |
| Ethiopian | 61 | 0.0% |
| European | 3,885 | 2.1% |
| Filipino | 103 | 0.1% |
| Finnish | 91 | 0.1% |
| French | 2,845 | 1.6% |
| French American Indian | 10 | 0.0% |
| French Canadian | 183 | 0.1% |
| German | 36,953 | 20.4% |
| Ghanaian | 54 | 0.0% |
| Greek | 725 | 0.4% |
| Guamanian / Chamorro | 3 | 0.0% |
| Guatemalan | 285 | 0.2% |
| Haitian | 4 | 0.0% |
| Honduran | 366 | 0.2% |
| Hungarian | 589 | 0.3% |
| Indian (Asian) | 1,652 | 0.9% |
| Inupiat | 15 | 0.0% |
| Iranian | 98 | 0.1% |
| Irish | 21,317 | 11.8% |
| Iroquois | 5 | 0.0% |
| Israeli | 12 | 0.0% |
| Italian | 6,228 | 3.4% |
| Jamaican | 1 | 0.0% |
| Jordanian | 17 | 0.0% |
| Korean | 930 | 0.5% |
| Latvian | 8 | 0.0% |
| Lebanese | 1,365 | 0.7% |
| Lithuanian | 245 | 0.1% |
| Luxembourger | 63 | 0.0% |
| Macedonian | 4 | 0.0% |
| Maltese | 65 | 0.0% |
| Mexican | 6,257 | 3.5% |
| Mexican American Indian | 89 | 0.1% |
| Moroccan | 96 | 0.1% |
| Native Hawaiian | 157 | 0.1% |
| Navajo | 32 | 0.0% |
| Nicaraguan | 7 | 0.0% |
| Nigerian | 153 | 0.1% |
| Northern European | 185 | 0.1% |
| Norwegian | 1,521 | 0.8% |
| Paiute | 77 | 0.0% |
| Pakistani | 28 | 0.0% |
| Palestinian | 13 | 0.0% |
| Panamanian | 1 | 0.0% |
| Pennsylvania German | 146 | 0.1% |
| Polish | 3,504 | 1.9% |
| Portuguese | 137 | 0.1% |
| Potawatomi | 7 | 0.0% |
| Puerto Rican | 806 | 0.4% |
| Romanian | 143 | 0.1% |
| Russian | 346 | 0.2% |
| Salvadoran | 150 | 0.1% |
| Samoan | 114 | 0.1% |
| Scandinavian | 475 | 0.3% |
| Scotch-Irish | 1,397 | 0.8% |
| Scottish | 3,110 | 1.7% |
| Serbian | 70 | 0.0% |
| Sioux | 46 | 0.0% |
| Slavic | 64 | 0.0% |
| Slovak | 225 | 0.1% |
| Slovene | 40 | 0.0% |
| South American | 364 | 0.2% |
| Spaniard | 113 | 0.1% |
| Spanish | 160 | 0.1% |
| Sri Lankan | 1,052 | 0.6% |
| Subsaharan African | 2,725 | 1.5% |
| Sudanese | 20 | 0.0% |
| Swedish | 3,076 | 1.7% |
| Swiss | 1,006 | 0.6% |
| Syrian | 3 | 0.0% |
| Thai | 3,779 | 2.1% |
| Tlingit-Haida | 5 | 0.0% |
| Trinidadian and Tobagonian | 36 | 0.0% |
| Turkish | 74 | 0.0% |
| Ugandan | 79 | 0.0% |
| Ukrainian | 181 | 0.1% |
| Uruguayan | 185 | 0.1% |
| Venezuelan | 10 | 0.0% |
| Welsh | 1,386 | 0.8% |
| West Indian | 4 | 0.0% |
| Yugoslavian | 49 | 0.0% | View All 126 Rows |
Immigrants in Peoria County
The most numerous immigrant groups reported in Peoria County came from Asia (6,535 | 3.6%), South Central Asia (3,232 | 1.8%), India (2,872 | 1.6%), Latin America (2,623 | 1.5%), and Central America (1,740 | 1.0%), together accounting for 9.4% of all Peoria County residents.
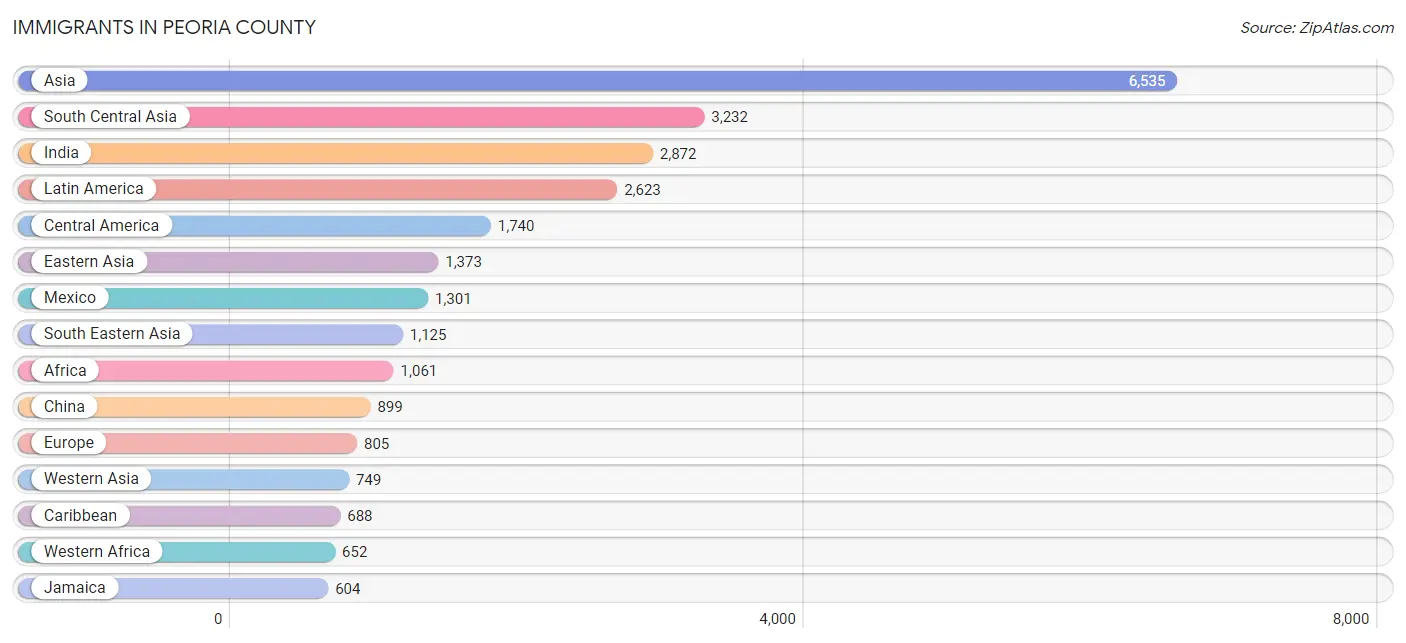
| Immigration Origin | # Population | % Population |
| Africa | 1,061 | 0.6% |
| Armenia | 250 | 0.1% |
| Asia | 6,535 | 3.6% |
| Australia | 64 | 0.0% |
| Bahamas | 4 | 0.0% |
| Belgium | 5 | 0.0% |
| Brazil | 26 | 0.0% |
| Bulgaria | 16 | 0.0% |
| Cameroon | 16 | 0.0% |
| Canada | 270 | 0.2% |
| Caribbean | 688 | 0.4% |
| Central America | 1,740 | 1.0% |
| China | 899 | 0.5% |
| Colombia | 48 | 0.0% |
| Congo | 1 | 0.0% |
| Costa Rica | 49 | 0.0% |
| Croatia | 22 | 0.0% |
| Cuba | 27 | 0.0% |
| Eastern Africa | 67 | 0.0% |
| Eastern Asia | 1,373 | 0.8% |
| Eastern Europe | 210 | 0.1% |
| Ecuador | 57 | 0.0% |
| Egypt | 46 | 0.0% |
| El Salvador | 86 | 0.1% |
| England | 128 | 0.1% |
| Ethiopia | 30 | 0.0% |
| Europe | 805 | 0.4% |
| France | 43 | 0.0% |
| Germany | 201 | 0.1% |
| Ghana | 65 | 0.0% |
| Guatemala | 76 | 0.0% |
| Honduras | 208 | 0.1% |
| Hong Kong | 15 | 0.0% |
| Hungary | 8 | 0.0% |
| India | 2,872 | 1.6% |
| Iran | 85 | 0.1% |
| Ireland | 15 | 0.0% |
| Italy | 65 | 0.0% |
| Jamaica | 604 | 0.3% |
| Japan | 179 | 0.1% |
| Korea | 286 | 0.2% |
| Kuwait | 48 | 0.0% |
| Latin America | 2,623 | 1.5% |
| Lebanon | 353 | 0.2% |
| Malaysia | 25 | 0.0% |
| Mexico | 1,301 | 0.7% |
| Middle Africa | 175 | 0.1% |
| Morocco | 27 | 0.0% |
| Nepal | 35 | 0.0% |
| Netherlands | 13 | 0.0% |
| Nicaragua | 20 | 0.0% |
| Nigeria | 513 | 0.3% |
| Northern Africa | 159 | 0.1% |
| Northern Europe | 204 | 0.1% |
| Norway | 3 | 0.0% |
| Oceania | 64 | 0.0% |
| Pakistan | 240 | 0.1% |
| Philippines | 517 | 0.3% |
| Poland | 50 | 0.0% |
| Romania | 46 | 0.0% |
| Russia | 39 | 0.0% |
| Saudi Arabia | 13 | 0.0% |
| Scotland | 10 | 0.0% |
| South America | 195 | 0.1% |
| South Central Asia | 3,232 | 1.8% |
| South Eastern Asia | 1,125 | 0.6% |
| Southern Europe | 129 | 0.1% |
| Spain | 49 | 0.0% |
| Sudan | 13 | 0.0% |
| Sweden | 25 | 0.0% |
| Syria | 13 | 0.0% |
| Taiwan | 46 | 0.0% |
| Trinidad and Tobago | 36 | 0.0% |
| Turkey | 33 | 0.0% |
| Uganda | 36 | 0.0% |
| Uruguay | 64 | 0.0% |
| Vietnam | 576 | 0.3% |
| Western Africa | 652 | 0.4% |
| Western Asia | 749 | 0.4% |
| Western Europe | 262 | 0.1% |
| Zaire | 158 | 0.1% | View All 81 Rows |
Sex and Age in Peoria County
Sex and Age in Peoria County
The most populous age groups in Peoria County are 5 to 9 Years (6,548 | 7.4%) for men and 5 to 9 Years (6,430 | 6.9%) for women.
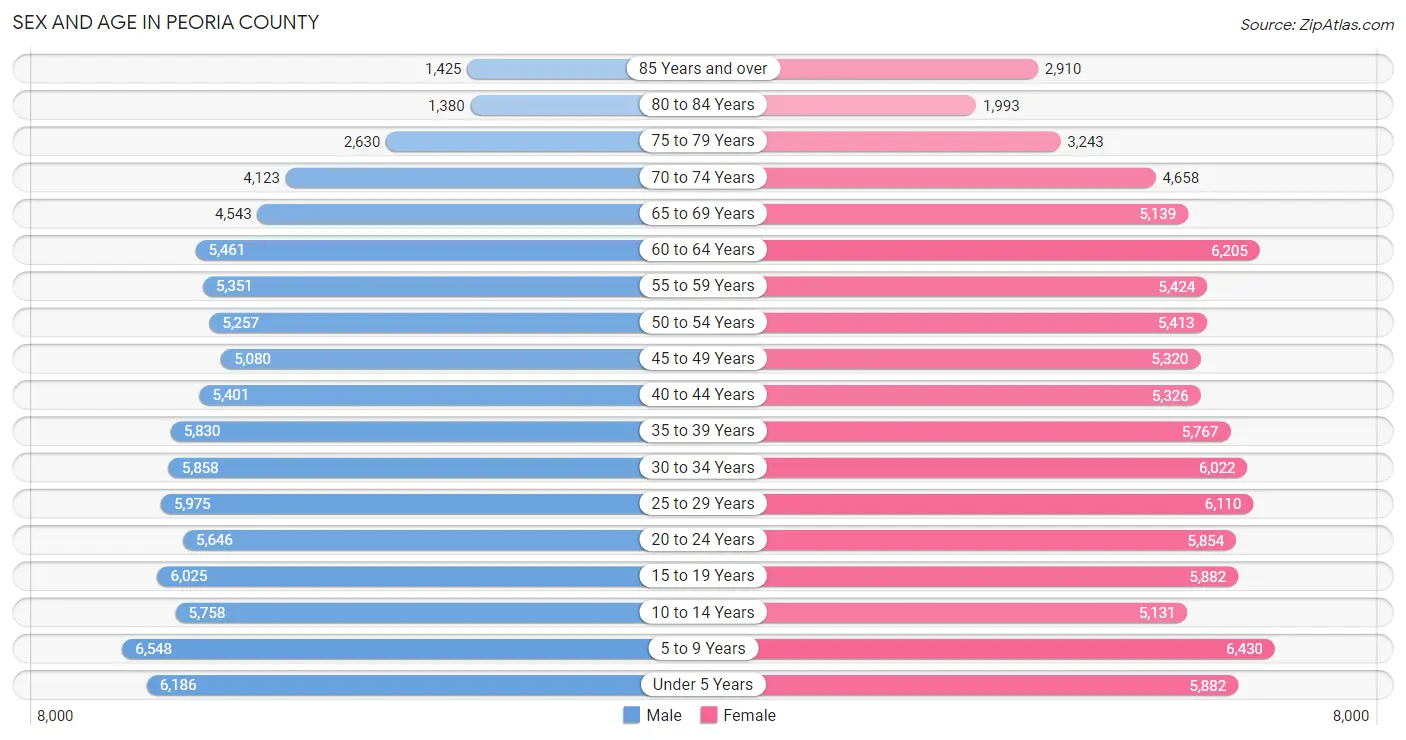
| Age Bracket | Male | Female |
| Under 5 Years | 6,186 (7.0%) | 5,882 (6.3%) |
| 5 to 9 Years | 6,548 (7.4%) | 6,430 (6.9%) |
| 10 to 14 Years | 5,758 (6.5%) | 5,131 (5.5%) |
| 15 to 19 Years | 6,025 (6.8%) | 5,882 (6.3%) |
| 20 to 24 Years | 5,646 (6.4%) | 5,854 (6.3%) |
| 25 to 29 Years | 5,975 (6.8%) | 6,110 (6.6%) |
| 30 to 34 Years | 5,858 (6.6%) | 6,022 (6.5%) |
| 35 to 39 Years | 5,830 (6.6%) | 5,767 (6.2%) |
| 40 to 44 Years | 5,401 (6.1%) | 5,326 (5.7%) |
| 45 to 49 Years | 5,080 (5.7%) | 5,320 (5.7%) |
| 50 to 54 Years | 5,257 (5.9%) | 5,413 (5.8%) |
| 55 to 59 Years | 5,351 (6.0%) | 5,424 (5.9%) |
| 60 to 64 Years | 5,461 (6.2%) | 6,205 (6.7%) |
| 65 to 69 Years | 4,543 (5.1%) | 5,139 (5.5%) |
| 70 to 74 Years | 4,123 (4.7%) | 4,658 (5.0%) |
| 75 to 79 Years | 2,630 (3.0%) | 3,243 (3.5%) |
| 80 to 84 Years | 1,380 (1.6%) | 1,993 (2.1%) |
| 85 Years and over | 1,425 (1.6%) | 2,910 (3.1%) |
| Total | 88,477 (100.0%) | 92,709 (100.0%) |
Families and Households in Peoria County
Median Family Size in Peoria County
The median family size in Peoria County is 3.05 persons per family, with single female/mother families (9,897 | 22.6%) accounting for the largest median family size of 3.13 persons per family. On the other hand, single male/father families (3,035 | 6.9%) represent the smallest median family size with 2.87 persons per family.
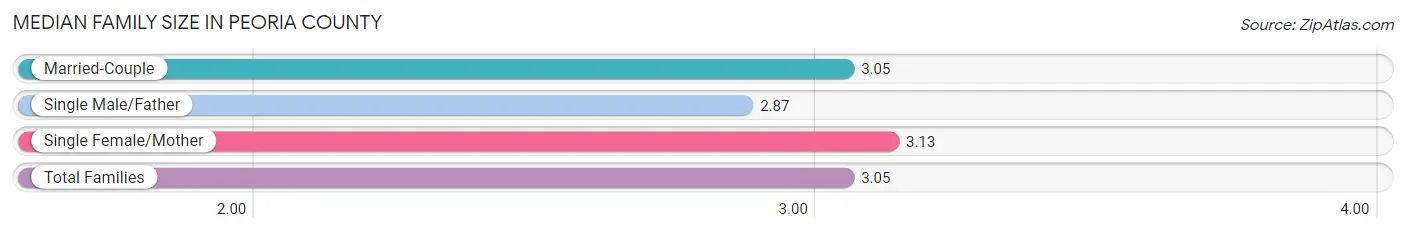
| Family Type | # Families | Family Size |
| Married-Couple | 30,891 (70.5%) | 3.05 |
| Single Male/Father | 3,035 (6.9%) | 2.87 |
| Single Female/Mother | 9,897 (22.6%) | 3.13 |
| Total Families | 43,823 (100.0%) | 3.05 |
Median Household Size in Peoria County
The median household size in Peoria County is 2.31 persons per household, with single female/mother households (9,897 | 13.0%) accounting for the largest median household size of 3.36 persons per household. non-family households (32,591 | 42.6%) represent the smallest median household size with 1.18 persons per household.
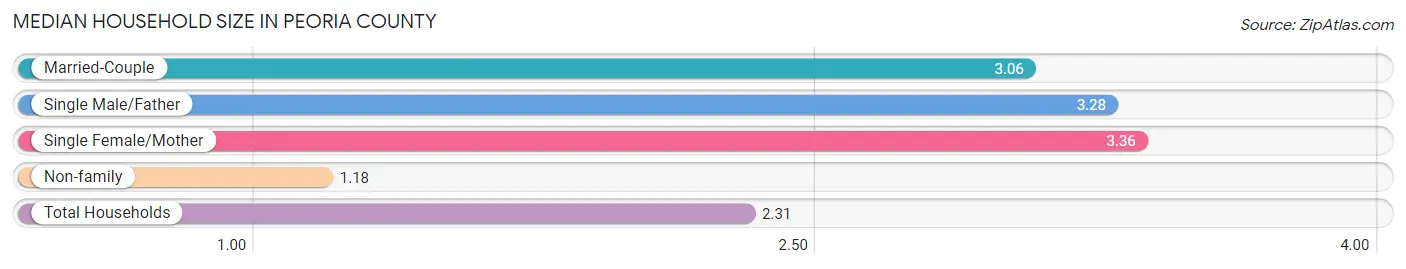
| Household Type | # Households | Household Size |
| Married-Couple | 30,891 (40.4%) | 3.06 |
| Single Male/Father | 3,035 (4.0%) | 3.28 |
| Single Female/Mother | 9,897 (13.0%) | 3.36 |
| Non-family | 32,591 (42.6%) | 1.18 |
| Total Households | 76,414 (100.0%) | 2.31 |
Household Size by Marriage Status in Peoria County
Out of a total of 76,414 households in Peoria County, 43,823 (57.4%) are family households, while 32,591 (42.6%) are nonfamily households. The most numerous type of family households are 2-person households, comprising 21,058, and the most common type of nonfamily households are 1-person households, comprising 27,698.
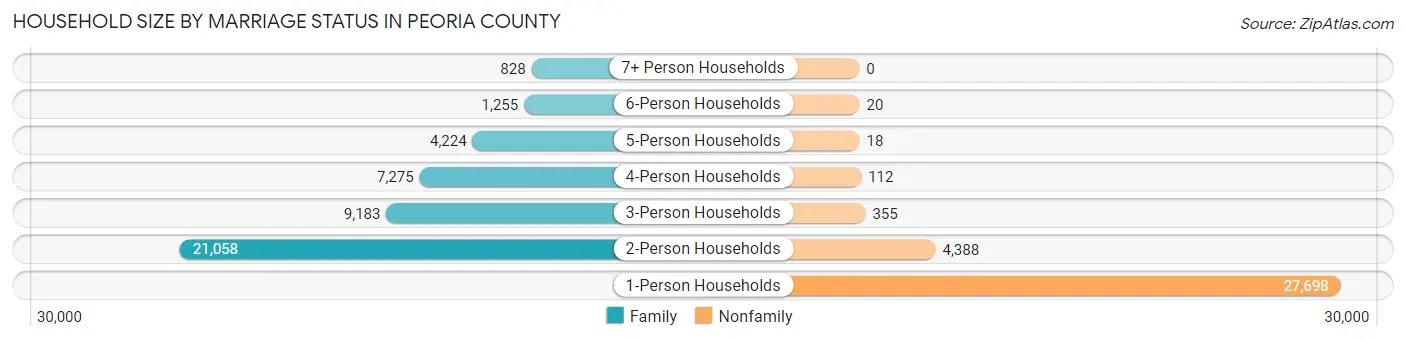
| Household Size | Family Households | Nonfamily Households |
| 1-Person Households | - | 27,698 (36.2%) |
| 2-Person Households | 21,058 (27.6%) | 4,388 (5.7%) |
| 3-Person Households | 9,183 (12.0%) | 355 (0.5%) |
| 4-Person Households | 7,275 (9.5%) | 112 (0.2%) |
| 5-Person Households | 4,224 (5.5%) | 18 (0.0%) |
| 6-Person Households | 1,255 (1.6%) | 20 (0.0%) |
| 7+ Person Households | 828 (1.1%) | 0 (0.0%) |
| Total | 43,823 (57.4%) | 32,591 (42.6%) |
Female Fertility in Peoria County
Fertility by Age in Peoria County
Average fertility rate in Peoria County is 54.0 births per 1,000 women. Women in the age bracket of 20 to 34 years have the highest fertility rate with 90.0 births per 1,000 women. Women in the age bracket of 20 to 34 years acount for 73.0% of all women with births.
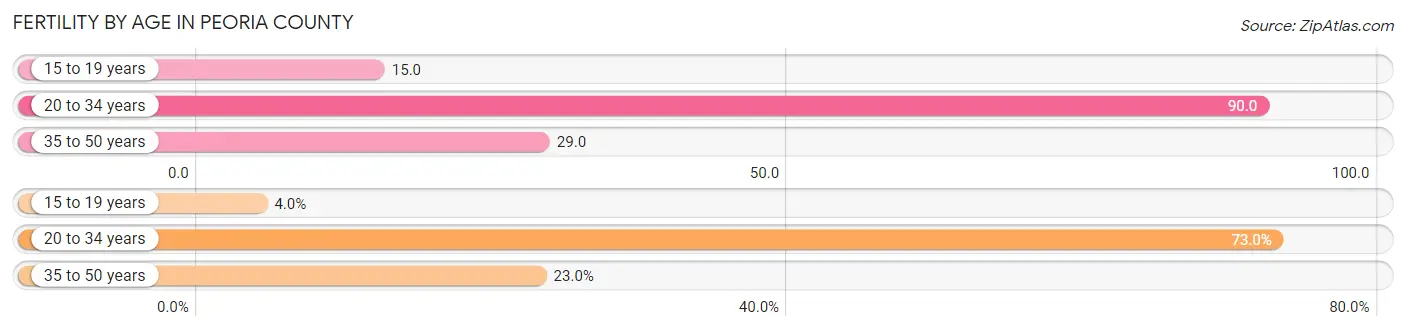
| Age Bracket | Women with Births | Births / 1,000 Women |
| 15 to 19 years | 89 (4.0%) | 15.0 |
| 20 to 34 years | 1,614 (73.0%) | 90.0 |
| 35 to 50 years | 508 (23.0%) | 29.0 |
| Total | 2,211 (100.0%) | 54.0 |
Fertility by Age by Marriage Status in Peoria County
53.8% of women with births (2,211) in Peoria County are married. The highest percentage of unmarried women with births falls into 15 to 19 years age bracket with 83.2% of them unmarried at the time of birth, while the lowest percentage of unmarried women with births belong to 35 to 50 years age bracket with 19.9% of them unmarried.
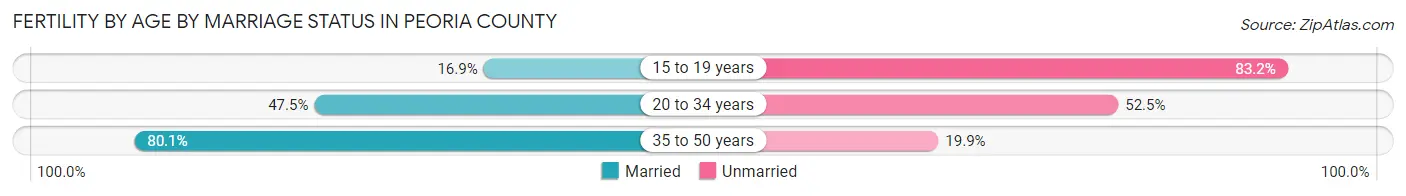
| Age Bracket | Married | Unmarried |
| 15 to 19 years | 15 (16.9%) | 74 (83.2%) |
| 20 to 34 years | 767 (47.5%) | 847 (52.5%) |
| 35 to 50 years | 407 (80.1%) | 101 (19.9%) |
| Total | 1,190 (53.8%) | 1,021 (46.2%) |
Fertility by Education in Peoria County
Average fertility rate in Peoria County is 54.0 births per 1,000 women. Women with the education attainment of graduate degree have the highest fertility rate of 70.0 births per 1,000 women, while women with the education attainment of less than high school have the lowest fertility at 31.0 births per 1,000 women. Women with the education attainment of college or associate's degree represent 36.5% of all women with births.
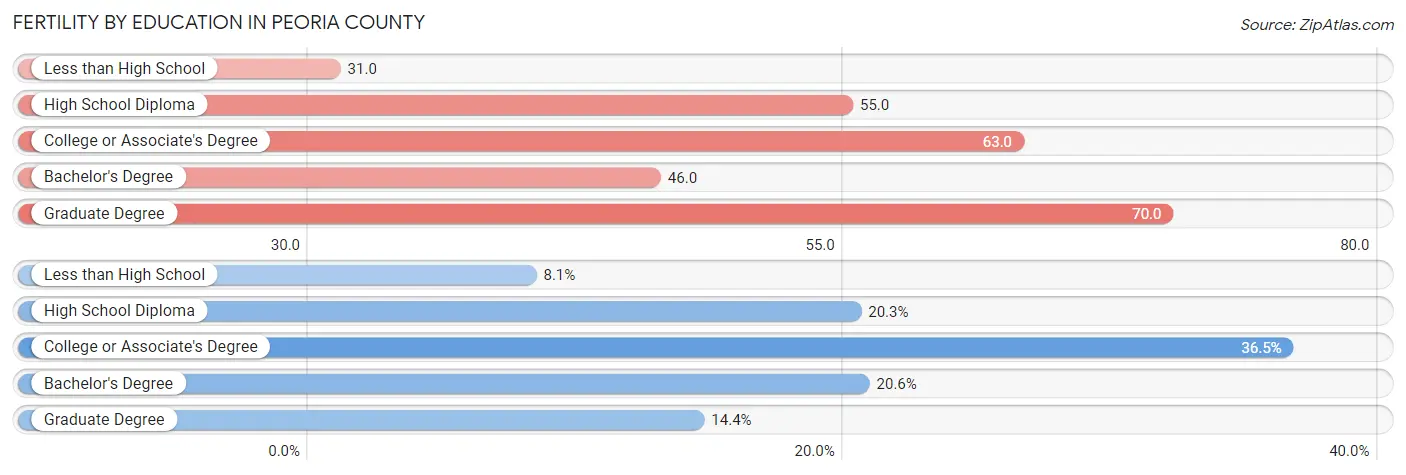
| Educational Attainment | Women with Births | Births / 1,000 Women |
| Less than High School | 180 (8.1%) | 31.0 |
| High School Diploma | 449 (20.3%) | 55.0 |
| College or Associate's Degree | 807 (36.5%) | 63.0 |
| Bachelor's Degree | 456 (20.6%) | 46.0 |
| Graduate Degree | 319 (14.4%) | 70.0 |
| Total | 2,211 (100.0%) | 54.0 |
Fertility by Education by Marriage Status in Peoria County
46.2% of women with births in Peoria County are unmarried. Women with the educational attainment of graduate degree are most likely to be married with 98.1% of them married at childbirth, while women with the educational attainment of less than high school are least likely to be married with 91.7% of them unmarried at childbirth.
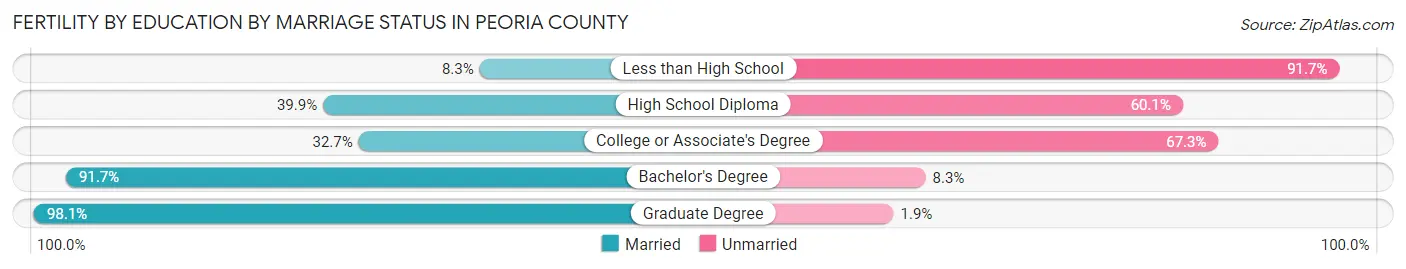
| Educational Attainment | Married | Unmarried |
| Less than High School | 15 (8.3%) | 165 (91.7%) |
| High School Diploma | 179 (39.9%) | 270 (60.1%) |
| College or Associate's Degree | 264 (32.7%) | 543 (67.3%) |
| Bachelor's Degree | 418 (91.7%) | 38 (8.3%) |
| Graduate Degree | 313 (98.1%) | 6 (1.9%) |
| Total | 1,190 (53.8%) | 1,021 (46.2%) |
Income in Peoria County
Income Overview in Peoria County
Per Capita Income in Peoria County is $38,581, while median incomes of families and households are $85,683 and $63,409 respectively.
| Characteristic | Number | Measure |
| Per Capita Income | 181,186 | $38,581 |
| Median Family Income | 43,823 | $85,683 |
| Mean Family Income | 43,823 | $115,181 |
| Median Household Income | 76,414 | $63,409 |
| Mean Household Income | 76,414 | $90,221 |
| Income Deficit | 43,823 | $11,427 |
| Wage / Income Gap (%) | 181,186 | 32.71% |
| Wage / Income Gap ($) | 181,186 | 67.29¢ per $1 |
| Gini / Inequality Index | 181,186 | 0.49 |
Earnings by Sex in Peoria County
Average Earnings in Peoria County are $39,784, $48,952 for men and $32,940 for women, a difference of 32.7%.

| Sex | Number | Average Earnings |
| Male | 45,610 (50.2%) | $48,952 |
| Female | 45,198 (49.8%) | $32,940 |
| Total | 90,808 (100.0%) | $39,784 |
Earnings by Sex by Income Bracket in Peoria County
The most common earnings brackets in Peoria County are $100,000+ for men (9,121 | 20.0%) and $25,000 to $29,999 for women (3,606 | 8.0%).
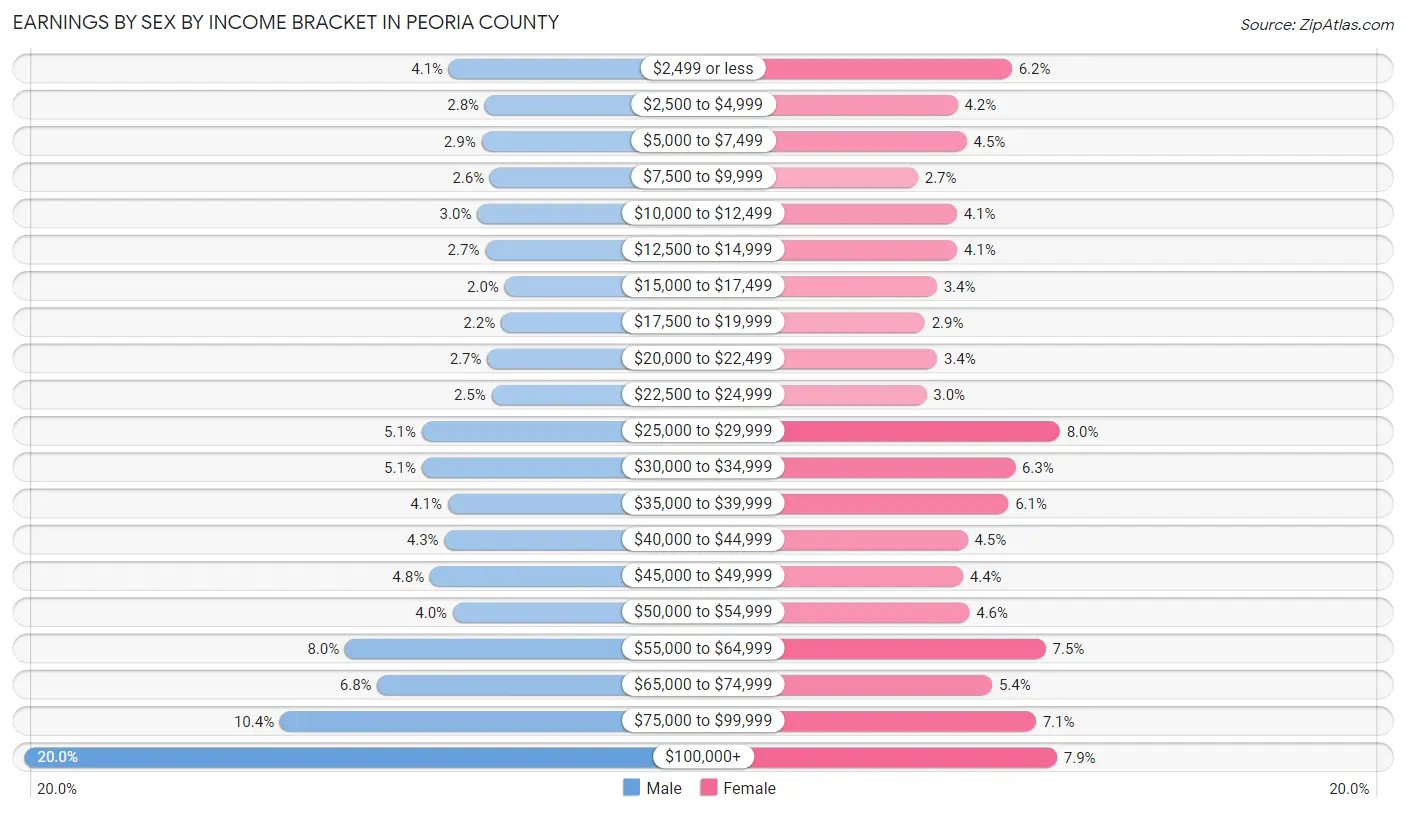
| Income | Male | Female |
| $2,499 or less | 1,872 (4.1%) | 2,791 (6.2%) |
| $2,500 to $4,999 | 1,254 (2.8%) | 1,874 (4.2%) |
| $5,000 to $7,499 | 1,314 (2.9%) | 2,028 (4.5%) |
| $7,500 to $9,999 | 1,166 (2.6%) | 1,204 (2.7%) |
| $10,000 to $12,499 | 1,388 (3.0%) | 1,861 (4.1%) |
| $12,500 to $14,999 | 1,250 (2.7%) | 1,867 (4.1%) |
| $15,000 to $17,499 | 917 (2.0%) | 1,522 (3.4%) |
| $17,500 to $19,999 | 979 (2.1%) | 1,320 (2.9%) |
| $20,000 to $22,499 | 1,212 (2.7%) | 1,529 (3.4%) |
| $22,500 to $24,999 | 1,141 (2.5%) | 1,348 (3.0%) |
| $25,000 to $29,999 | 2,334 (5.1%) | 3,606 (8.0%) |
| $30,000 to $34,999 | 2,337 (5.1%) | 2,846 (6.3%) |
| $35,000 to $39,999 | 1,890 (4.1%) | 2,734 (6.0%) |
| $40,000 to $44,999 | 1,946 (4.3%) | 2,045 (4.5%) |
| $45,000 to $49,999 | 2,195 (4.8%) | 1,965 (4.3%) |
| $50,000 to $54,999 | 1,803 (4.0%) | 2,073 (4.6%) |
| $55,000 to $64,999 | 3,642 (8.0%) | 3,368 (7.4%) |
| $65,000 to $74,999 | 3,091 (6.8%) | 2,459 (5.4%) |
| $75,000 to $99,999 | 4,758 (10.4%) | 3,202 (7.1%) |
| $100,000+ | 9,121 (20.0%) | 3,556 (7.9%) |
| Total | 45,610 (100.0%) | 45,198 (100.0%) |
Earnings by Sex by Educational Attainment in Peoria County
Average earnings in Peoria County are $56,834 for men and $38,349 for women, a difference of 32.5%. Men with an educational attainment of graduate degree enjoy the highest average annual earnings of $107,971, while those with less than high school education earn the least with $33,432. Women with an educational attainment of graduate degree earn the most with the average annual earnings of $67,320, while those with less than high school education have the smallest earnings of $16,530.
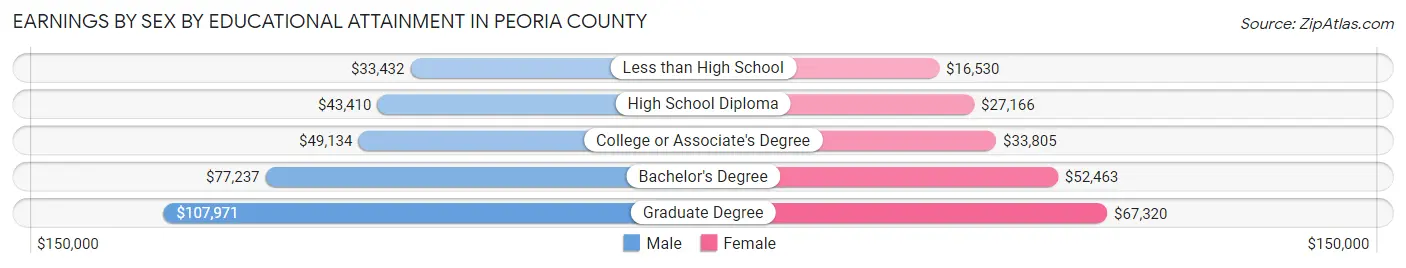
| Educational Attainment | Male Income | Female Income |
| Less than High School | $33,432 | $16,530 |
| High School Diploma | $43,410 | $27,166 |
| College or Associate's Degree | $49,134 | $33,805 |
| Bachelor's Degree | $77,237 | $52,463 |
| Graduate Degree | $107,971 | $67,320 |
| Total | $56,834 | $38,349 |
Family Income in Peoria County
Family Income Brackets in Peoria County
According to the Peoria County family income data, there are 8,677 families falling into the $100,000 to $149,999 income range, which is the most common income bracket and makes up 19.8% of all families. Conversely, the $10,000 to $14,999 income bracket is the least frequent group with only 1,227 families (2.8%) belonging to this category.

| Income Bracket | # Families | % Families |
| Less than $10,000 | 1,359 | 3.1% |
| $10,000 to $14,999 | 1,227 | 2.8% |
| $15,000 to $24,999 | 1,972 | 4.5% |
| $25,000 to $34,999 | 2,366 | 5.4% |
| $35,000 to $49,999 | 4,426 | 10.1% |
| $50,000 to $74,999 | 7,713 | 17.6% |
| $75,000 to $99,999 | 6,091 | 13.9% |
| $100,000 to $149,999 | 8,677 | 19.8% |
| $150,000 to $199,999 | 4,426 | 10.1% |
| $200,000+ | 5,566 | 12.7% |
Family Income by Famaliy Size in Peoria County
4-person families (6,895 | 15.7%) account for the highest median family income in Peoria County with $124,313 per family, while 2-person families (22,469 | 51.3%) have the highest median income of $37,748 per family member.
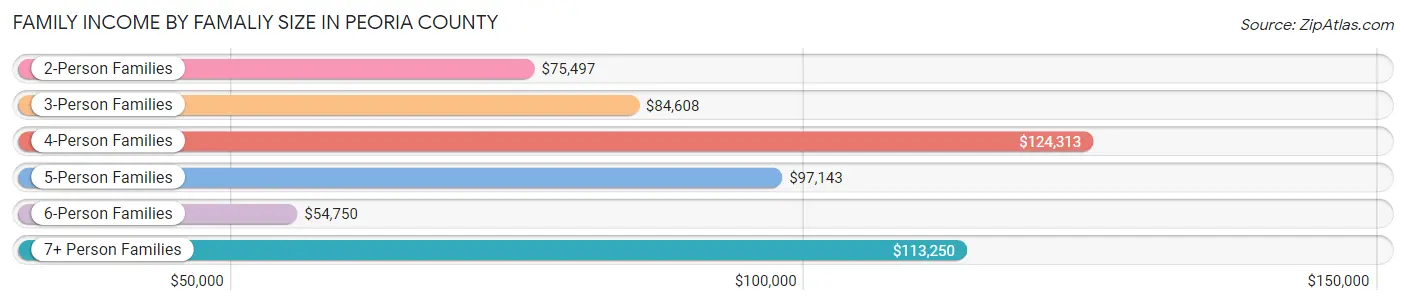
| Income Bracket | # Families | Median Income |
| 2-Person Families | 22,469 (51.3%) | $75,497 |
| 3-Person Families | 8,984 (20.5%) | $84,608 |
| 4-Person Families | 6,895 (15.7%) | $124,313 |
| 5-Person Families | 3,670 (8.4%) | $97,143 |
| 6-Person Families | 1,170 (2.7%) | $54,750 |
| 7+ Person Families | 635 (1.5%) | $113,250 |
| Total | 43,823 (100.0%) | $85,683 |
Family Income by Number of Earners in Peoria County
The median family income in Peoria County is $85,683, with families comprising 3+ earners (3,876) having the highest median family income of $141,071, while families with no earners (7,242) have the lowest median family income of $56,581, accounting for 8.8% and 16.5% of families, respectively.
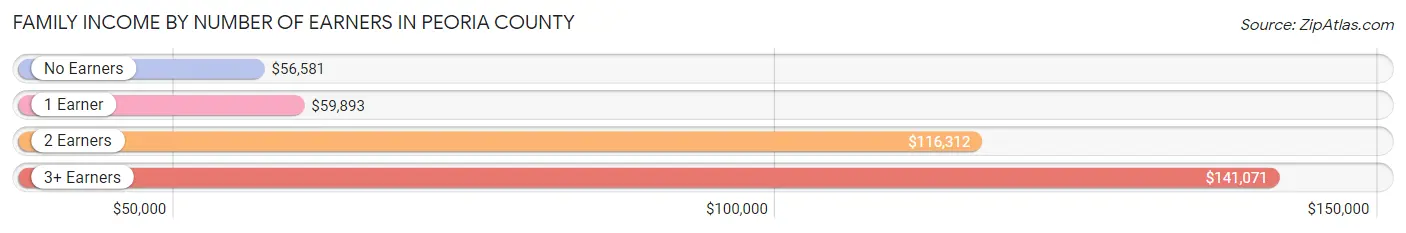
| Number of Earners | # Families | Median Income |
| No Earners | 7,242 (16.5%) | $56,581 |
| 1 Earner | 15,451 (35.3%) | $59,893 |
| 2 Earners | 17,254 (39.4%) | $116,312 |
| 3+ Earners | 3,876 (8.8%) | $141,071 |
| Total | 43,823 (100.0%) | $85,683 |
Household Income in Peoria County
Household Income Brackets in Peoria County
With 13,678 households falling in the category, the $50,000 to $74,999 income range is the most frequent in Peoria County, accounting for 17.9% of all households. In contrast, only 3,974 households (5.2%) fall into the $10,000 to $14,999 income bracket, making it the least populous group.
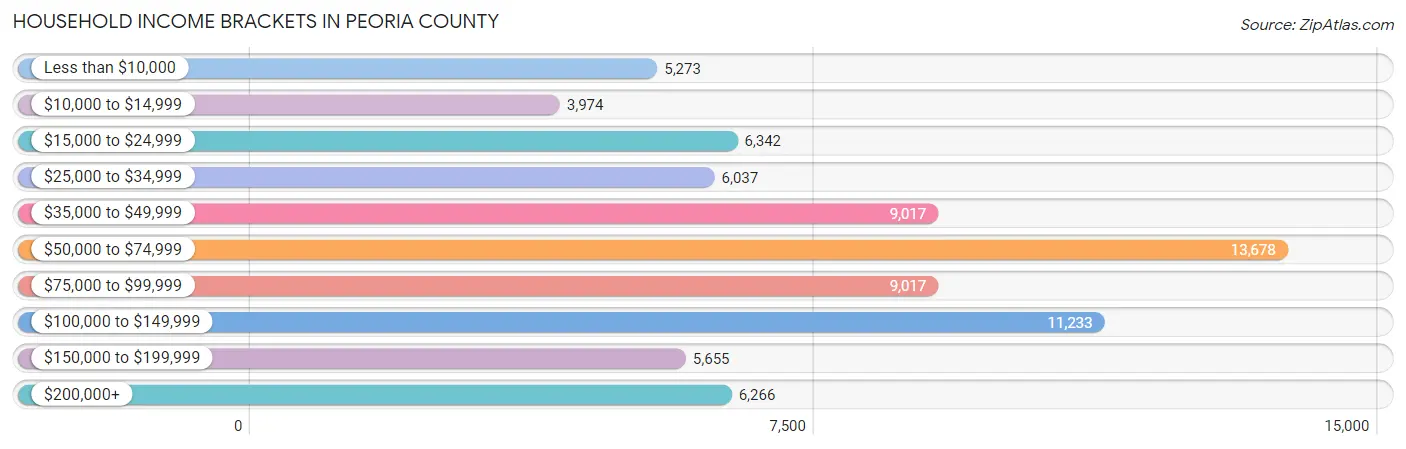
| Income Bracket | # Households | % Households |
| Less than $10,000 | 5,273 | 6.9% |
| $10,000 to $14,999 | 3,974 | 5.2% |
| $15,000 to $24,999 | 6,342 | 8.3% |
| $25,000 to $34,999 | 6,037 | 7.9% |
| $35,000 to $49,999 | 9,017 | 11.8% |
| $50,000 to $74,999 | 13,678 | 17.9% |
| $75,000 to $99,999 | 9,017 | 11.8% |
| $100,000 to $149,999 | 11,233 | 14.7% |
| $150,000 to $199,999 | 5,655 | 7.4% |
| $200,000+ | 6,266 | 8.2% |
Household Income by Householder Age in Peoria County
The median household income in Peoria County is $63,409, with the highest median household income of $75,873 found in the 45 to 64 years age bracket for the primary householder. A total of 25,862 households (33.8%) fall into this category. Meanwhile, the 15 to 24 years age bracket for the primary householder has the lowest median household income of $30,991, with 4,003 households (5.2%) in this group.
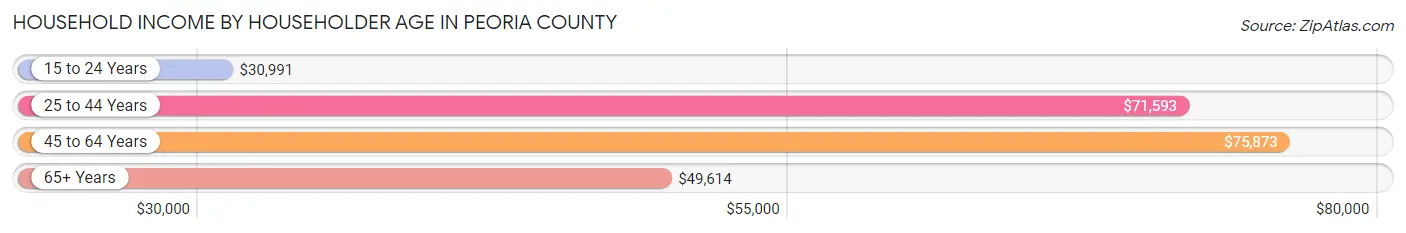
| Income Bracket | # Households | Median Income |
| 15 to 24 Years | 4,003 (5.2%) | $30,991 |
| 25 to 44 Years | 25,360 (33.2%) | $71,593 |
| 45 to 64 Years | 25,862 (33.8%) | $75,873 |
| 65+ Years | 21,189 (27.7%) | $49,614 |
| Total | 76,414 (100.0%) | $63,409 |
Poverty in Peoria County
Income Below Poverty by Sex and Age in Peoria County
With 14.3% poverty level for males and 16.5% for females among the residents of Peoria County, under 5 year old males and 15 year old females are the most vulnerable to poverty, with 1,431 males (23.6%) and 450 females (33.8%) in their respective age groups living below the poverty level.
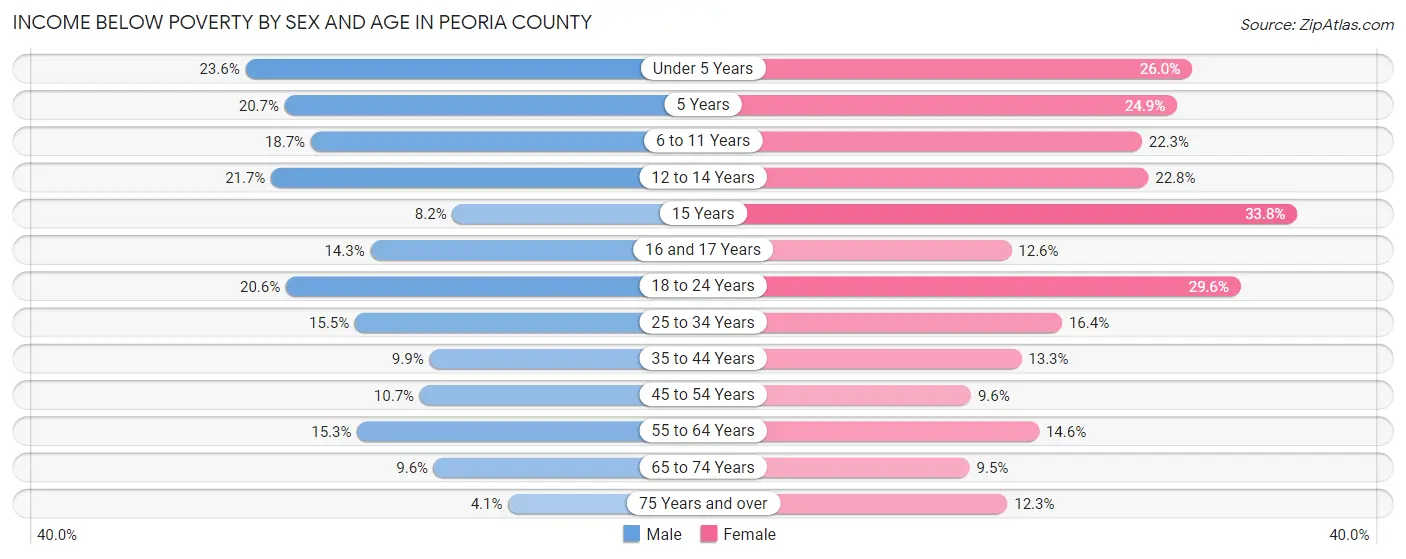
| Age Bracket | Male | Female |
| Under 5 Years | 1,431 (23.6%) | 1,522 (26.0%) |
| 5 Years | 200 (20.7%) | 331 (24.9%) |
| 6 to 11 Years | 1,424 (18.7%) | 1,514 (22.3%) |
| 12 to 14 Years | 776 (21.7%) | 705 (22.8%) |
| 15 Years | 102 (8.2%) | 450 (33.8%) |
| 16 and 17 Years | 333 (14.3%) | 262 (12.6%) |
| 18 to 24 Years | 1,435 (20.6%) | 2,125 (29.6%) |
| 25 to 34 Years | 1,812 (15.5%) | 1,981 (16.4%) |
| 35 to 44 Years | 1,109 (9.9%) | 1,476 (13.3%) |
| 45 to 54 Years | 1,087 (10.6%) | 1,027 (9.6%) |
| 55 to 64 Years | 1,637 (15.3%) | 1,694 (14.6%) |
| 65 to 74 Years | 820 (9.6%) | 909 (9.5%) |
| 75 Years and over | 213 (4.1%) | 909 (12.3%) |
| Total | 12,379 (14.3%) | 14,905 (16.5%) |
Income Above Poverty by Sex and Age in Peoria County
According to the poverty statistics in Peoria County, males aged 75 years and over and females aged 65 to 74 years are the age groups that are most secure financially, with 95.9% of males and 90.5% of females in these age groups living above the poverty line.
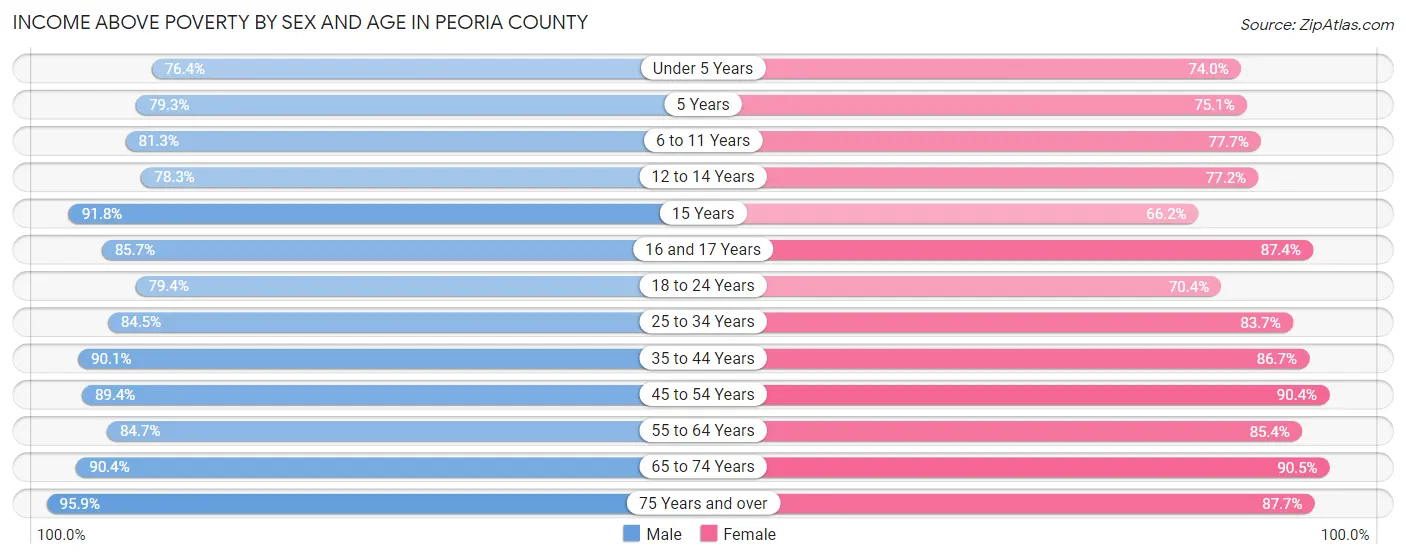
| Age Bracket | Male | Female |
| Under 5 Years | 4,633 (76.4%) | 4,331 (74.0%) |
| 5 Years | 767 (79.3%) | 999 (75.1%) |
| 6 to 11 Years | 6,175 (81.3%) | 5,281 (77.7%) |
| 12 to 14 Years | 2,801 (78.3%) | 2,393 (77.2%) |
| 15 Years | 1,138 (91.8%) | 881 (66.2%) |
| 16 and 17 Years | 1,993 (85.7%) | 1,819 (87.4%) |
| 18 to 24 Years | 5,535 (79.4%) | 5,048 (70.4%) |
| 25 to 34 Years | 9,905 (84.5%) | 10,135 (83.7%) |
| 35 to 44 Years | 10,043 (90.1%) | 9,593 (86.7%) |
| 45 to 54 Years | 9,123 (89.3%) | 9,684 (90.4%) |
| 55 to 64 Years | 9,061 (84.7%) | 9,878 (85.4%) |
| 65 to 74 Years | 7,710 (90.4%) | 8,672 (90.5%) |
| 75 Years and over | 4,993 (95.9%) | 6,490 (87.7%) |
| Total | 73,877 (85.7%) | 75,204 (83.5%) |
Income Below Poverty Among Married-Couple Families in Peoria County
The poverty statistics for married-couple families in Peoria County show that 3.1% or 957 of the total 30,891 families live below the poverty line. Families with 5 or more children have the highest poverty rate of 14.3%, comprising of 34 families. On the other hand, families with 1 or 2 children have the lowest poverty rate of 1.9%, which includes 170 families.
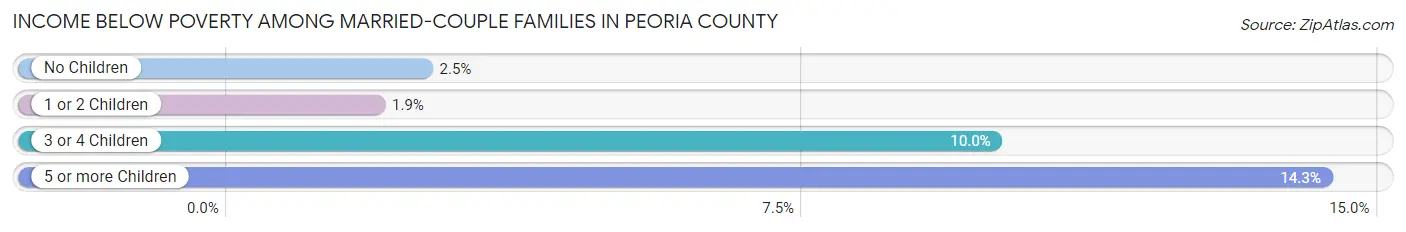
| Children | Above Poverty | Below Poverty |
| No Children | 18,626 (97.5%) | 486 (2.5%) |
| 1 or 2 Children | 8,696 (98.1%) | 170 (1.9%) |
| 3 or 4 Children | 2,408 (90.0%) | 267 (10.0%) |
| 5 or more Children | 204 (85.7%) | 34 (14.3%) |
| Total | 29,934 (96.9%) | 957 (3.1%) |
Income Below Poverty Among Single-Parent Households in Peoria County
According to the poverty data in Peoria County, 17.6% or 534 single-father households and 28.8% or 2,852 single-mother households are living below the poverty line. Among single-father households, those with 1 or 2 children have the highest poverty rate, with 309 households (20.4%) experiencing poverty. Likewise, among single-mother households, those with 5 or more children have the highest poverty rate, with 236 households (96.7%) falling below the poverty line.
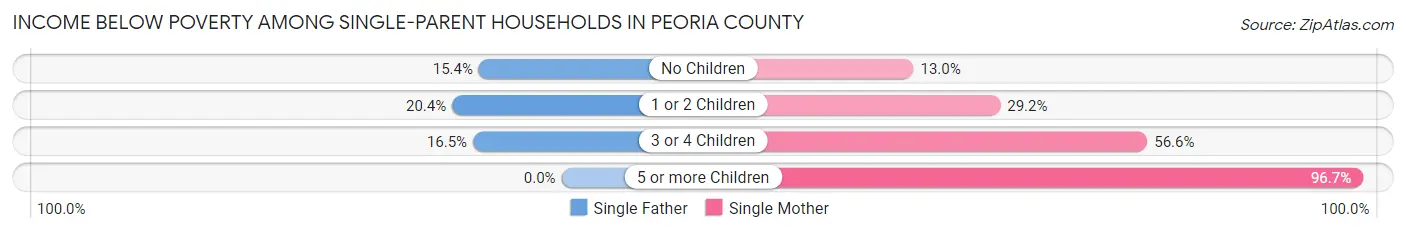
| Children | Single Father | Single Mother |
| No Children | 178 (15.4%) | 450 (13.0%) |
| 1 or 2 Children | 309 (20.4%) | 1,425 (29.2%) |
| 3 or 4 Children | 47 (16.5%) | 741 (56.6%) |
| 5 or more Children | 0 (0.0%) | 236 (96.7%) |
| Total | 534 (17.6%) | 2,852 (28.8%) |
Income Below Poverty Among Married-Couple vs Single-Parent Households in Peoria County
The poverty data for Peoria County shows that 957 of the married-couple family households (3.1%) and 3,386 of the single-parent households (26.2%) are living below the poverty level. Within the married-couple family households, those with 5 or more children have the highest poverty rate, with 34 households (14.3%) falling below the poverty line. Among the single-parent households, those with 5 or more children have the highest poverty rate, with 236 household (73.3%) living below poverty.
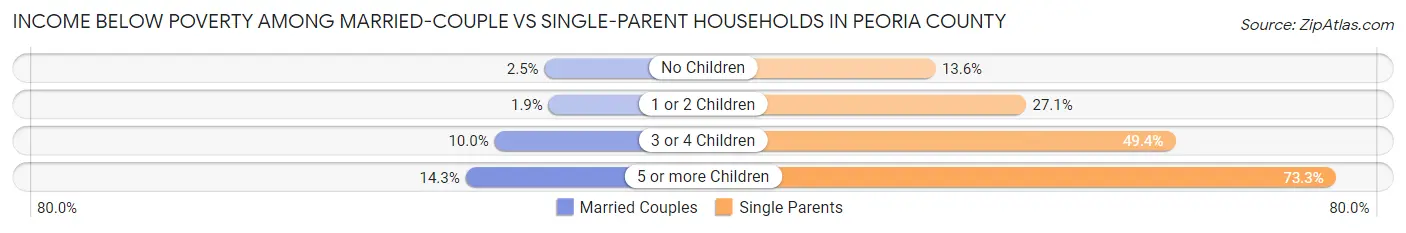
| Children | Married-Couple Families | Single-Parent Households |
| No Children | 486 (2.5%) | 628 (13.6%) |
| 1 or 2 Children | 170 (1.9%) | 1,734 (27.1%) |
| 3 or 4 Children | 267 (10.0%) | 788 (49.4%) |
| 5 or more Children | 34 (14.3%) | 236 (73.3%) |
| Total | 957 (3.1%) | 3,386 (26.2%) |
Employment Characteristics in Peoria County
Employment by Class of Employer in Peoria County
Among the 80,437 employed individuals in Peoria County, private company employees (54,840 | 68.2%), not-for-profit organizations (11,371 | 14.1%), and local government employees (5,342 | 6.6%) make up the most common classes of employment.
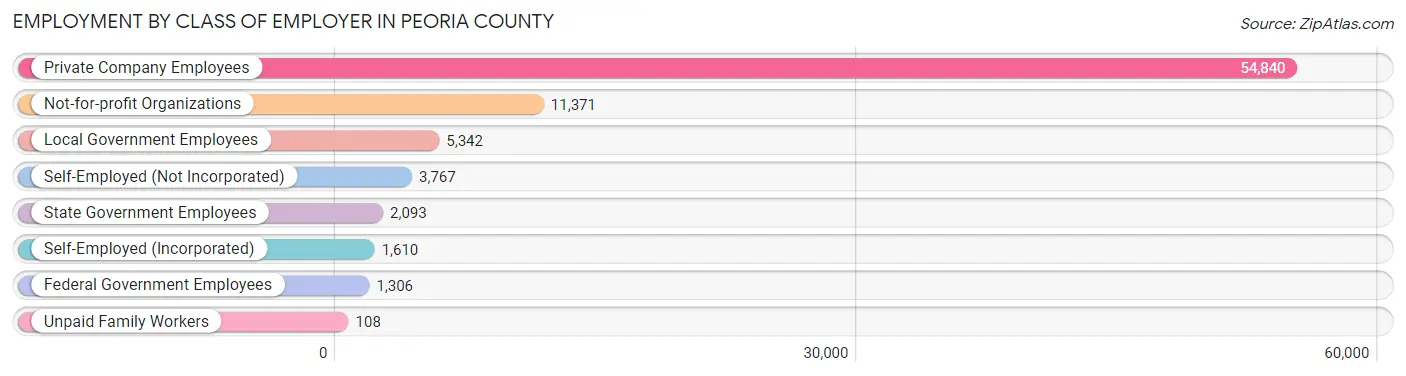
| Employer Class | # Employees | % Employees |
| Private Company Employees | 54,840 | 68.2% |
| Self-Employed (Incorporated) | 1,610 | 2.0% |
| Self-Employed (Not Incorporated) | 3,767 | 4.7% |
| Not-for-profit Organizations | 11,371 | 14.1% |
| Local Government Employees | 5,342 | 6.6% |
| State Government Employees | 2,093 | 2.6% |
| Federal Government Employees | 1,306 | 1.6% |
| Unpaid Family Workers | 108 | 0.1% |
| Total | 80,437 | 100.0% |
Employment Status by Age in Peoria County
According to the labor force statistics for Peoria County, out of the total population over 16 years of age (142,670), 61.6% or 87,885 individuals are in the labor force, with 6.6% or 5,800 of them unemployed. The age group with the highest labor force participation rate is 30 to 34 years, with 86.7% or 10,300 individuals in the labor force. Within the labor force, the 16 to 19 years age range has the highest percentage of unemployed individuals, with 12.4% or 492 of them being unemployed.
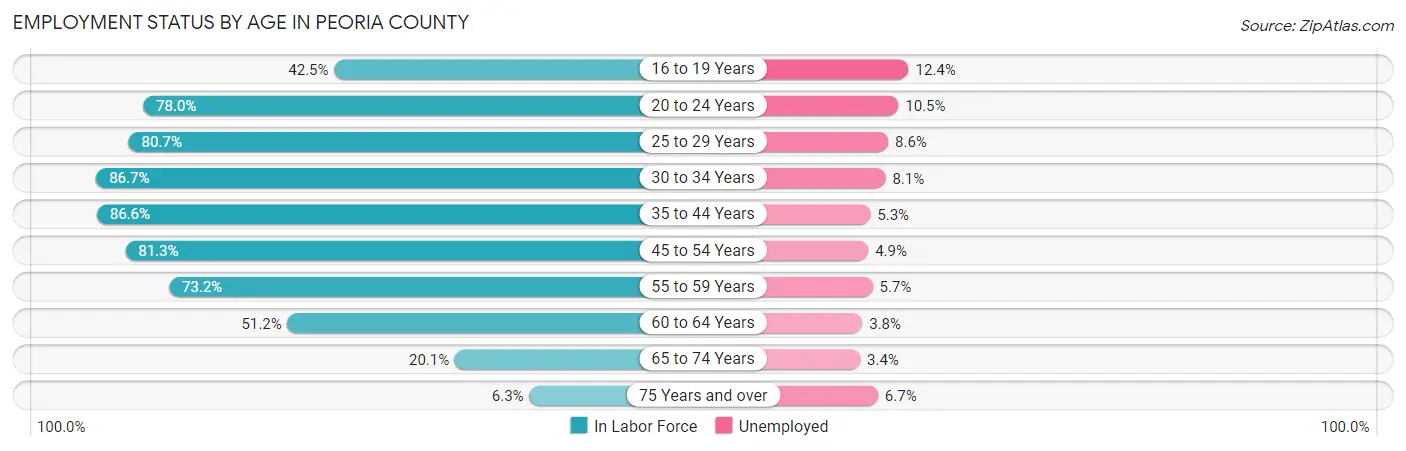
| Age Bracket | In Labor Force | Unemployed |
| 16 to 19 Years | 3,964 (42.5%) | 492 (12.4%) |
| 20 to 24 Years | 8,970 (78.0%) | 942 (10.5%) |
| 25 to 29 Years | 9,753 (80.7%) | 839 (8.6%) |
| 30 to 34 Years | 10,300 (86.7%) | 834 (8.1%) |
| 35 to 44 Years | 19,333 (86.6%) | 1,025 (5.3%) |
| 45 to 54 Years | 17,130 (81.3%) | 839 (4.9%) |
| 55 to 59 Years | 7,887 (73.2%) | 450 (5.7%) |
| 60 to 64 Years | 5,973 (51.2%) | 227 (3.8%) |
| 65 to 74 Years | 3,711 (20.1%) | 126 (3.4%) |
| 75 Years and over | 856 (6.3%) | 57 (6.7%) |
| Total | 87,885 (61.6%) | 5,800 (6.6%) |
Employment Status by Educational Attainment in Peoria County
According to labor force statistics for Peoria County, 78.4% of individuals (70,403) out of the total population between 25 and 64 years of age (89,800) are in the labor force, with 6.0% or 4,224 of them being unemployed. The group with the highest labor force participation rate are those with the educational attainment of bachelor's degree or higher, with 86.1% or 28,409 individuals in the labor force. Within the labor force, individuals with less than high school education have the highest percentage of unemployment, with 18.8% or 613 of them being unemployed.
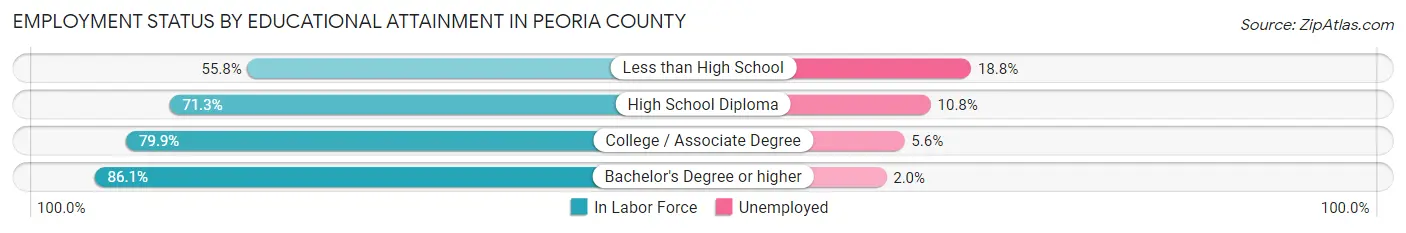
| Educational Attainment | In Labor Force | Unemployed |
| Less than High School | 3,263 (55.8%) | 1,099 (18.8%) |
| High School Diploma | 16,528 (71.3%) | 2,504 (10.8%) |
| College / Associate Degree | 22,194 (79.9%) | 1,556 (5.6%) |
| Bachelor's Degree or higher | 28,409 (86.1%) | 660 (2.0%) |
| Total | 70,403 (78.4%) | 5,388 (6.0%) |
Employment Occupations by Sex in Peoria County
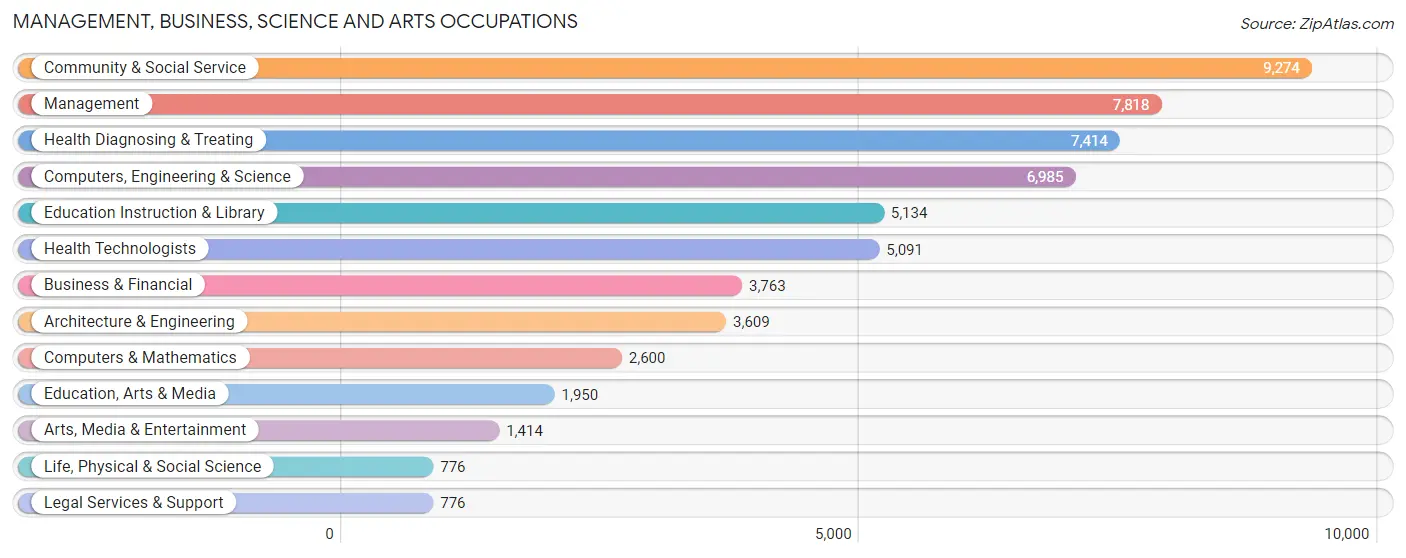
Management, Business, Science and Arts Occupations
The most common Management, Business, Science and Arts occupations in Peoria County are Community & Social Service (9,274 | 11.3%), Management (7,818 | 9.5%), Health Diagnosing & Treating (7,414 | 9.0%), Computers, Engineering & Science (6,985 | 8.5%), and Education Instruction & Library (5,134 | 6.3%).
Management, Business, Science and Arts Occupations by Sex
Within the Management, Business, Science and Arts occupations in Peoria County, the most male-oriented occupations are Architecture & Engineering (86.5%), Computers, Engineering & Science (79.3%), and Computers & Mathematics (79.1%), while the most female-oriented occupations are Health Technologists (77.8%), Health Diagnosing & Treating (76.6%), and Education Instruction & Library (75.0%).

| Occupation | Male | Female |
| Management | 4,415 (56.5%) | 3,403 (43.5%) |
| Business & Financial | 1,702 (45.2%) | 2,061 (54.8%) |
| Computers, Engineering & Science | 5,536 (79.3%) | 1,449 (20.7%) |
| Computers & Mathematics | 2,056 (79.1%) | 544 (20.9%) |
| Architecture & Engineering | 3,123 (86.5%) | 486 (13.5%) |
| Life, Physical & Social Science | 357 (46.0%) | 419 (54.0%) |
| Community & Social Service | 2,956 (31.9%) | 6,318 (68.1%) |
| Education, Arts & Media | 509 (26.1%) | 1,441 (73.9%) |
| Legal Services & Support | 399 (51.4%) | 377 (48.6%) |
| Education Instruction & Library | 1,283 (25.0%) | 3,851 (75.0%) |
| Arts, Media & Entertainment | 765 (54.1%) | 649 (45.9%) |
| Health Diagnosing & Treating | 1,736 (23.4%) | 5,678 (76.6%) |
| Health Technologists | 1,131 (22.2%) | 3,960 (77.8%) |
| Total (Category) | 16,345 (46.4%) | 18,909 (53.6%) |
| Total (Overall) | 41,196 (50.3%) | 40,719 (49.7%) |
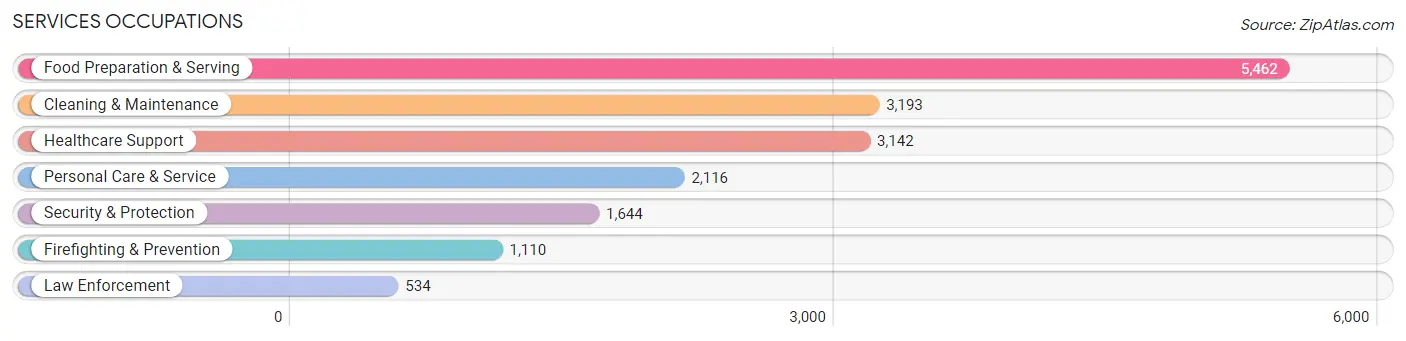
Services Occupations
The most common Services occupations in Peoria County are Food Preparation & Serving (5,462 | 6.7%), Cleaning & Maintenance (3,193 | 3.9%), Healthcare Support (3,142 | 3.8%), Personal Care & Service (2,116 | 2.6%), and Security & Protection (1,644 | 2.0%).
Services Occupations by Sex
Within the Services occupations in Peoria County, the most male-oriented occupations are Law Enforcement (87.1%), Security & Protection (74.0%), and Firefighting & Prevention (67.7%), while the most female-oriented occupations are Healthcare Support (85.8%), Personal Care & Service (82.9%), and Food Preparation & Serving (61.9%).
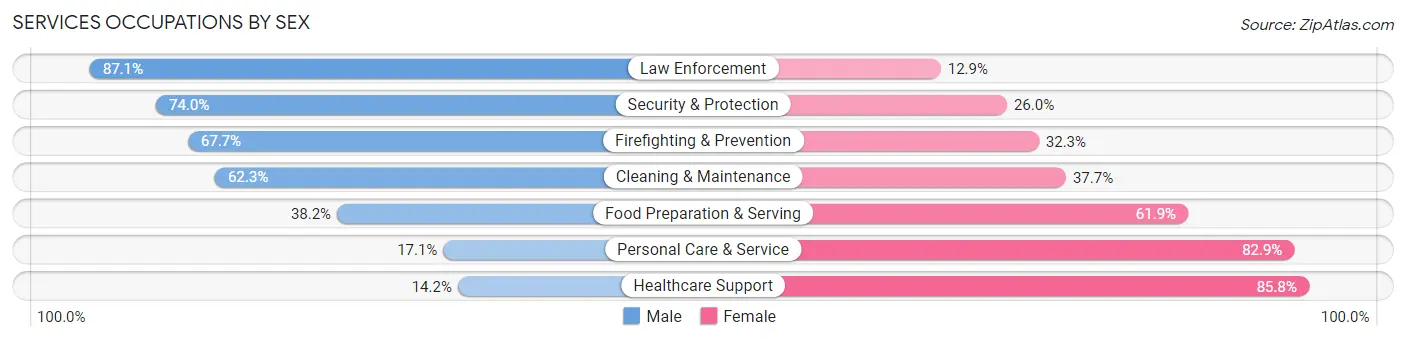
| Occupation | Male | Female |
| Healthcare Support | 447 (14.2%) | 2,695 (85.8%) |
| Security & Protection | 1,216 (74.0%) | 428 (26.0%) |
| Firefighting & Prevention | 751 (67.7%) | 359 (32.3%) |
| Law Enforcement | 465 (87.1%) | 69 (12.9%) |
| Food Preparation & Serving | 2,084 (38.2%) | 3,378 (61.9%) |
| Cleaning & Maintenance | 1,989 (62.3%) | 1,204 (37.7%) |
| Personal Care & Service | 362 (17.1%) | 1,754 (82.9%) |
| Total (Category) | 6,098 (39.2%) | 9,459 (60.8%) |
| Total (Overall) | 41,196 (50.3%) | 40,719 (49.7%) |
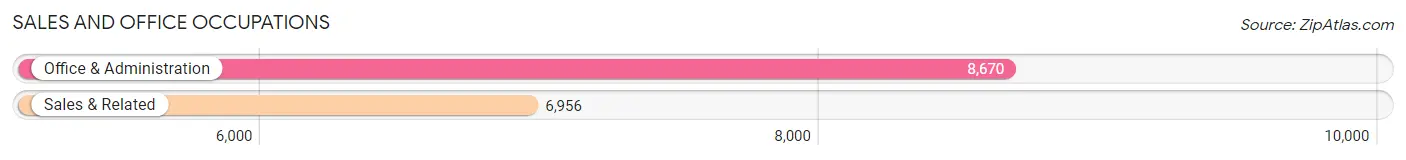
Sales and Office Occupations
The most common Sales and Office occupations in Peoria County are Office & Administration (8,670 | 10.6%), and Sales & Related (6,956 | 8.5%).
Sales and Office Occupations by Sex
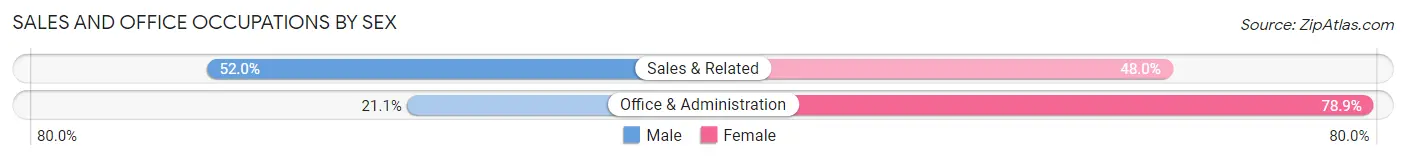
| Occupation | Male | Female |
| Sales & Related | 3,617 (52.0%) | 3,339 (48.0%) |
| Office & Administration | 1,827 (21.1%) | 6,843 (78.9%) |
| Total (Category) | 5,444 (34.8%) | 10,182 (65.2%) |
| Total (Overall) | 41,196 (50.3%) | 40,719 (49.7%) |
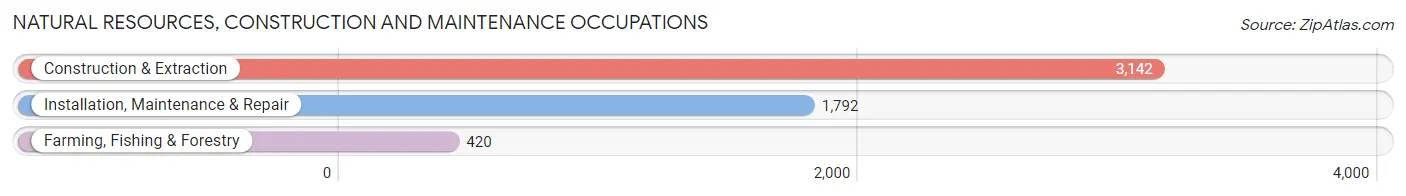
Natural Resources, Construction and Maintenance Occupations
The most common Natural Resources, Construction and Maintenance occupations in Peoria County are Construction & Extraction (3,142 | 3.8%), Installation, Maintenance & Repair (1,792 | 2.2%), and Farming, Fishing & Forestry (420 | 0.5%).
Natural Resources, Construction and Maintenance Occupations by Sex
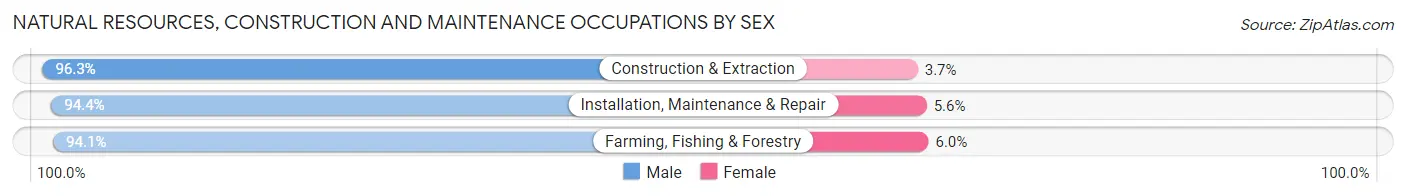
| Occupation | Male | Female |
| Farming, Fishing & Forestry | 395 (94.1%) | 25 (5.9%) |
| Construction & Extraction | 3,025 (96.3%) | 117 (3.7%) |
| Installation, Maintenance & Repair | 1,692 (94.4%) | 100 (5.6%) |
| Total (Category) | 5,112 (95.5%) | 242 (4.5%) |
| Total (Overall) | 41,196 (50.3%) | 40,719 (49.7%) |
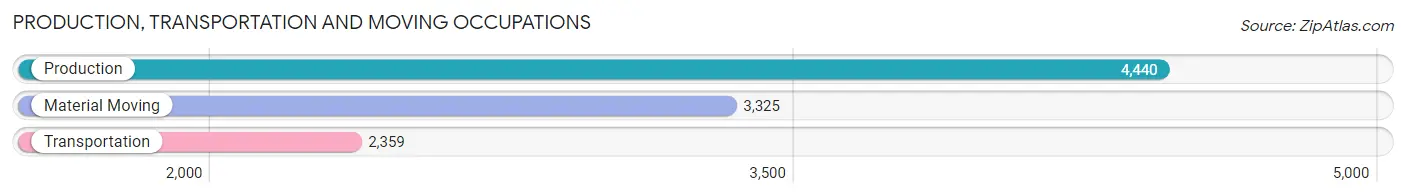
Production, Transportation and Moving Occupations
The most common Production, Transportation and Moving occupations in Peoria County are Production (4,440 | 5.4%), Material Moving (3,325 | 4.1%), and Transportation (2,359 | 2.9%).
Production, Transportation and Moving Occupations by Sex
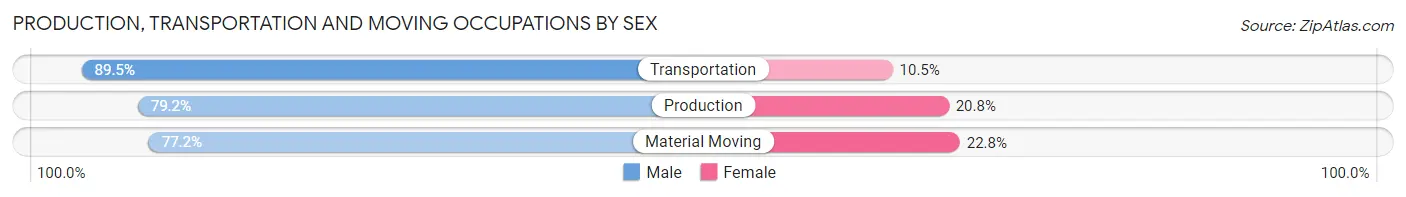
| Occupation | Male | Female |
| Production | 3,518 (79.2%) | 922 (20.8%) |
| Transportation | 2,112 (89.5%) | 247 (10.5%) |
| Material Moving | 2,567 (77.2%) | 758 (22.8%) |
| Total (Category) | 8,197 (81.0%) | 1,927 (19.0%) |
| Total (Overall) | 41,196 (50.3%) | 40,719 (49.7%) |
Employment Industries by Sex in Peoria County
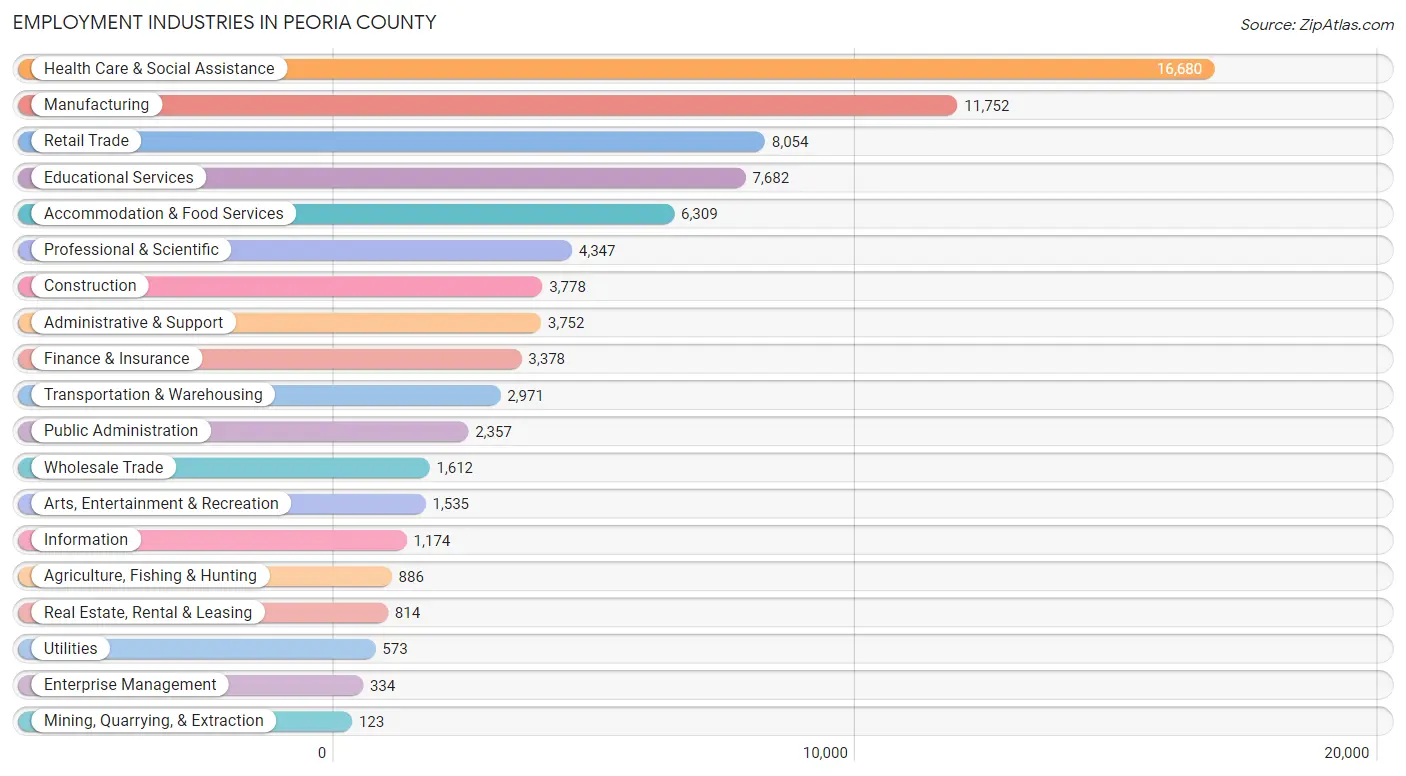
Employment Industries in Peoria County
The major employment industries in Peoria County include Health Care & Social Assistance (16,680 | 20.4%), Manufacturing (11,752 | 14.3%), Retail Trade (8,054 | 9.8%), Educational Services (7,682 | 9.4%), and Accommodation & Food Services (6,309 | 7.7%).
Employment Industries by Sex in Peoria County
The Peoria County industries that see more men than women are Construction (90.4%), Wholesale Trade (79.4%), and Manufacturing (76.8%), whereas the industries that tend to have a higher number of women are Health Care & Social Assistance (79.9%), Mining, Quarrying, & Extraction (74.8%), and Educational Services (66.9%).
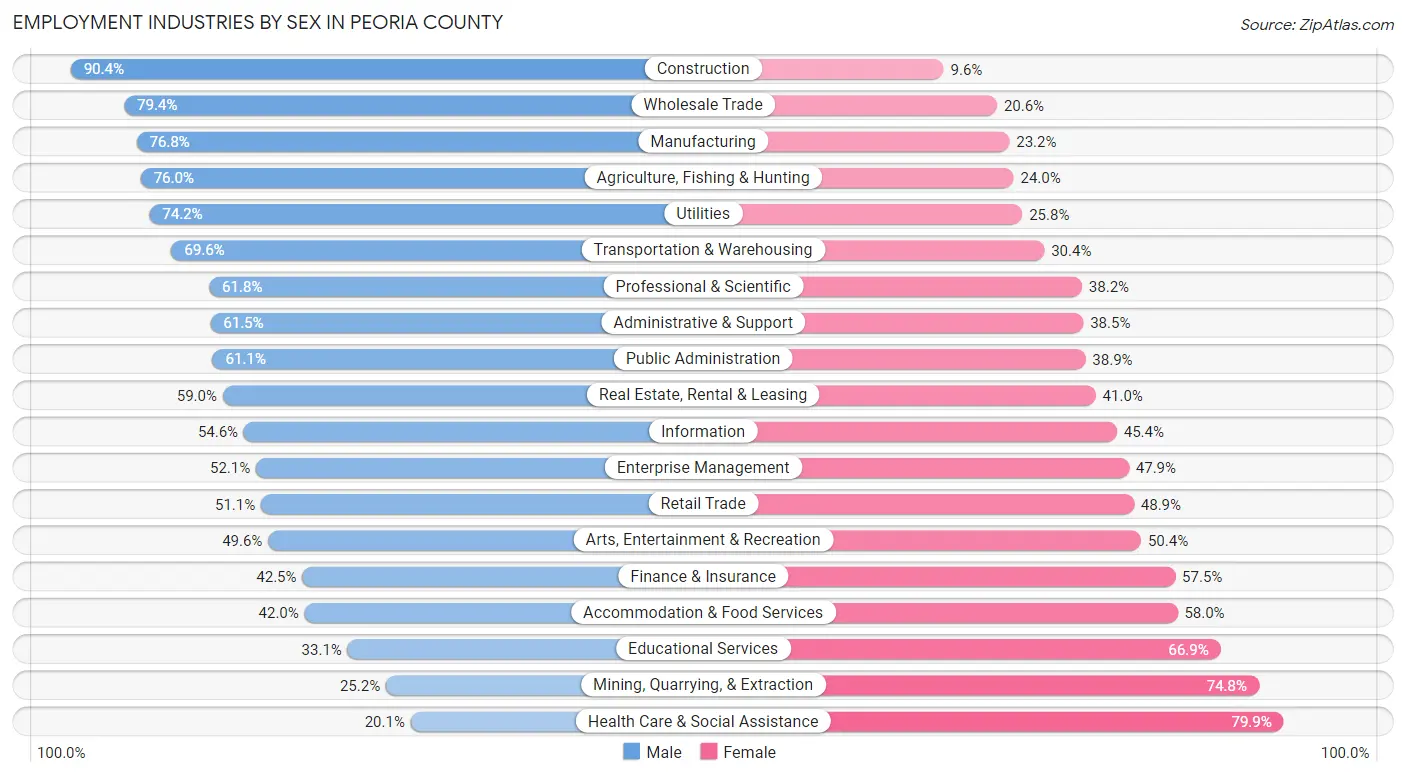
| Industry | Male | Female |
| Agriculture, Fishing & Hunting | 673 (76.0%) | 213 (24.0%) |
| Mining, Quarrying, & Extraction | 31 (25.2%) | 92 (74.8%) |
| Construction | 3,417 (90.4%) | 361 (9.6%) |
| Manufacturing | 9,030 (76.8%) | 2,722 (23.2%) |
| Wholesale Trade | 1,280 (79.4%) | 332 (20.6%) |
| Retail Trade | 4,112 (51.1%) | 3,942 (48.9%) |
| Transportation & Warehousing | 2,068 (69.6%) | 903 (30.4%) |
| Utilities | 425 (74.2%) | 148 (25.8%) |
| Information | 641 (54.6%) | 533 (45.4%) |
| Finance & Insurance | 1,436 (42.5%) | 1,942 (57.5%) |
| Real Estate, Rental & Leasing | 480 (59.0%) | 334 (41.0%) |
| Professional & Scientific | 2,687 (61.8%) | 1,660 (38.2%) |
| Enterprise Management | 174 (52.1%) | 160 (47.9%) |
| Administrative & Support | 2,309 (61.5%) | 1,443 (38.5%) |
| Educational Services | 2,545 (33.1%) | 5,137 (66.9%) |
| Health Care & Social Assistance | 3,350 (20.1%) | 13,330 (79.9%) |
| Arts, Entertainment & Recreation | 761 (49.6%) | 774 (50.4%) |
| Accommodation & Food Services | 2,652 (42.0%) | 3,657 (58.0%) |
| Public Administration | 1,440 (61.1%) | 917 (38.9%) |
| Total | 41,196 (50.3%) | 40,719 (49.7%) |
Education in Peoria County
School Enrollment in Peoria County
The most common levels of schooling among the 44,325 students in Peoria County are elementary school (9,423 | 21.3%), college / undergraduate (9,136 | 20.6%), and high school (9,042 | 20.4%).
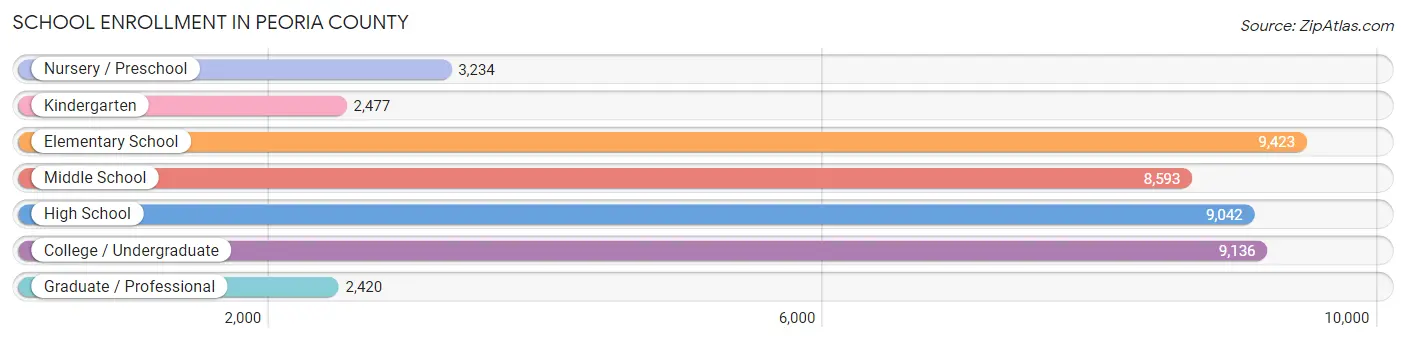
| School Level | # Students | % Students |
| Nursery / Preschool | 3,234 | 7.3% |
| Kindergarten | 2,477 | 5.6% |
| Elementary School | 9,423 | 21.3% |
| Middle School | 8,593 | 19.4% |
| High School | 9,042 | 20.4% |
| College / Undergraduate | 9,136 | 20.6% |
| Graduate / Professional | 2,420 | 5.5% |
| Total | 44,325 | 100.0% |
School Enrollment by Age by Funding Source in Peoria County
Out of a total of 44,325 students who are enrolled in schools in Peoria County, 10,505 (23.7%) attend a private institution, while the remaining 33,820 (76.3%) are enrolled in public schools. The age group of 20 to 24 year olds has the highest likelihood of being enrolled in private schools, with 2,176 (47.1% in the age bracket) enrolled. Conversely, the age group of 15 to 17 year olds has the lowest likelihood of being enrolled in a private school, with 6,001 (89.2% in the age bracket) attending a public institution.
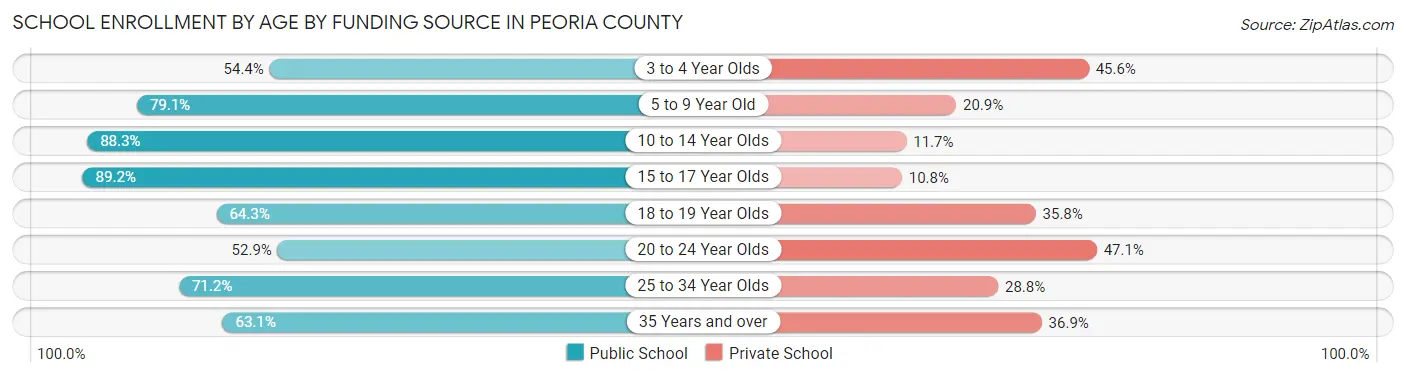
| Age Bracket | Public School | Private School |
| 3 to 4 Year Olds | 1,339 (54.4%) | 1,124 (45.6%) |
| 5 to 9 Year Old | 9,278 (79.1%) | 2,456 (20.9%) |
| 10 to 14 Year Olds | 9,235 (88.3%) | 1,220 (11.7%) |
| 15 to 17 Year Olds | 6,001 (89.2%) | 728 (10.8%) |
| 18 to 19 Year Olds | 2,344 (64.2%) | 1,304 (35.7%) |
| 20 to 24 Year Olds | 2,441 (52.9%) | 2,176 (47.1%) |
| 25 to 34 Year Olds | 1,813 (71.2%) | 732 (28.8%) |
| 35 Years and over | 1,347 (63.1%) | 787 (36.9%) |
| Total | 33,820 (76.3%) | 10,505 (23.7%) |
Educational Attainment by Field of Study in Peoria County
Business (7,449 | 16.8%), science & technology (5,992 | 13.5%), education (5,928 | 13.4%), engineering (5,083 | 11.5%), and bio, nature & agricultural (2,776 | 6.2%) are the most common fields of study among 44,395 individuals in Peoria County who have obtained a bachelor's degree or higher.
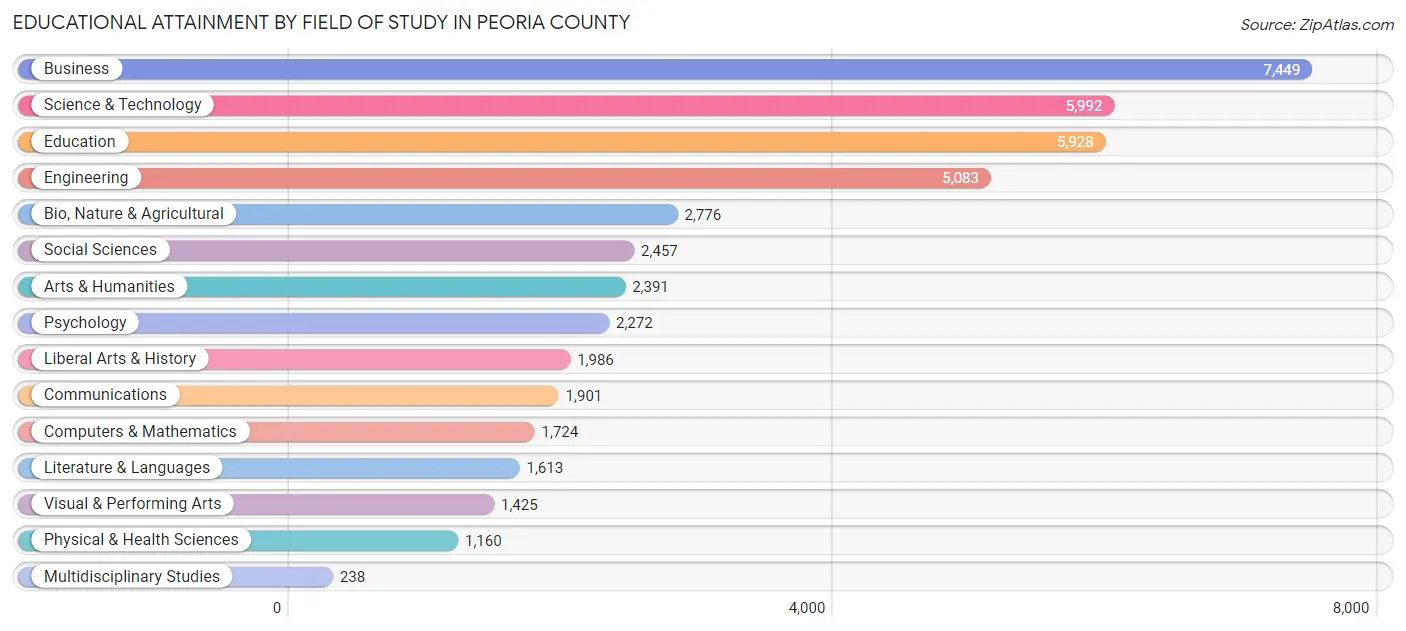
| Field of Study | # Graduates | % Graduates |
| Computers & Mathematics | 1,724 | 3.9% |
| Bio, Nature & Agricultural | 2,776 | 6.2% |
| Physical & Health Sciences | 1,160 | 2.6% |
| Psychology | 2,272 | 5.1% |
| Social Sciences | 2,457 | 5.5% |
| Engineering | 5,083 | 11.5% |
| Multidisciplinary Studies | 238 | 0.5% |
| Science & Technology | 5,992 | 13.5% |
| Business | 7,449 | 16.8% |
| Education | 5,928 | 13.4% |
| Literature & Languages | 1,613 | 3.6% |
| Liberal Arts & History | 1,986 | 4.5% |
| Visual & Performing Arts | 1,425 | 3.2% |
| Communications | 1,901 | 4.3% |
| Arts & Humanities | 2,391 | 5.4% |
| Total | 44,395 | 100.0% |
Transportation & Commute in Peoria County
Vehicle Availability by Sex in Peoria County
The most prevalent vehicle ownership categories in Peoria County are males with 2 vehicles (18,491, accounting for 46.0%) and females with 2 vehicles (15,429, making up 47.0%).
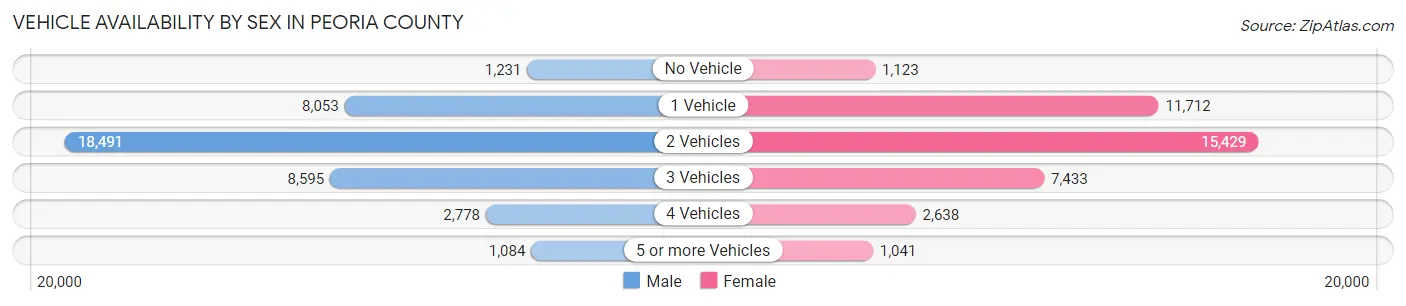
| Vehicles Available | Male | Female |
| No Vehicle | 1,231 (3.1%) | 1,123 (2.9%) |
| 1 Vehicle | 8,053 (20.0%) | 11,712 (29.7%) |
| 2 Vehicles | 18,491 (46.0%) | 15,429 (39.2%) |
| 3 Vehicles | 8,595 (21.4%) | 7,433 (18.9%) |
| 4 Vehicles | 2,778 (6.9%) | 2,638 (6.7%) |
| 5 or more Vehicles | 1,084 (2.7%) | 1,041 (2.6%) |
| Total | 40,232 (100.0%) | 39,376 (100.0%) |
Commute Time in Peoria County
The most frequently occuring commute durations in Peoria County are 15 to 19 minutes (17,086 commuters, 23.3%), 10 to 14 minutes (15,344 commuters, 20.9%), and 20 to 24 minutes (12,111 commuters, 16.5%).
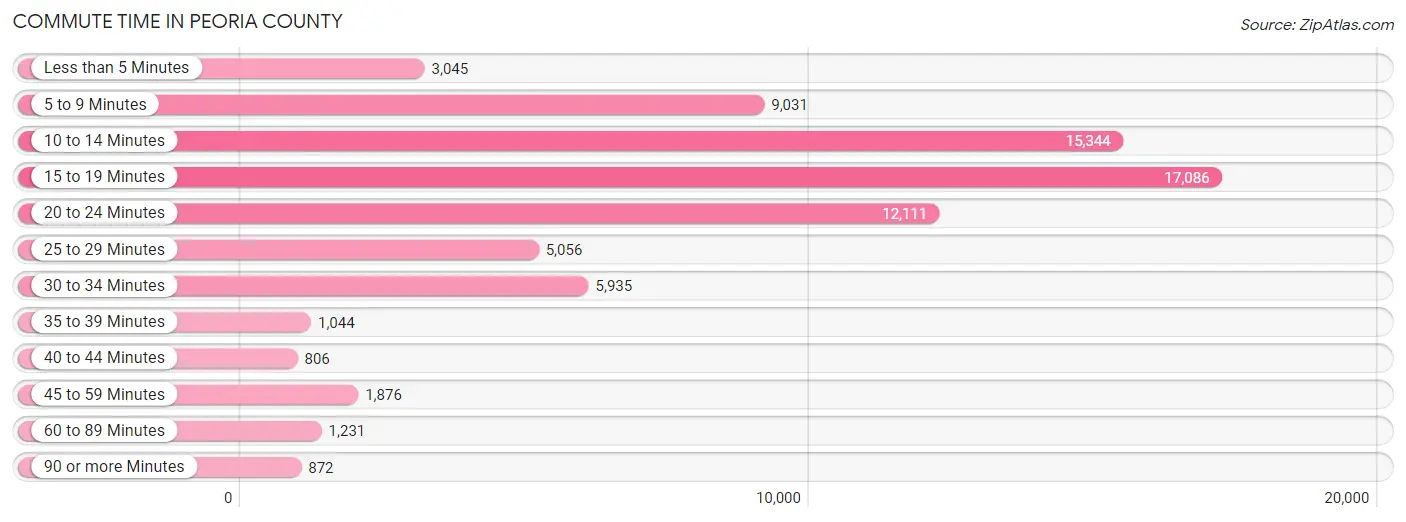
| Commute Time | # Commuters | % Commuters |
| Less than 5 Minutes | 3,045 | 4.2% |
| 5 to 9 Minutes | 9,031 | 12.3% |
| 10 to 14 Minutes | 15,344 | 20.9% |
| 15 to 19 Minutes | 17,086 | 23.3% |
| 20 to 24 Minutes | 12,111 | 16.5% |
| 25 to 29 Minutes | 5,056 | 6.9% |
| 30 to 34 Minutes | 5,935 | 8.1% |
| 35 to 39 Minutes | 1,044 | 1.4% |
| 40 to 44 Minutes | 806 | 1.1% |
| 45 to 59 Minutes | 1,876 | 2.5% |
| 60 to 89 Minutes | 1,231 | 1.7% |
| 90 or more Minutes | 872 | 1.2% |
Commute Time by Sex in Peoria County
The most common commute times in Peoria County are 15 to 19 minutes (8,669 commuters, 23.3%) for males and 15 to 19 minutes (8,417 commuters, 23.2%) for females.
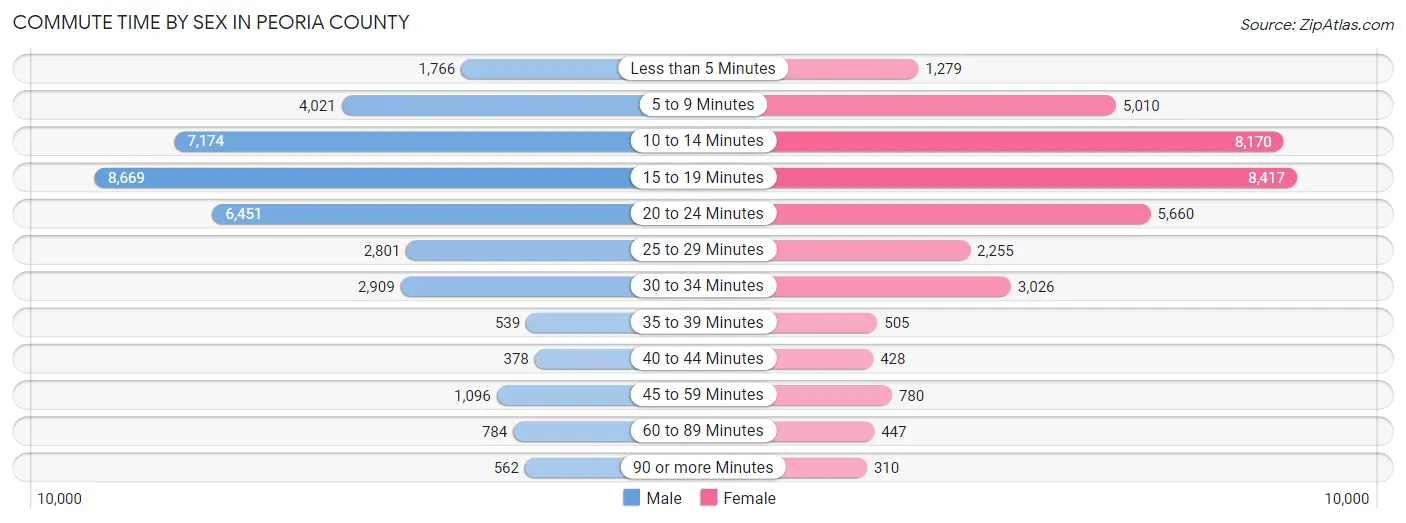
| Commute Time | Male | Female |
| Less than 5 Minutes | 1,766 (4.8%) | 1,279 (3.5%) |
| 5 to 9 Minutes | 4,021 (10.8%) | 5,010 (13.8%) |
| 10 to 14 Minutes | 7,174 (19.3%) | 8,170 (22.5%) |
| 15 to 19 Minutes | 8,669 (23.3%) | 8,417 (23.2%) |
| 20 to 24 Minutes | 6,451 (17.4%) | 5,660 (15.6%) |
| 25 to 29 Minutes | 2,801 (7.5%) | 2,255 (6.2%) |
| 30 to 34 Minutes | 2,909 (7.8%) | 3,026 (8.3%) |
| 35 to 39 Minutes | 539 (1.5%) | 505 (1.4%) |
| 40 to 44 Minutes | 378 (1.0%) | 428 (1.2%) |
| 45 to 59 Minutes | 1,096 (2.9%) | 780 (2.1%) |
| 60 to 89 Minutes | 784 (2.1%) | 447 (1.2%) |
| 90 or more Minutes | 562 (1.5%) | 310 (0.9%) |
Time of Departure to Work by Sex in Peoria County
The most frequent times of departure to work in Peoria County are 7:30 AM to 7:59 AM (4,556, 12.3%) for males and 7:30 AM to 7:59 AM (5,812, 16.0%) for females.
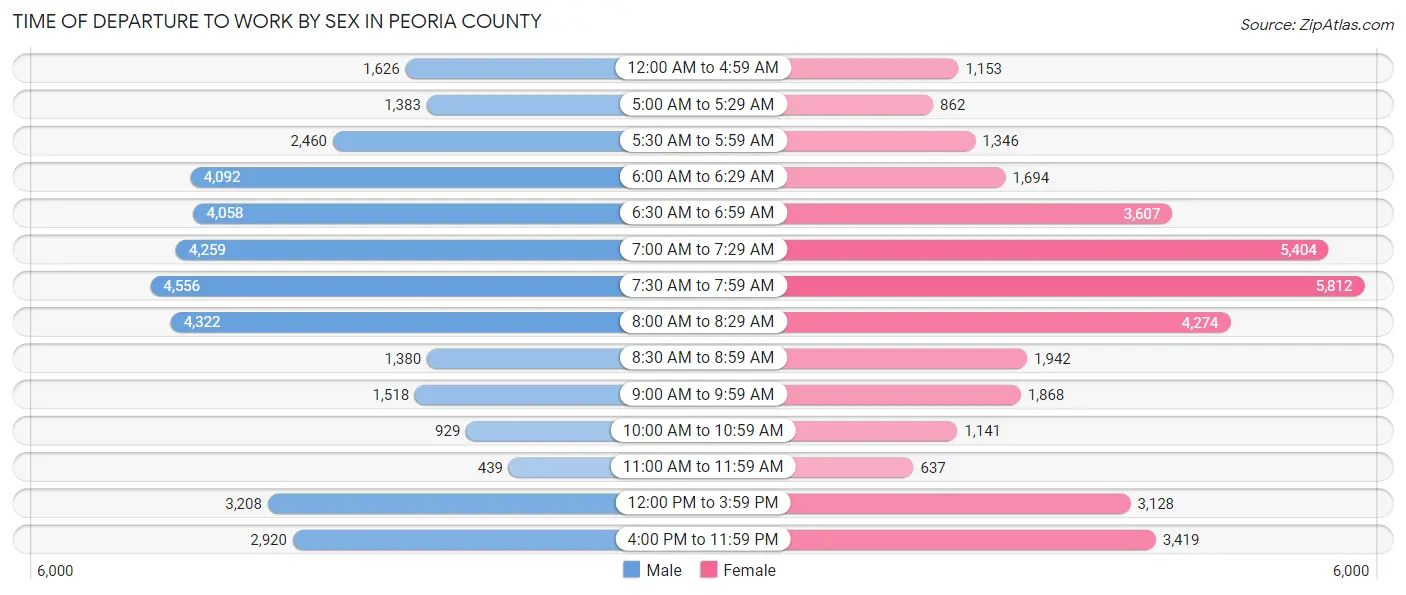
| Time of Departure | Male | Female |
| 12:00 AM to 4:59 AM | 1,626 (4.4%) | 1,153 (3.2%) |
| 5:00 AM to 5:29 AM | 1,383 (3.7%) | 862 (2.4%) |
| 5:30 AM to 5:59 AM | 2,460 (6.6%) | 1,346 (3.7%) |
| 6:00 AM to 6:29 AM | 4,092 (11.0%) | 1,694 (4.7%) |
| 6:30 AM to 6:59 AM | 4,058 (10.9%) | 3,607 (9.9%) |
| 7:00 AM to 7:29 AM | 4,259 (11.5%) | 5,404 (14.9%) |
| 7:30 AM to 7:59 AM | 4,556 (12.3%) | 5,812 (16.0%) |
| 8:00 AM to 8:29 AM | 4,322 (11.6%) | 4,274 (11.8%) |
| 8:30 AM to 8:59 AM | 1,380 (3.7%) | 1,942 (5.3%) |
| 9:00 AM to 9:59 AM | 1,518 (4.1%) | 1,868 (5.1%) |
| 10:00 AM to 10:59 AM | 929 (2.5%) | 1,141 (3.1%) |
| 11:00 AM to 11:59 AM | 439 (1.2%) | 637 (1.8%) |
| 12:00 PM to 3:59 PM | 3,208 (8.6%) | 3,128 (8.6%) |
| 4:00 PM to 11:59 PM | 2,920 (7.9%) | 3,419 (9.4%) |
| Total | 37,150 (100.0%) | 36,287 (100.0%) |
Housing Occupancy in Peoria County
Occupancy by Ownership in Peoria County
Of the total 76,414 dwellings in Peoria County, owner-occupied units account for 50,062 (65.5%), while renter-occupied units make up 26,352 (34.5%).
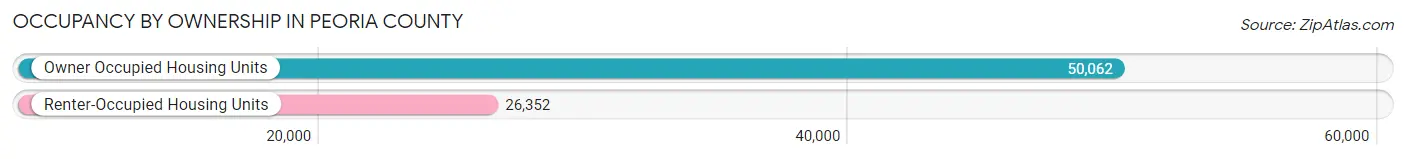
| Occupancy | # Housing Units | % Housing Units |
| Owner Occupied Housing Units | 50,062 | 65.5% |
| Renter-Occupied Housing Units | 26,352 | 34.5% |
| Total Occupied Housing Units | 76,414 | 100.0% |
Occupancy by Household Size in Peoria County
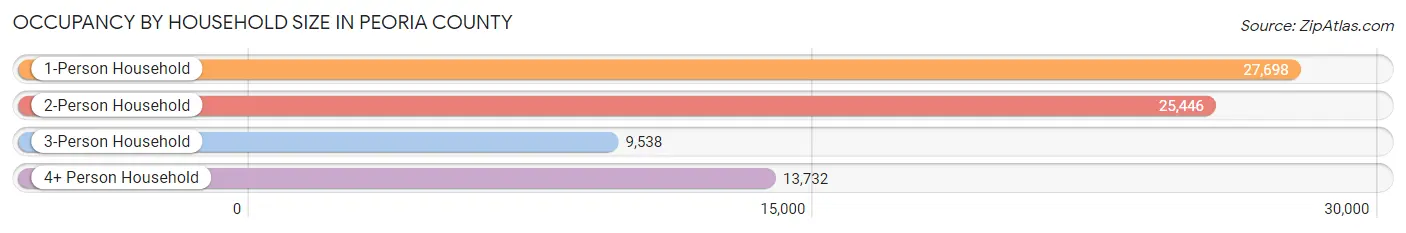
| Household Size | # Housing Units | % Housing Units |
| 1-Person Household | 27,698 | 36.2% |
| 2-Person Household | 25,446 | 33.3% |
| 3-Person Household | 9,538 | 12.5% |
| 4+ Person Household | 13,732 | 18.0% |
| Total Housing Units | 76,414 | 100.0% |
Occupancy by Ownership by Household Size in Peoria County
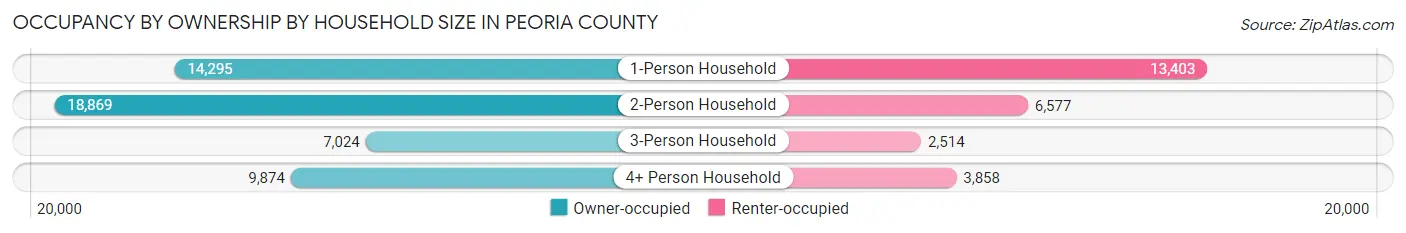
| Household Size | Owner-occupied | Renter-occupied |
| 1-Person Household | 14,295 (51.6%) | 13,403 (48.4%) |
| 2-Person Household | 18,869 (74.2%) | 6,577 (25.9%) |
| 3-Person Household | 7,024 (73.6%) | 2,514 (26.4%) |
| 4+ Person Household | 9,874 (71.9%) | 3,858 (28.1%) |
| Total Housing Units | 50,062 (65.5%) | 26,352 (34.5%) |
Occupancy by Educational Attainment in Peoria County
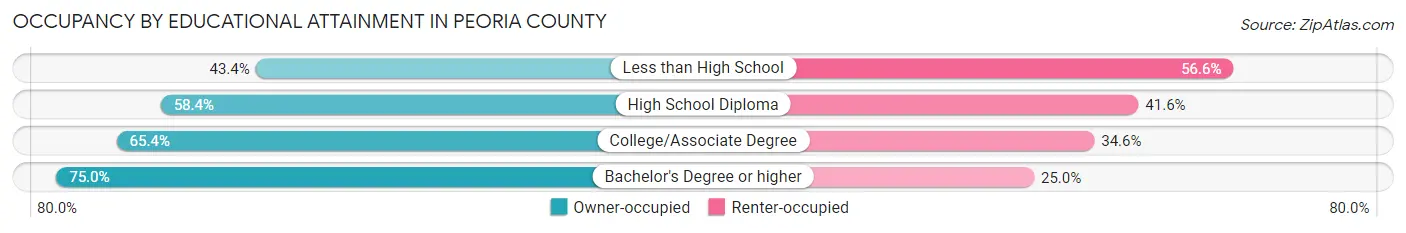
| Household Size | Owner-occupied | Renter-occupied |
| Less than High School | 2,276 (43.4%) | 2,972 (56.6%) |
| High School Diploma | 10,937 (58.4%) | 7,786 (41.6%) |
| College/Associate Degree | 16,838 (65.4%) | 8,910 (34.6%) |
| Bachelor's Degree or higher | 20,011 (75.0%) | 6,684 (25.0%) |
Occupancy by Age of Householder in Peoria County
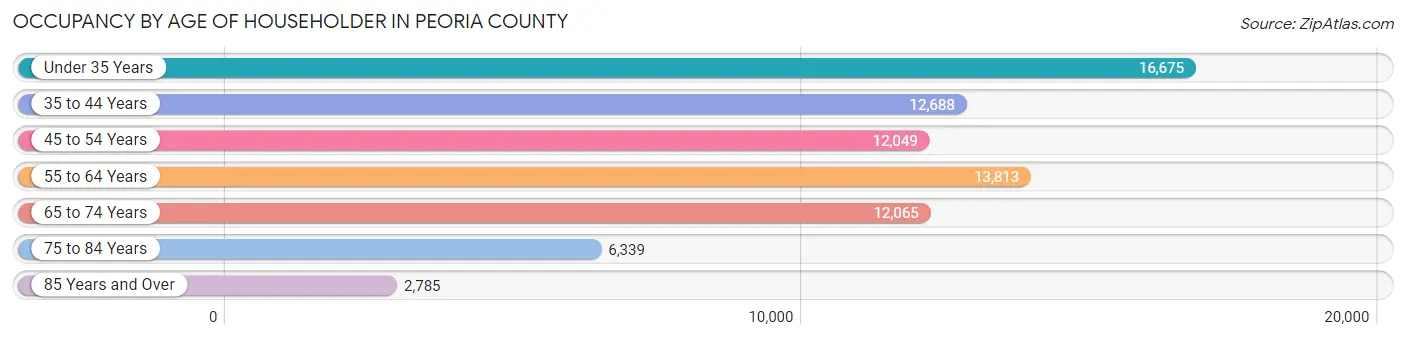
| Age Bracket | # Households | % Households |
| Under 35 Years | 16,675 | 21.8% |
| 35 to 44 Years | 12,688 | 16.6% |
| 45 to 54 Years | 12,049 | 15.8% |
| 55 to 64 Years | 13,813 | 18.1% |
| 65 to 74 Years | 12,065 | 15.8% |
| 75 to 84 Years | 6,339 | 8.3% |
| 85 Years and Over | 2,785 | 3.6% |
| Total | 76,414 | 100.0% |
Housing Finances in Peoria County
Median Income by Occupancy in Peoria County
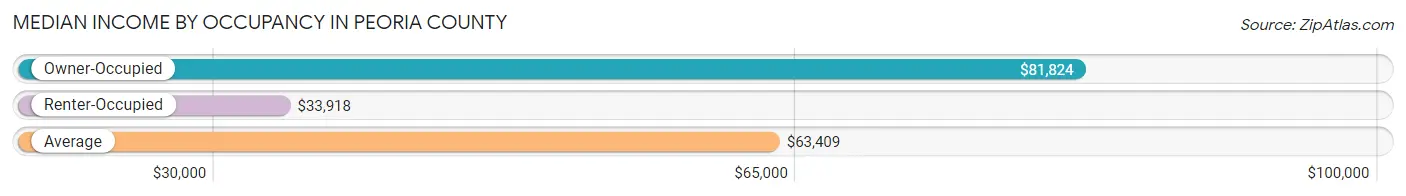
| Occupancy Type | # Households | Median Income |
| Owner-Occupied | 50,062 (65.5%) | $81,824 |
| Renter-Occupied | 26,352 (34.5%) | $33,918 |
| Average | 76,414 (100.0%) | $63,409 |
Occupancy by Householder Income Bracket in Peoria County
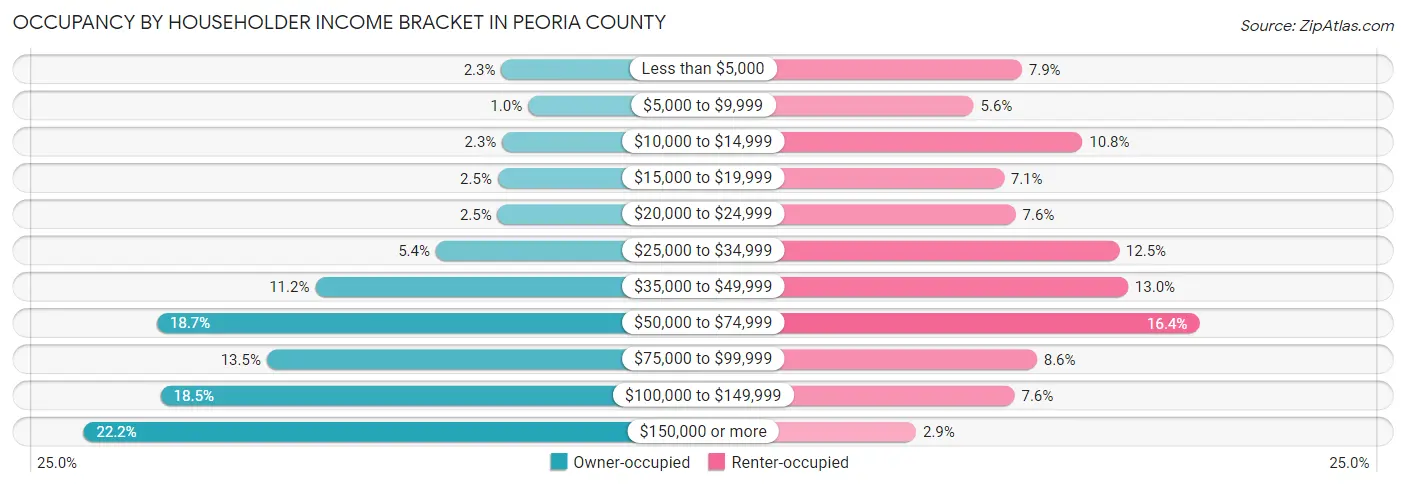
| Income Bracket | Owner-occupied | Renter-occupied |
| Less than $5,000 | 1,149 (2.3%) | 2,088 (7.9%) |
| $5,000 to $9,999 | 516 (1.0%) | 1,482 (5.6%) |
| $10,000 to $14,999 | 1,132 (2.3%) | 2,847 (10.8%) |
| $15,000 to $19,999 | 1,237 (2.5%) | 1,861 (7.1%) |
| $20,000 to $24,999 | 1,242 (2.5%) | 2,007 (7.6%) |
| $25,000 to $34,999 | 2,714 (5.4%) | 3,305 (12.5%) |
| $35,000 to $49,999 | 5,586 (11.2%) | 3,419 (13.0%) |
| $50,000 to $74,999 | 9,361 (18.7%) | 4,312 (16.4%) |
| $75,000 to $99,999 | 6,741 (13.5%) | 2,275 (8.6%) |
| $100,000 to $149,999 | 9,269 (18.5%) | 1,996 (7.6%) |
| $150,000 or more | 11,115 (22.2%) | 760 (2.9%) |
| Total | 50,062 (100.0%) | 26,352 (100.0%) |
Monthly Housing Cost Tiers in Peoria County

| Monthly Cost | Owner-occupied | Renter-occupied |
| Less than $300 | 1,694 (3.4%) | 1,135 (4.3%) |
| $300 to $499 | 5,581 (11.2%) | 1,569 (5.9%) |
| $500 to $799 | 10,018 (20.0%) | 6,261 (23.8%) |
| $800 to $999 | 6,548 (13.1%) | 6,678 (25.3%) |
| $1,000 to $1,499 | 11,959 (23.9%) | 7,733 (29.3%) |
| $1,500 to $1,999 | 6,755 (13.5%) | 1,249 (4.7%) |
| $2,000 to $2,499 | 3,276 (6.5%) | 411 (1.6%) |
| $2,500 to $2,999 | 1,629 (3.3%) | 105 (0.4%) |
| $3,000 or more | 2,602 (5.2%) | 105 (0.4%) |
| Total | 50,062 (100.0%) | 26,352 (100.0%) |
Physical Housing Characteristics in Peoria County
Housing Structures in Peoria County
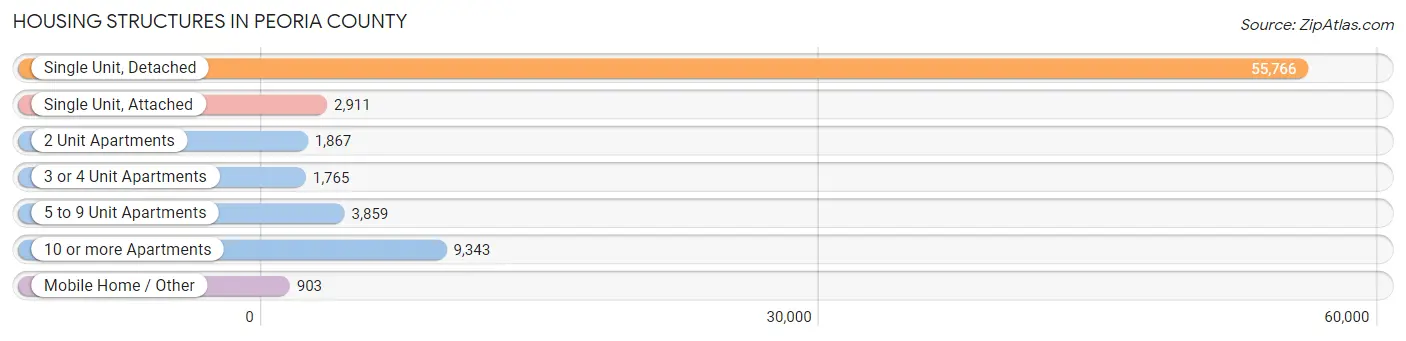
| Structure Type | # Housing Units | % Housing Units |
| Single Unit, Detached | 55,766 | 73.0% |
| Single Unit, Attached | 2,911 | 3.8% |
| 2 Unit Apartments | 1,867 | 2.4% |
| 3 or 4 Unit Apartments | 1,765 | 2.3% |
| 5 to 9 Unit Apartments | 3,859 | 5.1% |
| 10 or more Apartments | 9,343 | 12.2% |
| Mobile Home / Other | 903 | 1.2% |
| Total | 76,414 | 100.0% |
Housing Structures by Occupancy in Peoria County
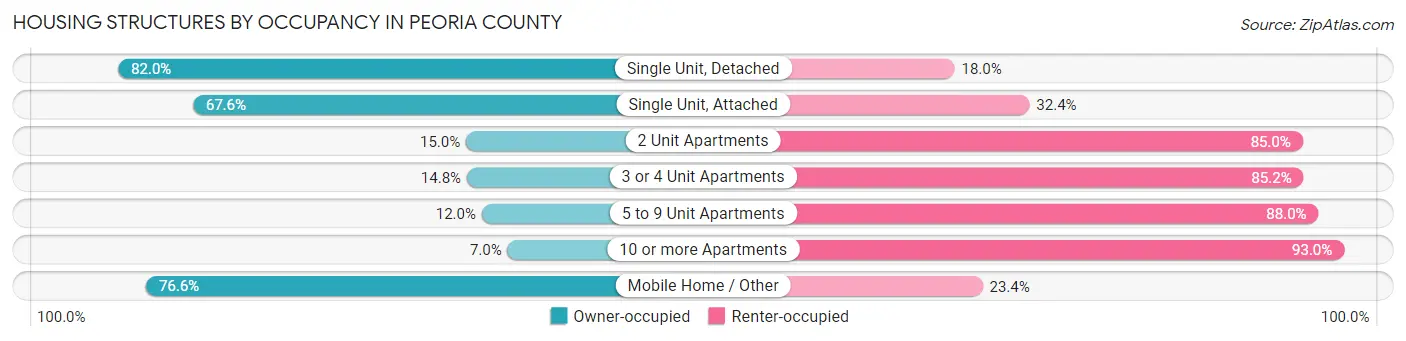
| Structure Type | Owner-occupied | Renter-occupied |
| Single Unit, Detached | 45,742 (82.0%) | 10,024 (18.0%) |
| Single Unit, Attached | 1,968 (67.6%) | 943 (32.4%) |
| 2 Unit Apartments | 280 (15.0%) | 1,587 (85.0%) |
| 3 or 4 Unit Apartments | 262 (14.8%) | 1,503 (85.2%) |
| 5 to 9 Unit Apartments | 462 (12.0%) | 3,397 (88.0%) |
| 10 or more Apartments | 656 (7.0%) | 8,687 (93.0%) |
| Mobile Home / Other | 692 (76.6%) | 211 (23.4%) |
| Total | 50,062 (65.5%) | 26,352 (34.5%) |
Housing Structures by Number of Rooms in Peoria County
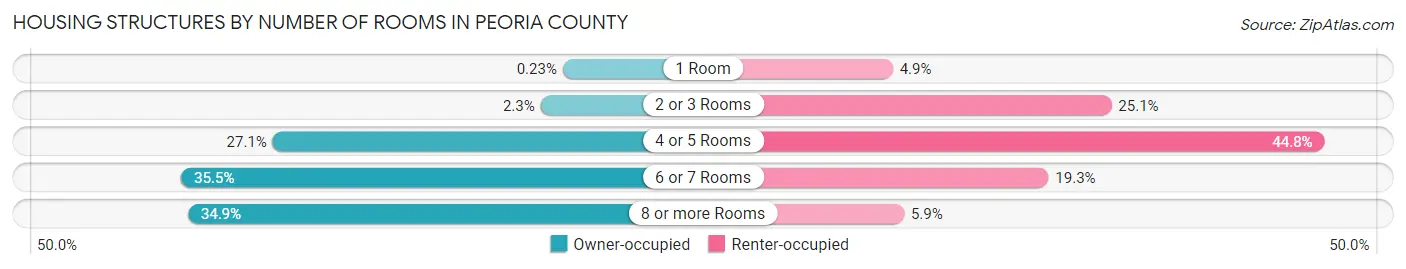
| Number of Rooms | Owner-occupied | Renter-occupied |
| 1 Room | 113 (0.2%) | 1,286 (4.9%) |
| 2 or 3 Rooms | 1,143 (2.3%) | 6,617 (25.1%) |
| 4 or 5 Rooms | 13,546 (27.1%) | 11,809 (44.8%) |
| 6 or 7 Rooms | 17,787 (35.5%) | 5,081 (19.3%) |
| 8 or more Rooms | 17,473 (34.9%) | 1,559 (5.9%) |
| Total | 50,062 (100.0%) | 26,352 (100.0%) |
Housing Structure by Heating Type in Peoria County
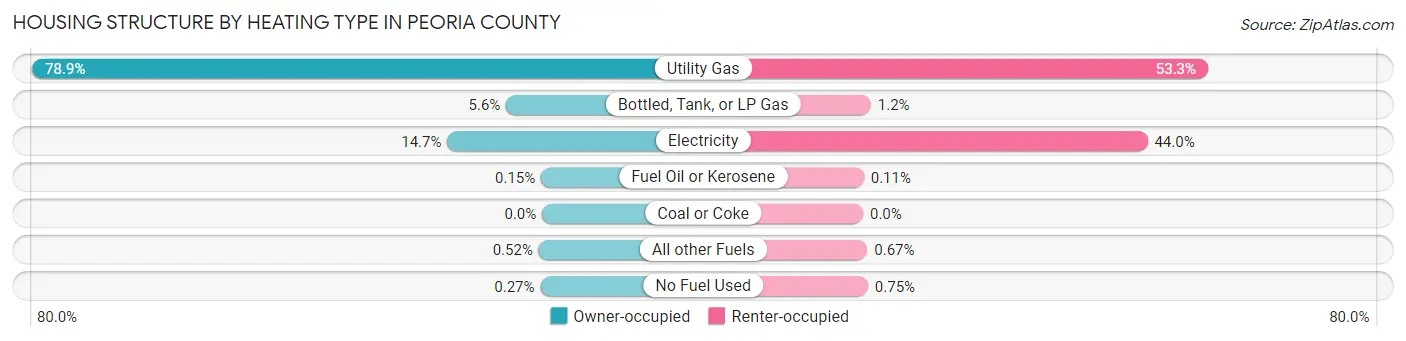
| Heating Type | Owner-occupied | Renter-occupied |
| Utility Gas | 39,472 (78.8%) | 14,046 (53.3%) |
| Bottled, Tank, or LP Gas | 2,780 (5.6%) | 318 (1.2%) |
| Electricity | 7,338 (14.7%) | 11,586 (44.0%) |
| Fuel Oil or Kerosene | 76 (0.2%) | 29 (0.1%) |
| Coal or Coke | 0 (0.0%) | 0 (0.0%) |
| All other Fuels | 261 (0.5%) | 176 (0.7%) |
| No Fuel Used | 135 (0.3%) | 197 (0.7%) |
| Total | 50,062 (100.0%) | 26,352 (100.0%) |
Household Vehicle Usage in Peoria County
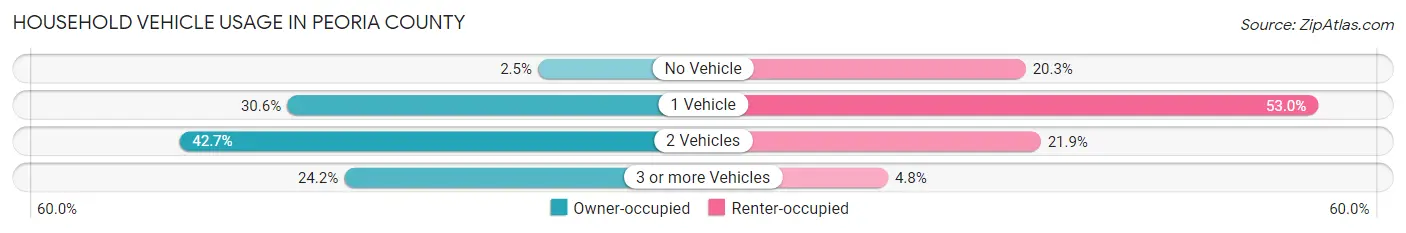
| Vehicles per Household | Owner-occupied | Renter-occupied |
| No Vehicle | 1,259 (2.5%) | 5,337 (20.3%) |
| 1 Vehicle | 15,322 (30.6%) | 13,967 (53.0%) |
| 2 Vehicles | 21,358 (42.7%) | 5,779 (21.9%) |
| 3 or more Vehicles | 12,123 (24.2%) | 1,269 (4.8%) |
| Total | 50,062 (100.0%) | 26,352 (100.0%) |
Real Estate & Mortgages in Peoria County
Real Estate and Mortgage Overview in Peoria County
| Characteristic | Without Mortgage | With Mortgage |
| Housing Units | 19,865 | 30,197 |
| Median Property Value | $143,400 | $154,800 |
| Median Household Income | $63,343 | $7,860 |
| Monthly Housing Costs | $612 | $2,573 |
| Real Estate Taxes | $3,129 | $271 |
Property Value by Mortgage Status in Peoria County
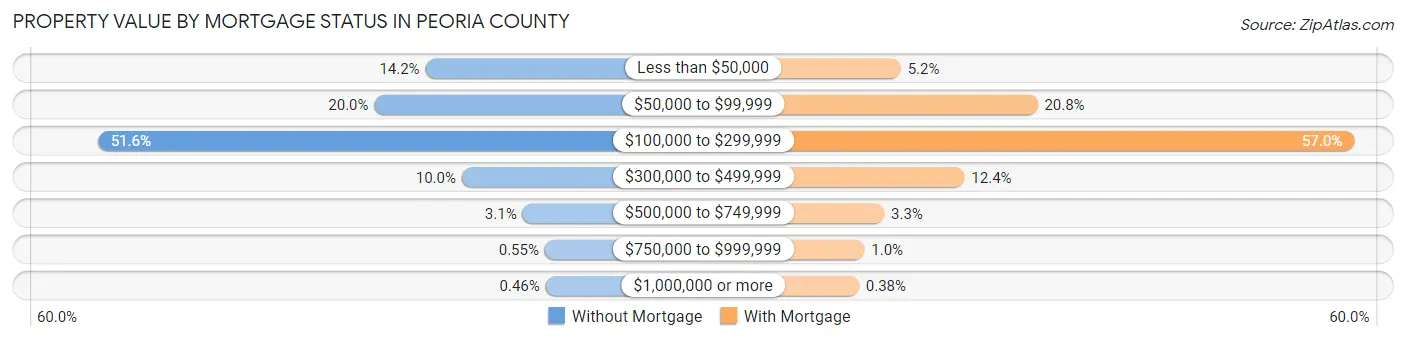
| Property Value | Without Mortgage | With Mortgage |
| Less than $50,000 | 2,818 (14.2%) | 1,557 (5.2%) |
| $50,000 to $99,999 | 3,978 (20.0%) | 6,278 (20.8%) |
| $100,000 to $299,999 | 10,259 (51.6%) | 17,205 (57.0%) |
| $300,000 to $499,999 | 1,994 (10.0%) | 3,755 (12.4%) |
| $500,000 to $749,999 | 615 (3.1%) | 983 (3.3%) |
| $750,000 to $999,999 | 109 (0.5%) | 304 (1.0%) |
| $1,000,000 or more | 92 (0.5%) | 115 (0.4%) |
| Total | 19,865 (100.0%) | 30,197 (100.0%) |
Household Income by Mortgage Status in Peoria County
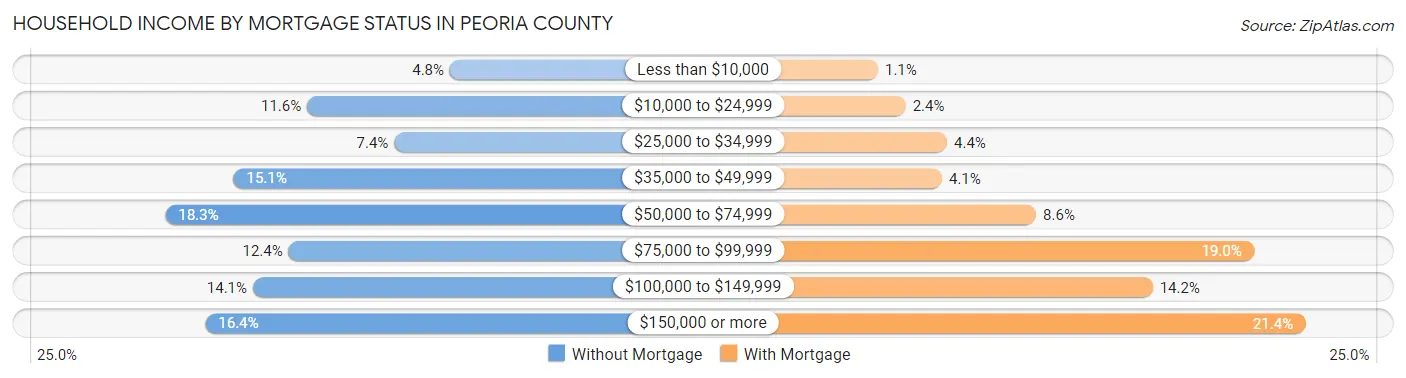
| Household Income | Without Mortgage | With Mortgage |
| Less than $10,000 | 944 (4.8%) | 322 (1.1%) |
| $10,000 to $24,999 | 2,295 (11.6%) | 721 (2.4%) |
| $25,000 to $34,999 | 1,471 (7.4%) | 1,316 (4.4%) |
| $35,000 to $49,999 | 2,989 (15.0%) | 1,243 (4.1%) |
| $50,000 to $74,999 | 3,636 (18.3%) | 2,597 (8.6%) |
| $75,000 to $99,999 | 2,469 (12.4%) | 5,725 (19.0%) |
| $100,000 to $149,999 | 2,806 (14.1%) | 4,272 (14.1%) |
| $150,000 or more | 3,255 (16.4%) | 6,463 (21.4%) |
| Total | 19,865 (100.0%) | 30,197 (100.0%) |
Property Value to Household Income Ratio in Peoria County
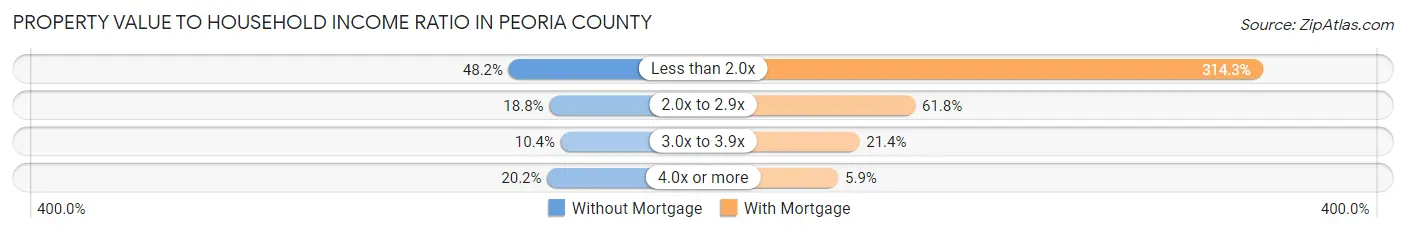
| Value-to-Income Ratio | Without Mortgage | With Mortgage |
| Less than 2.0x | 9,574 (48.2%) | 94,907 (314.3%) |
| 2.0x to 2.9x | 3,726 (18.8%) | 18,671 (61.8%) |
| 3.0x to 3.9x | 2,071 (10.4%) | 6,449 (21.4%) |
| 4.0x or more | 4,020 (20.2%) | 1,788 (5.9%) |
| Total | 19,865 (100.0%) | 30,197 (100.0%) |
Real Estate Taxes by Mortgage Status in Peoria County
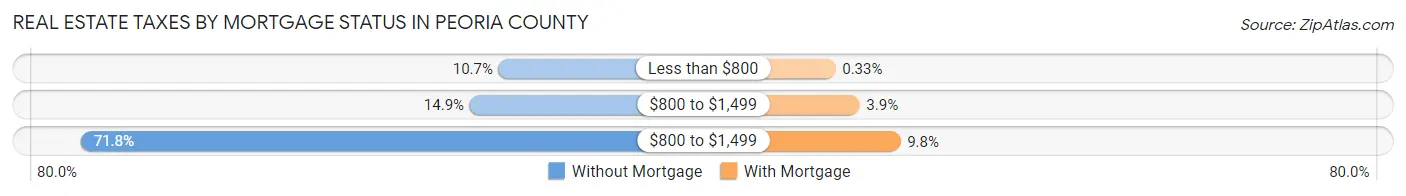
| Property Taxes | Without Mortgage | With Mortgage |
| Less than $800 | 2,128 (10.7%) | 101 (0.3%) |
| $800 to $1,499 | 2,965 (14.9%) | 1,162 (3.8%) |
| $800 to $1,499 | 14,260 (71.8%) | 2,963 (9.8%) |
| Total | 19,865 (100.0%) | 30,197 (100.0%) |
Health & Disability in Peoria County
Health Insurance Coverage by Age in Peoria County
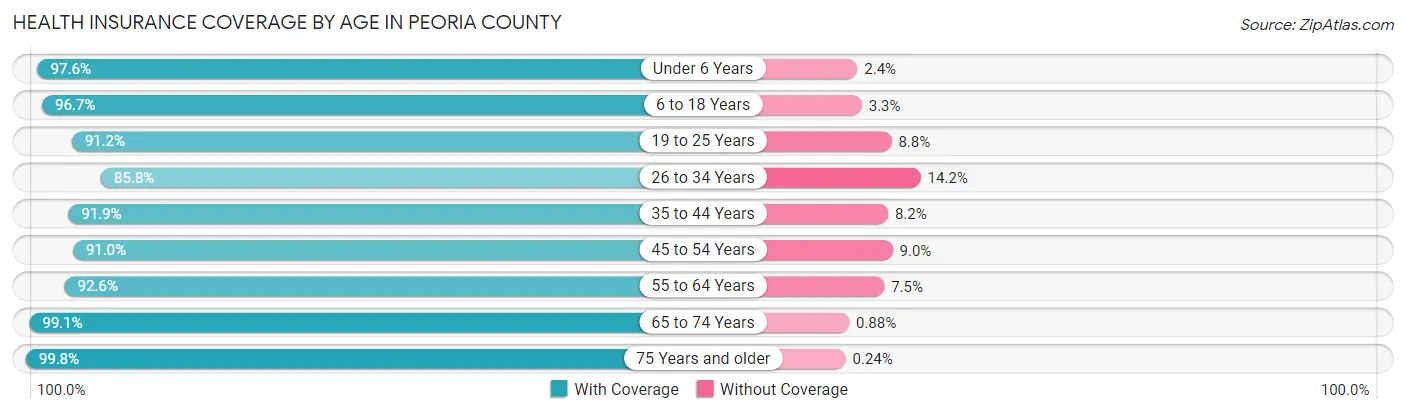
| Age Bracket | With Coverage | Without Coverage |
| Under 6 Years | 14,062 (97.6%) | 351 (2.4%) |
| 6 to 18 Years | 29,891 (96.7%) | 1,008 (3.3%) |
| 19 to 25 Years | 14,917 (91.2%) | 1,438 (8.8%) |
| 26 to 34 Years | 18,218 (85.8%) | 3,026 (14.2%) |
| 35 to 44 Years | 20,381 (91.8%) | 1,808 (8.2%) |
| 45 to 54 Years | 19,028 (91.0%) | 1,884 (9.0%) |
| 55 to 64 Years | 20,610 (92.5%) | 1,660 (7.4%) |
| 65 to 74 Years | 17,951 (99.1%) | 160 (0.9%) |
| 75 Years and older | 12,575 (99.8%) | 30 (0.2%) |
| Total | 167,633 (93.6%) | 11,365 (6.4%) |
Health Insurance Coverage by Citizenship Status in Peoria County
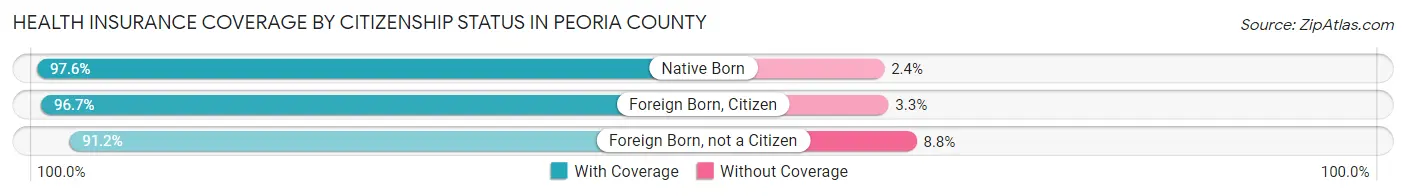
| Citizenship Status | With Coverage | Without Coverage |
| Native Born | 14,062 (97.6%) | 351 (2.4%) |
| Foreign Born, Citizen | 29,891 (96.7%) | 1,008 (3.3%) |
| Foreign Born, not a Citizen | 14,917 (91.2%) | 1,438 (8.8%) |
Health Insurance Coverage by Household Income in Peoria County
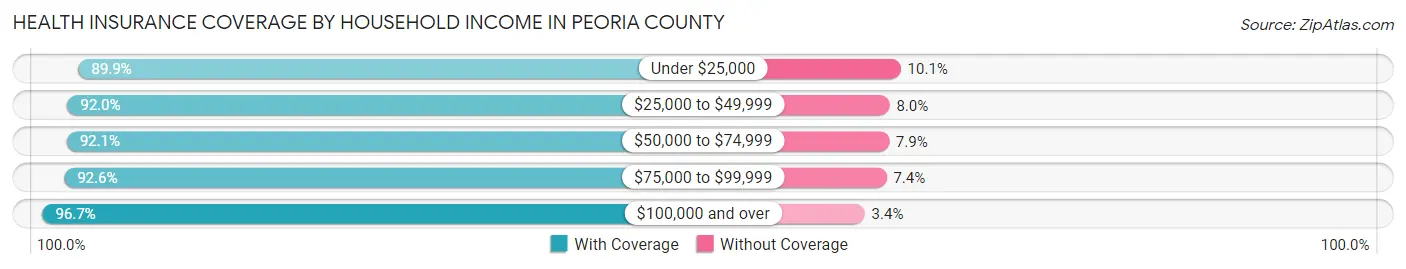
| Household Income | With Coverage | Without Coverage |
| Under $25,000 | 22,567 (89.9%) | 2,532 (10.1%) |
| $25,000 to $49,999 | 28,142 (92.0%) | 2,446 (8.0%) |
| $50,000 to $74,999 | 27,206 (92.1%) | 2,332 (7.9%) |
| $75,000 to $99,999 | 20,715 (92.6%) | 1,663 (7.4%) |
| $100,000 and over | 66,174 (96.7%) | 2,295 (3.4%) |
Public vs Private Health Insurance Coverage by Age in Peoria County
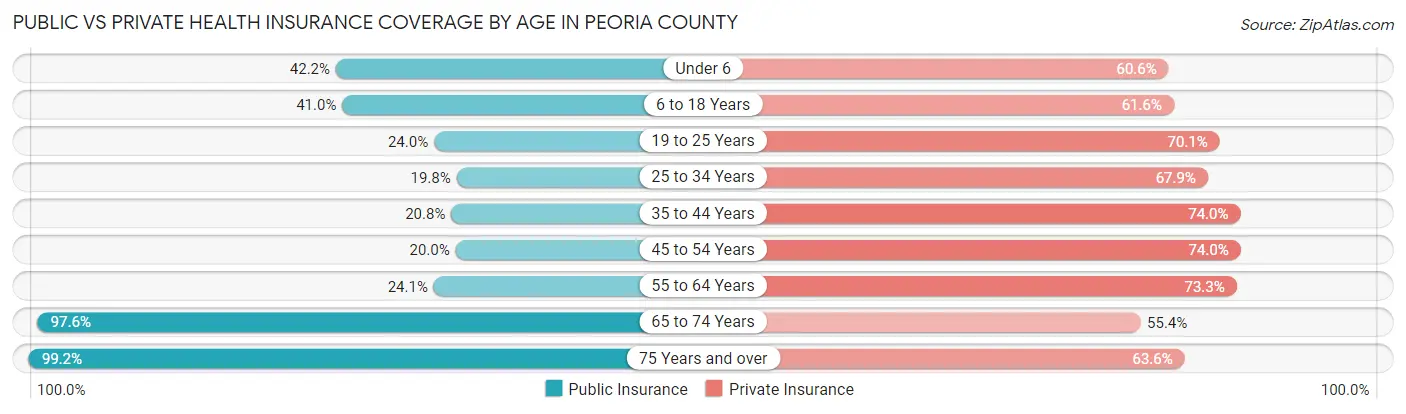
| Age Bracket | Public Insurance | Private Insurance |
| Under 6 | 6,086 (42.2%) | 8,740 (60.6%) |
| 6 to 18 Years | 12,680 (41.0%) | 19,036 (61.6%) |
| 19 to 25 Years | 3,927 (24.0%) | 11,470 (70.1%) |
| 25 to 34 Years | 4,213 (19.8%) | 14,427 (67.9%) |
| 35 to 44 Years | 4,618 (20.8%) | 16,412 (74.0%) |
| 45 to 54 Years | 4,185 (20.0%) | 15,481 (74.0%) |
| 55 to 64 Years | 5,358 (24.1%) | 16,316 (73.3%) |
| 65 to 74 Years | 17,671 (97.6%) | 10,028 (55.4%) |
| 75 Years and over | 12,507 (99.2%) | 8,018 (63.6%) |
| Total | 71,245 (39.8%) | 119,928 (67.0%) |
Disability Status by Sex by Age in Peoria County
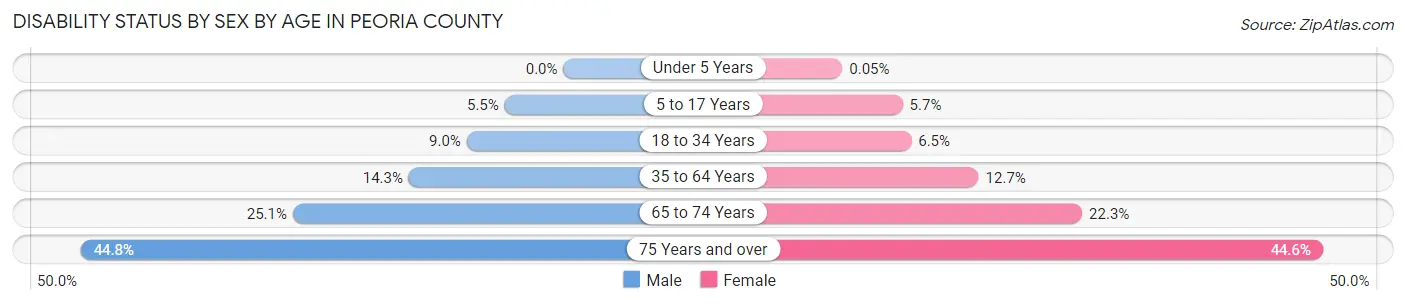
| Age Bracket | Male | Female |
| Under 5 Years | 0 (0.0%) | 3 (0.1%) |
| 5 to 17 Years | 864 (5.4%) | 846 (5.7%) |
| 18 to 34 Years | 1,762 (9.0%) | 1,314 (6.5%) |
| 35 to 64 Years | 4,592 (14.3%) | 4,236 (12.7%) |
| 65 to 74 Years | 2,142 (25.1%) | 2,138 (22.3%) |
| 75 Years and over | 2,332 (44.8%) | 3,302 (44.6%) |
Disability Class by Sex by Age in Peoria County
Disability Class: Hearing Difficulty
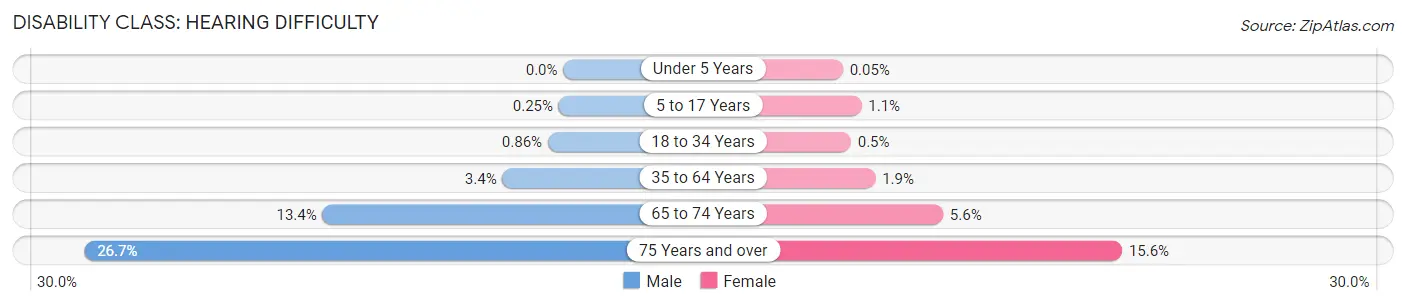
| Age Bracket | Male | Female |
| Under 5 Years | 0 (0.0%) | 3 (0.1%) |
| 5 to 17 Years | 39 (0.3%) | 163 (1.1%) |
| 18 to 34 Years | 169 (0.9%) | 102 (0.5%) |
| 35 to 64 Years | 1,087 (3.4%) | 620 (1.9%) |
| 65 to 74 Years | 1,144 (13.4%) | 539 (5.6%) |
| 75 Years and over | 1,389 (26.7%) | 1,154 (15.6%) |
Disability Class: Vision Difficulty
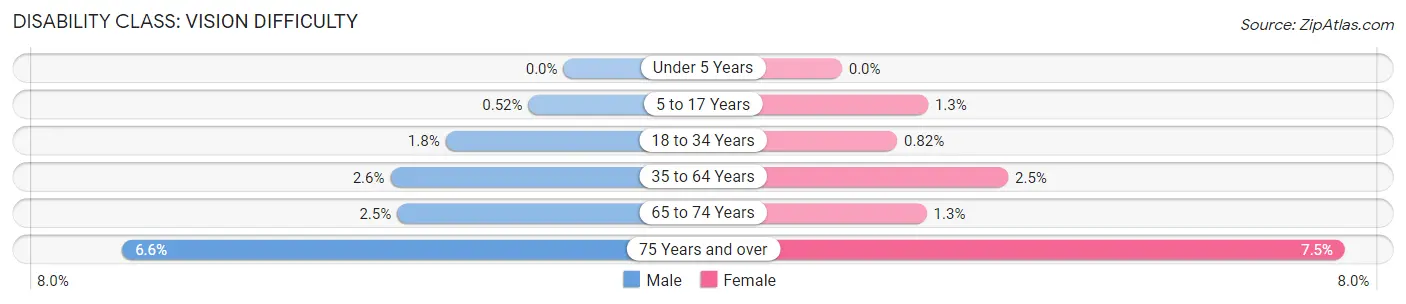
| Age Bracket | Male | Female |
| Under 5 Years | 0 (0.0%) | 0 (0.0%) |
| 5 to 17 Years | 83 (0.5%) | 192 (1.3%) |
| 18 to 34 Years | 344 (1.8%) | 167 (0.8%) |
| 35 to 64 Years | 822 (2.6%) | 825 (2.5%) |
| 65 to 74 Years | 211 (2.5%) | 121 (1.3%) |
| 75 Years and over | 341 (6.6%) | 553 (7.5%) |
Disability Class: Cognitive Difficulty
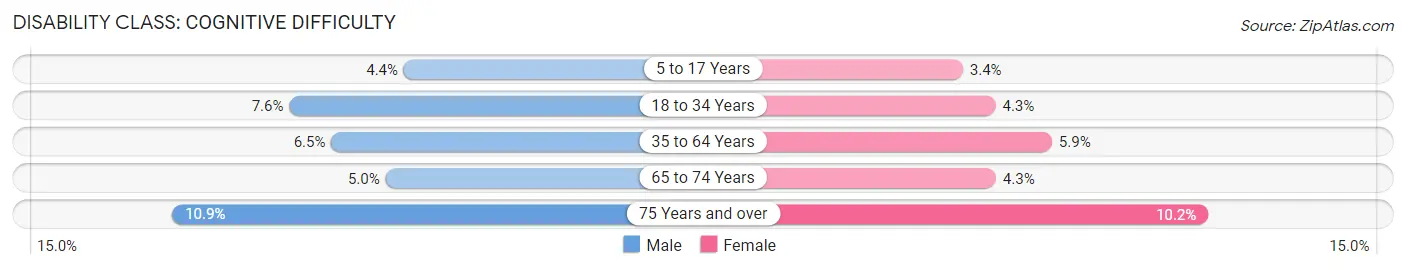
| Age Bracket | Male | Female |
| 5 to 17 Years | 704 (4.4%) | 505 (3.4%) |
| 18 to 34 Years | 1,499 (7.6%) | 871 (4.3%) |
| 35 to 64 Years | 2,070 (6.5%) | 1,951 (5.9%) |
| 65 to 74 Years | 422 (5.0%) | 411 (4.3%) |
| 75 Years and over | 567 (10.9%) | 755 (10.2%) |
Disability Class: Ambulatory Difficulty

| Age Bracket | Male | Female |
| 5 to 17 Years | 63 (0.4%) | 69 (0.5%) |
| 18 to 34 Years | 298 (1.5%) | 203 (1.0%) |
| 35 to 64 Years | 2,225 (7.0%) | 2,157 (6.5%) |
| 65 to 74 Years | 1,119 (13.1%) | 1,670 (17.4%) |
| 75 Years and over | 1,473 (28.3%) | 2,402 (32.5%) |
Disability Class: Self-Care Difficulty
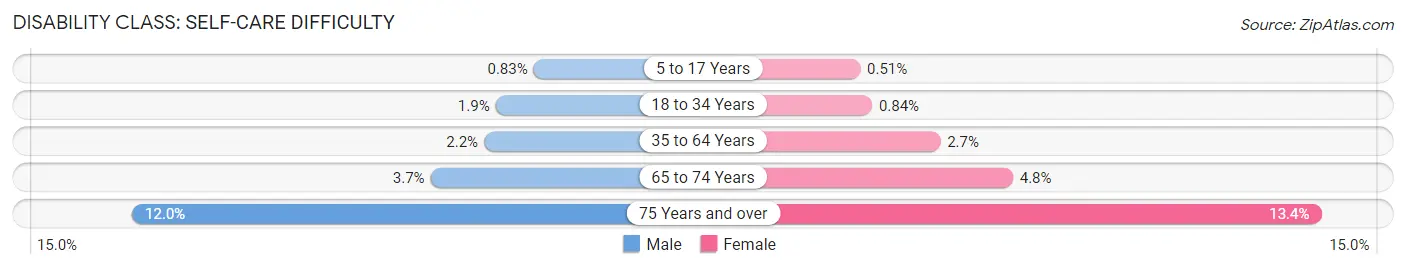
| Age Bracket | Male | Female |
| 5 to 17 Years | 132 (0.8%) | 77 (0.5%) |
| 18 to 34 Years | 371 (1.9%) | 171 (0.8%) |
| 35 to 64 Years | 709 (2.2%) | 913 (2.7%) |
| 65 to 74 Years | 316 (3.7%) | 456 (4.8%) |
| 75 Years and over | 625 (12.0%) | 988 (13.4%) |
Technology Access in Peoria County
Computing Device Access in Peoria County

| Device Type | # Households | % Households |
| Desktop or Laptop | 55,901 | 73.2% |
| Smartphone | 66,090 | 86.5% |
| Tablet | 44,229 | 57.9% |
| No Computing Device | 5,908 | 7.7% |
| Total | 76,414 | 100.0% |
Internet Access in Peoria County
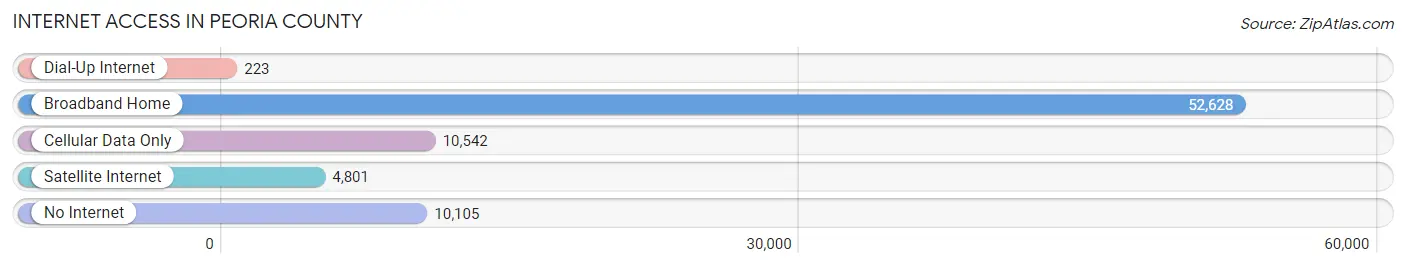
| Internet Type | # Households | % Households |
| Dial-Up Internet | 223 | 0.3% |
| Broadband Home | 52,628 | 68.9% |
| Cellular Data Only | 10,542 | 13.8% |
| Satellite Internet | 4,801 | 6.3% |
| No Internet | 10,105 | 13.2% |
| Total | 76,414 | 100.0% |
Peoria County Summary
Peoria County is located in the central part of the state of Illinois, in the United States. It is part of the Peoria, IL Metropolitan Statistical Area, and is bordered by Fulton County to the north, Tazewell County to the east, Woodford County to the south, and Marshall and Stark Counties to the west. The county seat is Peoria, the largest city in the county.
Geography
Peoria County covers an area of 645 square miles, making it the fourth largest county in Illinois. The county is located in the central part of the state, and is part of the Midwest Plains region. The terrain is mostly flat, with some rolling hills in the northern part of the county. The Illinois River forms the eastern border of the county, and the Spoon River forms the western border. The county is home to several small lakes, including Lake Camelot, Lake Wildwood, and Lake Thunderbird.
The climate of Peoria County is humid continental, with hot, humid summers and cold, snowy winters. The average annual temperature is around 50°F, and the average annual precipitation is around 40 inches.
Demographics
As of the 2010 United States Census, Peoria County had a population of 186,494. The racial makeup of the county was 79.2% White, 15.2% African American, 0.5% Native American, 1.7% Asian, 0.1% Pacific Islander, 1.3% from other races, and 2.1% from two or more races. Hispanic or Latino of any race were 4.2% of the population.
The median household income in Peoria County was $50,945 in 2017, and the median family income was $62,917. The per capita income was $26,845. About 11.2% of the population was below the poverty line.
Economy
Peoria County is home to several major employers, including Caterpillar Inc., OSF Healthcare, and UnityPoint Health. The county is also home to several universities and colleges, including Bradley University, Illinois Central College, and Midstate College.
Agriculture is an important part of the economy in Peoria County. The county is home to several large farms, and the main crops grown in the county are corn, soybeans, and wheat. Livestock production is also important, with cattle, hogs, and poultry being the main animals raised.
History
Peoria County was first settled in the early 1800s, and was officially established in 1825. The county was named after the Peoria tribe, which had inhabited the area for centuries before the arrival of European settlers.
The county was an important center of the Underground Railroad during the Civil War, and several prominent abolitionists lived in the county. After the war, the county experienced a period of rapid growth, and several industries, including manufacturing and agriculture, flourished.
In the late 20th century, the county experienced a period of economic decline, as many of the industries that had been the backbone of the economy began to move away. However, in recent years, the county has seen a resurgence in economic activity, and is now home to several major employers.
Common Questions
What is the Total Population of Peoria County?
Total Population of Peoria County is 181,186.
What is the Total Male Population of Peoria County?
Total Male Population of Peoria County is 88,477.
What is the Total Female Population of Peoria County?
Total Female Population of Peoria County is 92,709.
What is the Ratio of Males per 100 Females in Peoria County?
There are 95.44 Males per 100 Females in Peoria County.
What is the Ratio of Females per 100 Males in Peoria County?
There are 104.78 Females per 100 Males in Peoria County.
What is the Median Population Age in Peoria County?
Median Population Age in Peoria County is 38.1 Years.
What is the Average Family Size in Peoria County
Average Family Size in Peoria County is 3.0 People.
What is the Average Household Size in Peoria County
Average Household Size in Peoria County is 2.3 People.
What is Per Capita Income in Peoria County?
Per Capita income in Peoria County is $38,581.
What is the Median Family Income in Peoria County?
Median Family Income in Peoria County is $85,683.
What is the Median Household income in Peoria County?
Median Household Income in Peoria County is $63,409.
What is Income or Wage Gap in Peoria County?
Income or Wage Gap in Peoria County is 32.7%.
Women in Peoria County earn 67.3 cents for every dollar earned by a man.
What is Family Income Deficit in Peoria County?
Family Income Deficit in Peoria County is $11,427.
Families that are below poverty line in Peoria County earn $11,427 less on average than the poverty threshold level.
What is Inequality or Gini Index in Peoria County?
Inequality or Gini Index in Peoria County is 0.49.
How Large is the Labor Force in Peoria County?
There are 87,885 People in the Labor Forcein in Peoria County.
What is the Percentage of People in the Labor Force in Peoria County?
61.6% of People are in the Labor Force in Peoria County.
What is the Unemployment Rate in Peoria County?
Unemployment Rate in Peoria County is 6.6%.