Ogle County, IL
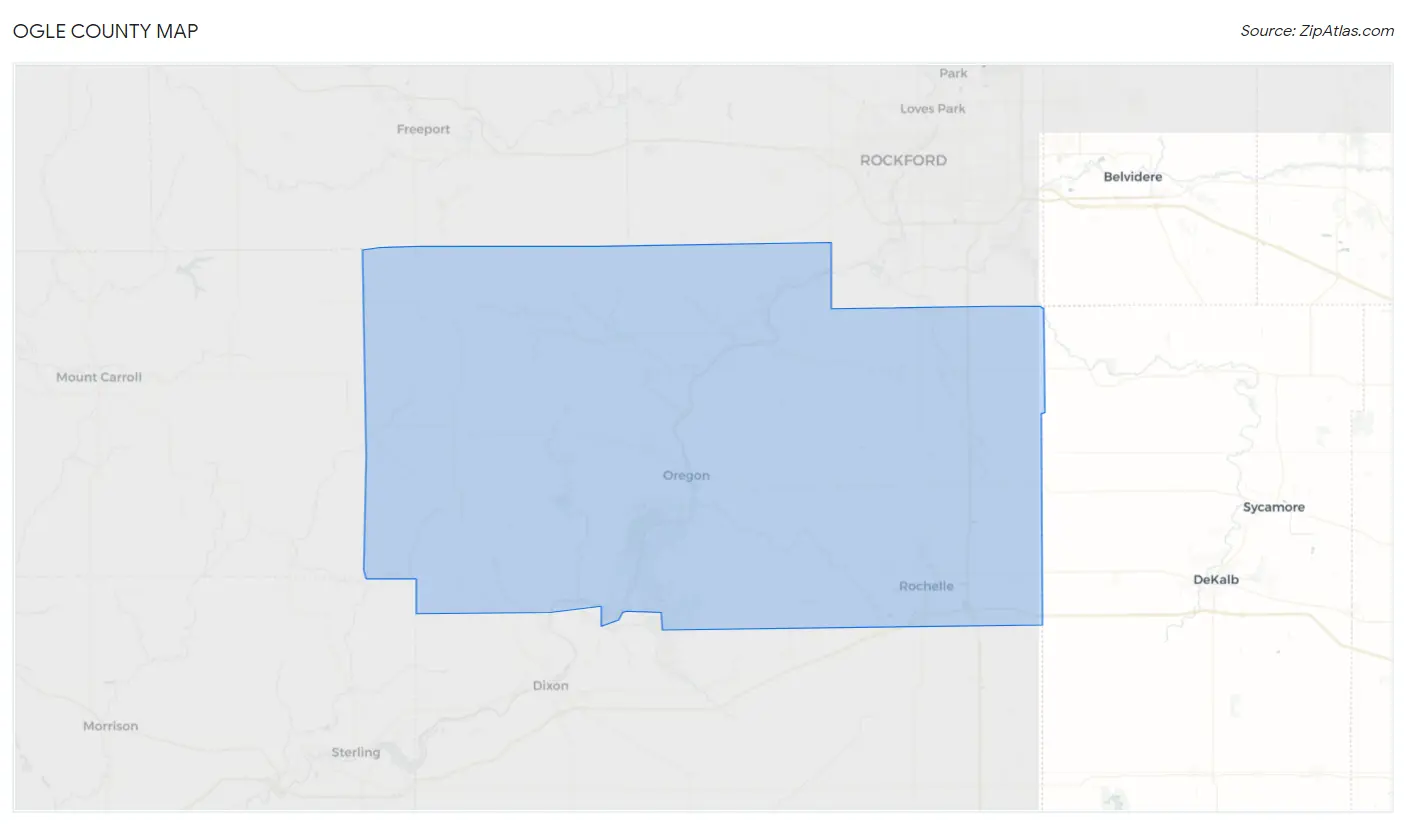
Ogle County Map
Ogle County Overview
51,672
TOTAL POPULATION
25,836
MALE POPULATION
25,836
FEMALE POPULATION
100.00
MALES / 100 FEMALES
100.00
FEMALES / 100 MALES
42.3
MEDIAN AGE
3.0
AVG FAMILY SIZE
2.5
AVG HOUSEHOLD SIZE
$36,436
PER CAPITA INCOME
$91,406
AVG FAMILY INCOME
$75,782
AVG HOUSEHOLD INCOME
41.1%
WAGE / INCOME GAP [ % ]
58.9¢/ $1
WAGE / INCOME GAP [ $ ]
$10,438
FAMILY INCOME DEFICIT
0.40
INEQUALITY / GINI INDEX
26,489
LABOR FORCE [ PEOPLE ]
63.6%
PERCENT IN LABOR FORCE
6.0%
UNEMPLOYMENT RATE
Race in Ogle County
The most populous races in Ogle County are White / Caucasian (46,277 | 89.6%), Hispanic or Latino (5,645 | 10.9%), and Two or more Races (3,420 | 6.6%).
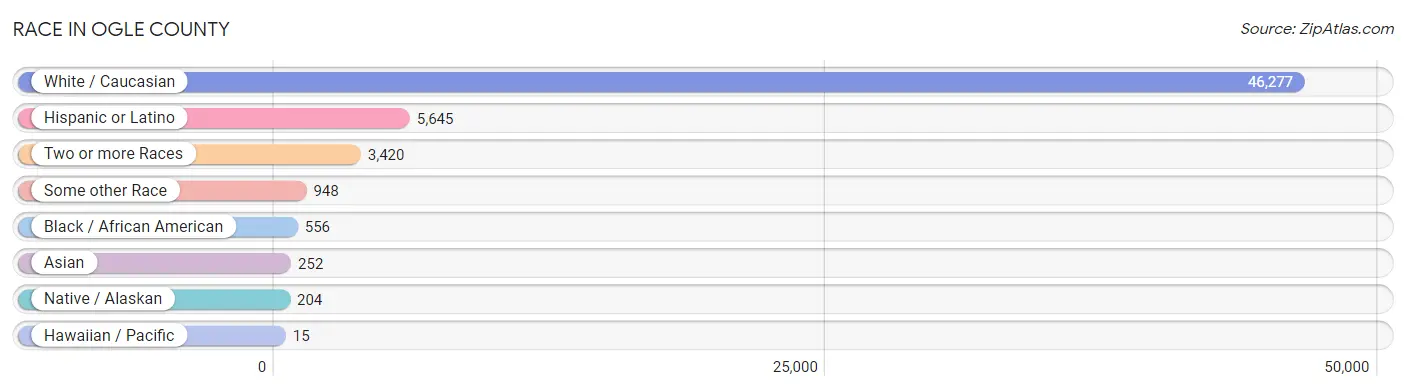
| Race | # Population | % Population |
| Asian | 252 | 0.5% |
| Black / African American | 556 | 1.1% |
| Hawaiian / Pacific | 15 | 0.0% |
| Hispanic or Latino | 5,645 | 10.9% |
| Native / Alaskan | 204 | 0.4% |
| White / Caucasian | 46,277 | 89.6% |
| Two or more Races | 3,420 | 6.6% |
| Some other Race | 948 | 1.8% |
| Total | 51,672 | 100.0% |
Ancestry in Ogle County
The most populous ancestries reported in Ogle County are German (15,718 | 30.4%), Irish (7,121 | 13.8%), English (5,043 | 9.8%), Mexican (4,910 | 9.5%), and Swedish (2,931 | 5.7%), together accounting for 69.1% of all Ogle County residents.
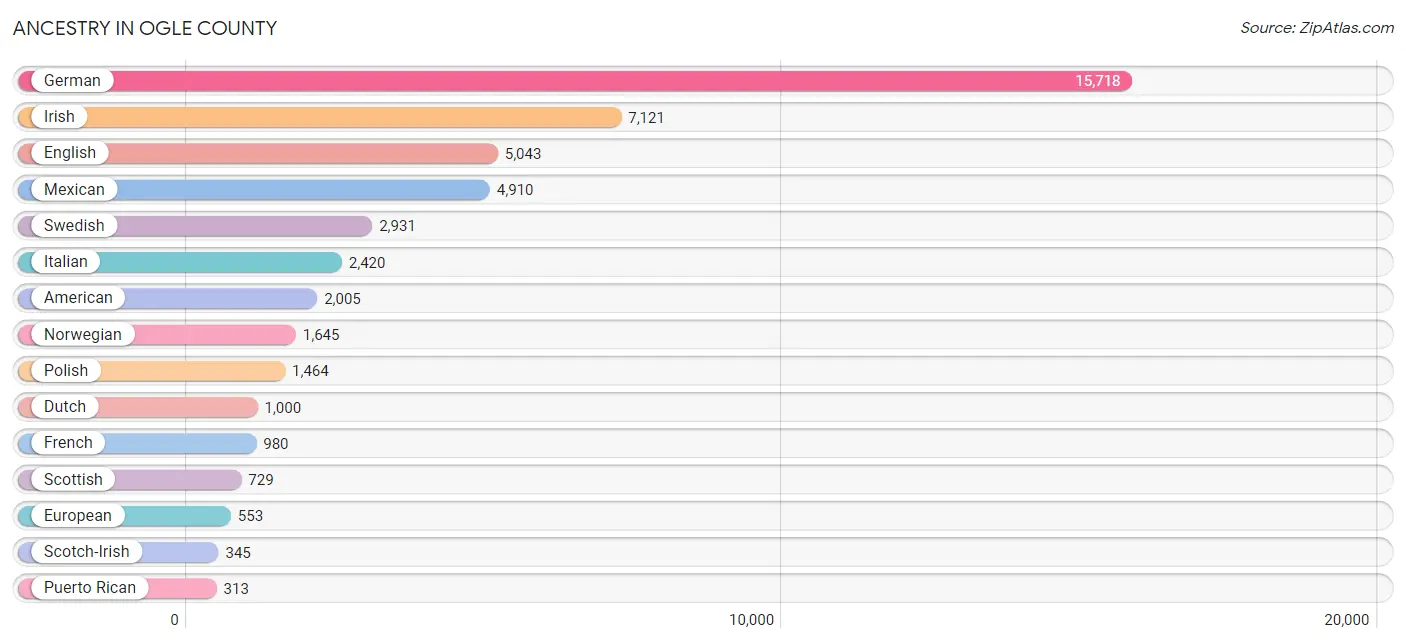
| Ancestry | # Population | % Population |
| African | 10 | 0.0% |
| Albanian | 2 | 0.0% |
| American | 2,005 | 3.9% |
| Arab | 41 | 0.1% |
| Assyrian / Chaldean / Syriac | 7 | 0.0% |
| Austrian | 76 | 0.2% |
| Belgian | 96 | 0.2% |
| Bhutanese | 57 | 0.1% |
| Blackfeet | 36 | 0.1% |
| Brazilian | 6 | 0.0% |
| British | 174 | 0.3% |
| Bulgarian | 75 | 0.2% |
| Burmese | 87 | 0.2% |
| Canadian | 45 | 0.1% |
| Celtic | 22 | 0.0% |
| Central American | 68 | 0.1% |
| Central American Indian | 28 | 0.1% |
| Cherokee | 25 | 0.1% |
| Chippewa | 10 | 0.0% |
| Cree | 1 | 0.0% |
| Croatian | 28 | 0.1% |
| Crow | 35 | 0.1% |
| Cuban | 10 | 0.0% |
| Czech | 199 | 0.4% |
| Czechoslovakian | 46 | 0.1% |
| Danish | 216 | 0.4% |
| Dutch | 1,000 | 1.9% |
| Eastern European | 27 | 0.1% |
| English | 5,043 | 9.8% |
| European | 553 | 1.1% |
| Filipino | 4 | 0.0% |
| Finnish | 154 | 0.3% |
| French | 980 | 1.9% |
| French Canadian | 89 | 0.2% |
| German | 15,718 | 30.4% |
| Greek | 133 | 0.3% |
| Guatemalan | 68 | 0.1% |
| Hungarian | 79 | 0.2% |
| Indian (Asian) | 139 | 0.3% |
| Irish | 7,121 | 13.8% |
| Iroquois | 1 | 0.0% |
| Italian | 2,420 | 4.7% |
| Jamaican | 89 | 0.2% |
| Jordanian | 26 | 0.1% |
| Korean | 92 | 0.2% |
| Latvian | 6 | 0.0% |
| Lithuanian | 188 | 0.4% |
| Luxembourger | 19 | 0.0% |
| Mexican | 4,910 | 9.5% |
| Mexican American Indian | 100 | 0.2% |
| Native Hawaiian | 39 | 0.1% |
| Navajo | 42 | 0.1% |
| New Zealander | 26 | 0.1% |
| Nigerian | 3 | 0.0% |
| Northern European | 76 | 0.2% |
| Norwegian | 1,645 | 3.2% |
| Palestinian | 2 | 0.0% |
| Pennsylvania German | 30 | 0.1% |
| Peruvian | 39 | 0.1% |
| Polish | 1,464 | 2.8% |
| Portuguese | 13 | 0.0% |
| Potawatomi | 17 | 0.0% |
| Puerto Rican | 313 | 0.6% |
| Romanian | 3 | 0.0% |
| Russian | 109 | 0.2% |
| Scandinavian | 281 | 0.5% |
| Scotch-Irish | 345 | 0.7% |
| Scottish | 729 | 1.4% |
| Serbian | 36 | 0.1% |
| Shoshone | 1 | 0.0% |
| Sioux | 2 | 0.0% |
| Slovak | 30 | 0.1% |
| Slovene | 19 | 0.0% |
| South American | 39 | 0.1% |
| Spaniard | 97 | 0.2% |
| Spanish | 95 | 0.2% |
| Sri Lankan | 33 | 0.1% |
| Subsaharan African | 13 | 0.0% |
| Swedish | 2,931 | 5.7% |
| Swiss | 177 | 0.3% |
| Thai | 24 | 0.1% |
| Turkish | 2 | 0.0% |
| Ukrainian | 17 | 0.0% |
| Welsh | 222 | 0.4% |
| Yugoslavian | 12 | 0.0% | View All 85 Rows |
Immigrants in Ogle County
The most numerous immigrant groups reported in Ogle County came from Latin America (1,407 | 2.7%), Central America (1,380 | 2.7%), Mexico (1,336 | 2.6%), Europe (226 | 0.4%), and Asia (201 | 0.4%), together accounting for 8.8% of all Ogle County residents.
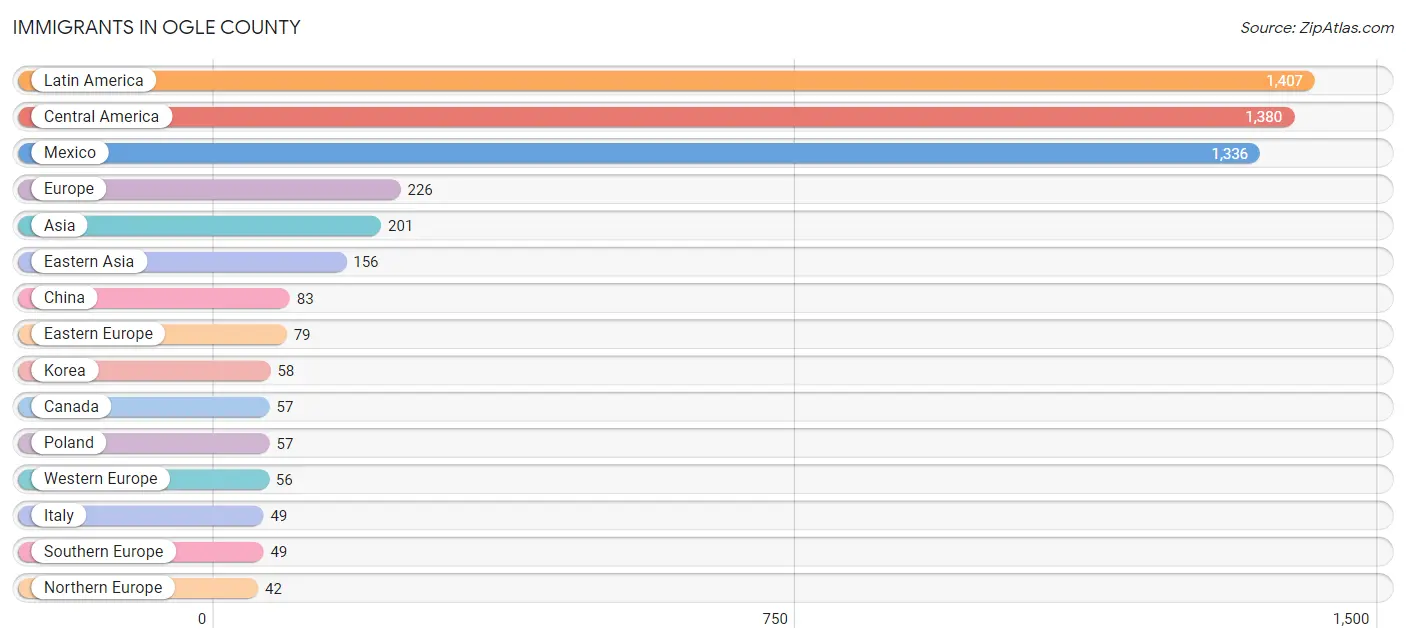
| Immigration Origin | # Population | % Population |
| Asia | 201 | 0.4% |
| Austria | 9 | 0.0% |
| Belarus | 10 | 0.0% |
| Brazil | 6 | 0.0% |
| Canada | 57 | 0.1% |
| Caribbean | 21 | 0.0% |
| Central America | 1,380 | 2.7% |
| China | 83 | 0.2% |
| Cuba | 10 | 0.0% |
| Eastern Asia | 156 | 0.3% |
| Eastern Europe | 79 | 0.2% |
| England | 18 | 0.0% |
| Europe | 226 | 0.4% |
| Germany | 40 | 0.1% |
| Guatemala | 31 | 0.1% |
| India | 5 | 0.0% |
| Italy | 49 | 0.1% |
| Jamaica | 11 | 0.0% |
| Japan | 15 | 0.0% |
| Jordan | 26 | 0.1% |
| Korea | 58 | 0.1% |
| Latin America | 1,407 | 2.7% |
| Mexico | 1,336 | 2.6% |
| Netherlands | 7 | 0.0% |
| Nicaragua | 13 | 0.0% |
| Northern Europe | 42 | 0.1% |
| Philippines | 11 | 0.0% |
| Poland | 57 | 0.1% |
| South America | 6 | 0.0% |
| South Central Asia | 5 | 0.0% |
| South Eastern Asia | 11 | 0.0% |
| Southern Europe | 49 | 0.1% |
| Western Asia | 26 | 0.1% |
| Western Europe | 56 | 0.1% | View All 34 Rows |
Sex and Age in Ogle County
Sex and Age in Ogle County
The most populous age groups in Ogle County are 60 to 64 Years (1,914 | 7.4%) for men and 60 to 64 Years (1,880 | 7.3%) for women.
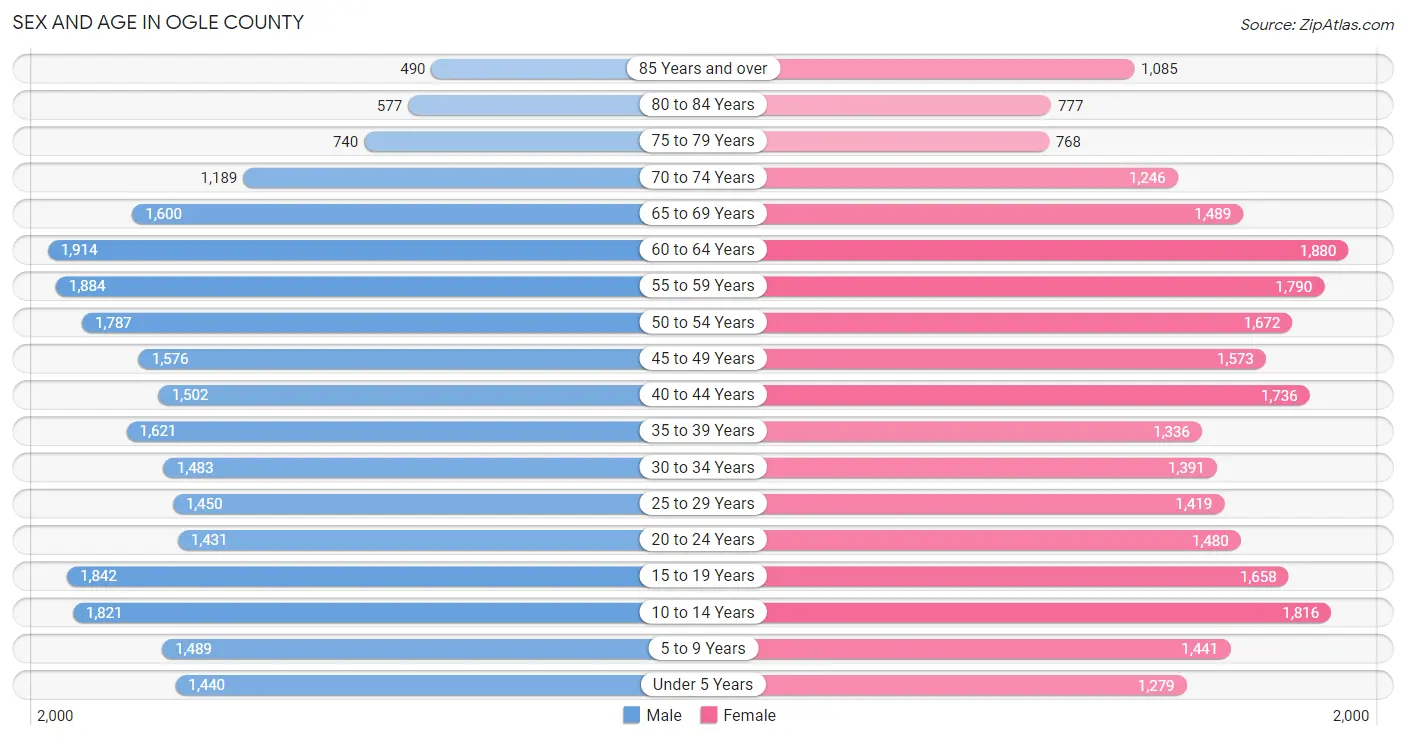
| Age Bracket | Male | Female |
| Under 5 Years | 1,440 (5.6%) | 1,279 (5.0%) |
| 5 to 9 Years | 1,489 (5.8%) | 1,441 (5.6%) |
| 10 to 14 Years | 1,821 (7.0%) | 1,816 (7.0%) |
| 15 to 19 Years | 1,842 (7.1%) | 1,658 (6.4%) |
| 20 to 24 Years | 1,431 (5.5%) | 1,480 (5.7%) |
| 25 to 29 Years | 1,450 (5.6%) | 1,419 (5.5%) |
| 30 to 34 Years | 1,483 (5.7%) | 1,391 (5.4%) |
| 35 to 39 Years | 1,621 (6.3%) | 1,336 (5.2%) |
| 40 to 44 Years | 1,502 (5.8%) | 1,736 (6.7%) |
| 45 to 49 Years | 1,576 (6.1%) | 1,573 (6.1%) |
| 50 to 54 Years | 1,787 (6.9%) | 1,672 (6.5%) |
| 55 to 59 Years | 1,884 (7.3%) | 1,790 (6.9%) |
| 60 to 64 Years | 1,914 (7.4%) | 1,880 (7.3%) |
| 65 to 69 Years | 1,600 (6.2%) | 1,489 (5.8%) |
| 70 to 74 Years | 1,189 (4.6%) | 1,246 (4.8%) |
| 75 to 79 Years | 740 (2.9%) | 768 (3.0%) |
| 80 to 84 Years | 577 (2.2%) | 777 (3.0%) |
| 85 Years and over | 490 (1.9%) | 1,085 (4.2%) |
| Total | 25,836 (100.0%) | 25,836 (100.0%) |
Families and Households in Ogle County
Median Family Size in Ogle County
The median family size in Ogle County is 3.04 persons per family, with single female/mother families (2,018 | 14.7%) accounting for the largest median family size of 3.13 persons per family. On the other hand, single male/father families (1,052 | 7.7%) represent the smallest median family size with 2.48 persons per family.
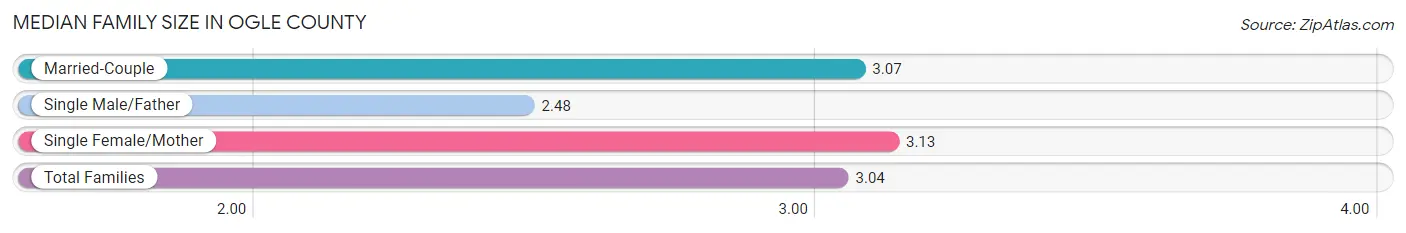
| Family Type | # Families | Family Size |
| Married-Couple | 10,670 (77.7%) | 3.07 |
| Single Male/Father | 1,052 (7.7%) | 2.48 |
| Single Female/Mother | 2,018 (14.7%) | 3.13 |
| Total Families | 13,740 (100.0%) | 3.04 |
Median Household Size in Ogle County
The median household size in Ogle County is 2.46 persons per household, with single female/mother households (2,018 | 9.7%) accounting for the largest median household size of 3.37 persons per household. non-family households (7,067 | 34.0%) represent the smallest median household size with 1.16 persons per household.
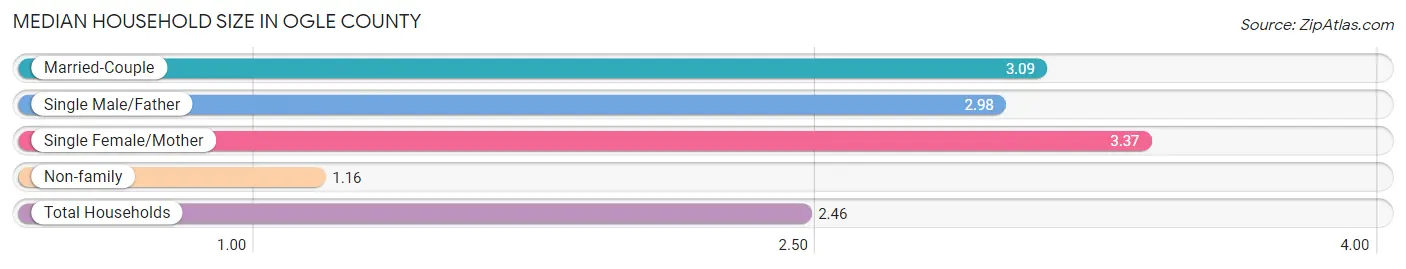
| Household Type | # Households | Household Size |
| Married-Couple | 10,670 (51.3%) | 3.09 |
| Single Male/Father | 1,052 (5.1%) | 2.98 |
| Single Female/Mother | 2,018 (9.7%) | 3.37 |
| Non-family | 7,067 (34.0%) | 1.16 |
| Total Households | 20,807 (100.0%) | 2.46 |
Household Size by Marriage Status in Ogle County
Out of a total of 20,807 households in Ogle County, 13,740 (66.0%) are family households, while 7,067 (34.0%) are nonfamily households. The most numerous type of family households are 2-person households, comprising 6,643, and the most common type of nonfamily households are 1-person households, comprising 6,156.
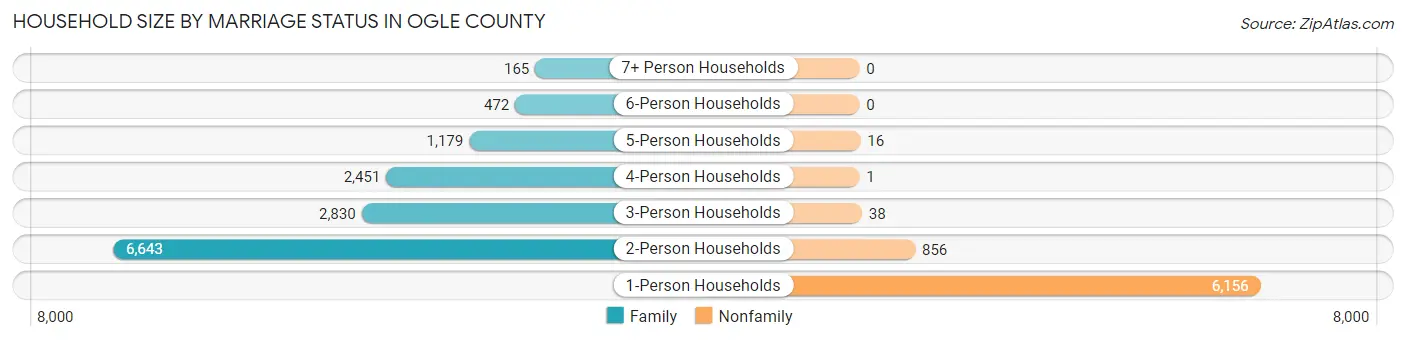
| Household Size | Family Households | Nonfamily Households |
| 1-Person Households | - | 6,156 (29.6%) |
| 2-Person Households | 6,643 (31.9%) | 856 (4.1%) |
| 3-Person Households | 2,830 (13.6%) | 38 (0.2%) |
| 4-Person Households | 2,451 (11.8%) | 1 (0.0%) |
| 5-Person Households | 1,179 (5.7%) | 16 (0.1%) |
| 6-Person Households | 472 (2.3%) | 0 (0.0%) |
| 7+ Person Households | 165 (0.8%) | 0 (0.0%) |
| Total | 13,740 (66.0%) | 7,067 (34.0%) |
Female Fertility in Ogle County
Fertility by Age in Ogle County
Average fertility rate in Ogle County is 66.0 births per 1,000 women. Women in the age bracket of 20 to 34 years have the highest fertility rate with 114.0 births per 1,000 women. Women in the age bracket of 20 to 34 years acount for 68.3% of all women with births.
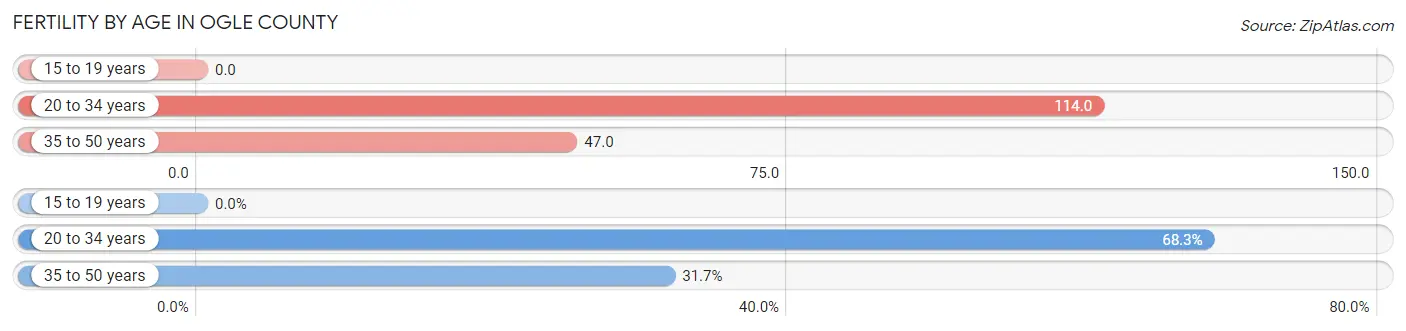
| Age Bracket | Women with Births | Births / 1,000 Women |
| 15 to 19 years | 0 (0.0%) | 0.0 |
| 20 to 34 years | 491 (68.3%) | 114.0 |
| 35 to 50 years | 228 (31.7%) | 47.0 |
| Total | 719 (100.0%) | 66.0 |
Fertility by Age by Marriage Status in Ogle County
70.7% of women with births (719) in Ogle County are married. The highest percentage of unmarried women with births falls into 20 to 34 years age bracket with 42.4% of them unmarried at the time of birth, while the lowest percentage of unmarried women with births belong to 35 to 50 years age bracket with 1.3% of them unmarried.
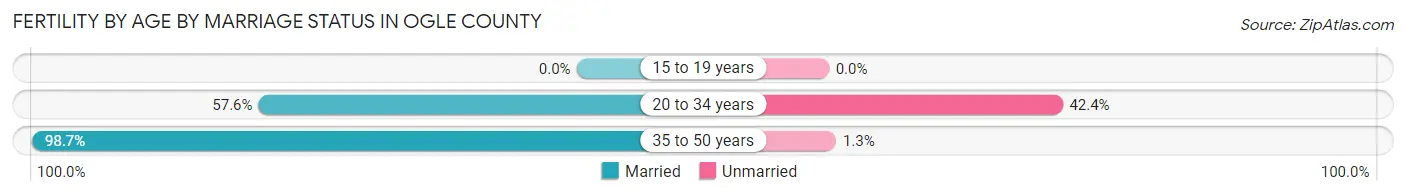
| Age Bracket | Married | Unmarried |
| 15 to 19 years | 0 (0.0%) | 0 (0.0%) |
| 20 to 34 years | 283 (57.6%) | 208 (42.4%) |
| 35 to 50 years | 225 (98.7%) | 3 (1.3%) |
| Total | 508 (70.7%) | 211 (29.3%) |
Fertility by Education in Ogle County
Average fertility rate in Ogle County is 66.0 births per 1,000 women. Women with the education attainment of high school diploma have the highest fertility rate of 110.0 births per 1,000 women, while women with the education attainment of less than high school have the lowest fertility at 24.0 births per 1,000 women. Women with the education attainment of high school diploma represent 38.7% of all women with births.
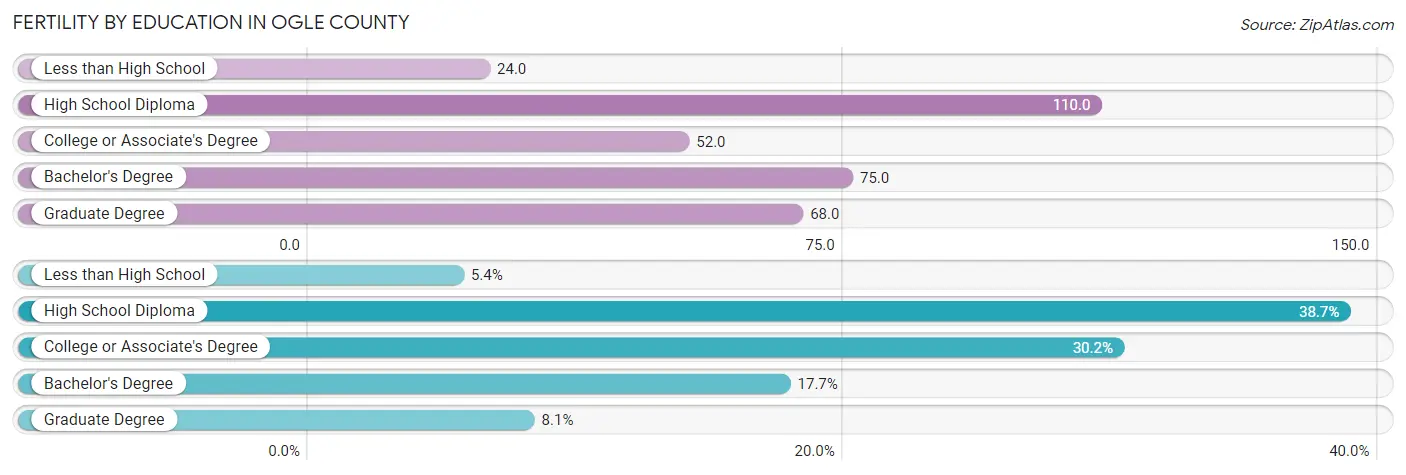
| Educational Attainment | Women with Births | Births / 1,000 Women |
| Less than High School | 39 (5.4%) | 24.0 |
| High School Diploma | 278 (38.7%) | 110.0 |
| College or Associate's Degree | 217 (30.2%) | 52.0 |
| Bachelor's Degree | 127 (17.7%) | 75.0 |
| Graduate Degree | 58 (8.1%) | 68.0 |
| Total | 719 (100.0%) | 66.0 |
Fertility by Education by Marriage Status in Ogle County
29.3% of women with births in Ogle County are unmarried. Women with the educational attainment of graduate degree are most likely to be married with 100.0% of them married at childbirth, while women with the educational attainment of less than high school are least likely to be married with 51.3% of them unmarried at childbirth.
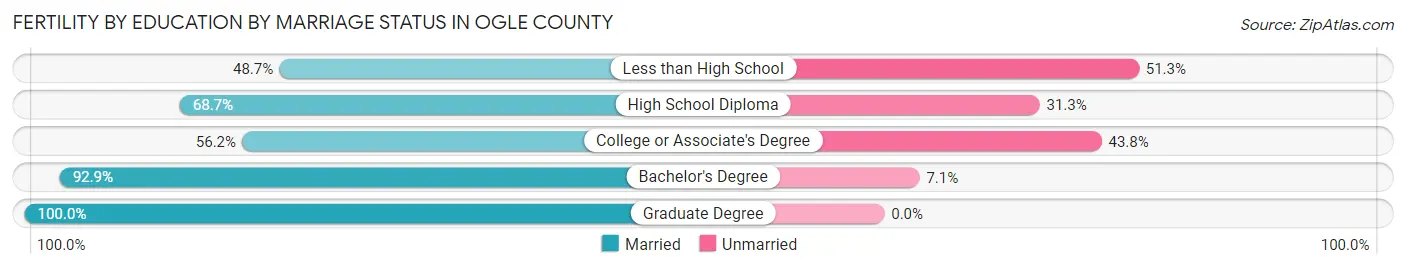
| Educational Attainment | Married | Unmarried |
| Less than High School | 19 (48.7%) | 20 (51.3%) |
| High School Diploma | 191 (68.7%) | 87 (31.3%) |
| College or Associate's Degree | 122 (56.2%) | 95 (43.8%) |
| Bachelor's Degree | 118 (92.9%) | 9 (7.1%) |
| Graduate Degree | 58 (100.0%) | 0 (0.0%) |
| Total | 508 (70.7%) | 211 (29.3%) |
Income in Ogle County
Income Overview in Ogle County
Per Capita Income in Ogle County is $36,436, while median incomes of families and households are $91,406 and $75,782 respectively.
| Characteristic | Number | Measure |
| Per Capita Income | 51,672 | $36,436 |
| Median Family Income | 13,740 | $91,406 |
| Mean Family Income | 13,740 | $107,321 |
| Median Household Income | 20,807 | $75,782 |
| Mean Household Income | 20,807 | $88,858 |
| Income Deficit | 13,740 | $10,438 |
| Wage / Income Gap (%) | 51,672 | 41.08% |
| Wage / Income Gap ($) | 51,672 | 58.92¢ per $1 |
| Gini / Inequality Index | 51,672 | 0.40 |
Earnings by Sex in Ogle County
Average Earnings in Ogle County are $39,935, $50,820 for men and $29,941 for women, a difference of 41.1%.
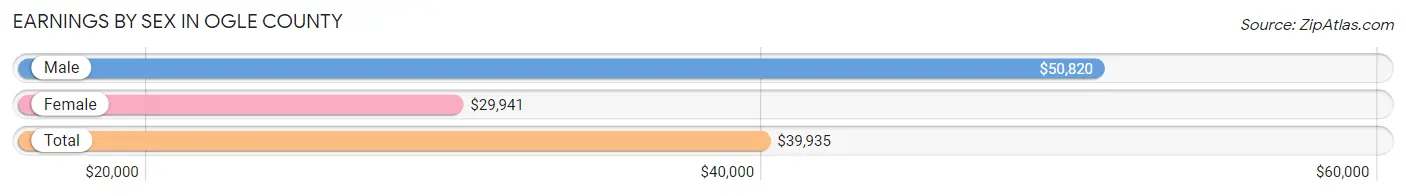
| Sex | Number | Average Earnings |
| Male | 14,727 (53.3%) | $50,820 |
| Female | 12,895 (46.7%) | $29,941 |
| Total | 27,622 (100.0%) | $39,935 |
Earnings by Sex by Income Bracket in Ogle County
The most common earnings brackets in Ogle County are $100,000+ for men (2,172 | 14.7%) and $25,000 to $29,999 for women (1,184 | 9.2%).
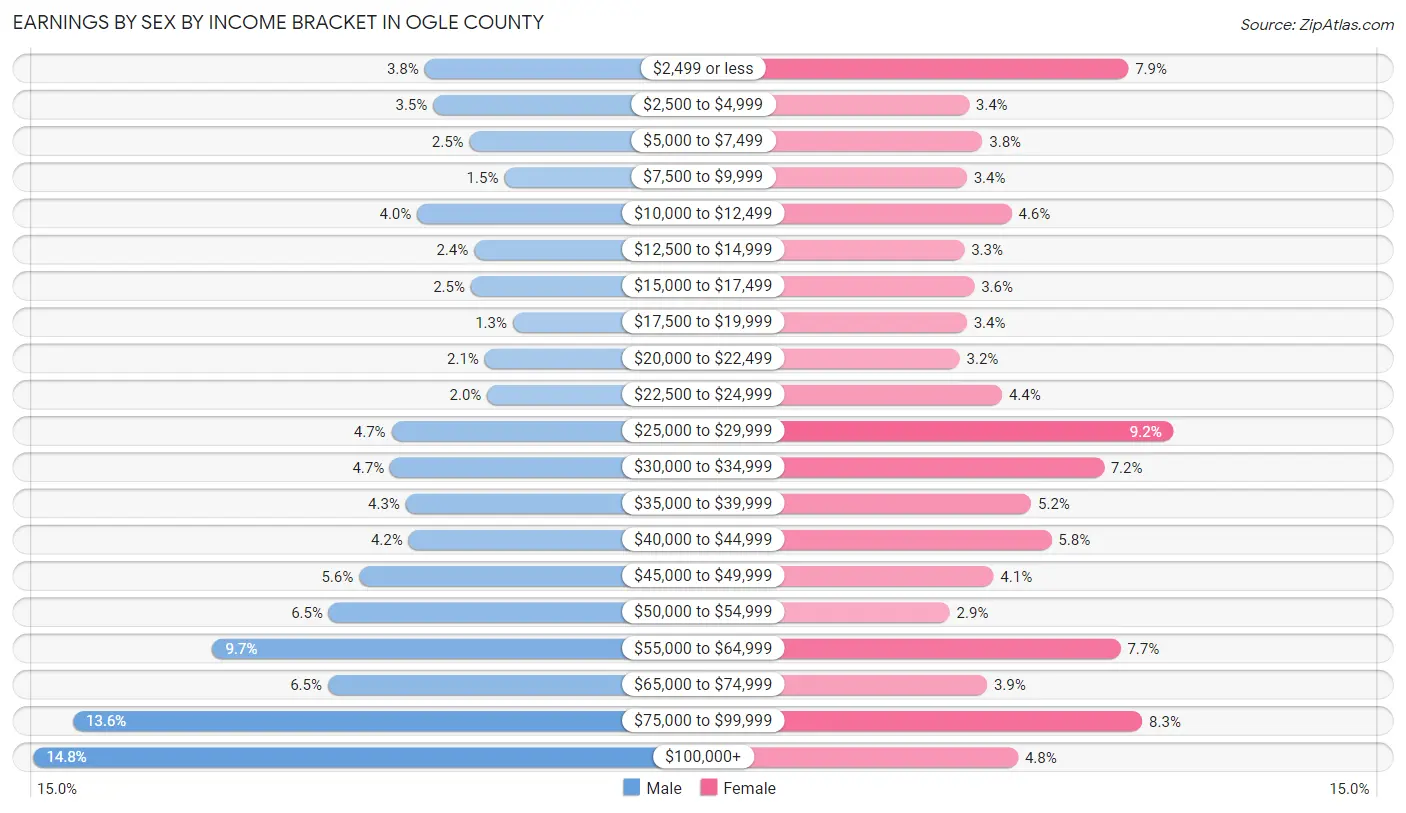
| Income | Male | Female |
| $2,499 or less | 554 (3.8%) | 1,020 (7.9%) |
| $2,500 to $4,999 | 519 (3.5%) | 442 (3.4%) |
| $5,000 to $7,499 | 368 (2.5%) | 491 (3.8%) |
| $7,500 to $9,999 | 224 (1.5%) | 434 (3.4%) |
| $10,000 to $12,499 | 584 (4.0%) | 597 (4.6%) |
| $12,500 to $14,999 | 349 (2.4%) | 426 (3.3%) |
| $15,000 to $17,499 | 363 (2.5%) | 461 (3.6%) |
| $17,500 to $19,999 | 188 (1.3%) | 434 (3.4%) |
| $20,000 to $22,499 | 305 (2.1%) | 409 (3.2%) |
| $22,500 to $24,999 | 294 (2.0%) | 562 (4.4%) |
| $25,000 to $29,999 | 691 (4.7%) | 1,184 (9.2%) |
| $30,000 to $34,999 | 696 (4.7%) | 931 (7.2%) |
| $35,000 to $39,999 | 632 (4.3%) | 668 (5.2%) |
| $40,000 to $44,999 | 620 (4.2%) | 742 (5.8%) |
| $45,000 to $49,999 | 824 (5.6%) | 531 (4.1%) |
| $50,000 to $54,999 | 950 (6.5%) | 373 (2.9%) |
| $55,000 to $64,999 | 1,431 (9.7%) | 992 (7.7%) |
| $65,000 to $74,999 | 954 (6.5%) | 508 (3.9%) |
| $75,000 to $99,999 | 2,009 (13.6%) | 1,070 (8.3%) |
| $100,000+ | 2,172 (14.7%) | 620 (4.8%) |
| Total | 14,727 (100.0%) | 12,895 (100.0%) |
Earnings by Sex by Educational Attainment in Ogle County
Average earnings in Ogle County are $56,170 for men and $34,642 for women, a difference of 38.3%. Men with an educational attainment of graduate degree enjoy the highest average annual earnings of $78,438, while those with high school diploma education earn the least with $48,974. Women with an educational attainment of graduate degree earn the most with the average annual earnings of $53,796, while those with high school diploma education have the smallest earnings of $27,131.
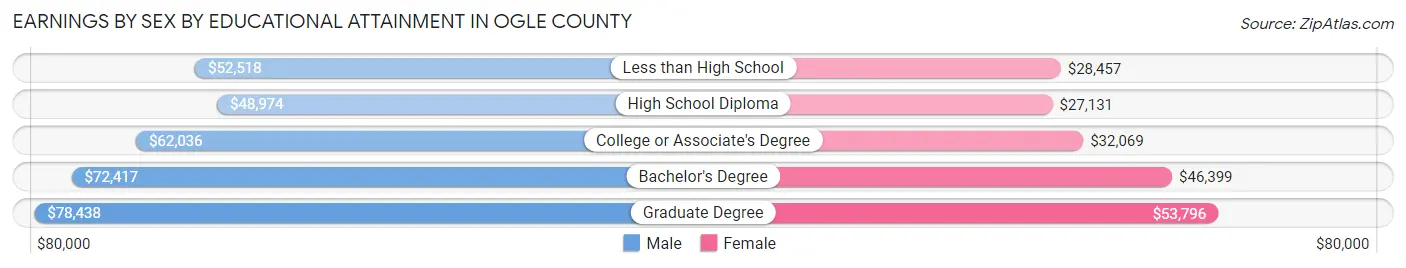
| Educational Attainment | Male Income | Female Income |
| Less than High School | $52,518 | $28,457 |
| High School Diploma | $48,974 | $27,131 |
| College or Associate's Degree | $62,036 | $32,069 |
| Bachelor's Degree | $72,417 | $46,399 |
| Graduate Degree | $78,438 | $53,796 |
| Total | $56,170 | $34,642 |
Family Income in Ogle County
Family Income Brackets in Ogle County
According to the Ogle County family income data, there are 3,476 families falling into the $100,000 to $149,999 income range, which is the most common income bracket and makes up 25.3% of all families. Conversely, the $10,000 to $14,999 income bracket is the least frequent group with only 69 families (0.5%) belonging to this category.
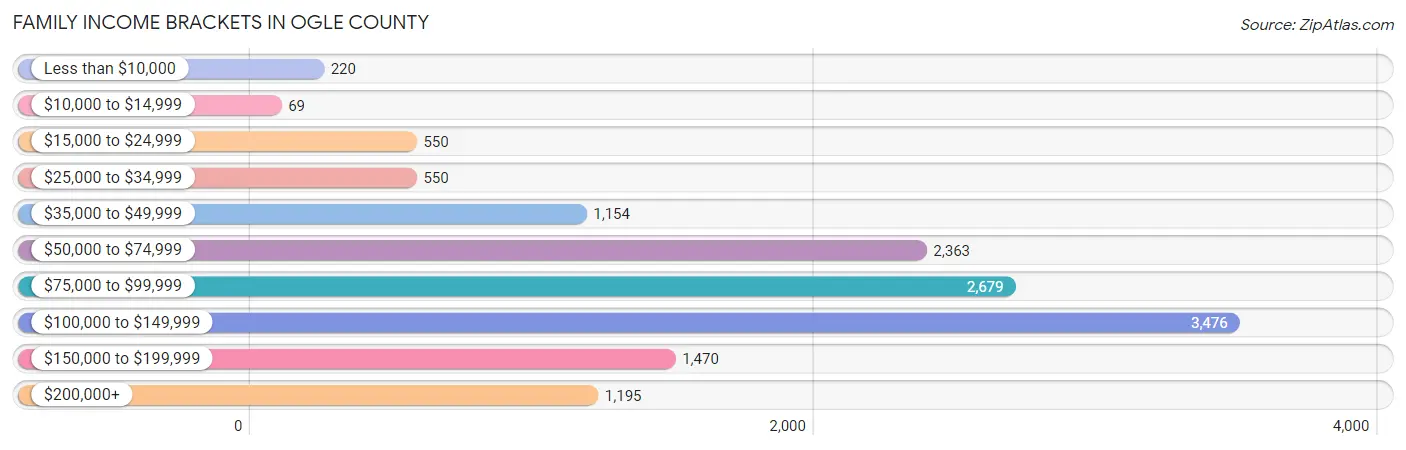
| Income Bracket | # Families | % Families |
| Less than $10,000 | 220 | 1.6% |
| $10,000 to $14,999 | 69 | 0.5% |
| $15,000 to $24,999 | 550 | 4.0% |
| $25,000 to $34,999 | 550 | 4.0% |
| $35,000 to $49,999 | 1,154 | 8.4% |
| $50,000 to $74,999 | 2,363 | 17.2% |
| $75,000 to $99,999 | 2,679 | 19.5% |
| $100,000 to $149,999 | 3,476 | 25.3% |
| $150,000 to $199,999 | 1,470 | 10.7% |
| $200,000+ | 1,195 | 8.7% |
Family Income by Famaliy Size in Ogle County
7+ person families (134 | 1.0%) account for the highest median family income in Ogle County with $120,903 per family, while 2-person families (7,126 | 51.9%) have the highest median income of $42,682 per family member.
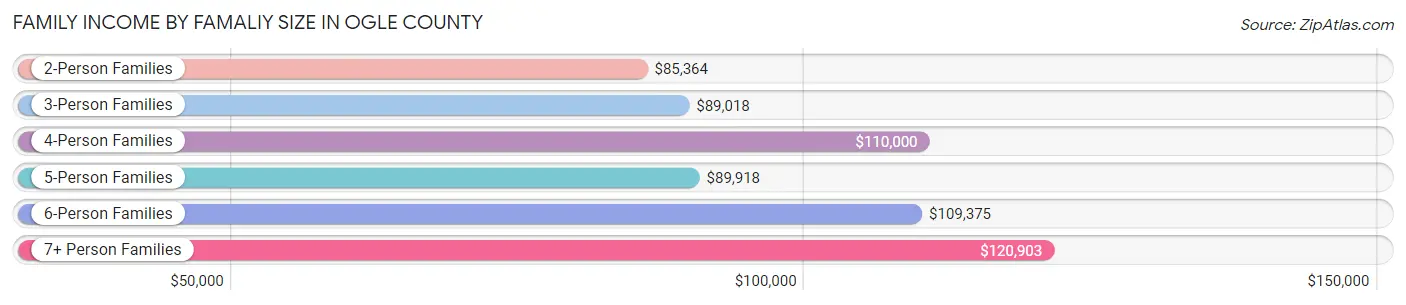
| Income Bracket | # Families | Median Income |
| 2-Person Families | 7,126 (51.9%) | $85,364 |
| 3-Person Families | 2,694 (19.6%) | $89,018 |
| 4-Person Families | 2,188 (15.9%) | $110,000 |
| 5-Person Families | 1,146 (8.3%) | $89,918 |
| 6-Person Families | 452 (3.3%) | $109,375 |
| 7+ Person Families | 134 (1.0%) | $120,903 |
| Total | 13,740 (100.0%) | $91,406 |
Family Income by Number of Earners in Ogle County
The median family income in Ogle County is $91,406, with families comprising 3+ earners (1,779) having the highest median family income of $121,989, while families with no earners (2,209) have the lowest median family income of $63,570, accounting for 13.0% and 16.1% of families, respectively.
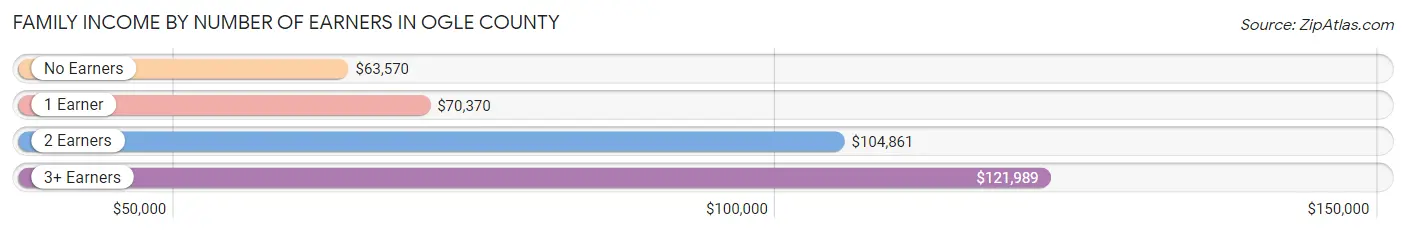
| Number of Earners | # Families | Median Income |
| No Earners | 2,209 (16.1%) | $63,570 |
| 1 Earner | 3,630 (26.4%) | $70,370 |
| 2 Earners | 6,122 (44.6%) | $104,861 |
| 3+ Earners | 1,779 (13.0%) | $121,989 |
| Total | 13,740 (100.0%) | $91,406 |
Household Income in Ogle County
Household Income Brackets in Ogle County
With 4,286 households falling in the category, the $100,000 to $149,999 income range is the most frequent in Ogle County, accounting for 20.6% of all households. In contrast, only 583 households (2.8%) fall into the $10,000 to $14,999 income bracket, making it the least populous group.
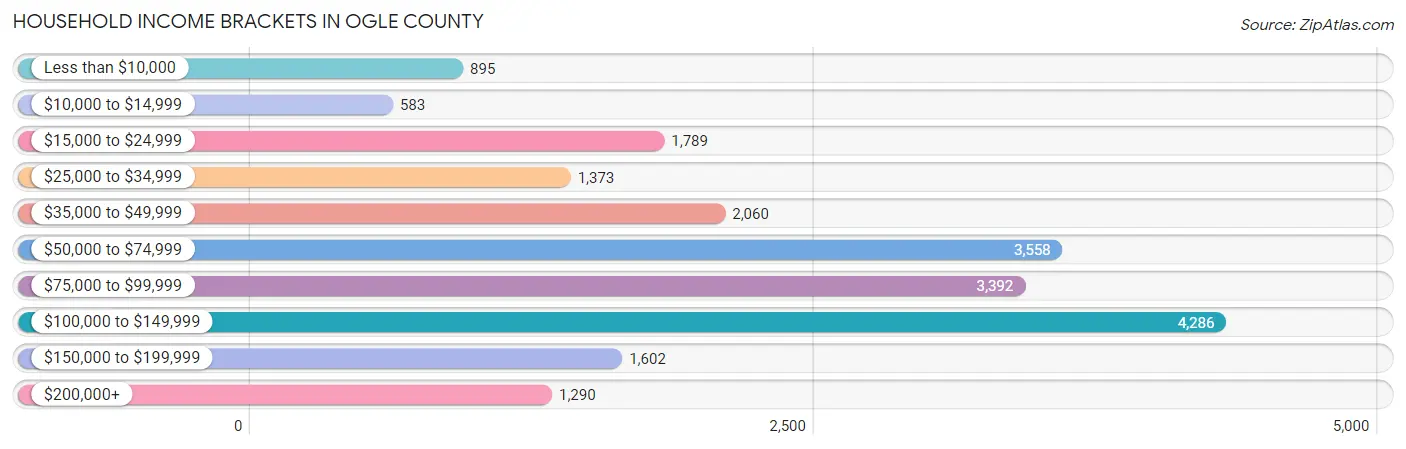
| Income Bracket | # Households | % Households |
| Less than $10,000 | 895 | 4.3% |
| $10,000 to $14,999 | 583 | 2.8% |
| $15,000 to $24,999 | 1,789 | 8.6% |
| $25,000 to $34,999 | 1,373 | 6.6% |
| $35,000 to $49,999 | 2,060 | 9.9% |
| $50,000 to $74,999 | 3,558 | 17.1% |
| $75,000 to $99,999 | 3,392 | 16.3% |
| $100,000 to $149,999 | 4,286 | 20.6% |
| $150,000 to $199,999 | 1,602 | 7.7% |
| $200,000+ | 1,290 | 6.2% |
Household Income by Householder Age in Ogle County
The median household income in Ogle County is $75,782, with the highest median household income of $85,924 found in the 25 to 44 years age bracket for the primary householder. A total of 5,653 households (27.2%) fall into this category. Meanwhile, the 15 to 24 years age bracket for the primary householder has the lowest median household income of $51,853, with 452 households (2.2%) in this group.
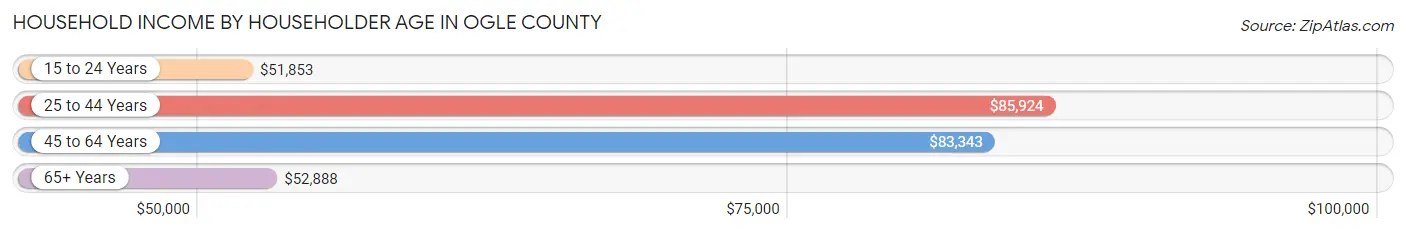
| Income Bracket | # Households | Median Income |
| 15 to 24 Years | 452 (2.2%) | $51,853 |
| 25 to 44 Years | 5,653 (27.2%) | $85,924 |
| 45 to 64 Years | 8,222 (39.5%) | $83,343 |
| 65+ Years | 6,480 (31.1%) | $52,888 |
| Total | 20,807 (100.0%) | $75,782 |
Poverty in Ogle County
Income Below Poverty by Sex and Age in Ogle County
With 7.5% poverty level for males and 9.1% for females among the residents of Ogle County, 5 year old males and 75 year old and over females are the most vulnerable to poverty, with 64 males (20.5%) and 454 females (19.1%) in their respective age groups living below the poverty level.
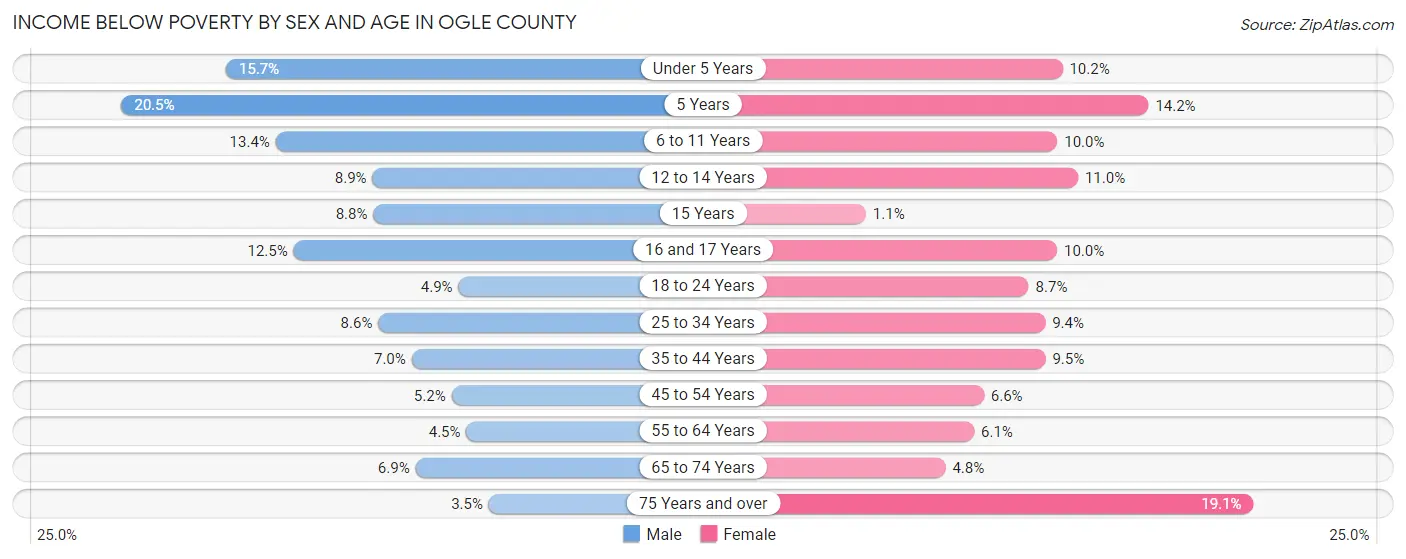
| Age Bracket | Male | Female |
| Under 5 Years | 224 (15.7%) | 131 (10.2%) |
| 5 Years | 64 (20.5%) | 35 (14.2%) |
| 6 to 11 Years | 256 (13.4%) | 184 (10.0%) |
| 12 to 14 Years | 89 (8.9%) | 123 (11.0%) |
| 15 Years | 41 (8.8%) | 3 (1.1%) |
| 16 and 17 Years | 84 (12.5%) | 79 (10.0%) |
| 18 to 24 Years | 102 (4.9%) | 178 (8.7%) |
| 25 to 34 Years | 250 (8.6%) | 265 (9.4%) |
| 35 to 44 Years | 219 (7.0%) | 290 (9.5%) |
| 45 to 54 Years | 173 (5.2%) | 214 (6.6%) |
| 55 to 64 Years | 170 (4.5%) | 224 (6.1%) |
| 65 to 74 Years | 191 (6.9%) | 130 (4.8%) |
| 75 Years and over | 61 (3.5%) | 454 (19.1%) |
| Total | 1,924 (7.5%) | 2,310 (9.1%) |
Income Above Poverty by Sex and Age in Ogle County
According to the poverty statistics in Ogle County, males aged 75 years and over and females aged 15 years are the age groups that are most secure financially, with 96.5% of males and 98.9% of females in these age groups living above the poverty line.
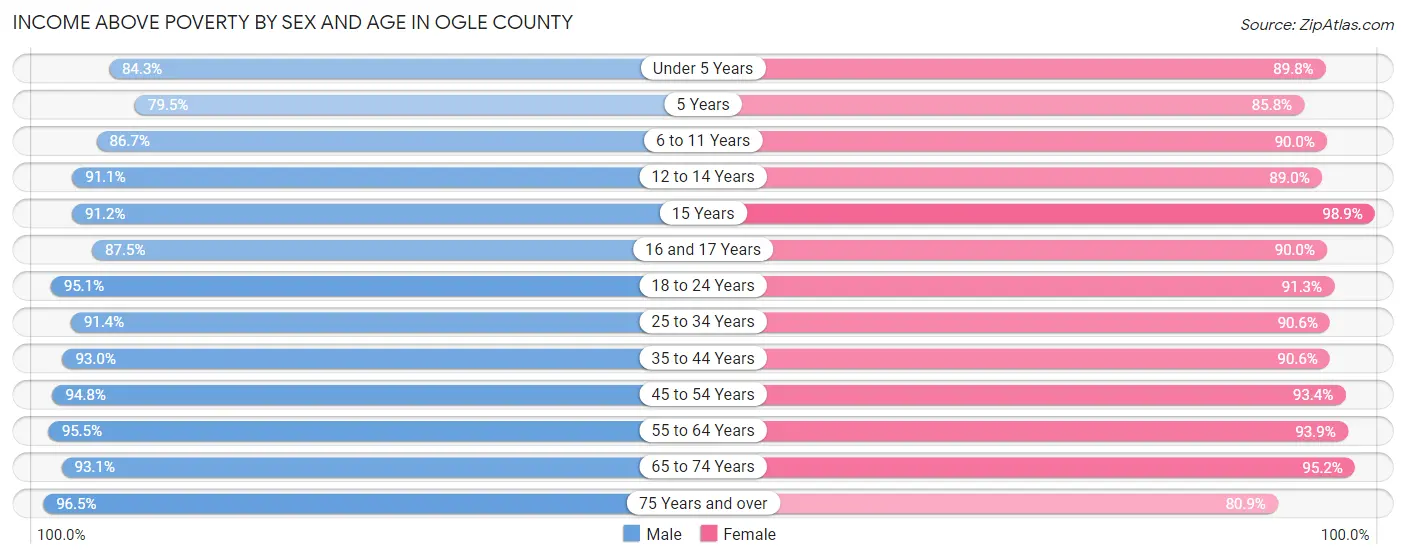
| Age Bracket | Male | Female |
| Under 5 Years | 1,206 (84.3%) | 1,148 (89.8%) |
| 5 Years | 248 (79.5%) | 211 (85.8%) |
| 6 to 11 Years | 1,661 (86.7%) | 1,656 (90.0%) |
| 12 to 14 Years | 916 (91.1%) | 999 (89.0%) |
| 15 Years | 424 (91.2%) | 266 (98.9%) |
| 16 and 17 Years | 587 (87.5%) | 712 (90.0%) |
| 18 to 24 Years | 1,992 (95.1%) | 1,874 (91.3%) |
| 25 to 34 Years | 2,659 (91.4%) | 2,541 (90.6%) |
| 35 to 44 Years | 2,894 (93.0%) | 2,778 (90.5%) |
| 45 to 54 Years | 3,163 (94.8%) | 3,031 (93.4%) |
| 55 to 64 Years | 3,608 (95.5%) | 3,425 (93.9%) |
| 65 to 74 Years | 2,592 (93.1%) | 2,575 (95.2%) |
| 75 Years and over | 1,701 (96.5%) | 1,923 (80.9%) |
| Total | 23,651 (92.5%) | 23,139 (90.9%) |
Income Below Poverty Among Married-Couple Families in Ogle County
The poverty statistics for married-couple families in Ogle County show that 2.2% or 238 of the total 10,670 families live below the poverty line. Families with 5 or more children have the highest poverty rate of 10.7%, comprising of 10 families. On the other hand, families with no children have the lowest poverty rate of 1.4%, which includes 98 families.
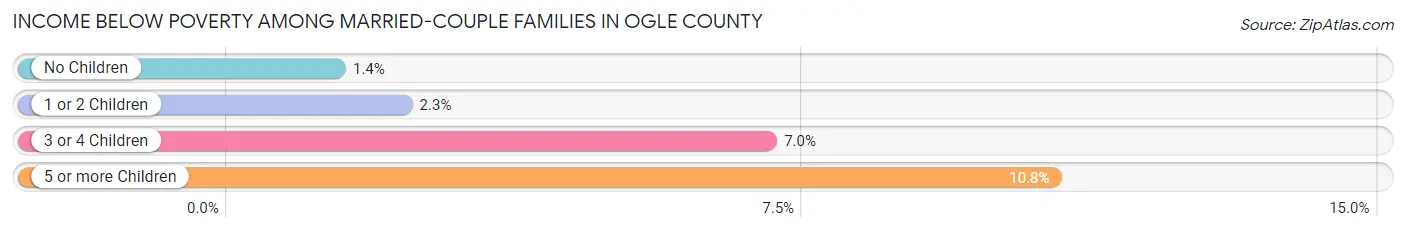
| Children | Above Poverty | Below Poverty |
| No Children | 6,849 (98.6%) | 98 (1.4%) |
| 1 or 2 Children | 2,575 (97.7%) | 60 (2.3%) |
| 3 or 4 Children | 925 (93.0%) | 70 (7.0%) |
| 5 or more Children | 83 (89.2%) | 10 (10.7%) |
| Total | 10,432 (97.8%) | 238 (2.2%) |
Income Below Poverty Among Single-Parent Households in Ogle County
According to the poverty data in Ogle County, 6.9% or 73 single-father households and 16.9% or 340 single-mother households are living below the poverty line. Among single-father households, those with 1 or 2 children have the highest poverty rate, with 66 households (12.0%) experiencing poverty. Likewise, among single-mother households, those with 3 or 4 children have the highest poverty rate, with 46 households (25.8%) falling below the poverty line.
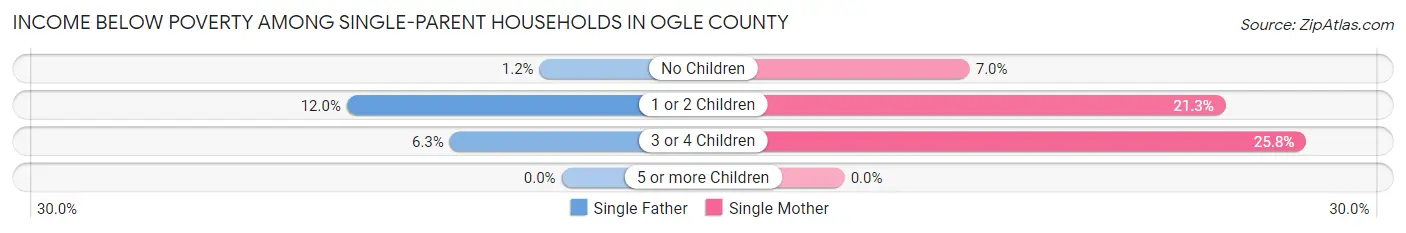
| Children | Single Father | Single Mother |
| No Children | 6 (1.2%) | 48 (7.0%) |
| 1 or 2 Children | 66 (12.0%) | 246 (21.3%) |
| 3 or 4 Children | 1 (6.2%) | 46 (25.8%) |
| 5 or more Children | 0 (0.0%) | 0 (0.0%) |
| Total | 73 (6.9%) | 340 (16.9%) |
Income Below Poverty Among Married-Couple vs Single-Parent Households in Ogle County
The poverty data for Ogle County shows that 238 of the married-couple family households (2.2%) and 413 of the single-parent households (13.5%) are living below the poverty level. Within the married-couple family households, those with 5 or more children have the highest poverty rate, with 10 households (10.7%) falling below the poverty line. Among the single-parent households, those with 3 or 4 children have the highest poverty rate, with 47 household (24.2%) living below poverty.
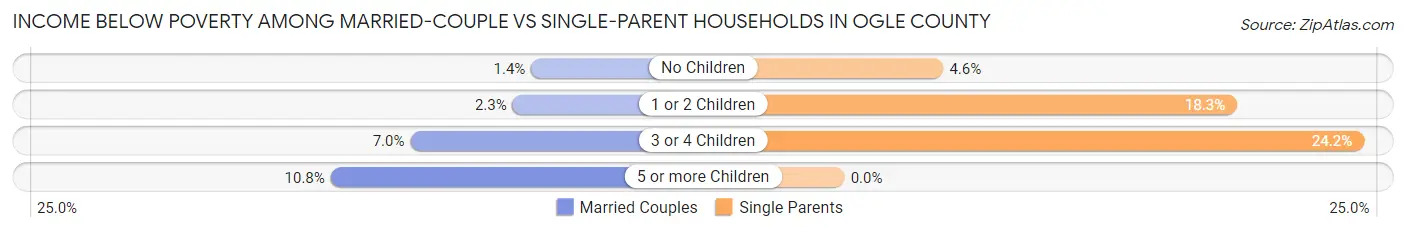
| Children | Married-Couple Families | Single-Parent Households |
| No Children | 98 (1.4%) | 54 (4.6%) |
| 1 or 2 Children | 60 (2.3%) | 312 (18.3%) |
| 3 or 4 Children | 70 (7.0%) | 47 (24.2%) |
| 5 or more Children | 10 (10.7%) | 0 (0.0%) |
| Total | 238 (2.2%) | 413 (13.5%) |
Employment Characteristics in Ogle County
Employment by Class of Employer in Ogle County
Among the 24,422 employed individuals in Ogle County, private company employees (16,459 | 67.4%), local government employees (2,376 | 9.7%), and not-for-profit organizations (2,015 | 8.3%) make up the most common classes of employment.
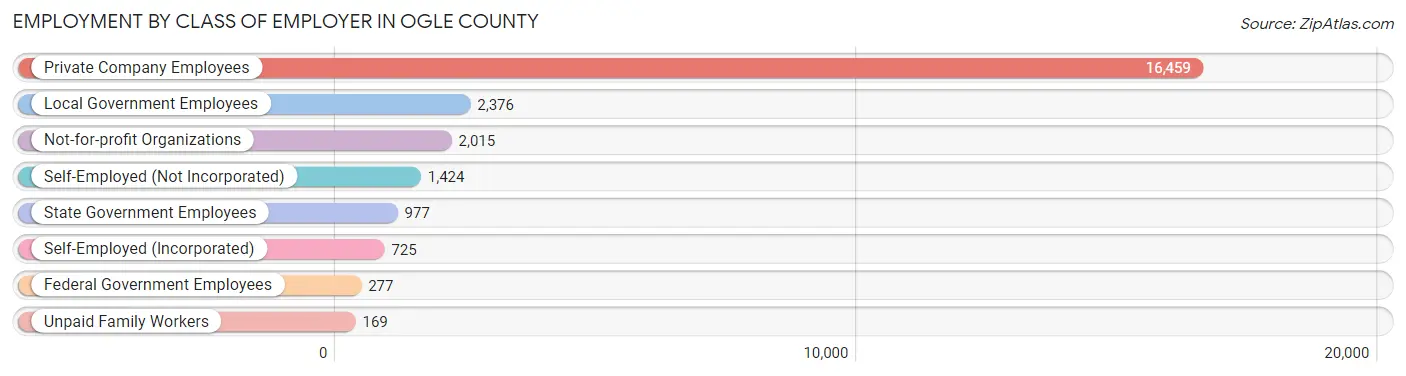
| Employer Class | # Employees | % Employees |
| Private Company Employees | 16,459 | 67.4% |
| Self-Employed (Incorporated) | 725 | 3.0% |
| Self-Employed (Not Incorporated) | 1,424 | 5.8% |
| Not-for-profit Organizations | 2,015 | 8.3% |
| Local Government Employees | 2,376 | 9.7% |
| State Government Employees | 977 | 4.0% |
| Federal Government Employees | 277 | 1.1% |
| Unpaid Family Workers | 169 | 0.7% |
| Total | 24,422 | 100.0% |
Employment Status by Age in Ogle County
According to the labor force statistics for Ogle County, out of the total population over 16 years of age (41,650), 63.6% or 26,489 individuals are in the labor force, with 6.0% or 1,589 of them unemployed. The age group with the highest labor force participation rate is 20 to 24 years, with 90.1% or 2,623 individuals in the labor force. Within the labor force, the 16 to 19 years age range has the highest percentage of unemployed individuals, with 22.9% or 284 of them being unemployed.
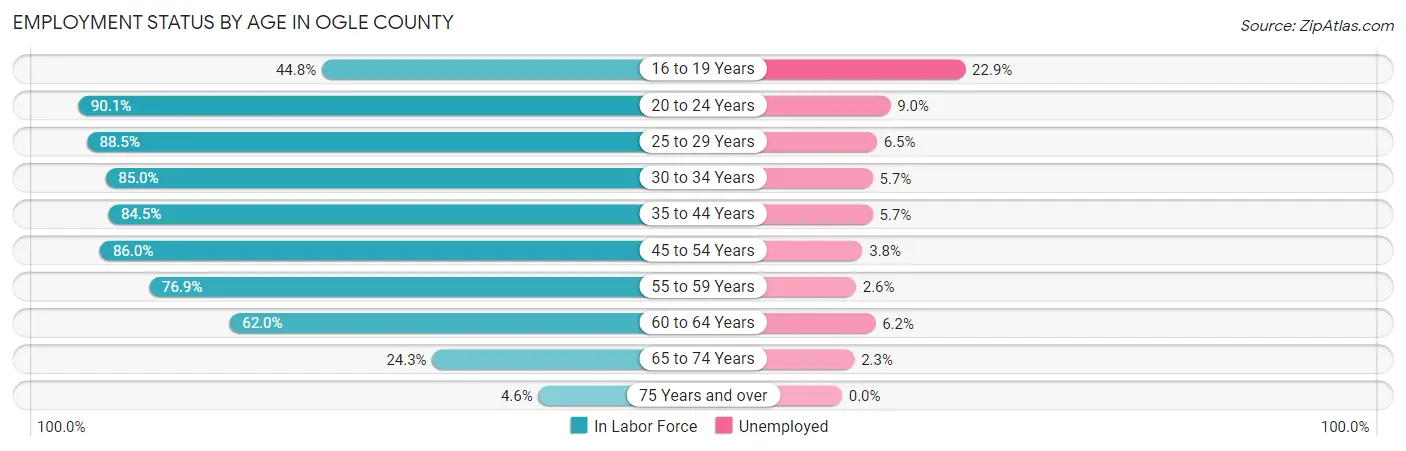
| Age Bracket | In Labor Force | Unemployed |
| 16 to 19 Years | 1,238 (44.8%) | 284 (22.9%) |
| 20 to 24 Years | 2,623 (90.1%) | 236 (9.0%) |
| 25 to 29 Years | 2,539 (88.5%) | 165 (6.5%) |
| 30 to 34 Years | 2,443 (85.0%) | 139 (5.7%) |
| 35 to 44 Years | 5,235 (84.5%) | 298 (5.7%) |
| 45 to 54 Years | 5,683 (86.0%) | 216 (3.8%) |
| 55 to 59 Years | 2,825 (76.9%) | 73 (2.6%) |
| 60 to 64 Years | 2,352 (62.0%) | 146 (6.2%) |
| 65 to 74 Years | 1,342 (24.3%) | 31 (2.3%) |
| 75 Years and over | 204 (4.6%) | 0 (0.0%) |
| Total | 26,489 (63.6%) | 1,589 (6.0%) |
Employment Status by Educational Attainment in Ogle County
According to labor force statistics for Ogle County, 81.0% of individuals (21,071) out of the total population between 25 and 64 years of age (26,014) are in the labor force, with 4.9% or 1,032 of them being unemployed. The group with the highest labor force participation rate are those with the educational attainment of bachelor's degree or higher, with 87.8% or 5,770 individuals in the labor force. Within the labor force, individuals with less than high school education have the highest percentage of unemployment, with 16.2% or 214 of them being unemployed.
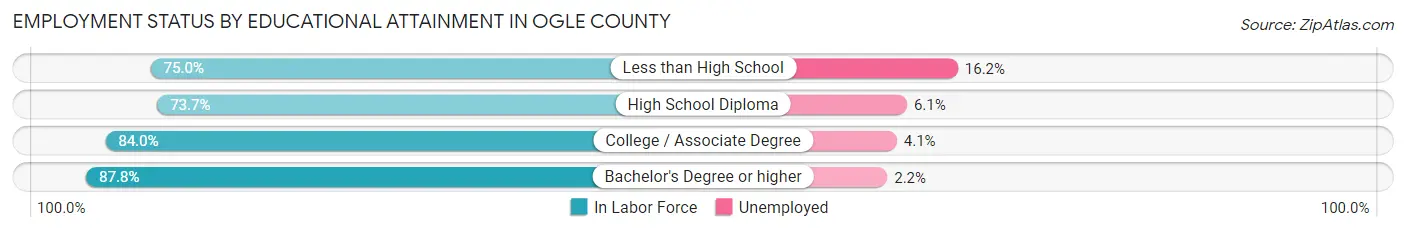
| Educational Attainment | In Labor Force | Unemployed |
| Less than High School | 1,324 (75.0%) | 286 (16.2%) |
| High School Diploma | 6,136 (73.7%) | 508 (6.1%) |
| College / Associate Degree | 7,854 (84.0%) | 383 (4.1%) |
| Bachelor's Degree or higher | 5,770 (87.8%) | 145 (2.2%) |
| Total | 21,071 (81.0%) | 1,275 (4.9%) |
Employment Occupations by Sex in Ogle County
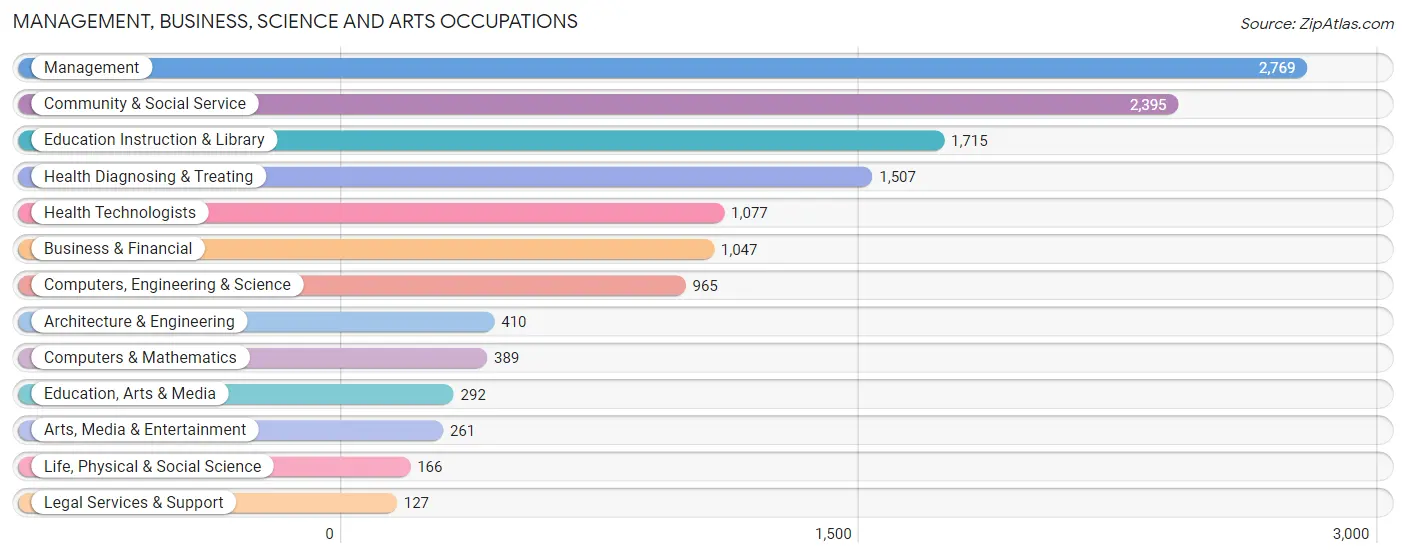
Management, Business, Science and Arts Occupations
The most common Management, Business, Science and Arts occupations in Ogle County are Management (2,769 | 11.1%), Community & Social Service (2,395 | 9.6%), Education Instruction & Library (1,715 | 6.9%), Health Diagnosing & Treating (1,507 | 6.0%), and Health Technologists (1,077 | 4.3%).
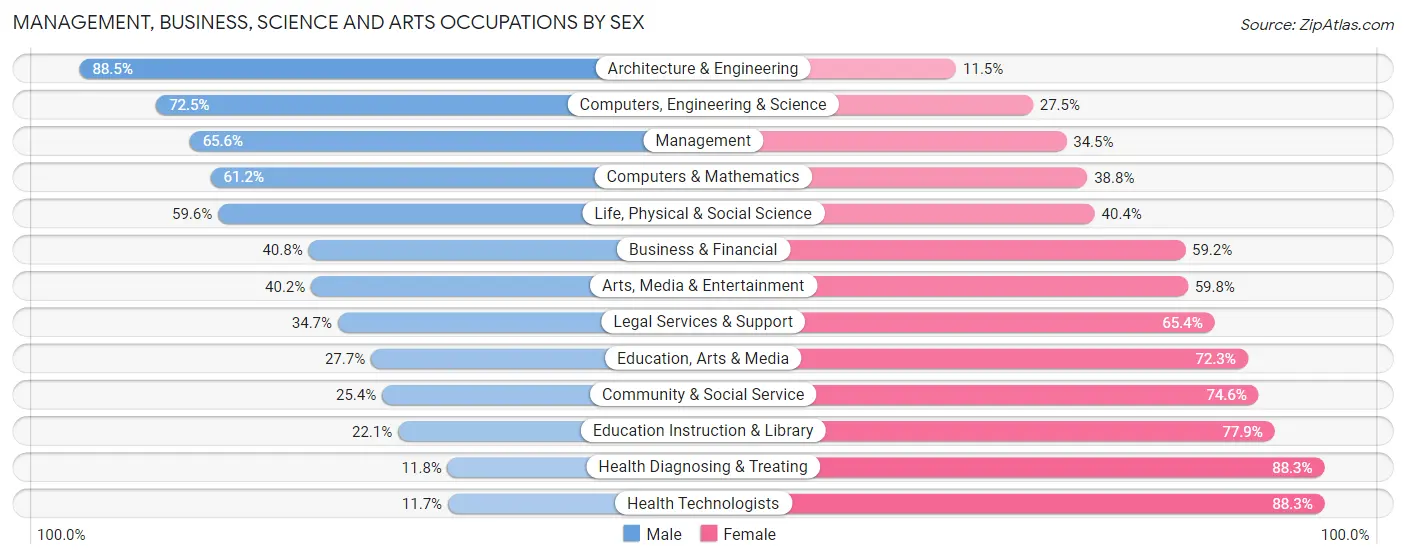
Management, Business, Science and Arts Occupations by Sex
Within the Management, Business, Science and Arts occupations in Ogle County, the most male-oriented occupations are Architecture & Engineering (88.5%), Computers, Engineering & Science (72.5%), and Management (65.5%), while the most female-oriented occupations are Health Technologists (88.3%), Health Diagnosing & Treating (88.2%), and Education Instruction & Library (77.9%).
| Occupation | Male | Female |
| Management | 1,815 (65.5%) | 954 (34.4%) |
| Business & Financial | 427 (40.8%) | 620 (59.2%) |
| Computers, Engineering & Science | 700 (72.5%) | 265 (27.5%) |
| Computers & Mathematics | 238 (61.2%) | 151 (38.8%) |
| Architecture & Engineering | 363 (88.5%) | 47 (11.5%) |
| Life, Physical & Social Science | 99 (59.6%) | 67 (40.4%) |
| Community & Social Service | 609 (25.4%) | 1,786 (74.6%) |
| Education, Arts & Media | 81 (27.7%) | 211 (72.3%) |
| Legal Services & Support | 44 (34.6%) | 83 (65.3%) |
| Education Instruction & Library | 379 (22.1%) | 1,336 (77.9%) |
| Arts, Media & Entertainment | 105 (40.2%) | 156 (59.8%) |
| Health Diagnosing & Treating | 177 (11.7%) | 1,330 (88.2%) |
| Health Technologists | 126 (11.7%) | 951 (88.3%) |
| Total (Category) | 3,728 (42.9%) | 4,955 (57.1%) |
| Total (Overall) | 13,449 (54.0%) | 11,444 (46.0%) |
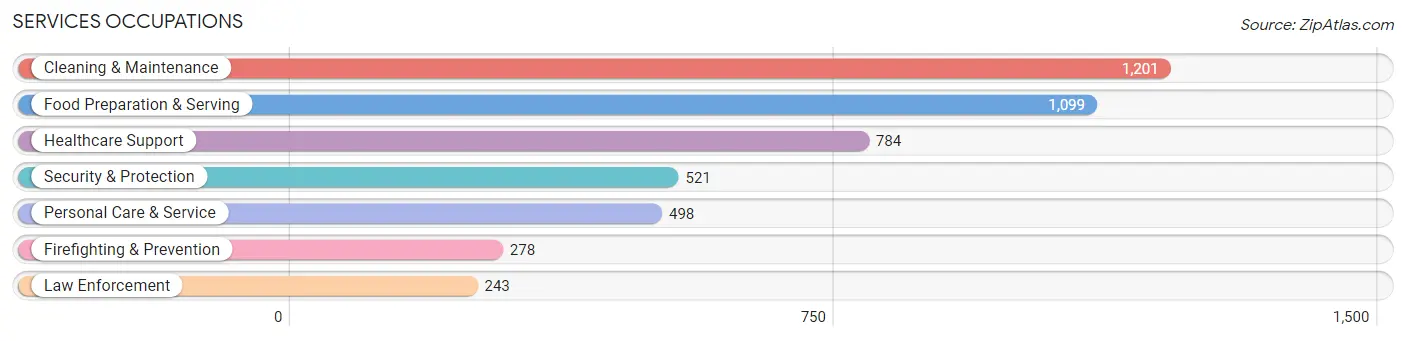
Services Occupations
The most common Services occupations in Ogle County are Cleaning & Maintenance (1,201 | 4.8%), Food Preparation & Serving (1,099 | 4.4%), Healthcare Support (784 | 3.2%), Security & Protection (521 | 2.1%), and Personal Care & Service (498 | 2.0%).
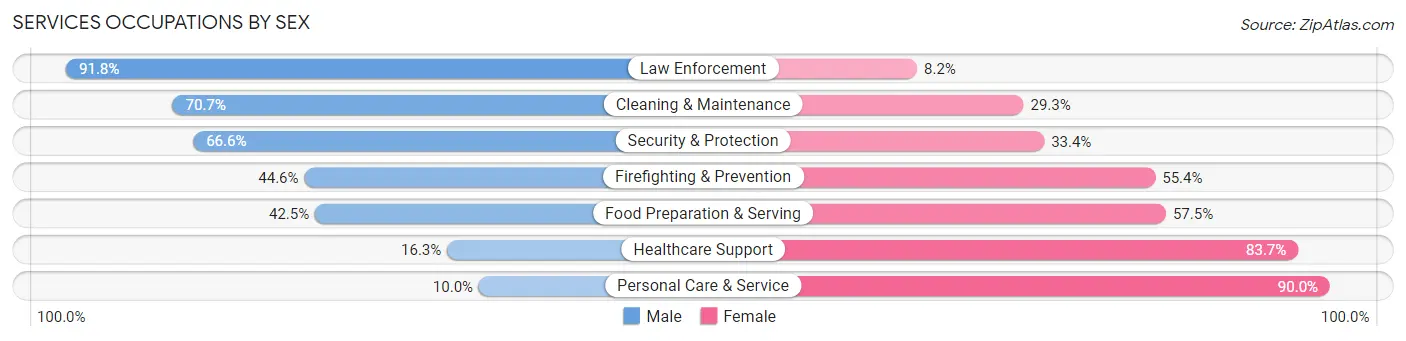
Services Occupations by Sex
Within the Services occupations in Ogle County, the most male-oriented occupations are Law Enforcement (91.8%), Cleaning & Maintenance (70.7%), and Security & Protection (66.6%), while the most female-oriented occupations are Personal Care & Service (90.0%), Healthcare Support (83.7%), and Food Preparation & Serving (57.5%).
| Occupation | Male | Female |
| Healthcare Support | 128 (16.3%) | 656 (83.7%) |
| Security & Protection | 347 (66.6%) | 174 (33.4%) |
| Firefighting & Prevention | 124 (44.6%) | 154 (55.4%) |
| Law Enforcement | 223 (91.8%) | 20 (8.2%) |
| Food Preparation & Serving | 467 (42.5%) | 632 (57.5%) |
| Cleaning & Maintenance | 849 (70.7%) | 352 (29.3%) |
| Personal Care & Service | 50 (10.0%) | 448 (90.0%) |
| Total (Category) | 1,841 (44.9%) | 2,262 (55.1%) |
| Total (Overall) | 13,449 (54.0%) | 11,444 (46.0%) |
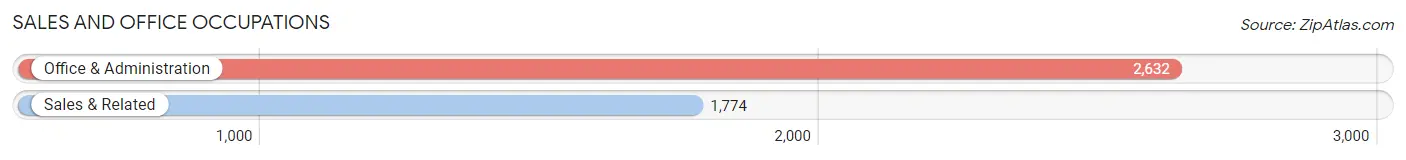
Sales and Office Occupations
The most common Sales and Office occupations in Ogle County are Office & Administration (2,632 | 10.6%), and Sales & Related (1,774 | 7.1%).
Sales and Office Occupations by Sex
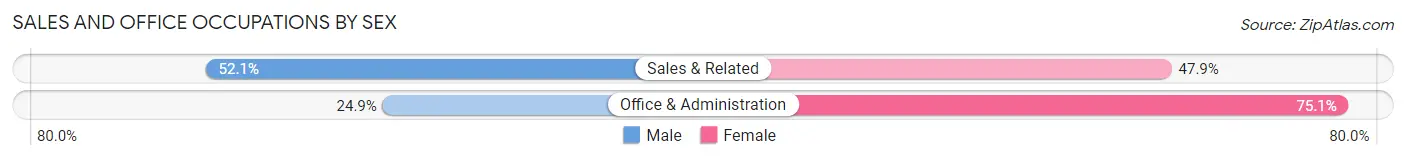
| Occupation | Male | Female |
| Sales & Related | 925 (52.1%) | 849 (47.9%) |
| Office & Administration | 656 (24.9%) | 1,976 (75.1%) |
| Total (Category) | 1,581 (35.9%) | 2,825 (64.1%) |
| Total (Overall) | 13,449 (54.0%) | 11,444 (46.0%) |
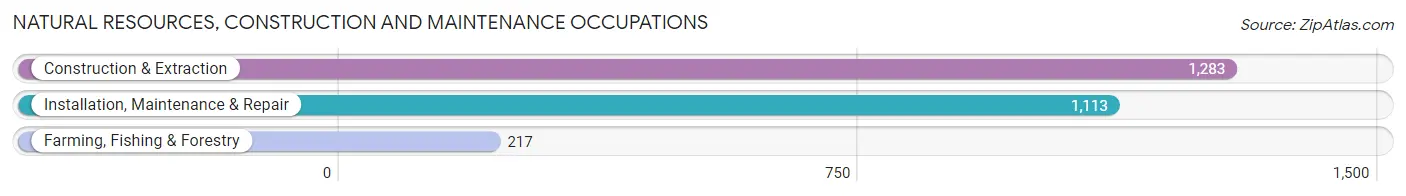
Natural Resources, Construction and Maintenance Occupations
The most common Natural Resources, Construction and Maintenance occupations in Ogle County are Construction & Extraction (1,283 | 5.1%), Installation, Maintenance & Repair (1,113 | 4.5%), and Farming, Fishing & Forestry (217 | 0.9%).
Natural Resources, Construction and Maintenance Occupations by Sex
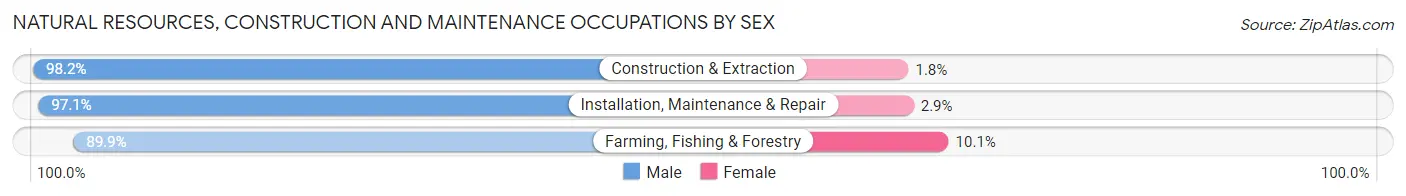
| Occupation | Male | Female |
| Farming, Fishing & Forestry | 195 (89.9%) | 22 (10.1%) |
| Construction & Extraction | 1,260 (98.2%) | 23 (1.8%) |
| Installation, Maintenance & Repair | 1,081 (97.1%) | 32 (2.9%) |
| Total (Category) | 2,536 (97.1%) | 77 (2.9%) |
| Total (Overall) | 13,449 (54.0%) | 11,444 (46.0%) |
Production, Transportation and Moving Occupations
The most common Production, Transportation and Moving occupations in Ogle County are Production (2,092 | 8.4%), Material Moving (1,650 | 6.6%), and Transportation (1,346 | 5.4%).
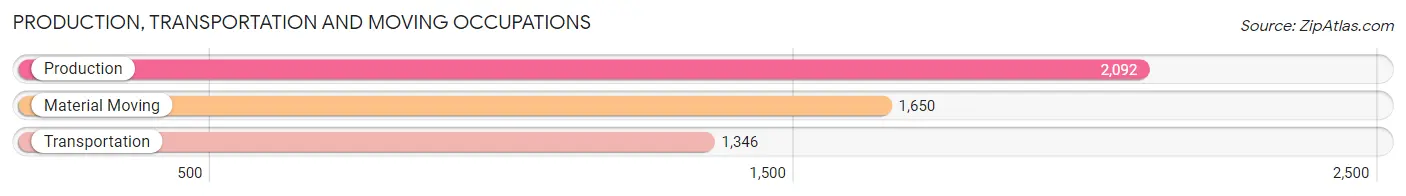
Production, Transportation and Moving Occupations by Sex
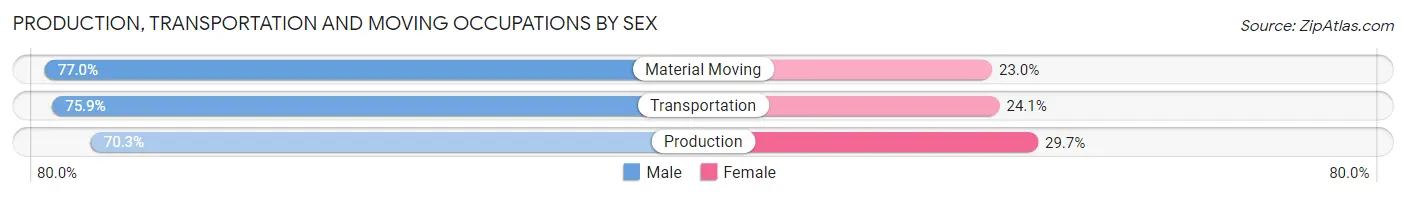
| Occupation | Male | Female |
| Production | 1,470 (70.3%) | 622 (29.7%) |
| Transportation | 1,022 (75.9%) | 324 (24.1%) |
| Material Moving | 1,271 (77.0%) | 379 (23.0%) |
| Total (Category) | 3,763 (74.0%) | 1,325 (26.0%) |
| Total (Overall) | 13,449 (54.0%) | 11,444 (46.0%) |
Employment Industries by Sex in Ogle County
Employment Industries in Ogle County
The major employment industries in Ogle County include Manufacturing (4,281 | 17.2%), Health Care & Social Assistance (3,503 | 14.1%), Retail Trade (2,735 | 11.0%), Educational Services (2,665 | 10.7%), and Construction (1,699 | 6.8%).
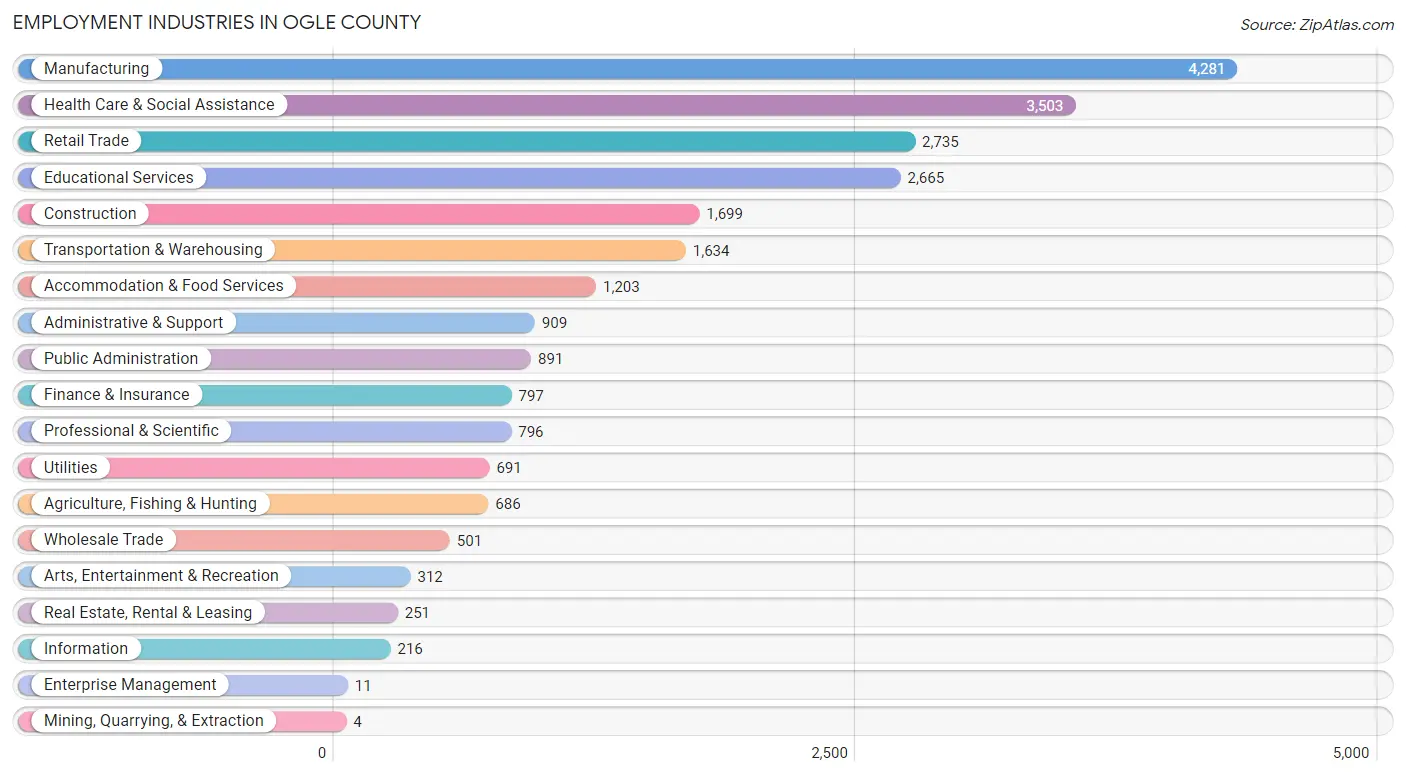
Employment Industries by Sex in Ogle County
The Ogle County industries that see more men than women are Mining, Quarrying, & Extraction (100.0%), Construction (93.8%), and Agriculture, Fishing & Hunting (88.0%), whereas the industries that tend to have a higher number of women are Health Care & Social Assistance (85.8%), Educational Services (73.1%), and Enterprise Management (72.7%).
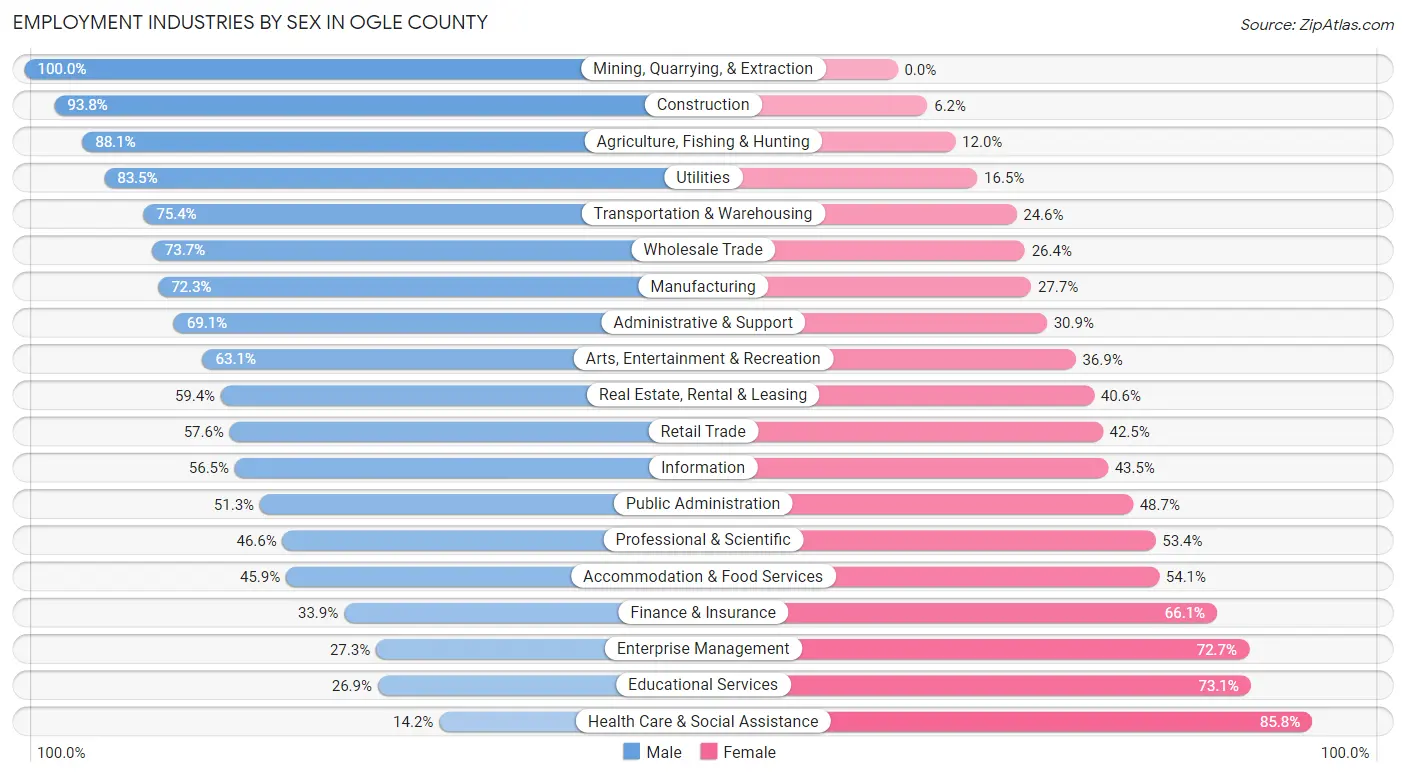
| Industry | Male | Female |
| Agriculture, Fishing & Hunting | 604 (88.0%) | 82 (11.9%) |
| Mining, Quarrying, & Extraction | 4 (100.0%) | 0 (0.0%) |
| Construction | 1,594 (93.8%) | 105 (6.2%) |
| Manufacturing | 3,097 (72.3%) | 1,184 (27.7%) |
| Wholesale Trade | 369 (73.7%) | 132 (26.4%) |
| Retail Trade | 1,574 (57.6%) | 1,161 (42.4%) |
| Transportation & Warehousing | 1,232 (75.4%) | 402 (24.6%) |
| Utilities | 577 (83.5%) | 114 (16.5%) |
| Information | 122 (56.5%) | 94 (43.5%) |
| Finance & Insurance | 270 (33.9%) | 527 (66.1%) |
| Real Estate, Rental & Leasing | 149 (59.4%) | 102 (40.6%) |
| Professional & Scientific | 371 (46.6%) | 425 (53.4%) |
| Enterprise Management | 3 (27.3%) | 8 (72.7%) |
| Administrative & Support | 628 (69.1%) | 281 (30.9%) |
| Educational Services | 717 (26.9%) | 1,948 (73.1%) |
| Health Care & Social Assistance | 497 (14.2%) | 3,006 (85.8%) |
| Arts, Entertainment & Recreation | 197 (63.1%) | 115 (36.9%) |
| Accommodation & Food Services | 552 (45.9%) | 651 (54.1%) |
| Public Administration | 457 (51.3%) | 434 (48.7%) |
| Total | 13,449 (54.0%) | 11,444 (46.0%) |
Education in Ogle County
School Enrollment in Ogle County
The most common levels of schooling among the 12,318 students in Ogle County are high school (3,070 | 24.9%), middle school (2,894 | 23.5%), and elementary school (2,309 | 18.7%).
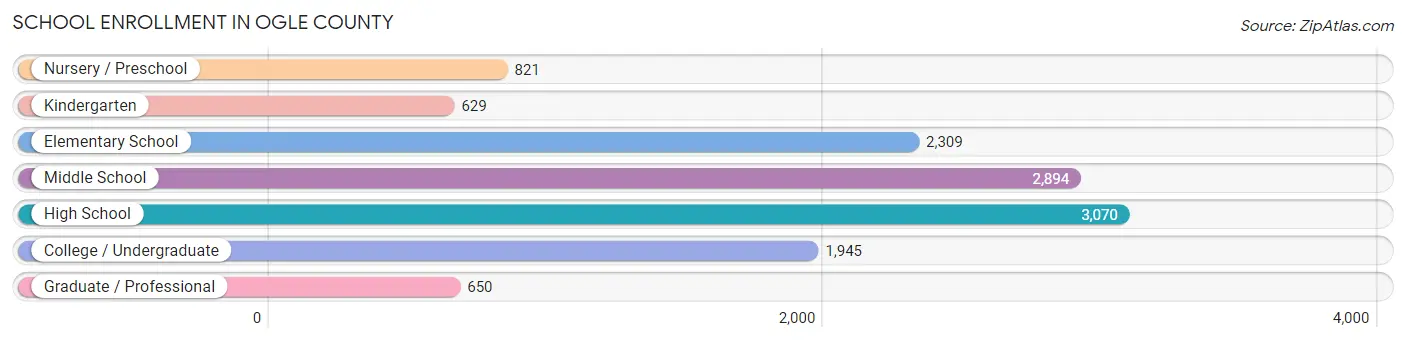
| School Level | # Students | % Students |
| Nursery / Preschool | 821 | 6.7% |
| Kindergarten | 629 | 5.1% |
| Elementary School | 2,309 | 18.7% |
| Middle School | 2,894 | 23.5% |
| High School | 3,070 | 24.9% |
| College / Undergraduate | 1,945 | 15.8% |
| Graduate / Professional | 650 | 5.3% |
| Total | 12,318 | 100.0% |
School Enrollment by Age by Funding Source in Ogle County
Out of a total of 12,318 students who are enrolled in schools in Ogle County, 1,712 (13.9%) attend a private institution, while the remaining 10,606 (86.1%) are enrolled in public schools. The age group of 25 to 34 year olds has the highest likelihood of being enrolled in private schools, with 178 (26.1% in the age bracket) enrolled. Conversely, the age group of 20 to 24 year olds has the lowest likelihood of being enrolled in a private school, with 758 (90.8% in the age bracket) attending a public institution.
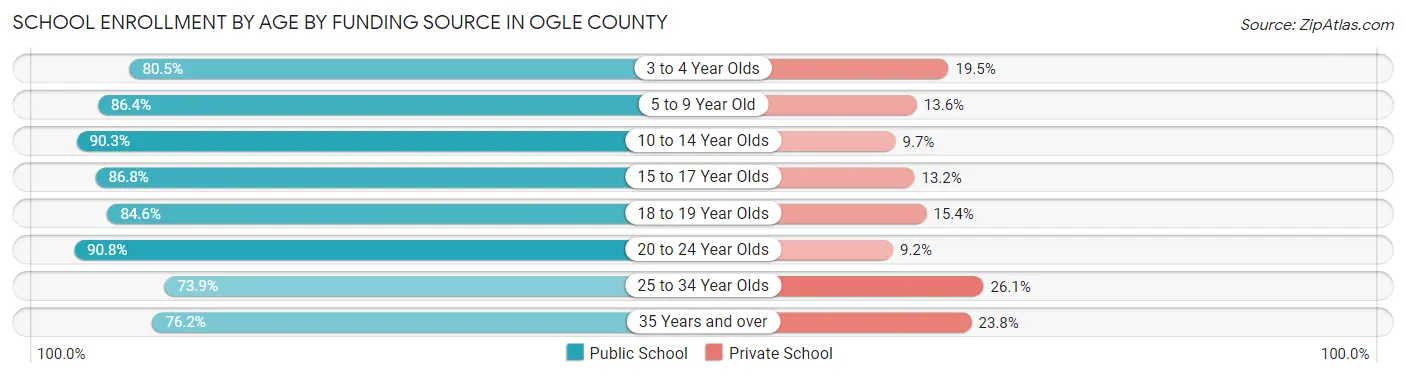
| Age Bracket | Public School | Private School |
| 3 to 4 Year Olds | 490 (80.5%) | 119 (19.5%) |
| 5 to 9 Year Old | 2,437 (86.4%) | 385 (13.6%) |
| 10 to 14 Year Olds | 3,220 (90.3%) | 345 (9.7%) |
| 15 to 17 Year Olds | 1,855 (86.8%) | 282 (13.2%) |
| 18 to 19 Year Olds | 767 (84.6%) | 140 (15.4%) |
| 20 to 24 Year Olds | 758 (90.8%) | 77 (9.2%) |
| 25 to 34 Year Olds | 505 (73.9%) | 178 (26.1%) |
| 35 Years and over | 579 (76.2%) | 181 (23.8%) |
| Total | 10,606 (86.1%) | 1,712 (13.9%) |
Educational Attainment by Field of Study in Ogle County
Education (2,052 | 22.6%), business (1,780 | 19.6%), science & technology (1,217 | 13.4%), arts & humanities (673 | 7.4%), and bio, nature & agricultural (593 | 6.5%) are the most common fields of study among 9,062 individuals in Ogle County who have obtained a bachelor's degree or higher.
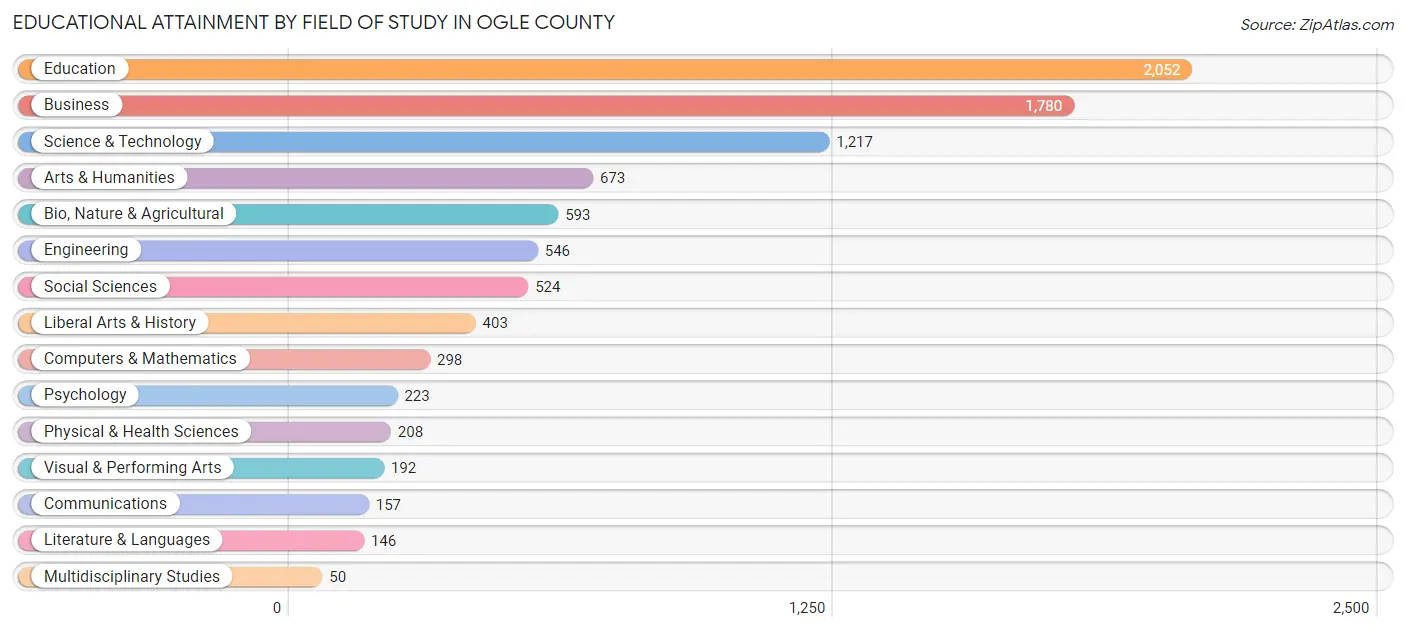
| Field of Study | # Graduates | % Graduates |
| Computers & Mathematics | 298 | 3.3% |
| Bio, Nature & Agricultural | 593 | 6.5% |
| Physical & Health Sciences | 208 | 2.3% |
| Psychology | 223 | 2.5% |
| Social Sciences | 524 | 5.8% |
| Engineering | 546 | 6.0% |
| Multidisciplinary Studies | 50 | 0.5% |
| Science & Technology | 1,217 | 13.4% |
| Business | 1,780 | 19.6% |
| Education | 2,052 | 22.6% |
| Literature & Languages | 146 | 1.6% |
| Liberal Arts & History | 403 | 4.4% |
| Visual & Performing Arts | 192 | 2.1% |
| Communications | 157 | 1.7% |
| Arts & Humanities | 673 | 7.4% |
| Total | 9,062 | 100.0% |
Transportation & Commute in Ogle County
Vehicle Availability by Sex in Ogle County
The most prevalent vehicle ownership categories in Ogle County are males with 2 vehicles (5,809, accounting for 43.9%) and females with 2 vehicles (4,607, making up 52.1%).
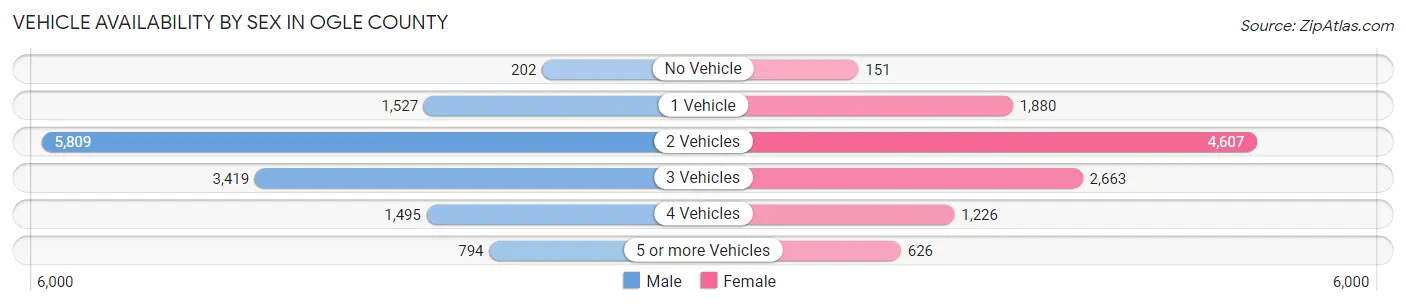
| Vehicles Available | Male | Female |
| No Vehicle | 202 (1.5%) | 151 (1.3%) |
| 1 Vehicle | 1,527 (11.5%) | 1,880 (16.9%) |
| 2 Vehicles | 5,809 (43.9%) | 4,607 (41.3%) |
| 3 Vehicles | 3,419 (25.8%) | 2,663 (23.9%) |
| 4 Vehicles | 1,495 (11.3%) | 1,226 (11.0%) |
| 5 or more Vehicles | 794 (6.0%) | 626 (5.6%) |
| Total | 13,246 (100.0%) | 11,153 (100.0%) |
Commute Time in Ogle County
The most frequently occuring commute durations in Ogle County are 20 to 24 minutes (3,019 commuters, 13.2%), 10 to 14 minutes (2,908 commuters, 12.7%), and 30 to 34 minutes (2,877 commuters, 12.6%).
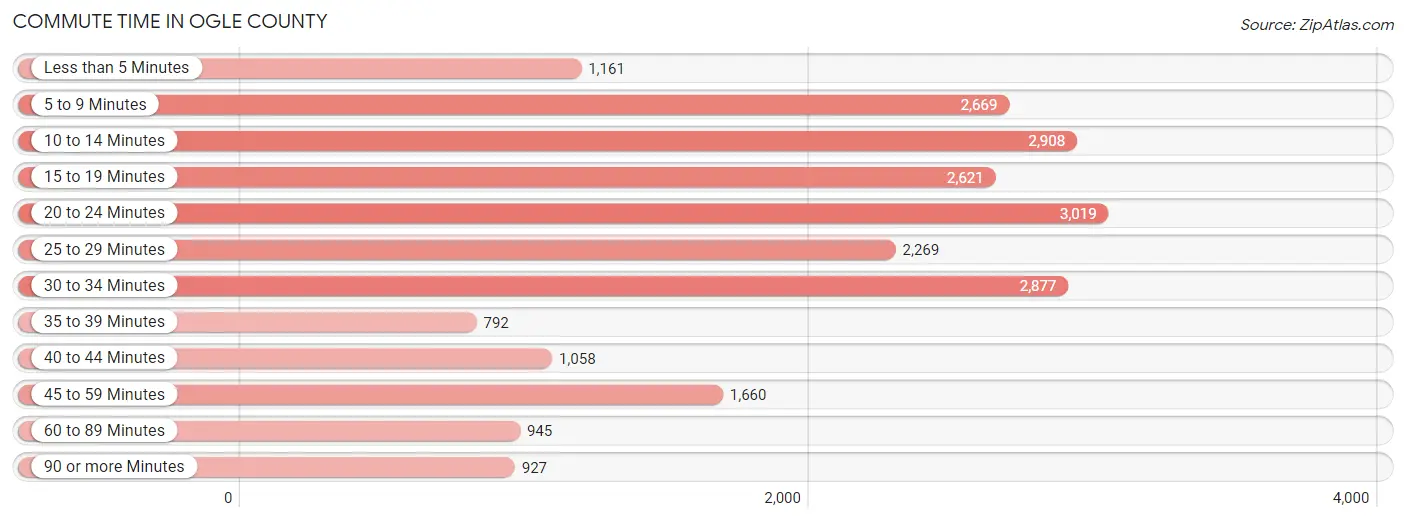
| Commute Time | # Commuters | % Commuters |
| Less than 5 Minutes | 1,161 | 5.1% |
| 5 to 9 Minutes | 2,669 | 11.7% |
| 10 to 14 Minutes | 2,908 | 12.7% |
| 15 to 19 Minutes | 2,621 | 11.4% |
| 20 to 24 Minutes | 3,019 | 13.2% |
| 25 to 29 Minutes | 2,269 | 9.9% |
| 30 to 34 Minutes | 2,877 | 12.6% |
| 35 to 39 Minutes | 792 | 3.5% |
| 40 to 44 Minutes | 1,058 | 4.6% |
| 45 to 59 Minutes | 1,660 | 7.2% |
| 60 to 89 Minutes | 945 | 4.1% |
| 90 or more Minutes | 927 | 4.1% |
Commute Time by Sex in Ogle County
The most common commute times in Ogle County are 20 to 24 minutes (1,580 commuters, 12.6%) for males and 10 to 14 minutes (1,526 commuters, 14.7%) for females.

| Commute Time | Male | Female |
| Less than 5 Minutes | 651 (5.2%) | 510 (4.9%) |
| 5 to 9 Minutes | 1,452 (11.6%) | 1,217 (11.7%) |
| 10 to 14 Minutes | 1,382 (11.0%) | 1,526 (14.7%) |
| 15 to 19 Minutes | 1,344 (10.7%) | 1,277 (12.3%) |
| 20 to 24 Minutes | 1,580 (12.6%) | 1,439 (13.9%) |
| 25 to 29 Minutes | 1,125 (9.0%) | 1,144 (11.0%) |
| 30 to 34 Minutes | 1,526 (12.2%) | 1,351 (13.0%) |
| 35 to 39 Minutes | 345 (2.8%) | 447 (4.3%) |
| 40 to 44 Minutes | 525 (4.2%) | 533 (5.1%) |
| 45 to 59 Minutes | 1,208 (9.6%) | 452 (4.4%) |
| 60 to 89 Minutes | 603 (4.8%) | 342 (3.3%) |
| 90 or more Minutes | 789 (6.3%) | 138 (1.3%) |
Time of Departure to Work by Sex in Ogle County
The most frequent times of departure to work in Ogle County are 12:00 AM to 4:59 AM (1,664, 13.3%) for males and 7:00 AM to 7:29 AM (2,027, 19.5%) for females.
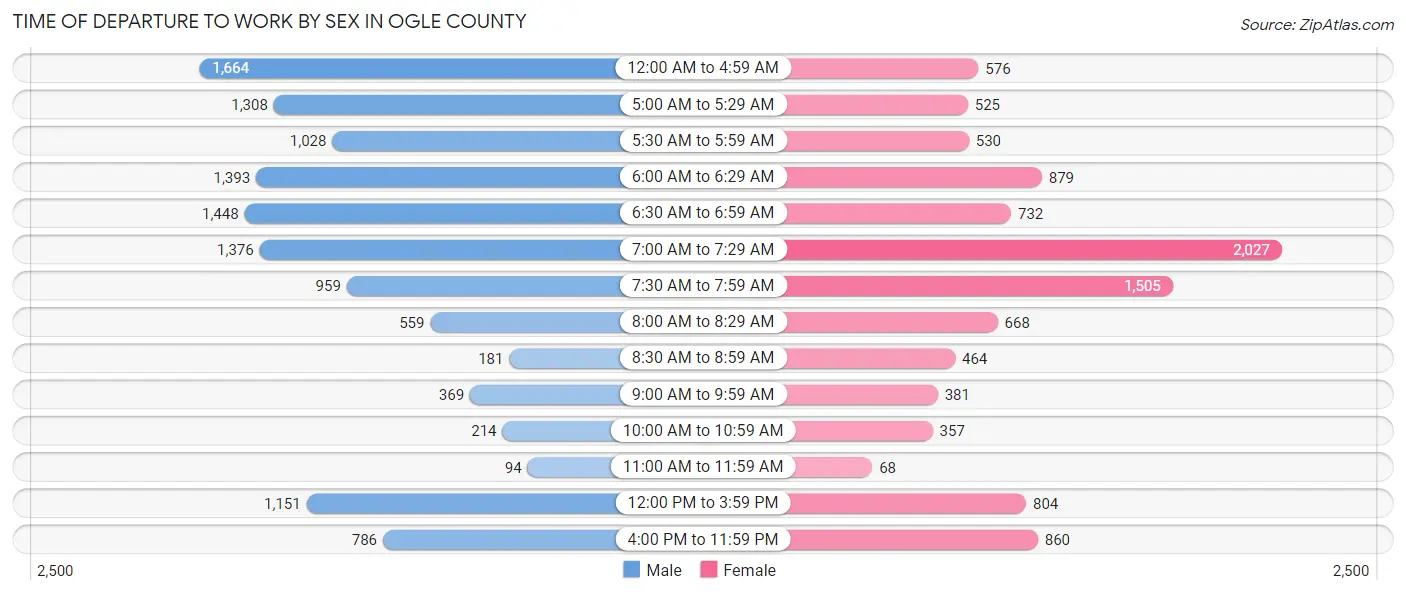
| Time of Departure | Male | Female |
| 12:00 AM to 4:59 AM | 1,664 (13.3%) | 576 (5.6%) |
| 5:00 AM to 5:29 AM | 1,308 (10.4%) | 525 (5.1%) |
| 5:30 AM to 5:59 AM | 1,028 (8.2%) | 530 (5.1%) |
| 6:00 AM to 6:29 AM | 1,393 (11.1%) | 879 (8.5%) |
| 6:30 AM to 6:59 AM | 1,448 (11.6%) | 732 (7.0%) |
| 7:00 AM to 7:29 AM | 1,376 (11.0%) | 2,027 (19.5%) |
| 7:30 AM to 7:59 AM | 959 (7.6%) | 1,505 (14.5%) |
| 8:00 AM to 8:29 AM | 559 (4.5%) | 668 (6.4%) |
| 8:30 AM to 8:59 AM | 181 (1.4%) | 464 (4.5%) |
| 9:00 AM to 9:59 AM | 369 (2.9%) | 381 (3.7%) |
| 10:00 AM to 10:59 AM | 214 (1.7%) | 357 (3.4%) |
| 11:00 AM to 11:59 AM | 94 (0.7%) | 68 (0.7%) |
| 12:00 PM to 3:59 PM | 1,151 (9.2%) | 804 (7.7%) |
| 4:00 PM to 11:59 PM | 786 (6.3%) | 860 (8.3%) |
| Total | 12,530 (100.0%) | 10,376 (100.0%) |
Housing Occupancy in Ogle County
Occupancy by Ownership in Ogle County
Of the total 20,807 dwellings in Ogle County, owner-occupied units account for 15,232 (73.2%), while renter-occupied units make up 5,575 (26.8%).
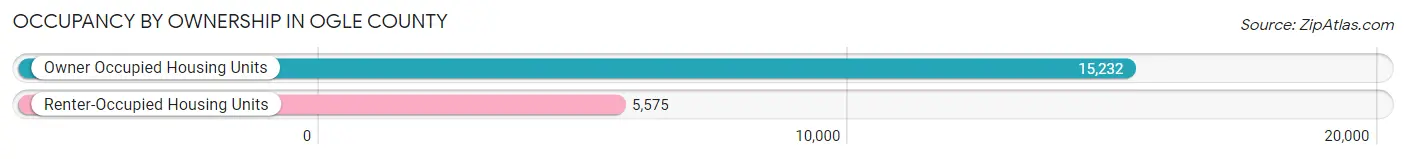
| Occupancy | # Housing Units | % Housing Units |
| Owner Occupied Housing Units | 15,232 | 73.2% |
| Renter-Occupied Housing Units | 5,575 | 26.8% |
| Total Occupied Housing Units | 20,807 | 100.0% |
Occupancy by Household Size in Ogle County
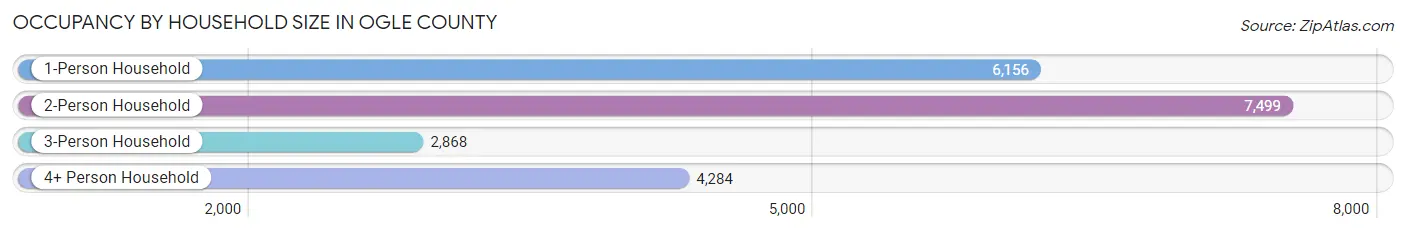
| Household Size | # Housing Units | % Housing Units |
| 1-Person Household | 6,156 | 29.6% |
| 2-Person Household | 7,499 | 36.0% |
| 3-Person Household | 2,868 | 13.8% |
| 4+ Person Household | 4,284 | 20.6% |
| Total Housing Units | 20,807 | 100.0% |
Occupancy by Ownership by Household Size in Ogle County
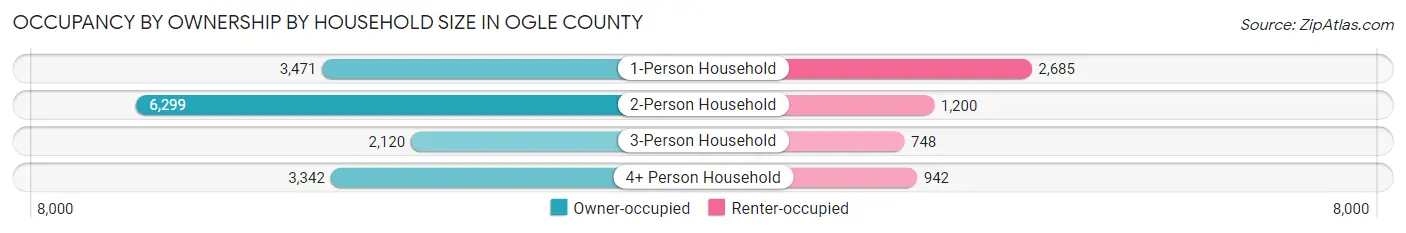
| Household Size | Owner-occupied | Renter-occupied |
| 1-Person Household | 3,471 (56.4%) | 2,685 (43.6%) |
| 2-Person Household | 6,299 (84.0%) | 1,200 (16.0%) |
| 3-Person Household | 2,120 (73.9%) | 748 (26.1%) |
| 4+ Person Household | 3,342 (78.0%) | 942 (22.0%) |
| Total Housing Units | 15,232 (73.2%) | 5,575 (26.8%) |
Occupancy by Educational Attainment in Ogle County
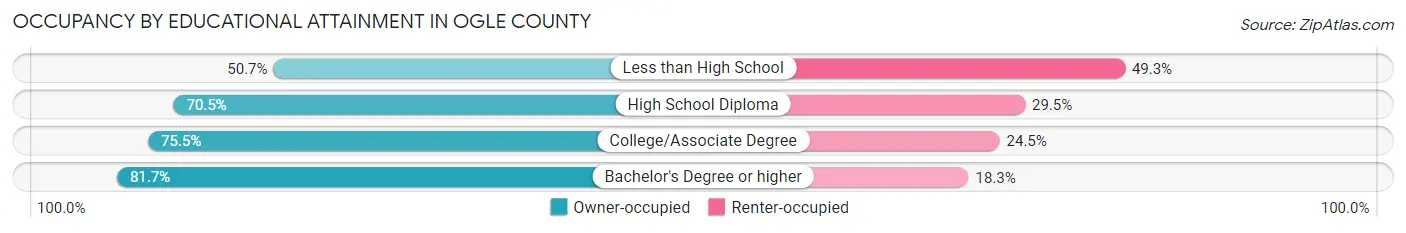
| Household Size | Owner-occupied | Renter-occupied |
| Less than High School | 967 (50.7%) | 941 (49.3%) |
| High School Diploma | 4,500 (70.5%) | 1,885 (29.5%) |
| College/Associate Degree | 5,604 (75.5%) | 1,816 (24.5%) |
| Bachelor's Degree or higher | 4,161 (81.7%) | 933 (18.3%) |
Occupancy by Age of Householder in Ogle County
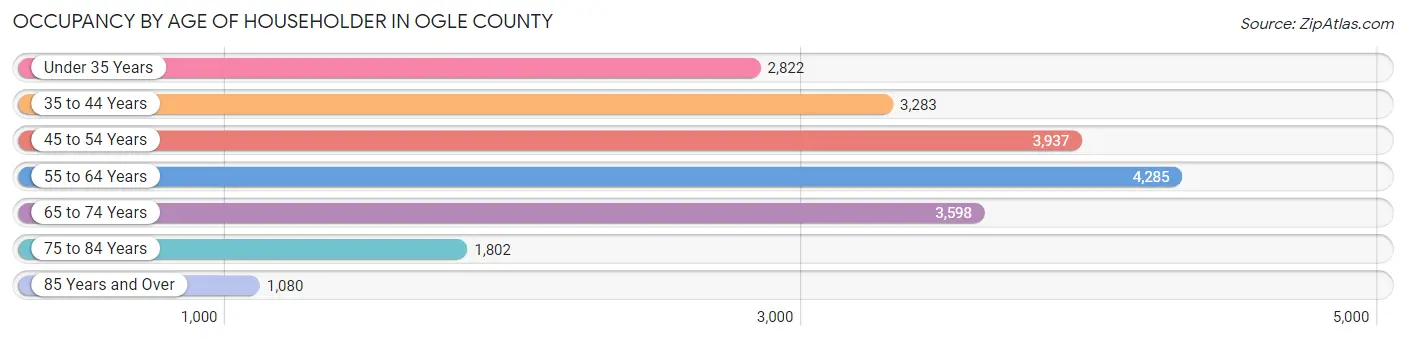
| Age Bracket | # Households | % Households |
| Under 35 Years | 2,822 | 13.6% |
| 35 to 44 Years | 3,283 | 15.8% |
| 45 to 54 Years | 3,937 | 18.9% |
| 55 to 64 Years | 4,285 | 20.6% |
| 65 to 74 Years | 3,598 | 17.3% |
| 75 to 84 Years | 1,802 | 8.7% |
| 85 Years and Over | 1,080 | 5.2% |
| Total | 20,807 | 100.0% |
Housing Finances in Ogle County
Median Income by Occupancy in Ogle County
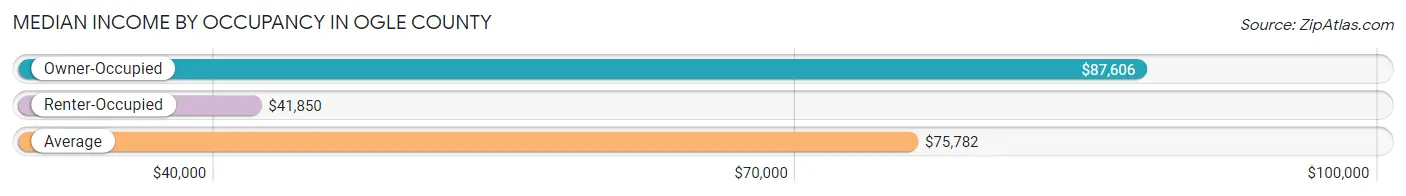
| Occupancy Type | # Households | Median Income |
| Owner-Occupied | 15,232 (73.2%) | $87,606 |
| Renter-Occupied | 5,575 (26.8%) | $41,850 |
| Average | 20,807 (100.0%) | $75,782 |
Occupancy by Householder Income Bracket in Ogle County
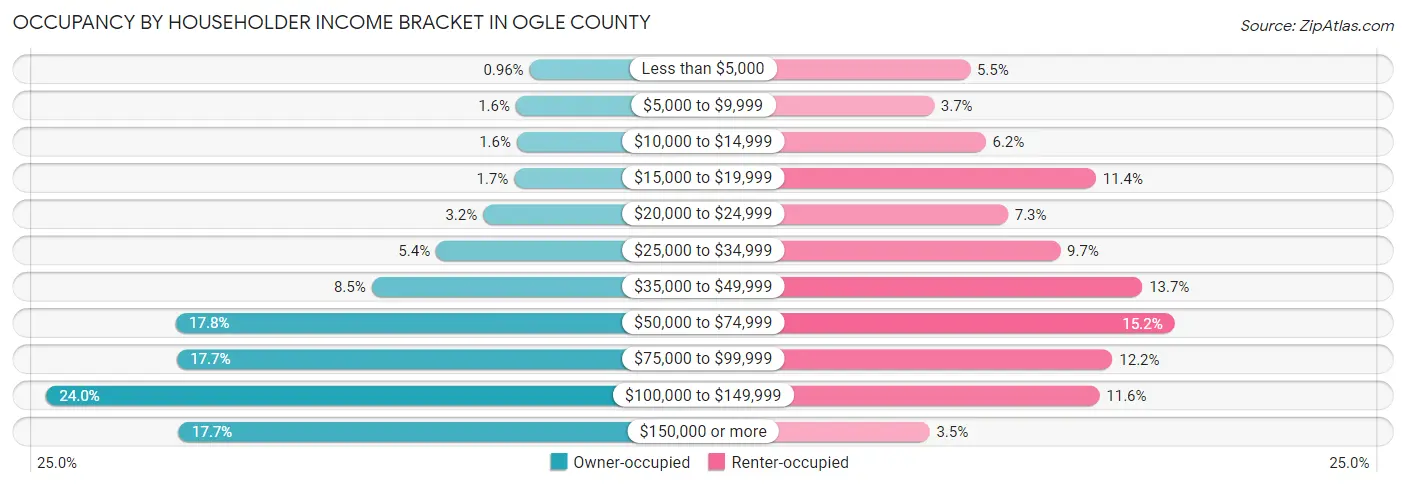
| Income Bracket | Owner-occupied | Renter-occupied |
| Less than $5,000 | 146 (1.0%) | 304 (5.4%) |
| $5,000 to $9,999 | 245 (1.6%) | 208 (3.7%) |
| $10,000 to $14,999 | 238 (1.6%) | 345 (6.2%) |
| $15,000 to $19,999 | 258 (1.7%) | 638 (11.4%) |
| $20,000 to $24,999 | 483 (3.2%) | 404 (7.2%) |
| $25,000 to $34,999 | 824 (5.4%) | 543 (9.7%) |
| $35,000 to $49,999 | 1,292 (8.5%) | 761 (13.7%) |
| $50,000 to $74,999 | 2,708 (17.8%) | 847 (15.2%) |
| $75,000 to $99,999 | 2,701 (17.7%) | 682 (12.2%) |
| $100,000 to $149,999 | 3,649 (24.0%) | 647 (11.6%) |
| $150,000 or more | 2,688 (17.6%) | 196 (3.5%) |
| Total | 15,232 (100.0%) | 5,575 (100.0%) |
Monthly Housing Cost Tiers in Ogle County
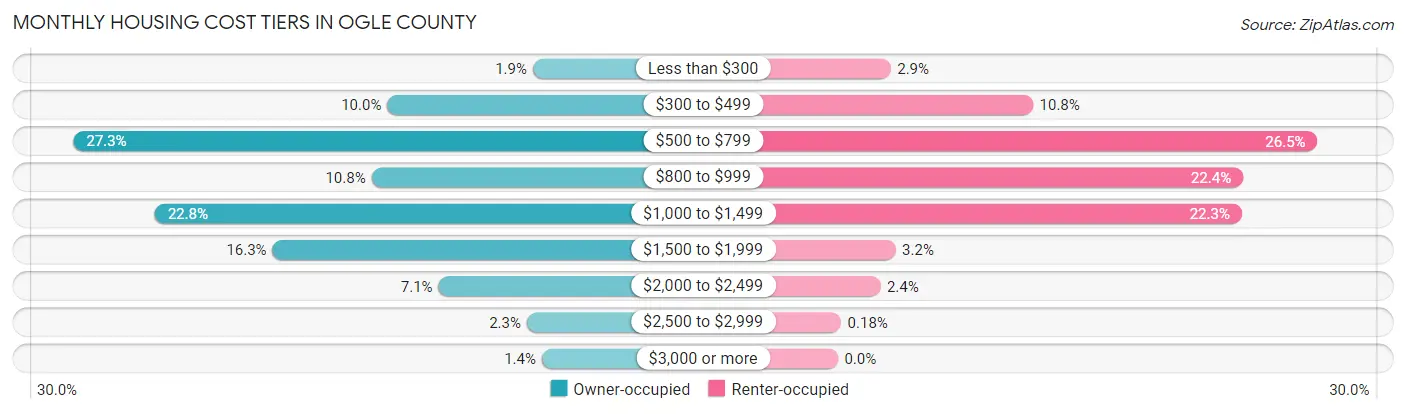
| Monthly Cost | Owner-occupied | Renter-occupied |
| Less than $300 | 294 (1.9%) | 163 (2.9%) |
| $300 to $499 | 1,518 (10.0%) | 601 (10.8%) |
| $500 to $799 | 4,160 (27.3%) | 1,478 (26.5%) |
| $800 to $999 | 1,651 (10.8%) | 1,249 (22.4%) |
| $1,000 to $1,499 | 3,475 (22.8%) | 1,245 (22.3%) |
| $1,500 to $1,999 | 2,484 (16.3%) | 178 (3.2%) |
| $2,000 to $2,499 | 1,087 (7.1%) | 131 (2.4%) |
| $2,500 to $2,999 | 345 (2.3%) | 10 (0.2%) |
| $3,000 or more | 218 (1.4%) | 0 (0.0%) |
| Total | 15,232 (100.0%) | 5,575 (100.0%) |
Physical Housing Characteristics in Ogle County
Housing Structures in Ogle County
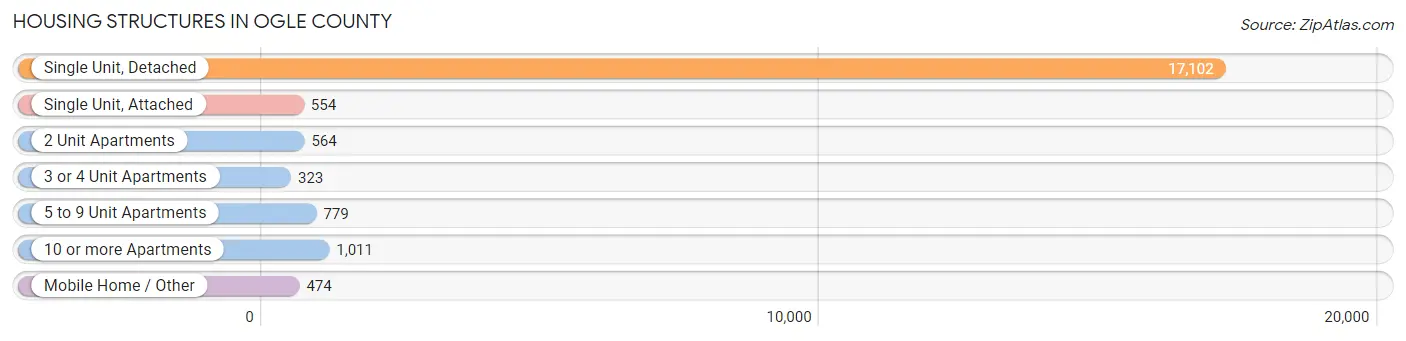
| Structure Type | # Housing Units | % Housing Units |
| Single Unit, Detached | 17,102 | 82.2% |
| Single Unit, Attached | 554 | 2.7% |
| 2 Unit Apartments | 564 | 2.7% |
| 3 or 4 Unit Apartments | 323 | 1.5% |
| 5 to 9 Unit Apartments | 779 | 3.7% |
| 10 or more Apartments | 1,011 | 4.9% |
| Mobile Home / Other | 474 | 2.3% |
| Total | 20,807 | 100.0% |
Housing Structures by Occupancy in Ogle County
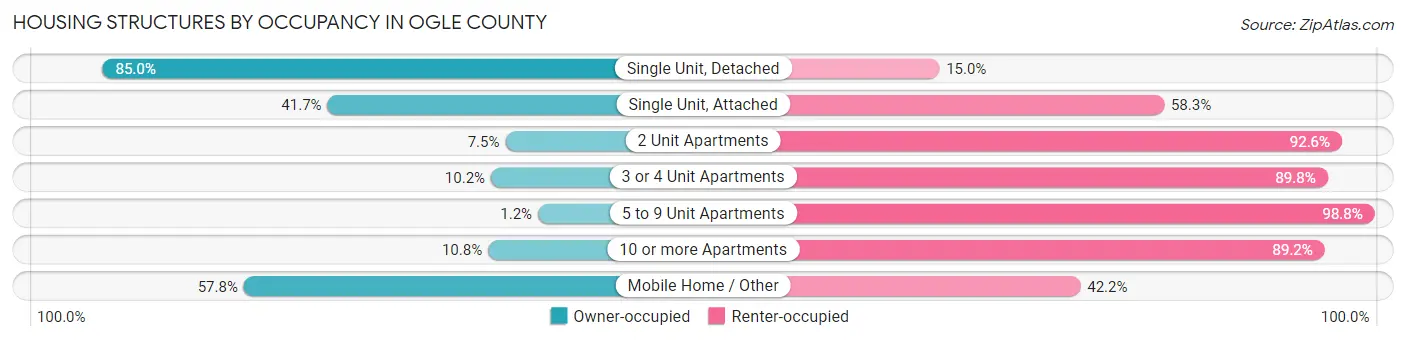
| Structure Type | Owner-occupied | Renter-occupied |
| Single Unit, Detached | 14,534 (85.0%) | 2,568 (15.0%) |
| Single Unit, Attached | 231 (41.7%) | 323 (58.3%) |
| 2 Unit Apartments | 42 (7.4%) | 522 (92.5%) |
| 3 or 4 Unit Apartments | 33 (10.2%) | 290 (89.8%) |
| 5 to 9 Unit Apartments | 9 (1.2%) | 770 (98.8%) |
| 10 or more Apartments | 109 (10.8%) | 902 (89.2%) |
| Mobile Home / Other | 274 (57.8%) | 200 (42.2%) |
| Total | 15,232 (73.2%) | 5,575 (26.8%) |
Housing Structures by Number of Rooms in Ogle County
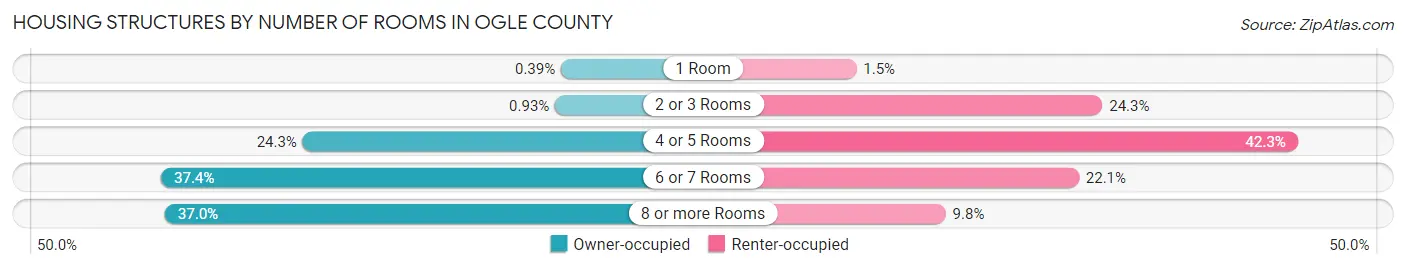
| Number of Rooms | Owner-occupied | Renter-occupied |
| 1 Room | 60 (0.4%) | 85 (1.5%) |
| 2 or 3 Rooms | 142 (0.9%) | 1,353 (24.3%) |
| 4 or 5 Rooms | 3,699 (24.3%) | 2,360 (42.3%) |
| 6 or 7 Rooms | 5,692 (37.4%) | 1,232 (22.1%) |
| 8 or more Rooms | 5,639 (37.0%) | 545 (9.8%) |
| Total | 15,232 (100.0%) | 5,575 (100.0%) |
Housing Structure by Heating Type in Ogle County
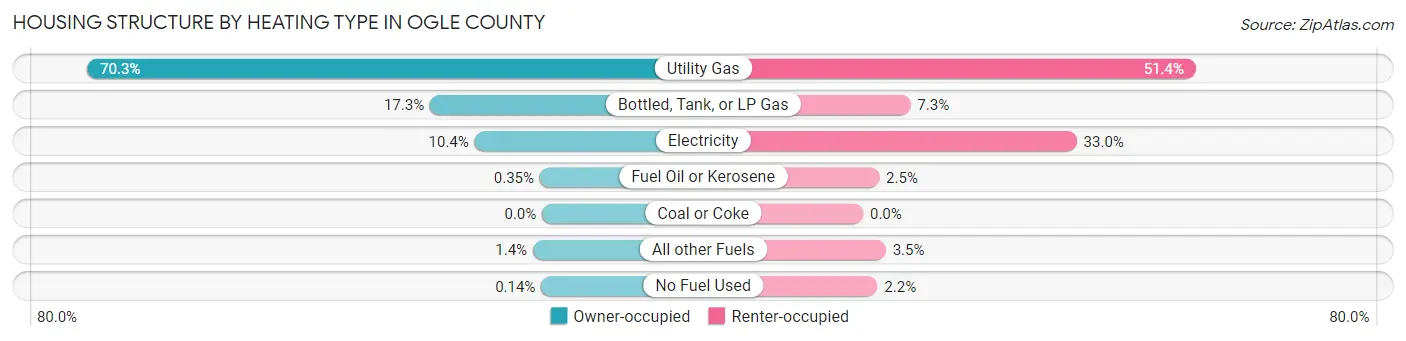
| Heating Type | Owner-occupied | Renter-occupied |
| Utility Gas | 10,712 (70.3%) | 2,868 (51.4%) |
| Bottled, Tank, or LP Gas | 2,640 (17.3%) | 408 (7.3%) |
| Electricity | 1,588 (10.4%) | 1,841 (33.0%) |
| Fuel Oil or Kerosene | 54 (0.4%) | 139 (2.5%) |
| Coal or Coke | 0 (0.0%) | 0 (0.0%) |
| All other Fuels | 217 (1.4%) | 195 (3.5%) |
| No Fuel Used | 21 (0.1%) | 124 (2.2%) |
| Total | 15,232 (100.0%) | 5,575 (100.0%) |
Household Vehicle Usage in Ogle County
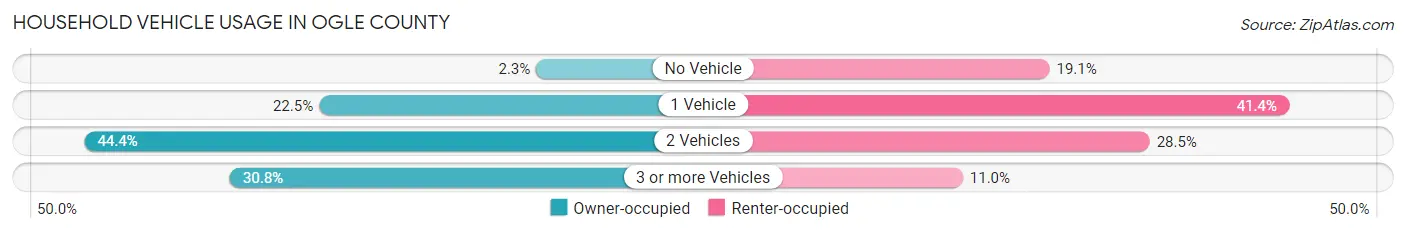
| Vehicles per Household | Owner-occupied | Renter-occupied |
| No Vehicle | 342 (2.2%) | 1,065 (19.1%) |
| 1 Vehicle | 3,430 (22.5%) | 2,310 (41.4%) |
| 2 Vehicles | 6,764 (44.4%) | 1,586 (28.4%) |
| 3 or more Vehicles | 4,696 (30.8%) | 614 (11.0%) |
| Total | 15,232 (100.0%) | 5,575 (100.0%) |
Real Estate & Mortgages in Ogle County
Real Estate and Mortgage Overview in Ogle County
| Characteristic | Without Mortgage | With Mortgage |
| Housing Units | 6,441 | 8,791 |
| Median Property Value | $170,800 | $174,100 |
| Median Household Income | $75,127 | $1,794 |
| Monthly Housing Costs | $622 | $200 |
| Real Estate Taxes | $3,420 | $109 |
Property Value by Mortgage Status in Ogle County
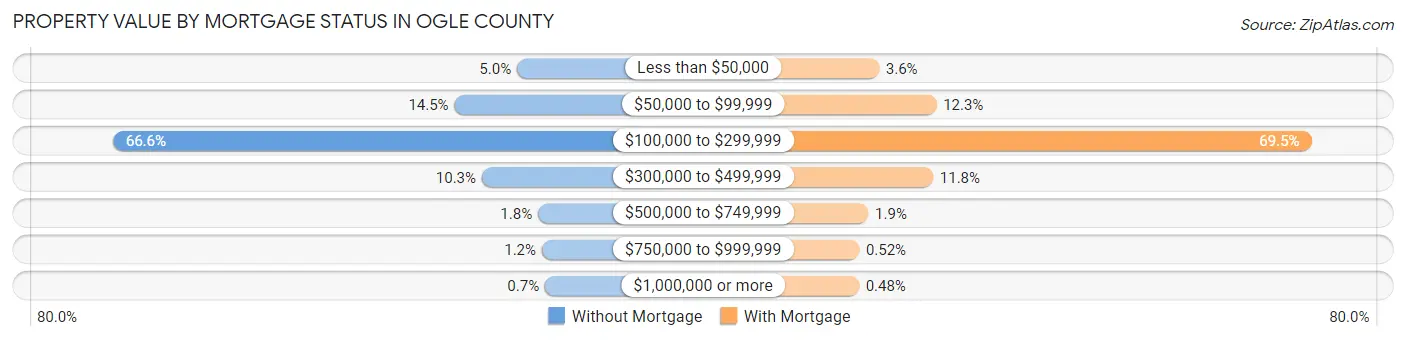
| Property Value | Without Mortgage | With Mortgage |
| Less than $50,000 | 320 (5.0%) | 312 (3.5%) |
| $50,000 to $99,999 | 934 (14.5%) | 1,080 (12.3%) |
| $100,000 to $299,999 | 4,287 (66.6%) | 6,106 (69.5%) |
| $300,000 to $499,999 | 665 (10.3%) | 1,036 (11.8%) |
| $500,000 to $749,999 | 114 (1.8%) | 169 (1.9%) |
| $750,000 to $999,999 | 76 (1.2%) | 46 (0.5%) |
| $1,000,000 or more | 45 (0.7%) | 42 (0.5%) |
| Total | 6,441 (100.0%) | 8,791 (100.0%) |
Household Income by Mortgage Status in Ogle County
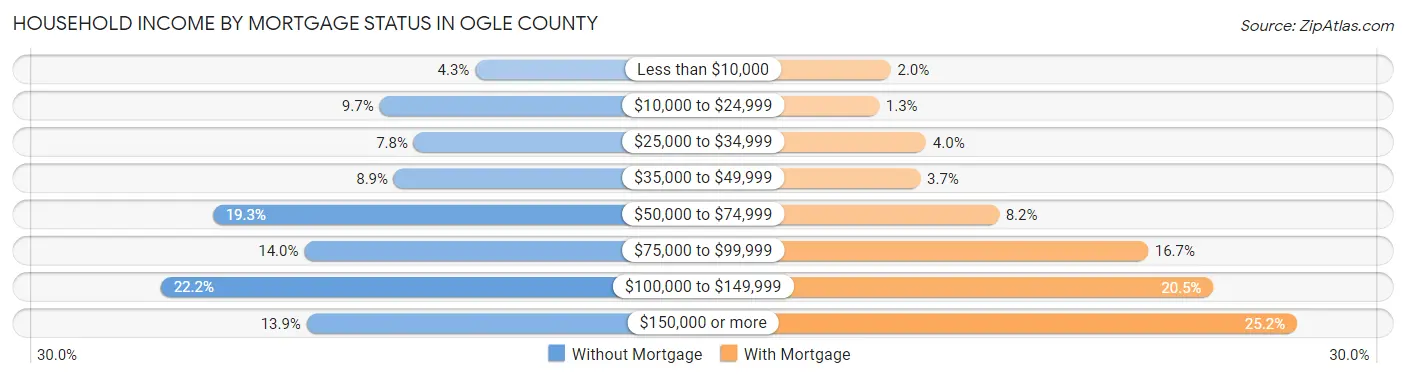
| Household Income | Without Mortgage | With Mortgage |
| Less than $10,000 | 274 (4.3%) | 176 (2.0%) |
| $10,000 to $24,999 | 626 (9.7%) | 117 (1.3%) |
| $25,000 to $34,999 | 500 (7.8%) | 353 (4.0%) |
| $35,000 to $49,999 | 573 (8.9%) | 324 (3.7%) |
| $50,000 to $74,999 | 1,240 (19.3%) | 719 (8.2%) |
| $75,000 to $99,999 | 903 (14.0%) | 1,468 (16.7%) |
| $100,000 to $149,999 | 1,431 (22.2%) | 1,798 (20.4%) |
| $150,000 or more | 894 (13.9%) | 2,218 (25.2%) |
| Total | 6,441 (100.0%) | 8,791 (100.0%) |
Property Value to Household Income Ratio in Ogle County
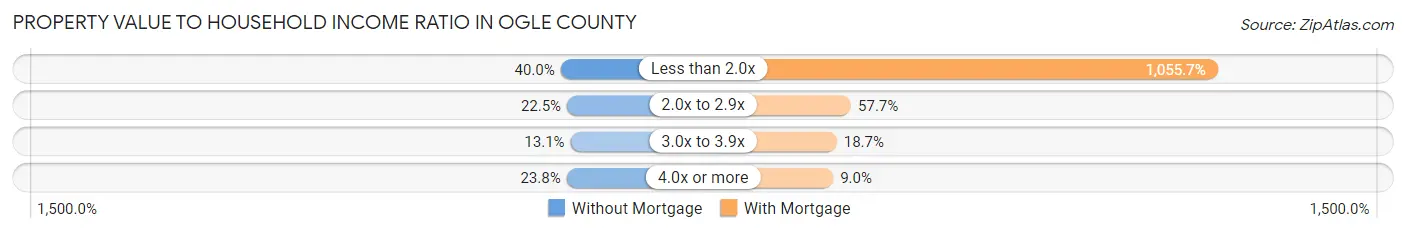
| Value-to-Income Ratio | Without Mortgage | With Mortgage |
| Less than 2.0x | 2,578 (40.0%) | 92,802 (1,055.6%) |
| 2.0x to 2.9x | 1,452 (22.5%) | 5,071 (57.7%) |
| 3.0x to 3.9x | 843 (13.1%) | 1,643 (18.7%) |
| 4.0x or more | 1,532 (23.8%) | 787 (8.9%) |
| Total | 6,441 (100.0%) | 8,791 (100.0%) |
Real Estate Taxes by Mortgage Status in Ogle County
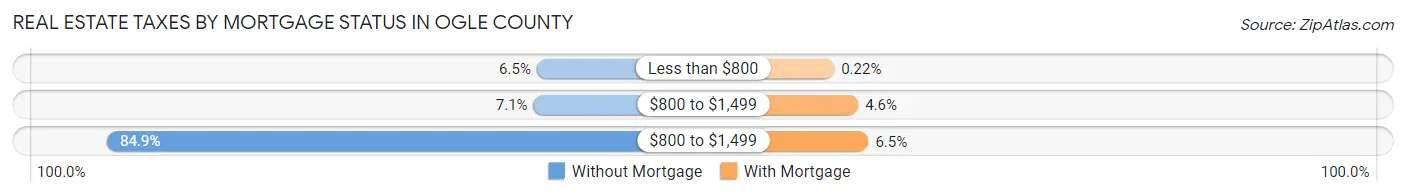
| Property Taxes | Without Mortgage | With Mortgage |
| Less than $800 | 416 (6.5%) | 19 (0.2%) |
| $800 to $1,499 | 455 (7.1%) | 405 (4.6%) |
| $800 to $1,499 | 5,471 (84.9%) | 569 (6.5%) |
| Total | 6,441 (100.0%) | 8,791 (100.0%) |
Health & Disability in Ogle County
Health Insurance Coverage by Age in Ogle County
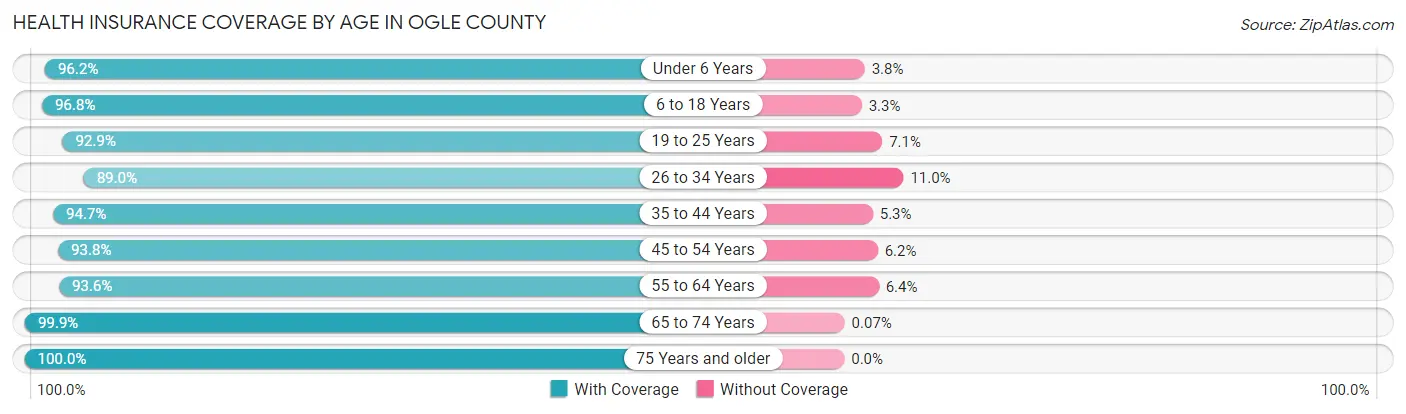
| Age Bracket | With Coverage | Without Coverage |
| Under 6 Years | 3,152 (96.2%) | 125 (3.8%) |
| 6 to 18 Years | 8,717 (96.8%) | 293 (3.3%) |
| 19 to 25 Years | 3,653 (92.9%) | 278 (7.1%) |
| 26 to 34 Years | 4,580 (89.0%) | 568 (11.0%) |
| 35 to 44 Years | 5,853 (94.7%) | 328 (5.3%) |
| 45 to 54 Years | 6,171 (93.8%) | 410 (6.2%) |
| 55 to 64 Years | 6,950 (93.6%) | 477 (6.4%) |
| 65 to 74 Years | 5,484 (99.9%) | 4 (0.1%) |
| 75 Years and older | 4,139 (100.0%) | 0 (0.0%) |
| Total | 48,699 (95.2%) | 2,483 (4.9%) |
Health Insurance Coverage by Citizenship Status in Ogle County

| Citizenship Status | With Coverage | Without Coverage |
| Native Born | 3,152 (96.2%) | 125 (3.8%) |
| Foreign Born, Citizen | 8,717 (96.8%) | 293 (3.3%) |
| Foreign Born, not a Citizen | 3,653 (92.9%) | 278 (7.1%) |
Health Insurance Coverage by Household Income in Ogle County
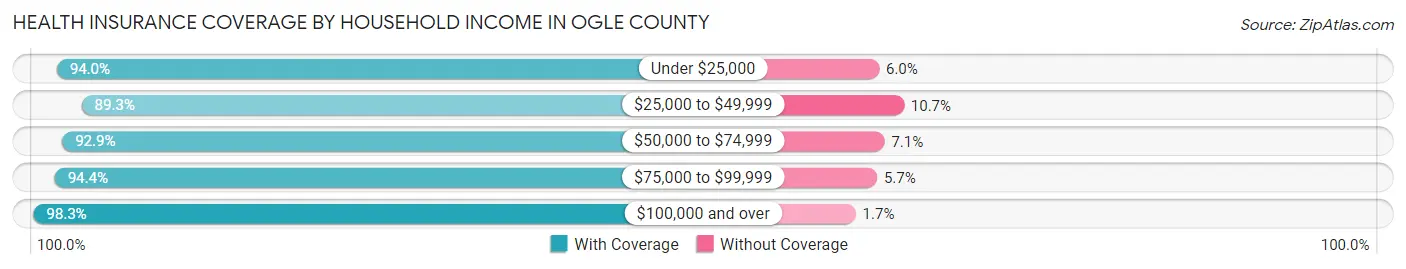
| Household Income | With Coverage | Without Coverage |
| Under $25,000 | 4,639 (94.0%) | 298 (6.0%) |
| $25,000 to $49,999 | 6,151 (89.3%) | 736 (10.7%) |
| $50,000 to $74,999 | 7,546 (92.9%) | 573 (7.1%) |
| $75,000 to $99,999 | 8,374 (94.4%) | 501 (5.7%) |
| $100,000 and over | 21,912 (98.3%) | 370 (1.7%) |
Public vs Private Health Insurance Coverage by Age in Ogle County
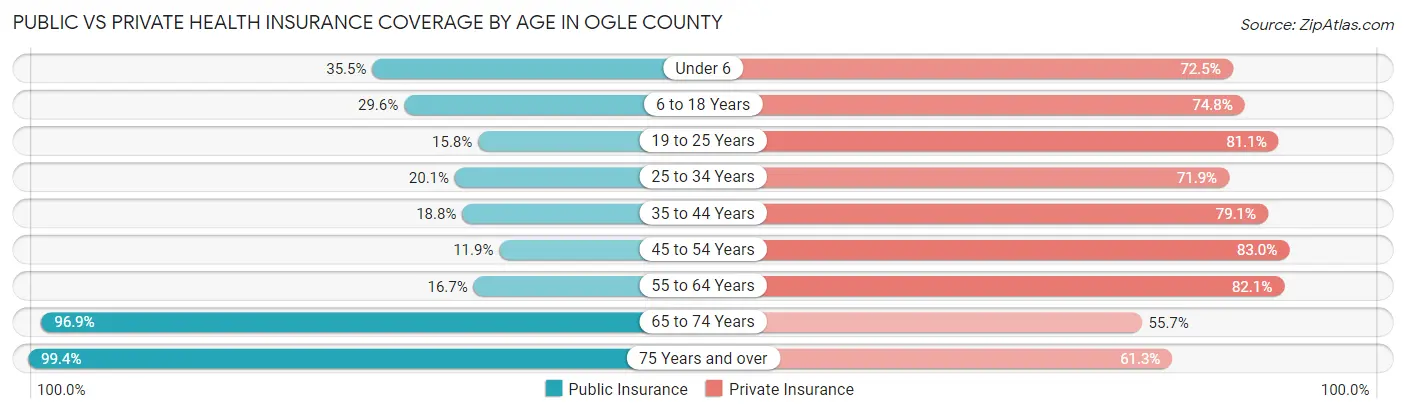
| Age Bracket | Public Insurance | Private Insurance |
| Under 6 | 1,162 (35.5%) | 2,376 (72.5%) |
| 6 to 18 Years | 2,664 (29.6%) | 6,735 (74.8%) |
| 19 to 25 Years | 622 (15.8%) | 3,186 (81.0%) |
| 25 to 34 Years | 1,037 (20.1%) | 3,699 (71.9%) |
| 35 to 44 Years | 1,160 (18.8%) | 4,888 (79.1%) |
| 45 to 54 Years | 783 (11.9%) | 5,463 (83.0%) |
| 55 to 64 Years | 1,238 (16.7%) | 6,095 (82.1%) |
| 65 to 74 Years | 5,317 (96.9%) | 3,054 (55.6%) |
| 75 Years and over | 4,112 (99.4%) | 2,538 (61.3%) |
| Total | 18,095 (35.3%) | 38,034 (74.3%) |
Disability Status by Sex by Age in Ogle County
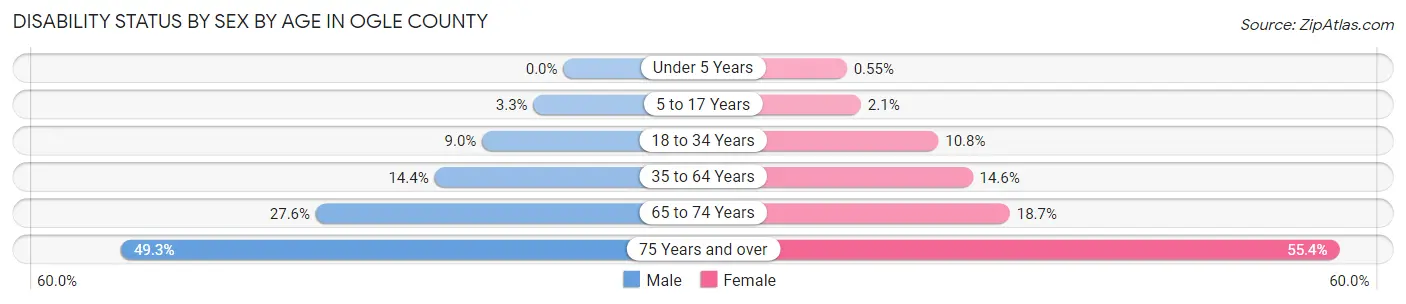
| Age Bracket | Male | Female |
| Under 5 Years | 0 (0.0%) | 7 (0.5%) |
| 5 to 17 Years | 148 (3.3%) | 92 (2.1%) |
| 18 to 34 Years | 452 (9.0%) | 525 (10.7%) |
| 35 to 64 Years | 1,468 (14.3%) | 1,450 (14.6%) |
| 65 to 74 Years | 767 (27.6%) | 506 (18.7%) |
| 75 Years and over | 868 (49.3%) | 1,317 (55.4%) |
Disability Class by Sex by Age in Ogle County
Disability Class: Hearing Difficulty
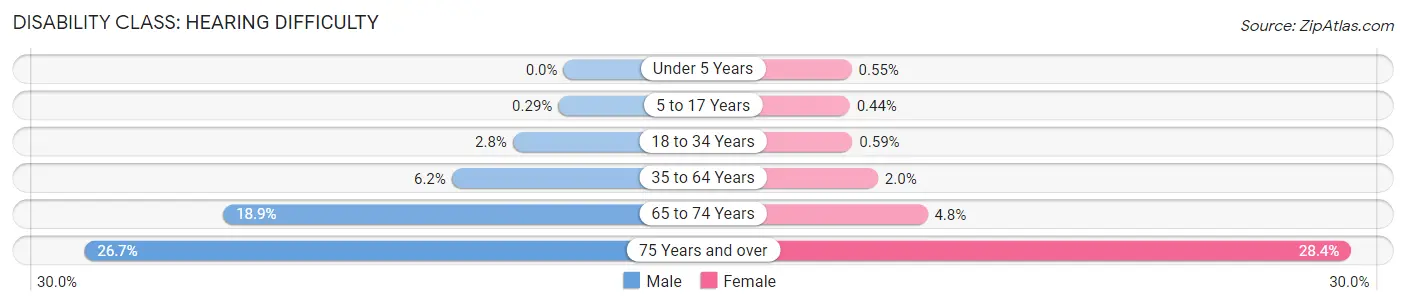
| Age Bracket | Male | Female |
| Under 5 Years | 0 (0.0%) | 7 (0.5%) |
| 5 to 17 Years | 13 (0.3%) | 19 (0.4%) |
| 18 to 34 Years | 141 (2.8%) | 29 (0.6%) |
| 35 to 64 Years | 636 (6.2%) | 200 (2.0%) |
| 65 to 74 Years | 527 (18.9%) | 129 (4.8%) |
| 75 Years and over | 470 (26.7%) | 674 (28.4%) |
Disability Class: Vision Difficulty
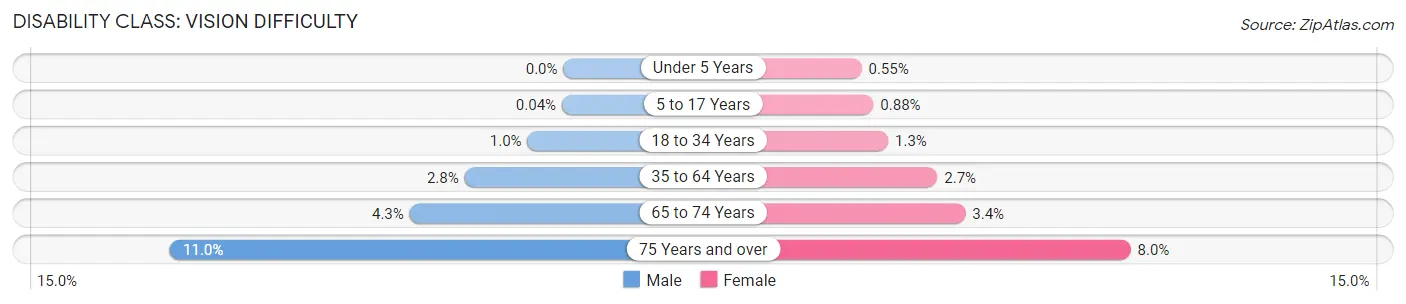
| Age Bracket | Male | Female |
| Under 5 Years | 0 (0.0%) | 7 (0.5%) |
| 5 to 17 Years | 2 (0.0%) | 38 (0.9%) |
| 18 to 34 Years | 50 (1.0%) | 63 (1.3%) |
| 35 to 64 Years | 281 (2.8%) | 265 (2.7%) |
| 65 to 74 Years | 119 (4.3%) | 93 (3.4%) |
| 75 Years and over | 193 (11.0%) | 191 (8.0%) |
Disability Class: Cognitive Difficulty
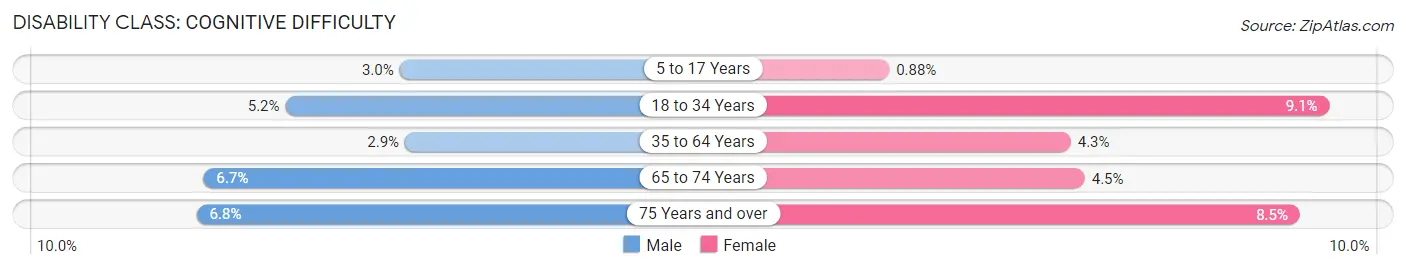
| Age Bracket | Male | Female |
| 5 to 17 Years | 135 (3.0%) | 38 (0.9%) |
| 18 to 34 Years | 258 (5.2%) | 442 (9.0%) |
| 35 to 64 Years | 301 (2.9%) | 423 (4.3%) |
| 65 to 74 Years | 186 (6.7%) | 122 (4.5%) |
| 75 Years and over | 120 (6.8%) | 202 (8.5%) |
Disability Class: Ambulatory Difficulty
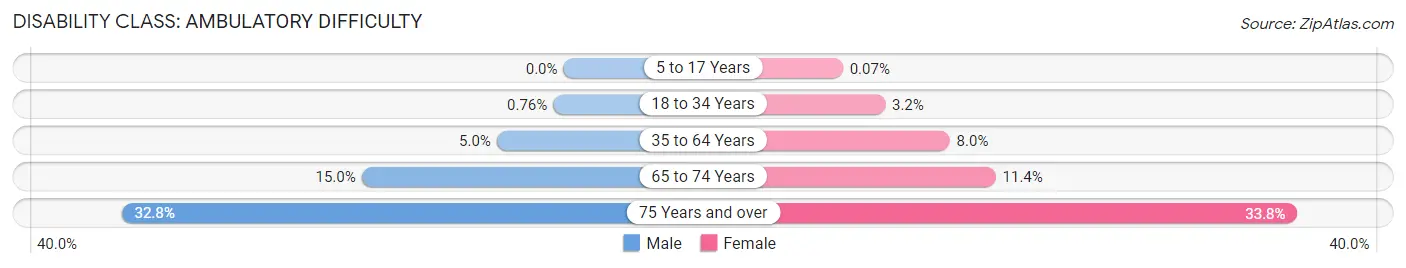
| Age Bracket | Male | Female |
| 5 to 17 Years | 0 (0.0%) | 3 (0.1%) |
| 18 to 34 Years | 38 (0.8%) | 157 (3.2%) |
| 35 to 64 Years | 506 (5.0%) | 798 (8.0%) |
| 65 to 74 Years | 417 (15.0%) | 309 (11.4%) |
| 75 Years and over | 578 (32.8%) | 804 (33.8%) |
Disability Class: Self-Care Difficulty
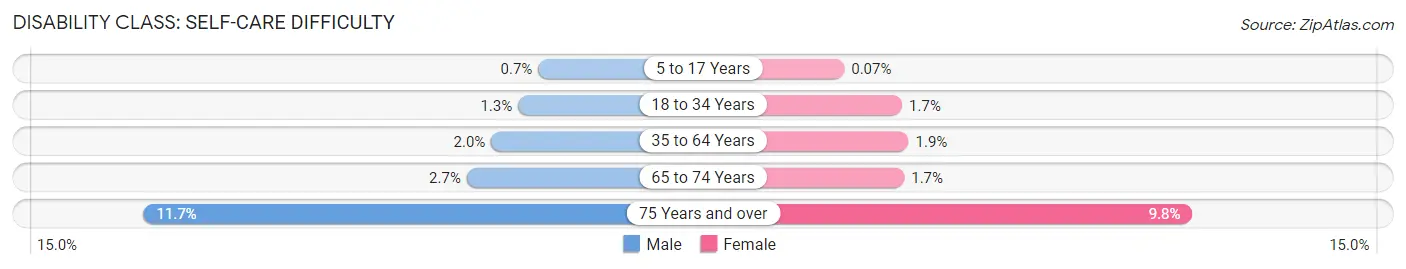
| Age Bracket | Male | Female |
| 5 to 17 Years | 31 (0.7%) | 3 (0.1%) |
| 18 to 34 Years | 63 (1.3%) | 82 (1.7%) |
| 35 to 64 Years | 206 (2.0%) | 185 (1.9%) |
| 65 to 74 Years | 75 (2.7%) | 47 (1.7%) |
| 75 Years and over | 206 (11.7%) | 232 (9.8%) |
Technology Access in Ogle County
Computing Device Access in Ogle County
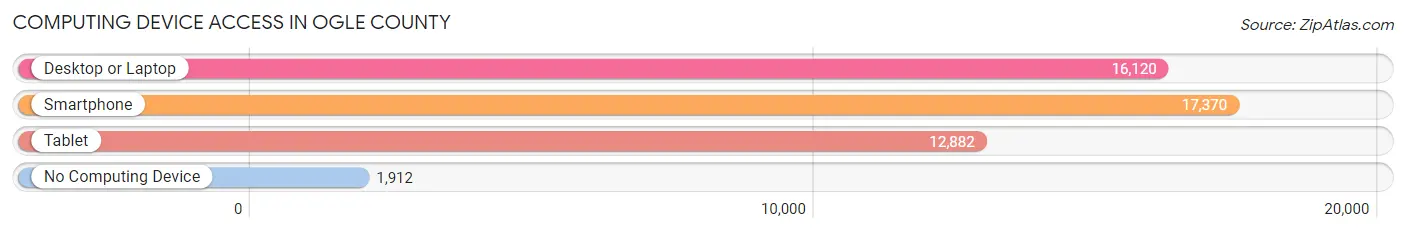
| Device Type | # Households | % Households |
| Desktop or Laptop | 16,120 | 77.5% |
| Smartphone | 17,370 | 83.5% |
| Tablet | 12,882 | 61.9% |
| No Computing Device | 1,912 | 9.2% |
| Total | 20,807 | 100.0% |
Internet Access in Ogle County
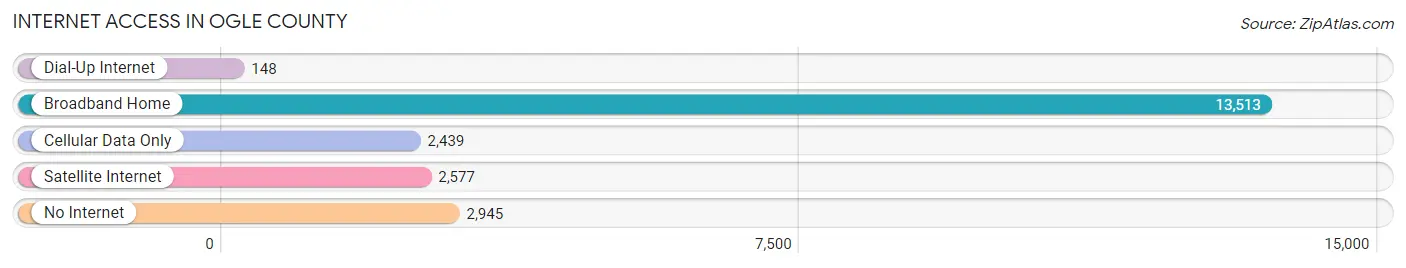
| Internet Type | # Households | % Households |
| Dial-Up Internet | 148 | 0.7% |
| Broadband Home | 13,513 | 64.9% |
| Cellular Data Only | 2,439 | 11.7% |
| Satellite Internet | 2,577 | 12.4% |
| No Internet | 2,945 | 14.1% |
| Total | 20,807 | 100.0% |
Ogle County Summary
Ogle County is located in the northern part of Illinois, and is part of the Rockford Metropolitan Statistical Area. It is bordered by Winnebago County to the north, Boone County to the east, Lee County to the south, and Stephenson County to the west. The county seat is Oregon, and the largest city is Rochelle. As of the 2010 census, the population was 53,497.
History
Ogle County was formed in 1836 from Jo Daviess and LaSalle counties. It was named after Captain Joseph Ogle, a veteran of the Revolutionary War. The first settlers arrived in the area in the early 1830s, and the county was officially organized in 1837.
The first county seat was Oregon, which was established in 1837. The county seat was moved to Byron in 1839, and then back to Oregon in 1841. The county seat has remained in Oregon ever since.
Geography
Ogle County covers an area of 845 square miles, making it the 25th largest county in Illinois. It is located in the northern part of the state, and is part of the Rockford Metropolitan Statistical Area. The county is bordered by Winnebago County to the north, Boone County to the east, Lee County to the south, and Stephenson County to the west.
The terrain of Ogle County is mostly flat, with some rolling hills in the northern and western parts of the county. The highest point in the county is located in the northwest corner, at an elevation of 890 feet. The county is drained by the Rock River, which flows through the western part of the county.
Economy
The economy of Ogle County is largely based on agriculture and manufacturing. The county is home to several large farms, which produce corn, soybeans, wheat, and other crops. The county is also home to several manufacturing companies, including a large paper mill in Oregon and a large food processing plant in Rochelle.
The county is also home to several large employers, including the University of Illinois College of Medicine at Rockford, the Rockford Public Schools, and the Rockford Memorial Hospital.
Demographics
As of the 2010 census, there were 53,497 people, 20,845 households, and 14,717 families living in Ogle County. The population density was 63.2 people per square mile. The racial makeup of the county was 92.3% White, 2.7% African American, 0.3% Native American, 1.3% Asian, 0.1% Pacific Islander, 1.7% from other races, and 1.9% from two or more races. Hispanic or Latino of any race were 5.2% of the population.
The median income for a household in the county was $50,945, and the median income for a family was $60,945. The per capita income for the county was $24,845. About 6.7% of families and 9.2% of the population were below the poverty line, including 11.3% of those under age 18 and 6.2% of those age 65 or over.
Common Questions
What is the Total Population of Ogle County?
Total Population of Ogle County is 51,672.
What is the Total Male Population of Ogle County?
Total Male Population of Ogle County is 25,836.
What is the Total Female Population of Ogle County?
Total Female Population of Ogle County is 25,836.
What is the Ratio of Males per 100 Females in Ogle County?
There are 100.00 Males per 100 Females in Ogle County.
What is the Ratio of Females per 100 Males in Ogle County?
There are 100.00 Females per 100 Males in Ogle County.
What is the Median Population Age in Ogle County?
Median Population Age in Ogle County is 42.3 Years.
What is the Average Family Size in Ogle County
Average Family Size in Ogle County is 3.0 People.
What is the Average Household Size in Ogle County
Average Household Size in Ogle County is 2.5 People.
What is Per Capita Income in Ogle County?
Per Capita income in Ogle County is $36,436.
What is the Median Family Income in Ogle County?
Median Family Income in Ogle County is $91,406.
What is the Median Household income in Ogle County?
Median Household Income in Ogle County is $75,782.
What is Income or Wage Gap in Ogle County?
Income or Wage Gap in Ogle County is 41.1%.
Women in Ogle County earn 58.9 cents for every dollar earned by a man.
What is Family Income Deficit in Ogle County?
Family Income Deficit in Ogle County is $10,438.
Families that are below poverty line in Ogle County earn $10,438 less on average than the poverty threshold level.
What is Inequality or Gini Index in Ogle County?
Inequality or Gini Index in Ogle County is 0.40.
How Large is the Labor Force in Ogle County?
There are 26,489 People in the Labor Forcein in Ogle County.
What is the Percentage of People in the Labor Force in Ogle County?
63.6% of People are in the Labor Force in Ogle County.
What is the Unemployment Rate in Ogle County?
Unemployment Rate in Ogle County is 6.0%.