Moultrie County, IL
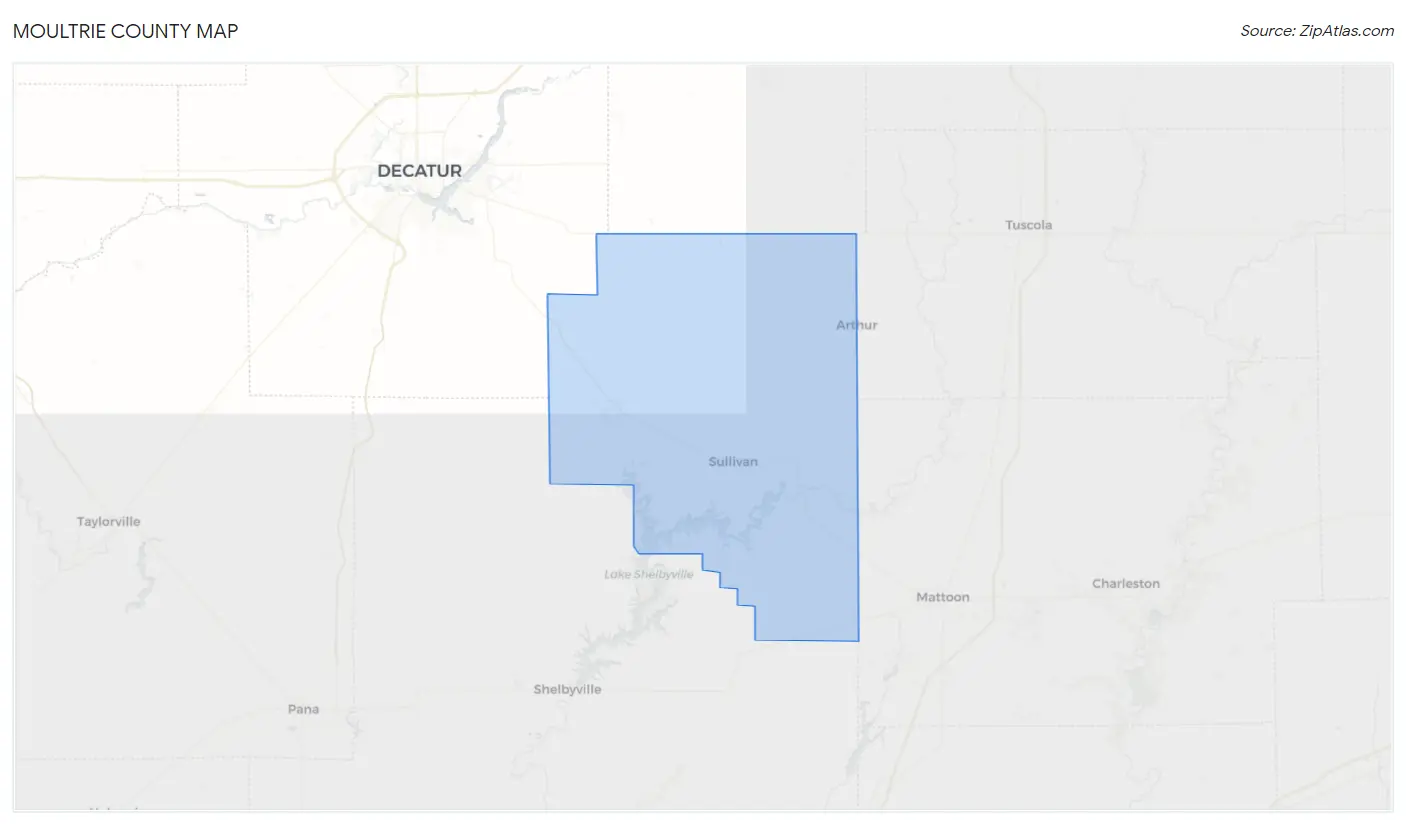
Moultrie County Map
Moultrie County Overview
14,531
TOTAL POPULATION
7,171
MALE POPULATION
7,360
FEMALE POPULATION
97.43
MALES / 100 FEMALES
102.64
FEMALES / 100 MALES
40.5
MEDIAN AGE
3.0
AVG FAMILY SIZE
2.4
AVG HOUSEHOLD SIZE
$34,849
PER CAPITA INCOME
$89,934
AVG FAMILY INCOME
$72,833
AVG HOUSEHOLD INCOME
41.8%
WAGE / INCOME GAP [ % ]
58.2¢/ $1
WAGE / INCOME GAP [ $ ]
0.42
INEQUALITY / GINI INDEX
6,922
LABOR FORCE [ PEOPLE ]
60.8%
PERCENT IN LABOR FORCE
4.1%
UNEMPLOYMENT RATE
Moultrie County Area Codes
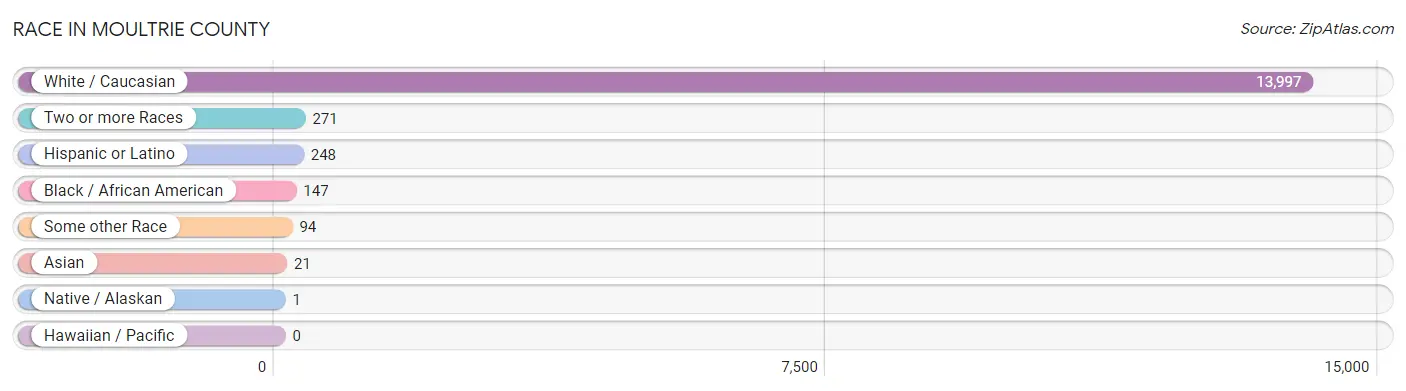
Race in Moultrie County
The most populous races in Moultrie County are White / Caucasian (13,997 | 96.3%), Two or more Races (271 | 1.9%), and Hispanic or Latino (248 | 1.7%).
| Race | # Population | % Population |
| Asian | 21 | 0.1% |
| Black / African American | 147 | 1.0% |
| Hawaiian / Pacific | 0 | 0.0% |
| Hispanic or Latino | 248 | 1.7% |
| Native / Alaskan | 1 | 0.0% |
| White / Caucasian | 13,997 | 96.3% |
| Two or more Races | 271 | 1.9% |
| Some other Race | 94 | 0.6% |
| Total | 14,531 | 100.0% |
Ancestry in Moultrie County
The most populous ancestries reported in Moultrie County are German (3,552 | 24.4%), English (2,025 | 13.9%), Irish (1,589 | 10.9%), American (1,379 | 9.5%), and Swiss (414 | 2.9%), together accounting for 61.7% of all Moultrie County residents.

| Ancestry | # Population | % Population |
| American | 1,379 | 9.5% |
| Apache | 10 | 0.1% |
| Arab | 18 | 0.1% |
| Argentinean | 29 | 0.2% |
| Australian | 6 | 0.0% |
| Austrian | 24 | 0.2% |
| Blackfeet | 1 | 0.0% |
| British | 108 | 0.7% |
| Canadian | 3 | 0.0% |
| Cherokee | 14 | 0.1% |
| Czech | 73 | 0.5% |
| Danish | 7 | 0.1% |
| Dutch | 115 | 0.8% |
| English | 2,025 | 13.9% |
| European | 172 | 1.2% |
| Finnish | 2 | 0.0% |
| French | 211 | 1.5% |
| French Canadian | 5 | 0.0% |
| German | 3,552 | 24.4% |
| Greek | 4 | 0.0% |
| Hungarian | 52 | 0.4% |
| Indian (Asian) | 21 | 0.1% |
| Irish | 1,589 | 10.9% |
| Italian | 271 | 1.9% |
| Lebanese | 18 | 0.1% |
| Lithuanian | 14 | 0.1% |
| Mexican | 123 | 0.9% |
| Navajo | 5 | 0.0% |
| Northern European | 21 | 0.1% |
| Norwegian | 33 | 0.2% |
| Pennsylvania German | 218 | 1.5% |
| Polish | 82 | 0.6% |
| Puerto Rican | 29 | 0.2% |
| Scandinavian | 19 | 0.1% |
| Scotch-Irish | 58 | 0.4% |
| Scottish | 132 | 0.9% |
| Serbian | 11 | 0.1% |
| Slavic | 15 | 0.1% |
| Slovak | 1 | 0.0% |
| South American | 53 | 0.4% |
| Spanish | 43 | 0.3% |
| Swedish | 50 | 0.3% |
| Swiss | 414 | 2.9% |
| Venezuelan | 24 | 0.2% |
| Welsh | 143 | 1.0% |
| Yugoslavian | 6 | 0.0% | View All 46 Rows |
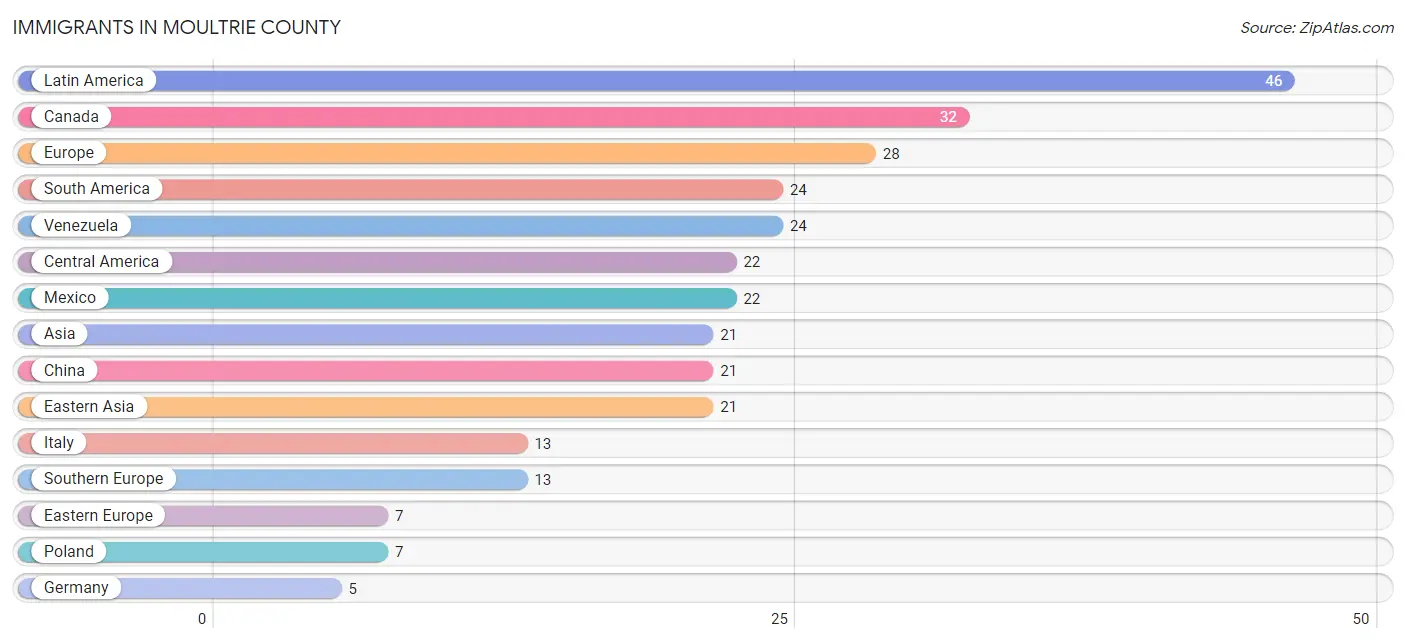
Immigrants in Moultrie County
The most numerous immigrant groups reported in Moultrie County came from Latin America (46 | 0.3%), Canada (32 | 0.2%), Europe (28 | 0.2%), South America (24 | 0.2%), and Venezuela (24 | 0.2%), together accounting for 1.1% of all Moultrie County residents.
| Immigration Origin | # Population | % Population |
| Asia | 21 | 0.1% |
| Canada | 32 | 0.2% |
| Central America | 22 | 0.2% |
| China | 21 | 0.1% |
| Eastern Asia | 21 | 0.1% |
| Eastern Europe | 7 | 0.1% |
| England | 1 | 0.0% |
| Europe | 28 | 0.2% |
| Germany | 5 | 0.0% |
| Italy | 13 | 0.1% |
| Latin America | 46 | 0.3% |
| Mexico | 22 | 0.2% |
| Northern Europe | 3 | 0.0% |
| Norway | 2 | 0.0% |
| Poland | 7 | 0.1% |
| South America | 24 | 0.2% |
| Southern Europe | 13 | 0.1% |
| Venezuela | 24 | 0.2% |
| Western Europe | 5 | 0.0% | View All 19 Rows |
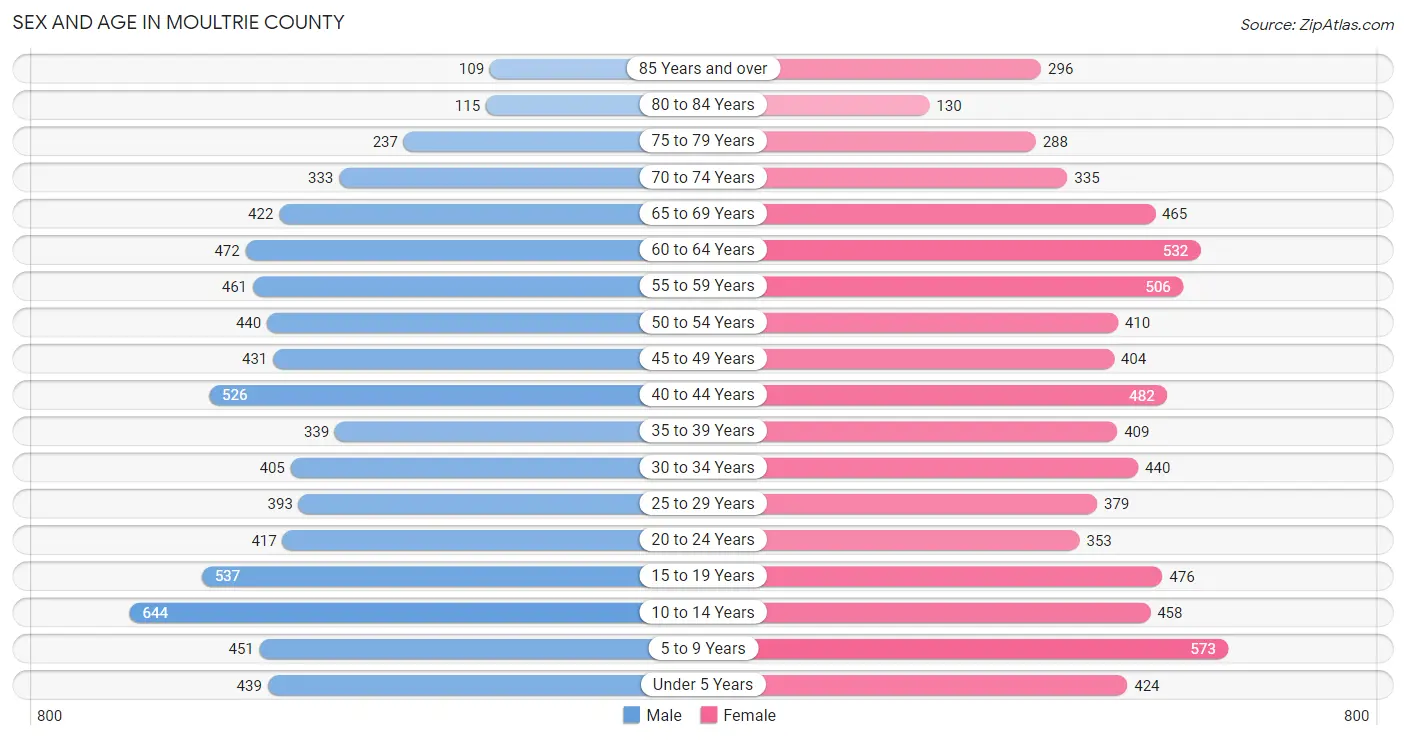
Sex and Age in Moultrie County
Sex and Age in Moultrie County
The most populous age groups in Moultrie County are 10 to 14 Years (644 | 9.0%) for men and 5 to 9 Years (573 | 7.8%) for women.
| Age Bracket | Male | Female |
| Under 5 Years | 439 (6.1%) | 424 (5.8%) |
| 5 to 9 Years | 451 (6.3%) | 573 (7.8%) |
| 10 to 14 Years | 644 (9.0%) | 458 (6.2%) |
| 15 to 19 Years | 537 (7.5%) | 476 (6.5%) |
| 20 to 24 Years | 417 (5.8%) | 353 (4.8%) |
| 25 to 29 Years | 393 (5.5%) | 379 (5.1%) |
| 30 to 34 Years | 405 (5.7%) | 440 (6.0%) |
| 35 to 39 Years | 339 (4.7%) | 409 (5.6%) |
| 40 to 44 Years | 526 (7.3%) | 482 (6.6%) |
| 45 to 49 Years | 431 (6.0%) | 404 (5.5%) |
| 50 to 54 Years | 440 (6.1%) | 410 (5.6%) |
| 55 to 59 Years | 461 (6.4%) | 506 (6.9%) |
| 60 to 64 Years | 472 (6.6%) | 532 (7.2%) |
| 65 to 69 Years | 422 (5.9%) | 465 (6.3%) |
| 70 to 74 Years | 333 (4.6%) | 335 (4.5%) |
| 75 to 79 Years | 237 (3.3%) | 288 (3.9%) |
| 80 to 84 Years | 115 (1.6%) | 130 (1.8%) |
| 85 Years and over | 109 (1.5%) | 296 (4.0%) |
| Total | 7,171 (100.0%) | 7,360 (100.0%) |
Families and Households in Moultrie County
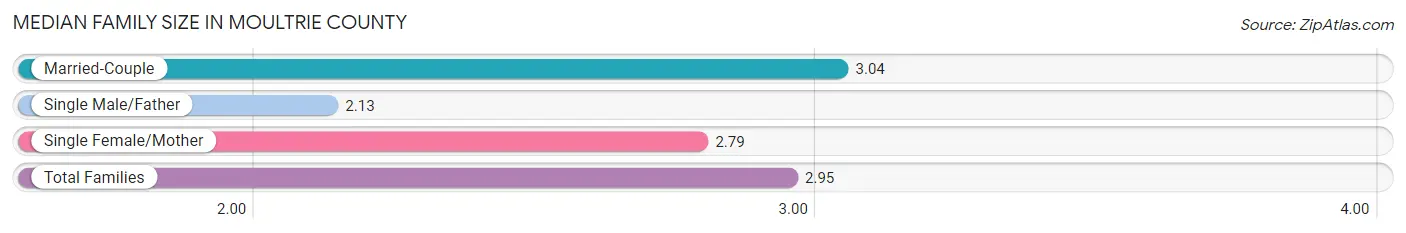
Median Family Size in Moultrie County
The median family size in Moultrie County is 2.95 persons per family, with married-couple families (3,271 | 81.1%) accounting for the largest median family size of 3.04 persons per family. On the other hand, single male/father families (241 | 6.0%) represent the smallest median family size with 2.13 persons per family.
| Family Type | # Families | Family Size |
| Married-Couple | 3,271 (81.1%) | 3.04 |
| Single Male/Father | 241 (6.0%) | 2.13 |
| Single Female/Mother | 519 (12.9%) | 2.79 |
| Total Families | 4,031 (100.0%) | 2.95 |
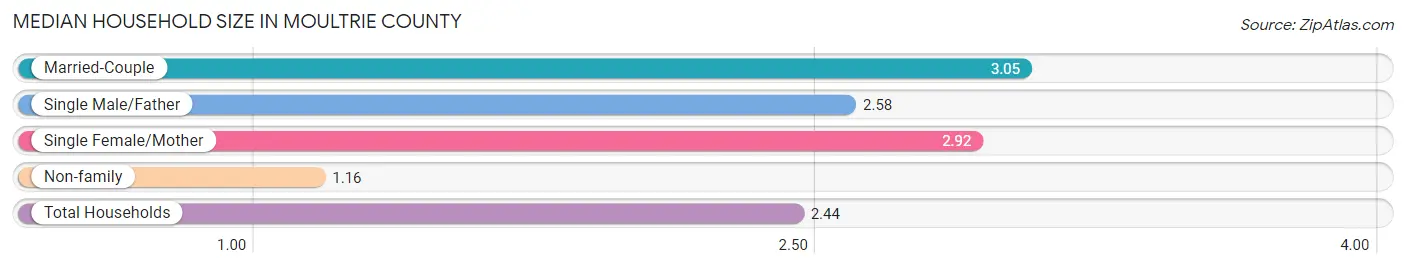
Median Household Size in Moultrie County
The median household size in Moultrie County is 2.44 persons per household, with married-couple households (3,271 | 56.2%) accounting for the largest median household size of 3.05 persons per household. non-family households (1,793 | 30.8%) represent the smallest median household size with 1.16 persons per household.
| Household Type | # Households | Household Size |
| Married-Couple | 3,271 (56.2%) | 3.05 |
| Single Male/Father | 241 (4.1%) | 2.58 |
| Single Female/Mother | 519 (8.9%) | 2.92 |
| Non-family | 1,793 (30.8%) | 1.16 |
| Total Households | 5,824 (100.0%) | 2.44 |
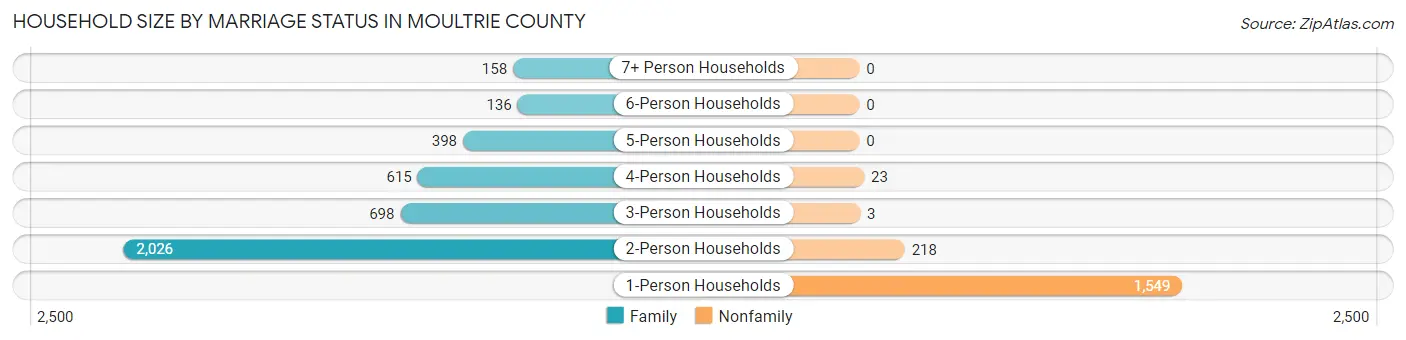
Household Size by Marriage Status in Moultrie County
Out of a total of 5,824 households in Moultrie County, 4,031 (69.2%) are family households, while 1,793 (30.8%) are nonfamily households. The most numerous type of family households are 2-person households, comprising 2,026, and the most common type of nonfamily households are 1-person households, comprising 1,549.
| Household Size | Family Households | Nonfamily Households |
| 1-Person Households | - | 1,549 (26.6%) |
| 2-Person Households | 2,026 (34.8%) | 218 (3.7%) |
| 3-Person Households | 698 (12.0%) | 3 (0.1%) |
| 4-Person Households | 615 (10.6%) | 23 (0.4%) |
| 5-Person Households | 398 (6.8%) | 0 (0.0%) |
| 6-Person Households | 136 (2.3%) | 0 (0.0%) |
| 7+ Person Households | 158 (2.7%) | 0 (0.0%) |
| Total | 4,031 (69.2%) | 1,793 (30.8%) |
Female Fertility in Moultrie County
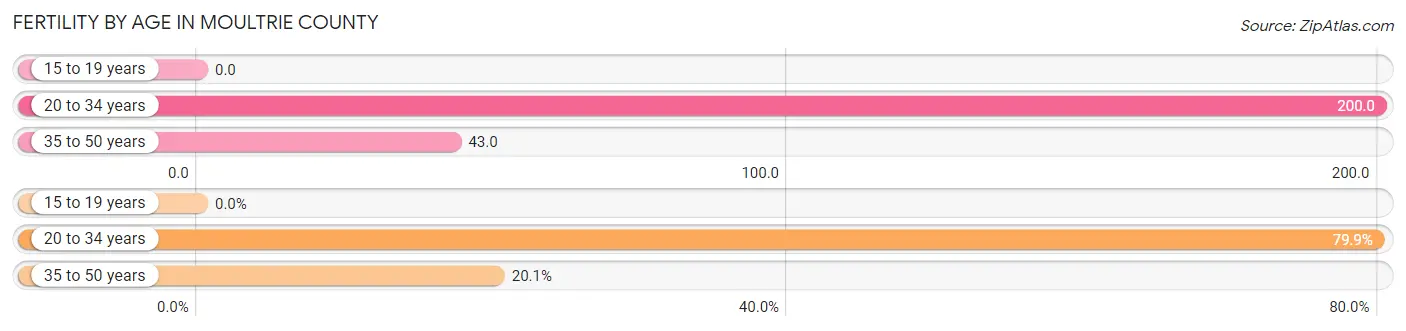
Fertility by Age in Moultrie County
Average fertility rate in Moultrie County is 97.0 births per 1,000 women. Women in the age bracket of 20 to 34 years have the highest fertility rate with 200.0 births per 1,000 women. Women in the age bracket of 20 to 34 years acount for 79.9% of all women with births.
| Age Bracket | Women with Births | Births / 1,000 Women |
| 15 to 19 years | 0 (0.0%) | 0.0 |
| 20 to 34 years | 234 (79.9%) | 200.0 |
| 35 to 50 years | 59 (20.1%) | 43.0 |
| Total | 293 (100.0%) | 97.0 |
Fertility by Age by Marriage Status in Moultrie County
77.1% of women with births (293) in Moultrie County are married. The highest percentage of unmarried women with births falls into 20 to 34 years age bracket with 25.6% of them unmarried at the time of birth, while the lowest percentage of unmarried women with births belong to 35 to 50 years age bracket with 11.9% of them unmarried.
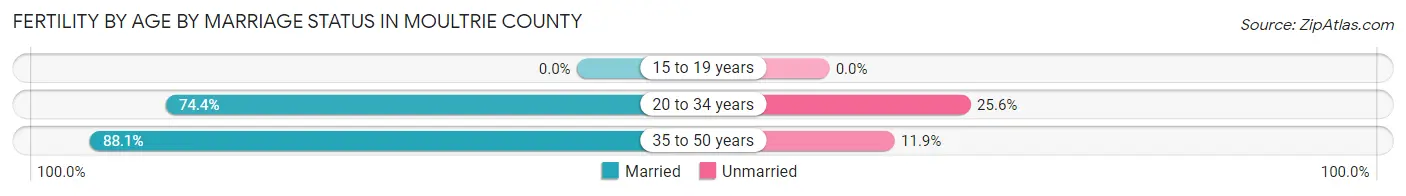
| Age Bracket | Married | Unmarried |
| 15 to 19 years | 0 (0.0%) | 0 (0.0%) |
| 20 to 34 years | 174 (74.4%) | 60 (25.6%) |
| 35 to 50 years | 52 (88.1%) | 7 (11.9%) |
| Total | 226 (77.1%) | 67 (22.9%) |
Fertility by Education in Moultrie County
Average fertility rate in Moultrie County is 97.0 births per 1,000 women. Women with the education attainment of bachelor's degree have the highest fertility rate of 192.0 births per 1,000 women, while women with the education attainment of high school diploma have the lowest fertility at 18.0 births per 1,000 women. Women with the education attainment of college or associate's degree represent 47.1% of all women with births.
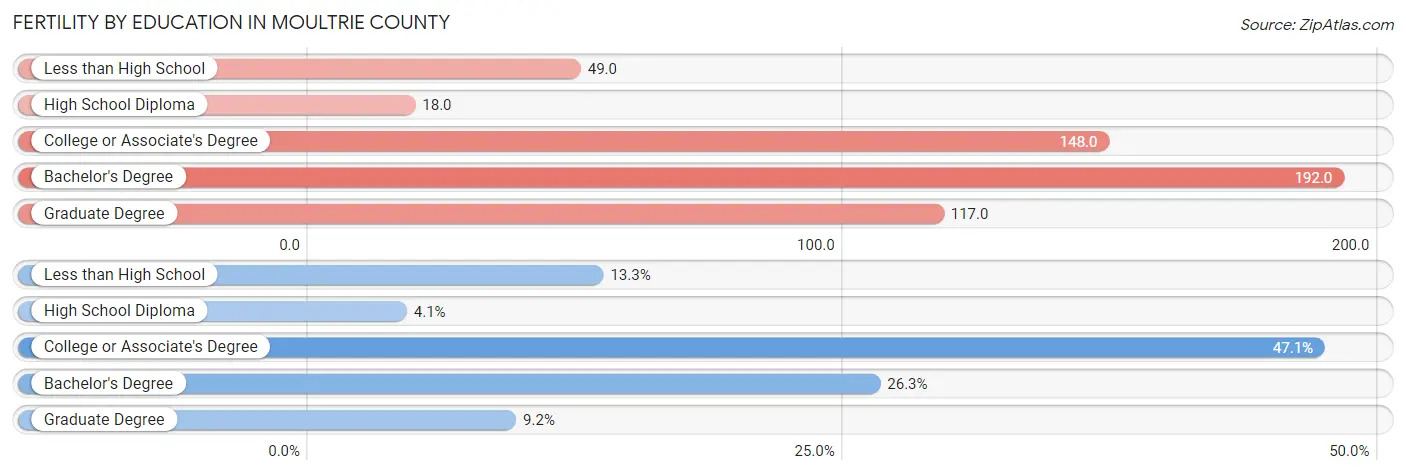
| Educational Attainment | Women with Births | Births / 1,000 Women |
| Less than High School | 39 (13.3%) | 49.0 |
| High School Diploma | 12 (4.1%) | 18.0 |
| College or Associate's Degree | 138 (47.1%) | 148.0 |
| Bachelor's Degree | 77 (26.3%) | 192.0 |
| Graduate Degree | 27 (9.2%) | 117.0 |
| Total | 293 (100.0%) | 97.0 |
Fertility by Education by Marriage Status in Moultrie County
22.9% of women with births in Moultrie County are unmarried. Women with the educational attainment of graduate degree are most likely to be married with 100.0% of them married at childbirth, while women with the educational attainment of high school diploma are least likely to be married with 75.0% of them unmarried at childbirth.
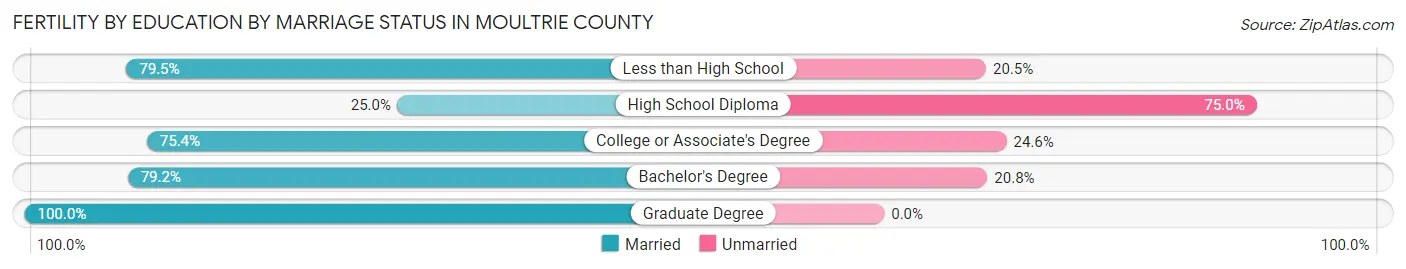
| Educational Attainment | Married | Unmarried |
| Less than High School | 31 (79.5%) | 8 (20.5%) |
| High School Diploma | 3 (25.0%) | 9 (75.0%) |
| College or Associate's Degree | 104 (75.4%) | 34 (24.6%) |
| Bachelor's Degree | 61 (79.2%) | 16 (20.8%) |
| Graduate Degree | 27 (100.0%) | 0 (0.0%) |
| Total | 226 (77.1%) | 67 (22.9%) |
Income in Moultrie County
Income Overview in Moultrie County
Per Capita Income in Moultrie County is $34,849, while median incomes of families and households are $89,934 and $72,833 respectively.
| Characteristic | Number | Measure |
| Per Capita Income | 14,531 | $34,849 |
| Median Family Income | 4,031 | $89,934 |
| Mean Family Income | 4,031 | $103,746 |
| Median Household Income | 5,824 | $72,833 |
| Mean Household Income | 5,824 | $86,610 |
| Income Deficit | 4,031 | $0 |
| Wage / Income Gap (%) | 14,531 | 41.77% |
| Wage / Income Gap ($) | 14,531 | 58.23¢ per $1 |
| Gini / Inequality Index | 14,531 | 0.42 |
Earnings by Sex in Moultrie County
Average Earnings in Moultrie County are $42,251, $53,108 for men and $30,927 for women, a difference of 41.8%.
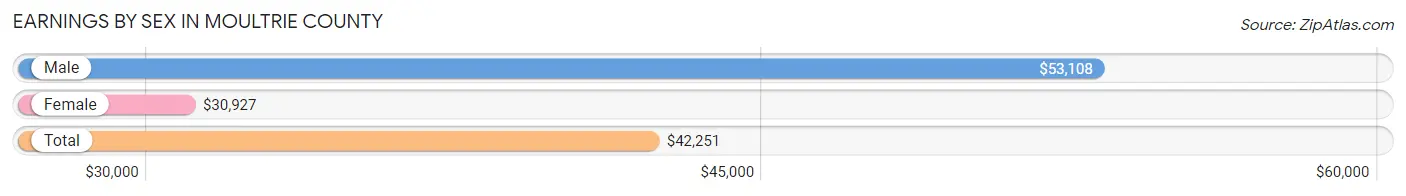
| Sex | Number | Average Earnings |
| Male | 4,101 (56.2%) | $53,108 |
| Female | 3,192 (43.8%) | $30,927 |
| Total | 7,293 (100.0%) | $42,251 |
Earnings by Sex by Income Bracket in Moultrie County
The most common earnings brackets in Moultrie County are $75,000 to $99,999 for men (674 | 16.4%) and $45,000 to $49,999 for women (300 | 9.4%).
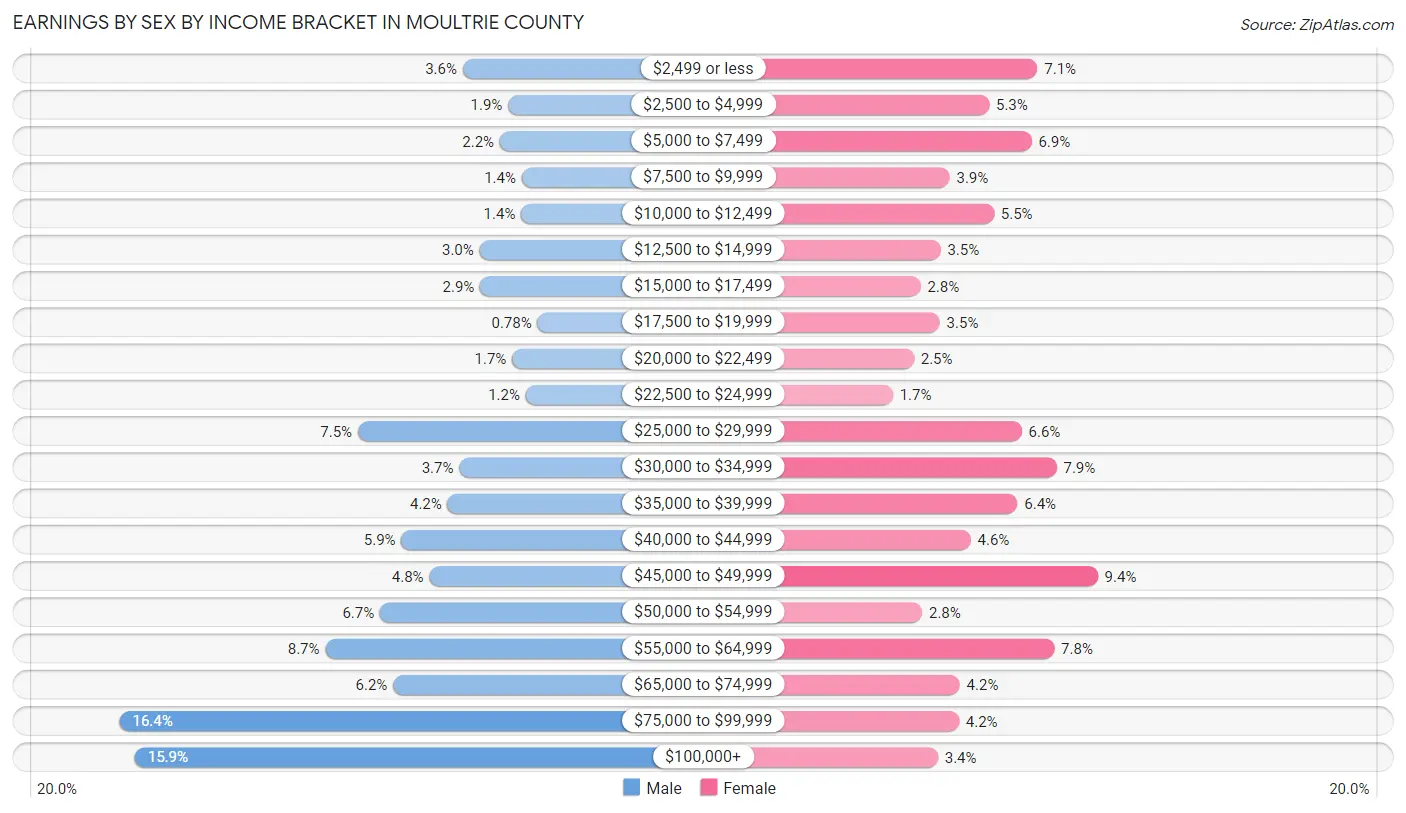
| Income | Male | Female |
| $2,499 or less | 147 (3.6%) | 228 (7.1%) |
| $2,500 to $4,999 | 77 (1.9%) | 170 (5.3%) |
| $5,000 to $7,499 | 90 (2.2%) | 221 (6.9%) |
| $7,500 to $9,999 | 56 (1.4%) | 123 (3.8%) |
| $10,000 to $12,499 | 57 (1.4%) | 176 (5.5%) |
| $12,500 to $14,999 | 121 (2.9%) | 112 (3.5%) |
| $15,000 to $17,499 | 120 (2.9%) | 88 (2.8%) |
| $17,500 to $19,999 | 32 (0.8%) | 111 (3.5%) |
| $20,000 to $22,499 | 71 (1.7%) | 80 (2.5%) |
| $22,500 to $24,999 | 50 (1.2%) | 55 (1.7%) |
| $25,000 to $29,999 | 308 (7.5%) | 209 (6.6%) |
| $30,000 to $34,999 | 152 (3.7%) | 251 (7.9%) |
| $35,000 to $39,999 | 170 (4.2%) | 204 (6.4%) |
| $40,000 to $44,999 | 241 (5.9%) | 148 (4.6%) |
| $45,000 to $49,999 | 198 (4.8%) | 300 (9.4%) |
| $50,000 to $54,999 | 274 (6.7%) | 90 (2.8%) |
| $55,000 to $64,999 | 358 (8.7%) | 248 (7.8%) |
| $65,000 to $74,999 | 254 (6.2%) | 135 (4.2%) |
| $75,000 to $99,999 | 674 (16.4%) | 134 (4.2%) |
| $100,000+ | 651 (15.9%) | 109 (3.4%) |
| Total | 4,101 (100.0%) | 3,192 (100.0%) |
Earnings by Sex by Educational Attainment in Moultrie County
Average earnings in Moultrie County are $58,888 for men and $35,150 for women, a difference of 40.3%. Men with an educational attainment of bachelor's degree enjoy the highest average annual earnings of $86,250, while those with high school diploma education earn the least with $50,240. Women with an educational attainment of graduate degree earn the most with the average annual earnings of $49,800, while those with less than high school education have the smallest earnings of $17,880.
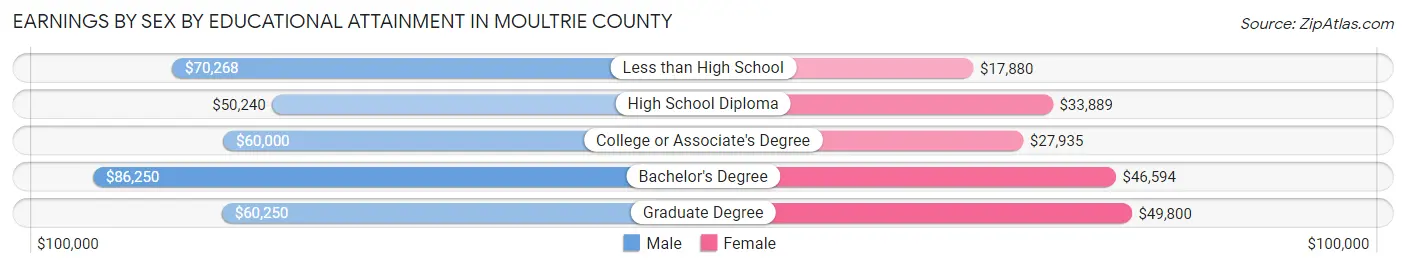
| Educational Attainment | Male Income | Female Income |
| Less than High School | $70,268 | $17,880 |
| High School Diploma | $50,240 | $33,889 |
| College or Associate's Degree | $60,000 | $27,935 |
| Bachelor's Degree | $86,250 | $46,594 |
| Graduate Degree | $60,250 | $49,800 |
| Total | $58,888 | $35,150 |
Family Income in Moultrie County
Family Income Brackets in Moultrie County
According to the Moultrie County family income data, there are 1,020 families falling into the $100,000 to $149,999 income range, which is the most common income bracket and makes up 25.3% of all families. Conversely, the $10,000 to $14,999 income bracket is the least frequent group with only 48 families (1.2%) belonging to this category.
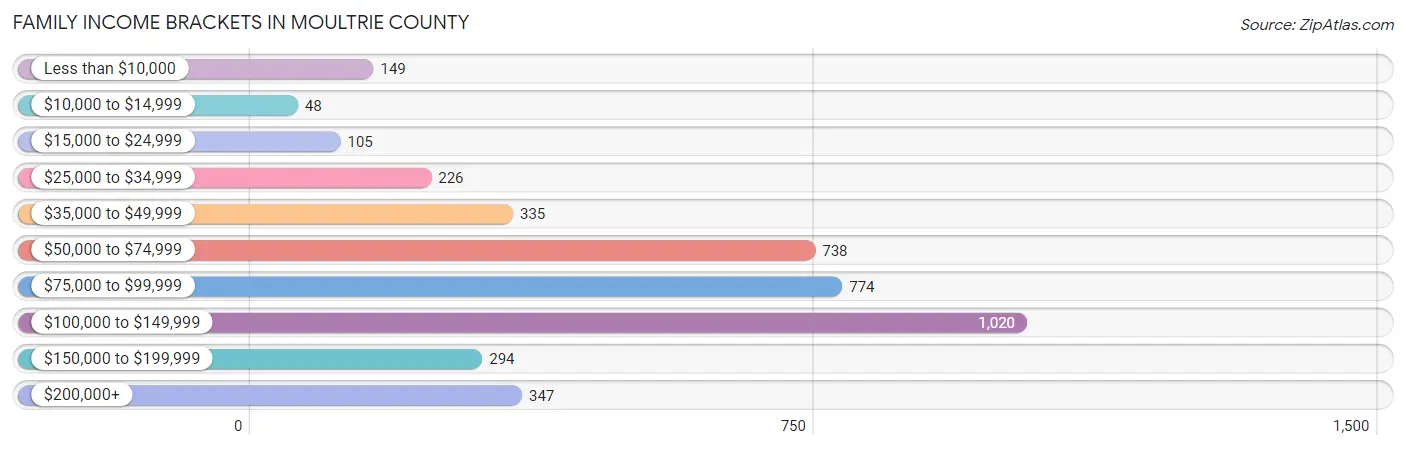
| Income Bracket | # Families | % Families |
| Less than $10,000 | 149 | 3.7% |
| $10,000 to $14,999 | 48 | 1.2% |
| $15,000 to $24,999 | 105 | 2.6% |
| $25,000 to $34,999 | 226 | 5.6% |
| $35,000 to $49,999 | 335 | 8.3% |
| $50,000 to $74,999 | 738 | 18.3% |
| $75,000 to $99,999 | 774 | 19.2% |
| $100,000 to $149,999 | 1,020 | 25.3% |
| $150,000 to $199,999 | 294 | 7.3% |
| $200,000+ | 347 | 8.6% |
Family Income by Famaliy Size in Moultrie County
7+ person families (158 | 3.9%) account for the highest median family income in Moultrie County with $148,241 per family, while 2-person families (2,122 | 52.6%) have the highest median income of $41,062 per family member.
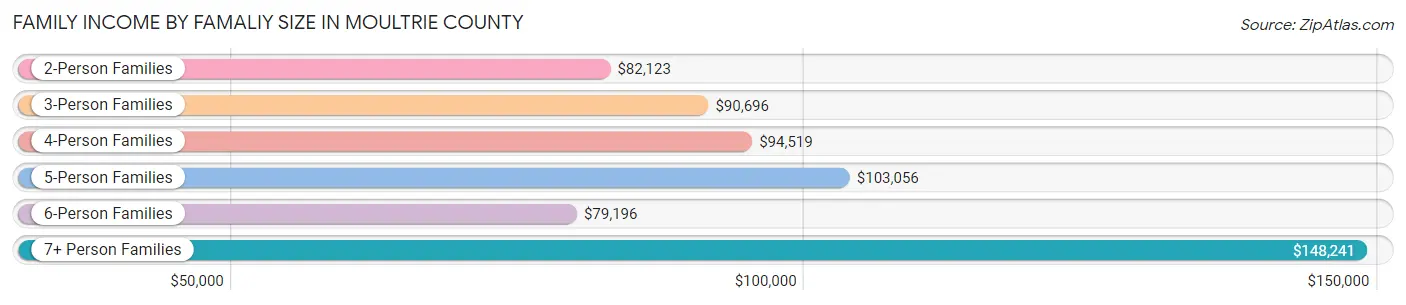
| Income Bracket | # Families | Median Income |
| 2-Person Families | 2,122 (52.6%) | $82,123 |
| 3-Person Families | 715 (17.7%) | $90,696 |
| 4-Person Families | 517 (12.8%) | $94,519 |
| 5-Person Families | 384 (9.5%) | $103,056 |
| 6-Person Families | 135 (3.4%) | $79,196 |
| 7+ Person Families | 158 (3.9%) | $148,241 |
| Total | 4,031 (100.0%) | $89,934 |
Family Income by Number of Earners in Moultrie County
The median family income in Moultrie County is $89,934, with families comprising 3+ earners (554) having the highest median family income of $147,963, while families with no earners (611) have the lowest median family income of $44,135, accounting for 13.7% and 15.2% of families, respectively.
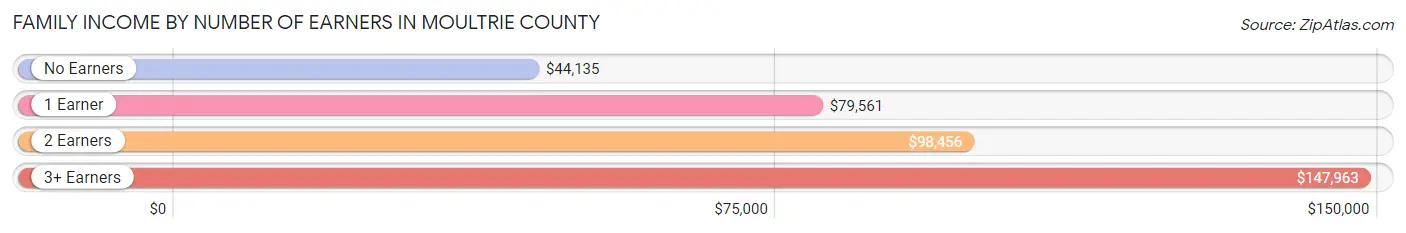
| Number of Earners | # Families | Median Income |
| No Earners | 611 (15.2%) | $44,135 |
| 1 Earner | 1,568 (38.9%) | $79,561 |
| 2 Earners | 1,298 (32.2%) | $98,456 |
| 3+ Earners | 554 (13.7%) | $147,963 |
| Total | 4,031 (100.0%) | $89,934 |
Household Income in Moultrie County
Household Income Brackets in Moultrie County
With 1,159 households falling in the category, the $100,000 to $149,999 income range is the most frequent in Moultrie County, accounting for 19.9% of all households. In contrast, only 163 households (2.8%) fall into the $10,000 to $14,999 income bracket, making it the least populous group.
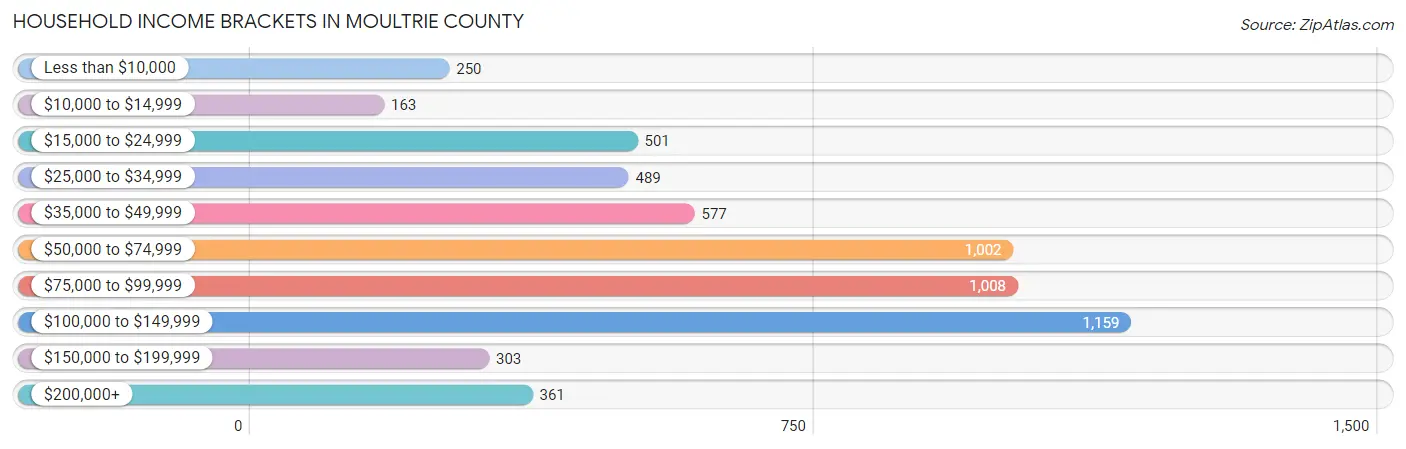
| Income Bracket | # Households | % Households |
| Less than $10,000 | 250 | 4.3% |
| $10,000 to $14,999 | 163 | 2.8% |
| $15,000 to $24,999 | 501 | 8.6% |
| $25,000 to $34,999 | 489 | 8.4% |
| $35,000 to $49,999 | 577 | 9.9% |
| $50,000 to $74,999 | 1,002 | 17.2% |
| $75,000 to $99,999 | 1,008 | 17.3% |
| $100,000 to $149,999 | 1,159 | 19.9% |
| $150,000 to $199,999 | 303 | 5.2% |
| $200,000+ | 361 | 6.2% |
Household Income by Householder Age in Moultrie County
The median household income in Moultrie County is $72,833, with the highest median household income of $86,071 found in the 45 to 64 years age bracket for the primary householder. A total of 2,140 households (36.7%) fall into this category. Meanwhile, the 65+ years age bracket for the primary householder has the lowest median household income of $49,216, with 1,713 households (29.4%) in this group.
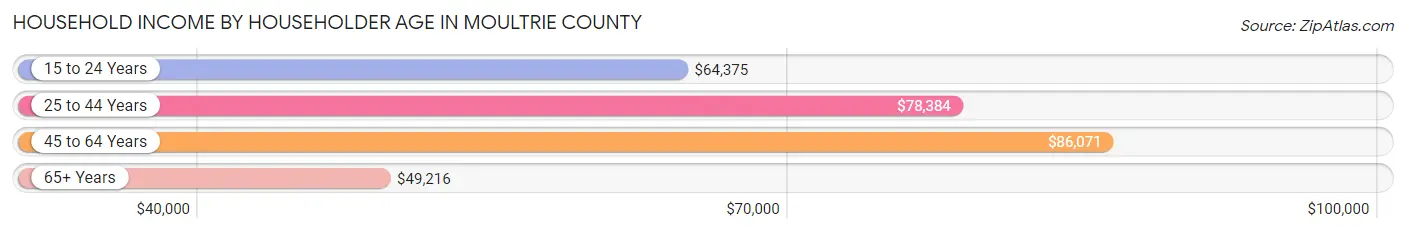
| Income Bracket | # Households | Median Income |
| 15 to 24 Years | 232 (4.0%) | $64,375 |
| 25 to 44 Years | 1,739 (29.9%) | $78,384 |
| 45 to 64 Years | 2,140 (36.7%) | $86,071 |
| 65+ Years | 1,713 (29.4%) | $49,216 |
| Total | 5,824 (100.0%) | $72,833 |
Poverty in Moultrie County
Income Below Poverty by Sex and Age in Moultrie County
With 7.1% poverty level for males and 11.2% for females among the residents of Moultrie County, 6 to 11 year old males and 25 to 34 year old females are the most vulnerable to poverty, with 99 males (17.4%) and 166 females (20.3%) in their respective age groups living below the poverty level.
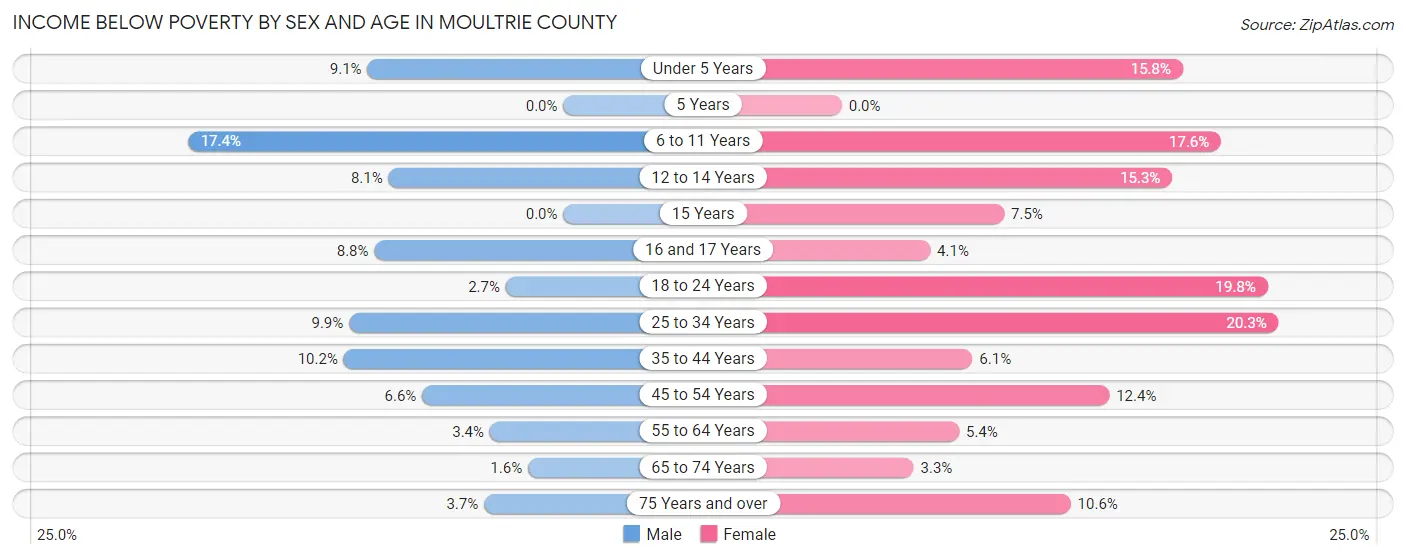
| Age Bracket | Male | Female |
| Under 5 Years | 39 (9.1%) | 65 (15.8%) |
| 5 Years | 0 (0.0%) | 0 (0.0%) |
| 6 to 11 Years | 99 (17.4%) | 116 (17.6%) |
| 12 to 14 Years | 37 (8.1%) | 42 (15.3%) |
| 15 Years | 0 (0.0%) | 7 (7.5%) |
| 16 and 17 Years | 25 (8.8%) | 10 (4.1%) |
| 18 to 24 Years | 16 (2.7%) | 97 (19.8%) |
| 25 to 34 Years | 79 (9.9%) | 166 (20.3%) |
| 35 to 44 Years | 87 (10.2%) | 54 (6.1%) |
| 45 to 54 Years | 57 (6.6%) | 101 (12.4%) |
| 55 to 64 Years | 30 (3.4%) | 56 (5.4%) |
| 65 to 74 Years | 12 (1.6%) | 25 (3.3%) |
| 75 Years and over | 15 (3.7%) | 72 (10.6%) |
| Total | 496 (7.1%) | 811 (11.2%) |
Income Above Poverty by Sex and Age in Moultrie County
According to the poverty statistics in Moultrie County, males aged 5 years and females aged 5 years are the age groups that are most secure financially, with 100.0% of males and 100.0% of females in these age groups living above the poverty line.
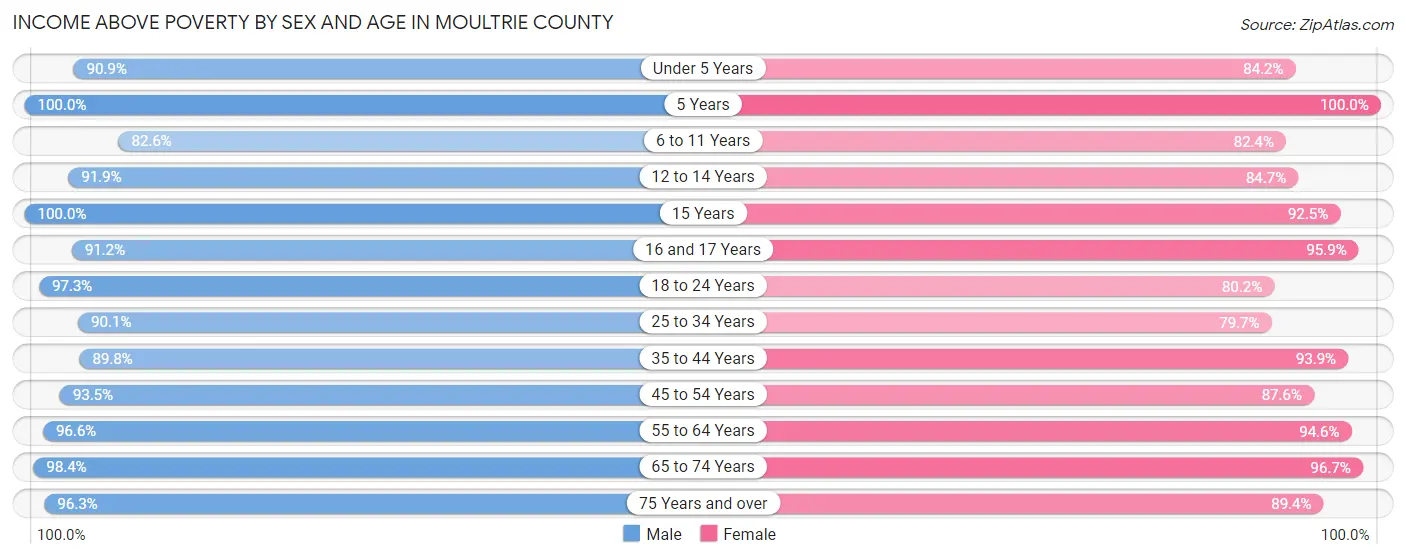
| Age Bracket | Male | Female |
| Under 5 Years | 390 (90.9%) | 346 (84.2%) |
| 5 Years | 71 (100.0%) | 72 (100.0%) |
| 6 to 11 Years | 469 (82.6%) | 543 (82.4%) |
| 12 to 14 Years | 419 (91.9%) | 232 (84.7%) |
| 15 Years | 64 (100.0%) | 86 (92.5%) |
| 16 and 17 Years | 260 (91.2%) | 234 (95.9%) |
| 18 to 24 Years | 584 (97.3%) | 394 (80.2%) |
| 25 to 34 Years | 716 (90.1%) | 653 (79.7%) |
| 35 to 44 Years | 767 (89.8%) | 837 (93.9%) |
| 45 to 54 Years | 813 (93.4%) | 713 (87.6%) |
| 55 to 64 Years | 851 (96.6%) | 974 (94.6%) |
| 65 to 74 Years | 720 (98.4%) | 725 (96.7%) |
| 75 Years and over | 393 (96.3%) | 606 (89.4%) |
| Total | 6,517 (92.9%) | 6,415 (88.8%) |
Income Below Poverty Among Married-Couple Families in Moultrie County
The poverty statistics for married-couple families in Moultrie County show that 4.2% or 137 of the total 3,271 families live below the poverty line. Families with 3 or 4 children have the highest poverty rate of 8.3%, comprising of 31 families. On the other hand, families with 5 or more children have the lowest poverty rate of 0.0%, which includes 0 families.
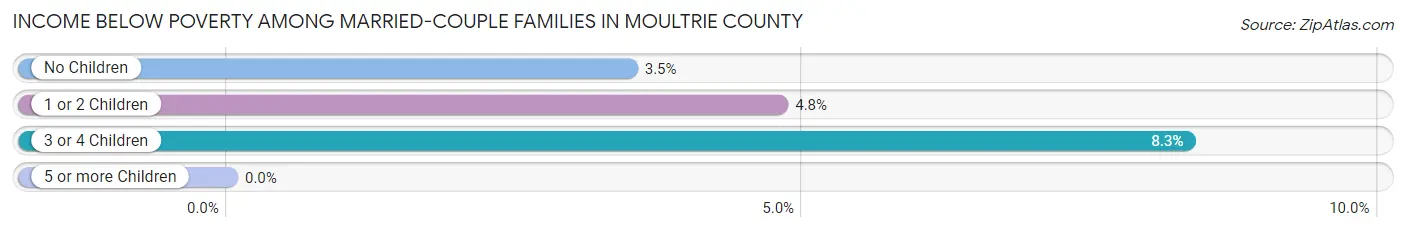
| Children | Above Poverty | Below Poverty |
| No Children | 1,944 (96.5%) | 70 (3.5%) |
| 1 or 2 Children | 716 (95.2%) | 36 (4.8%) |
| 3 or 4 Children | 341 (91.7%) | 31 (8.3%) |
| 5 or more Children | 133 (100.0%) | 0 (0.0%) |
| Total | 3,134 (95.8%) | 137 (4.2%) |
Income Below Poverty Among Single-Parent Households in Moultrie County
According to the poverty data in Moultrie County, 4.6% or 11 single-father households and 25.1% or 130 single-mother households are living below the poverty line. Among single-father households, those with 1 or 2 children have the highest poverty rate, with 11 households (6.5%) experiencing poverty. Likewise, among single-mother households, those with 3 or 4 children have the highest poverty rate, with 65 households (95.6%) falling below the poverty line.
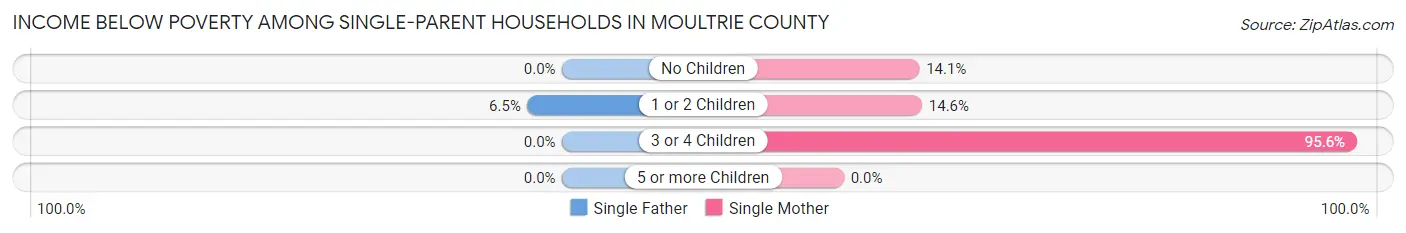
| Children | Single Father | Single Mother |
| No Children | 0 (0.0%) | 19 (14.1%) |
| 1 or 2 Children | 11 (6.5%) | 46 (14.6%) |
| 3 or 4 Children | 0 (0.0%) | 65 (95.6%) |
| 5 or more Children | 0 (0.0%) | 0 (0.0%) |
| Total | 11 (4.6%) | 130 (25.1%) |
Income Below Poverty Among Married-Couple vs Single-Parent Households in Moultrie County
The poverty data for Moultrie County shows that 137 of the married-couple family households (4.2%) and 141 of the single-parent households (18.5%) are living below the poverty level. Within the married-couple family households, those with 3 or 4 children have the highest poverty rate, with 31 households (8.3%) falling below the poverty line. Among the single-parent households, those with 3 or 4 children have the highest poverty rate, with 65 household (82.3%) living below poverty.
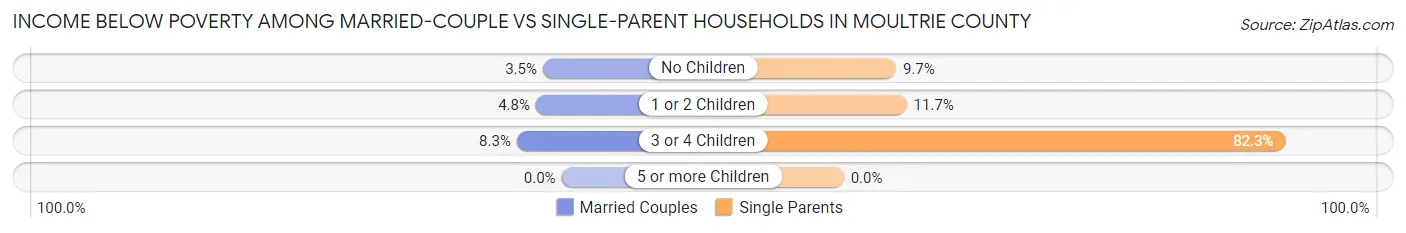
| Children | Married-Couple Families | Single-Parent Households |
| No Children | 70 (3.5%) | 19 (9.7%) |
| 1 or 2 Children | 36 (4.8%) | 57 (11.7%) |
| 3 or 4 Children | 31 (8.3%) | 65 (82.3%) |
| 5 or more Children | 0 (0.0%) | 0 (0.0%) |
| Total | 137 (4.2%) | 141 (18.5%) |
Employment Characteristics in Moultrie County
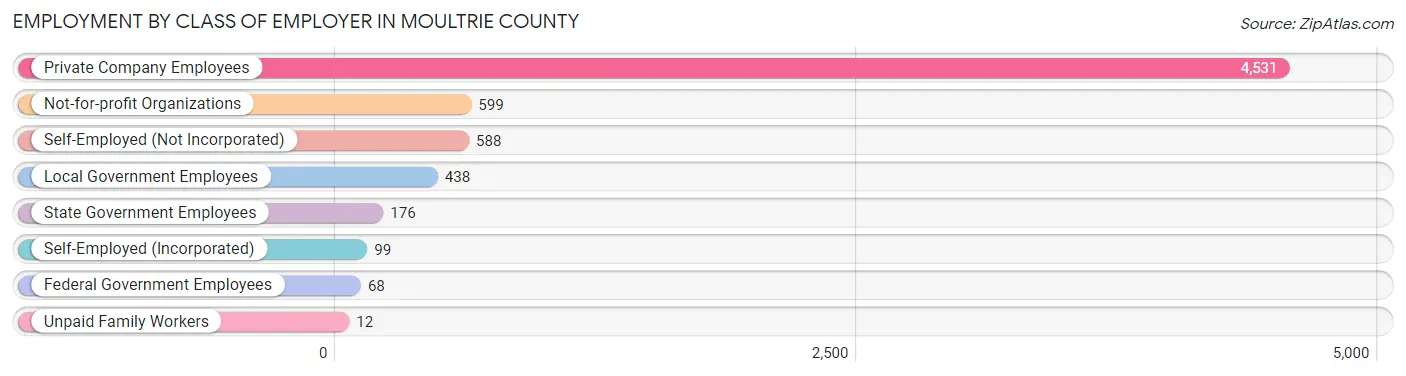
Employment by Class of Employer in Moultrie County
Among the 6,511 employed individuals in Moultrie County, private company employees (4,531 | 69.6%), not-for-profit organizations (599 | 9.2%), and self-employed (not incorporated) (588 | 9.0%) make up the most common classes of employment.
| Employer Class | # Employees | % Employees |
| Private Company Employees | 4,531 | 69.6% |
| Self-Employed (Incorporated) | 99 | 1.5% |
| Self-Employed (Not Incorporated) | 588 | 9.0% |
| Not-for-profit Organizations | 599 | 9.2% |
| Local Government Employees | 438 | 6.7% |
| State Government Employees | 176 | 2.7% |
| Federal Government Employees | 68 | 1.0% |
| Unpaid Family Workers | 12 | 0.2% |
| Total | 6,511 | 100.0% |
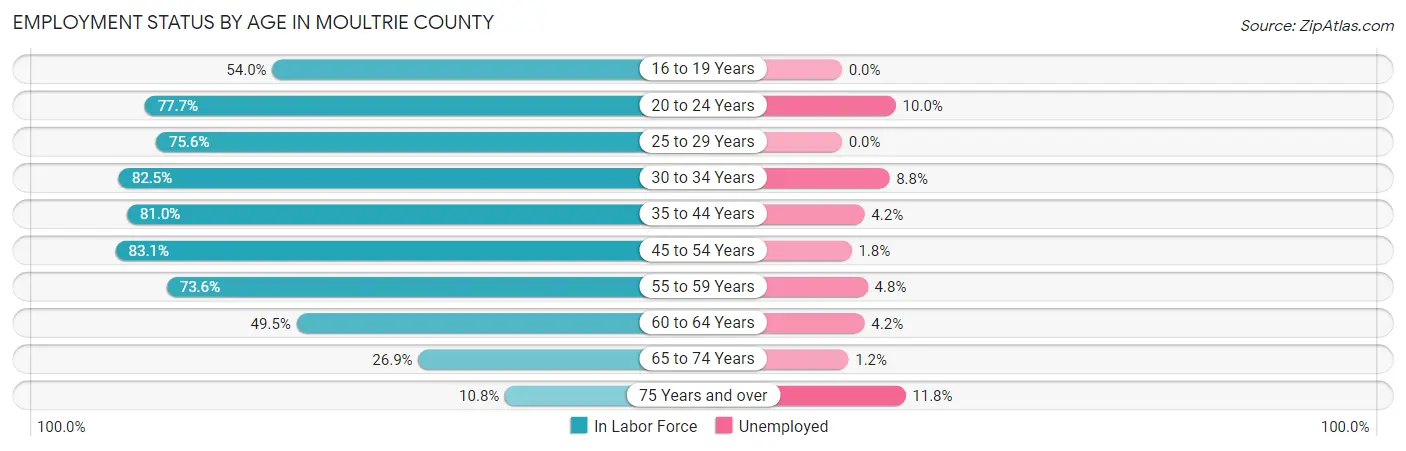
Employment Status by Age in Moultrie County
According to the labor force statistics for Moultrie County, out of the total population over 16 years of age (11,385), 60.8% or 6,922 individuals are in the labor force, with 4.1% or 284 of them unemployed. The age group with the highest labor force participation rate is 45 to 54 years, with 83.1% or 1,400 individuals in the labor force. Within the labor force, the 75 years and over age range has the highest percentage of unemployed individuals, with 11.8% or 15 of them being unemployed.
| Age Bracket | In Labor Force | Unemployed |
| 16 to 19 Years | 462 (54.0%) | 0 (0.0%) |
| 20 to 24 Years | 598 (77.7%) | 60 (10.0%) |
| 25 to 29 Years | 584 (75.6%) | 0 (0.0%) |
| 30 to 34 Years | 697 (82.5%) | 61 (8.8%) |
| 35 to 44 Years | 1,422 (81.0%) | 60 (4.2%) |
| 45 to 54 Years | 1,400 (83.1%) | 25 (1.8%) |
| 55 to 59 Years | 712 (73.6%) | 34 (4.8%) |
| 60 to 64 Years | 497 (49.5%) | 21 (4.2%) |
| 65 to 74 Years | 418 (26.9%) | 5 (1.2%) |
| 75 Years and over | 127 (10.8%) | 15 (11.8%) |
| Total | 6,922 (60.8%) | 284 (4.1%) |
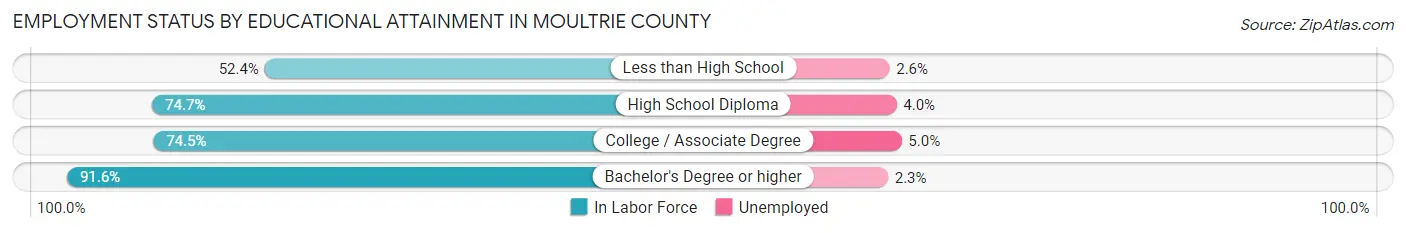
Employment Status by Educational Attainment in Moultrie County
According to labor force statistics for Moultrie County, 75.6% of individuals (5,314) out of the total population between 25 and 64 years of age (7,029) are in the labor force, with 3.8% or 202 of them being unemployed. The group with the highest labor force participation rate are those with the educational attainment of bachelor's degree or higher, with 91.6% or 1,428 individuals in the labor force. Within the labor force, individuals with college / associate degree education have the highest percentage of unemployment, with 5.0% or 89 of them being unemployed.
| Educational Attainment | In Labor Force | Unemployed |
| Less than High School | 462 (52.4%) | 23 (2.6%) |
| High School Diploma | 1,649 (74.7%) | 88 (4.0%) |
| College / Associate Degree | 1,775 (74.5%) | 119 (5.0%) |
| Bachelor's Degree or higher | 1,428 (91.6%) | 36 (2.3%) |
| Total | 5,314 (75.6%) | 267 (3.8%) |
Employment Occupations by Sex in Moultrie County
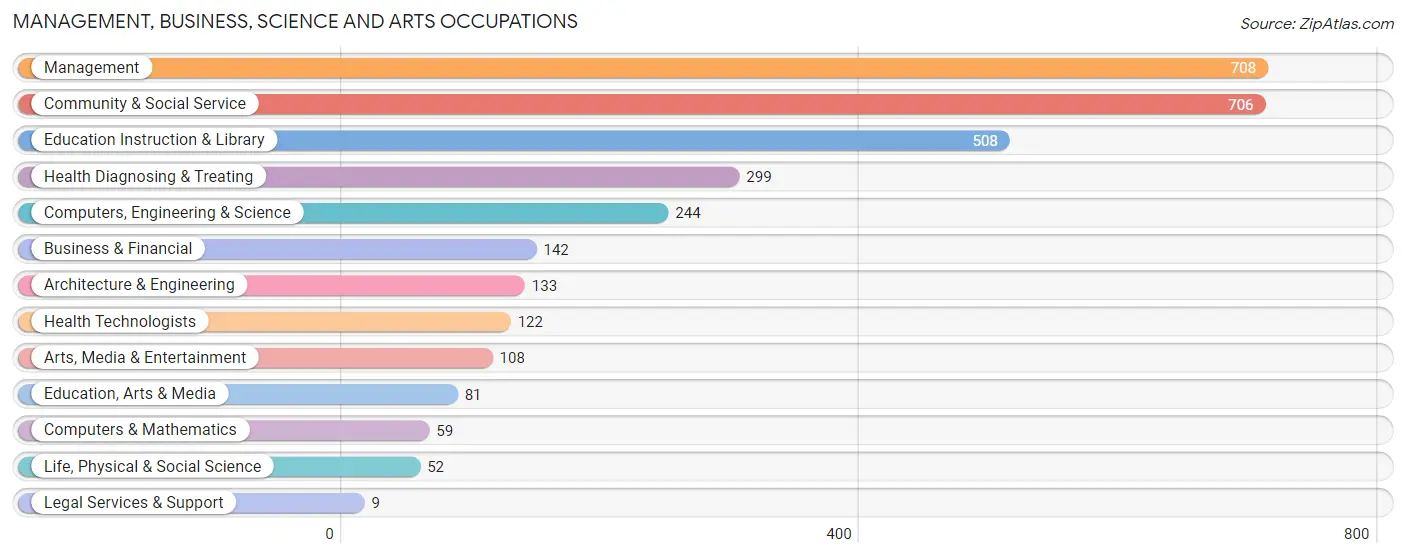
Management, Business, Science and Arts Occupations
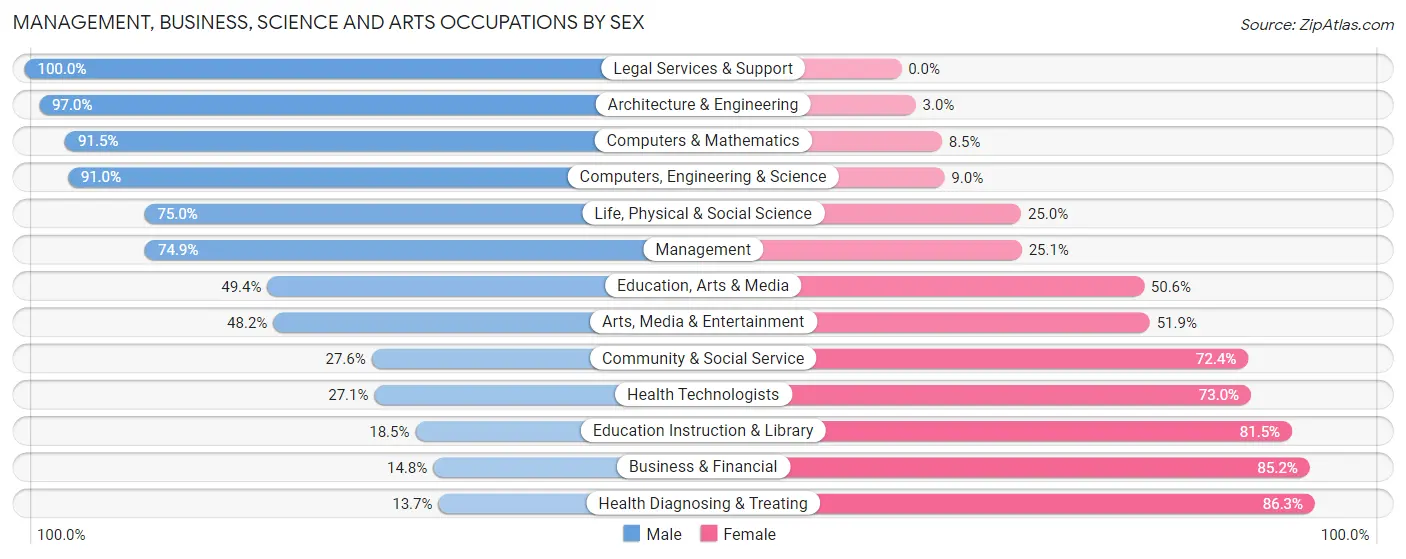
The most common Management, Business, Science and Arts occupations in Moultrie County are Management (708 | 10.7%), Community & Social Service (706 | 10.7%), Education Instruction & Library (508 | 7.7%), Health Diagnosing & Treating (299 | 4.5%), and Computers, Engineering & Science (244 | 3.7%).
Management, Business, Science and Arts Occupations by Sex
Within the Management, Business, Science and Arts occupations in Moultrie County, the most male-oriented occupations are Legal Services & Support (100.0%), Architecture & Engineering (97.0%), and Computers & Mathematics (91.5%), while the most female-oriented occupations are Health Diagnosing & Treating (86.3%), Business & Financial (85.2%), and Education Instruction & Library (81.5%).
| Occupation | Male | Female |
| Management | 530 (74.9%) | 178 (25.1%) |
| Business & Financial | 21 (14.8%) | 121 (85.2%) |
| Computers, Engineering & Science | 222 (91.0%) | 22 (9.0%) |
| Computers & Mathematics | 54 (91.5%) | 5 (8.5%) |
| Architecture & Engineering | 129 (97.0%) | 4 (3.0%) |
| Life, Physical & Social Science | 39 (75.0%) | 13 (25.0%) |
| Community & Social Service | 195 (27.6%) | 511 (72.4%) |
| Education, Arts & Media | 40 (49.4%) | 41 (50.6%) |
| Legal Services & Support | 9 (100.0%) | 0 (0.0%) |
| Education Instruction & Library | 94 (18.5%) | 414 (81.5%) |
| Arts, Media & Entertainment | 52 (48.1%) | 56 (51.8%) |
| Health Diagnosing & Treating | 41 (13.7%) | 258 (86.3%) |
| Health Technologists | 33 (27.1%) | 89 (73.0%) |
| Total (Category) | 1,009 (48.1%) | 1,090 (51.9%) |
| Total (Overall) | 3,835 (58.1%) | 2,762 (41.9%) |
Services Occupations
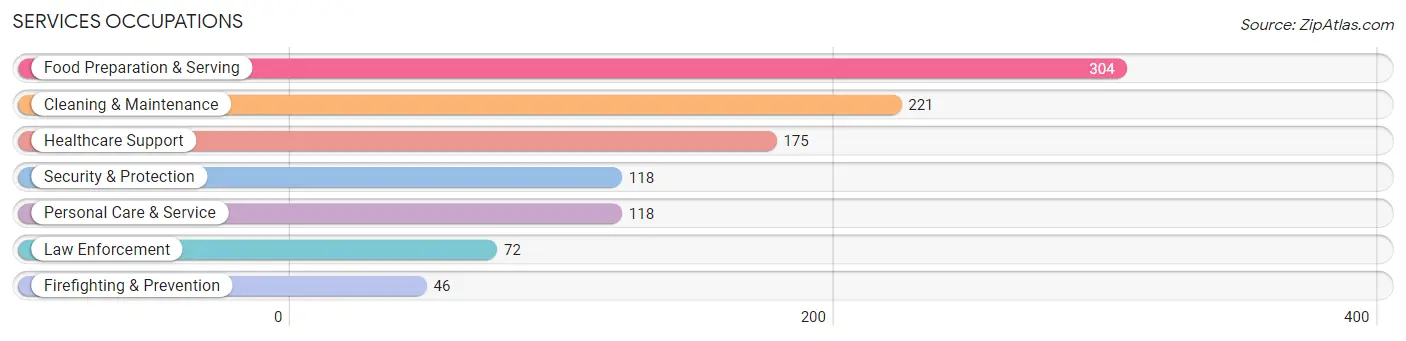
The most common Services occupations in Moultrie County are Food Preparation & Serving (304 | 4.6%), Cleaning & Maintenance (221 | 3.4%), Healthcare Support (175 | 2.6%), Security & Protection (118 | 1.8%), and Personal Care & Service (118 | 1.8%).
Services Occupations by Sex
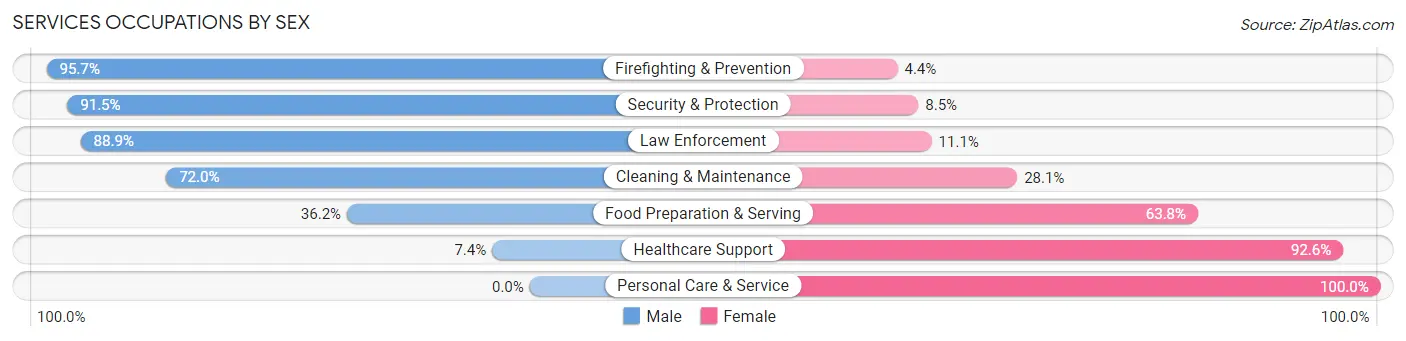
Within the Services occupations in Moultrie County, the most male-oriented occupations are Firefighting & Prevention (95.7%), Security & Protection (91.5%), and Law Enforcement (88.9%), while the most female-oriented occupations are Personal Care & Service (100.0%), Healthcare Support (92.6%), and Food Preparation & Serving (63.8%).
| Occupation | Male | Female |
| Healthcare Support | 13 (7.4%) | 162 (92.6%) |
| Security & Protection | 108 (91.5%) | 10 (8.5%) |
| Firefighting & Prevention | 44 (95.7%) | 2 (4.3%) |
| Law Enforcement | 64 (88.9%) | 8 (11.1%) |
| Food Preparation & Serving | 110 (36.2%) | 194 (63.8%) |
| Cleaning & Maintenance | 159 (72.0%) | 62 (28.1%) |
| Personal Care & Service | 0 (0.0%) | 118 (100.0%) |
| Total (Category) | 390 (41.7%) | 546 (58.3%) |
| Total (Overall) | 3,835 (58.1%) | 2,762 (41.9%) |
Sales and Office Occupations
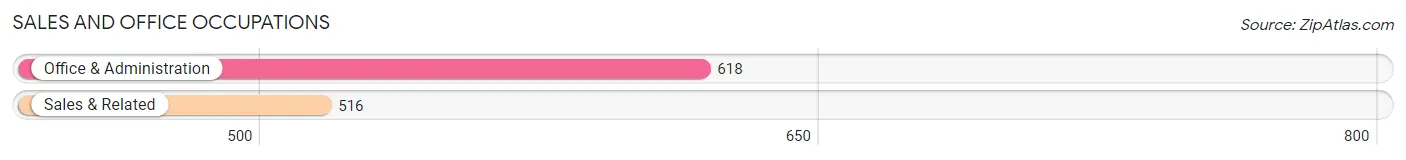
The most common Sales and Office occupations in Moultrie County are Office & Administration (618 | 9.4%), and Sales & Related (516 | 7.8%).
Sales and Office Occupations by Sex
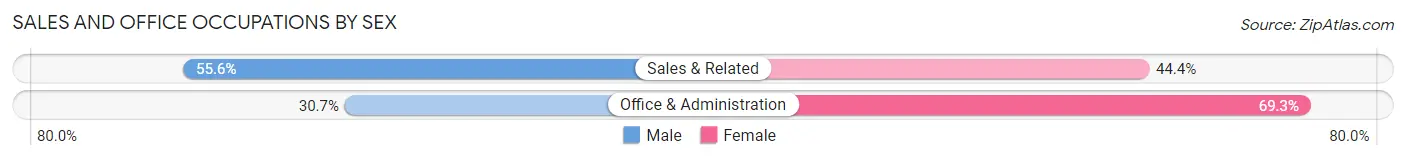
| Occupation | Male | Female |
| Sales & Related | 287 (55.6%) | 229 (44.4%) |
| Office & Administration | 190 (30.7%) | 428 (69.3%) |
| Total (Category) | 477 (42.1%) | 657 (57.9%) |
| Total (Overall) | 3,835 (58.1%) | 2,762 (41.9%) |
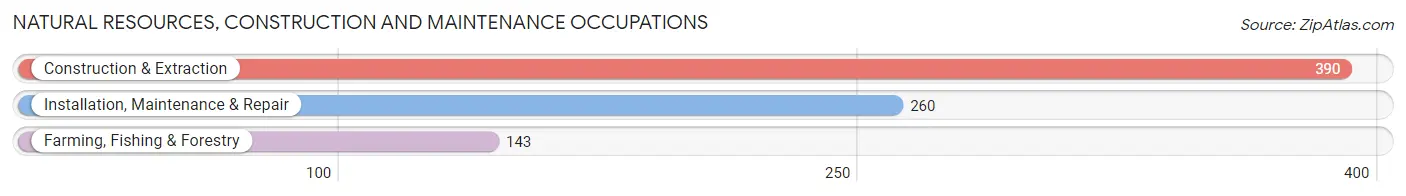
Natural Resources, Construction and Maintenance Occupations
The most common Natural Resources, Construction and Maintenance occupations in Moultrie County are Construction & Extraction (390 | 5.9%), Installation, Maintenance & Repair (260 | 3.9%), and Farming, Fishing & Forestry (143 | 2.2%).
Natural Resources, Construction and Maintenance Occupations by Sex
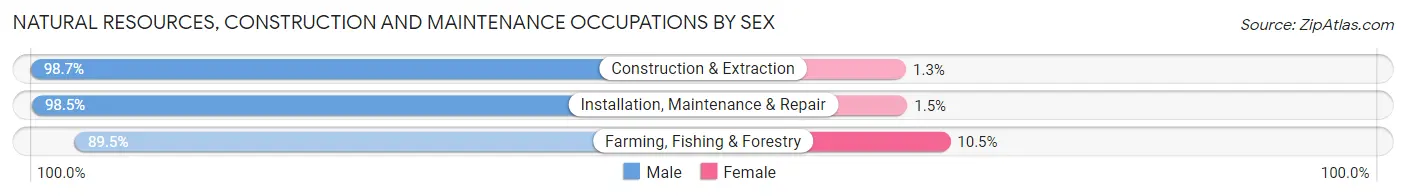
| Occupation | Male | Female |
| Farming, Fishing & Forestry | 128 (89.5%) | 15 (10.5%) |
| Construction & Extraction | 385 (98.7%) | 5 (1.3%) |
| Installation, Maintenance & Repair | 256 (98.5%) | 4 (1.5%) |
| Total (Category) | 769 (97.0%) | 24 (3.0%) |
| Total (Overall) | 3,835 (58.1%) | 2,762 (41.9%) |
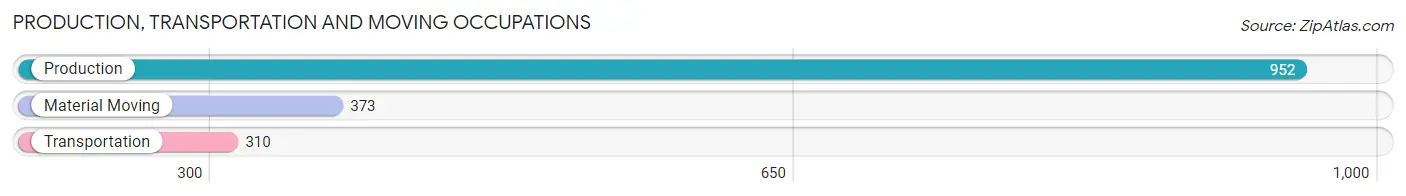
Production, Transportation and Moving Occupations
The most common Production, Transportation and Moving occupations in Moultrie County are Production (952 | 14.4%), Material Moving (373 | 5.7%), and Transportation (310 | 4.7%).
Production, Transportation and Moving Occupations by Sex
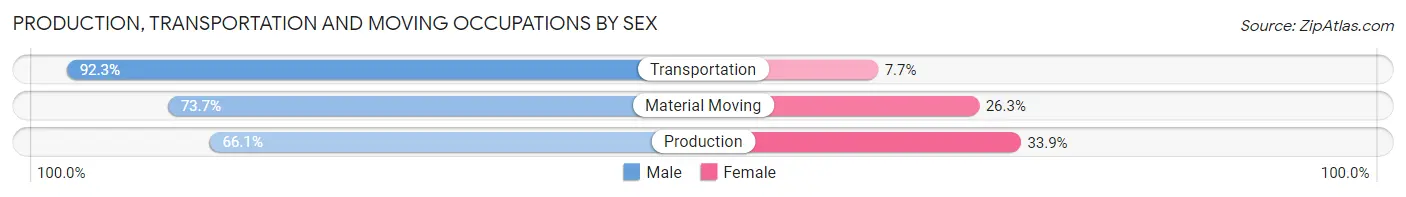
| Occupation | Male | Female |
| Production | 629 (66.1%) | 323 (33.9%) |
| Transportation | 286 (92.3%) | 24 (7.7%) |
| Material Moving | 275 (73.7%) | 98 (26.3%) |
| Total (Category) | 1,190 (72.8%) | 445 (27.2%) |
| Total (Overall) | 3,835 (58.1%) | 2,762 (41.9%) |
Employment Industries by Sex in Moultrie County
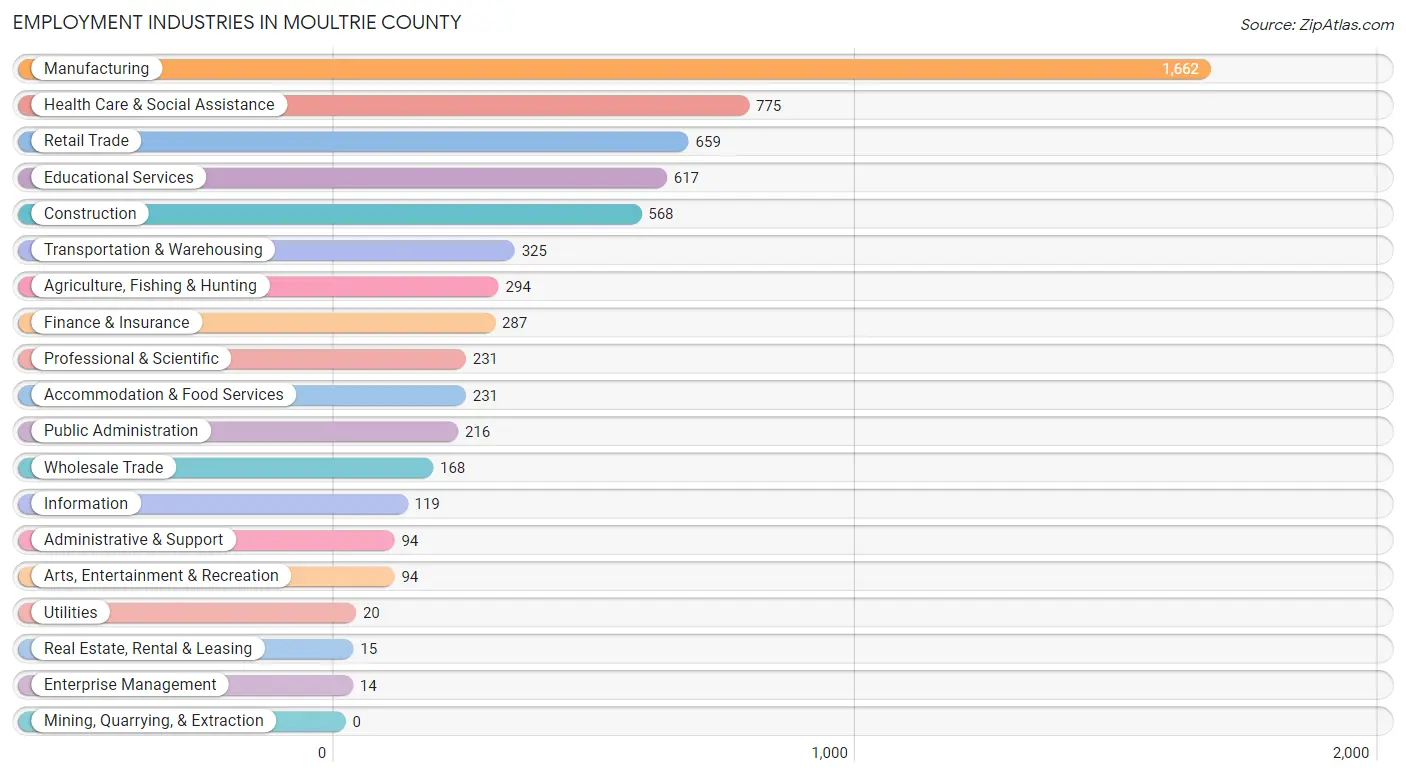
Employment Industries in Moultrie County
The major employment industries in Moultrie County include Manufacturing (1,662 | 25.2%), Health Care & Social Assistance (775 | 11.7%), Retail Trade (659 | 10.0%), Educational Services (617 | 9.3%), and Construction (568 | 8.6%).
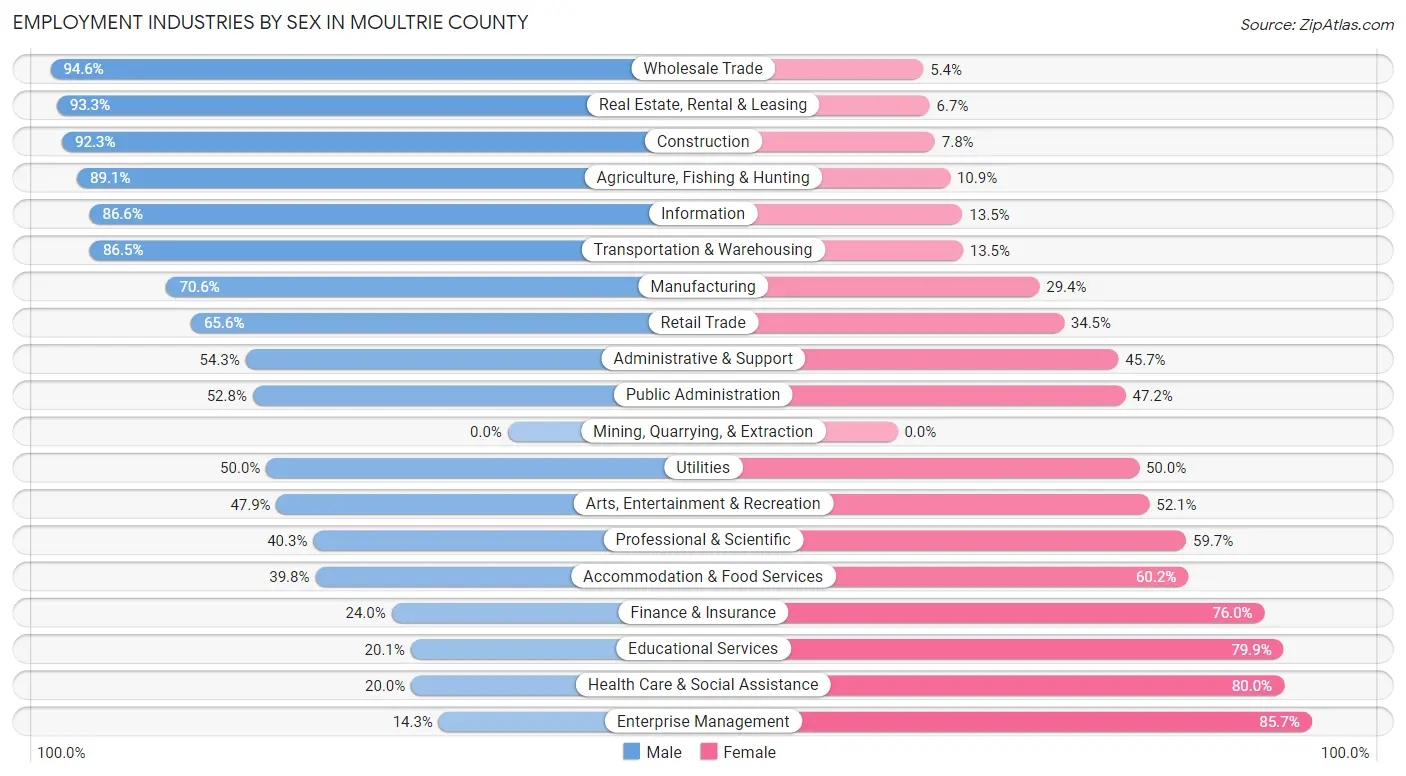
Employment Industries by Sex in Moultrie County
The Moultrie County industries that see more men than women are Wholesale Trade (94.6%), Real Estate, Rental & Leasing (93.3%), and Construction (92.2%), whereas the industries that tend to have a higher number of women are Enterprise Management (85.7%), Health Care & Social Assistance (80.0%), and Educational Services (79.9%).
| Industry | Male | Female |
| Agriculture, Fishing & Hunting | 262 (89.1%) | 32 (10.9%) |
| Mining, Quarrying, & Extraction | 0 (0.0%) | 0 (0.0%) |
| Construction | 524 (92.2%) | 44 (7.7%) |
| Manufacturing | 1,174 (70.6%) | 488 (29.4%) |
| Wholesale Trade | 159 (94.6%) | 9 (5.4%) |
| Retail Trade | 432 (65.5%) | 227 (34.4%) |
| Transportation & Warehousing | 281 (86.5%) | 44 (13.5%) |
| Utilities | 10 (50.0%) | 10 (50.0%) |
| Information | 103 (86.6%) | 16 (13.5%) |
| Finance & Insurance | 69 (24.0%) | 218 (76.0%) |
| Real Estate, Rental & Leasing | 14 (93.3%) | 1 (6.7%) |
| Professional & Scientific | 93 (40.3%) | 138 (59.7%) |
| Enterprise Management | 2 (14.3%) | 12 (85.7%) |
| Administrative & Support | 51 (54.3%) | 43 (45.7%) |
| Educational Services | 124 (20.1%) | 493 (79.9%) |
| Health Care & Social Assistance | 155 (20.0%) | 620 (80.0%) |
| Arts, Entertainment & Recreation | 45 (47.9%) | 49 (52.1%) |
| Accommodation & Food Services | 92 (39.8%) | 139 (60.2%) |
| Public Administration | 114 (52.8%) | 102 (47.2%) |
| Total | 3,835 (58.1%) | 2,762 (41.9%) |
Education in Moultrie County
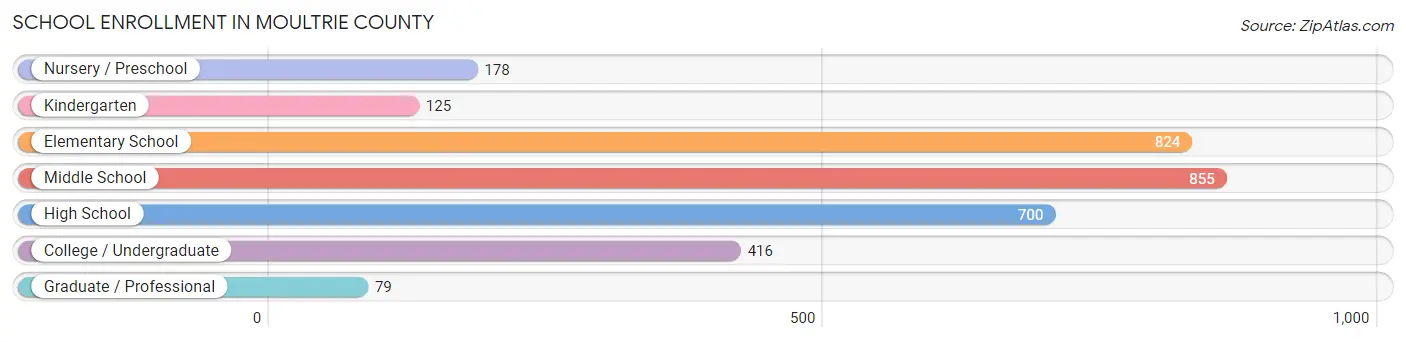
School Enrollment in Moultrie County
The most common levels of schooling among the 3,177 students in Moultrie County are middle school (855 | 26.9%), elementary school (824 | 25.9%), and high school (700 | 22.0%).
| School Level | # Students | % Students |
| Nursery / Preschool | 178 | 5.6% |
| Kindergarten | 125 | 3.9% |
| Elementary School | 824 | 25.9% |
| Middle School | 855 | 26.9% |
| High School | 700 | 22.0% |
| College / Undergraduate | 416 | 13.1% |
| Graduate / Professional | 79 | 2.5% |
| Total | 3,177 | 100.0% |
School Enrollment by Age by Funding Source in Moultrie County
Out of a total of 3,177 students who are enrolled in schools in Moultrie County, 492 (15.5%) attend a private institution, while the remaining 2,685 (84.5%) are enrolled in public schools. The age group of 20 to 24 year olds has the highest likelihood of being enrolled in private schools, with 55 (34.4% in the age bracket) enrolled. Conversely, the age group of 18 to 19 year olds has the lowest likelihood of being enrolled in a private school, with 147 (99.3% in the age bracket) attending a public institution.

| Age Bracket | Public School | Private School |
| 3 to 4 Year Olds | 118 (83.7%) | 23 (16.3%) |
| 5 to 9 Year Old | 776 (87.7%) | 109 (12.3%) |
| 10 to 14 Year Olds | 895 (85.9%) | 147 (14.1%) |
| 15 to 17 Year Olds | 398 (77.3%) | 117 (22.7%) |
| 18 to 19 Year Olds | 147 (99.3%) | 1 (0.7%) |
| 20 to 24 Year Olds | 105 (65.6%) | 55 (34.4%) |
| 25 to 34 Year Olds | 144 (94.7%) | 8 (5.3%) |
| 35 Years and over | 102 (76.1%) | 32 (23.9%) |
| Total | 2,685 (84.5%) | 492 (15.5%) |
Educational Attainment by Field of Study in Moultrie County
Education (537 | 25.2%), business (400 | 18.8%), science & technology (266 | 12.5%), arts & humanities (179 | 8.4%), and bio, nature & agricultural (140 | 6.6%) are the most common fields of study among 2,133 individuals in Moultrie County who have obtained a bachelor's degree or higher.
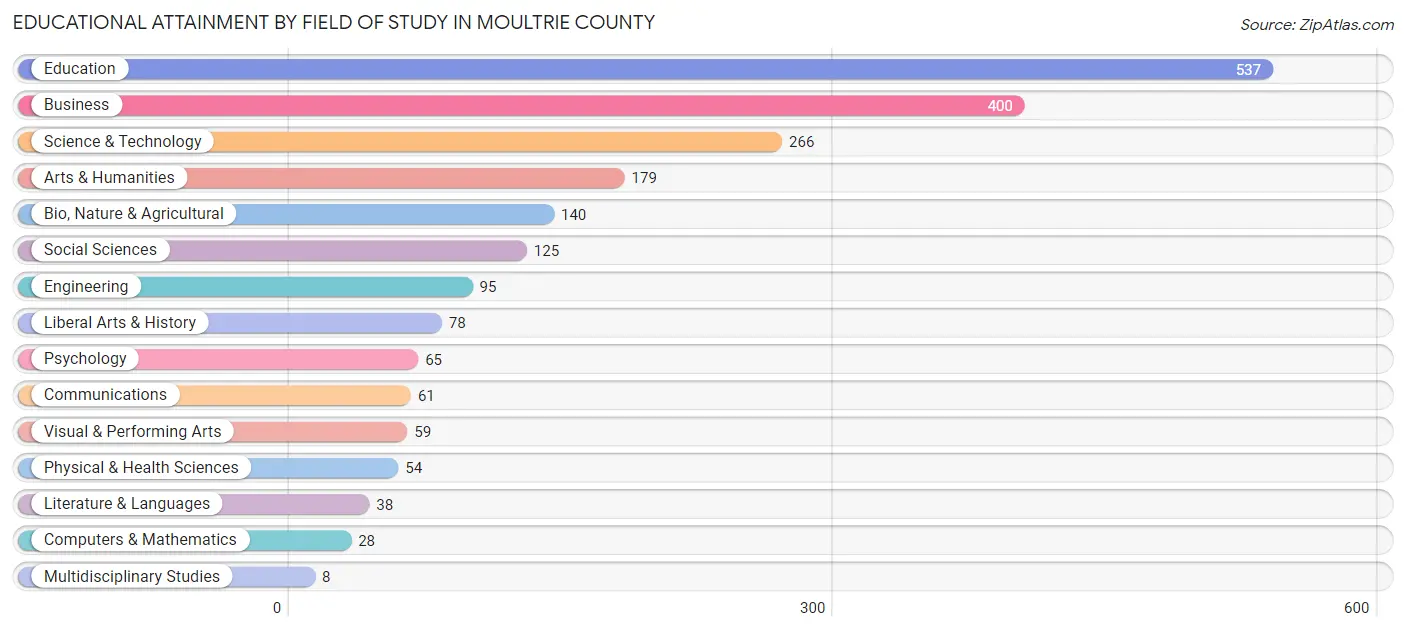
| Field of Study | # Graduates | % Graduates |
| Computers & Mathematics | 28 | 1.3% |
| Bio, Nature & Agricultural | 140 | 6.6% |
| Physical & Health Sciences | 54 | 2.5% |
| Psychology | 65 | 3.0% |
| Social Sciences | 125 | 5.9% |
| Engineering | 95 | 4.4% |
| Multidisciplinary Studies | 8 | 0.4% |
| Science & Technology | 266 | 12.5% |
| Business | 400 | 18.8% |
| Education | 537 | 25.2% |
| Literature & Languages | 38 | 1.8% |
| Liberal Arts & History | 78 | 3.7% |
| Visual & Performing Arts | 59 | 2.8% |
| Communications | 61 | 2.9% |
| Arts & Humanities | 179 | 8.4% |
| Total | 2,133 | 100.0% |
Transportation & Commute in Moultrie County
Vehicle Availability by Sex in Moultrie County
The most prevalent vehicle ownership categories in Moultrie County are males with 2 vehicles (1,476, accounting for 39.4%) and females with 2 vehicles (1,201, making up 54.4%).
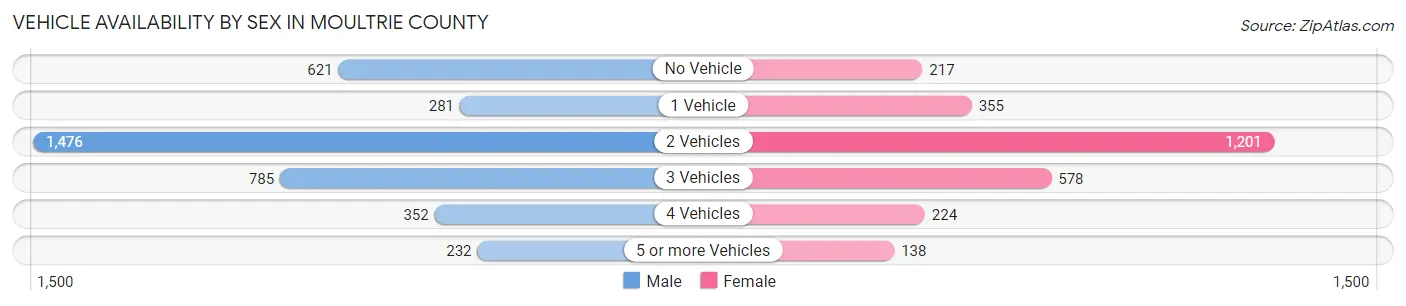
| Vehicles Available | Male | Female |
| No Vehicle | 621 (16.6%) | 217 (8.0%) |
| 1 Vehicle | 281 (7.5%) | 355 (13.1%) |
| 2 Vehicles | 1,476 (39.4%) | 1,201 (44.3%) |
| 3 Vehicles | 785 (20.9%) | 578 (21.3%) |
| 4 Vehicles | 352 (9.4%) | 224 (8.3%) |
| 5 or more Vehicles | 232 (6.2%) | 138 (5.1%) |
| Total | 3,747 (100.0%) | 2,713 (100.0%) |
Commute Time in Moultrie County
The most frequently occuring commute durations in Moultrie County are 5 to 9 minutes (1,161 commuters, 18.6%), 10 to 14 minutes (821 commuters, 13.2%), and 30 to 34 minutes (761 commuters, 12.2%).
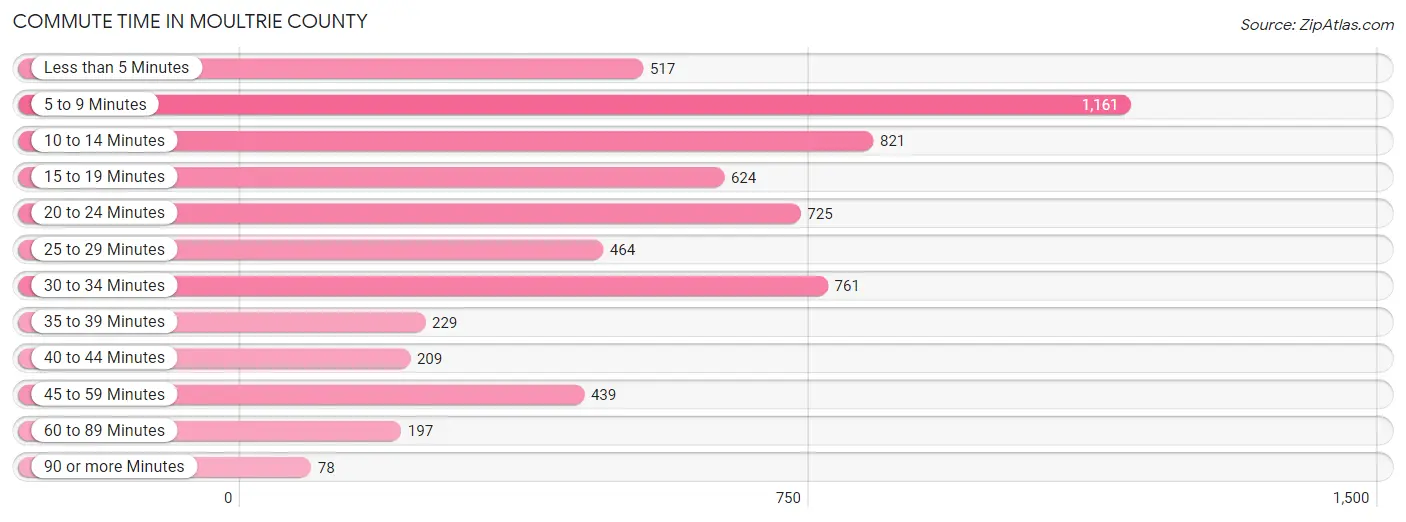
| Commute Time | # Commuters | % Commuters |
| Less than 5 Minutes | 517 | 8.3% |
| 5 to 9 Minutes | 1,161 | 18.6% |
| 10 to 14 Minutes | 821 | 13.2% |
| 15 to 19 Minutes | 624 | 10.0% |
| 20 to 24 Minutes | 725 | 11.7% |
| 25 to 29 Minutes | 464 | 7.4% |
| 30 to 34 Minutes | 761 | 12.2% |
| 35 to 39 Minutes | 229 | 3.7% |
| 40 to 44 Minutes | 209 | 3.4% |
| 45 to 59 Minutes | 439 | 7.0% |
| 60 to 89 Minutes | 197 | 3.2% |
| 90 or more Minutes | 78 | 1.3% |
Commute Time by Sex in Moultrie County
The most common commute times in Moultrie County are 5 to 9 minutes (618 commuters, 16.9%) for males and 5 to 9 minutes (543 commuters, 21.1%) for females.
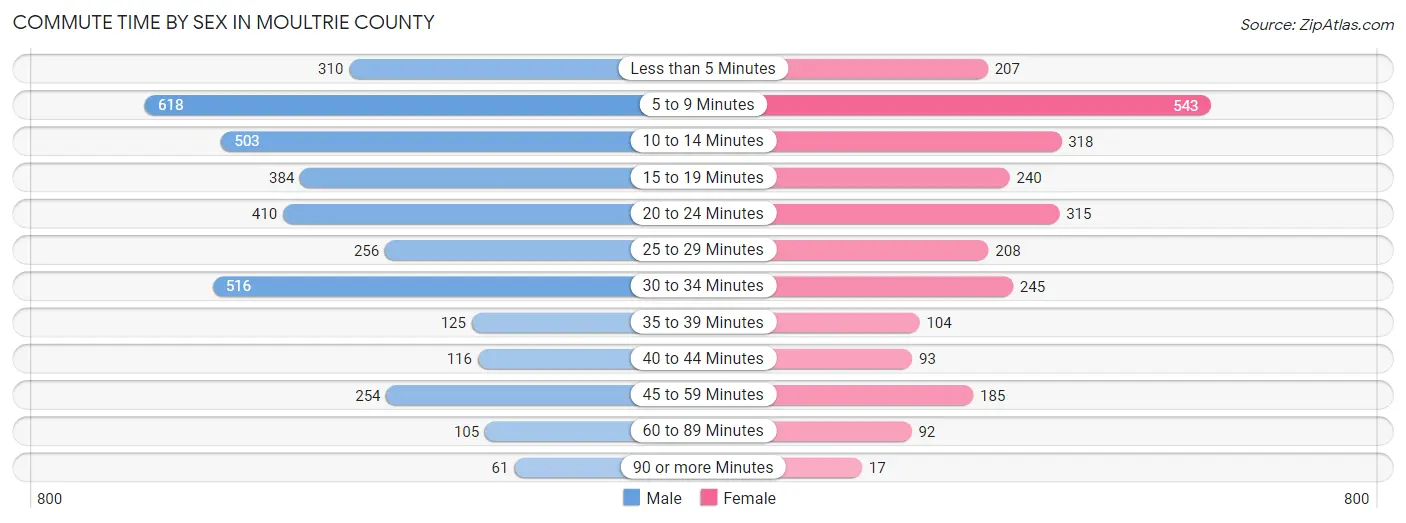
| Commute Time | Male | Female |
| Less than 5 Minutes | 310 (8.5%) | 207 (8.1%) |
| 5 to 9 Minutes | 618 (16.9%) | 543 (21.1%) |
| 10 to 14 Minutes | 503 (13.8%) | 318 (12.4%) |
| 15 to 19 Minutes | 384 (10.5%) | 240 (9.3%) |
| 20 to 24 Minutes | 410 (11.2%) | 315 (12.3%) |
| 25 to 29 Minutes | 256 (7.0%) | 208 (8.1%) |
| 30 to 34 Minutes | 516 (14.1%) | 245 (9.5%) |
| 35 to 39 Minutes | 125 (3.4%) | 104 (4.1%) |
| 40 to 44 Minutes | 116 (3.2%) | 93 (3.6%) |
| 45 to 59 Minutes | 254 (6.9%) | 185 (7.2%) |
| 60 to 89 Minutes | 105 (2.9%) | 92 (3.6%) |
| 90 or more Minutes | 61 (1.7%) | 17 (0.7%) |
Time of Departure to Work by Sex in Moultrie County
The most frequent times of departure to work in Moultrie County are 6:00 AM to 6:29 AM (614, 16.8%) for males and 7:30 AM to 7:59 AM (529, 20.6%) for females.
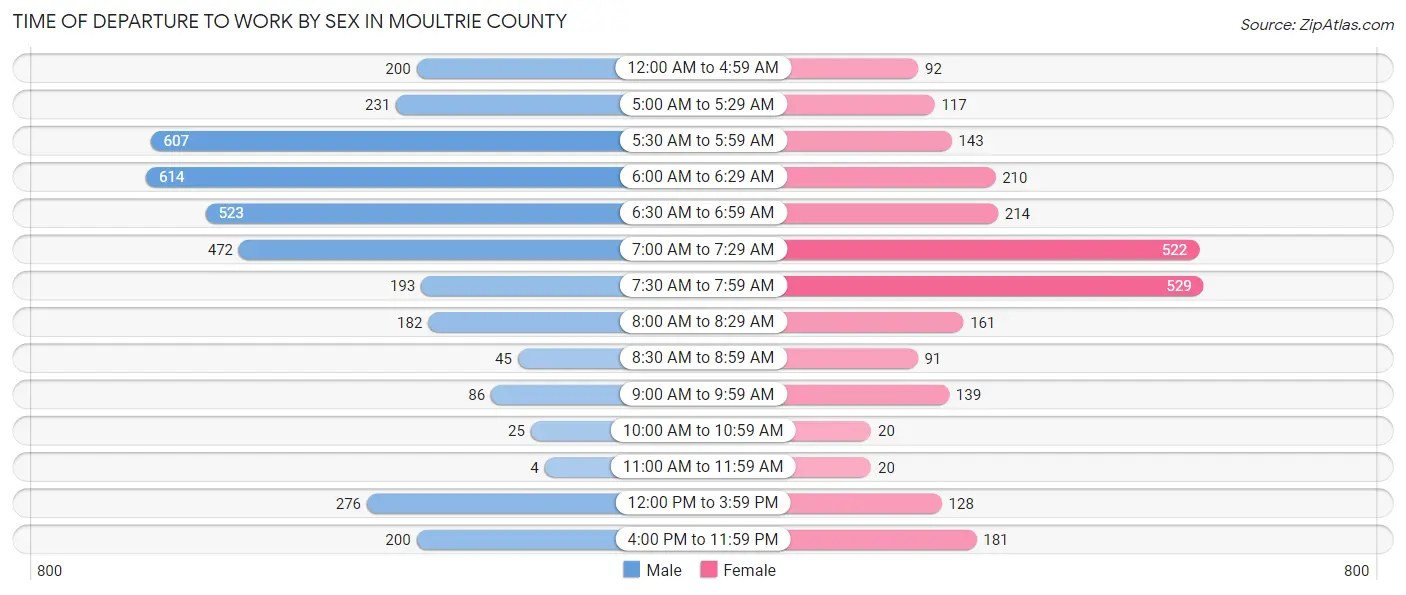
| Time of Departure | Male | Female |
| 12:00 AM to 4:59 AM | 200 (5.5%) | 92 (3.6%) |
| 5:00 AM to 5:29 AM | 231 (6.3%) | 117 (4.6%) |
| 5:30 AM to 5:59 AM | 607 (16.6%) | 143 (5.6%) |
| 6:00 AM to 6:29 AM | 614 (16.8%) | 210 (8.2%) |
| 6:30 AM to 6:59 AM | 523 (14.3%) | 214 (8.3%) |
| 7:00 AM to 7:29 AM | 472 (12.9%) | 522 (20.3%) |
| 7:30 AM to 7:59 AM | 193 (5.3%) | 529 (20.6%) |
| 8:00 AM to 8:29 AM | 182 (5.0%) | 161 (6.3%) |
| 8:30 AM to 8:59 AM | 45 (1.2%) | 91 (3.5%) |
| 9:00 AM to 9:59 AM | 86 (2.4%) | 139 (5.4%) |
| 10:00 AM to 10:59 AM | 25 (0.7%) | 20 (0.8%) |
| 11:00 AM to 11:59 AM | 4 (0.1%) | 20 (0.8%) |
| 12:00 PM to 3:59 PM | 276 (7.5%) | 128 (5.0%) |
| 4:00 PM to 11:59 PM | 200 (5.5%) | 181 (7.0%) |
| Total | 3,658 (100.0%) | 2,567 (100.0%) |
Housing Occupancy in Moultrie County
Occupancy by Ownership in Moultrie County
Of the total 5,824 dwellings in Moultrie County, owner-occupied units account for 4,542 (78.0%), while renter-occupied units make up 1,282 (22.0%).
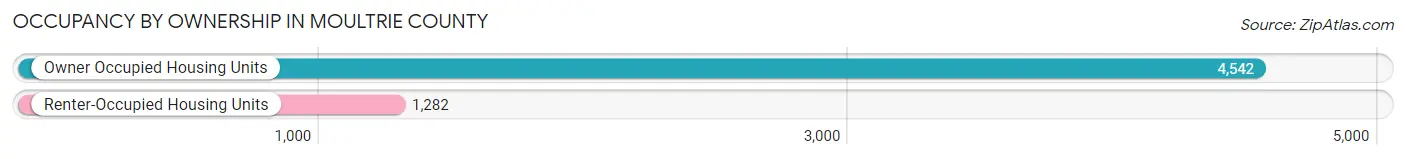
| Occupancy | # Housing Units | % Housing Units |
| Owner Occupied Housing Units | 4,542 | 78.0% |
| Renter-Occupied Housing Units | 1,282 | 22.0% |
| Total Occupied Housing Units | 5,824 | 100.0% |
Occupancy by Household Size in Moultrie County
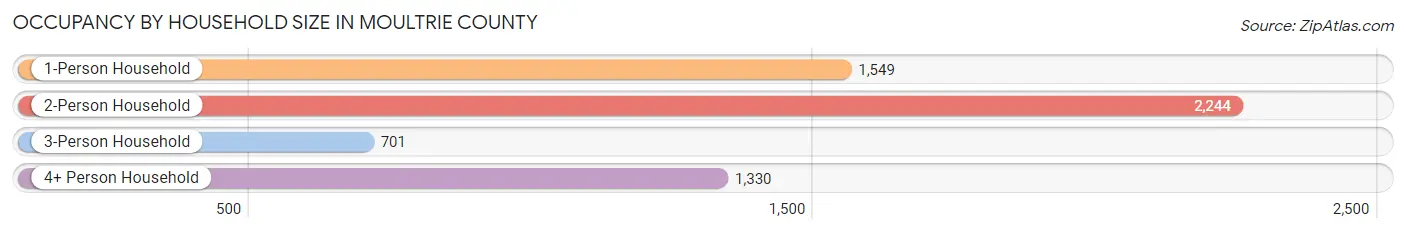
| Household Size | # Housing Units | % Housing Units |
| 1-Person Household | 1,549 | 26.6% |
| 2-Person Household | 2,244 | 38.5% |
| 3-Person Household | 701 | 12.0% |
| 4+ Person Household | 1,330 | 22.8% |
| Total Housing Units | 5,824 | 100.0% |
Occupancy by Ownership by Household Size in Moultrie County
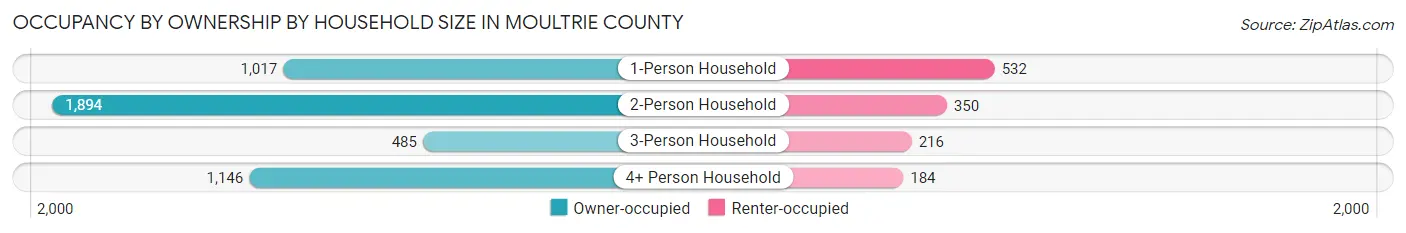
| Household Size | Owner-occupied | Renter-occupied |
| 1-Person Household | 1,017 (65.7%) | 532 (34.3%) |
| 2-Person Household | 1,894 (84.4%) | 350 (15.6%) |
| 3-Person Household | 485 (69.2%) | 216 (30.8%) |
| 4+ Person Household | 1,146 (86.2%) | 184 (13.8%) |
| Total Housing Units | 4,542 (78.0%) | 1,282 (22.0%) |
Occupancy by Educational Attainment in Moultrie County
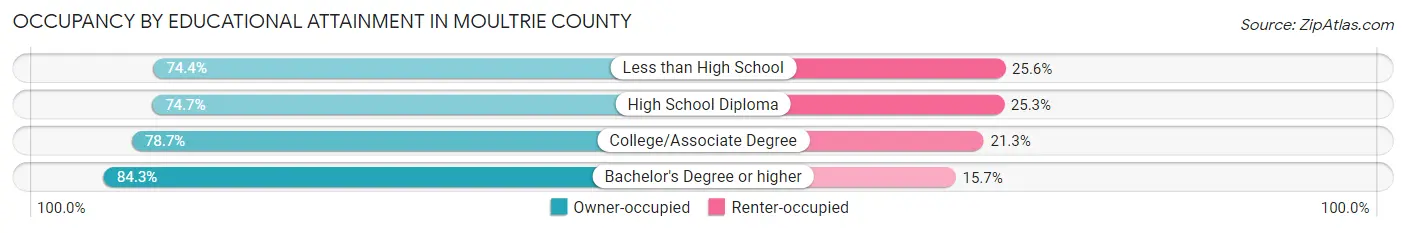
| Household Size | Owner-occupied | Renter-occupied |
| Less than High School | 536 (74.4%) | 184 (25.6%) |
| High School Diploma | 1,440 (74.7%) | 488 (25.3%) |
| College/Associate Degree | 1,564 (78.7%) | 423 (21.3%) |
| Bachelor's Degree or higher | 1,002 (84.3%) | 187 (15.7%) |
Occupancy by Age of Householder in Moultrie County
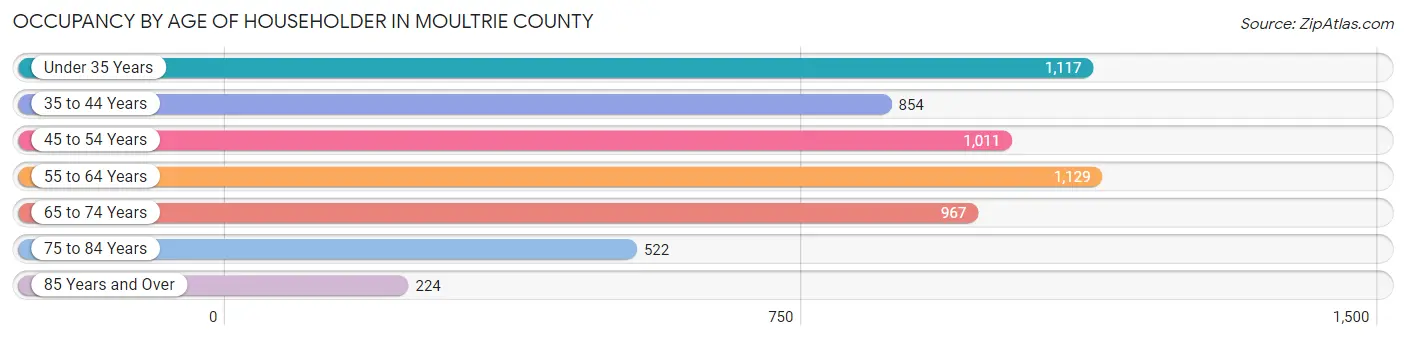
| Age Bracket | # Households | % Households |
| Under 35 Years | 1,117 | 19.2% |
| 35 to 44 Years | 854 | 14.7% |
| 45 to 54 Years | 1,011 | 17.4% |
| 55 to 64 Years | 1,129 | 19.4% |
| 65 to 74 Years | 967 | 16.6% |
| 75 to 84 Years | 522 | 9.0% |
| 85 Years and Over | 224 | 3.8% |
| Total | 5,824 | 100.0% |
Housing Finances in Moultrie County
Median Income by Occupancy in Moultrie County
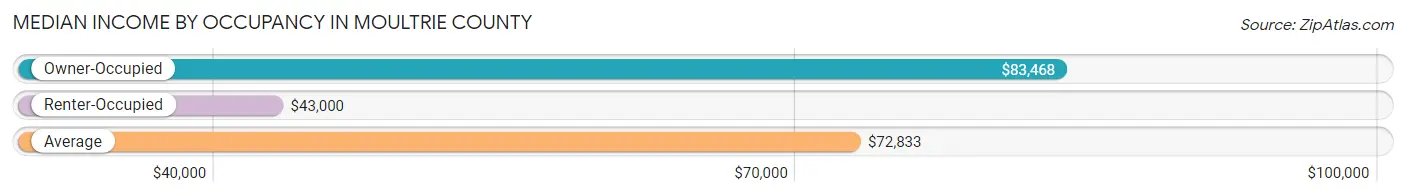
| Occupancy Type | # Households | Median Income |
| Owner-Occupied | 4,542 (78.0%) | $83,468 |
| Renter-Occupied | 1,282 (22.0%) | $43,000 |
| Average | 5,824 (100.0%) | $72,833 |
Occupancy by Householder Income Bracket in Moultrie County
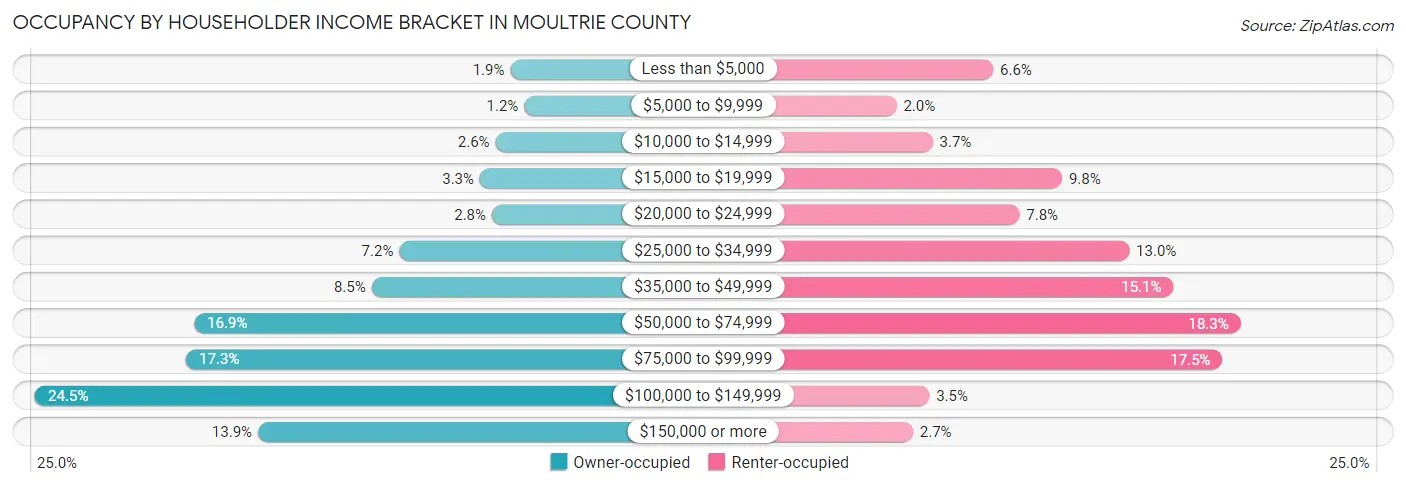
| Income Bracket | Owner-occupied | Renter-occupied |
| Less than $5,000 | 85 (1.9%) | 84 (6.6%) |
| $5,000 to $9,999 | 55 (1.2%) | 25 (1.9%) |
| $10,000 to $14,999 | 117 (2.6%) | 47 (3.7%) |
| $15,000 to $19,999 | 151 (3.3%) | 126 (9.8%) |
| $20,000 to $24,999 | 125 (2.8%) | 100 (7.8%) |
| $25,000 to $34,999 | 325 (7.2%) | 167 (13.0%) |
| $35,000 to $49,999 | 385 (8.5%) | 194 (15.1%) |
| $50,000 to $74,999 | 769 (16.9%) | 235 (18.3%) |
| $75,000 to $99,999 | 786 (17.3%) | 224 (17.5%) |
| $100,000 to $149,999 | 1,113 (24.5%) | 45 (3.5%) |
| $150,000 or more | 631 (13.9%) | 35 (2.7%) |
| Total | 4,542 (100.0%) | 1,282 (100.0%) |
Monthly Housing Cost Tiers in Moultrie County
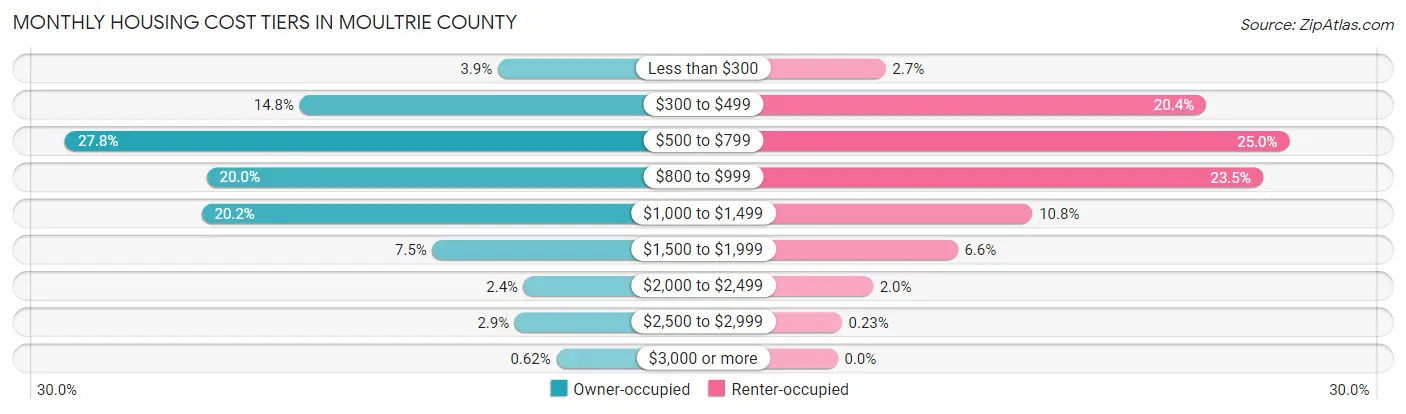
| Monthly Cost | Owner-occupied | Renter-occupied |
| Less than $300 | 175 (3.8%) | 34 (2.6%) |
| $300 to $499 | 672 (14.8%) | 261 (20.4%) |
| $500 to $799 | 1,261 (27.8%) | 320 (25.0%) |
| $800 to $999 | 906 (20.0%) | 301 (23.5%) |
| $1,000 to $1,499 | 919 (20.2%) | 138 (10.8%) |
| $1,500 to $1,999 | 339 (7.5%) | 85 (6.6%) |
| $2,000 to $2,499 | 110 (2.4%) | 25 (1.9%) |
| $2,500 to $2,999 | 132 (2.9%) | 3 (0.2%) |
| $3,000 or more | 28 (0.6%) | 0 (0.0%) |
| Total | 4,542 (100.0%) | 1,282 (100.0%) |
Physical Housing Characteristics in Moultrie County
Housing Structures in Moultrie County
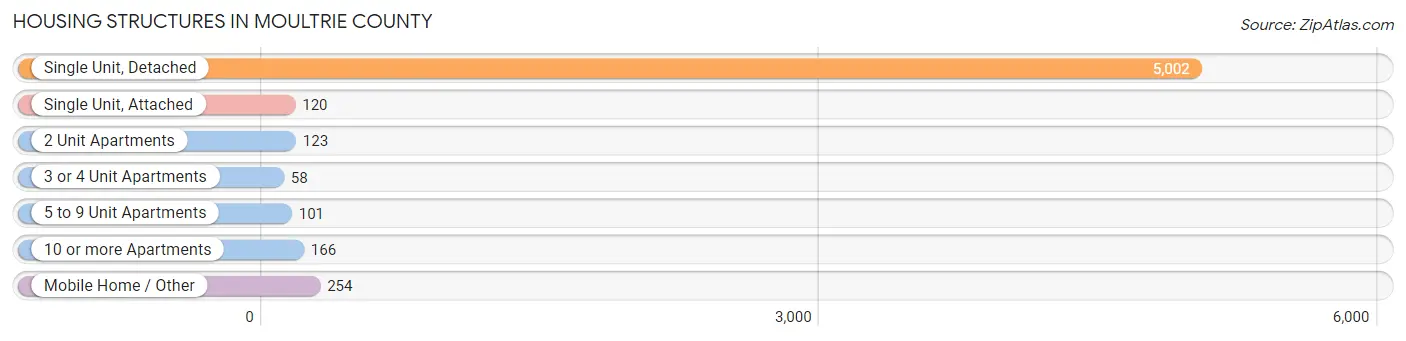
| Structure Type | # Housing Units | % Housing Units |
| Single Unit, Detached | 5,002 | 85.9% |
| Single Unit, Attached | 120 | 2.1% |
| 2 Unit Apartments | 123 | 2.1% |
| 3 or 4 Unit Apartments | 58 | 1.0% |
| 5 to 9 Unit Apartments | 101 | 1.7% |
| 10 or more Apartments | 166 | 2.9% |
| Mobile Home / Other | 254 | 4.4% |
| Total | 5,824 | 100.0% |
Housing Structures by Occupancy in Moultrie County
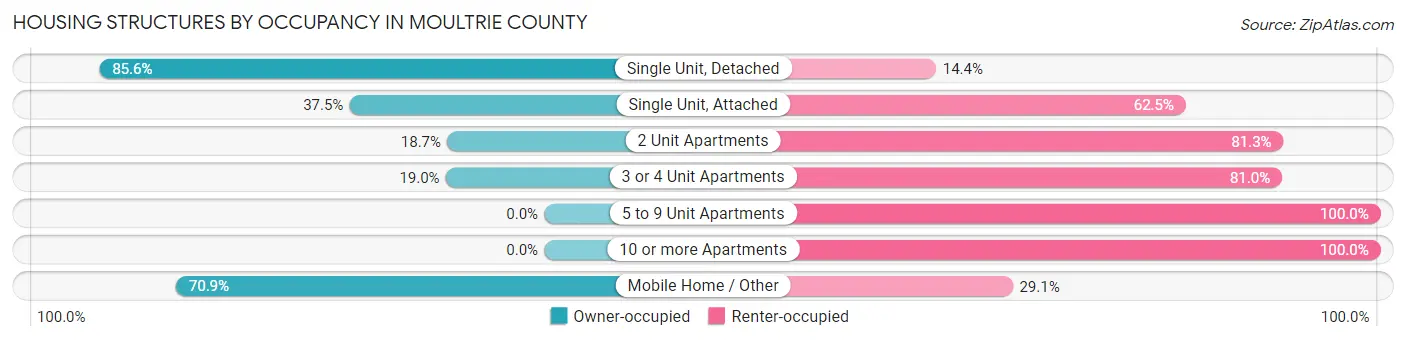
| Structure Type | Owner-occupied | Renter-occupied |
| Single Unit, Detached | 4,283 (85.6%) | 719 (14.4%) |
| Single Unit, Attached | 45 (37.5%) | 75 (62.5%) |
| 2 Unit Apartments | 23 (18.7%) | 100 (81.3%) |
| 3 or 4 Unit Apartments | 11 (19.0%) | 47 (81.0%) |
| 5 to 9 Unit Apartments | 0 (0.0%) | 101 (100.0%) |
| 10 or more Apartments | 0 (0.0%) | 166 (100.0%) |
| Mobile Home / Other | 180 (70.9%) | 74 (29.1%) |
| Total | 4,542 (78.0%) | 1,282 (22.0%) |
Housing Structures by Number of Rooms in Moultrie County
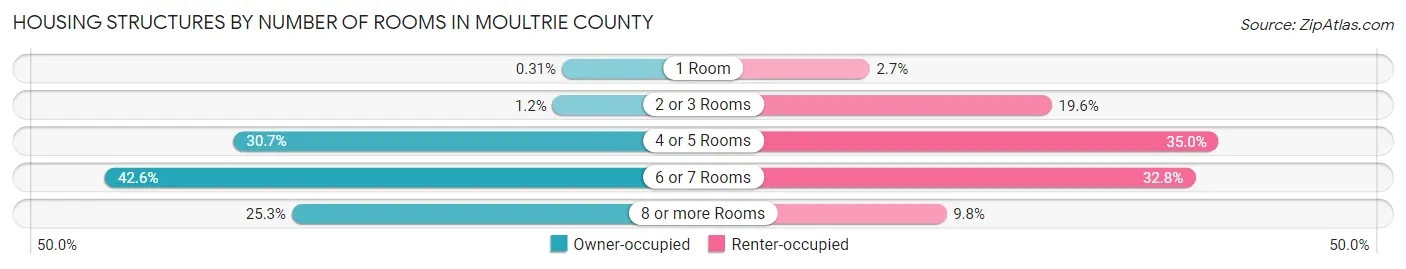
| Number of Rooms | Owner-occupied | Renter-occupied |
| 1 Room | 14 (0.3%) | 35 (2.7%) |
| 2 or 3 Rooms | 53 (1.2%) | 251 (19.6%) |
| 4 or 5 Rooms | 1,394 (30.7%) | 449 (35.0%) |
| 6 or 7 Rooms | 1,933 (42.6%) | 421 (32.8%) |
| 8 or more Rooms | 1,148 (25.3%) | 126 (9.8%) |
| Total | 4,542 (100.0%) | 1,282 (100.0%) |
Housing Structure by Heating Type in Moultrie County

| Heating Type | Owner-occupied | Renter-occupied |
| Utility Gas | 2,513 (55.3%) | 611 (47.7%) |
| Bottled, Tank, or LP Gas | 802 (17.7%) | 140 (10.9%) |
| Electricity | 959 (21.1%) | 471 (36.7%) |
| Fuel Oil or Kerosene | 0 (0.0%) | 21 (1.6%) |
| Coal or Coke | 31 (0.7%) | 0 (0.0%) |
| All other Fuels | 222 (4.9%) | 39 (3.0%) |
| No Fuel Used | 15 (0.3%) | 0 (0.0%) |
| Total | 4,542 (100.0%) | 1,282 (100.0%) |
Household Vehicle Usage in Moultrie County
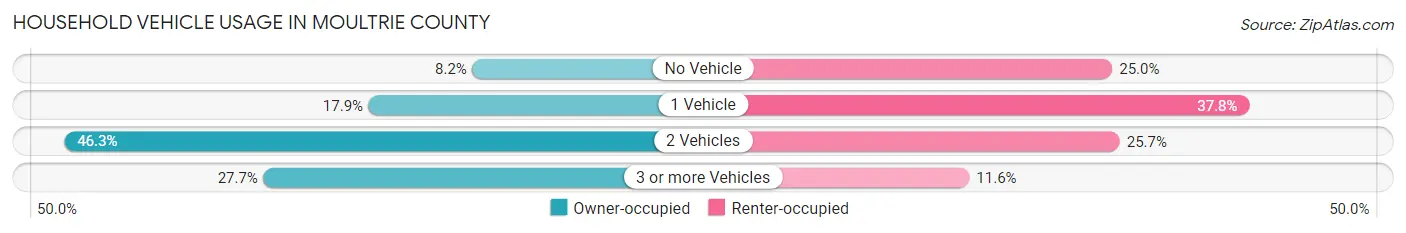
| Vehicles per Household | Owner-occupied | Renter-occupied |
| No Vehicle | 371 (8.2%) | 320 (25.0%) |
| 1 Vehicle | 811 (17.9%) | 484 (37.8%) |
| 2 Vehicles | 2,103 (46.3%) | 329 (25.7%) |
| 3 or more Vehicles | 1,257 (27.7%) | 149 (11.6%) |
| Total | 4,542 (100.0%) | 1,282 (100.0%) |
Real Estate & Mortgages in Moultrie County
Real Estate and Mortgage Overview in Moultrie County
| Characteristic | Without Mortgage | With Mortgage |
| Housing Units | 2,304 | 2,238 |
| Median Property Value | $120,900 | $113,100 |
| Median Household Income | $80,000 | $343 |
| Monthly Housing Costs | $593 | $28 |
| Real Estate Taxes | $2,293 | $85 |
Property Value by Mortgage Status in Moultrie County
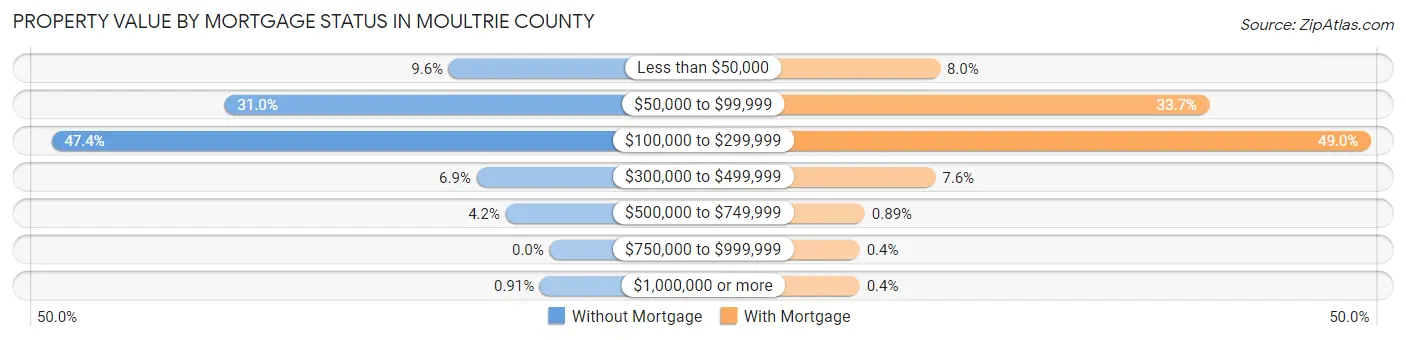
| Property Value | Without Mortgage | With Mortgage |
| Less than $50,000 | 221 (9.6%) | 180 (8.0%) |
| $50,000 to $99,999 | 713 (30.9%) | 753 (33.7%) |
| $100,000 to $299,999 | 1,093 (47.4%) | 1,097 (49.0%) |
| $300,000 to $499,999 | 160 (6.9%) | 170 (7.6%) |
| $500,000 to $749,999 | 96 (4.2%) | 20 (0.9%) |
| $750,000 to $999,999 | 0 (0.0%) | 9 (0.4%) |
| $1,000,000 or more | 21 (0.9%) | 9 (0.4%) |
| Total | 2,304 (100.0%) | 2,238 (100.0%) |
Household Income by Mortgage Status in Moultrie County
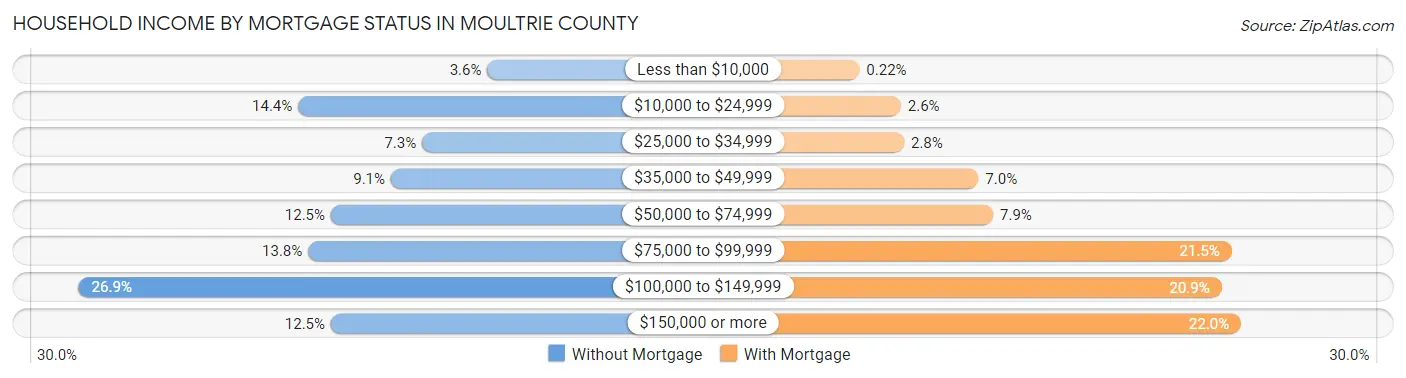
| Household Income | Without Mortgage | With Mortgage |
| Less than $10,000 | 82 (3.6%) | 5 (0.2%) |
| $10,000 to $24,999 | 331 (14.4%) | 58 (2.6%) |
| $25,000 to $34,999 | 168 (7.3%) | 62 (2.8%) |
| $35,000 to $49,999 | 209 (9.1%) | 157 (7.0%) |
| $50,000 to $74,999 | 288 (12.5%) | 176 (7.9%) |
| $75,000 to $99,999 | 318 (13.8%) | 481 (21.5%) |
| $100,000 to $149,999 | 620 (26.9%) | 468 (20.9%) |
| $150,000 or more | 288 (12.5%) | 493 (22.0%) |
| Total | 2,304 (100.0%) | 2,238 (100.0%) |
Property Value to Household Income Ratio in Moultrie County
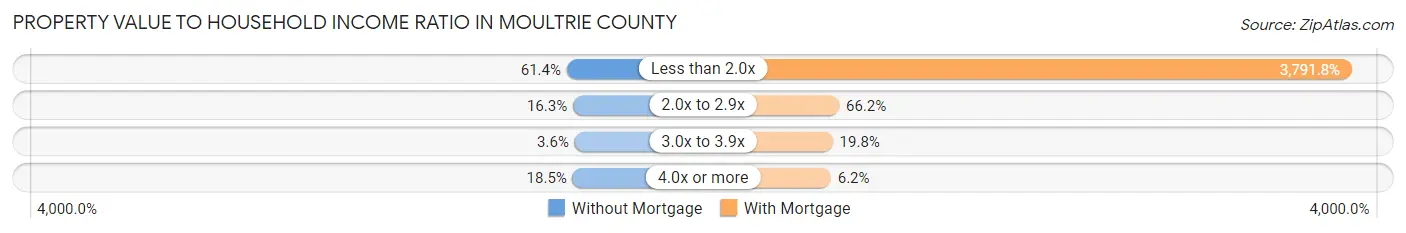
| Value-to-Income Ratio | Without Mortgage | With Mortgage |
| Less than 2.0x | 1,415 (61.4%) | 84,861 (3,791.8%) |
| 2.0x to 2.9x | 375 (16.3%) | 1,481 (66.2%) |
| 3.0x to 3.9x | 82 (3.6%) | 444 (19.8%) |
| 4.0x or more | 425 (18.4%) | 139 (6.2%) |
| Total | 2,304 (100.0%) | 2,238 (100.0%) |
Real Estate Taxes by Mortgage Status in Moultrie County
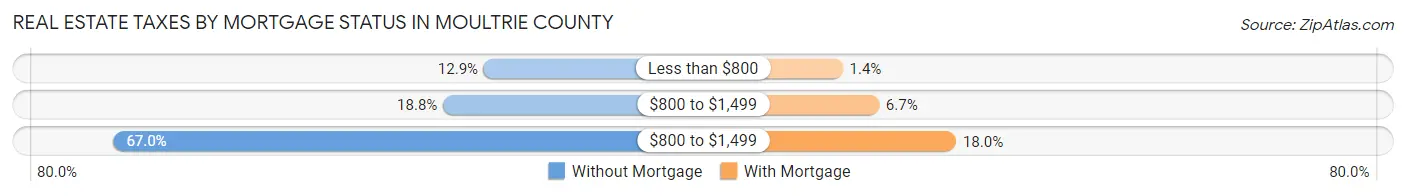
| Property Taxes | Without Mortgage | With Mortgage |
| Less than $800 | 297 (12.9%) | 31 (1.4%) |
| $800 to $1,499 | 434 (18.8%) | 150 (6.7%) |
| $800 to $1,499 | 1,544 (67.0%) | 402 (18.0%) |
| Total | 2,304 (100.0%) | 2,238 (100.0%) |
Health & Disability in Moultrie County
Health Insurance Coverage by Age in Moultrie County
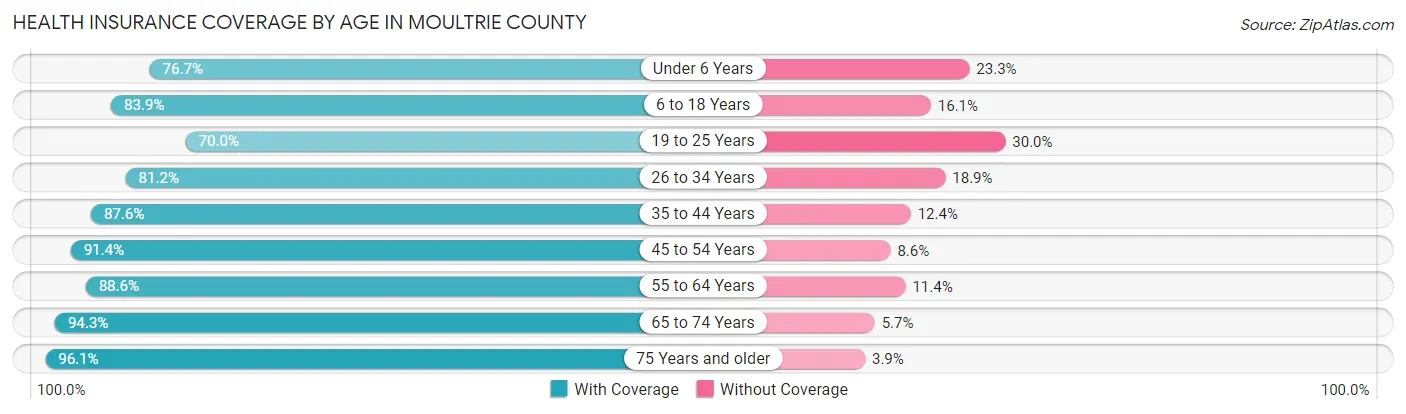
| Age Bracket | With Coverage | Without Coverage |
| Under 6 Years | 779 (76.7%) | 237 (23.3%) |
| 6 to 18 Years | 2,353 (83.9%) | 453 (16.1%) |
| 19 to 25 Years | 715 (70.0%) | 307 (30.0%) |
| 26 to 34 Years | 1,240 (81.1%) | 288 (18.9%) |
| 35 to 44 Years | 1,499 (87.6%) | 212 (12.4%) |
| 45 to 54 Years | 1,539 (91.4%) | 145 (8.6%) |
| 55 to 64 Years | 1,693 (88.6%) | 218 (11.4%) |
| 65 to 74 Years | 1,398 (94.3%) | 84 (5.7%) |
| 75 Years and older | 1,044 (96.1%) | 42 (3.9%) |
| Total | 12,260 (86.1%) | 1,986 (13.9%) |
Health Insurance Coverage by Citizenship Status in Moultrie County
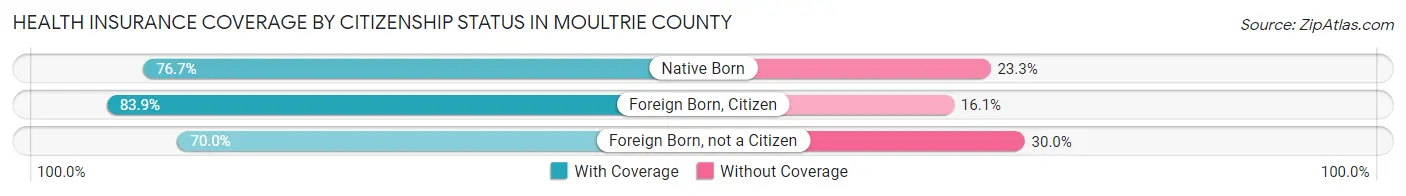
| Citizenship Status | With Coverage | Without Coverage |
| Native Born | 779 (76.7%) | 237 (23.3%) |
| Foreign Born, Citizen | 2,353 (83.9%) | 453 (16.1%) |
| Foreign Born, not a Citizen | 715 (70.0%) | 307 (30.0%) |
Health Insurance Coverage by Household Income in Moultrie County
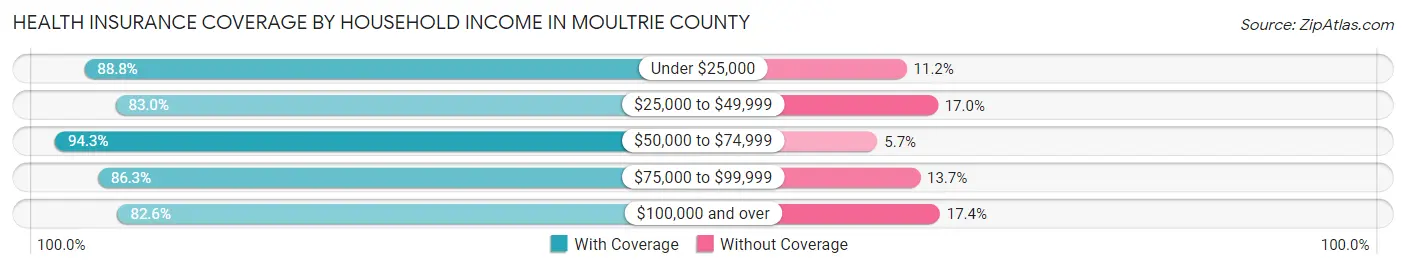
| Household Income | With Coverage | Without Coverage |
| Under $25,000 | 1,347 (88.8%) | 170 (11.2%) |
| $25,000 to $49,999 | 1,529 (83.0%) | 314 (17.0%) |
| $50,000 to $74,999 | 2,224 (94.3%) | 135 (5.7%) |
| $75,000 to $99,999 | 2,333 (86.3%) | 371 (13.7%) |
| $100,000 and over | 4,721 (82.6%) | 996 (17.4%) |
Public vs Private Health Insurance Coverage by Age in Moultrie County
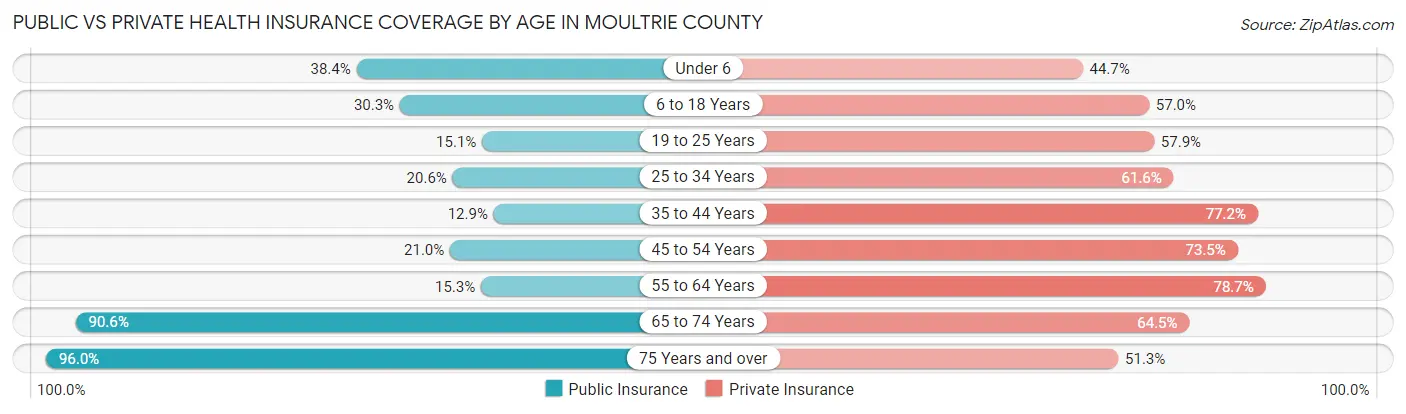
| Age Bracket | Public Insurance | Private Insurance |
| Under 6 | 390 (38.4%) | 454 (44.7%) |
| 6 to 18 Years | 851 (30.3%) | 1,599 (57.0%) |
| 19 to 25 Years | 154 (15.1%) | 592 (57.9%) |
| 25 to 34 Years | 314 (20.5%) | 941 (61.6%) |
| 35 to 44 Years | 221 (12.9%) | 1,321 (77.2%) |
| 45 to 54 Years | 354 (21.0%) | 1,237 (73.5%) |
| 55 to 64 Years | 292 (15.3%) | 1,503 (78.6%) |
| 65 to 74 Years | 1,342 (90.5%) | 956 (64.5%) |
| 75 Years and over | 1,043 (96.0%) | 557 (51.3%) |
| Total | 4,961 (34.8%) | 9,160 (64.3%) |
Disability Status by Sex by Age in Moultrie County
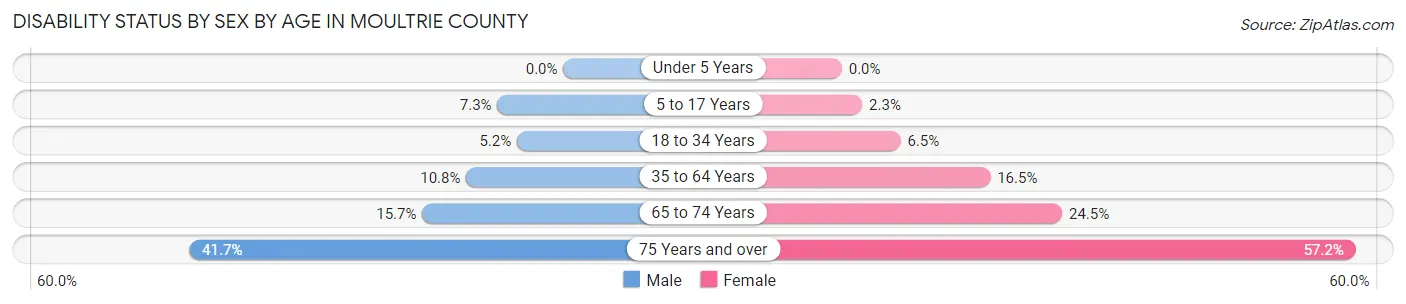
| Age Bracket | Male | Female |
| Under 5 Years | 0 (0.0%) | 0 (0.0%) |
| 5 to 17 Years | 106 (7.3%) | 31 (2.3%) |
| 18 to 34 Years | 72 (5.2%) | 85 (6.5%) |
| 35 to 64 Years | 278 (10.8%) | 452 (16.5%) |
| 65 to 74 Years | 115 (15.7%) | 184 (24.5%) |
| 75 Years and over | 170 (41.7%) | 388 (57.2%) |
Disability Class by Sex by Age in Moultrie County
Disability Class: Hearing Difficulty
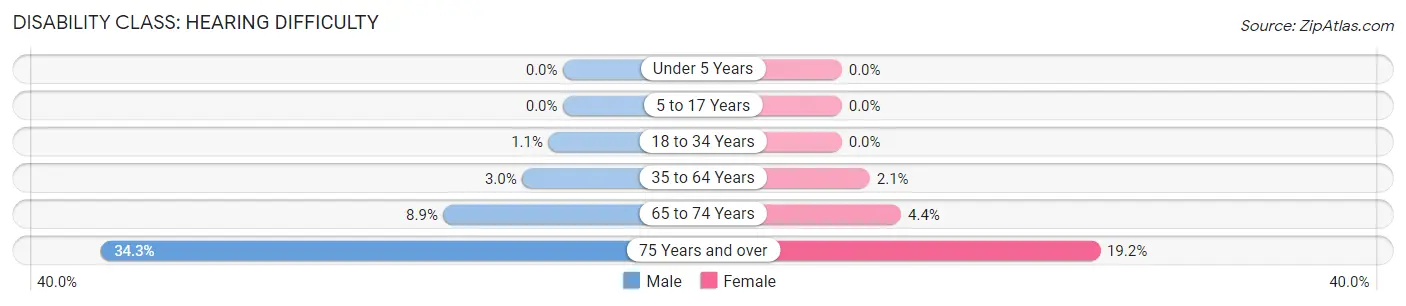
| Age Bracket | Male | Female |
| Under 5 Years | 0 (0.0%) | 0 (0.0%) |
| 5 to 17 Years | 0 (0.0%) | 0 (0.0%) |
| 18 to 34 Years | 15 (1.1%) | 0 (0.0%) |
| 35 to 64 Years | 78 (3.0%) | 57 (2.1%) |
| 65 to 74 Years | 65 (8.9%) | 33 (4.4%) |
| 75 Years and over | 140 (34.3%) | 130 (19.2%) |
Disability Class: Vision Difficulty
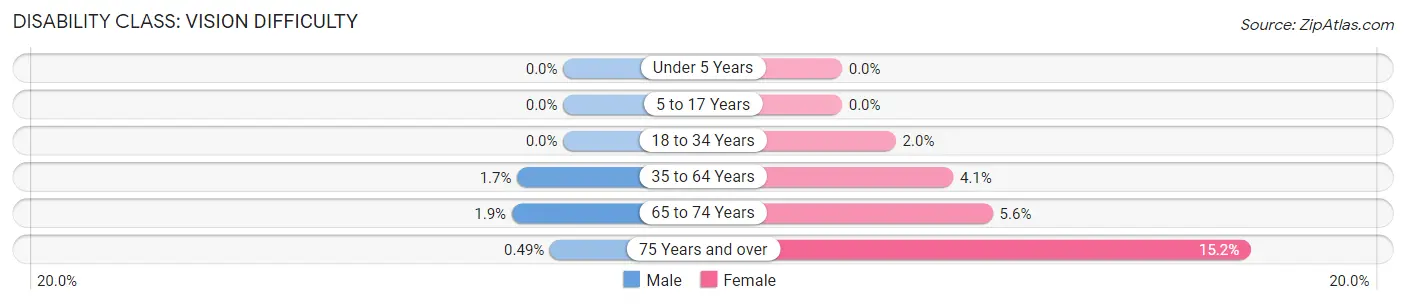
| Age Bracket | Male | Female |
| Under 5 Years | 0 (0.0%) | 0 (0.0%) |
| 5 to 17 Years | 0 (0.0%) | 0 (0.0%) |
| 18 to 34 Years | 0 (0.0%) | 26 (2.0%) |
| 35 to 64 Years | 44 (1.7%) | 113 (4.1%) |
| 65 to 74 Years | 14 (1.9%) | 42 (5.6%) |
| 75 Years and over | 2 (0.5%) | 103 (15.2%) |
Disability Class: Cognitive Difficulty
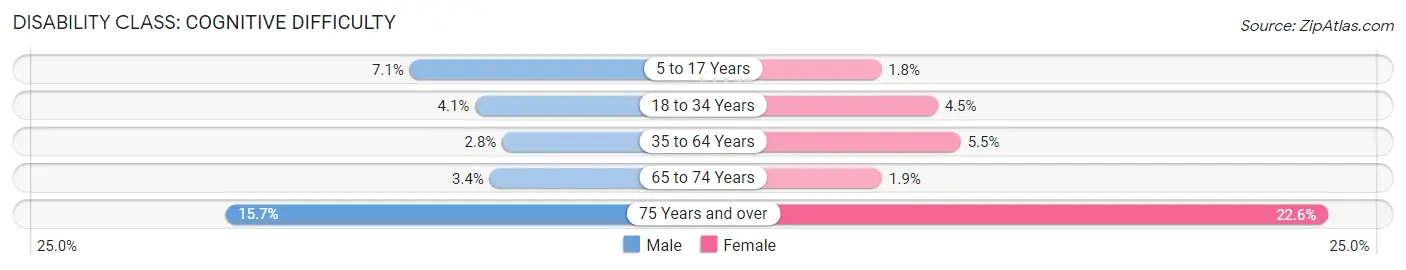
| Age Bracket | Male | Female |
| 5 to 17 Years | 103 (7.1%) | 25 (1.8%) |
| 18 to 34 Years | 57 (4.1%) | 58 (4.4%) |
| 35 to 64 Years | 73 (2.8%) | 151 (5.5%) |
| 65 to 74 Years | 25 (3.4%) | 14 (1.9%) |
| 75 Years and over | 64 (15.7%) | 153 (22.6%) |
Disability Class: Ambulatory Difficulty
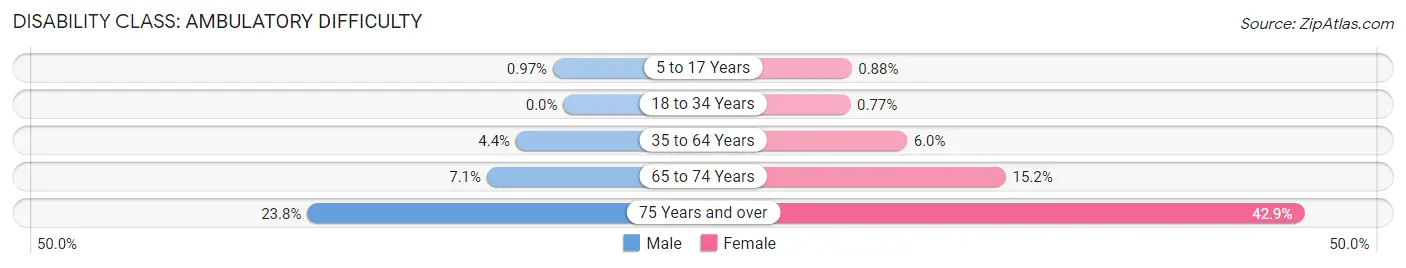
| Age Bracket | Male | Female |
| 5 to 17 Years | 14 (1.0%) | 12 (0.9%) |
| 18 to 34 Years | 0 (0.0%) | 10 (0.8%) |
| 35 to 64 Years | 113 (4.4%) | 165 (6.0%) |
| 65 to 74 Years | 52 (7.1%) | 114 (15.2%) |
| 75 Years and over | 97 (23.8%) | 291 (42.9%) |
Disability Class: Self-Care Difficulty
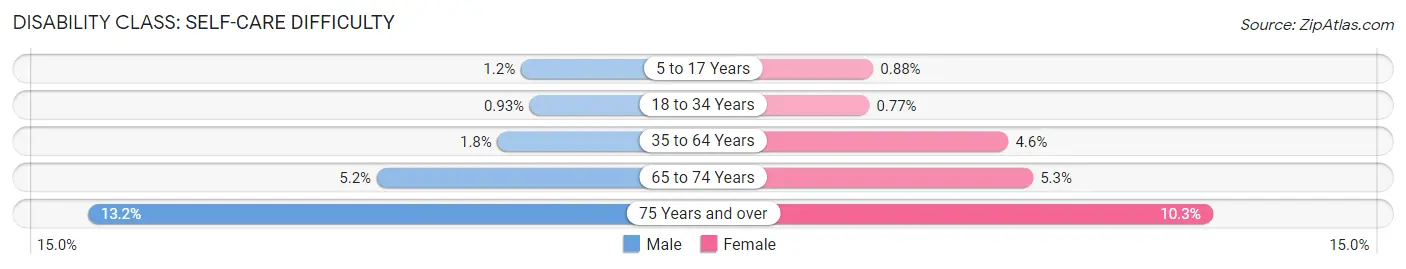
| Age Bracket | Male | Female |
| 5 to 17 Years | 17 (1.2%) | 12 (0.9%) |
| 18 to 34 Years | 13 (0.9%) | 10 (0.8%) |
| 35 to 64 Years | 47 (1.8%) | 127 (4.6%) |
| 65 to 74 Years | 38 (5.2%) | 40 (5.3%) |
| 75 Years and over | 54 (13.2%) | 70 (10.3%) |
Technology Access in Moultrie County
Computing Device Access in Moultrie County
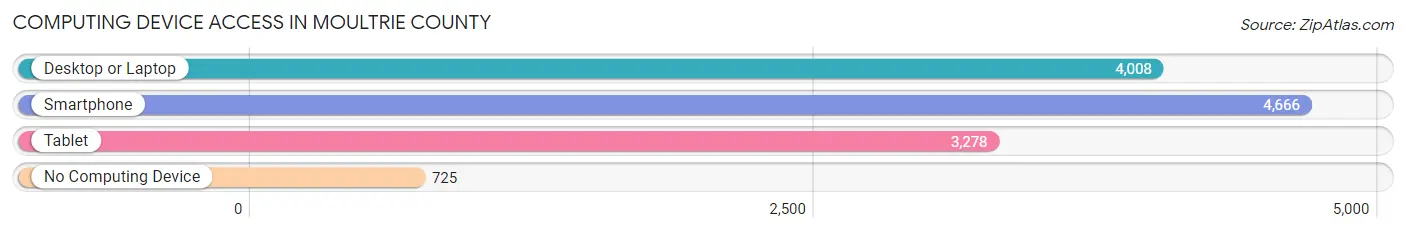
| Device Type | # Households | % Households |
| Desktop or Laptop | 4,008 | 68.8% |
| Smartphone | 4,666 | 80.1% |
| Tablet | 3,278 | 56.3% |
| No Computing Device | 725 | 12.4% |
| Total | 5,824 | 100.0% |
Internet Access in Moultrie County
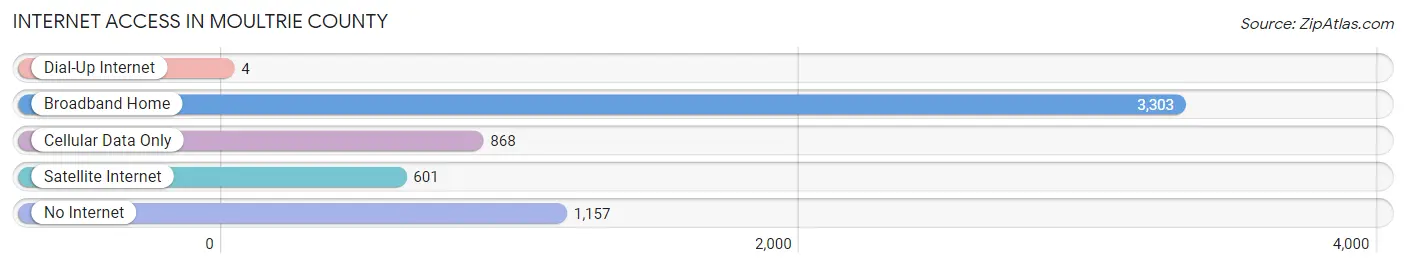
| Internet Type | # Households | % Households |
| Dial-Up Internet | 4 | 0.1% |
| Broadband Home | 3,303 | 56.7% |
| Cellular Data Only | 868 | 14.9% |
| Satellite Internet | 601 | 10.3% |
| No Internet | 1,157 | 19.9% |
| Total | 5,824 | 100.0% |
Moultrie County Summary
Moultrie County is located in the central part of Illinois, in the east-central region of the United States. It is bordered by Shelby County to the north, Macon County to the east, Shelby County to the south, and Macon County to the west. The county seat is Sullivan, and the largest city is Sullivan. The county has a total area of 517 square miles, of which 514 square miles is land and 3 square miles is water.
History
Moultrie County was established in 1843 and named after General William Moultrie, a Revolutionary War hero. The county was originally part of Shelby County, and was created from parts of Shelby, Macon, and Coles counties. The first settlers arrived in the area in the early 1830s, and the county was officially organized in 1843.
The county was largely agricultural in its early years, with corn, wheat, and oats being the main crops. The county also had a thriving livestock industry, with cattle, hogs, and sheep being raised. The county was also home to several coal mines, which provided employment for many of the county's residents.
Geography
Moultrie County is located in the east-central region of Illinois, in the central part of the state. It is bordered by Shelby County to the north, Macon County to the east, Shelby County to the south, and Macon County to the west. The county has a total area of 517 square miles, of which 514 square miles is land and 3 square miles is water.
The county is mostly flat, with some rolling hills in the northern and western parts of the county. The Kaskaskia River runs through the county, and there are several small lakes and ponds scattered throughout the county. The county is also home to several state parks, including Lake Shelbyville, Lincoln Trail State Park, and Moultrie County State Park.
Economy
Moultrie County has a diverse economy, with agriculture, manufacturing, and tourism being the main industries. The county is home to several large agricultural operations, including corn, soybeans, wheat, and oats. The county also has a thriving livestock industry, with cattle, hogs, and sheep being raised.
Manufacturing is also an important part of the county's economy, with several large factories located in the county. The county is home to several large food processing plants, as well as a number of smaller factories that produce a variety of products.
Tourism is also an important part of the county's economy, with several state parks located in the county. The county is also home to several golf courses, as well as a number of historic sites.
Demographics
As of the 2010 census, Moultrie County had a population of 14,846. The racial makeup of the county was 95.3% White, 0.7% African American, 0.3% Native American, 0.3% Asian, 0.1% Pacific Islander, 1.7% from other races, and 1.5% from two or more races. Hispanic or Latino of any race were 4.2% of the population.
The median income for a household in the county was $45,945, and the median income for a family was $54,945. The per capita income for the county was $21,945. About 11.2% of families and 14.2% of the population were below the poverty line, including 19.2% of those under age 18 and 8.2% of those age 65 or over.
Common Questions
What is the Total Population of Moultrie County?
Total Population of Moultrie County is 14,531.
What is the Total Male Population of Moultrie County?
Total Male Population of Moultrie County is 7,171.
What is the Total Female Population of Moultrie County?
Total Female Population of Moultrie County is 7,360.
What is the Ratio of Males per 100 Females in Moultrie County?
There are 97.43 Males per 100 Females in Moultrie County.
What is the Ratio of Females per 100 Males in Moultrie County?
There are 102.64 Females per 100 Males in Moultrie County.
What is the Median Population Age in Moultrie County?
Median Population Age in Moultrie County is 40.5 Years.
What is the Average Family Size in Moultrie County
Average Family Size in Moultrie County is 3.0 People.
What is the Average Household Size in Moultrie County
Average Household Size in Moultrie County is 2.4 People.
What is Per Capita Income in Moultrie County?
Per Capita income in Moultrie County is $34,849.
What is the Median Family Income in Moultrie County?
Median Family Income in Moultrie County is $89,934.
What is the Median Household income in Moultrie County?
Median Household Income in Moultrie County is $72,833.
What is Income or Wage Gap in Moultrie County?
Income or Wage Gap in Moultrie County is 41.8%.
Women in Moultrie County earn 58.2 cents for every dollar earned by a man.
What is Inequality or Gini Index in Moultrie County?
Inequality or Gini Index in Moultrie County is 0.42.
How Large is the Labor Force in Moultrie County?
There are 6,922 People in the Labor Forcein in Moultrie County.
What is the Percentage of People in the Labor Force in Moultrie County?
60.8% of People are in the Labor Force in Moultrie County.
What is the Unemployment Rate in Moultrie County?
Unemployment Rate in Moultrie County is 4.1%.