Menard County, IL
Menard County Map
Menard County Overview
12,284
TOTAL POPULATION
6,051
MALE POPULATION
6,233
FEMALE POPULATION
97.08
MALES / 100 FEMALES
103.01
FEMALES / 100 MALES
42.8
MEDIAN AGE
2.8
AVG FAMILY SIZE
2.4
AVG HOUSEHOLD SIZE
$41,497
PER CAPITA INCOME
$97,125
AVG FAMILY INCOME
$84,846
AVG HOUSEHOLD INCOME
23.3%
WAGE / INCOME GAP [ % ]
76.7¢/ $1
WAGE / INCOME GAP [ $ ]
0.40
INEQUALITY / GINI INDEX
6,214
LABOR FORCE [ PEOPLE ]
63.1%
PERCENT IN LABOR FORCE
4.9%
UNEMPLOYMENT RATE
Menard County Area Codes
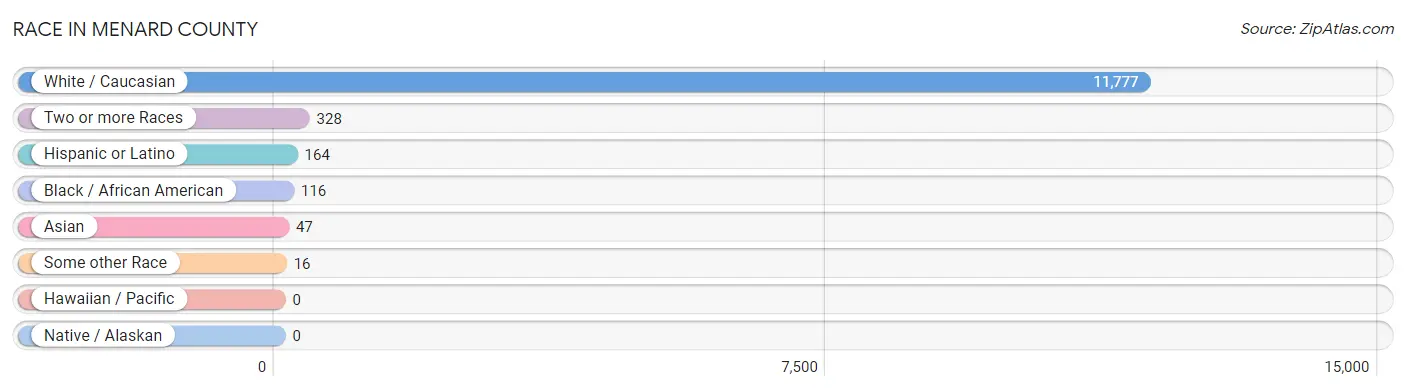
Race in Menard County
The most populous races in Menard County are White / Caucasian (11,777 | 95.9%), Two or more Races (328 | 2.7%), and Hispanic or Latino (164 | 1.3%).
| Race | # Population | % Population |
| Asian | 47 | 0.4% |
| Black / African American | 116 | 0.9% |
| Hawaiian / Pacific | 0 | 0.0% |
| Hispanic or Latino | 164 | 1.3% |
| Native / Alaskan | 0 | 0.0% |
| White / Caucasian | 11,777 | 95.9% |
| Two or more Races | 328 | 2.7% |
| Some other Race | 16 | 0.1% |
| Total | 12,284 | 100.0% |
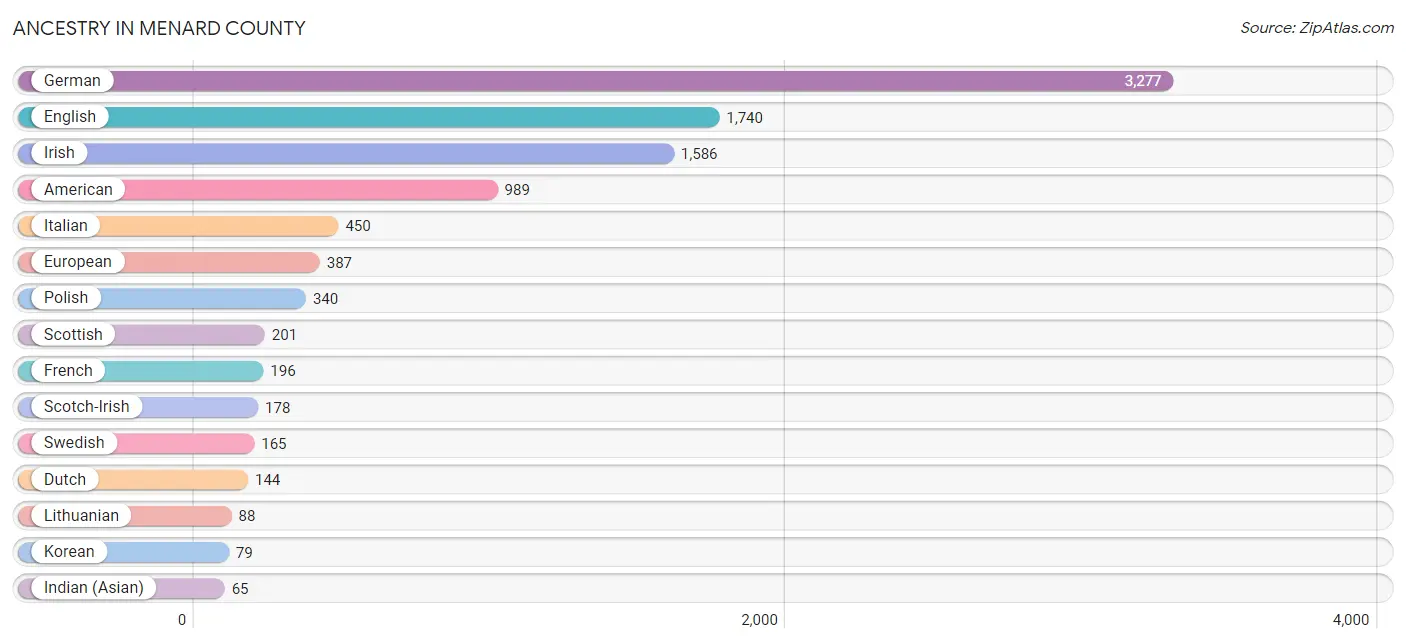
Ancestry in Menard County
The most populous ancestries reported in Menard County are German (3,277 | 26.7%), English (1,740 | 14.2%), Irish (1,586 | 12.9%), American (989 | 8.1%), and Italian (450 | 3.7%), together accounting for 65.5% of all Menard County residents.
| Ancestry | # Population | % Population |
| Alsatian | 3 | 0.0% |
| American | 989 | 8.1% |
| Apache | 31 | 0.3% |
| Austrian | 16 | 0.1% |
| Bahamian | 3 | 0.0% |
| Bhutanese | 10 | 0.1% |
| Brazilian | 28 | 0.2% |
| British | 29 | 0.2% |
| Bulgarian | 7 | 0.1% |
| Cajun | 4 | 0.0% |
| Canadian | 8 | 0.1% |
| Cherokee | 13 | 0.1% |
| Colombian | 23 | 0.2% |
| Croatian | 10 | 0.1% |
| Cuban | 23 | 0.2% |
| Czech | 23 | 0.2% |
| Czechoslovakian | 10 | 0.1% |
| Danish | 33 | 0.3% |
| Dutch | 144 | 1.2% |
| Eastern European | 13 | 0.1% |
| English | 1,740 | 14.2% |
| European | 387 | 3.2% |
| French | 196 | 1.6% |
| French Canadian | 15 | 0.1% |
| German | 3,277 | 26.7% |
| Greek | 5 | 0.0% |
| Houma | 3 | 0.0% |
| Hungarian | 19 | 0.2% |
| Indian (Asian) | 65 | 0.5% |
| Inupiat | 26 | 0.2% |
| Irish | 1,586 | 12.9% |
| Italian | 450 | 3.7% |
| Korean | 79 | 0.6% |
| Lithuanian | 88 | 0.7% |
| Mexican | 47 | 0.4% |
| Northern European | 12 | 0.1% |
| Norwegian | 60 | 0.5% |
| Polish | 340 | 2.8% |
| Portuguese | 4 | 0.0% |
| Puerto Rican | 24 | 0.2% |
| Romanian | 3 | 0.0% |
| Russian | 34 | 0.3% |
| Scandinavian | 34 | 0.3% |
| Scotch-Irish | 178 | 1.5% |
| Scottish | 201 | 1.6% |
| Slovak | 13 | 0.1% |
| South American | 23 | 0.2% |
| Swedish | 165 | 1.3% |
| Swiss | 54 | 0.4% |
| Ukrainian | 47 | 0.4% |
| Welsh | 20 | 0.2% | View All 51 Rows |
Immigrants in Menard County
The most numerous immigrant groups reported in Menard County came from Latin America (74 | 0.6%), South America (51 | 0.4%), Brazil (28 | 0.2%), Asia (27 | 0.2%), and Europe (26 | 0.2%), together accounting for 1.7% of all Menard County residents.

| Immigration Origin | # Population | % Population |
| Asia | 27 | 0.2% |
| Brazil | 28 | 0.2% |
| Bulgaria | 7 | 0.1% |
| Caribbean | 23 | 0.2% |
| China | 11 | 0.1% |
| Colombia | 23 | 0.2% |
| Cuba | 23 | 0.2% |
| Eastern Asia | 11 | 0.1% |
| Eastern Europe | 14 | 0.1% |
| Europe | 26 | 0.2% |
| France | 12 | 0.1% |
| Latin America | 74 | 0.6% |
| Philippines | 16 | 0.1% |
| Poland | 4 | 0.0% |
| Romania | 3 | 0.0% |
| South America | 51 | 0.4% |
| South Eastern Asia | 16 | 0.1% |
| Western Europe | 12 | 0.1% | View All 18 Rows |
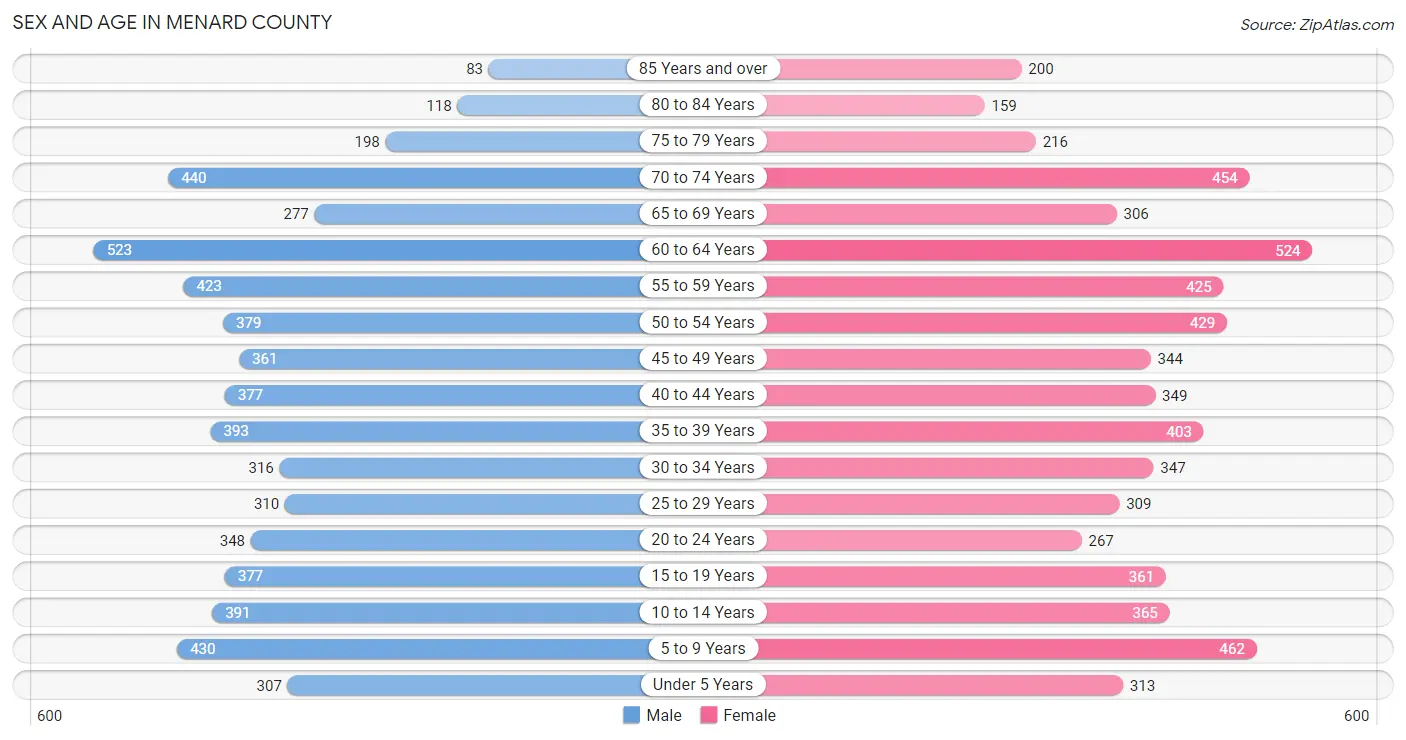
Sex and Age in Menard County
Sex and Age in Menard County
The most populous age groups in Menard County are 60 to 64 Years (523 | 8.6%) for men and 60 to 64 Years (524 | 8.4%) for women.
| Age Bracket | Male | Female |
| Under 5 Years | 307 (5.1%) | 313 (5.0%) |
| 5 to 9 Years | 430 (7.1%) | 462 (7.4%) |
| 10 to 14 Years | 391 (6.5%) | 365 (5.9%) |
| 15 to 19 Years | 377 (6.2%) | 361 (5.8%) |
| 20 to 24 Years | 348 (5.8%) | 267 (4.3%) |
| 25 to 29 Years | 310 (5.1%) | 309 (5.0%) |
| 30 to 34 Years | 316 (5.2%) | 347 (5.6%) |
| 35 to 39 Years | 393 (6.5%) | 403 (6.5%) |
| 40 to 44 Years | 377 (6.2%) | 349 (5.6%) |
| 45 to 49 Years | 361 (6.0%) | 344 (5.5%) |
| 50 to 54 Years | 379 (6.3%) | 429 (6.9%) |
| 55 to 59 Years | 423 (7.0%) | 425 (6.8%) |
| 60 to 64 Years | 523 (8.6%) | 524 (8.4%) |
| 65 to 69 Years | 277 (4.6%) | 306 (4.9%) |
| 70 to 74 Years | 440 (7.3%) | 454 (7.3%) |
| 75 to 79 Years | 198 (3.3%) | 216 (3.5%) |
| 80 to 84 Years | 118 (1.9%) | 159 (2.5%) |
| 85 Years and over | 83 (1.4%) | 200 (3.2%) |
| Total | 6,051 (100.0%) | 6,233 (100.0%) |
Families and Households in Menard County
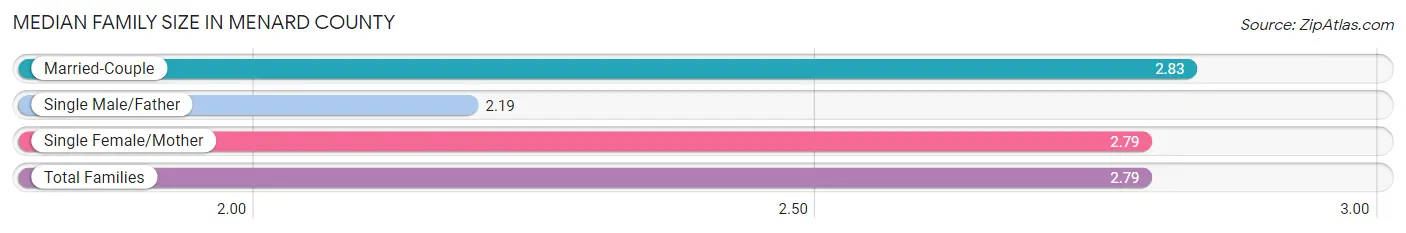
Median Family Size in Menard County
The median family size in Menard County is 2.79 persons per family, with married-couple families (2,898 | 77.9%) accounting for the largest median family size of 2.83 persons per family. On the other hand, single male/father families (191 | 5.1%) represent the smallest median family size with 2.19 persons per family.
| Family Type | # Families | Family Size |
| Married-Couple | 2,898 (77.9%) | 2.83 |
| Single Male/Father | 191 (5.1%) | 2.19 |
| Single Female/Mother | 631 (17.0%) | 2.79 |
| Total Families | 3,720 (100.0%) | 2.79 |
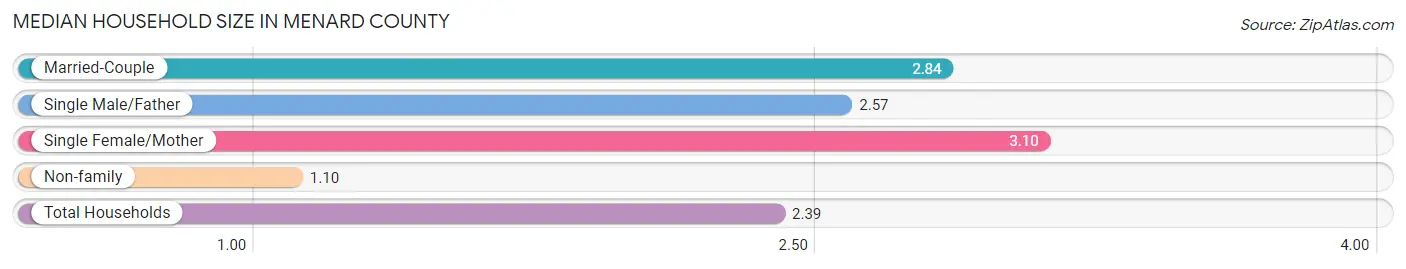
Median Household Size in Menard County
The median household size in Menard County is 2.39 persons per household, with single female/mother households (631 | 12.4%) accounting for the largest median household size of 3.1 persons per household. non-family households (1,365 | 26.8%) represent the smallest median household size with 1.10 persons per household.
| Household Type | # Households | Household Size |
| Married-Couple | 2,898 (57.0%) | 2.84 |
| Single Male/Father | 191 (3.8%) | 2.57 |
| Single Female/Mother | 631 (12.4%) | 3.10 |
| Non-family | 1,365 (26.8%) | 1.10 |
| Total Households | 5,085 (100.0%) | 2.39 |
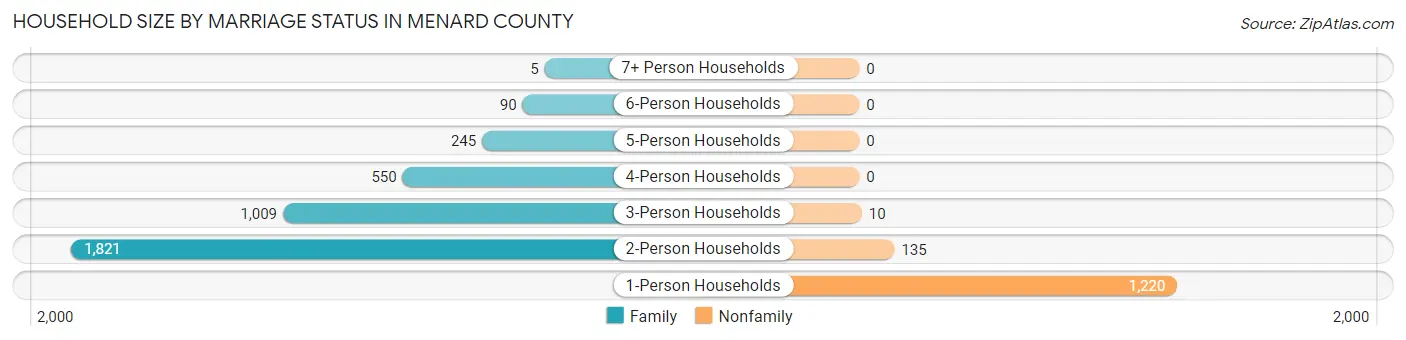
Household Size by Marriage Status in Menard County
Out of a total of 5,085 households in Menard County, 3,720 (73.2%) are family households, while 1,365 (26.8%) are nonfamily households. The most numerous type of family households are 2-person households, comprising 1,821, and the most common type of nonfamily households are 1-person households, comprising 1,220.
| Household Size | Family Households | Nonfamily Households |
| 1-Person Households | - | 1,220 (24.0%) |
| 2-Person Households | 1,821 (35.8%) | 135 (2.6%) |
| 3-Person Households | 1,009 (19.8%) | 10 (0.2%) |
| 4-Person Households | 550 (10.8%) | 0 (0.0%) |
| 5-Person Households | 245 (4.8%) | 0 (0.0%) |
| 6-Person Households | 90 (1.8%) | 0 (0.0%) |
| 7+ Person Households | 5 (0.1%) | 0 (0.0%) |
| Total | 3,720 (73.2%) | 1,365 (26.8%) |
Female Fertility in Menard County
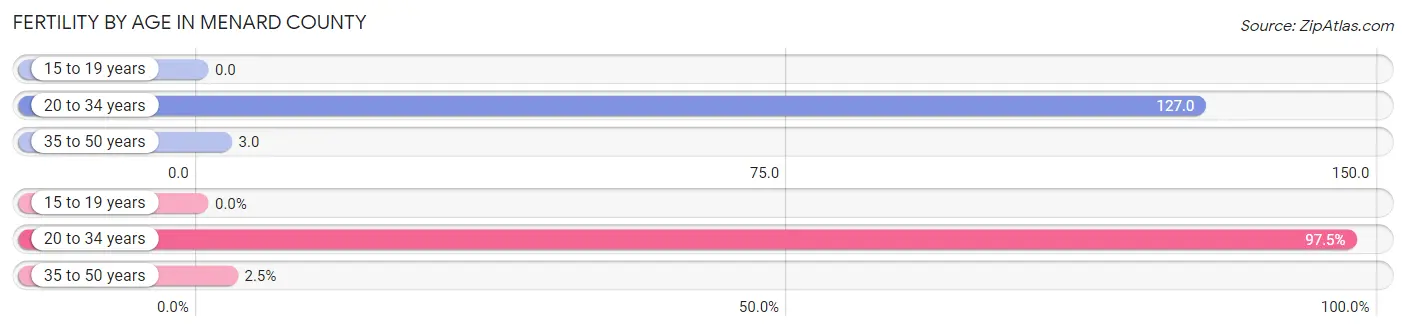
Fertility by Age in Menard County
Average fertility rate in Menard County is 49.0 births per 1,000 women. Women in the age bracket of 20 to 34 years have the highest fertility rate with 127.0 births per 1,000 women. Women in the age bracket of 20 to 34 years acount for 97.5% of all women with births.
| Age Bracket | Women with Births | Births / 1,000 Women |
| 15 to 19 years | 0 (0.0%) | 0.0 |
| 20 to 34 years | 117 (97.5%) | 127.0 |
| 35 to 50 years | 3 (2.5%) | 3.0 |
| Total | 120 (100.0%) | 49.0 |
Fertility by Age by Marriage Status in Menard County
81.7% of women with births (120) in Menard County are married. The highest percentage of unmarried women with births falls into 20 to 34 years age bracket with 18.8% of them unmarried at the time of birth, while the lowest percentage of unmarried women with births belong to 35 to 50 years age bracket with 0.0% of them unmarried.
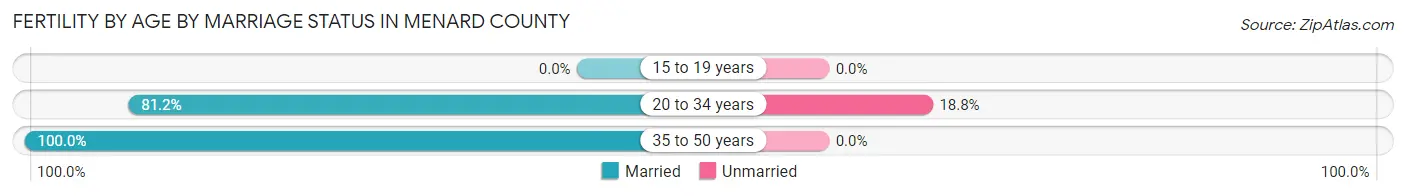
| Age Bracket | Married | Unmarried |
| 15 to 19 years | 0 (0.0%) | 0 (0.0%) |
| 20 to 34 years | 95 (81.2%) | 22 (18.8%) |
| 35 to 50 years | 3 (100.0%) | 0 (0.0%) |
| Total | 98 (81.7%) | 22 (18.3%) |
Fertility by Education in Menard County
Average fertility rate in Menard County is 49.0 births per 1,000 women. Women with the education attainment of high school diploma have the highest fertility rate of 109.0 births per 1,000 women, while women with the education attainment of college or associate's degree have the lowest fertility at 12.0 births per 1,000 women. Women with the education attainment of high school diploma represent 34.2% of all women with births.
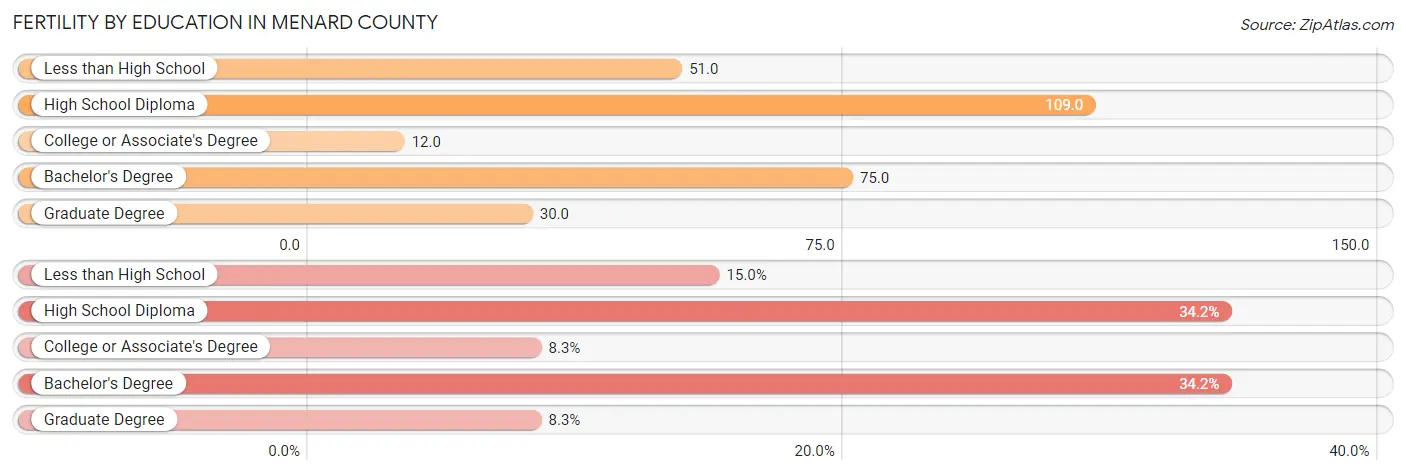
| Educational Attainment | Women with Births | Births / 1,000 Women |
| Less than High School | 18 (15.0%) | 51.0 |
| High School Diploma | 41 (34.2%) | 109.0 |
| College or Associate's Degree | 10 (8.3%) | 12.0 |
| Bachelor's Degree | 41 (34.2%) | 75.0 |
| Graduate Degree | 10 (8.3%) | 30.0 |
| Total | 120 (100.0%) | 49.0 |
Fertility by Education by Marriage Status in Menard County
18.3% of women with births in Menard County are unmarried. Women with the educational attainment of college or associate's degree are most likely to be married with 100.0% of them married at childbirth, while women with the educational attainment of less than high school are least likely to be married with 100.0% of them unmarried at childbirth.
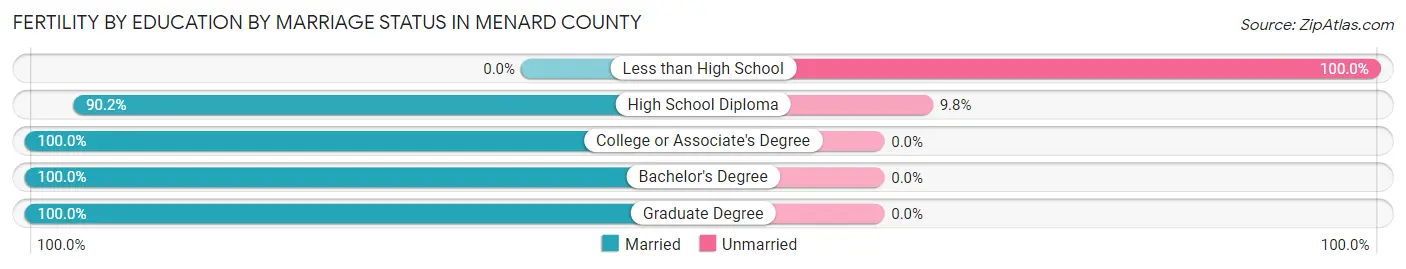
| Educational Attainment | Married | Unmarried |
| Less than High School | 0 (0.0%) | 18 (100.0%) |
| High School Diploma | 37 (90.2%) | 4 (9.8%) |
| College or Associate's Degree | 10 (100.0%) | 0 (0.0%) |
| Bachelor's Degree | 41 (100.0%) | 0 (0.0%) |
| Graduate Degree | 10 (100.0%) | 0 (0.0%) |
| Total | 98 (81.7%) | 22 (18.3%) |
Income in Menard County
Income Overview in Menard County
Per Capita Income in Menard County is $41,497, while median incomes of families and households are $97,125 and $84,846 respectively.
| Characteristic | Number | Measure |
| Per Capita Income | 12,284 | $41,497 |
| Median Family Income | 3,720 | $97,125 |
| Mean Family Income | 3,720 | $108,623 |
| Median Household Income | 5,085 | $84,846 |
| Mean Household Income | 5,085 | $99,217 |
| Income Deficit | 3,720 | $0 |
| Wage / Income Gap (%) | 12,284 | 23.26% |
| Wage / Income Gap ($) | 12,284 | 76.74¢ per $1 |
| Gini / Inequality Index | 12,284 | 0.40 |
Earnings by Sex in Menard County
Average Earnings in Menard County are $46,022, $52,958 for men and $40,638 for women, a difference of 23.3%.
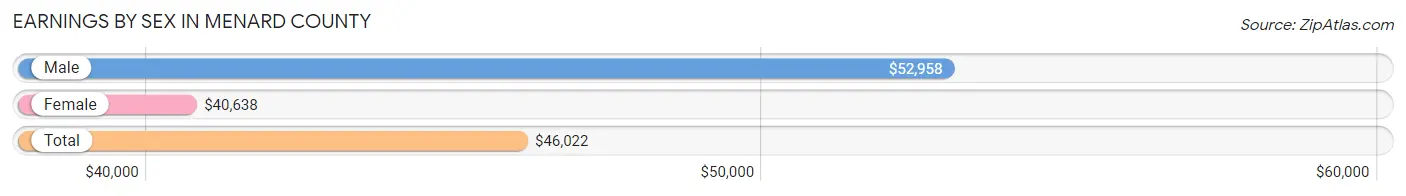
| Sex | Number | Average Earnings |
| Male | 3,408 (52.7%) | $52,958 |
| Female | 3,056 (47.3%) | $40,638 |
| Total | 6,464 (100.0%) | $46,022 |
Earnings by Sex by Income Bracket in Menard County
The most common earnings brackets in Menard County are $100,000+ for men (505 | 14.8%) and $55,000 to $64,999 for women (428 | 14.0%).
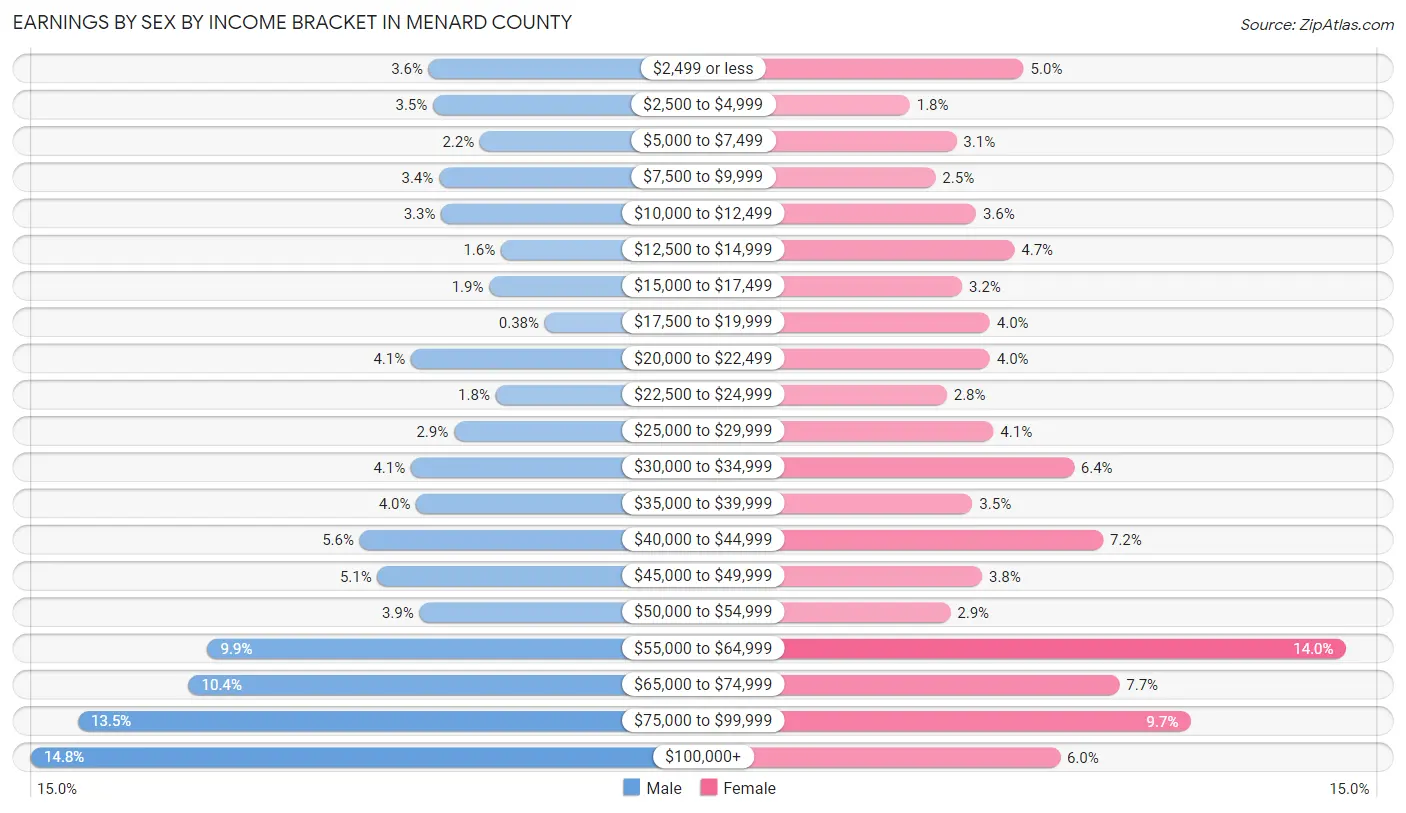
| Income | Male | Female |
| $2,499 or less | 124 (3.6%) | 152 (5.0%) |
| $2,500 to $4,999 | 120 (3.5%) | 54 (1.8%) |
| $5,000 to $7,499 | 75 (2.2%) | 94 (3.1%) |
| $7,500 to $9,999 | 114 (3.4%) | 76 (2.5%) |
| $10,000 to $12,499 | 112 (3.3%) | 111 (3.6%) |
| $12,500 to $14,999 | 55 (1.6%) | 144 (4.7%) |
| $15,000 to $17,499 | 66 (1.9%) | 99 (3.2%) |
| $17,500 to $19,999 | 13 (0.4%) | 123 (4.0%) |
| $20,000 to $22,499 | 141 (4.1%) | 123 (4.0%) |
| $22,500 to $24,999 | 60 (1.8%) | 86 (2.8%) |
| $25,000 to $29,999 | 100 (2.9%) | 126 (4.1%) |
| $30,000 to $34,999 | 141 (4.1%) | 195 (6.4%) |
| $35,000 to $39,999 | 136 (4.0%) | 108 (3.5%) |
| $40,000 to $44,999 | 190 (5.6%) | 220 (7.2%) |
| $45,000 to $49,999 | 173 (5.1%) | 116 (3.8%) |
| $50,000 to $54,999 | 133 (3.9%) | 89 (2.9%) |
| $55,000 to $64,999 | 336 (9.9%) | 428 (14.0%) |
| $65,000 to $74,999 | 354 (10.4%) | 234 (7.7%) |
| $75,000 to $99,999 | 460 (13.5%) | 295 (9.7%) |
| $100,000+ | 505 (14.8%) | 183 (6.0%) |
| Total | 3,408 (100.0%) | 3,056 (100.0%) |
Earnings by Sex by Educational Attainment in Menard County
Average earnings in Menard County are $58,735 for men and $44,528 for women, a difference of 24.2%. Men with an educational attainment of bachelor's degree enjoy the highest average annual earnings of $79,875, while those with high school diploma education earn the least with $46,992. Women with an educational attainment of graduate degree earn the most with the average annual earnings of $59,740, while those with less than high school education have the smallest earnings of $15,938.
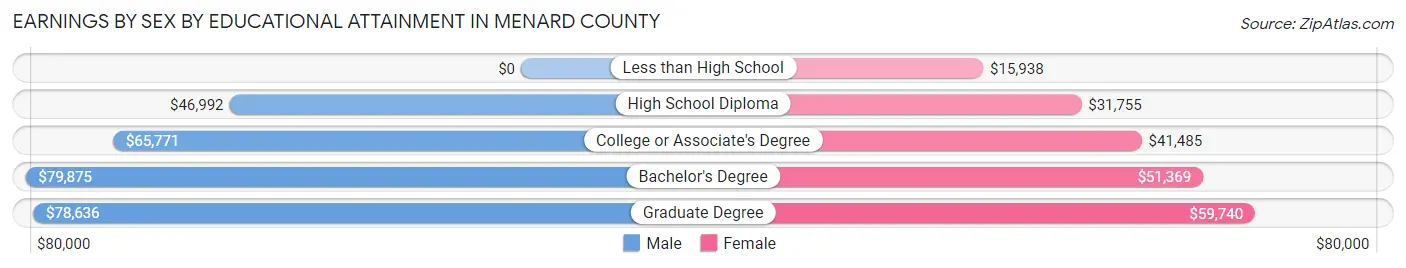
| Educational Attainment | Male Income | Female Income |
| Less than High School | - | - |
| High School Diploma | $46,992 | $31,755 |
| College or Associate's Degree | $65,771 | $41,485 |
| Bachelor's Degree | $79,875 | $51,369 |
| Graduate Degree | $78,636 | $59,740 |
| Total | $58,735 | $44,528 |
Family Income in Menard County
Family Income Brackets in Menard County
According to the Menard County family income data, there are 1,079 families falling into the $100,000 to $149,999 income range, which is the most common income bracket and makes up 29.0% of all families. Conversely, the $10,000 to $14,999 income bracket is the least frequent group with only 26 families (0.7%) belonging to this category.
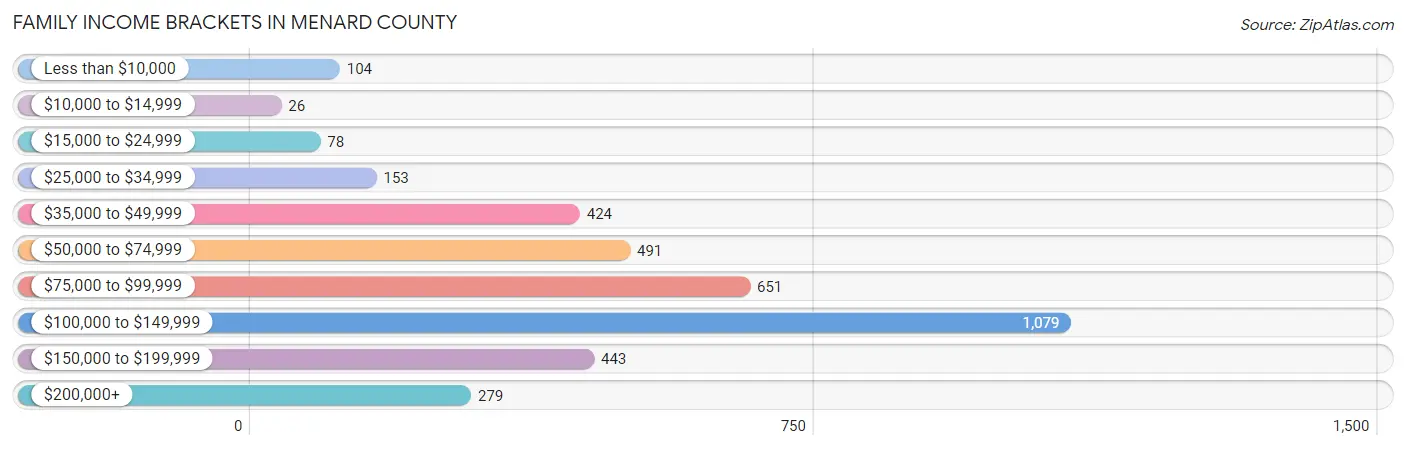
| Income Bracket | # Families | % Families |
| Less than $10,000 | 104 | 2.8% |
| $10,000 to $14,999 | 26 | 0.7% |
| $15,000 to $24,999 | 78 | 2.1% |
| $25,000 to $34,999 | 153 | 4.1% |
| $35,000 to $49,999 | 424 | 11.4% |
| $50,000 to $74,999 | 491 | 13.2% |
| $75,000 to $99,999 | 651 | 17.5% |
| $100,000 to $149,999 | 1,079 | 29.0% |
| $150,000 to $199,999 | 443 | 11.9% |
| $200,000+ | 279 | 7.5% |
Family Income by Famaliy Size in Menard County
6-person families (77 | 2.1%) account for the highest median family income in Menard County with $126,488 per family, while 2-person families (1,963 | 52.8%) have the highest median income of $44,970 per family member.
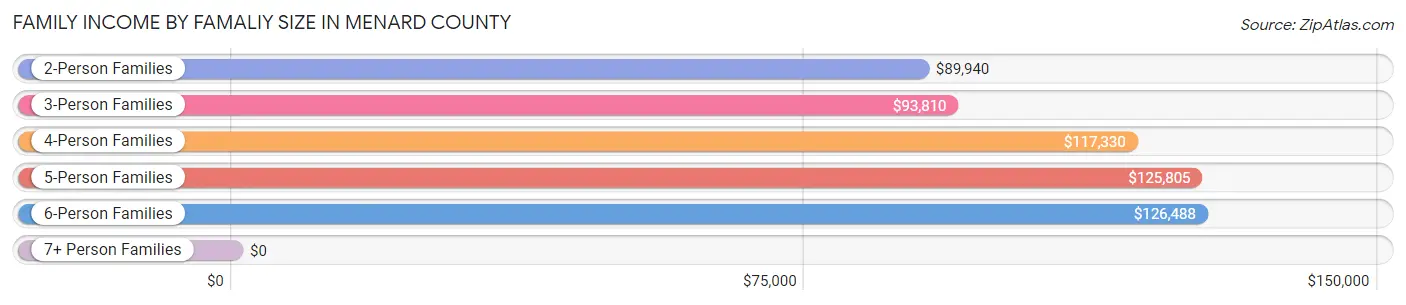
| Income Bracket | # Families | Median Income |
| 2-Person Families | 1,963 (52.8%) | $89,940 |
| 3-Person Families | 924 (24.8%) | $93,810 |
| 4-Person Families | 537 (14.4%) | $117,330 |
| 5-Person Families | 217 (5.8%) | $125,805 |
| 6-Person Families | 77 (2.1%) | $126,488 |
| 7+ Person Families | 2 (0.1%) | $0 |
| Total | 3,720 (100.0%) | $97,125 |
Family Income by Number of Earners in Menard County
The median family income in Menard County is $97,125, with families comprising 3+ earners (286) having the highest median family income of $150,000, while families with 1 earner (949) have the lowest median family income of $66,615, accounting for 7.7% and 25.5% of families, respectively.
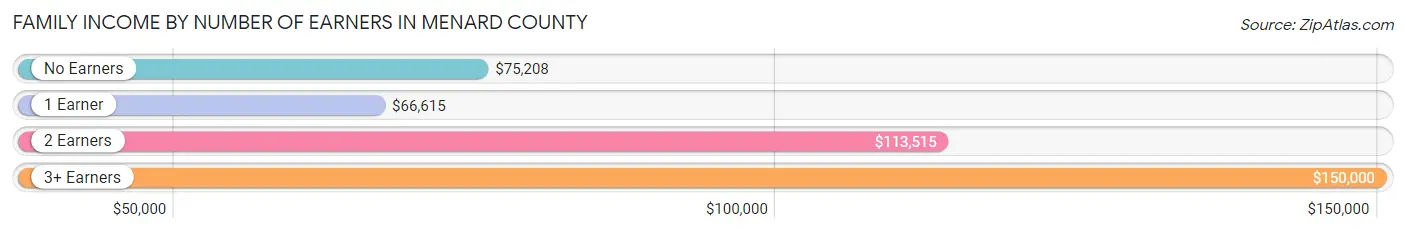
| Number of Earners | # Families | Median Income |
| No Earners | 692 (18.6%) | $75,208 |
| 1 Earner | 949 (25.5%) | $66,615 |
| 2 Earners | 1,793 (48.2%) | $113,515 |
| 3+ Earners | 286 (7.7%) | $150,000 |
| Total | 3,720 (100.0%) | $97,125 |
Household Income in Menard County
Household Income Brackets in Menard County
With 1,317 households falling in the category, the $100,000 to $149,999 income range is the most frequent in Menard County, accounting for 25.9% of all households. In contrast, only 97 households (1.9%) fall into the $10,000 to $14,999 income bracket, making it the least populous group.
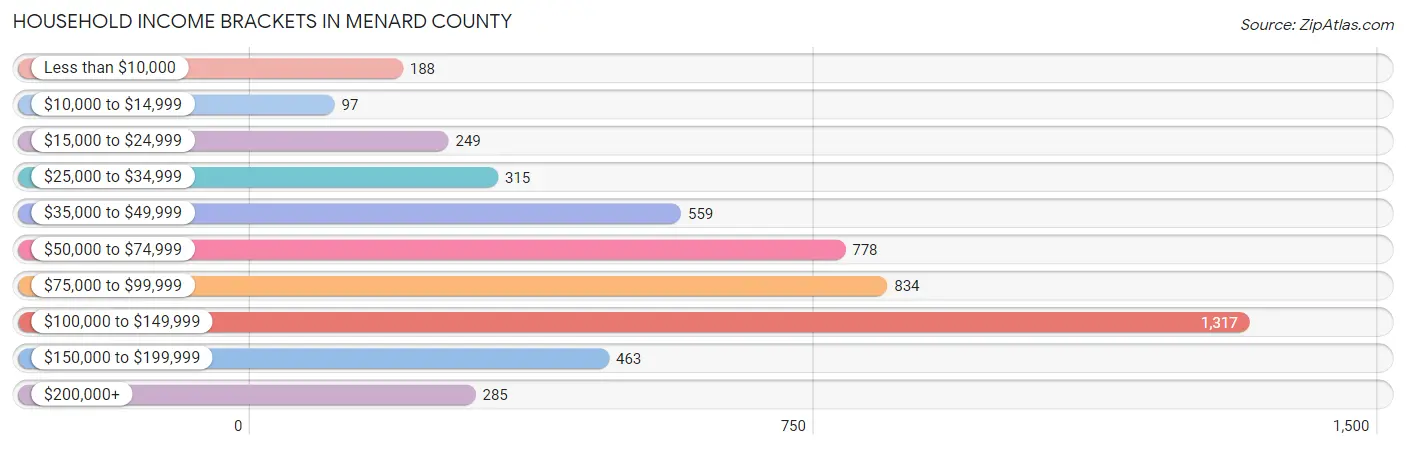
| Income Bracket | # Households | % Households |
| Less than $10,000 | 188 | 3.7% |
| $10,000 to $14,999 | 97 | 1.9% |
| $15,000 to $24,999 | 249 | 4.9% |
| $25,000 to $34,999 | 315 | 6.2% |
| $35,000 to $49,999 | 559 | 11.0% |
| $50,000 to $74,999 | 778 | 15.3% |
| $75,000 to $99,999 | 834 | 16.4% |
| $100,000 to $149,999 | 1,317 | 25.9% |
| $150,000 to $199,999 | 463 | 9.1% |
| $200,000+ | 285 | 5.6% |
Household Income by Householder Age in Menard County
The median household income in Menard County is $84,846, with the highest median household income of $99,375 found in the 25 to 44 years age bracket for the primary householder. A total of 1,447 households (28.5%) fall into this category. Meanwhile, the 15 to 24 years age bracket for the primary householder has the lowest median household income of $39,861, with 121 households (2.4%) in this group.

| Income Bracket | # Households | Median Income |
| 15 to 24 Years | 121 (2.4%) | $39,861 |
| 25 to 44 Years | 1,447 (28.5%) | $99,375 |
| 45 to 64 Years | 1,924 (37.8%) | $95,167 |
| 65+ Years | 1,593 (31.3%) | $65,662 |
| Total | 5,085 (100.0%) | $84,846 |
Poverty in Menard County
Income Below Poverty by Sex and Age in Menard County
With 8.7% poverty level for males and 7.2% for females among the residents of Menard County, 15 year old males and 15 year old females are the most vulnerable to poverty, with 18 males (22.0%) and 20 females (23.3%) in their respective age groups living below the poverty level.
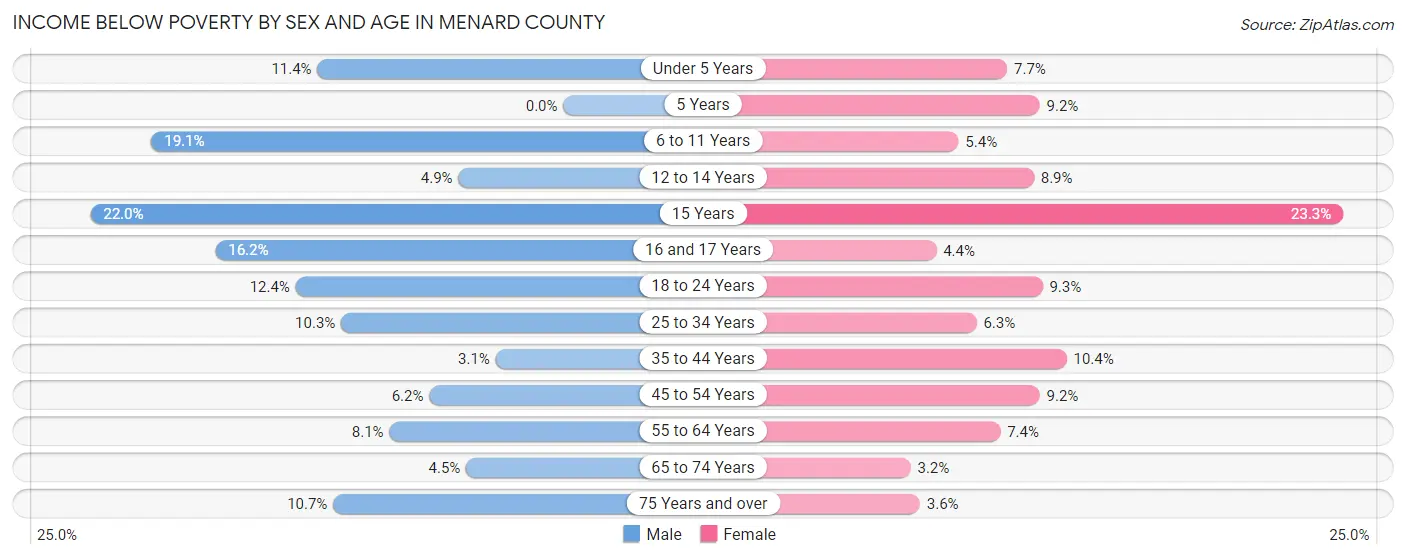
| Age Bracket | Male | Female |
| Under 5 Years | 34 (11.4%) | 24 (7.7%) |
| 5 Years | 0 (0.0%) | 9 (9.2%) |
| 6 to 11 Years | 87 (19.1%) | 25 (5.4%) |
| 12 to 14 Years | 13 (4.9%) | 22 (8.9%) |
| 15 Years | 18 (22.0%) | 20 (23.3%) |
| 16 and 17 Years | 26 (16.2%) | 7 (4.4%) |
| 18 to 24 Years | 59 (12.4%) | 35 (9.3%) |
| 25 to 34 Years | 64 (10.3%) | 41 (6.2%) |
| 35 to 44 Years | 24 (3.1%) | 78 (10.4%) |
| 45 to 54 Years | 46 (6.2%) | 71 (9.2%) |
| 55 to 64 Years | 76 (8.1%) | 69 (7.3%) |
| 65 to 74 Years | 32 (4.5%) | 24 (3.2%) |
| 75 Years and over | 41 (10.7%) | 19 (3.6%) |
| Total | 520 (8.7%) | 444 (7.2%) |
Income Above Poverty by Sex and Age in Menard County
According to the poverty statistics in Menard County, males aged 5 years and females aged 65 to 74 years are the age groups that are most secure financially, with 100.0% of males and 96.8% of females in these age groups living above the poverty line.
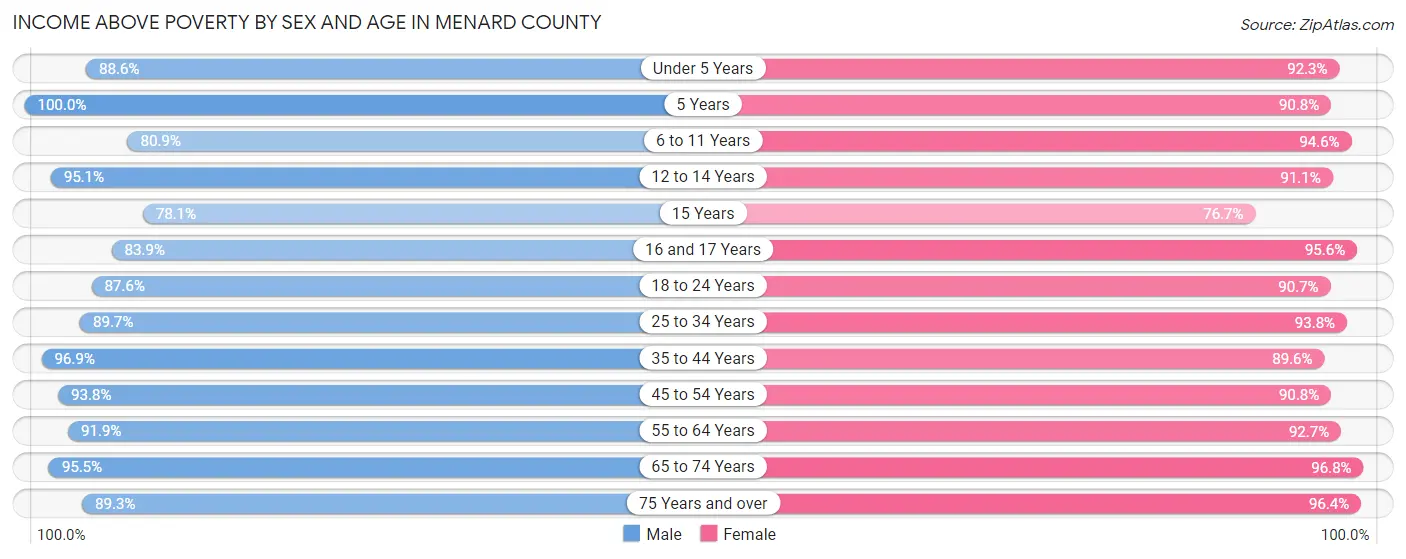
| Age Bracket | Male | Female |
| Under 5 Years | 264 (88.6%) | 289 (92.3%) |
| 5 Years | 99 (100.0%) | 89 (90.8%) |
| 6 to 11 Years | 368 (80.9%) | 437 (94.6%) |
| 12 to 14 Years | 254 (95.1%) | 225 (91.1%) |
| 15 Years | 64 (78.0%) | 66 (76.7%) |
| 16 and 17 Years | 135 (83.9%) | 153 (95.6%) |
| 18 to 24 Years | 416 (87.6%) | 341 (90.7%) |
| 25 to 34 Years | 557 (89.7%) | 615 (93.8%) |
| 35 to 44 Years | 740 (96.9%) | 670 (89.6%) |
| 45 to 54 Years | 694 (93.8%) | 702 (90.8%) |
| 55 to 64 Years | 866 (91.9%) | 870 (92.6%) |
| 65 to 74 Years | 678 (95.5%) | 729 (96.8%) |
| 75 Years and over | 343 (89.3%) | 506 (96.4%) |
| Total | 5,478 (91.3%) | 5,692 (92.8%) |
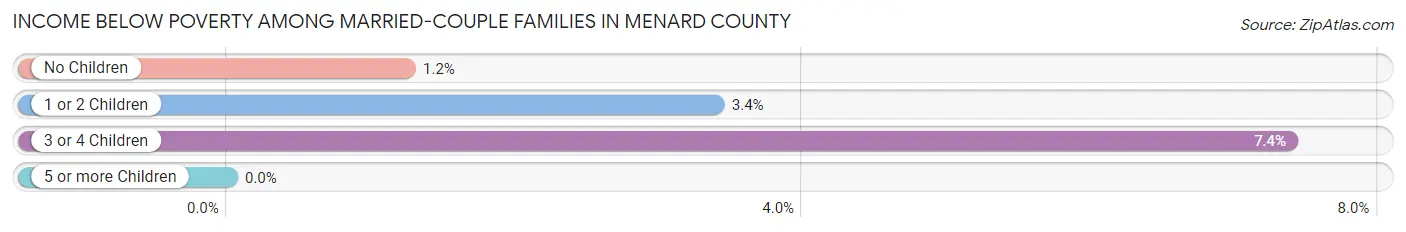
Income Below Poverty Among Married-Couple Families in Menard County
The poverty statistics for married-couple families in Menard County show that 2.4% or 70 of the total 2,898 families live below the poverty line. Families with 3 or 4 children have the highest poverty rate of 7.4%, comprising of 18 families. On the other hand, families with no children have the lowest poverty rate of 1.2%, which includes 22 families.
| Children | Above Poverty | Below Poverty |
| No Children | 1,746 (98.8%) | 22 (1.2%) |
| 1 or 2 Children | 856 (96.6%) | 30 (3.4%) |
| 3 or 4 Children | 226 (92.6%) | 18 (7.4%) |
| 5 or more Children | 0 (0.0%) | 0 (0.0%) |
| Total | 2,828 (97.6%) | 70 (2.4%) |
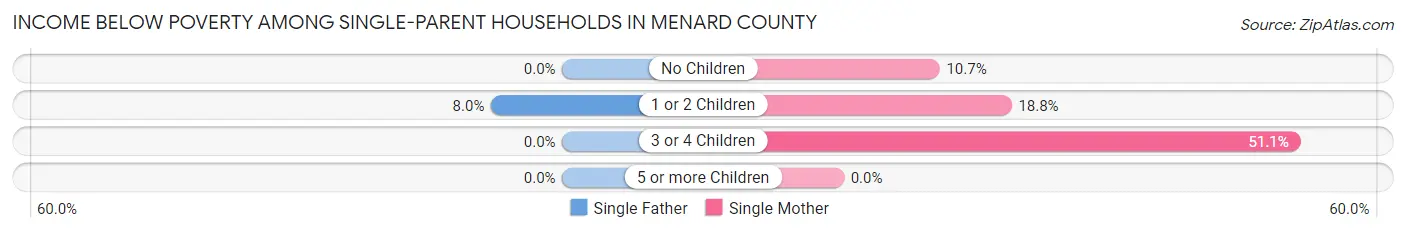
Income Below Poverty Among Single-Parent Households in Menard County
According to the poverty data in Menard County, 4.7% or 9 single-father households and 17.6% or 111 single-mother households are living below the poverty line. Among single-father households, those with 1 or 2 children have the highest poverty rate, with 9 households (8.0%) experiencing poverty. Likewise, among single-mother households, those with 3 or 4 children have the highest poverty rate, with 24 households (51.1%) falling below the poverty line.
| Children | Single Father | Single Mother |
| No Children | 0 (0.0%) | 30 (10.7%) |
| 1 or 2 Children | 9 (8.0%) | 57 (18.8%) |
| 3 or 4 Children | 0 (0.0%) | 24 (51.1%) |
| 5 or more Children | 0 (0.0%) | 0 (0.0%) |
| Total | 9 (4.7%) | 111 (17.6%) |
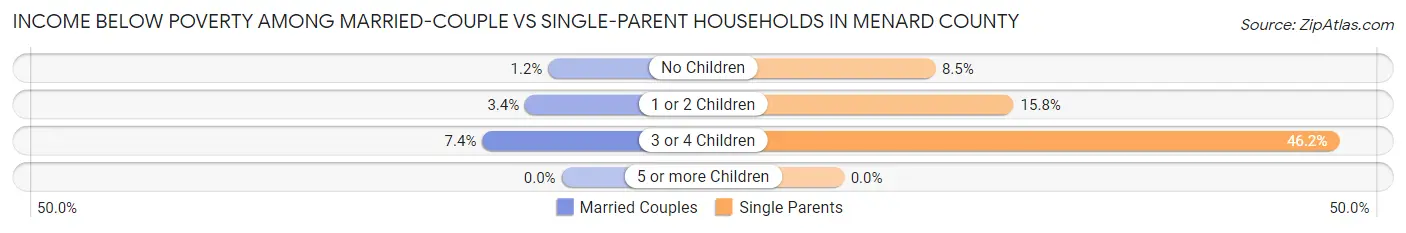
Income Below Poverty Among Married-Couple vs Single-Parent Households in Menard County
The poverty data for Menard County shows that 70 of the married-couple family households (2.4%) and 120 of the single-parent households (14.6%) are living below the poverty level. Within the married-couple family households, those with 3 or 4 children have the highest poverty rate, with 18 households (7.4%) falling below the poverty line. Among the single-parent households, those with 3 or 4 children have the highest poverty rate, with 24 household (46.2%) living below poverty.
| Children | Married-Couple Families | Single-Parent Households |
| No Children | 22 (1.2%) | 30 (8.5%) |
| 1 or 2 Children | 30 (3.4%) | 66 (15.8%) |
| 3 or 4 Children | 18 (7.4%) | 24 (46.2%) |
| 5 or more Children | 0 (0.0%) | 0 (0.0%) |
| Total | 70 (2.4%) | 120 (14.6%) |
Employment Characteristics in Menard County
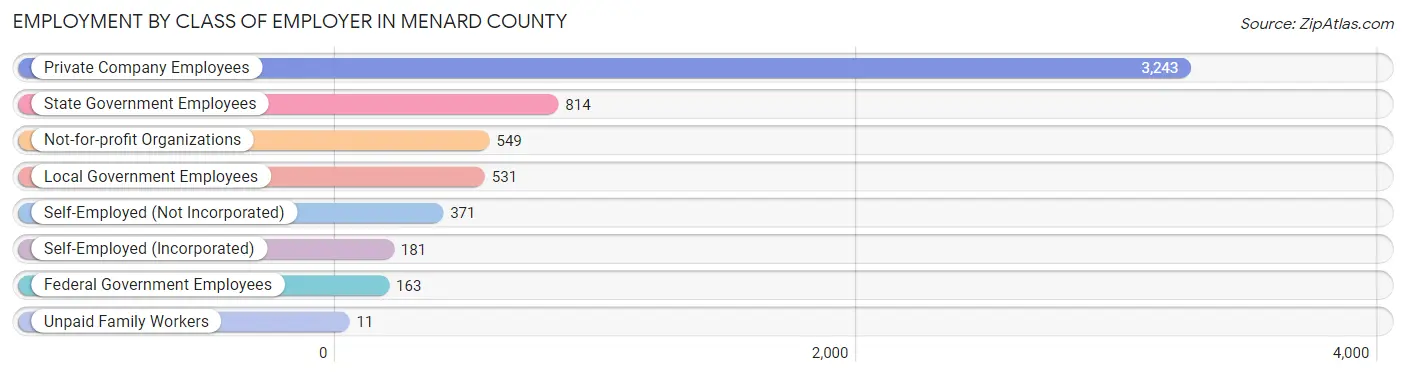
Employment by Class of Employer in Menard County
Among the 5,863 employed individuals in Menard County, private company employees (3,243 | 55.3%), state government employees (814 | 13.9%), and not-for-profit organizations (549 | 9.4%) make up the most common classes of employment.
| Employer Class | # Employees | % Employees |
| Private Company Employees | 3,243 | 55.3% |
| Self-Employed (Incorporated) | 181 | 3.1% |
| Self-Employed (Not Incorporated) | 371 | 6.3% |
| Not-for-profit Organizations | 549 | 9.4% |
| Local Government Employees | 531 | 9.1% |
| State Government Employees | 814 | 13.9% |
| Federal Government Employees | 163 | 2.8% |
| Unpaid Family Workers | 11 | 0.2% |
| Total | 5,863 | 100.0% |
Employment Status by Age in Menard County
According to the labor force statistics for Menard County, out of the total population over 16 years of age (9,848), 63.1% or 6,214 individuals are in the labor force, with 4.9% or 304 of them unemployed. The age group with the highest labor force participation rate is 30 to 34 years, with 96.2% or 638 individuals in the labor force. Within the labor force, the 16 to 19 years age range has the highest percentage of unemployed individuals, with 14.3% or 38 of them being unemployed.
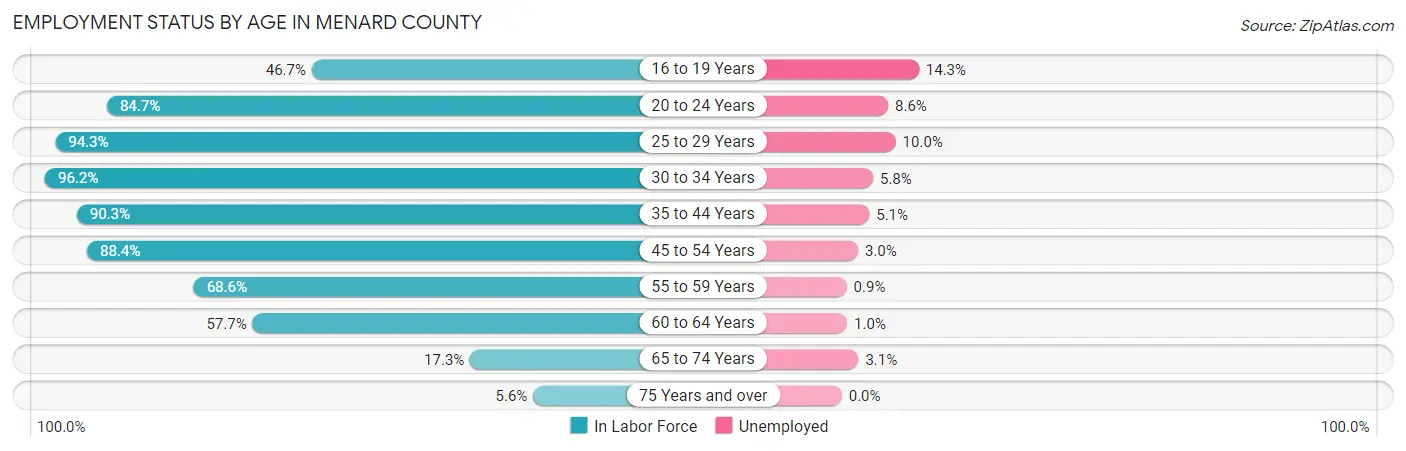
| Age Bracket | In Labor Force | Unemployed |
| 16 to 19 Years | 266 (46.7%) | 38 (14.3%) |
| 20 to 24 Years | 521 (84.7%) | 45 (8.6%) |
| 25 to 29 Years | 584 (94.3%) | 58 (10.0%) |
| 30 to 34 Years | 638 (96.2%) | 37 (5.8%) |
| 35 to 44 Years | 1,374 (90.3%) | 70 (5.1%) |
| 45 to 54 Years | 1,337 (88.4%) | 40 (3.0%) |
| 55 to 59 Years | 582 (68.6%) | 5 (0.9%) |
| 60 to 64 Years | 604 (57.7%) | 6 (1.0%) |
| 65 to 74 Years | 256 (17.3%) | 8 (3.1%) |
| 75 Years and over | 55 (5.6%) | 0 (0.0%) |
| Total | 6,214 (63.1%) | 304 (4.9%) |
Employment Status by Educational Attainment in Menard County
According to labor force statistics for Menard County, 82.4% of individuals (5,119) out of the total population between 25 and 64 years of age (6,212) are in the labor force, with 4.2% or 215 of them being unemployed. The group with the highest labor force participation rate are those with the educational attainment of bachelor's degree or higher, with 91.6% or 1,587 individuals in the labor force. Within the labor force, individuals with less than high school education have the highest percentage of unemployment, with 12.1% or 21 of them being unemployed.
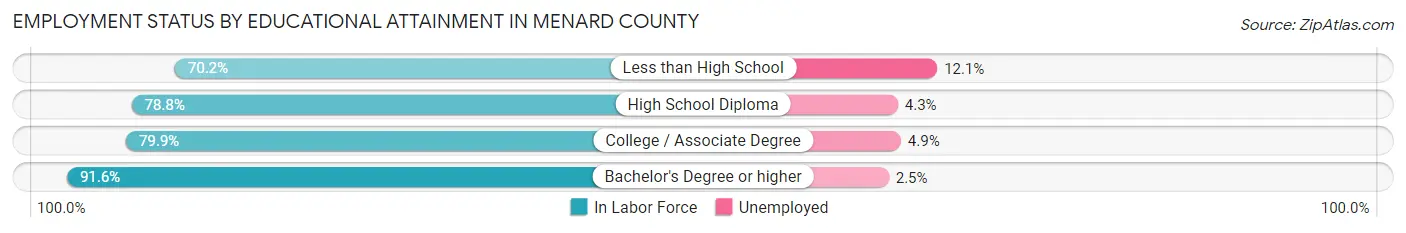
| Educational Attainment | In Labor Force | Unemployed |
| Less than High School | 174 (70.2%) | 30 (12.1%) |
| High School Diploma | 1,506 (78.8%) | 82 (4.3%) |
| College / Associate Degree | 1,854 (79.9%) | 114 (4.9%) |
| Bachelor's Degree or higher | 1,587 (91.6%) | 43 (2.5%) |
| Total | 5,119 (82.4%) | 261 (4.2%) |
Employment Occupations by Sex in Menard County
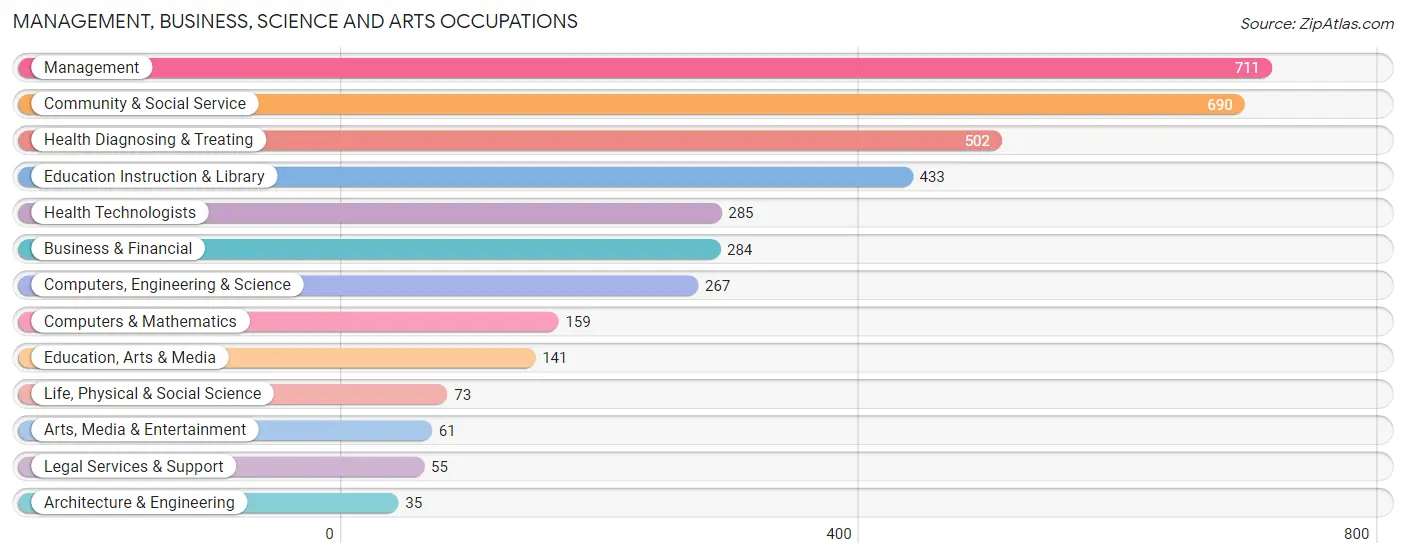
Management, Business, Science and Arts Occupations
The most common Management, Business, Science and Arts occupations in Menard County are Management (711 | 12.1%), Community & Social Service (690 | 11.7%), Health Diagnosing & Treating (502 | 8.5%), Education Instruction & Library (433 | 7.4%), and Health Technologists (285 | 4.8%).
Management, Business, Science and Arts Occupations by Sex
Within the Management, Business, Science and Arts occupations in Menard County, the most male-oriented occupations are Architecture & Engineering (100.0%), Arts, Media & Entertainment (85.3%), and Management (74.0%), while the most female-oriented occupations are Health Technologists (79.6%), Legal Services & Support (78.2%), and Education, Arts & Media (73.1%).
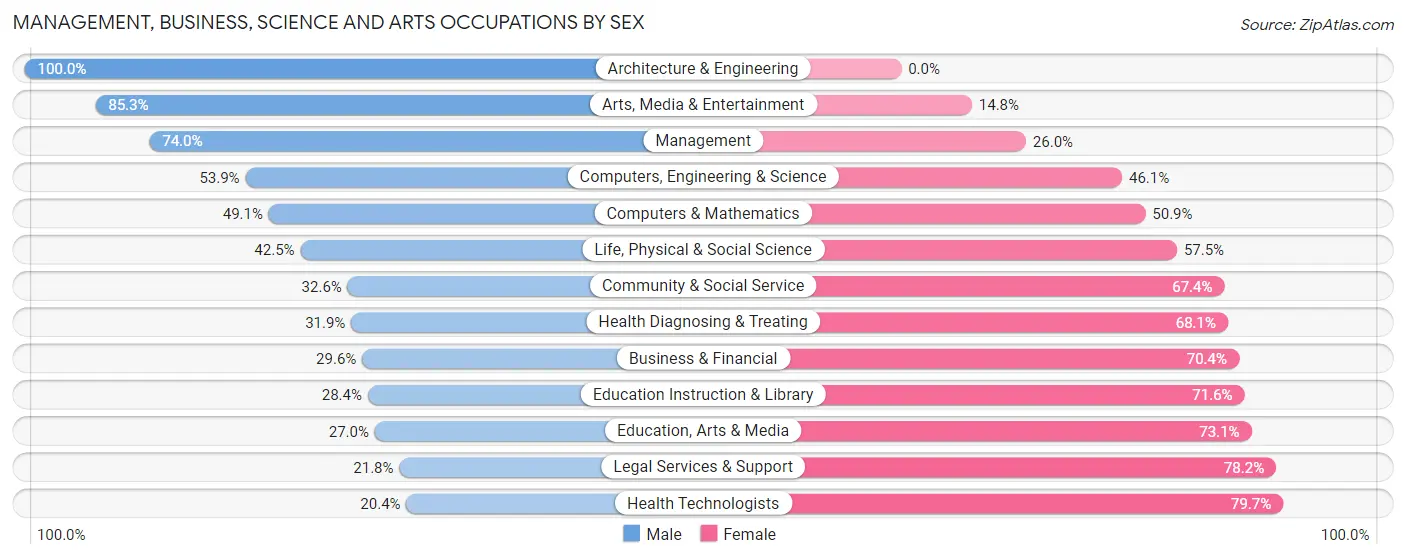
| Occupation | Male | Female |
| Management | 526 (74.0%) | 185 (26.0%) |
| Business & Financial | 84 (29.6%) | 200 (70.4%) |
| Computers, Engineering & Science | 144 (53.9%) | 123 (46.1%) |
| Computers & Mathematics | 78 (49.1%) | 81 (50.9%) |
| Architecture & Engineering | 35 (100.0%) | 0 (0.0%) |
| Life, Physical & Social Science | 31 (42.5%) | 42 (57.5%) |
| Community & Social Service | 225 (32.6%) | 465 (67.4%) |
| Education, Arts & Media | 38 (27.0%) | 103 (73.1%) |
| Legal Services & Support | 12 (21.8%) | 43 (78.2%) |
| Education Instruction & Library | 123 (28.4%) | 310 (71.6%) |
| Arts, Media & Entertainment | 52 (85.3%) | 9 (14.7%) |
| Health Diagnosing & Treating | 160 (31.9%) | 342 (68.1%) |
| Health Technologists | 58 (20.3%) | 227 (79.6%) |
| Total (Category) | 1,139 (46.4%) | 1,315 (53.6%) |
| Total (Overall) | 3,075 (52.2%) | 2,811 (47.8%) |
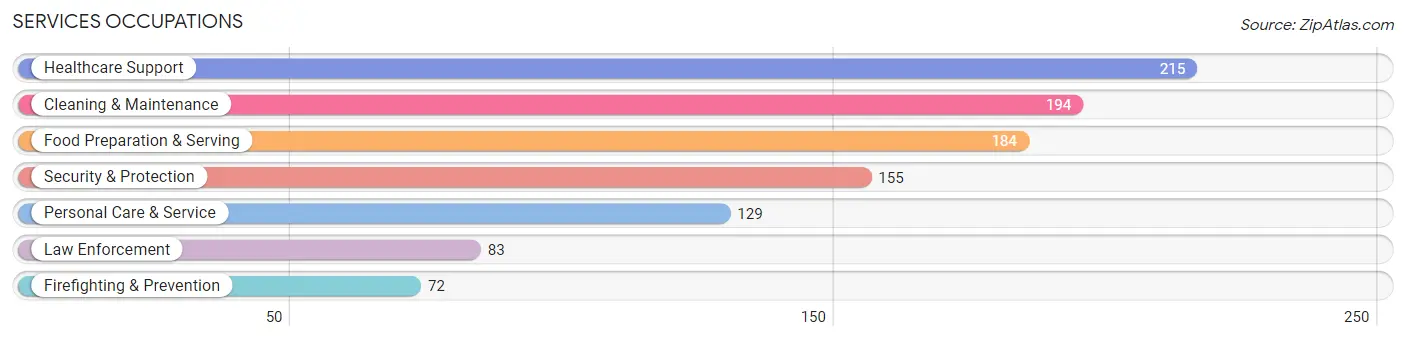
Services Occupations
The most common Services occupations in Menard County are Healthcare Support (215 | 3.6%), Cleaning & Maintenance (194 | 3.3%), Food Preparation & Serving (184 | 3.1%), Security & Protection (155 | 2.6%), and Personal Care & Service (129 | 2.2%).
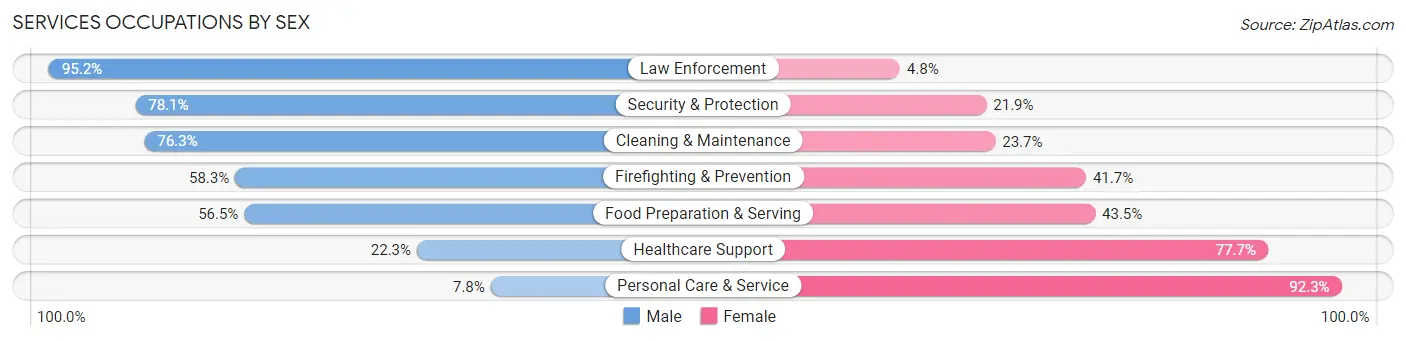
Services Occupations by Sex
Within the Services occupations in Menard County, the most male-oriented occupations are Law Enforcement (95.2%), Security & Protection (78.1%), and Cleaning & Maintenance (76.3%), while the most female-oriented occupations are Personal Care & Service (92.2%), Healthcare Support (77.7%), and Food Preparation & Serving (43.5%).
| Occupation | Male | Female |
| Healthcare Support | 48 (22.3%) | 167 (77.7%) |
| Security & Protection | 121 (78.1%) | 34 (21.9%) |
| Firefighting & Prevention | 42 (58.3%) | 30 (41.7%) |
| Law Enforcement | 79 (95.2%) | 4 (4.8%) |
| Food Preparation & Serving | 104 (56.5%) | 80 (43.5%) |
| Cleaning & Maintenance | 148 (76.3%) | 46 (23.7%) |
| Personal Care & Service | 10 (7.7%) | 119 (92.2%) |
| Total (Category) | 431 (49.1%) | 446 (50.9%) |
| Total (Overall) | 3,075 (52.2%) | 2,811 (47.8%) |
Sales and Office Occupations
The most common Sales and Office occupations in Menard County are Office & Administration (839 | 14.2%), and Sales & Related (581 | 9.9%).

Sales and Office Occupations by Sex

| Occupation | Male | Female |
| Sales & Related | 284 (48.9%) | 297 (51.1%) |
| Office & Administration | 200 (23.8%) | 639 (76.2%) |
| Total (Category) | 484 (34.1%) | 936 (65.9%) |
| Total (Overall) | 3,075 (52.2%) | 2,811 (47.8%) |
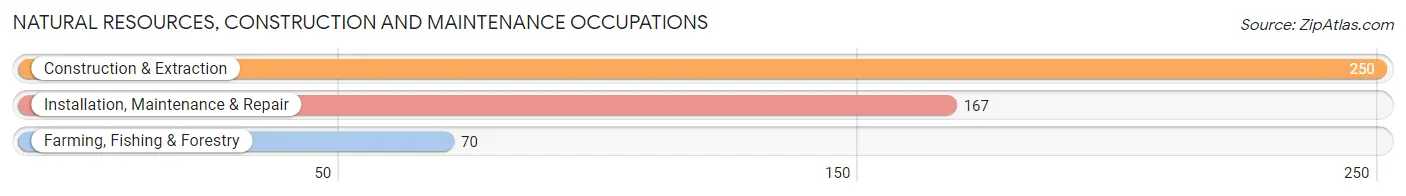
Natural Resources, Construction and Maintenance Occupations
The most common Natural Resources, Construction and Maintenance occupations in Menard County are Construction & Extraction (250 | 4.3%), Installation, Maintenance & Repair (167 | 2.8%), and Farming, Fishing & Forestry (70 | 1.2%).
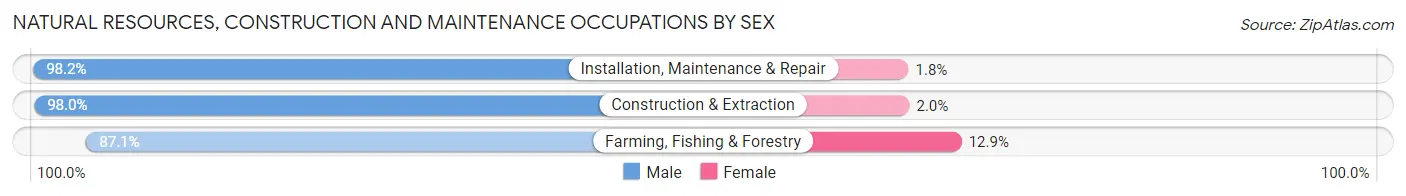
Natural Resources, Construction and Maintenance Occupations by Sex
| Occupation | Male | Female |
| Farming, Fishing & Forestry | 61 (87.1%) | 9 (12.9%) |
| Construction & Extraction | 245 (98.0%) | 5 (2.0%) |
| Installation, Maintenance & Repair | 164 (98.2%) | 3 (1.8%) |
| Total (Category) | 470 (96.5%) | 17 (3.5%) |
| Total (Overall) | 3,075 (52.2%) | 2,811 (47.8%) |
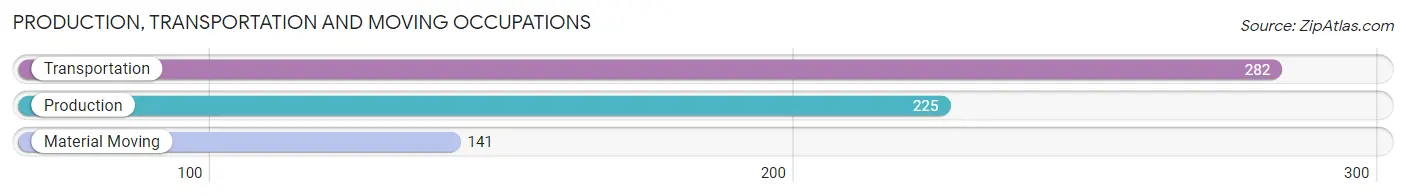
Production, Transportation and Moving Occupations
The most common Production, Transportation and Moving occupations in Menard County are Transportation (282 | 4.8%), Production (225 | 3.8%), and Material Moving (141 | 2.4%).
Production, Transportation and Moving Occupations by Sex
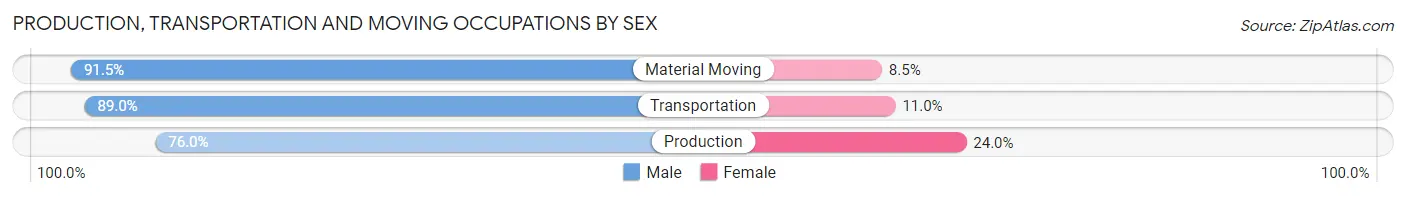
| Occupation | Male | Female |
| Production | 171 (76.0%) | 54 (24.0%) |
| Transportation | 251 (89.0%) | 31 (11.0%) |
| Material Moving | 129 (91.5%) | 12 (8.5%) |
| Total (Category) | 551 (85.0%) | 97 (15.0%) |
| Total (Overall) | 3,075 (52.2%) | 2,811 (47.8%) |
Employment Industries by Sex in Menard County
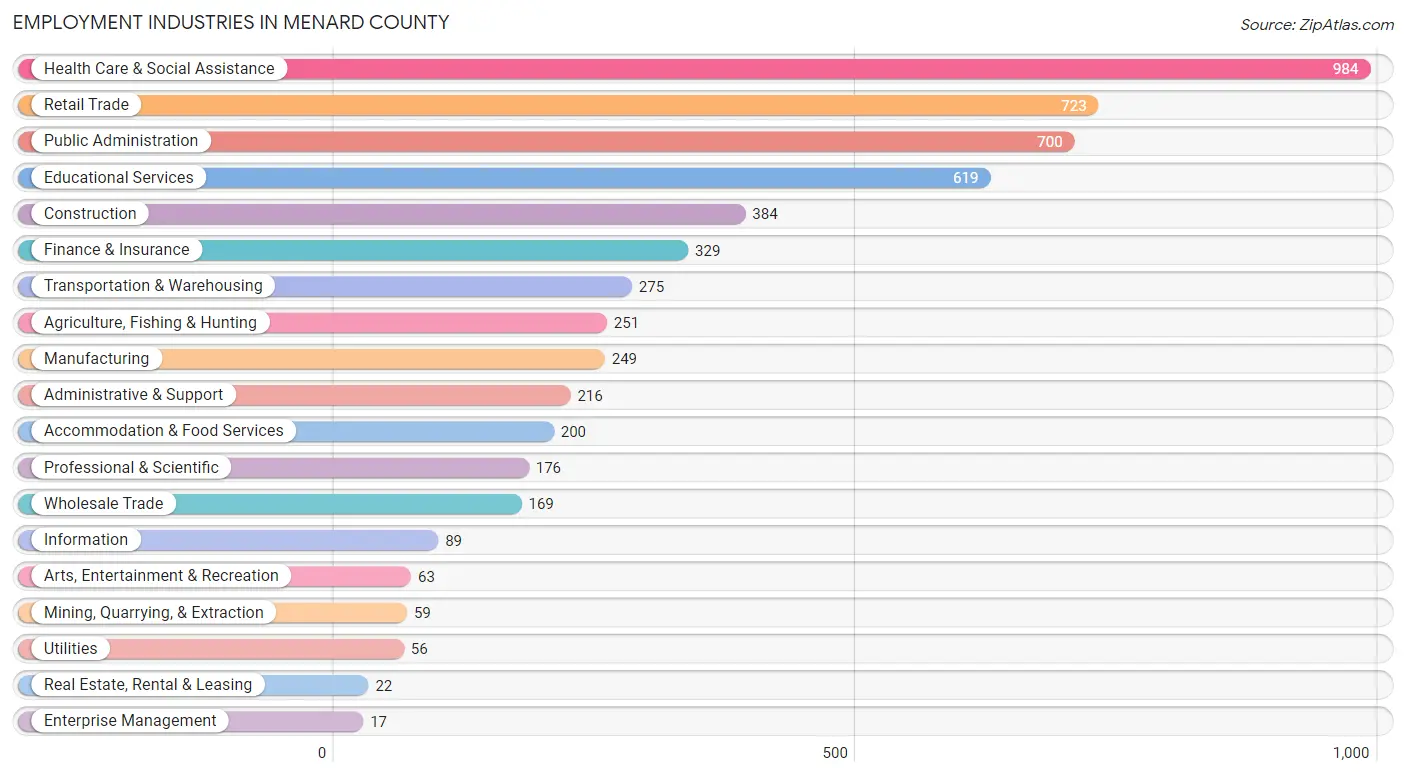
Employment Industries in Menard County
The major employment industries in Menard County include Health Care & Social Assistance (984 | 16.7%), Retail Trade (723 | 12.3%), Public Administration (700 | 11.9%), Educational Services (619 | 10.5%), and Construction (384 | 6.5%).
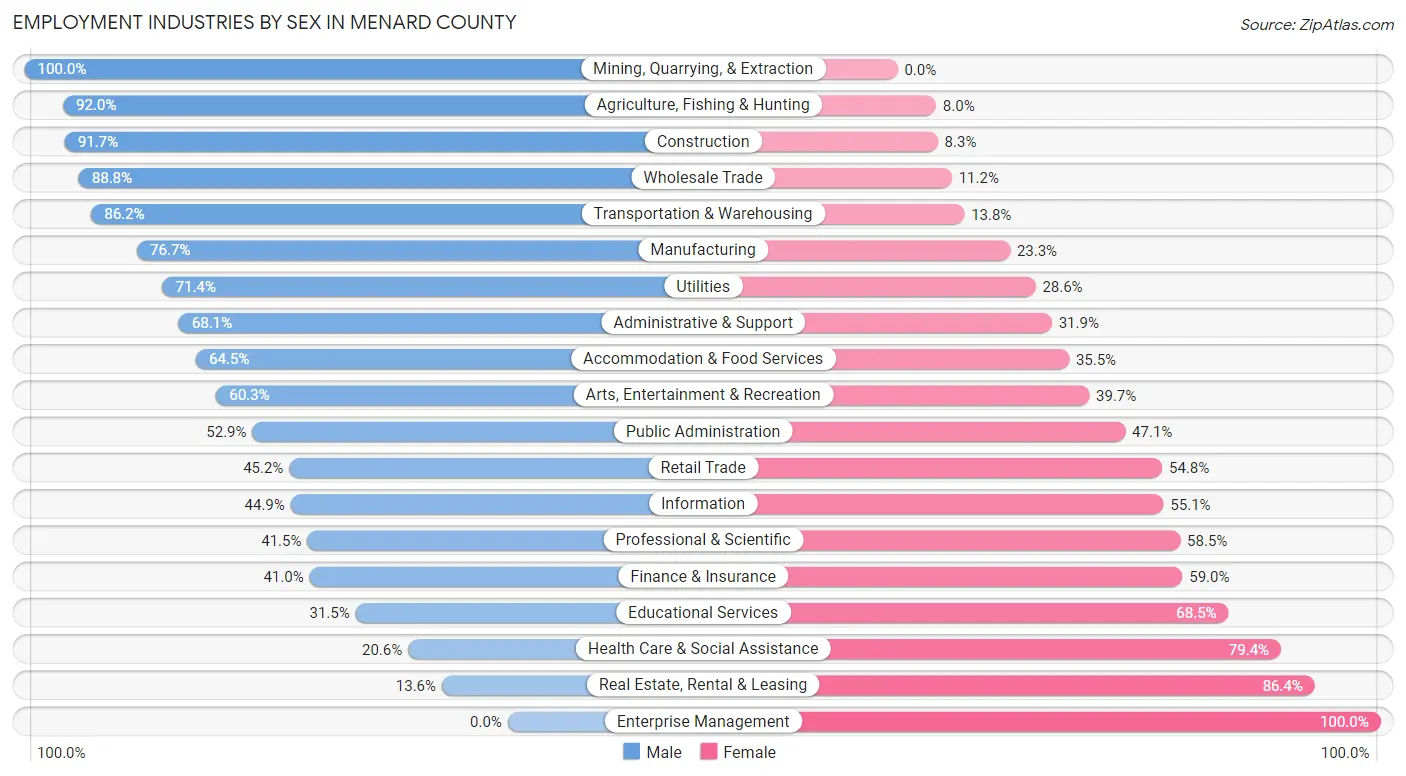
Employment Industries by Sex in Menard County
The Menard County industries that see more men than women are Mining, Quarrying, & Extraction (100.0%), Agriculture, Fishing & Hunting (92.0%), and Construction (91.7%), whereas the industries that tend to have a higher number of women are Enterprise Management (100.0%), Real Estate, Rental & Leasing (86.4%), and Health Care & Social Assistance (79.4%).
| Industry | Male | Female |
| Agriculture, Fishing & Hunting | 231 (92.0%) | 20 (8.0%) |
| Mining, Quarrying, & Extraction | 59 (100.0%) | 0 (0.0%) |
| Construction | 352 (91.7%) | 32 (8.3%) |
| Manufacturing | 191 (76.7%) | 58 (23.3%) |
| Wholesale Trade | 150 (88.8%) | 19 (11.2%) |
| Retail Trade | 327 (45.2%) | 396 (54.8%) |
| Transportation & Warehousing | 237 (86.2%) | 38 (13.8%) |
| Utilities | 40 (71.4%) | 16 (28.6%) |
| Information | 40 (44.9%) | 49 (55.1%) |
| Finance & Insurance | 135 (41.0%) | 194 (59.0%) |
| Real Estate, Rental & Leasing | 3 (13.6%) | 19 (86.4%) |
| Professional & Scientific | 73 (41.5%) | 103 (58.5%) |
| Enterprise Management | 0 (0.0%) | 17 (100.0%) |
| Administrative & Support | 147 (68.1%) | 69 (31.9%) |
| Educational Services | 195 (31.5%) | 424 (68.5%) |
| Health Care & Social Assistance | 203 (20.6%) | 781 (79.4%) |
| Arts, Entertainment & Recreation | 38 (60.3%) | 25 (39.7%) |
| Accommodation & Food Services | 129 (64.5%) | 71 (35.5%) |
| Public Administration | 370 (52.9%) | 330 (47.1%) |
| Total | 3,075 (52.2%) | 2,811 (47.8%) |
Education in Menard County
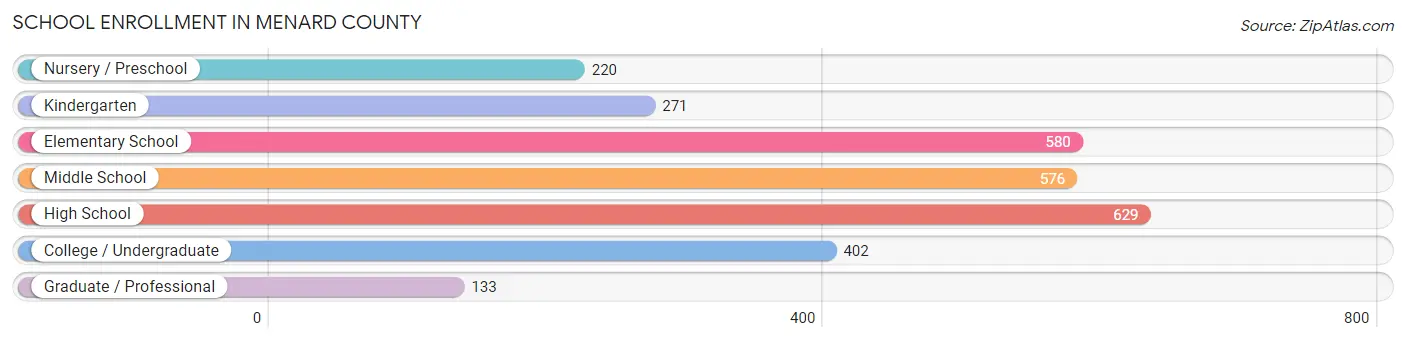
School Enrollment in Menard County
The most common levels of schooling among the 2,811 students in Menard County are high school (629 | 22.4%), elementary school (580 | 20.6%), and middle school (576 | 20.5%).
| School Level | # Students | % Students |
| Nursery / Preschool | 220 | 7.8% |
| Kindergarten | 271 | 9.6% |
| Elementary School | 580 | 20.6% |
| Middle School | 576 | 20.5% |
| High School | 629 | 22.4% |
| College / Undergraduate | 402 | 14.3% |
| Graduate / Professional | 133 | 4.7% |
| Total | 2,811 | 100.0% |
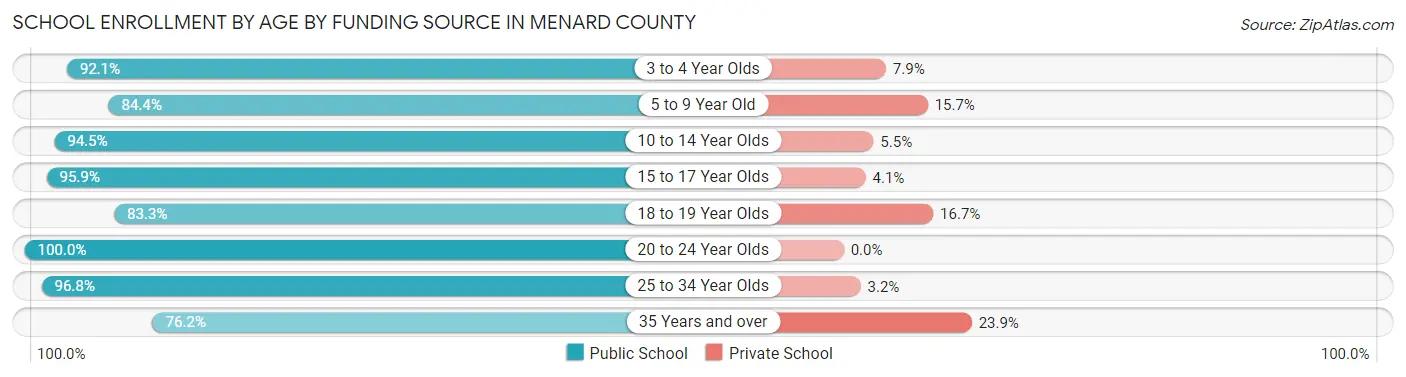
School Enrollment by Age by Funding Source in Menard County
Out of a total of 2,811 students who are enrolled in schools in Menard County, 267 (9.5%) attend a private institution, while the remaining 2,544 (90.5%) are enrolled in public schools. The age group of 35 years and over has the highest likelihood of being enrolled in private schools, with 26 (23.8% in the age bracket) enrolled. Conversely, the age group of 20 to 24 year olds has the lowest likelihood of being enrolled in a private school, with 156 (100.0% in the age bracket) attending a public institution.
| Age Bracket | Public School | Private School |
| 3 to 4 Year Olds | 117 (92.1%) | 10 (7.9%) |
| 5 to 9 Year Old | 744 (84.4%) | 138 (15.7%) |
| 10 to 14 Year Olds | 682 (94.5%) | 40 (5.5%) |
| 15 to 17 Year Olds | 469 (95.9%) | 20 (4.1%) |
| 18 to 19 Year Olds | 140 (83.3%) | 28 (16.7%) |
| 20 to 24 Year Olds | 156 (100.0%) | 0 (0.0%) |
| 25 to 34 Year Olds | 153 (96.8%) | 5 (3.2%) |
| 35 Years and over | 83 (76.1%) | 26 (23.8%) |
| Total | 2,544 (90.5%) | 267 (9.5%) |
Educational Attainment by Field of Study in Menard County
Education (598 | 24.9%), business (400 | 16.7%), science & technology (266 | 11.1%), bio, nature & agricultural (236 | 9.9%), and liberal arts & history (175 | 7.3%) are the most common fields of study among 2,397 individuals in Menard County who have obtained a bachelor's degree or higher.
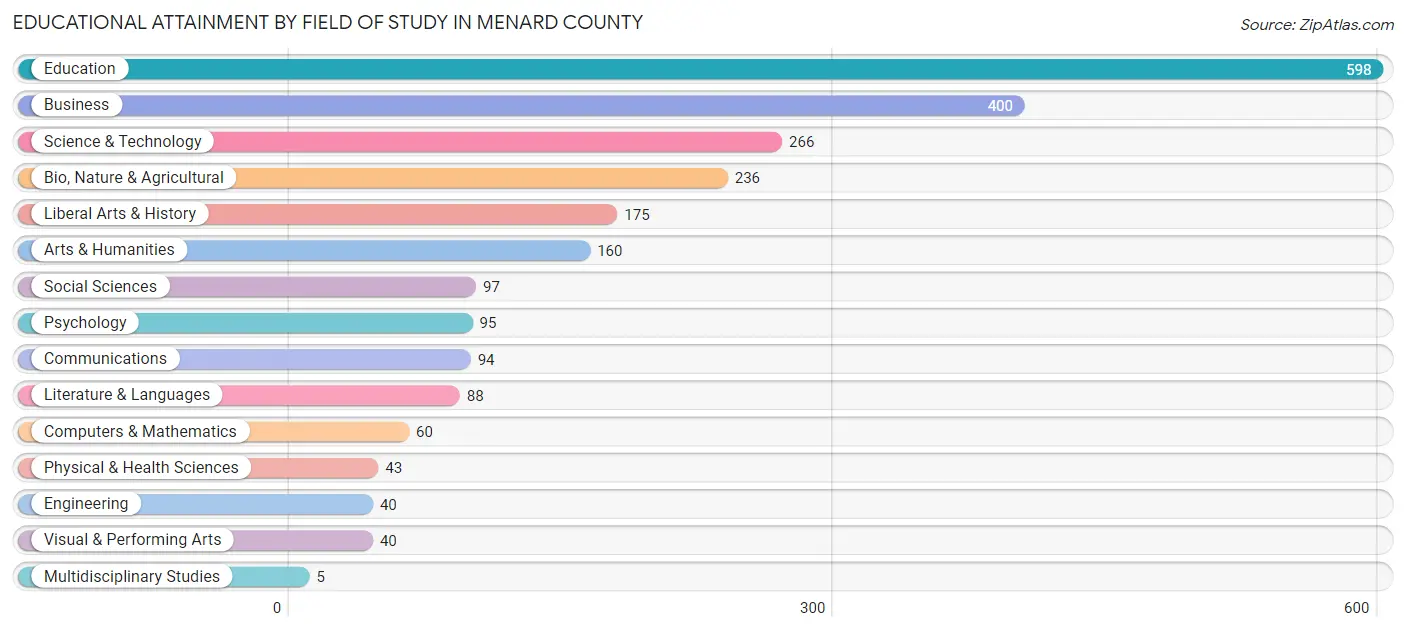
| Field of Study | # Graduates | % Graduates |
| Computers & Mathematics | 60 | 2.5% |
| Bio, Nature & Agricultural | 236 | 9.9% |
| Physical & Health Sciences | 43 | 1.8% |
| Psychology | 95 | 4.0% |
| Social Sciences | 97 | 4.1% |
| Engineering | 40 | 1.7% |
| Multidisciplinary Studies | 5 | 0.2% |
| Science & Technology | 266 | 11.1% |
| Business | 400 | 16.7% |
| Education | 598 | 24.9% |
| Literature & Languages | 88 | 3.7% |
| Liberal Arts & History | 175 | 7.3% |
| Visual & Performing Arts | 40 | 1.7% |
| Communications | 94 | 3.9% |
| Arts & Humanities | 160 | 6.7% |
| Total | 2,397 | 100.0% |
Transportation & Commute in Menard County
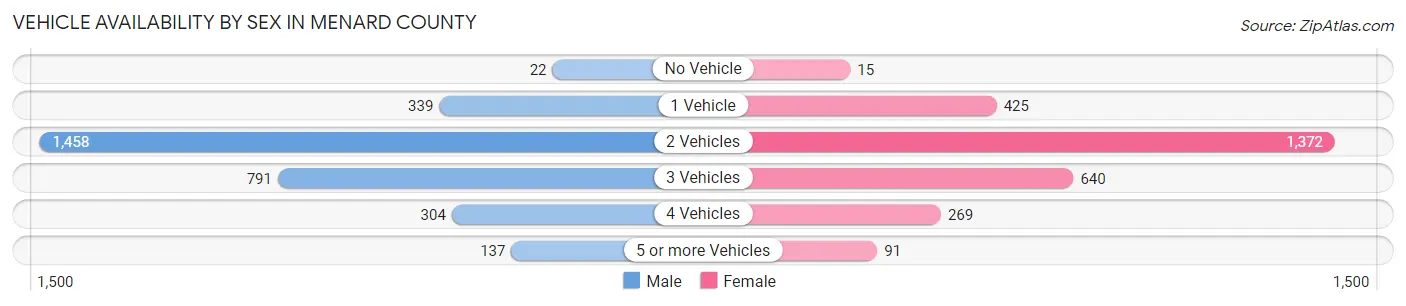
Vehicle Availability by Sex in Menard County
The most prevalent vehicle ownership categories in Menard County are males with 2 vehicles (1,458, accounting for 47.8%) and females with 2 vehicles (1,372, making up 51.8%).
| Vehicles Available | Male | Female |
| No Vehicle | 22 (0.7%) | 15 (0.5%) |
| 1 Vehicle | 339 (11.1%) | 425 (15.1%) |
| 2 Vehicles | 1,458 (47.8%) | 1,372 (48.8%) |
| 3 Vehicles | 791 (25.9%) | 640 (22.8%) |
| 4 Vehicles | 304 (10.0%) | 269 (9.6%) |
| 5 or more Vehicles | 137 (4.5%) | 91 (3.2%) |
| Total | 3,051 (100.0%) | 2,812 (100.0%) |
Commute Time in Menard County
The most frequently occuring commute durations in Menard County are 30 to 34 minutes (1,220 commuters, 22.4%), 25 to 29 minutes (720 commuters, 13.2%), and 20 to 24 minutes (655 commuters, 12.0%).
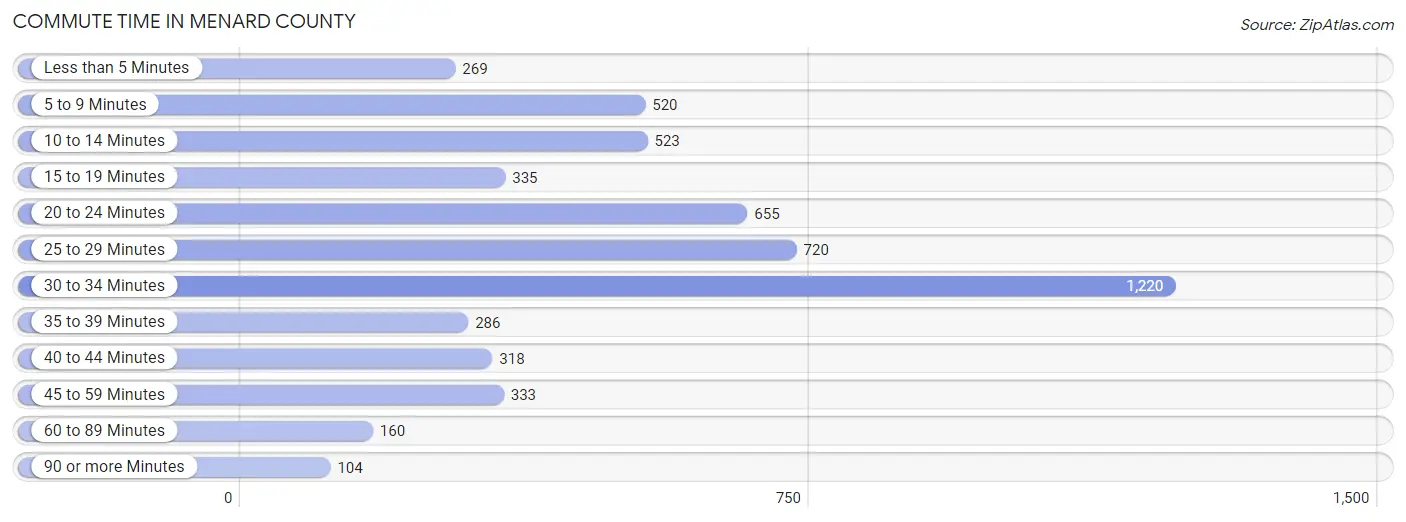
| Commute Time | # Commuters | % Commuters |
| Less than 5 Minutes | 269 | 4.9% |
| 5 to 9 Minutes | 520 | 9.6% |
| 10 to 14 Minutes | 523 | 9.6% |
| 15 to 19 Minutes | 335 | 6.1% |
| 20 to 24 Minutes | 655 | 12.0% |
| 25 to 29 Minutes | 720 | 13.2% |
| 30 to 34 Minutes | 1,220 | 22.4% |
| 35 to 39 Minutes | 286 | 5.2% |
| 40 to 44 Minutes | 318 | 5.8% |
| 45 to 59 Minutes | 333 | 6.1% |
| 60 to 89 Minutes | 160 | 2.9% |
| 90 or more Minutes | 104 | 1.9% |
Commute Time by Sex in Menard County
The most common commute times in Menard County are 30 to 34 minutes (669 commuters, 23.2%) for males and 30 to 34 minutes (551 commuters, 21.5%) for females.
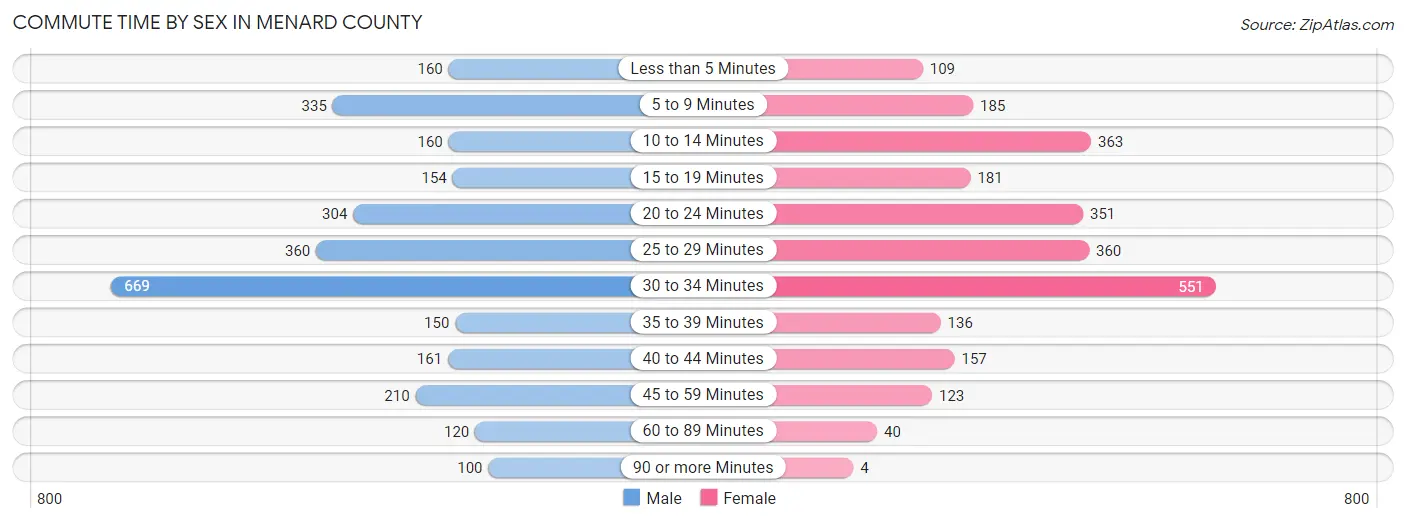
| Commute Time | Male | Female |
| Less than 5 Minutes | 160 (5.6%) | 109 (4.3%) |
| 5 to 9 Minutes | 335 (11.6%) | 185 (7.2%) |
| 10 to 14 Minutes | 160 (5.6%) | 363 (14.2%) |
| 15 to 19 Minutes | 154 (5.3%) | 181 (7.1%) |
| 20 to 24 Minutes | 304 (10.5%) | 351 (13.7%) |
| 25 to 29 Minutes | 360 (12.5%) | 360 (14.1%) |
| 30 to 34 Minutes | 669 (23.2%) | 551 (21.5%) |
| 35 to 39 Minutes | 150 (5.2%) | 136 (5.3%) |
| 40 to 44 Minutes | 161 (5.6%) | 157 (6.1%) |
| 45 to 59 Minutes | 210 (7.3%) | 123 (4.8%) |
| 60 to 89 Minutes | 120 (4.2%) | 40 (1.6%) |
| 90 or more Minutes | 100 (3.5%) | 4 (0.2%) |
Time of Departure to Work by Sex in Menard County
The most frequent times of departure to work in Menard County are 6:00 AM to 6:29 AM (440, 15.3%) for males and 7:00 AM to 7:29 AM (725, 28.3%) for females.
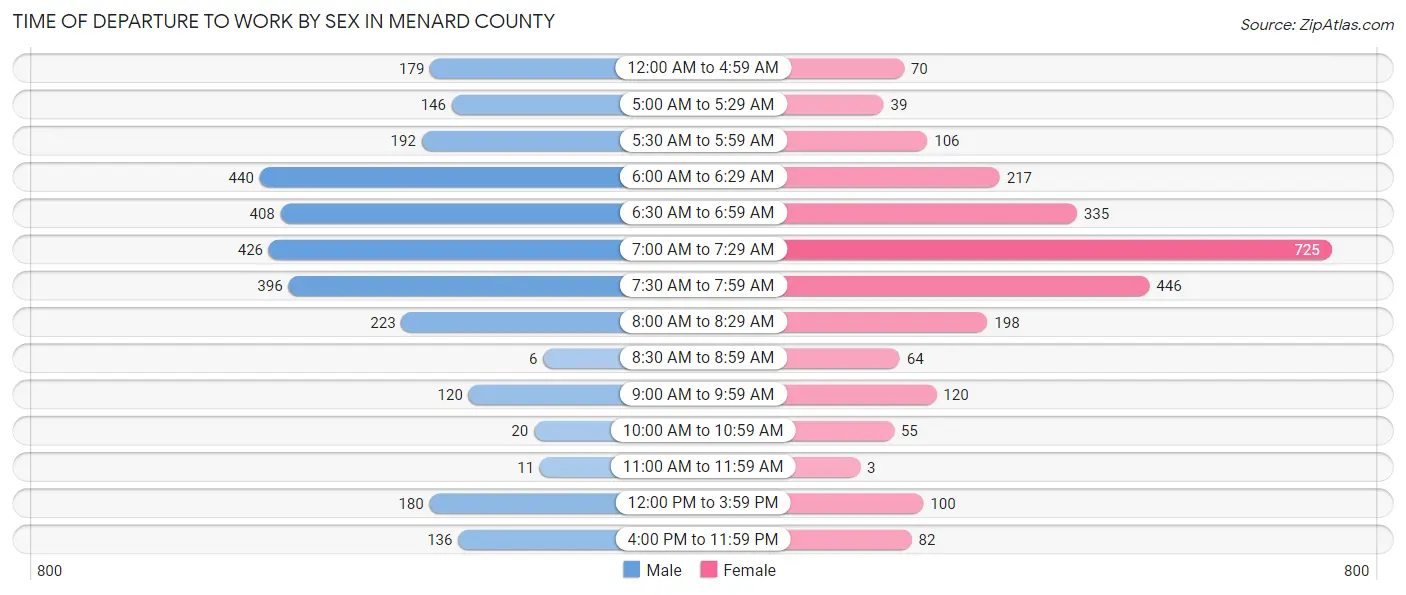
| Time of Departure | Male | Female |
| 12:00 AM to 4:59 AM | 179 (6.2%) | 70 (2.7%) |
| 5:00 AM to 5:29 AM | 146 (5.1%) | 39 (1.5%) |
| 5:30 AM to 5:59 AM | 192 (6.7%) | 106 (4.1%) |
| 6:00 AM to 6:29 AM | 440 (15.3%) | 217 (8.5%) |
| 6:30 AM to 6:59 AM | 408 (14.1%) | 335 (13.1%) |
| 7:00 AM to 7:29 AM | 426 (14.8%) | 725 (28.3%) |
| 7:30 AM to 7:59 AM | 396 (13.7%) | 446 (17.4%) |
| 8:00 AM to 8:29 AM | 223 (7.7%) | 198 (7.7%) |
| 8:30 AM to 8:59 AM | 6 (0.2%) | 64 (2.5%) |
| 9:00 AM to 9:59 AM | 120 (4.2%) | 120 (4.7%) |
| 10:00 AM to 10:59 AM | 20 (0.7%) | 55 (2.1%) |
| 11:00 AM to 11:59 AM | 11 (0.4%) | 3 (0.1%) |
| 12:00 PM to 3:59 PM | 180 (6.2%) | 100 (3.9%) |
| 4:00 PM to 11:59 PM | 136 (4.7%) | 82 (3.2%) |
| Total | 2,883 (100.0%) | 2,560 (100.0%) |
Housing Occupancy in Menard County
Occupancy by Ownership in Menard County
Of the total 5,085 dwellings in Menard County, owner-occupied units account for 4,050 (79.6%), while renter-occupied units make up 1,035 (20.3%).
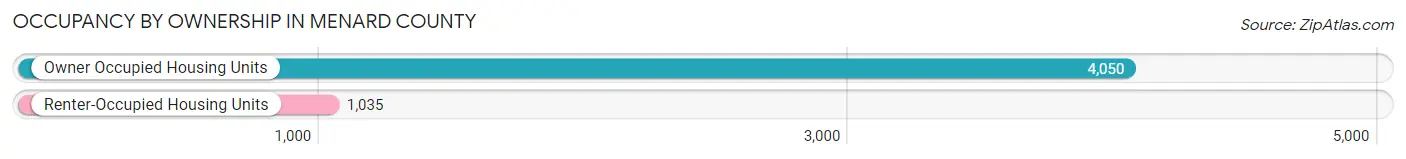
| Occupancy | # Housing Units | % Housing Units |
| Owner Occupied Housing Units | 4,050 | 79.6% |
| Renter-Occupied Housing Units | 1,035 | 20.3% |
| Total Occupied Housing Units | 5,085 | 100.0% |
Occupancy by Household Size in Menard County

| Household Size | # Housing Units | % Housing Units |
| 1-Person Household | 1,220 | 24.0% |
| 2-Person Household | 1,956 | 38.5% |
| 3-Person Household | 1,019 | 20.0% |
| 4+ Person Household | 890 | 17.5% |
| Total Housing Units | 5,085 | 100.0% |
Occupancy by Ownership by Household Size in Menard County
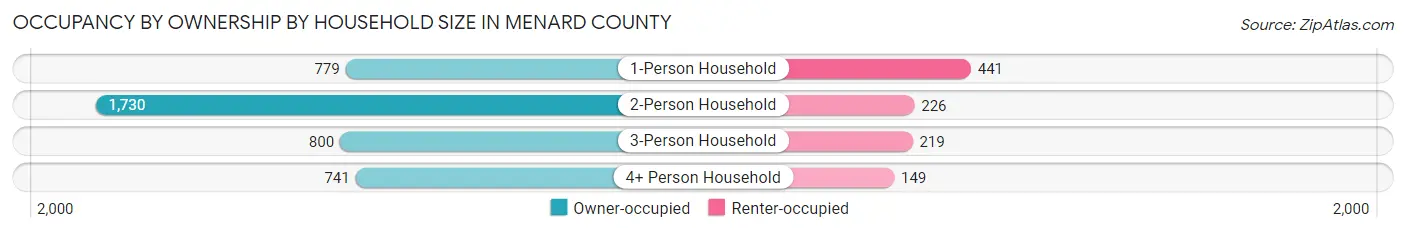
| Household Size | Owner-occupied | Renter-occupied |
| 1-Person Household | 779 (63.8%) | 441 (36.1%) |
| 2-Person Household | 1,730 (88.4%) | 226 (11.6%) |
| 3-Person Household | 800 (78.5%) | 219 (21.5%) |
| 4+ Person Household | 741 (83.3%) | 149 (16.7%) |
| Total Housing Units | 4,050 (79.6%) | 1,035 (20.3%) |
Occupancy by Educational Attainment in Menard County
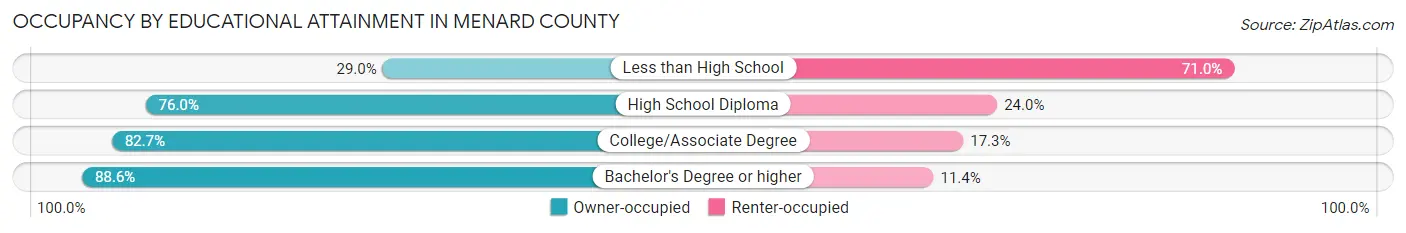
| Household Size | Owner-occupied | Renter-occupied |
| Less than High School | 72 (29.0%) | 176 (71.0%) |
| High School Diploma | 1,178 (76.0%) | 372 (24.0%) |
| College/Associate Degree | 1,585 (82.7%) | 331 (17.3%) |
| Bachelor's Degree or higher | 1,215 (88.6%) | 156 (11.4%) |
Occupancy by Age of Householder in Menard County
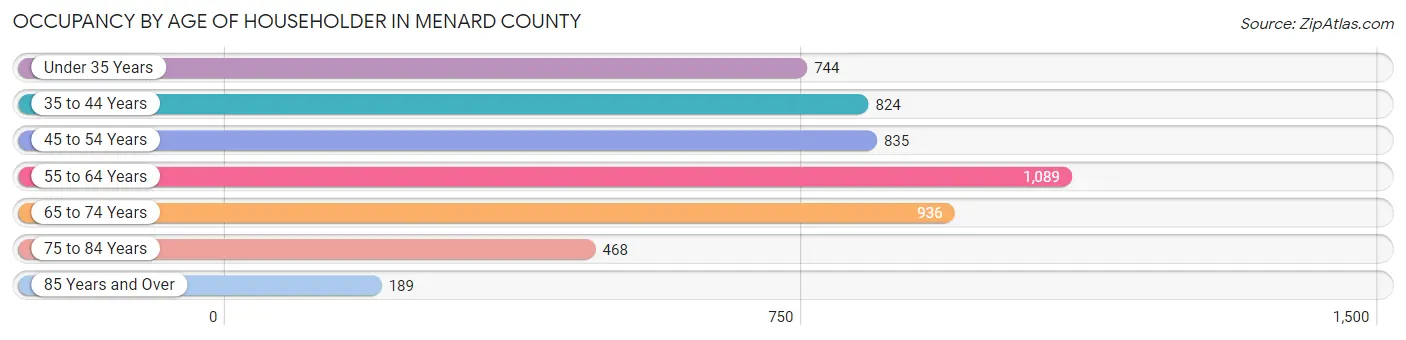
| Age Bracket | # Households | % Households |
| Under 35 Years | 744 | 14.6% |
| 35 to 44 Years | 824 | 16.2% |
| 45 to 54 Years | 835 | 16.4% |
| 55 to 64 Years | 1,089 | 21.4% |
| 65 to 74 Years | 936 | 18.4% |
| 75 to 84 Years | 468 | 9.2% |
| 85 Years and Over | 189 | 3.7% |
| Total | 5,085 | 100.0% |
Housing Finances in Menard County
Median Income by Occupancy in Menard County
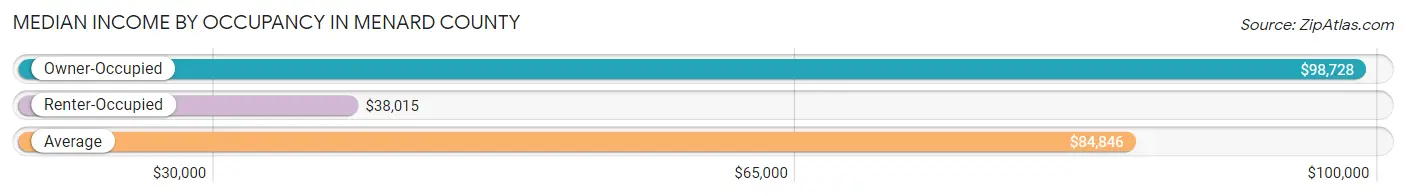
| Occupancy Type | # Households | Median Income |
| Owner-Occupied | 4,050 (79.6%) | $98,728 |
| Renter-Occupied | 1,035 (20.3%) | $38,015 |
| Average | 5,085 (100.0%) | $84,846 |
Occupancy by Householder Income Bracket in Menard County
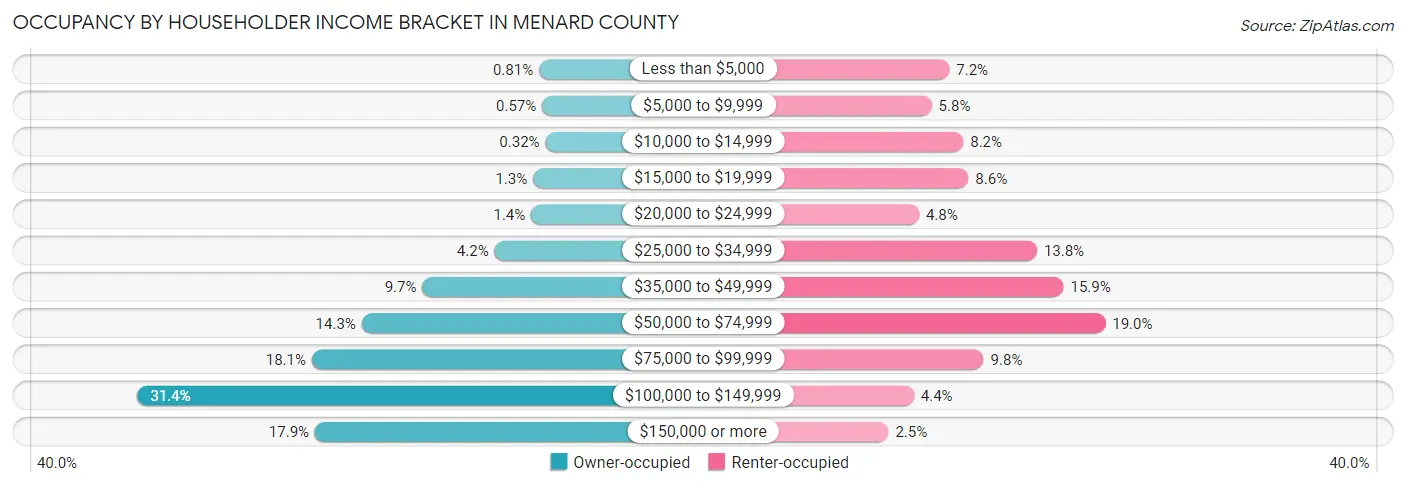
| Income Bracket | Owner-occupied | Renter-occupied |
| Less than $5,000 | 33 (0.8%) | 74 (7.1%) |
| $5,000 to $9,999 | 23 (0.6%) | 60 (5.8%) |
| $10,000 to $14,999 | 13 (0.3%) | 85 (8.2%) |
| $15,000 to $19,999 | 51 (1.3%) | 89 (8.6%) |
| $20,000 to $24,999 | 57 (1.4%) | 50 (4.8%) |
| $25,000 to $34,999 | 170 (4.2%) | 143 (13.8%) |
| $35,000 to $49,999 | 393 (9.7%) | 164 (15.9%) |
| $50,000 to $74,999 | 580 (14.3%) | 197 (19.0%) |
| $75,000 to $99,999 | 734 (18.1%) | 101 (9.8%) |
| $100,000 to $149,999 | 1,272 (31.4%) | 46 (4.4%) |
| $150,000 or more | 724 (17.9%) | 26 (2.5%) |
| Total | 4,050 (100.0%) | 1,035 (100.0%) |
Monthly Housing Cost Tiers in Menard County
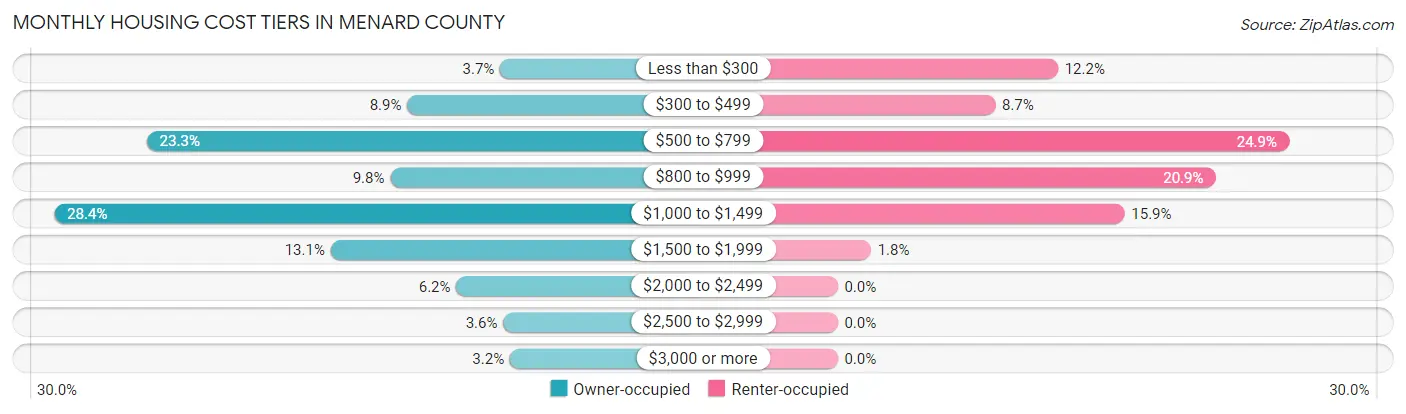
| Monthly Cost | Owner-occupied | Renter-occupied |
| Less than $300 | 151 (3.7%) | 126 (12.2%) |
| $300 to $499 | 359 (8.9%) | 90 (8.7%) |
| $500 to $799 | 942 (23.3%) | 258 (24.9%) |
| $800 to $999 | 397 (9.8%) | 216 (20.9%) |
| $1,000 to $1,499 | 1,149 (28.4%) | 164 (15.9%) |
| $1,500 to $1,999 | 530 (13.1%) | 19 (1.8%) |
| $2,000 to $2,499 | 249 (6.1%) | 0 (0.0%) |
| $2,500 to $2,999 | 144 (3.6%) | 0 (0.0%) |
| $3,000 or more | 129 (3.2%) | 0 (0.0%) |
| Total | 4,050 (100.0%) | 1,035 (100.0%) |
Physical Housing Characteristics in Menard County
Housing Structures in Menard County
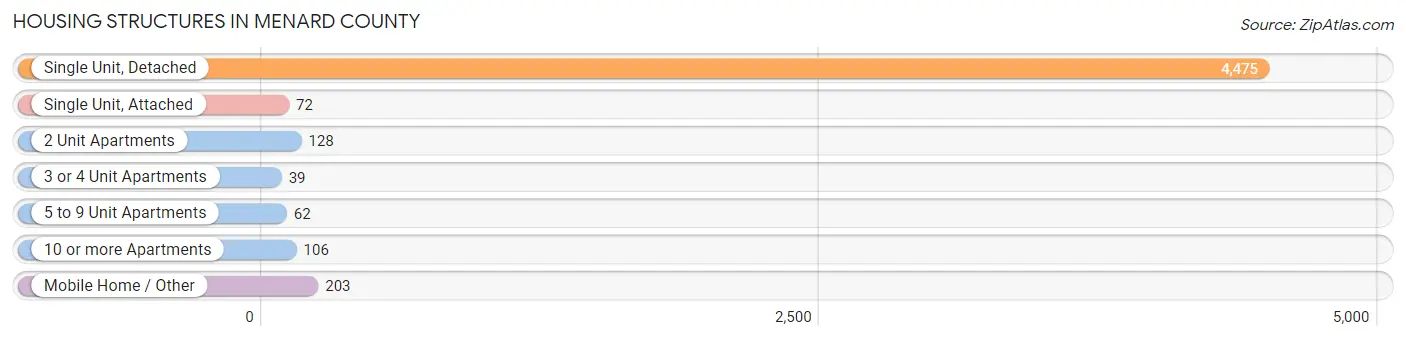
| Structure Type | # Housing Units | % Housing Units |
| Single Unit, Detached | 4,475 | 88.0% |
| Single Unit, Attached | 72 | 1.4% |
| 2 Unit Apartments | 128 | 2.5% |
| 3 or 4 Unit Apartments | 39 | 0.8% |
| 5 to 9 Unit Apartments | 62 | 1.2% |
| 10 or more Apartments | 106 | 2.1% |
| Mobile Home / Other | 203 | 4.0% |
| Total | 5,085 | 100.0% |
Housing Structures by Occupancy in Menard County
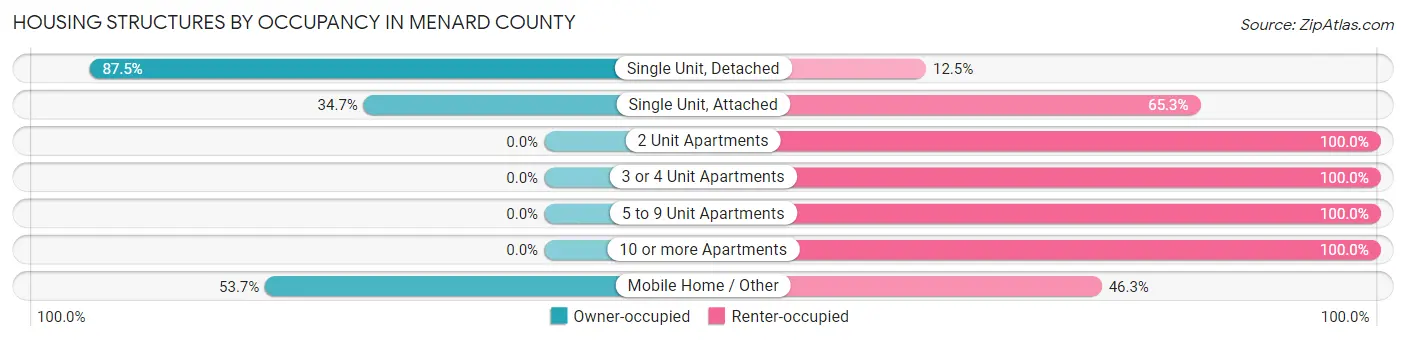
| Structure Type | Owner-occupied | Renter-occupied |
| Single Unit, Detached | 3,916 (87.5%) | 559 (12.5%) |
| Single Unit, Attached | 25 (34.7%) | 47 (65.3%) |
| 2 Unit Apartments | 0 (0.0%) | 128 (100.0%) |
| 3 or 4 Unit Apartments | 0 (0.0%) | 39 (100.0%) |
| 5 to 9 Unit Apartments | 0 (0.0%) | 62 (100.0%) |
| 10 or more Apartments | 0 (0.0%) | 106 (100.0%) |
| Mobile Home / Other | 109 (53.7%) | 94 (46.3%) |
| Total | 4,050 (79.6%) | 1,035 (20.3%) |
Housing Structures by Number of Rooms in Menard County
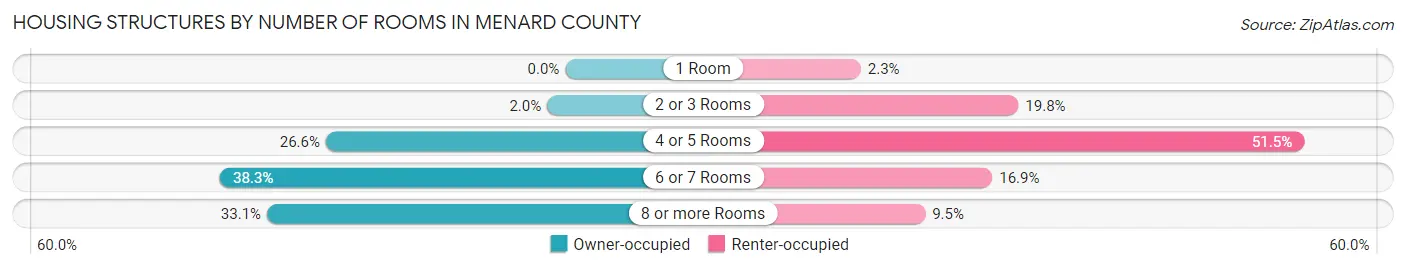
| Number of Rooms | Owner-occupied | Renter-occupied |
| 1 Room | 0 (0.0%) | 24 (2.3%) |
| 2 or 3 Rooms | 82 (2.0%) | 205 (19.8%) |
| 4 or 5 Rooms | 1,076 (26.6%) | 533 (51.5%) |
| 6 or 7 Rooms | 1,551 (38.3%) | 175 (16.9%) |
| 8 or more Rooms | 1,341 (33.1%) | 98 (9.5%) |
| Total | 4,050 (100.0%) | 1,035 (100.0%) |
Housing Structure by Heating Type in Menard County
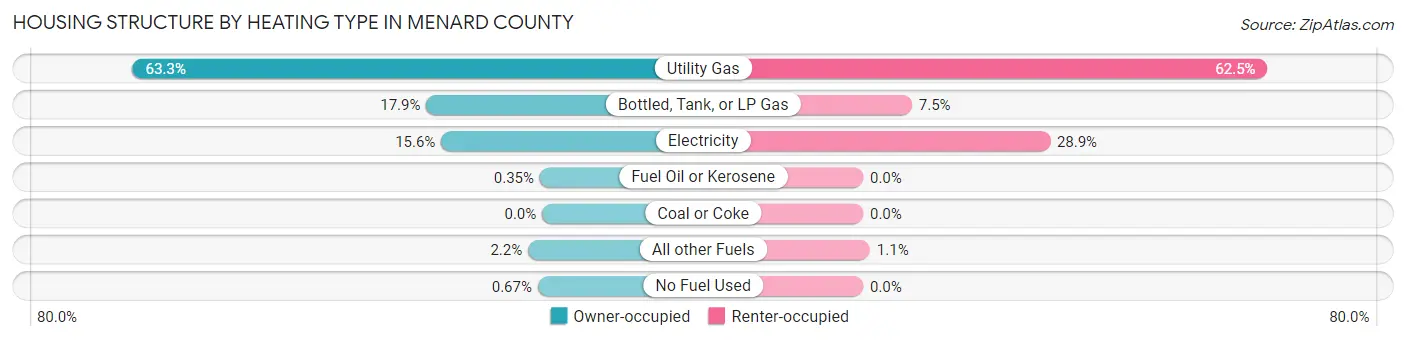
| Heating Type | Owner-occupied | Renter-occupied |
| Utility Gas | 2,564 (63.3%) | 647 (62.5%) |
| Bottled, Tank, or LP Gas | 725 (17.9%) | 78 (7.5%) |
| Electricity | 632 (15.6%) | 299 (28.9%) |
| Fuel Oil or Kerosene | 14 (0.4%) | 0 (0.0%) |
| Coal or Coke | 0 (0.0%) | 0 (0.0%) |
| All other Fuels | 88 (2.2%) | 11 (1.1%) |
| No Fuel Used | 27 (0.7%) | 0 (0.0%) |
| Total | 4,050 (100.0%) | 1,035 (100.0%) |
Household Vehicle Usage in Menard County
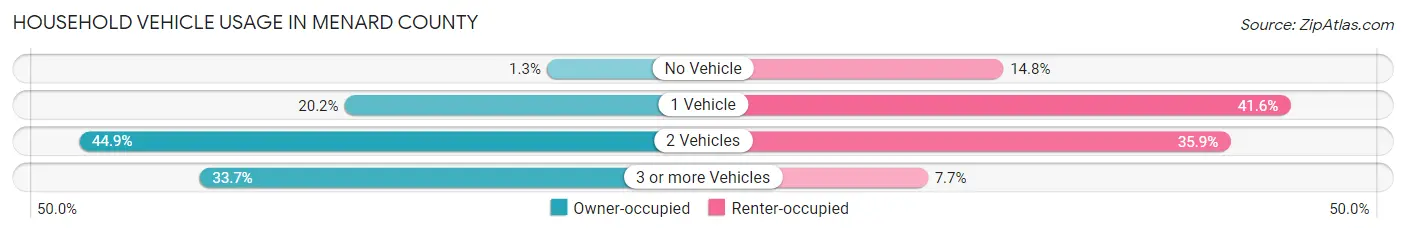
| Vehicles per Household | Owner-occupied | Renter-occupied |
| No Vehicle | 51 (1.3%) | 153 (14.8%) |
| 1 Vehicle | 816 (20.2%) | 430 (41.5%) |
| 2 Vehicles | 1,819 (44.9%) | 372 (35.9%) |
| 3 or more Vehicles | 1,364 (33.7%) | 80 (7.7%) |
| Total | 4,050 (100.0%) | 1,035 (100.0%) |
Real Estate & Mortgages in Menard County
Real Estate and Mortgage Overview in Menard County
| Characteristic | Without Mortgage | With Mortgage |
| Housing Units | 1,644 | 2,406 |
| Median Property Value | $160,900 | $185,600 |
| Median Household Income | $83,750 | $496 |
| Monthly Housing Costs | $615 | $123 |
| Real Estate Taxes | $2,717 | $33 |
Property Value by Mortgage Status in Menard County
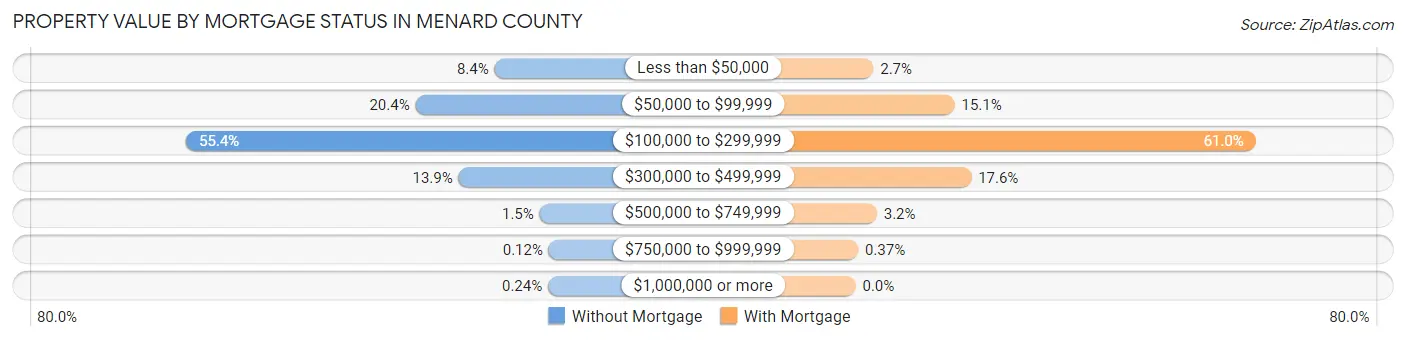
| Property Value | Without Mortgage | With Mortgage |
| Less than $50,000 | 138 (8.4%) | 65 (2.7%) |
| $50,000 to $99,999 | 336 (20.4%) | 363 (15.1%) |
| $100,000 to $299,999 | 911 (55.4%) | 1,467 (61.0%) |
| $300,000 to $499,999 | 228 (13.9%) | 424 (17.6%) |
| $500,000 to $749,999 | 25 (1.5%) | 78 (3.2%) |
| $750,000 to $999,999 | 2 (0.1%) | 9 (0.4%) |
| $1,000,000 or more | 4 (0.2%) | 0 (0.0%) |
| Total | 1,644 (100.0%) | 2,406 (100.0%) |
Household Income by Mortgage Status in Menard County
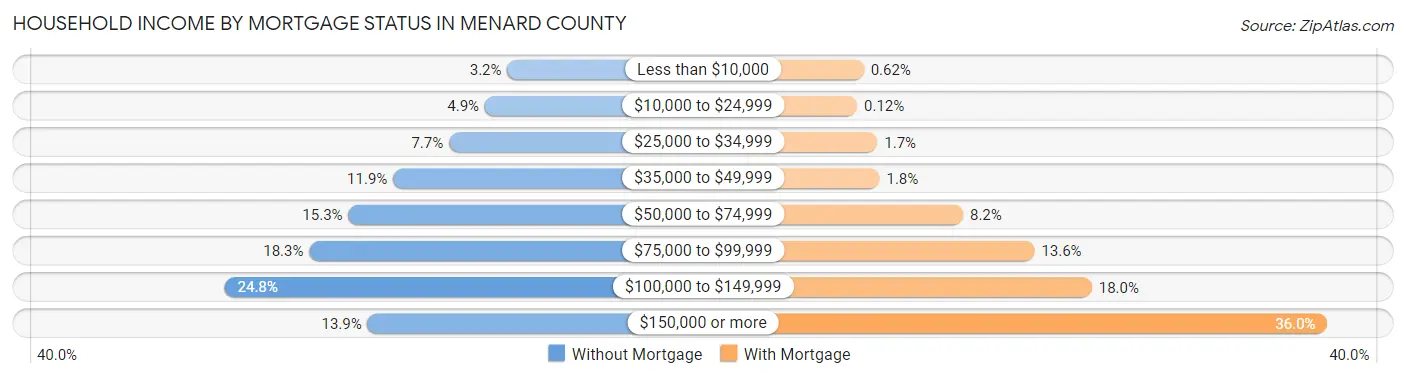
| Household Income | Without Mortgage | With Mortgage |
| Less than $10,000 | 53 (3.2%) | 15 (0.6%) |
| $10,000 to $24,999 | 81 (4.9%) | 3 (0.1%) |
| $25,000 to $34,999 | 126 (7.7%) | 40 (1.7%) |
| $35,000 to $49,999 | 196 (11.9%) | 44 (1.8%) |
| $50,000 to $74,999 | 252 (15.3%) | 197 (8.2%) |
| $75,000 to $99,999 | 301 (18.3%) | 328 (13.6%) |
| $100,000 to $149,999 | 407 (24.8%) | 433 (18.0%) |
| $150,000 or more | 228 (13.9%) | 865 (35.9%) |
| Total | 1,644 (100.0%) | 2,406 (100.0%) |
Property Value to Household Income Ratio in Menard County
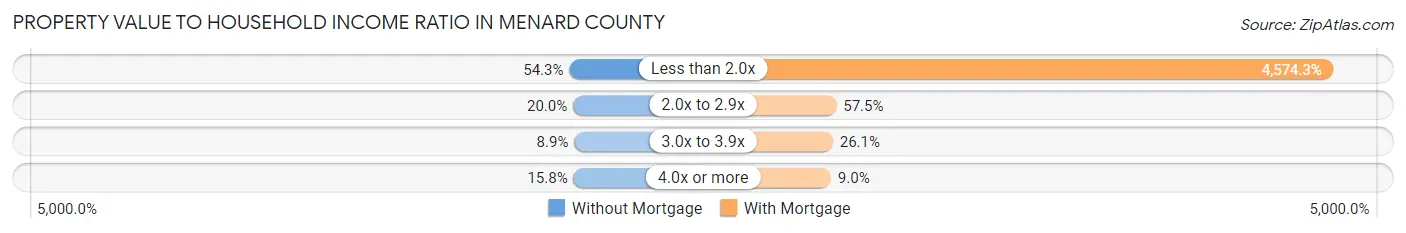
| Value-to-Income Ratio | Without Mortgage | With Mortgage |
| Less than 2.0x | 892 (54.3%) | 110,058 (4,574.3%) |
| 2.0x to 2.9x | 328 (20.0%) | 1,384 (57.5%) |
| 3.0x to 3.9x | 147 (8.9%) | 629 (26.1%) |
| 4.0x or more | 259 (15.8%) | 216 (9.0%) |
| Total | 1,644 (100.0%) | 2,406 (100.0%) |
Real Estate Taxes by Mortgage Status in Menard County
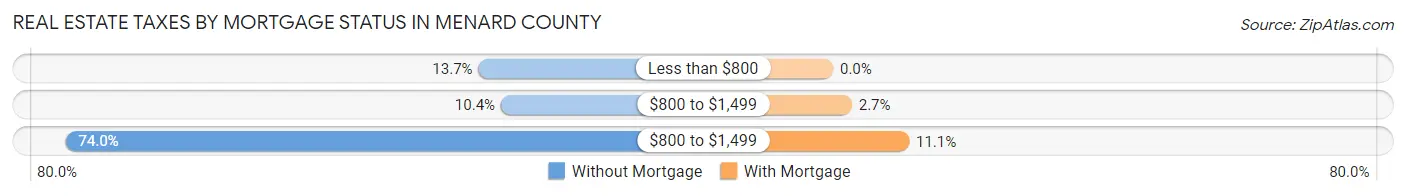
| Property Taxes | Without Mortgage | With Mortgage |
| Less than $800 | 225 (13.7%) | 0 (0.0%) |
| $800 to $1,499 | 171 (10.4%) | 66 (2.7%) |
| $800 to $1,499 | 1,217 (74.0%) | 267 (11.1%) |
| Total | 1,644 (100.0%) | 2,406 (100.0%) |
Health & Disability in Menard County
Health Insurance Coverage by Age in Menard County
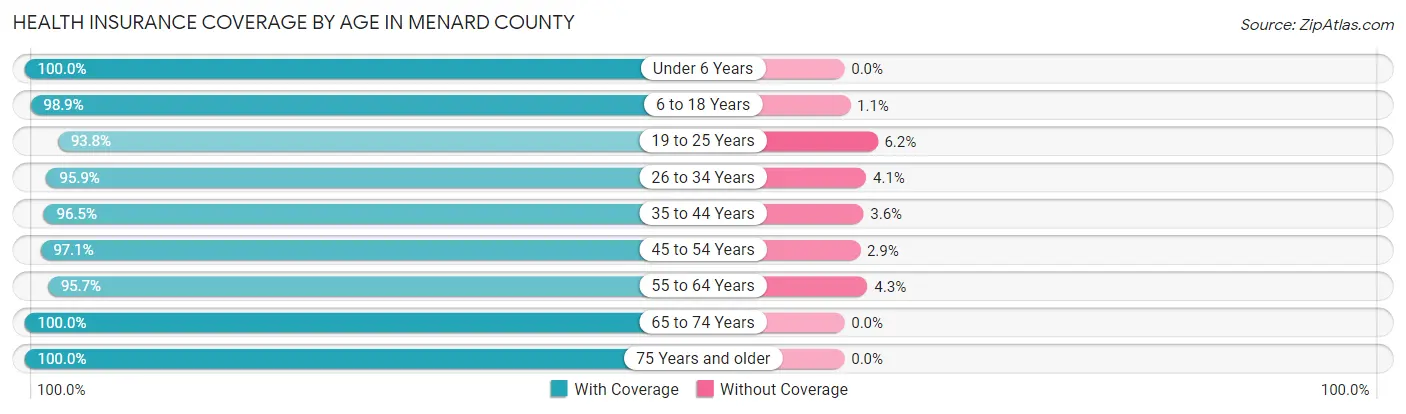
| Age Bracket | With Coverage | Without Coverage |
| Under 6 Years | 835 (100.0%) | 0 (0.0%) |
| 6 to 18 Years | 2,006 (98.9%) | 22 (1.1%) |
| 19 to 25 Years | 789 (93.8%) | 52 (6.2%) |
| 26 to 34 Years | 1,130 (95.9%) | 48 (4.1%) |
| 35 to 44 Years | 1,441 (96.5%) | 53 (3.5%) |
| 45 to 54 Years | 1,465 (97.1%) | 44 (2.9%) |
| 55 to 64 Years | 1,800 (95.7%) | 81 (4.3%) |
| 65 to 74 Years | 1,463 (100.0%) | 0 (0.0%) |
| 75 Years and older | 909 (100.0%) | 0 (0.0%) |
| Total | 11,838 (97.5%) | 300 (2.5%) |
Health Insurance Coverage by Citizenship Status in Menard County

| Citizenship Status | With Coverage | Without Coverage |
| Native Born | 835 (100.0%) | 0 (0.0%) |
| Foreign Born, Citizen | 2,006 (98.9%) | 22 (1.1%) |
| Foreign Born, not a Citizen | 789 (93.8%) | 52 (6.2%) |
Health Insurance Coverage by Household Income in Menard County
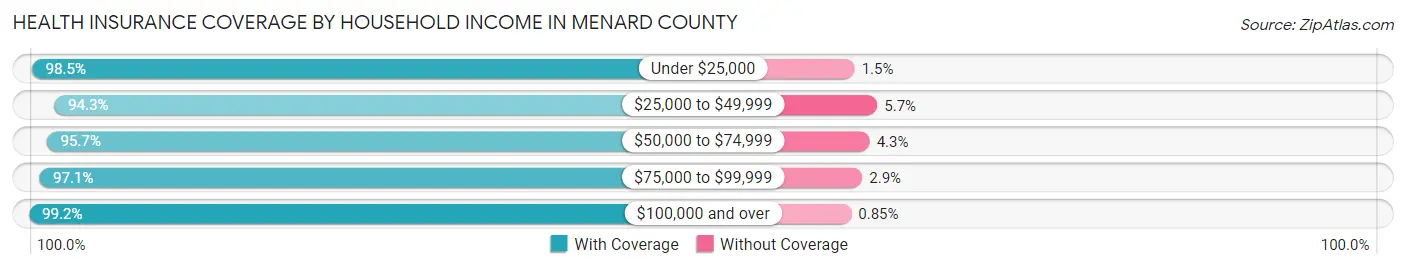
| Household Income | With Coverage | Without Coverage |
| Under $25,000 | 861 (98.5%) | 13 (1.5%) |
| $25,000 to $49,999 | 1,794 (94.3%) | 109 (5.7%) |
| $50,000 to $74,999 | 1,561 (95.7%) | 70 (4.3%) |
| $75,000 to $99,999 | 2,005 (97.1%) | 60 (2.9%) |
| $100,000 and over | 5,617 (99.2%) | 48 (0.9%) |
Public vs Private Health Insurance Coverage by Age in Menard County
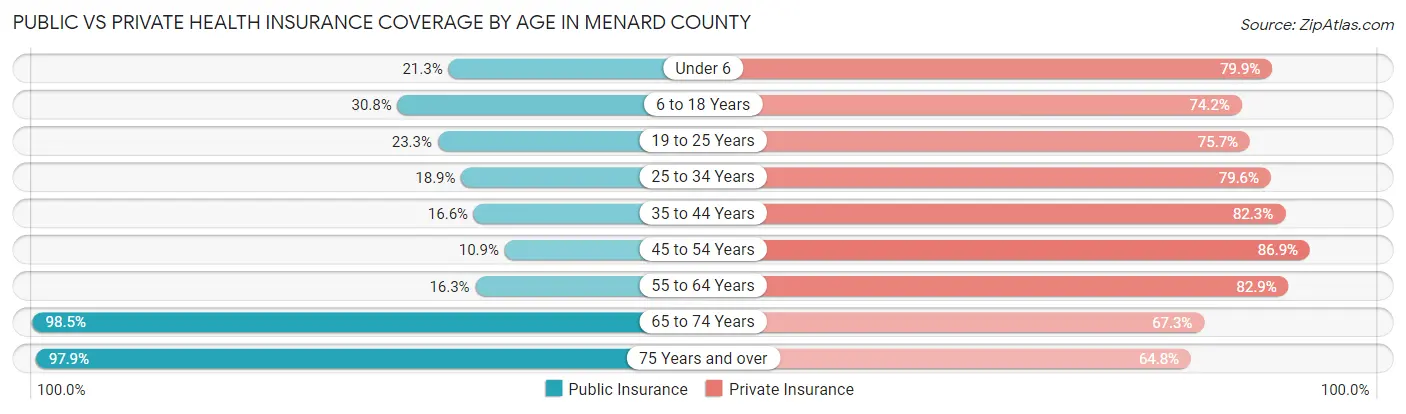
| Age Bracket | Public Insurance | Private Insurance |
| Under 6 | 178 (21.3%) | 667 (79.9%) |
| 6 to 18 Years | 624 (30.8%) | 1,505 (74.2%) |
| 19 to 25 Years | 196 (23.3%) | 637 (75.7%) |
| 25 to 34 Years | 223 (18.9%) | 938 (79.6%) |
| 35 to 44 Years | 248 (16.6%) | 1,229 (82.3%) |
| 45 to 54 Years | 164 (10.9%) | 1,311 (86.9%) |
| 55 to 64 Years | 307 (16.3%) | 1,560 (82.9%) |
| 65 to 74 Years | 1,441 (98.5%) | 984 (67.3%) |
| 75 Years and over | 890 (97.9%) | 589 (64.8%) |
| Total | 4,271 (35.2%) | 9,420 (77.6%) |
Disability Status by Sex by Age in Menard County

| Age Bracket | Male | Female |
| Under 5 Years | 1 (0.3%) | 14 (4.5%) |
| 5 to 17 Years | 113 (10.6%) | 125 (11.7%) |
| 18 to 34 Years | 123 (11.3%) | 144 (14.0%) |
| 35 to 64 Years | 336 (13.8%) | 331 (13.5%) |
| 65 to 74 Years | 85 (12.0%) | 119 (15.8%) |
| 75 Years and over | 241 (62.8%) | 257 (48.9%) |
Disability Class by Sex by Age in Menard County
Disability Class: Hearing Difficulty
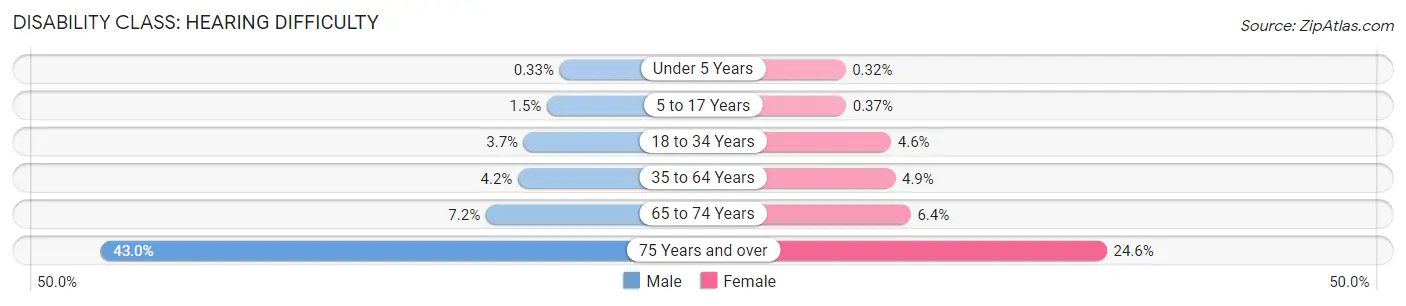
| Age Bracket | Male | Female |
| Under 5 Years | 1 (0.3%) | 1 (0.3%) |
| 5 to 17 Years | 16 (1.5%) | 4 (0.4%) |
| 18 to 34 Years | 40 (3.7%) | 47 (4.5%) |
| 35 to 64 Years | 102 (4.2%) | 121 (4.9%) |
| 65 to 74 Years | 51 (7.2%) | 48 (6.4%) |
| 75 Years and over | 165 (43.0%) | 129 (24.6%) |
Disability Class: Vision Difficulty
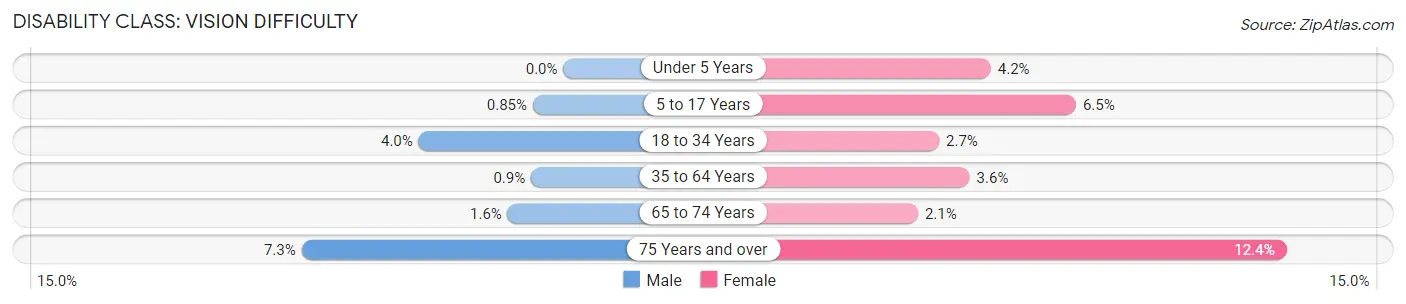
| Age Bracket | Male | Female |
| Under 5 Years | 0 (0.0%) | 13 (4.2%) |
| 5 to 17 Years | 9 (0.9%) | 70 (6.5%) |
| 18 to 34 Years | 44 (4.0%) | 28 (2.7%) |
| 35 to 64 Years | 22 (0.9%) | 87 (3.6%) |
| 65 to 74 Years | 11 (1.5%) | 16 (2.1%) |
| 75 Years and over | 28 (7.3%) | 65 (12.4%) |
Disability Class: Cognitive Difficulty
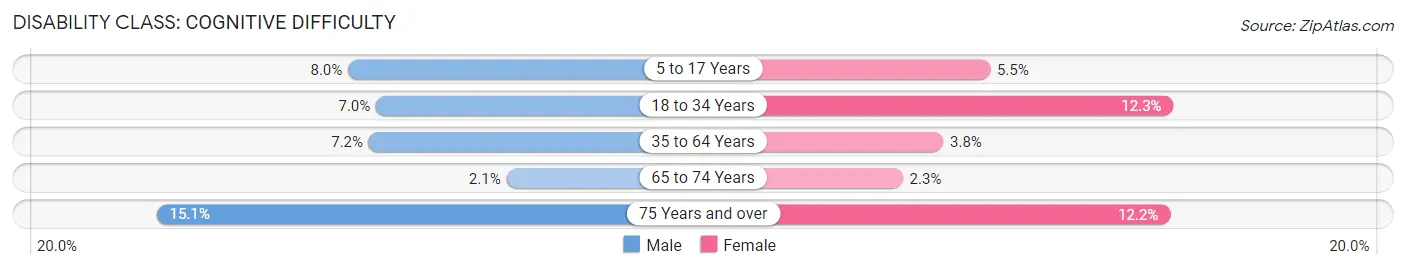
| Age Bracket | Male | Female |
| 5 to 17 Years | 85 (8.0%) | 59 (5.5%) |
| 18 to 34 Years | 76 (7.0%) | 127 (12.3%) |
| 35 to 64 Years | 176 (7.2%) | 92 (3.8%) |
| 65 to 74 Years | 15 (2.1%) | 17 (2.3%) |
| 75 Years and over | 58 (15.1%) | 64 (12.2%) |
Disability Class: Ambulatory Difficulty
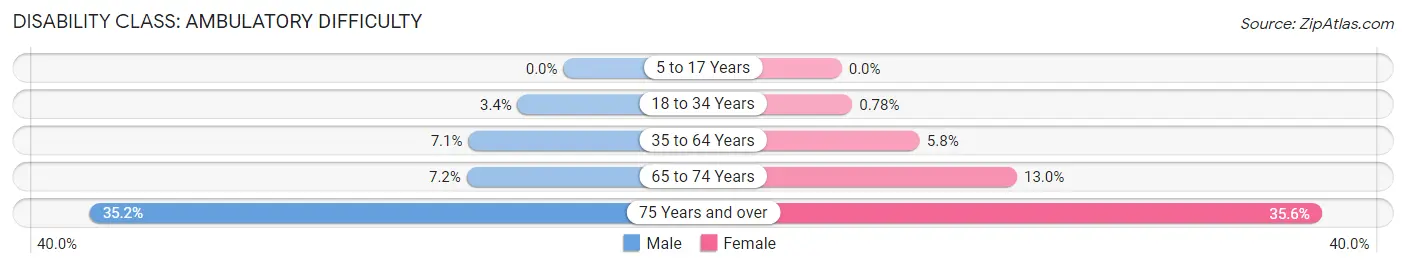
| Age Bracket | Male | Female |
| 5 to 17 Years | 0 (0.0%) | 0 (0.0%) |
| 18 to 34 Years | 37 (3.4%) | 8 (0.8%) |
| 35 to 64 Years | 172 (7.1%) | 142 (5.8%) |
| 65 to 74 Years | 51 (7.2%) | 98 (13.0%) |
| 75 Years and over | 135 (35.2%) | 187 (35.6%) |
Disability Class: Self-Care Difficulty

| Age Bracket | Male | Female |
| 5 to 17 Years | 19 (1.8%) | 10 (0.9%) |
| 18 to 34 Years | 29 (2.6%) | 3 (0.3%) |
| 35 to 64 Years | 63 (2.6%) | 47 (1.9%) |
| 65 to 74 Years | 4 (0.6%) | 21 (2.8%) |
| 75 Years and over | 38 (9.9%) | 76 (14.5%) |
Technology Access in Menard County
Computing Device Access in Menard County
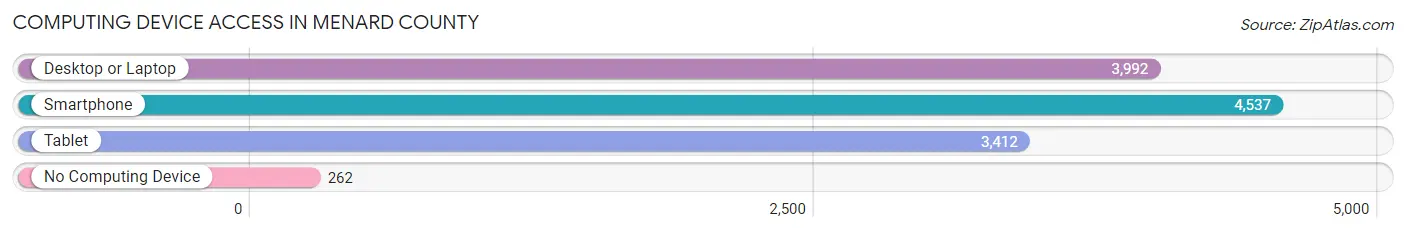
| Device Type | # Households | % Households |
| Desktop or Laptop | 3,992 | 78.5% |
| Smartphone | 4,537 | 89.2% |
| Tablet | 3,412 | 67.1% |
| No Computing Device | 262 | 5.1% |
| Total | 5,085 | 100.0% |
Internet Access in Menard County
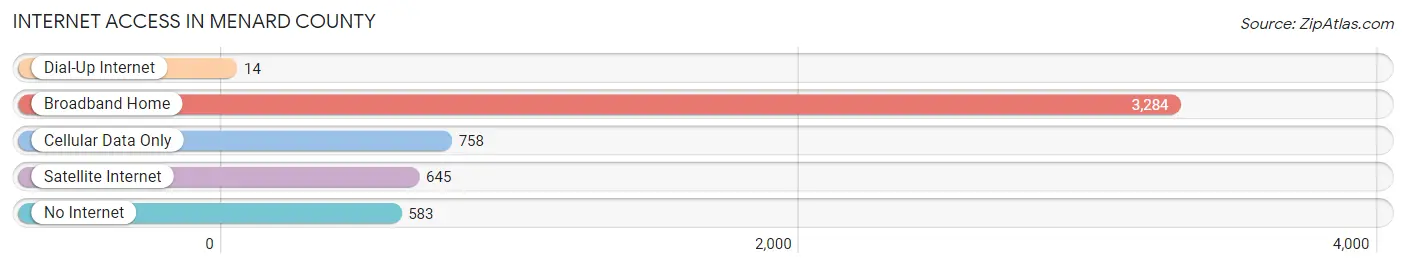
| Internet Type | # Households | % Households |
| Dial-Up Internet | 14 | 0.3% |
| Broadband Home | 3,284 | 64.6% |
| Cellular Data Only | 758 | 14.9% |
| Satellite Internet | 645 | 12.7% |
| No Internet | 583 | 11.5% |
| Total | 5,085 | 100.0% |
Menard County Summary
Menard County is located in the central part of the state of Illinois, in the United States. It is part of the Springfield Metropolitan Statistical Area and is bordered by Sangamon County to the north, Logan County to the east, Mason County to the south, and Tazewell County to the west. The county seat is Petersburg, and the largest city is Athens.
History
Menard County was formed in 1839 from Sangamon County. It was named after Pierre Menard, the first lieutenant governor of Illinois. The county was originally settled by French and American settlers, and the first county seat was located in Petersburg.
In the late 19th century, the county experienced a period of growth and development, with the construction of the Illinois Central Railroad and the development of the coal mining industry. The county also saw the development of the agricultural industry, with the introduction of new crops such as corn, wheat, and oats.
Geography
Menard County covers an area of 576 square miles, with a population of 12,845 people as of the 2010 census. The county is located in the central part of the state, and is bordered by Sangamon County to the north, Logan County to the east, Mason County to the south, and Tazewell County to the west. The county seat is Petersburg, and the largest city is Athens.
The county is mostly flat, with some rolling hills in the northern and western parts. The Sangamon River runs through the county, and there are several small lakes and ponds scattered throughout the area. The climate is generally temperate, with hot summers and cold winters.
Economy
Menard County’s economy is largely based on agriculture, with corn, wheat, and oats being the main crops. The county also has a strong manufacturing sector, with several factories producing a variety of products, including furniture, clothing, and automotive parts.
The county is also home to several large employers, including the Illinois Department of Corrections, the Illinois State Police, and the University of Illinois at Springfield. The county also has a strong tourism industry, with several popular attractions, such as the Lincoln Home National Historic Site, the Lincoln Tomb State Historic Site, and the Lincoln-Herndon Law Offices State Historic Site.
Demographics
As of the 2010 census, Menard County had a population of 12,845 people. The racial makeup of the county was 95.3% White, 1.2% African American, 0.4% Native American, 0.3% Asian, 0.1% Pacific Islander, 1.3% from other races, and 1.4% from two or more races. Hispanic or Latino of any race were 3.2% of the population.
The median income for a household in the county was $45,945, and the median income for a family was $54,945. The per capita income for the county was $21,945. About 10.3% of families and 13.2% of the population were below the poverty line, including 17.2% of those under age 18 and 8.2% of those age 65 or over.
Common Questions
What is the Total Population of Menard County?
Total Population of Menard County is 12,284.
What is the Total Male Population of Menard County?
Total Male Population of Menard County is 6,051.
What is the Total Female Population of Menard County?
Total Female Population of Menard County is 6,233.
What is the Ratio of Males per 100 Females in Menard County?
There are 97.08 Males per 100 Females in Menard County.
What is the Ratio of Females per 100 Males in Menard County?
There are 103.01 Females per 100 Males in Menard County.
What is the Median Population Age in Menard County?
Median Population Age in Menard County is 42.8 Years.
What is the Average Family Size in Menard County
Average Family Size in Menard County is 2.8 People.
What is the Average Household Size in Menard County
Average Household Size in Menard County is 2.4 People.
What is Per Capita Income in Menard County?
Per Capita income in Menard County is $41,497.
What is the Median Family Income in Menard County?
Median Family Income in Menard County is $97,125.
What is the Median Household income in Menard County?
Median Household Income in Menard County is $84,846.
What is Income or Wage Gap in Menard County?
Income or Wage Gap in Menard County is 23.3%.
Women in Menard County earn 76.7 cents for every dollar earned by a man.
What is Inequality or Gini Index in Menard County?
Inequality or Gini Index in Menard County is 0.40.
How Large is the Labor Force in Menard County?
There are 6,214 People in the Labor Forcein in Menard County.
What is the Percentage of People in the Labor Force in Menard County?
63.1% of People are in the Labor Force in Menard County.
What is the Unemployment Rate in Menard County?
Unemployment Rate in Menard County is 4.9%.