McLean County, IL
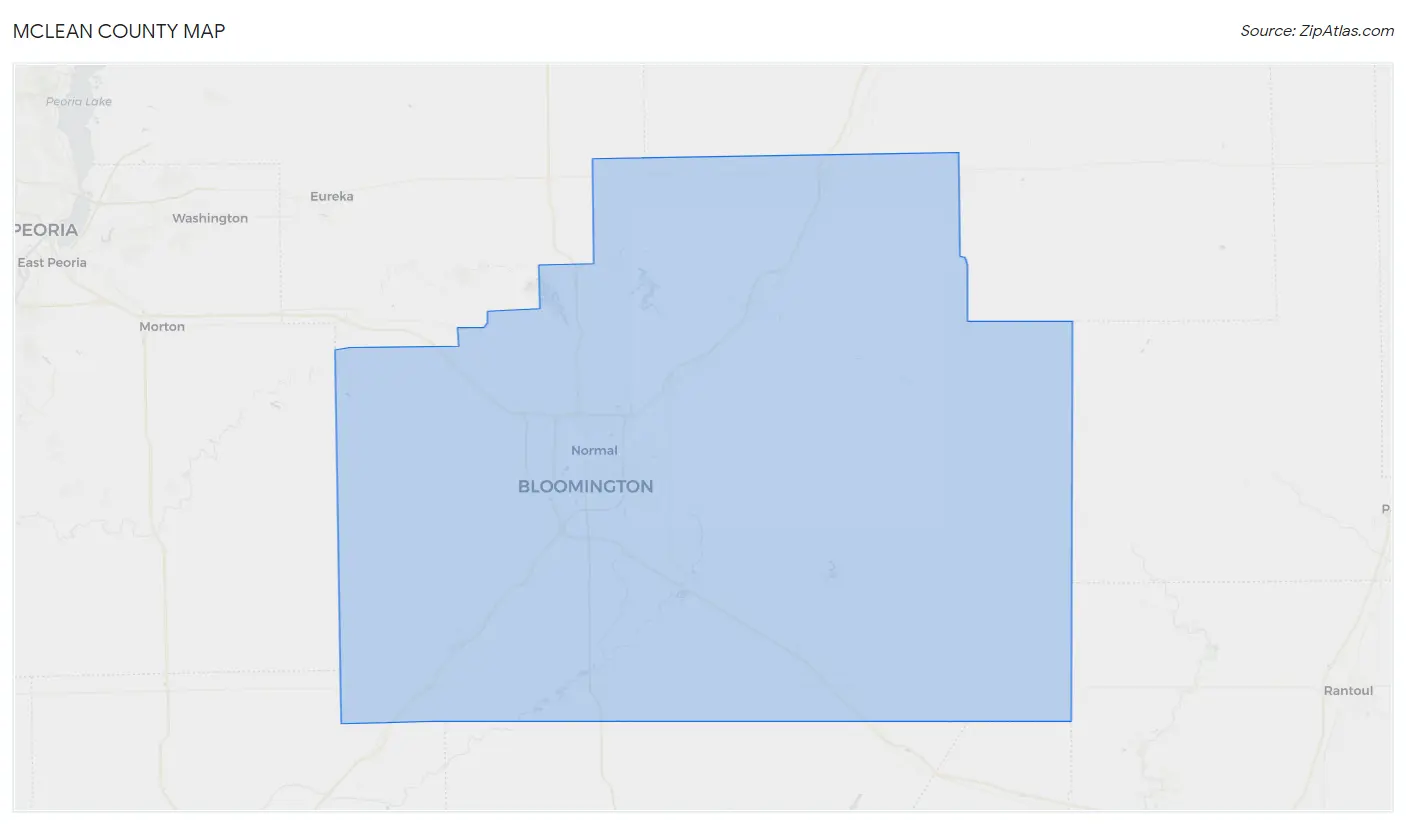
McLean County Map
McLean County Overview
171,284
TOTAL POPULATION
83,922
MALE POPULATION
87,362
FEMALE POPULATION
96.06
MALES / 100 FEMALES
104.10
FEMALES / 100 MALES
34.0
MEDIAN AGE
3.0
AVG FAMILY SIZE
2.4
AVG HOUSEHOLD SIZE
$40,252
PER CAPITA INCOME
$105,528
AVG FAMILY INCOME
$75,356
AVG HOUSEHOLD INCOME
35.4%
WAGE / INCOME GAP [ % ]
64.6¢/ $1
WAGE / INCOME GAP [ $ ]
$12,319
FAMILY INCOME DEFICIT
0.48
INEQUALITY / GINI INDEX
88,779
LABOR FORCE [ PEOPLE ]
63.9%
PERCENT IN LABOR FORCE
3.2%
UNEMPLOYMENT RATE
Race in McLean County
The most populous races in McLean County are White / Caucasian (138,660 | 80.9%), Black / African American (14,542 | 8.5%), and Hispanic or Latino (9,103 | 5.3%).
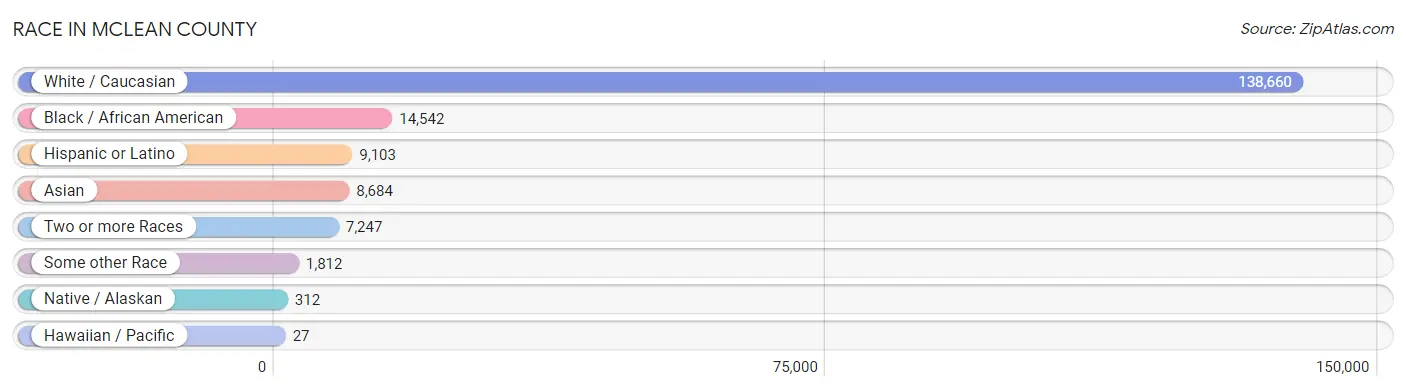
| Race | # Population | % Population |
| Asian | 8,684 | 5.1% |
| Black / African American | 14,542 | 8.5% |
| Hawaiian / Pacific | 27 | 0.0% |
| Hispanic or Latino | 9,103 | 5.3% |
| Native / Alaskan | 312 | 0.2% |
| White / Caucasian | 138,660 | 80.9% |
| Two or more Races | 7,247 | 4.2% |
| Some other Race | 1,812 | 1.1% |
| Total | 171,284 | 100.0% |
Ancestry in McLean County
The most populous ancestries reported in McLean County are German (44,958 | 26.3%), Irish (26,153 | 15.3%), English (19,552 | 11.4%), American (7,260 | 4.2%), and Mexican (6,513 | 3.8%), together accounting for 61.0% of all McLean County residents.
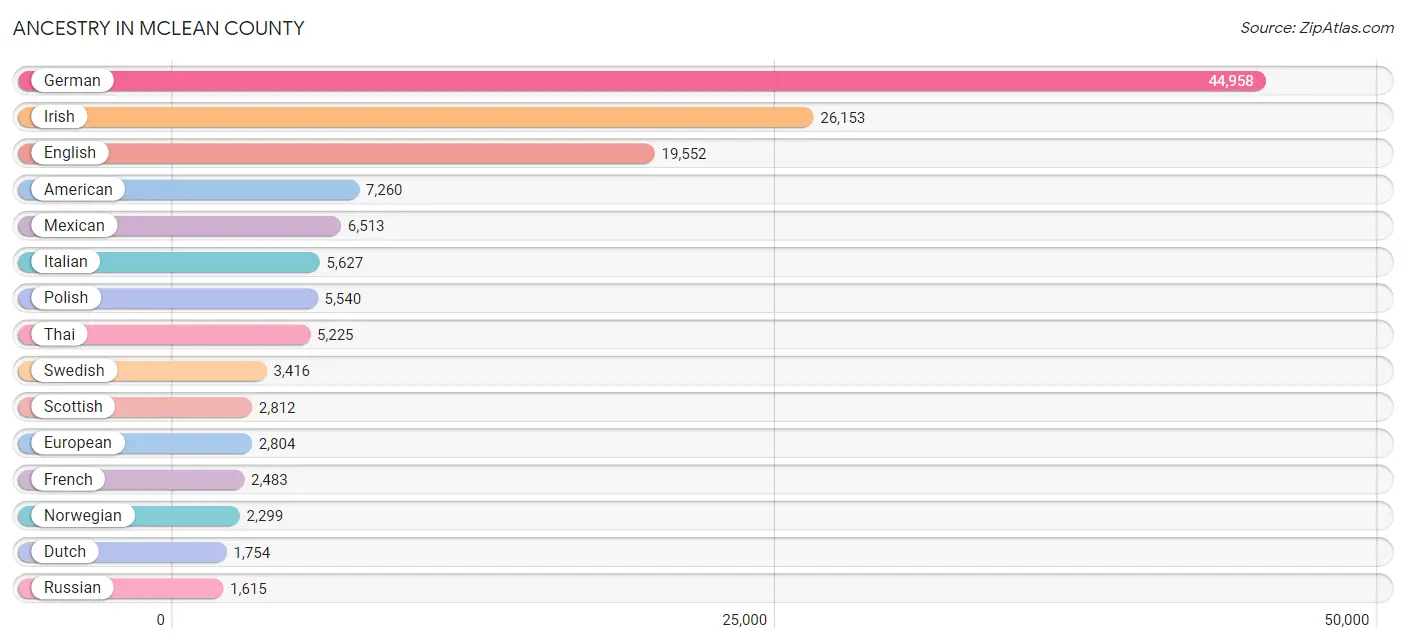
| Ancestry | # Population | % Population |
| African | 734 | 0.4% |
| Albanian | 13 | 0.0% |
| Alsatian | 8 | 0.0% |
| American | 7,260 | 4.2% |
| Arab | 808 | 0.5% |
| Arapaho | 12 | 0.0% |
| Argentinean | 24 | 0.0% |
| Australian | 35 | 0.0% |
| Austrian | 258 | 0.2% |
| Barbadian | 3 | 0.0% |
| Basque | 7 | 0.0% |
| Belgian | 385 | 0.2% |
| Belizean | 29 | 0.0% |
| Bhutanese | 399 | 0.2% |
| Blackfeet | 87 | 0.1% |
| Bolivian | 75 | 0.0% |
| Brazilian | 37 | 0.0% |
| British | 720 | 0.4% |
| Burmese | 710 | 0.4% |
| Cajun | 17 | 0.0% |
| Canadian | 161 | 0.1% |
| Cape Verdean | 12 | 0.0% |
| Celtic | 20 | 0.0% |
| Central American | 460 | 0.3% |
| Central American Indian | 90 | 0.1% |
| Cherokee | 207 | 0.1% |
| Cheyenne | 7 | 0.0% |
| Chilean | 20 | 0.0% |
| Choctaw | 27 | 0.0% |
| Colombian | 151 | 0.1% |
| Costa Rican | 57 | 0.0% |
| Croatian | 261 | 0.2% |
| Cuban | 225 | 0.1% |
| Cypriot | 7 | 0.0% |
| Czech | 573 | 0.3% |
| Czechoslovakian | 161 | 0.1% |
| Danish | 908 | 0.5% |
| Dominican | 48 | 0.0% |
| Dutch | 1,754 | 1.0% |
| Dutch West Indian | 7 | 0.0% |
| Eastern European | 301 | 0.2% |
| Ecuadorian | 9 | 0.0% |
| Egyptian | 28 | 0.0% |
| English | 19,552 | 11.4% |
| Estonian | 20 | 0.0% |
| Ethiopian | 99 | 0.1% |
| European | 2,804 | 1.6% |
| Filipino | 39 | 0.0% |
| Finnish | 82 | 0.1% |
| French | 2,483 | 1.5% |
| French Canadian | 438 | 0.3% |
| German | 44,958 | 26.3% |
| German Russian | 40 | 0.0% |
| Greek | 425 | 0.3% |
| Guatemalan | 208 | 0.1% |
| Guyanese | 35 | 0.0% |
| Haitian | 25 | 0.0% |
| Honduran | 71 | 0.0% |
| Hungarian | 484 | 0.3% |
| Icelander | 7 | 0.0% |
| Indian (Asian) | 1,517 | 0.9% |
| Indonesian | 308 | 0.2% |
| Inupiat | 3 | 0.0% |
| Iranian | 74 | 0.0% |
| Irish | 26,153 | 15.3% |
| Iroquois | 21 | 0.0% |
| Israeli | 1 | 0.0% |
| Italian | 5,627 | 3.3% |
| Jamaican | 220 | 0.1% |
| Jordanian | 79 | 0.1% |
| Kenyan | 23 | 0.0% |
| Korean | 996 | 0.6% |
| Laotian | 31 | 0.0% |
| Latvian | 35 | 0.0% |
| Lebanese | 146 | 0.1% |
| Lithuanian | 239 | 0.1% |
| Luxembourger | 41 | 0.0% |
| Macedonian | 25 | 0.0% |
| Malaysian | 40 | 0.0% |
| Mexican | 6,513 | 3.8% |
| Mexican American Indian | 61 | 0.0% |
| Moroccan | 125 | 0.1% |
| Native Hawaiian | 89 | 0.1% |
| Navajo | 12 | 0.0% |
| Nicaraguan | 4 | 0.0% |
| Nigerian | 198 | 0.1% |
| Northern European | 350 | 0.2% |
| Norwegian | 2,299 | 1.3% |
| Pakistani | 55 | 0.0% |
| Palestinian | 119 | 0.1% |
| Pennsylvania German | 59 | 0.0% |
| Peruvian | 115 | 0.1% |
| Polish | 5,540 | 3.2% |
| Portuguese | 120 | 0.1% |
| Puerto Rican | 585 | 0.3% |
| Romanian | 75 | 0.0% |
| Russian | 1,615 | 0.9% |
| Salvadoran | 120 | 0.1% |
| Samoan | 8 | 0.0% |
| Scandinavian | 438 | 0.3% |
| Scotch-Irish | 1,186 | 0.7% |
| Scottish | 2,812 | 1.6% |
| Senegalese | 15 | 0.0% |
| Serbian | 90 | 0.1% |
| Sioux | 30 | 0.0% |
| Slavic | 98 | 0.1% |
| Slovak | 232 | 0.1% |
| Slovene | 131 | 0.1% |
| South African | 11 | 0.0% |
| South American | 603 | 0.4% |
| Spaniard | 124 | 0.1% |
| Spanish | 120 | 0.1% |
| Spanish American | 10 | 0.0% |
| Sri Lankan | 560 | 0.3% |
| Subsaharan African | 1,602 | 0.9% |
| Swedish | 3,416 | 2.0% |
| Swiss | 564 | 0.3% |
| Syrian | 5 | 0.0% |
| Thai | 5,225 | 3.0% |
| Tongan | 18 | 0.0% |
| Trinidadian and Tobagonian | 2 | 0.0% |
| Turkish | 174 | 0.1% |
| Ukrainian | 173 | 0.1% |
| Venezuelan | 209 | 0.1% |
| Welsh | 1,128 | 0.7% |
| West Indian | 12 | 0.0% |
| Yugoslavian | 78 | 0.1% | View All 127 Rows |
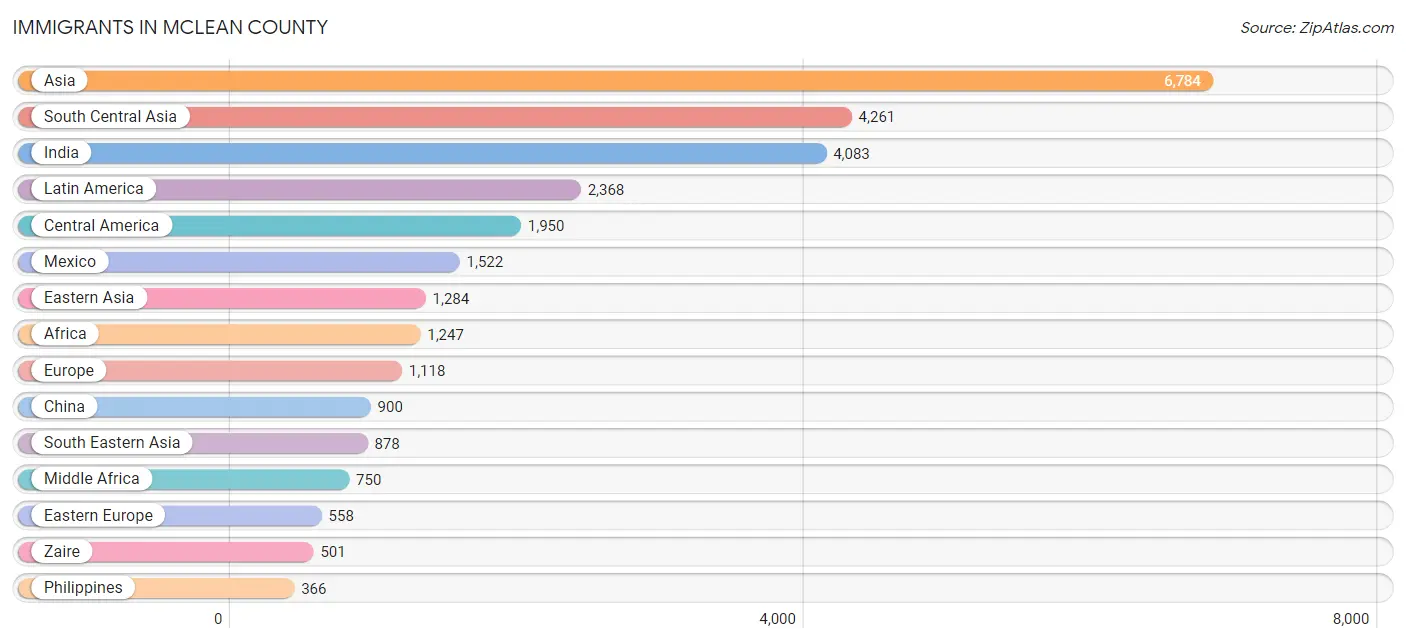
Immigrants in McLean County
The most numerous immigrant groups reported in McLean County came from Asia (6,784 | 4.0%), South Central Asia (4,261 | 2.5%), India (4,083 | 2.4%), Latin America (2,368 | 1.4%), and Central America (1,950 | 1.1%), together accounting for 11.3% of all McLean County residents.
| Immigration Origin | # Population | % Population |
| Africa | 1,247 | 0.7% |
| Albania | 13 | 0.0% |
| Argentina | 13 | 0.0% |
| Asia | 6,784 | 4.0% |
| Australia | 33 | 0.0% |
| Austria | 15 | 0.0% |
| Bangladesh | 14 | 0.0% |
| Belize | 35 | 0.0% |
| Bolivia | 20 | 0.0% |
| Brazil | 20 | 0.0% |
| Cameroon | 39 | 0.0% |
| Canada | 243 | 0.1% |
| Caribbean | 196 | 0.1% |
| Central America | 1,950 | 1.1% |
| Chile | 12 | 0.0% |
| China | 900 | 0.5% |
| Colombia | 96 | 0.1% |
| Congo | 210 | 0.1% |
| Costa Rica | 19 | 0.0% |
| Dominican Republic | 27 | 0.0% |
| Eastern Africa | 117 | 0.1% |
| Eastern Asia | 1,284 | 0.7% |
| Eastern Europe | 558 | 0.3% |
| Egypt | 14 | 0.0% |
| El Salvador | 21 | 0.0% |
| England | 122 | 0.1% |
| Ethiopia | 66 | 0.0% |
| Europe | 1,118 | 0.6% |
| Germany | 261 | 0.2% |
| Greece | 4 | 0.0% |
| Guatemala | 295 | 0.2% |
| Guyana | 35 | 0.0% |
| Haiti | 1 | 0.0% |
| Honduras | 58 | 0.0% |
| Hong Kong | 10 | 0.0% |
| Hungary | 3 | 0.0% |
| India | 4,083 | 2.4% |
| Iran | 10 | 0.0% |
| Ireland | 22 | 0.0% |
| Italy | 17 | 0.0% |
| Jamaica | 105 | 0.1% |
| Japan | 63 | 0.0% |
| Jordan | 56 | 0.0% |
| Kazakhstan | 45 | 0.0% |
| Kenya | 33 | 0.0% |
| Korea | 321 | 0.2% |
| Kuwait | 153 | 0.1% |
| Laos | 6 | 0.0% |
| Latin America | 2,368 | 1.4% |
| Lithuania | 35 | 0.0% |
| Malaysia | 63 | 0.0% |
| Mexico | 1,522 | 0.9% |
| Middle Africa | 750 | 0.4% |
| Morocco | 19 | 0.0% |
| Netherlands | 29 | 0.0% |
| Nigeria | 301 | 0.2% |
| Northern Africa | 33 | 0.0% |
| Northern Europe | 170 | 0.1% |
| Oceania | 33 | 0.0% |
| Pakistan | 74 | 0.0% |
| Peru | 26 | 0.0% |
| Philippines | 366 | 0.2% |
| Poland | 114 | 0.1% |
| Portugal | 41 | 0.0% |
| Russia | 291 | 0.2% |
| Saudi Arabia | 36 | 0.0% |
| Scotland | 6 | 0.0% |
| Senegal | 15 | 0.0% |
| South Africa | 31 | 0.0% |
| South America | 222 | 0.1% |
| South Central Asia | 4,261 | 2.5% |
| South Eastern Asia | 878 | 0.5% |
| Southern Europe | 72 | 0.0% |
| Spain | 10 | 0.0% |
| Sri Lanka | 35 | 0.0% |
| Switzerland | 13 | 0.0% |
| Syria | 5 | 0.0% |
| Taiwan | 69 | 0.0% |
| Thailand | 8 | 0.0% |
| Trinidad and Tobago | 53 | 0.0% |
| Turkey | 107 | 0.1% |
| Ukraine | 7 | 0.0% |
| Vietnam | 243 | 0.1% |
| Western Africa | 316 | 0.2% |
| Western Asia | 361 | 0.2% |
| Western Europe | 318 | 0.2% |
| Zaire | 501 | 0.3% | View All 87 Rows |
Sex and Age in McLean County
Sex and Age in McLean County
The most populous age groups in McLean County are 20 to 24 Years (10,288 | 12.3%) for men and 20 to 24 Years (10,671 | 12.2%) for women.
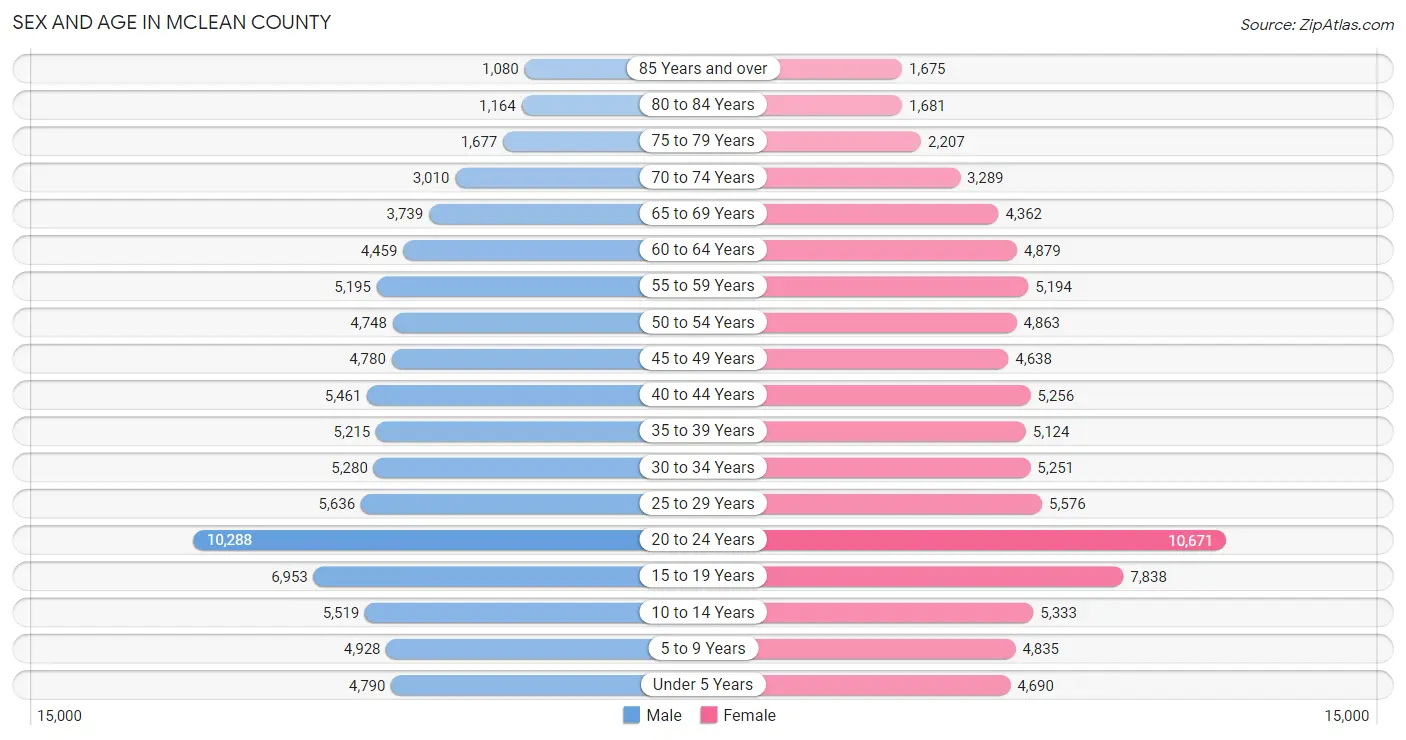
| Age Bracket | Male | Female |
| Under 5 Years | 4,790 (5.7%) | 4,690 (5.4%) |
| 5 to 9 Years | 4,928 (5.9%) | 4,835 (5.5%) |
| 10 to 14 Years | 5,519 (6.6%) | 5,333 (6.1%) |
| 15 to 19 Years | 6,953 (8.3%) | 7,838 (9.0%) |
| 20 to 24 Years | 10,288 (12.3%) | 10,671 (12.2%) |
| 25 to 29 Years | 5,636 (6.7%) | 5,576 (6.4%) |
| 30 to 34 Years | 5,280 (6.3%) | 5,251 (6.0%) |
| 35 to 39 Years | 5,215 (6.2%) | 5,124 (5.9%) |
| 40 to 44 Years | 5,461 (6.5%) | 5,256 (6.0%) |
| 45 to 49 Years | 4,780 (5.7%) | 4,638 (5.3%) |
| 50 to 54 Years | 4,748 (5.7%) | 4,863 (5.6%) |
| 55 to 59 Years | 5,195 (6.2%) | 5,194 (5.9%) |
| 60 to 64 Years | 4,459 (5.3%) | 4,879 (5.6%) |
| 65 to 69 Years | 3,739 (4.5%) | 4,362 (5.0%) |
| 70 to 74 Years | 3,010 (3.6%) | 3,289 (3.8%) |
| 75 to 79 Years | 1,677 (2.0%) | 2,207 (2.5%) |
| 80 to 84 Years | 1,164 (1.4%) | 1,681 (1.9%) |
| 85 Years and over | 1,080 (1.3%) | 1,675 (1.9%) |
| Total | 83,922 (100.0%) | 87,362 (100.0%) |
Families and Households in McLean County
Median Family Size in McLean County
The median family size in McLean County is 3.04 persons per family, with married-couple families (31,496 | 79.0%) accounting for the largest median family size of 3.09 persons per family. On the other hand, single male/father families (2,239 | 5.6%) represent the smallest median family size with 2.75 persons per family.
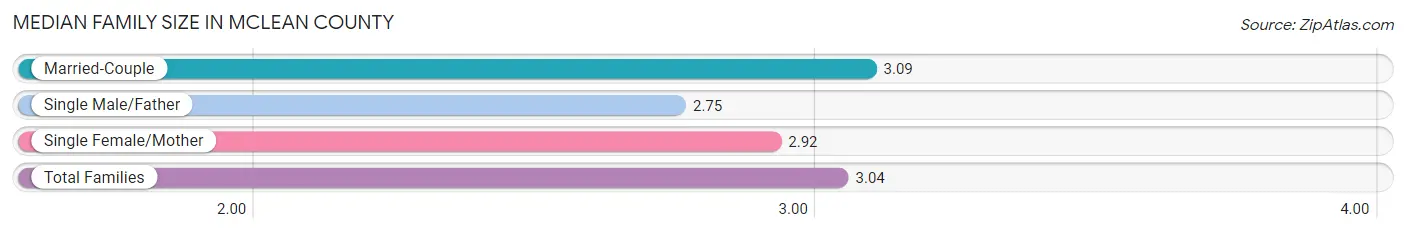
| Family Type | # Families | Family Size |
| Married-Couple | 31,496 (79.0%) | 3.09 |
| Single Male/Father | 2,239 (5.6%) | 2.75 |
| Single Female/Mother | 6,151 (15.4%) | 2.92 |
| Total Families | 39,886 (100.0%) | 3.04 |
Median Household Size in McLean County
The median household size in McLean County is 2.38 persons per household, with single male/father households (2,239 | 3.3%) accounting for the largest median household size of 3.13 persons per household. non-family households (28,605 | 41.8%) represent the smallest median household size with 1.36 persons per household.
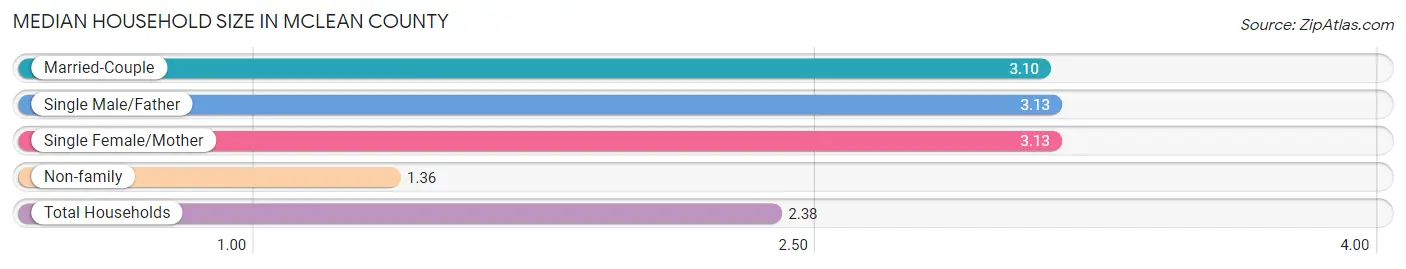
| Household Type | # Households | Household Size |
| Married-Couple | 31,496 (46.0%) | 3.10 |
| Single Male/Father | 2,239 (3.3%) | 3.13 |
| Single Female/Mother | 6,151 (9.0%) | 3.13 |
| Non-family | 28,605 (41.8%) | 1.36 |
| Total Households | 68,491 (100.0%) | 2.38 |
Household Size by Marriage Status in McLean County
Out of a total of 68,491 households in McLean County, 39,886 (58.2%) are family households, while 28,605 (41.8%) are nonfamily households. The most numerous type of family households are 2-person households, comprising 18,878, and the most common type of nonfamily households are 1-person households, comprising 21,811.
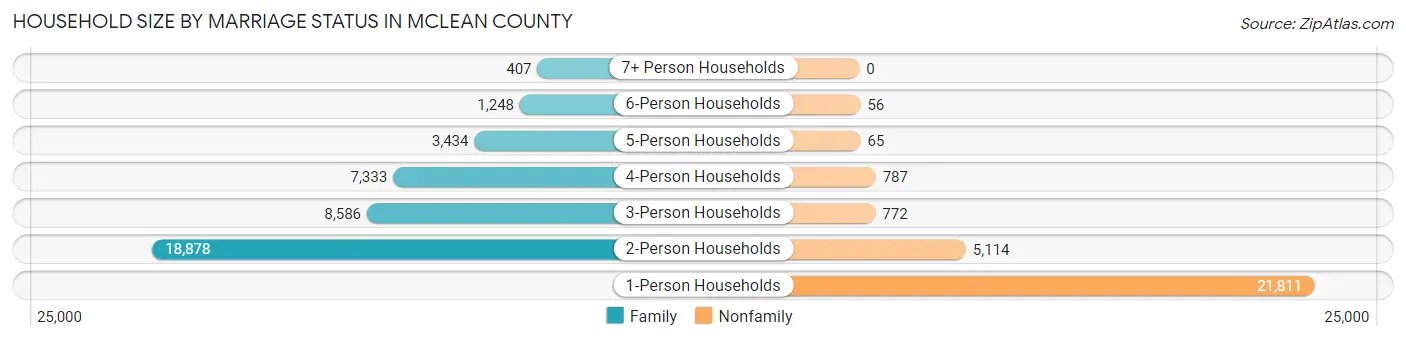
| Household Size | Family Households | Nonfamily Households |
| 1-Person Households | - | 21,811 (31.9%) |
| 2-Person Households | 18,878 (27.6%) | 5,114 (7.5%) |
| 3-Person Households | 8,586 (12.5%) | 772 (1.1%) |
| 4-Person Households | 7,333 (10.7%) | 787 (1.1%) |
| 5-Person Households | 3,434 (5.0%) | 65 (0.1%) |
| 6-Person Households | 1,248 (1.8%) | 56 (0.1%) |
| 7+ Person Households | 407 (0.6%) | 0 (0.0%) |
| Total | 39,886 (58.2%) | 28,605 (41.8%) |
Female Fertility in McLean County
Fertility by Age in McLean County
Average fertility rate in McLean County is 55.0 births per 1,000 women. Women in the age bracket of 20 to 34 years have the highest fertility rate with 87.0 births per 1,000 women. Women in the age bracket of 20 to 34 years acount for 75.2% of all women with births.
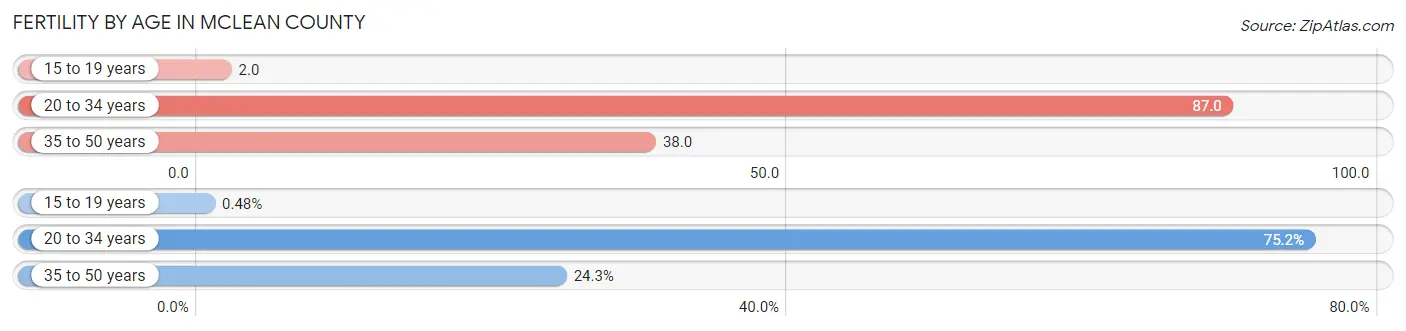
| Age Bracket | Women with Births | Births / 1,000 Women |
| 15 to 19 years | 12 (0.5%) | 2.0 |
| 20 to 34 years | 1,866 (75.2%) | 87.0 |
| 35 to 50 years | 604 (24.3%) | 38.0 |
| Total | 2,482 (100.0%) | 55.0 |
Fertility by Age by Marriage Status in McLean County
69.1% of women with births (2,482) in McLean County are married. The highest percentage of unmarried women with births falls into 15 to 19 years age bracket with 100.0% of them unmarried at the time of birth, while the lowest percentage of unmarried women with births belong to 35 to 50 years age bracket with 13.1% of them unmarried.
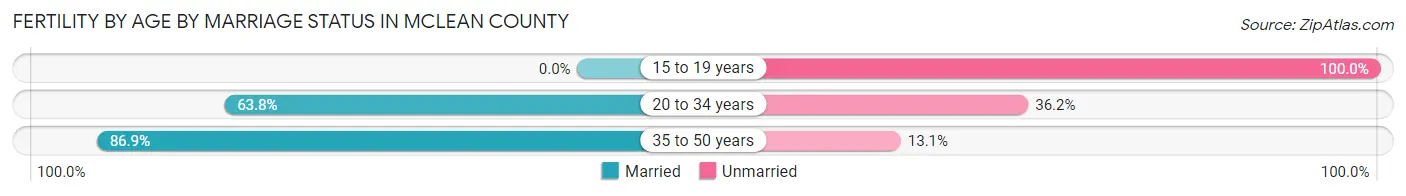
| Age Bracket | Married | Unmarried |
| 15 to 19 years | 0 (0.0%) | 12 (100.0%) |
| 20 to 34 years | 1,191 (63.8%) | 675 (36.2%) |
| 35 to 50 years | 525 (86.9%) | 79 (13.1%) |
| Total | 1,715 (69.1%) | 767 (30.9%) |
Fertility by Education in McLean County
Average fertility rate in McLean County is 55.0 births per 1,000 women. Women with the education attainment of bachelor's degree have the highest fertility rate of 77.0 births per 1,000 women, while women with the education attainment of less than high school have the lowest fertility at 4.0 births per 1,000 women. Women with the education attainment of bachelor's degree represent 36.0% of all women with births.
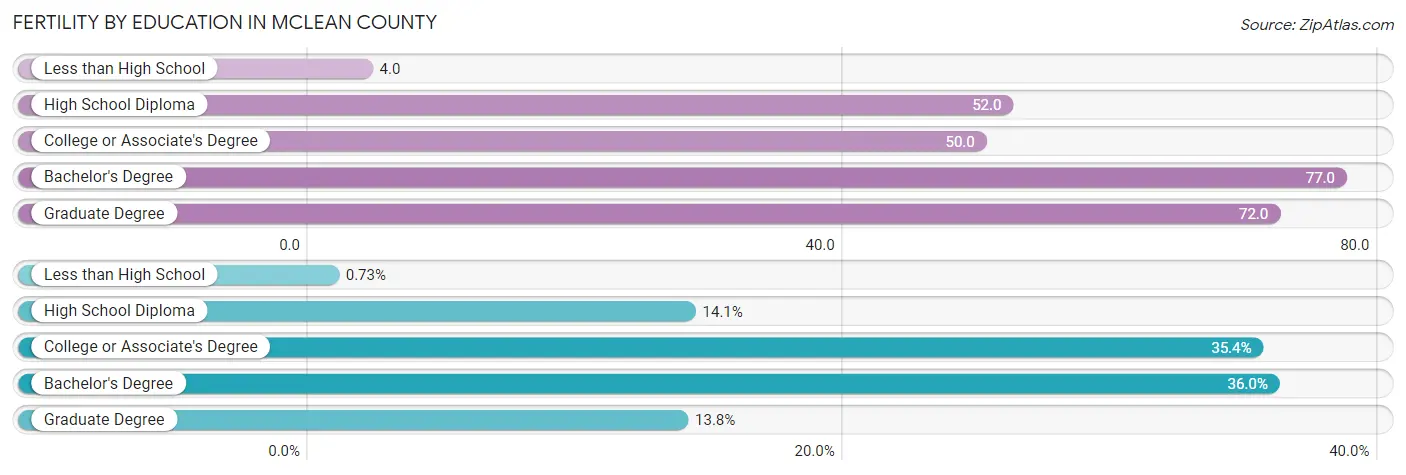
| Educational Attainment | Women with Births | Births / 1,000 Women |
| Less than High School | 18 (0.7%) | 4.0 |
| High School Diploma | 350 (14.1%) | 52.0 |
| College or Associate's Degree | 878 (35.4%) | 50.0 |
| Bachelor's Degree | 893 (36.0%) | 77.0 |
| Graduate Degree | 343 (13.8%) | 72.0 |
| Total | 2,482 (100.0%) | 55.0 |
Fertility by Education by Marriage Status in McLean County
30.9% of women with births in McLean County are unmarried. Women with the educational attainment of bachelor's degree are most likely to be married with 97.1% of them married at childbirth, while women with the educational attainment of college or associate's degree are least likely to be married with 60.3% of them unmarried at childbirth.
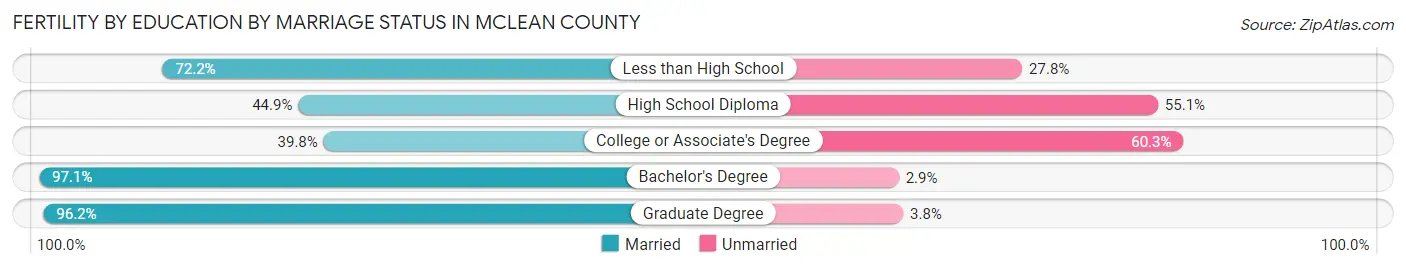
| Educational Attainment | Married | Unmarried |
| Less than High School | 13 (72.2%) | 5 (27.8%) |
| High School Diploma | 157 (44.9%) | 193 (55.1%) |
| College or Associate's Degree | 349 (39.8%) | 529 (60.3%) |
| Bachelor's Degree | 867 (97.1%) | 26 (2.9%) |
| Graduate Degree | 330 (96.2%) | 13 (3.8%) |
| Total | 1,715 (69.1%) | 767 (30.9%) |
Income in McLean County
Income Overview in McLean County
Per Capita Income in McLean County is $40,252, while median incomes of families and households are $105,528 and $75,356 respectively.
| Characteristic | Number | Measure |
| Per Capita Income | 171,284 | $40,252 |
| Median Family Income | 39,886 | $105,528 |
| Mean Family Income | 39,886 | $130,769 |
| Median Household Income | 68,491 | $75,356 |
| Mean Household Income | 68,491 | $99,327 |
| Income Deficit | 39,886 | $12,319 |
| Wage / Income Gap (%) | 171,284 | 35.44% |
| Wage / Income Gap ($) | 171,284 | 64.56¢ per $1 |
| Gini / Inequality Index | 171,284 | 0.48 |
Earnings by Sex in McLean County
Average Earnings in McLean County are $40,997, $50,389 for men and $32,532 for women, a difference of 35.4%.
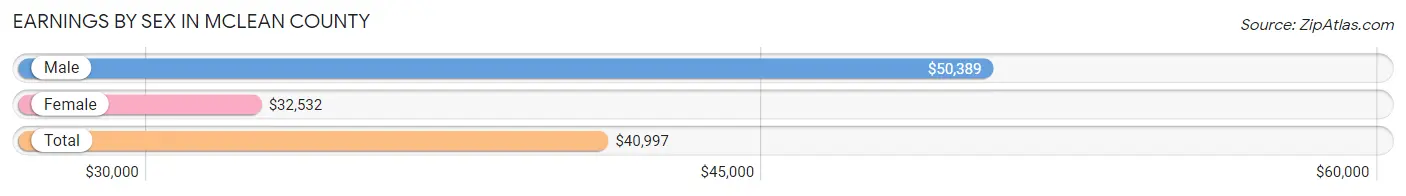
| Sex | Number | Average Earnings |
| Male | 48,572 (51.0%) | $50,389 |
| Female | 46,657 (49.0%) | $32,532 |
| Total | 95,229 (100.0%) | $40,997 |
Earnings by Sex by Income Bracket in McLean County
The most common earnings brackets in McLean County are $100,000+ for men (9,705 | 20.0%) and $100,000+ for women (4,248 | 9.1%).
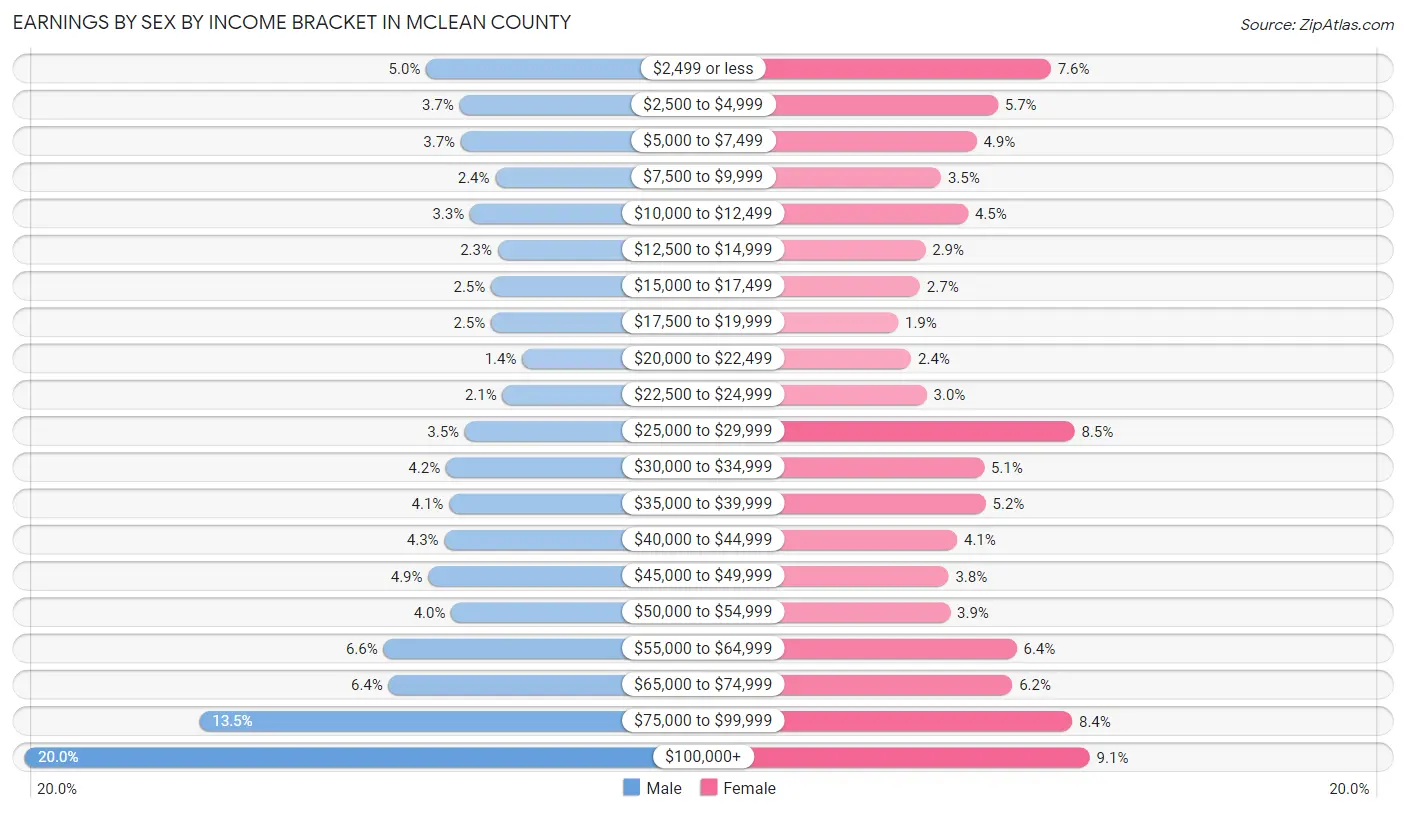
| Income | Male | Female |
| $2,499 or less | 2,402 (5.0%) | 3,564 (7.6%) |
| $2,500 to $4,999 | 1,798 (3.7%) | 2,640 (5.7%) |
| $5,000 to $7,499 | 1,772 (3.6%) | 2,268 (4.9%) |
| $7,500 to $9,999 | 1,145 (2.4%) | 1,646 (3.5%) |
| $10,000 to $12,499 | 1,607 (3.3%) | 2,117 (4.5%) |
| $12,500 to $14,999 | 1,101 (2.3%) | 1,372 (2.9%) |
| $15,000 to $17,499 | 1,224 (2.5%) | 1,280 (2.7%) |
| $17,500 to $19,999 | 1,226 (2.5%) | 896 (1.9%) |
| $20,000 to $22,499 | 654 (1.3%) | 1,124 (2.4%) |
| $22,500 to $24,999 | 1,017 (2.1%) | 1,394 (3.0%) |
| $25,000 to $29,999 | 1,700 (3.5%) | 3,980 (8.5%) |
| $30,000 to $34,999 | 2,047 (4.2%) | 2,398 (5.1%) |
| $35,000 to $39,999 | 1,985 (4.1%) | 2,426 (5.2%) |
| $40,000 to $44,999 | 2,074 (4.3%) | 1,927 (4.1%) |
| $45,000 to $49,999 | 2,366 (4.9%) | 1,776 (3.8%) |
| $50,000 to $54,999 | 1,947 (4.0%) | 1,804 (3.9%) |
| $55,000 to $64,999 | 3,180 (6.6%) | 2,966 (6.4%) |
| $65,000 to $74,999 | 3,088 (6.4%) | 2,891 (6.2%) |
| $75,000 to $99,999 | 6,534 (13.5%) | 3,940 (8.4%) |
| $100,000+ | 9,705 (20.0%) | 4,248 (9.1%) |
| Total | 48,572 (100.0%) | 46,657 (100.0%) |
Earnings by Sex by Educational Attainment in McLean County
Average earnings in McLean County are $65,746 for men and $45,498 for women, a difference of 30.8%. Men with an educational attainment of graduate degree enjoy the highest average annual earnings of $96,994, while those with less than high school education earn the least with $37,549. Women with an educational attainment of graduate degree earn the most with the average annual earnings of $69,513, while those with less than high school education have the smallest earnings of $19,968.
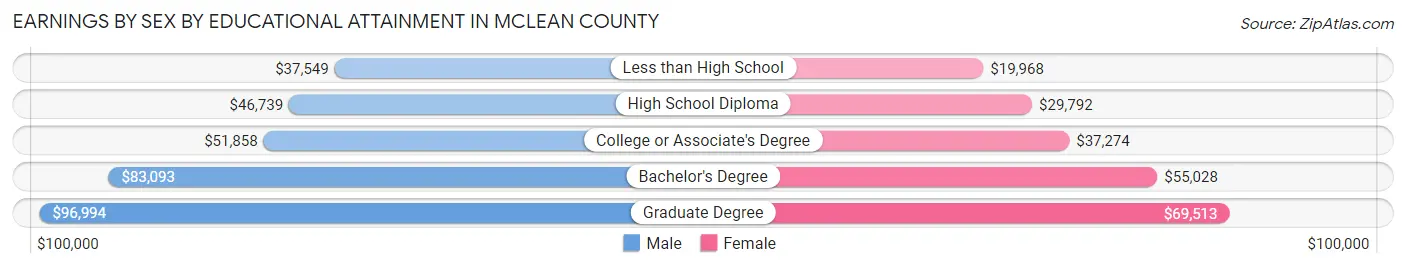
| Educational Attainment | Male Income | Female Income |
| Less than High School | $37,549 | $19,968 |
| High School Diploma | $46,739 | $29,792 |
| College or Associate's Degree | $51,858 | $37,274 |
| Bachelor's Degree | $83,093 | $55,028 |
| Graduate Degree | $96,994 | $69,513 |
| Total | $65,746 | $45,498 |
Family Income in McLean County
Family Income Brackets in McLean County
According to the McLean County family income data, there are 9,254 families falling into the $100,000 to $149,999 income range, which is the most common income bracket and makes up 23.2% of all families. Conversely, the $10,000 to $14,999 income bracket is the least frequent group with only 359 families (0.9%) belonging to this category.
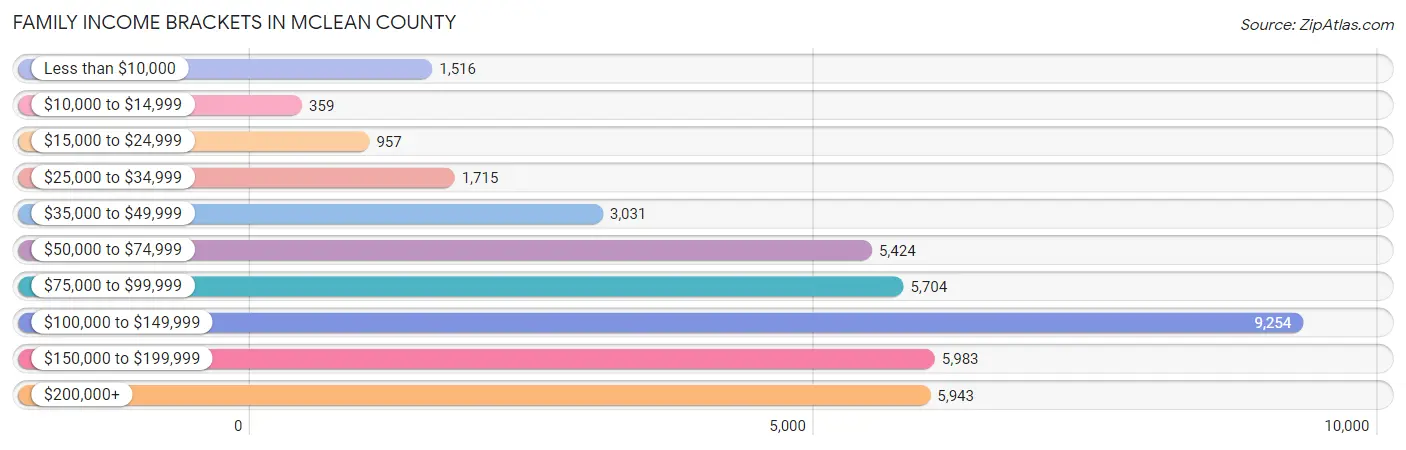
| Income Bracket | # Families | % Families |
| Less than $10,000 | 1,516 | 3.8% |
| $10,000 to $14,999 | 359 | 0.9% |
| $15,000 to $24,999 | 957 | 2.4% |
| $25,000 to $34,999 | 1,715 | 4.3% |
| $35,000 to $49,999 | 3,031 | 7.6% |
| $50,000 to $74,999 | 5,424 | 13.6% |
| $75,000 to $99,999 | 5,704 | 14.3% |
| $100,000 to $149,999 | 9,254 | 23.2% |
| $150,000 to $199,999 | 5,983 | 15.0% |
| $200,000+ | 5,943 | 14.9% |
Family Income by Famaliy Size in McLean County
6-person families (1,195 | 3.0%) account for the highest median family income in McLean County with $138,365 per family, while 2-person families (20,095 | 50.4%) have the highest median income of $46,432 per family member.
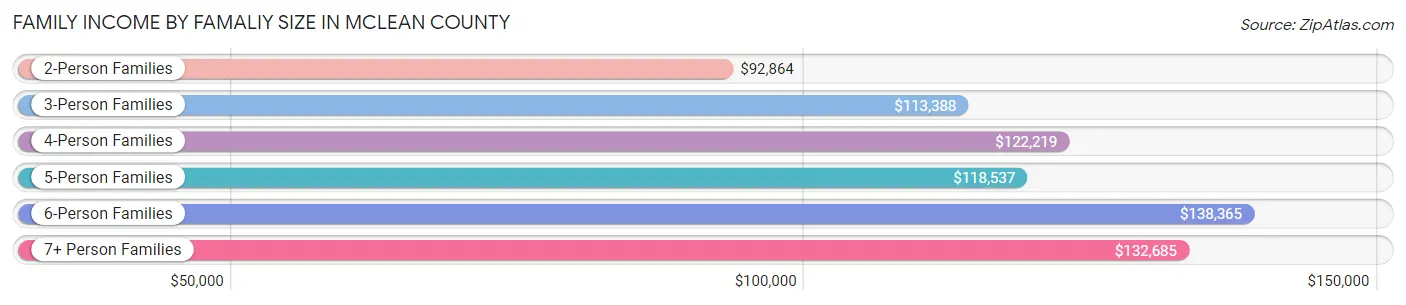
| Income Bracket | # Families | Median Income |
| 2-Person Families | 20,095 (50.4%) | $92,864 |
| 3-Person Families | 7,839 (19.7%) | $113,388 |
| 4-Person Families | 7,303 (18.3%) | $122,219 |
| 5-Person Families | 3,138 (7.9%) | $118,537 |
| 6-Person Families | 1,195 (3.0%) | $138,365 |
| 7+ Person Families | 316 (0.8%) | $132,685 |
| Total | 39,886 (100.0%) | $105,528 |
Family Income by Number of Earners in McLean County
The median family income in McLean County is $105,528, with families comprising 3+ earners (3,783) having the highest median family income of $170,972, while families with no earners (6,247) have the lowest median family income of $64,343, accounting for 9.5% and 15.7% of families, respectively.
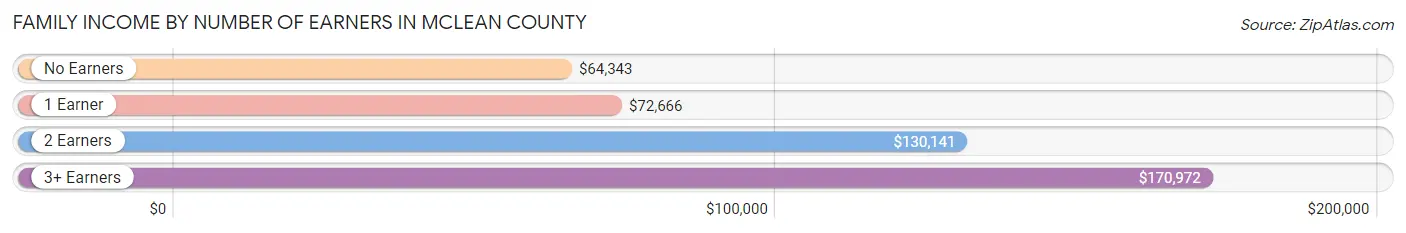
| Number of Earners | # Families | Median Income |
| No Earners | 6,247 (15.7%) | $64,343 |
| 1 Earner | 11,995 (30.1%) | $72,666 |
| 2 Earners | 17,861 (44.8%) | $130,141 |
| 3+ Earners | 3,783 (9.5%) | $170,972 |
| Total | 39,886 (100.0%) | $105,528 |
Household Income in McLean County
Household Income Brackets in McLean County
With 11,917 households falling in the category, the $100,000 to $149,999 income range is the most frequent in McLean County, accounting for 17.4% of all households. In contrast, only 2,055 households (3.0%) fall into the $10,000 to $14,999 income bracket, making it the least populous group.
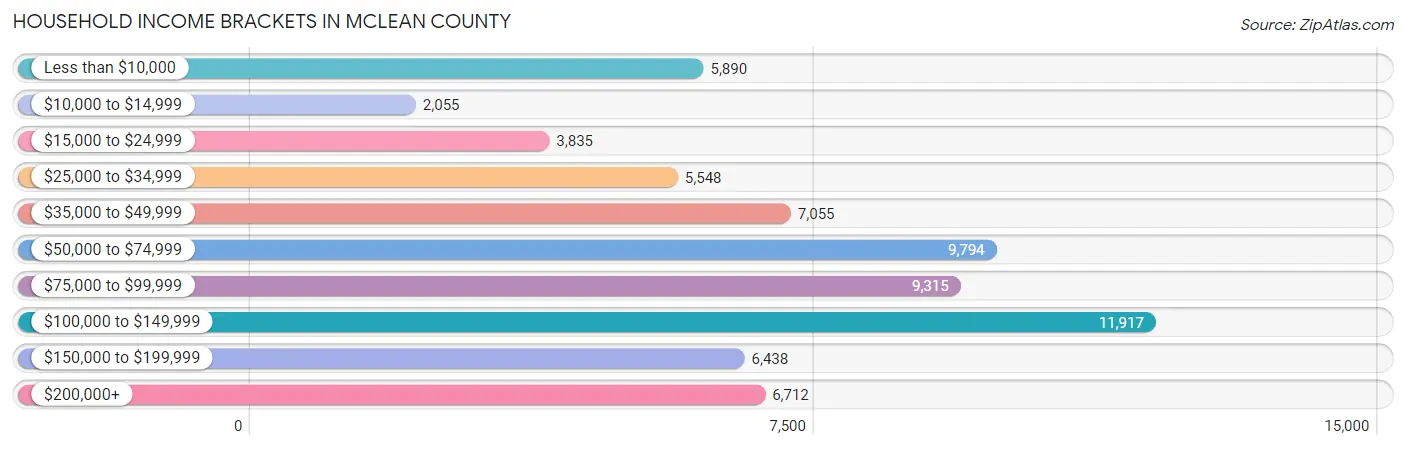
| Income Bracket | # Households | % Households |
| Less than $10,000 | 5,890 | 8.6% |
| $10,000 to $14,999 | 2,055 | 3.0% |
| $15,000 to $24,999 | 3,835 | 5.6% |
| $25,000 to $34,999 | 5,548 | 8.1% |
| $35,000 to $49,999 | 7,055 | 10.3% |
| $50,000 to $74,999 | 9,794 | 14.3% |
| $75,000 to $99,999 | 9,315 | 13.6% |
| $100,000 to $149,999 | 11,917 | 17.4% |
| $150,000 to $199,999 | 6,438 | 9.4% |
| $200,000+ | 6,712 | 9.8% |
Household Income by Householder Age in McLean County
The median household income in McLean County is $75,356, with the highest median household income of $98,389 found in the 45 to 64 years age bracket for the primary householder. A total of 23,129 households (33.8%) fall into this category. Meanwhile, the 15 to 24 years age bracket for the primary householder has the lowest median household income of $22,861, with 7,065 households (10.3%) in this group.
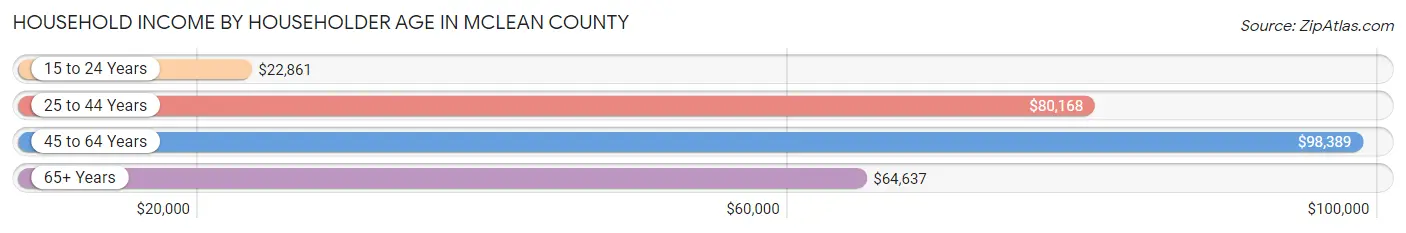
| Income Bracket | # Households | Median Income |
| 15 to 24 Years | 7,065 (10.3%) | $22,861 |
| 25 to 44 Years | 23,139 (33.8%) | $80,168 |
| 45 to 64 Years | 23,129 (33.8%) | $98,389 |
| 65+ Years | 15,158 (22.1%) | $64,637 |
| Total | 68,491 (100.0%) | $75,356 |
Poverty in McLean County
Income Below Poverty by Sex and Age in McLean County
With 13.0% poverty level for males and 15.3% for females among the residents of McLean County, 18 to 24 year old males and 18 to 24 year old females are the most vulnerable to poverty, with 3,841 males (34.8%) and 5,584 females (50.0%) in their respective age groups living below the poverty level.
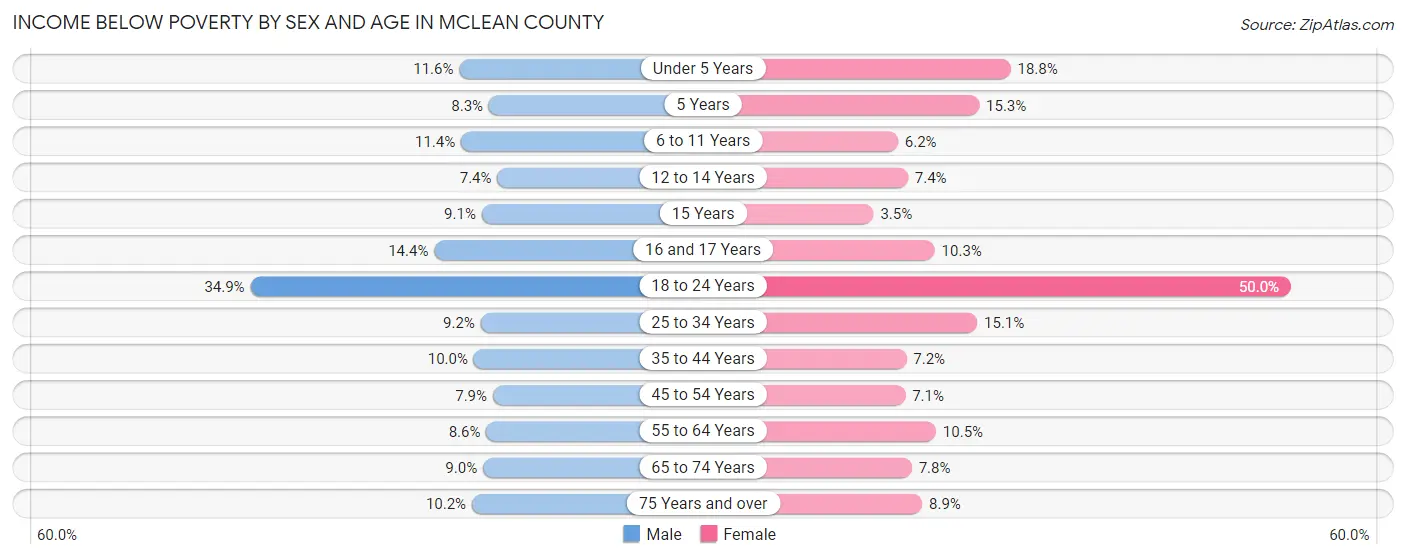
| Age Bracket | Male | Female |
| Under 5 Years | 553 (11.6%) | 874 (18.8%) |
| 5 Years | 62 (8.3%) | 148 (15.3%) |
| 6 to 11 Years | 726 (11.4%) | 348 (6.2%) |
| 12 to 14 Years | 228 (7.3%) | 248 (7.4%) |
| 15 Years | 94 (9.1%) | 43 (3.5%) |
| 16 and 17 Years | 315 (14.4%) | 195 (10.3%) |
| 18 to 24 Years | 3,841 (34.8%) | 5,584 (50.0%) |
| 25 to 34 Years | 999 (9.2%) | 1,628 (15.1%) |
| 35 to 44 Years | 1,058 (10.0%) | 746 (7.2%) |
| 45 to 54 Years | 746 (7.9%) | 671 (7.1%) |
| 55 to 64 Years | 825 (8.6%) | 1,056 (10.5%) |
| 65 to 74 Years | 601 (8.9%) | 589 (7.8%) |
| 75 Years and over | 381 (10.2%) | 464 (8.9%) |
| Total | 10,429 (13.0%) | 12,594 (15.3%) |
Income Above Poverty by Sex and Age in McLean County
According to the poverty statistics in McLean County, males aged 12 to 14 years and females aged 15 years are the age groups that are most secure financially, with 92.6% of males and 96.5% of females in these age groups living above the poverty line.
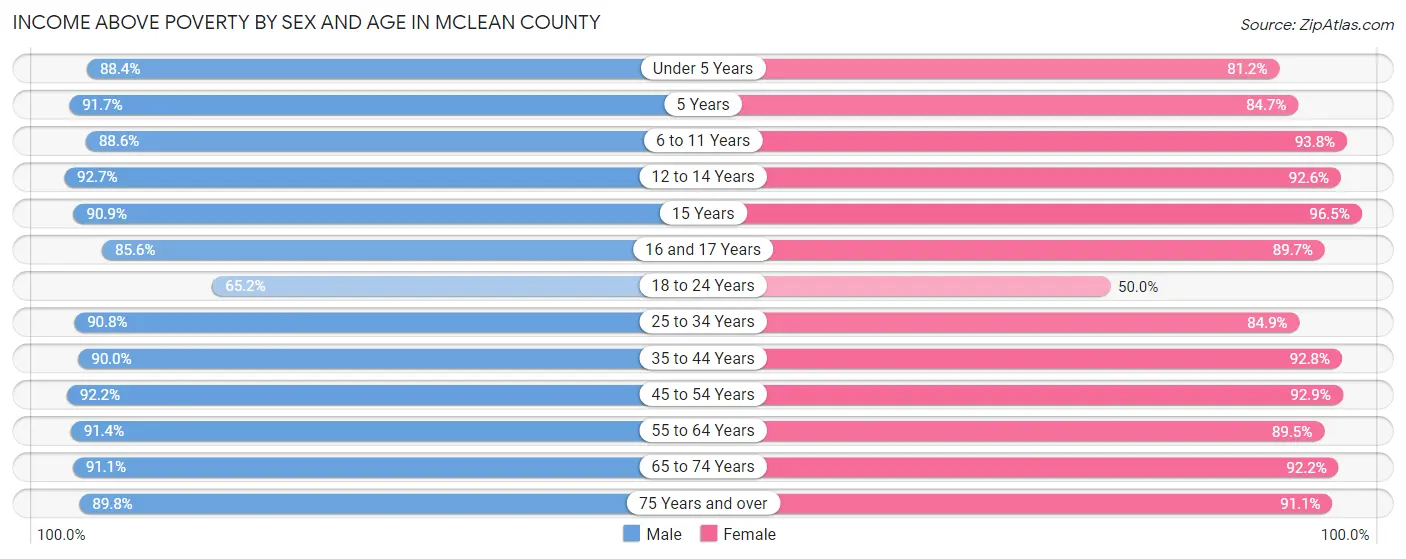
| Age Bracket | Male | Female |
| Under 5 Years | 4,219 (88.4%) | 3,777 (81.2%) |
| 5 Years | 686 (91.7%) | 820 (84.7%) |
| 6 to 11 Years | 5,646 (88.6%) | 5,232 (93.8%) |
| 12 to 14 Years | 2,874 (92.6%) | 3,121 (92.6%) |
| 15 Years | 940 (90.9%) | 1,176 (96.5%) |
| 16 and 17 Years | 1,875 (85.6%) | 1,690 (89.7%) |
| 18 to 24 Years | 7,180 (65.1%) | 5,580 (50.0%) |
| 25 to 34 Years | 9,845 (90.8%) | 9,176 (84.9%) |
| 35 to 44 Years | 9,557 (90.0%) | 9,626 (92.8%) |
| 45 to 54 Years | 8,754 (92.1%) | 8,830 (92.9%) |
| 55 to 64 Years | 8,792 (91.4%) | 9,017 (89.5%) |
| 65 to 74 Years | 6,111 (91.0%) | 6,968 (92.2%) |
| 75 Years and over | 3,363 (89.8%) | 4,729 (91.1%) |
| Total | 69,842 (87.0%) | 69,742 (84.7%) |
Income Below Poverty Among Married-Couple Families in McLean County
The poverty statistics for married-couple families in McLean County show that 3.4% or 1,060 of the total 31,496 families live below the poverty line. Families with 3 or 4 children have the highest poverty rate of 5.0%, comprising of 139 families. On the other hand, families with 5 or more children have the lowest poverty rate of 1.6%, which includes 3 families.
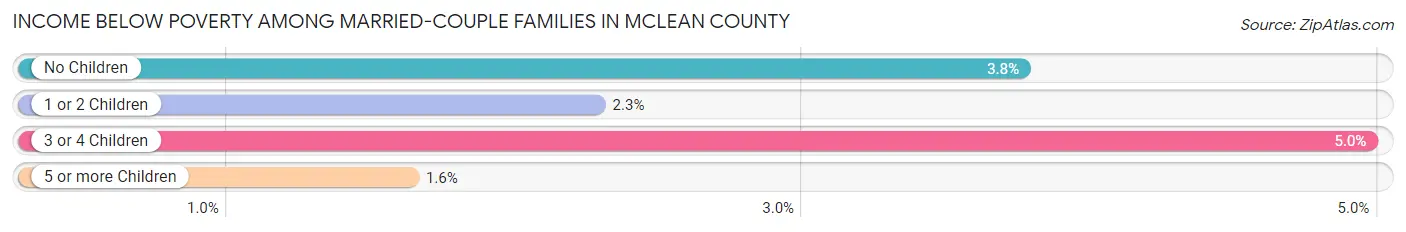
| Children | Above Poverty | Below Poverty |
| No Children | 17,424 (96.2%) | 681 (3.8%) |
| 1 or 2 Children | 10,175 (97.7%) | 237 (2.3%) |
| 3 or 4 Children | 2,656 (95.0%) | 139 (5.0%) |
| 5 or more Children | 181 (98.4%) | 3 (1.6%) |
| Total | 30,436 (96.6%) | 1,060 (3.4%) |
Income Below Poverty Among Single-Parent Households in McLean County
According to the poverty data in McLean County, 11.7% or 262 single-father households and 27.3% or 1,681 single-mother households are living below the poverty line. Among single-father households, those with no children have the highest poverty rate, with 195 households (17.1%) experiencing poverty. Likewise, among single-mother households, those with 3 or 4 children have the highest poverty rate, with 575 households (57.5%) falling below the poverty line.
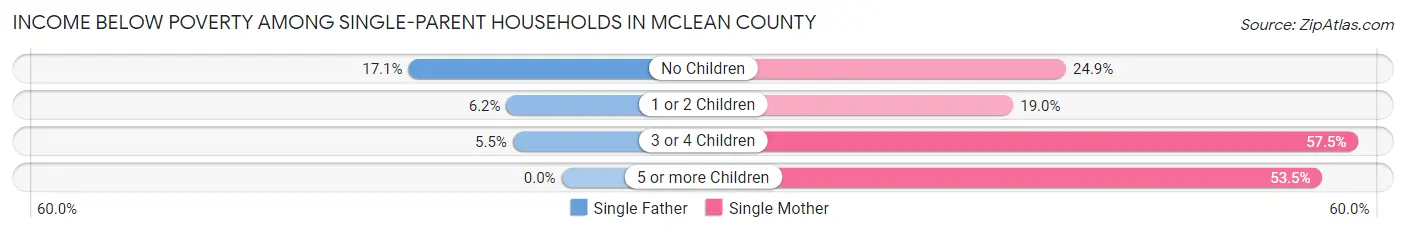
| Children | Single Father | Single Mother |
| No Children | 195 (17.1%) | 482 (24.9%) |
| 1 or 2 Children | 61 (6.2%) | 601 (19.0%) |
| 3 or 4 Children | 6 (5.4%) | 575 (57.5%) |
| 5 or more Children | 0 (0.0%) | 23 (53.5%) |
| Total | 262 (11.7%) | 1,681 (27.3%) |
Income Below Poverty Among Married-Couple vs Single-Parent Households in McLean County
The poverty data for McLean County shows that 1,060 of the married-couple family households (3.4%) and 1,943 of the single-parent households (23.2%) are living below the poverty level. Within the married-couple family households, those with 3 or 4 children have the highest poverty rate, with 139 households (5.0%) falling below the poverty line. Among the single-parent households, those with 5 or more children have the highest poverty rate, with 23 household (53.5%) living below poverty.
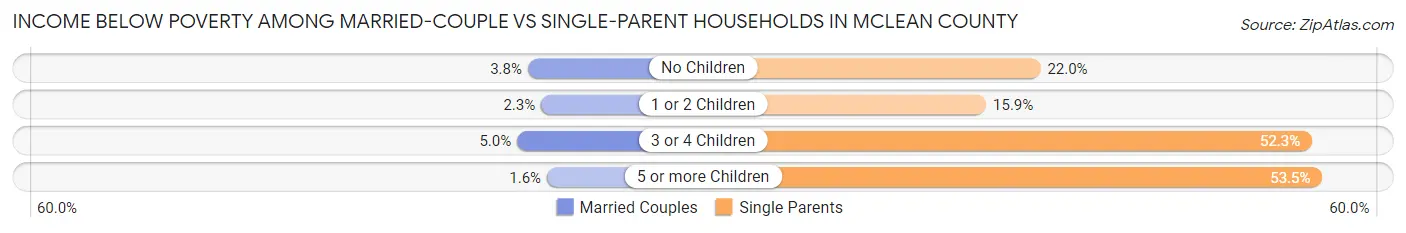
| Children | Married-Couple Families | Single-Parent Households |
| No Children | 681 (3.8%) | 677 (22.0%) |
| 1 or 2 Children | 237 (2.3%) | 662 (15.9%) |
| 3 or 4 Children | 139 (5.0%) | 581 (52.3%) |
| 5 or more Children | 3 (1.6%) | 23 (53.5%) |
| Total | 1,060 (3.4%) | 1,943 (23.2%) |
Employment Characteristics in McLean County
Employment by Class of Employer in McLean County
Among the 84,210 employed individuals in McLean County, private company employees (58,641 | 69.6%), not-for-profit organizations (8,242 | 9.8%), and state government employees (5,779 | 6.9%) make up the most common classes of employment.
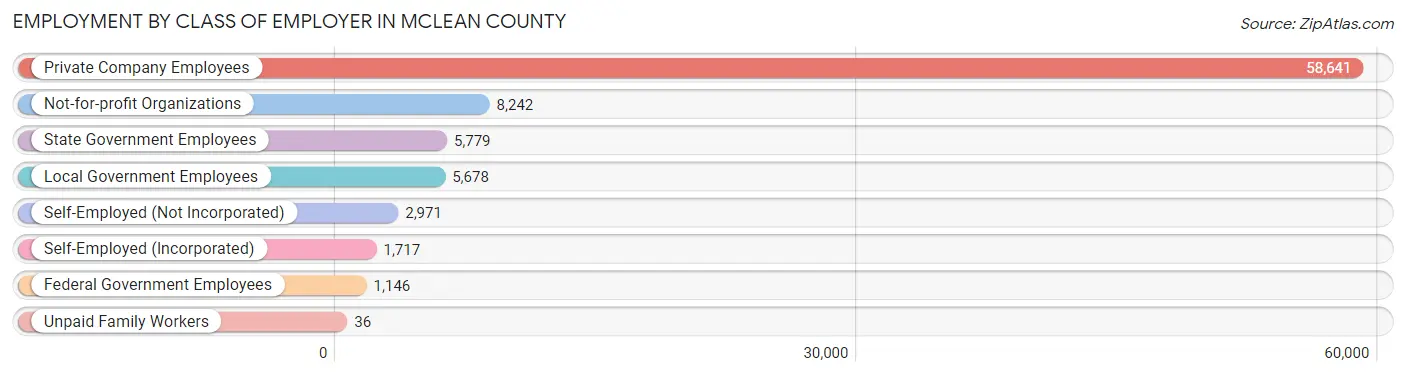
| Employer Class | # Employees | % Employees |
| Private Company Employees | 58,641 | 69.6% |
| Self-Employed (Incorporated) | 1,717 | 2.0% |
| Self-Employed (Not Incorporated) | 2,971 | 3.5% |
| Not-for-profit Organizations | 8,242 | 9.8% |
| Local Government Employees | 5,678 | 6.7% |
| State Government Employees | 5,779 | 6.9% |
| Federal Government Employees | 1,146 | 1.4% |
| Unpaid Family Workers | 36 | 0.0% |
| Total | 84,210 | 100.0% |
Employment Status by Age in McLean County
According to the labor force statistics for McLean County, out of the total population over 16 years of age (138,934), 63.9% or 88,779 individuals are in the labor force, with 3.2% or 2,841 of them unemployed. The age group with the highest labor force participation rate is 35 to 44 years, with 86.5% or 18,213 individuals in the labor force. Within the labor force, the 16 to 19 years age range has the highest percentage of unemployed individuals, with 9.3% or 486 of them being unemployed.
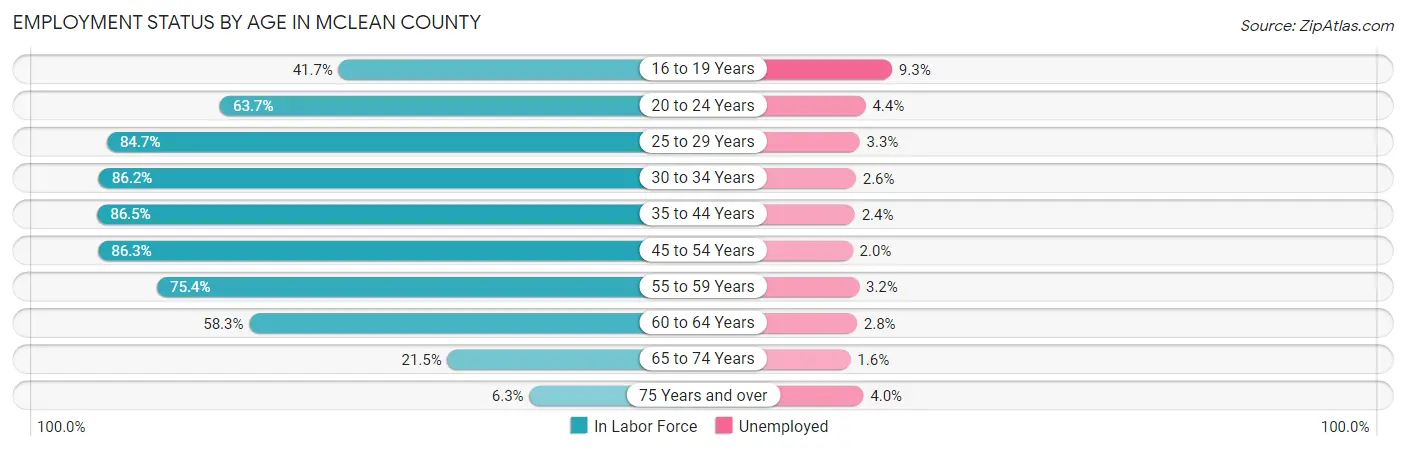
| Age Bracket | In Labor Force | Unemployed |
| 16 to 19 Years | 5,228 (41.7%) | 486 (9.3%) |
| 20 to 24 Years | 13,351 (63.7%) | 587 (4.4%) |
| 25 to 29 Years | 9,497 (84.7%) | 313 (3.3%) |
| 30 to 34 Years | 9,078 (86.2%) | 236 (2.6%) |
| 35 to 44 Years | 18,213 (86.5%) | 437 (2.4%) |
| 45 to 54 Years | 16,422 (86.3%) | 328 (2.0%) |
| 55 to 59 Years | 7,833 (75.4%) | 251 (3.2%) |
| 60 to 64 Years | 5,444 (58.3%) | 152 (2.8%) |
| 65 to 74 Years | 3,096 (21.5%) | 50 (1.6%) |
| 75 Years and over | 597 (6.3%) | 24 (4.0%) |
| Total | 88,779 (63.9%) | 2,841 (3.2%) |
Employment Status by Educational Attainment in McLean County
According to labor force statistics for McLean County, 81.5% of individuals (66,467) out of the total population between 25 and 64 years of age (81,555) are in the labor force, with 2.6% or 1,728 of them being unemployed. The group with the highest labor force participation rate are those with the educational attainment of bachelor's degree or higher, with 87.0% or 34,307 individuals in the labor force. Within the labor force, individuals with less than high school education have the highest percentage of unemployment, with 5.5% or 102 of them being unemployed.
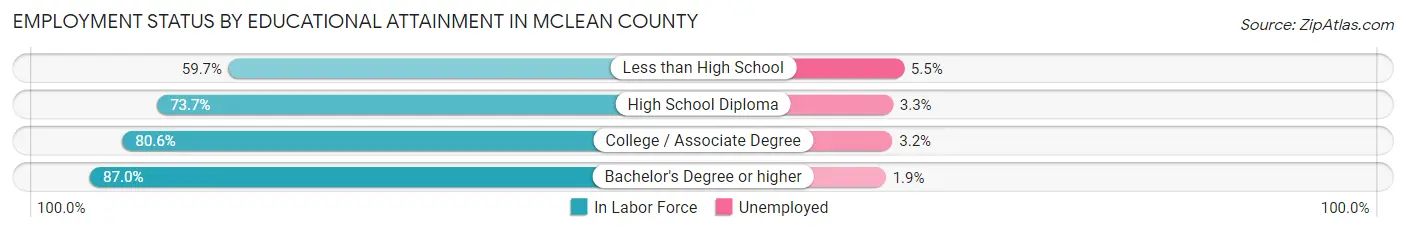
| Educational Attainment | In Labor Force | Unemployed |
| Less than High School | 1,848 (59.7%) | 170 (5.5%) |
| High School Diploma | 12,087 (73.7%) | 541 (3.3%) |
| College / Associate Degree | 18,237 (80.6%) | 724 (3.2%) |
| Bachelor's Degree or higher | 34,307 (87.0%) | 749 (1.9%) |
| Total | 66,467 (81.5%) | 2,120 (2.6%) |
Employment Occupations by Sex in McLean County
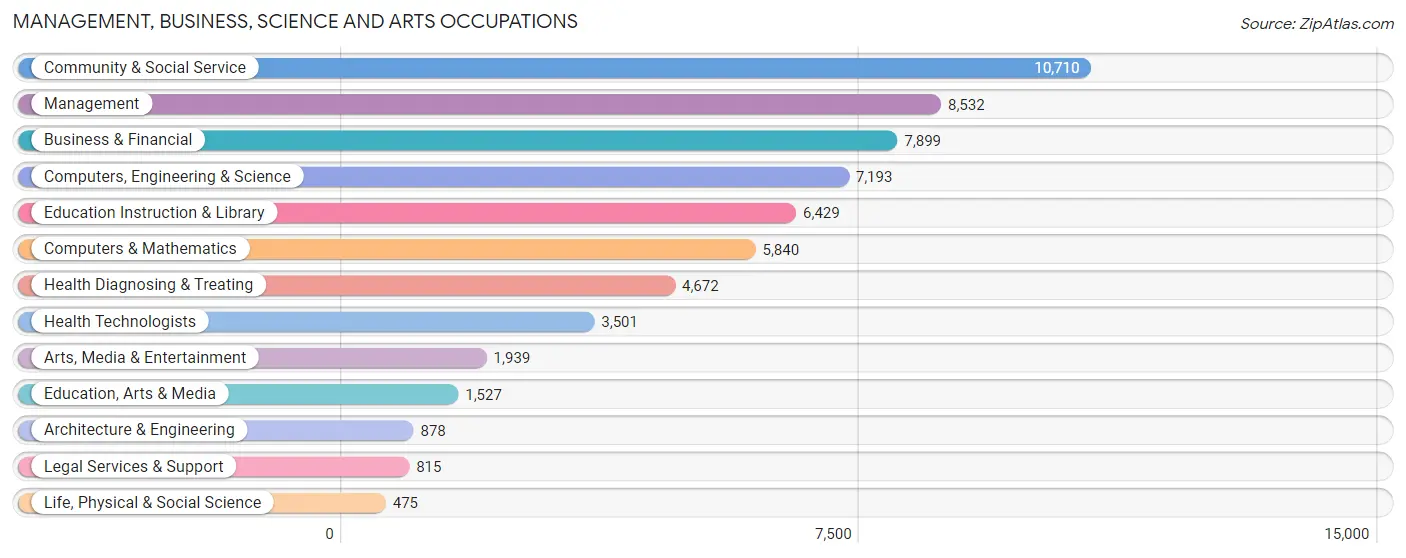
Management, Business, Science and Arts Occupations
The most common Management, Business, Science and Arts occupations in McLean County are Community & Social Service (10,710 | 12.5%), Management (8,532 | 9.9%), Business & Financial (7,899 | 9.2%), Computers, Engineering & Science (7,193 | 8.4%), and Education Instruction & Library (6,429 | 7.5%).
Management, Business, Science and Arts Occupations by Sex
Within the Management, Business, Science and Arts occupations in McLean County, the most male-oriented occupations are Architecture & Engineering (83.9%), Computers & Mathematics (75.1%), and Computers, Engineering & Science (74.4%), while the most female-oriented occupations are Health Technologists (76.1%), Health Diagnosing & Treating (73.9%), and Education, Arts & Media (67.1%).
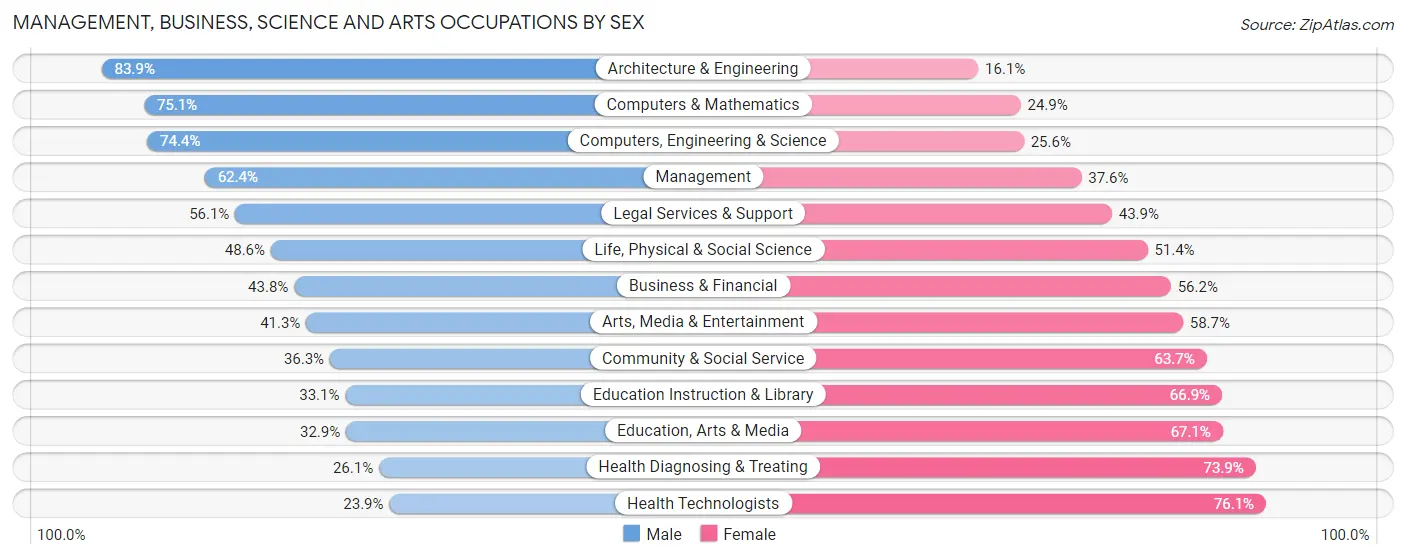
| Occupation | Male | Female |
| Management | 5,326 (62.4%) | 3,206 (37.6%) |
| Business & Financial | 3,457 (43.8%) | 4,442 (56.2%) |
| Computers, Engineering & Science | 5,354 (74.4%) | 1,839 (25.6%) |
| Computers & Mathematics | 4,386 (75.1%) | 1,454 (24.9%) |
| Architecture & Engineering | 737 (83.9%) | 141 (16.1%) |
| Life, Physical & Social Science | 231 (48.6%) | 244 (51.4%) |
| Community & Social Service | 3,888 (36.3%) | 6,822 (63.7%) |
| Education, Arts & Media | 503 (32.9%) | 1,024 (67.1%) |
| Legal Services & Support | 457 (56.1%) | 358 (43.9%) |
| Education Instruction & Library | 2,128 (33.1%) | 4,301 (66.9%) |
| Arts, Media & Entertainment | 800 (41.3%) | 1,139 (58.7%) |
| Health Diagnosing & Treating | 1,218 (26.1%) | 3,454 (73.9%) |
| Health Technologists | 837 (23.9%) | 2,664 (76.1%) |
| Total (Category) | 19,243 (49.3%) | 19,763 (50.7%) |
| Total (Overall) | 44,026 (51.3%) | 41,806 (48.7%) |
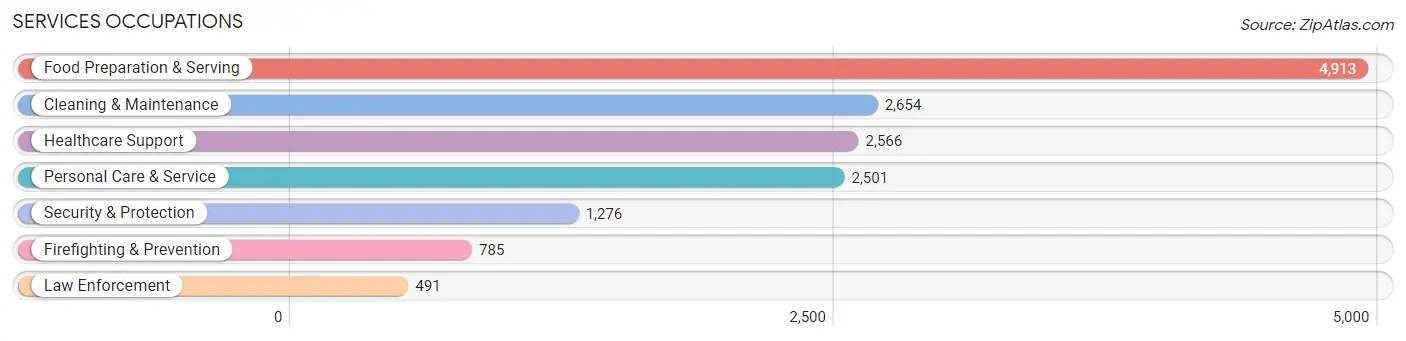
Services Occupations
The most common Services occupations in McLean County are Food Preparation & Serving (4,913 | 5.7%), Cleaning & Maintenance (2,654 | 3.1%), Healthcare Support (2,566 | 3.0%), Personal Care & Service (2,501 | 2.9%), and Security & Protection (1,276 | 1.5%).
Services Occupations by Sex
Within the Services occupations in McLean County, the most male-oriented occupations are Firefighting & Prevention (79.4%), Security & Protection (77.4%), and Law Enforcement (74.3%), while the most female-oriented occupations are Personal Care & Service (79.6%), Healthcare Support (79.3%), and Food Preparation & Serving (56.8%).
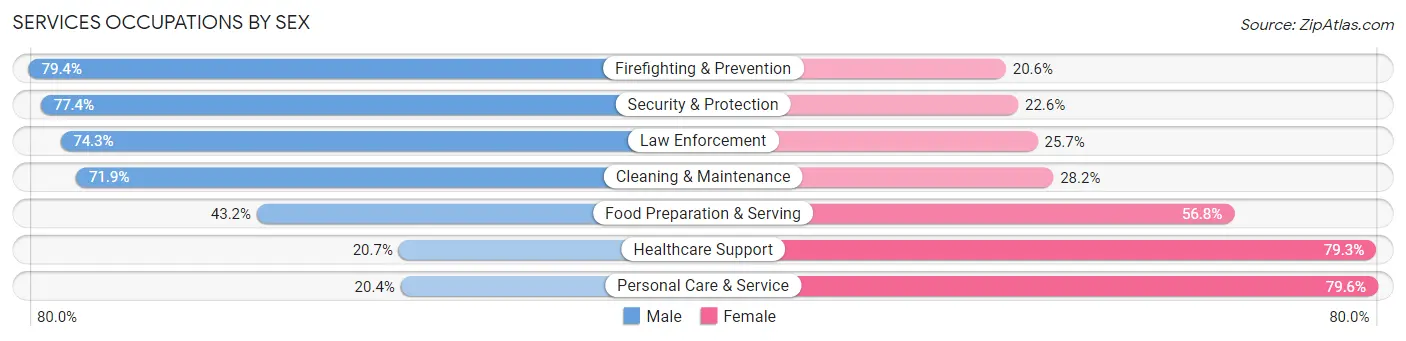
| Occupation | Male | Female |
| Healthcare Support | 532 (20.7%) | 2,034 (79.3%) |
| Security & Protection | 988 (77.4%) | 288 (22.6%) |
| Firefighting & Prevention | 623 (79.4%) | 162 (20.6%) |
| Law Enforcement | 365 (74.3%) | 126 (25.7%) |
| Food Preparation & Serving | 2,123 (43.2%) | 2,790 (56.8%) |
| Cleaning & Maintenance | 1,907 (71.9%) | 747 (28.1%) |
| Personal Care & Service | 511 (20.4%) | 1,990 (79.6%) |
| Total (Category) | 6,061 (43.6%) | 7,849 (56.4%) |
| Total (Overall) | 44,026 (51.3%) | 41,806 (48.7%) |
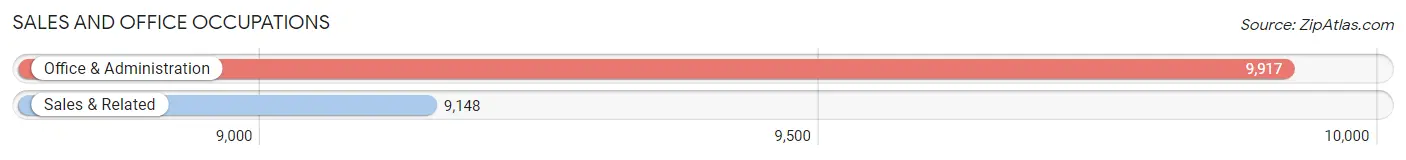
Sales and Office Occupations
The most common Sales and Office occupations in McLean County are Office & Administration (9,917 | 11.6%), and Sales & Related (9,148 | 10.7%).
Sales and Office Occupations by Sex
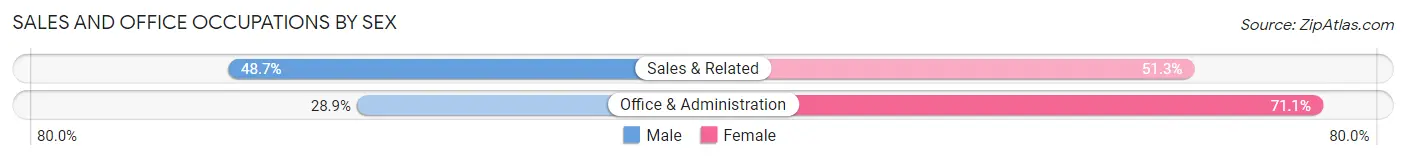
| Occupation | Male | Female |
| Sales & Related | 4,453 (48.7%) | 4,695 (51.3%) |
| Office & Administration | 2,865 (28.9%) | 7,052 (71.1%) |
| Total (Category) | 7,318 (38.4%) | 11,747 (61.6%) |
| Total (Overall) | 44,026 (51.3%) | 41,806 (48.7%) |
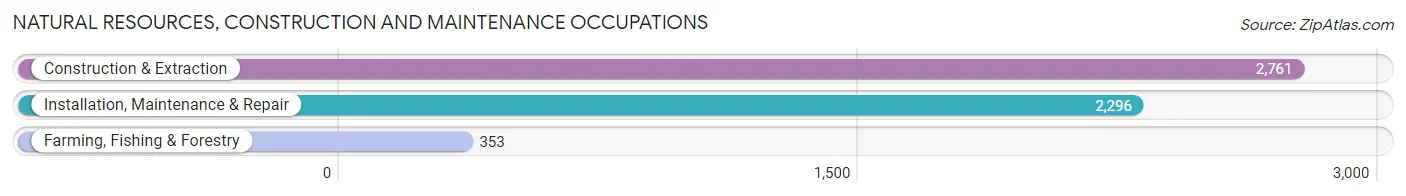
Natural Resources, Construction and Maintenance Occupations
The most common Natural Resources, Construction and Maintenance occupations in McLean County are Construction & Extraction (2,761 | 3.2%), Installation, Maintenance & Repair (2,296 | 2.7%), and Farming, Fishing & Forestry (353 | 0.4%).
Natural Resources, Construction and Maintenance Occupations by Sex
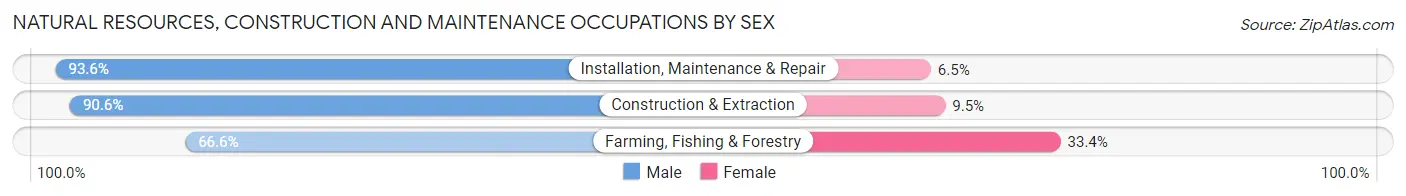
| Occupation | Male | Female |
| Farming, Fishing & Forestry | 235 (66.6%) | 118 (33.4%) |
| Construction & Extraction | 2,500 (90.5%) | 261 (9.5%) |
| Installation, Maintenance & Repair | 2,148 (93.5%) | 148 (6.5%) |
| Total (Category) | 4,883 (90.3%) | 527 (9.7%) |
| Total (Overall) | 44,026 (51.3%) | 41,806 (48.7%) |
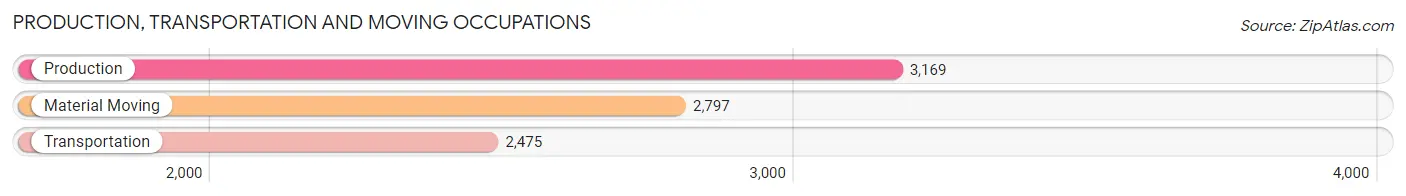
Production, Transportation and Moving Occupations
The most common Production, Transportation and Moving occupations in McLean County are Production (3,169 | 3.7%), Material Moving (2,797 | 3.3%), and Transportation (2,475 | 2.9%).
Production, Transportation and Moving Occupations by Sex
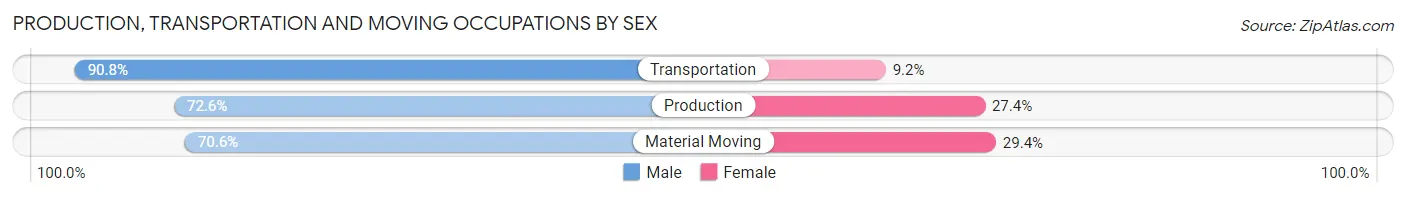
| Occupation | Male | Female |
| Production | 2,300 (72.6%) | 869 (27.4%) |
| Transportation | 2,247 (90.8%) | 228 (9.2%) |
| Material Moving | 1,974 (70.6%) | 823 (29.4%) |
| Total (Category) | 6,521 (77.2%) | 1,920 (22.8%) |
| Total (Overall) | 44,026 (51.3%) | 41,806 (48.7%) |
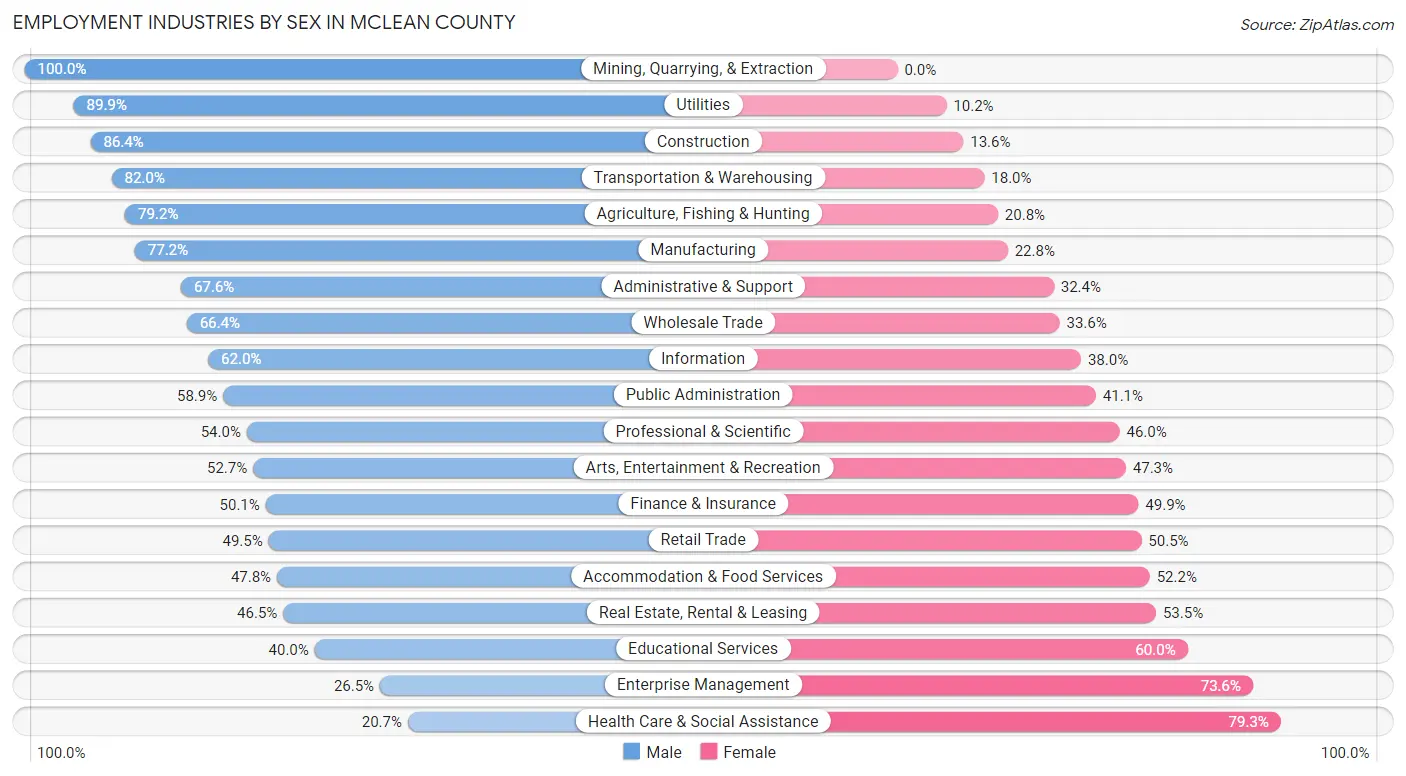
Employment Industries by Sex in McLean County
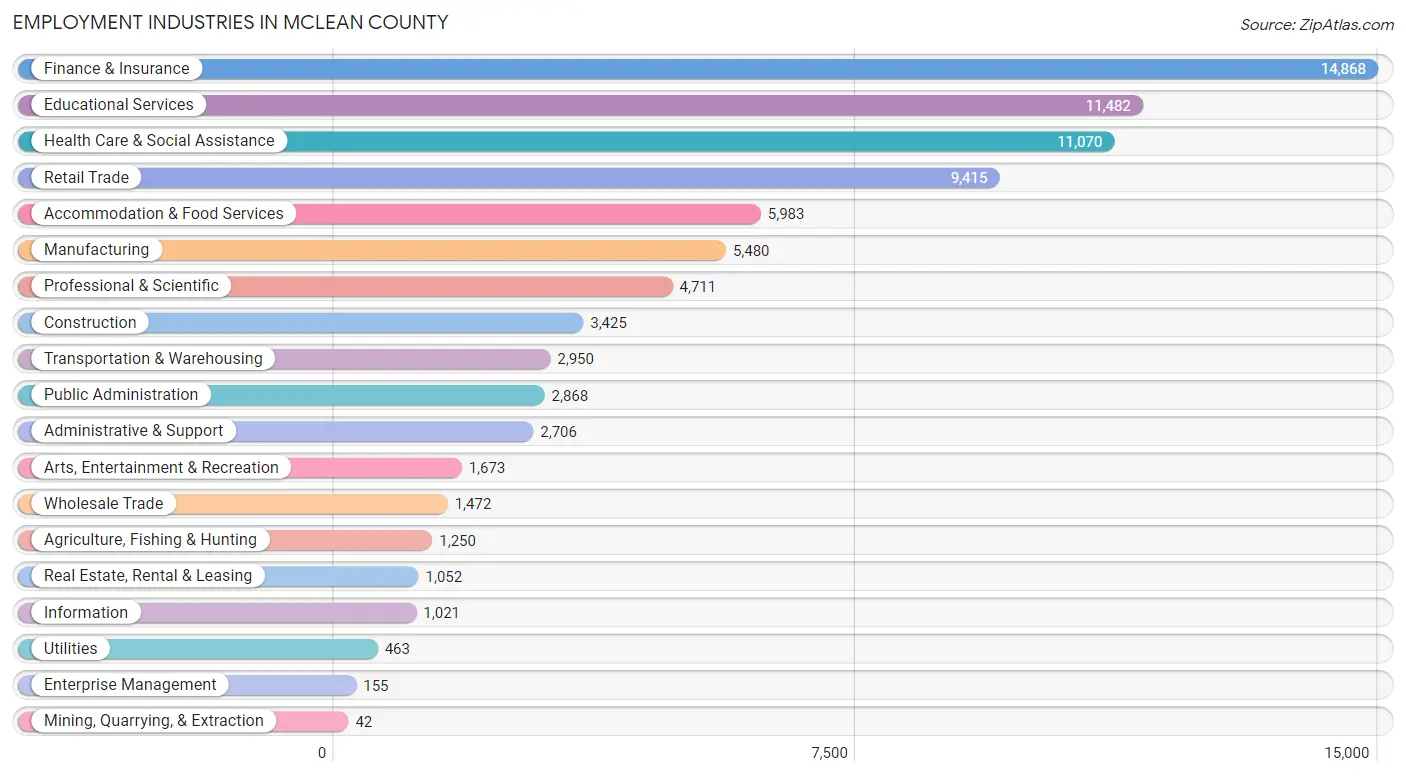
Employment Industries in McLean County
The major employment industries in McLean County include Finance & Insurance (14,868 | 17.3%), Educational Services (11,482 | 13.4%), Health Care & Social Assistance (11,070 | 12.9%), Retail Trade (9,415 | 11.0%), and Accommodation & Food Services (5,983 | 7.0%).
Employment Industries by Sex in McLean County
The McLean County industries that see more men than women are Mining, Quarrying, & Extraction (100.0%), Utilities (89.8%), and Construction (86.4%), whereas the industries that tend to have a higher number of women are Health Care & Social Assistance (79.3%), Enterprise Management (73.6%), and Educational Services (60.0%).
| Industry | Male | Female |
| Agriculture, Fishing & Hunting | 990 (79.2%) | 260 (20.8%) |
| Mining, Quarrying, & Extraction | 42 (100.0%) | 0 (0.0%) |
| Construction | 2,958 (86.4%) | 467 (13.6%) |
| Manufacturing | 4,229 (77.2%) | 1,251 (22.8%) |
| Wholesale Trade | 978 (66.4%) | 494 (33.6%) |
| Retail Trade | 4,660 (49.5%) | 4,755 (50.5%) |
| Transportation & Warehousing | 2,419 (82.0%) | 531 (18.0%) |
| Utilities | 416 (89.8%) | 47 (10.2%) |
| Information | 633 (62.0%) | 388 (38.0%) |
| Finance & Insurance | 7,452 (50.1%) | 7,416 (49.9%) |
| Real Estate, Rental & Leasing | 489 (46.5%) | 563 (53.5%) |
| Professional & Scientific | 2,545 (54.0%) | 2,166 (46.0%) |
| Enterprise Management | 41 (26.5%) | 114 (73.6%) |
| Administrative & Support | 1,830 (67.6%) | 876 (32.4%) |
| Educational Services | 4,589 (40.0%) | 6,893 (60.0%) |
| Health Care & Social Assistance | 2,289 (20.7%) | 8,781 (79.3%) |
| Arts, Entertainment & Recreation | 882 (52.7%) | 791 (47.3%) |
| Accommodation & Food Services | 2,858 (47.8%) | 3,125 (52.2%) |
| Public Administration | 1,690 (58.9%) | 1,178 (41.1%) |
| Total | 44,026 (51.3%) | 41,806 (48.7%) |
Education in McLean County
School Enrollment in McLean County
The most common levels of schooling among the 55,406 students in McLean County are college / undergraduate (23,211 | 41.9%), middle school (9,109 | 16.4%), and high school (8,175 | 14.7%).
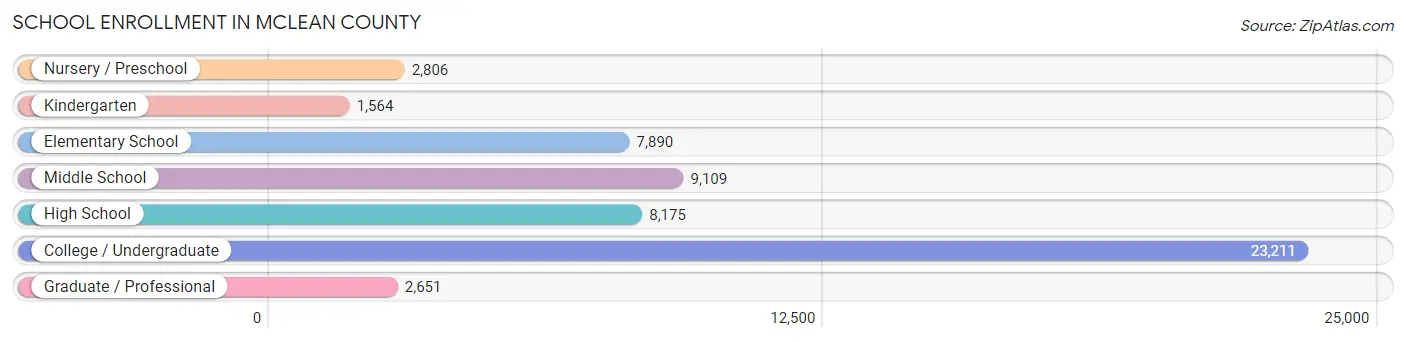
| School Level | # Students | % Students |
| Nursery / Preschool | 2,806 | 5.1% |
| Kindergarten | 1,564 | 2.8% |
| Elementary School | 7,890 | 14.2% |
| Middle School | 9,109 | 16.4% |
| High School | 8,175 | 14.7% |
| College / Undergraduate | 23,211 | 41.9% |
| Graduate / Professional | 2,651 | 4.8% |
| Total | 55,406 | 100.0% |
School Enrollment by Age by Funding Source in McLean County
Out of a total of 55,406 students who are enrolled in schools in McLean County, 6,981 (12.6%) attend a private institution, while the remaining 48,425 (87.4%) are enrolled in public schools. The age group of 3 to 4 year olds has the highest likelihood of being enrolled in private schools, with 869 (41.3% in the age bracket) enrolled. Conversely, the age group of 20 to 24 year olds has the lowest likelihood of being enrolled in a private school, with 13,128 (92.1% in the age bracket) attending a public institution.
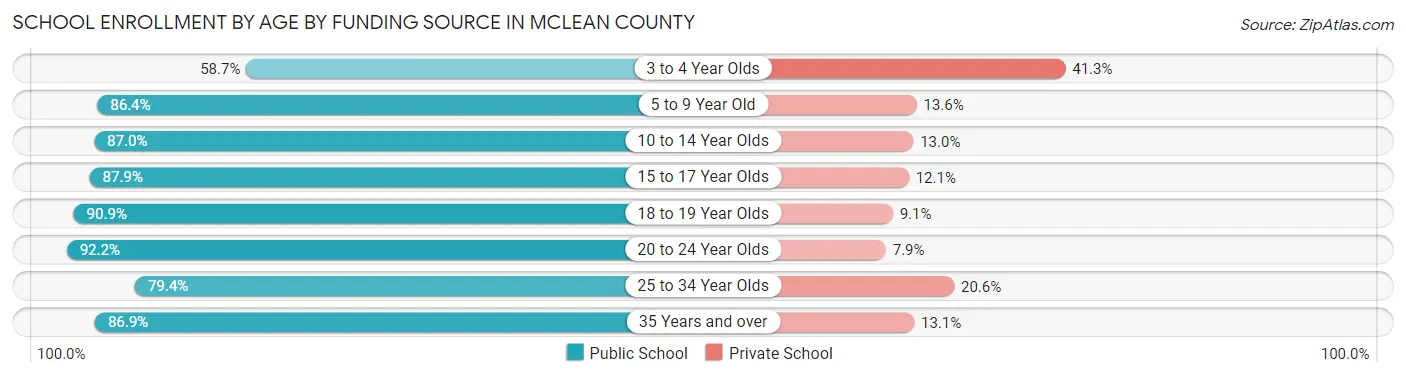
| Age Bracket | Public School | Private School |
| 3 to 4 Year Olds | 1,236 (58.7%) | 869 (41.3%) |
| 5 to 9 Year Old | 8,046 (86.4%) | 1,262 (13.6%) |
| 10 to 14 Year Olds | 9,298 (87.0%) | 1,384 (13.0%) |
| 15 to 17 Year Olds | 5,503 (87.9%) | 759 (12.1%) |
| 18 to 19 Year Olds | 6,968 (90.9%) | 701 (9.1%) |
| 20 to 24 Year Olds | 13,128 (92.1%) | 1,118 (7.9%) |
| 25 to 34 Year Olds | 2,055 (79.4%) | 532 (20.6%) |
| 35 Years and over | 2,213 (86.9%) | 334 (13.1%) |
| Total | 48,425 (87.4%) | 6,981 (12.6%) |
Educational Attainment by Field of Study in McLean County
Business (10,733 | 20.7%), education (7,061 | 13.6%), science & technology (4,820 | 9.3%), computers & mathematics (4,485 | 8.6%), and social sciences (3,742 | 7.2%) are the most common fields of study among 51,893 individuals in McLean County who have obtained a bachelor's degree or higher.
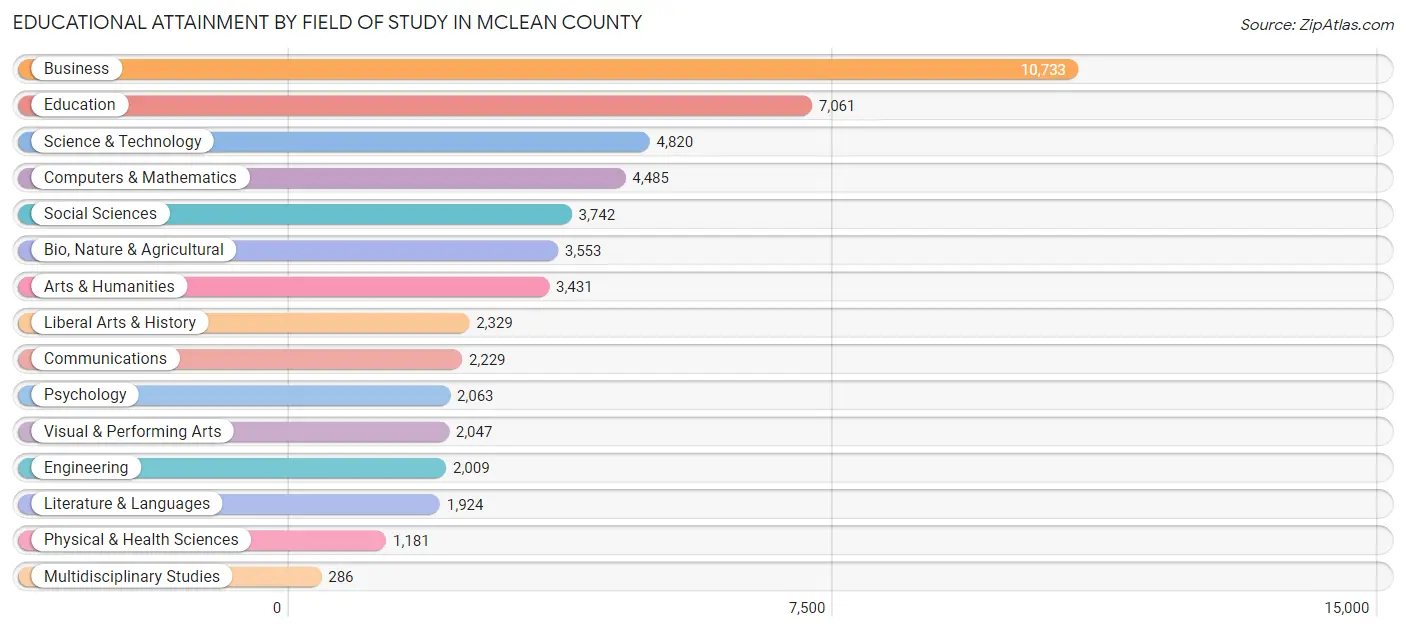
| Field of Study | # Graduates | % Graduates |
| Computers & Mathematics | 4,485 | 8.6% |
| Bio, Nature & Agricultural | 3,553 | 6.9% |
| Physical & Health Sciences | 1,181 | 2.3% |
| Psychology | 2,063 | 4.0% |
| Social Sciences | 3,742 | 7.2% |
| Engineering | 2,009 | 3.9% |
| Multidisciplinary Studies | 286 | 0.5% |
| Science & Technology | 4,820 | 9.3% |
| Business | 10,733 | 20.7% |
| Education | 7,061 | 13.6% |
| Literature & Languages | 1,924 | 3.7% |
| Liberal Arts & History | 2,329 | 4.5% |
| Visual & Performing Arts | 2,047 | 3.9% |
| Communications | 2,229 | 4.3% |
| Arts & Humanities | 3,431 | 6.6% |
| Total | 51,893 | 100.0% |
Transportation & Commute in McLean County
Vehicle Availability by Sex in McLean County
The most prevalent vehicle ownership categories in McLean County are males with 2 vehicles (20,693, accounting for 49.2%) and females with 2 vehicles (17,435, making up 52.9%).
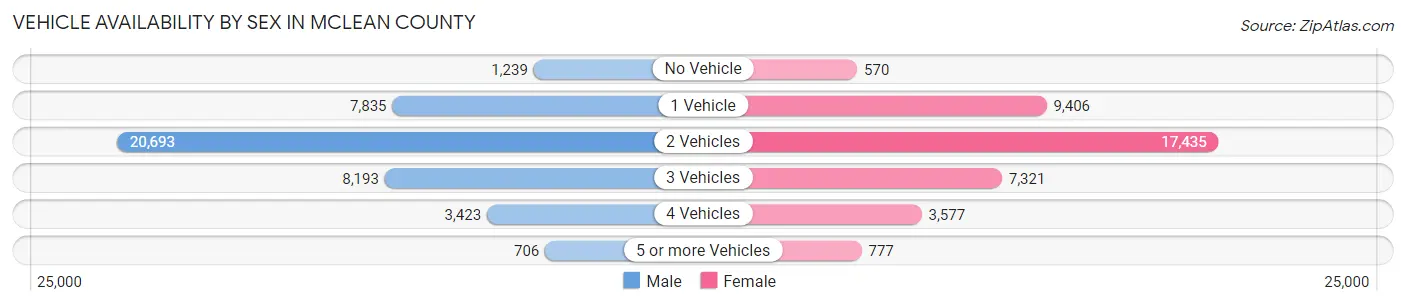
| Vehicles Available | Male | Female |
| No Vehicle | 1,239 (2.9%) | 570 (1.5%) |
| 1 Vehicle | 7,835 (18.6%) | 9,406 (24.1%) |
| 2 Vehicles | 20,693 (49.2%) | 17,435 (44.6%) |
| 3 Vehicles | 8,193 (19.5%) | 7,321 (18.7%) |
| 4 Vehicles | 3,423 (8.1%) | 3,577 (9.1%) |
| 5 or more Vehicles | 706 (1.7%) | 777 (2.0%) |
| Total | 42,089 (100.0%) | 39,086 (100.0%) |
Commute Time in McLean County
The most frequently occuring commute durations in McLean County are 10 to 14 minutes (17,832 commuters, 24.4%), 15 to 19 minutes (15,728 commuters, 21.5%), and 5 to 9 minutes (13,070 commuters, 17.9%).
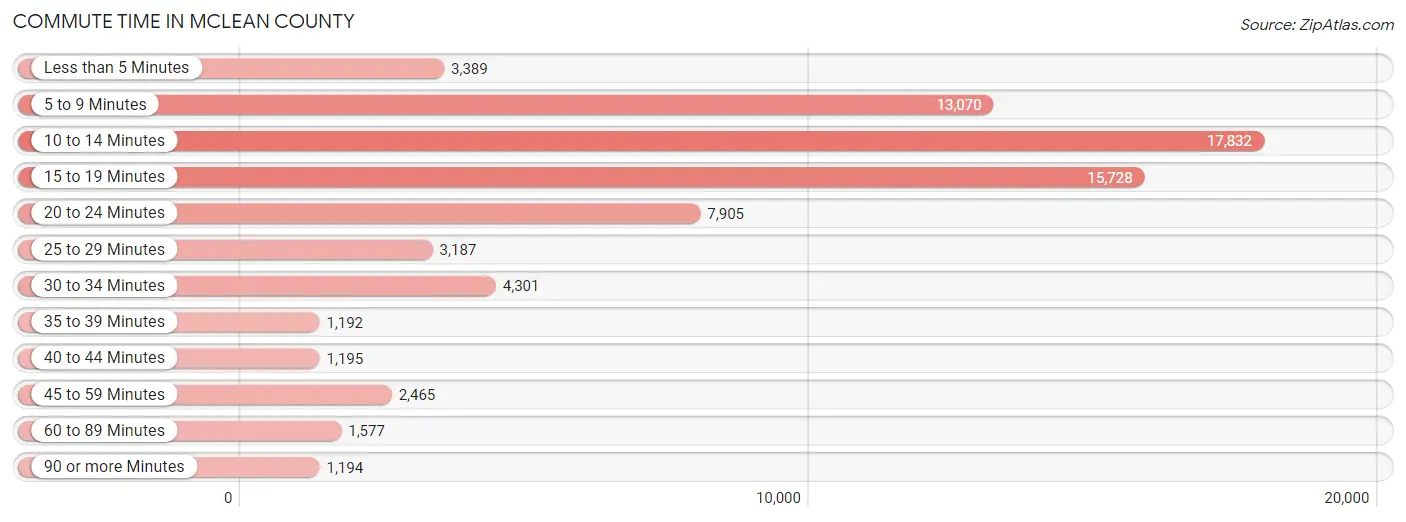
| Commute Time | # Commuters | % Commuters |
| Less than 5 Minutes | 3,389 | 4.6% |
| 5 to 9 Minutes | 13,070 | 17.9% |
| 10 to 14 Minutes | 17,832 | 24.4% |
| 15 to 19 Minutes | 15,728 | 21.5% |
| 20 to 24 Minutes | 7,905 | 10.8% |
| 25 to 29 Minutes | 3,187 | 4.4% |
| 30 to 34 Minutes | 4,301 | 5.9% |
| 35 to 39 Minutes | 1,192 | 1.6% |
| 40 to 44 Minutes | 1,195 | 1.6% |
| 45 to 59 Minutes | 2,465 | 3.4% |
| 60 to 89 Minutes | 1,577 | 2.2% |
| 90 or more Minutes | 1,194 | 1.6% |
Commute Time by Sex in McLean County
The most common commute times in McLean County are 10 to 14 minutes (8,905 commuters, 23.5%) for males and 10 to 14 minutes (8,927 commuters, 25.4%) for females.
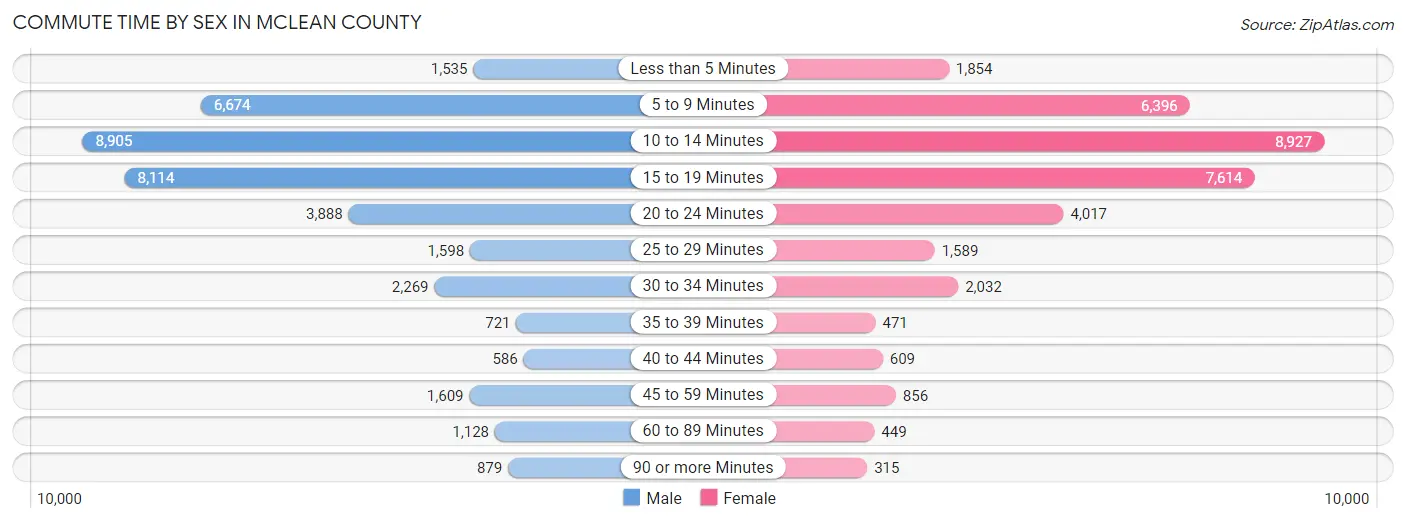
| Commute Time | Male | Female |
| Less than 5 Minutes | 1,535 (4.1%) | 1,854 (5.3%) |
| 5 to 9 Minutes | 6,674 (17.6%) | 6,396 (18.2%) |
| 10 to 14 Minutes | 8,905 (23.5%) | 8,927 (25.4%) |
| 15 to 19 Minutes | 8,114 (21.4%) | 7,614 (21.7%) |
| 20 to 24 Minutes | 3,888 (10.3%) | 4,017 (11.4%) |
| 25 to 29 Minutes | 1,598 (4.2%) | 1,589 (4.5%) |
| 30 to 34 Minutes | 2,269 (6.0%) | 2,032 (5.8%) |
| 35 to 39 Minutes | 721 (1.9%) | 471 (1.3%) |
| 40 to 44 Minutes | 586 (1.5%) | 609 (1.7%) |
| 45 to 59 Minutes | 1,609 (4.2%) | 856 (2.4%) |
| 60 to 89 Minutes | 1,128 (3.0%) | 449 (1.3%) |
| 90 or more Minutes | 879 (2.3%) | 315 (0.9%) |
Time of Departure to Work by Sex in McLean County
The most frequent times of departure to work in McLean County are 7:30 AM to 7:59 AM (6,010, 15.9%) for males and 7:30 AM to 7:59 AM (6,872, 19.6%) for females.
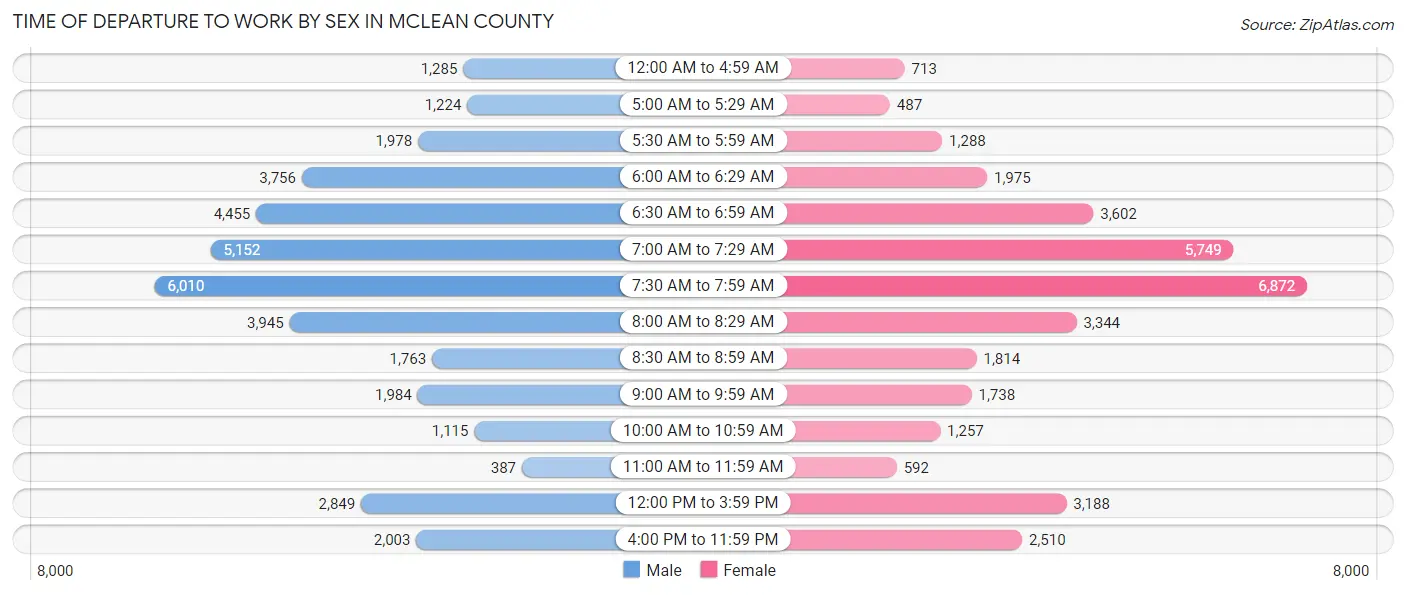
| Time of Departure | Male | Female |
| 12:00 AM to 4:59 AM | 1,285 (3.4%) | 713 (2.0%) |
| 5:00 AM to 5:29 AM | 1,224 (3.2%) | 487 (1.4%) |
| 5:30 AM to 5:59 AM | 1,978 (5.2%) | 1,288 (3.7%) |
| 6:00 AM to 6:29 AM | 3,756 (9.9%) | 1,975 (5.6%) |
| 6:30 AM to 6:59 AM | 4,455 (11.7%) | 3,602 (10.2%) |
| 7:00 AM to 7:29 AM | 5,152 (13.6%) | 5,749 (16.4%) |
| 7:30 AM to 7:59 AM | 6,010 (15.9%) | 6,872 (19.6%) |
| 8:00 AM to 8:29 AM | 3,945 (10.4%) | 3,344 (9.5%) |
| 8:30 AM to 8:59 AM | 1,763 (4.6%) | 1,814 (5.2%) |
| 9:00 AM to 9:59 AM | 1,984 (5.2%) | 1,738 (5.0%) |
| 10:00 AM to 10:59 AM | 1,115 (2.9%) | 1,257 (3.6%) |
| 11:00 AM to 11:59 AM | 387 (1.0%) | 592 (1.7%) |
| 12:00 PM to 3:59 PM | 2,849 (7.5%) | 3,188 (9.1%) |
| 4:00 PM to 11:59 PM | 2,003 (5.3%) | 2,510 (7.1%) |
| Total | 37,906 (100.0%) | 35,129 (100.0%) |
Housing Occupancy in McLean County
Occupancy by Ownership in McLean County
Of the total 68,491 dwellings in McLean County, owner-occupied units account for 44,512 (65.0%), while renter-occupied units make up 23,979 (35.0%).
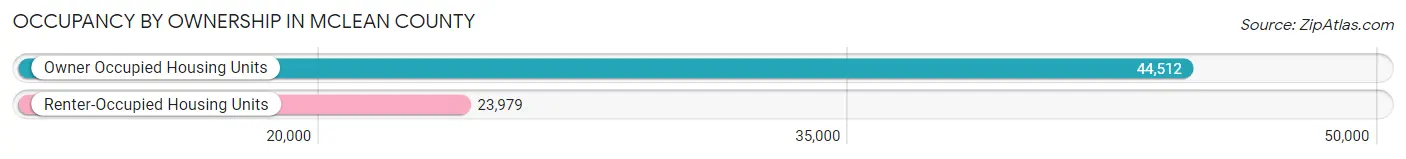
| Occupancy | # Housing Units | % Housing Units |
| Owner Occupied Housing Units | 44,512 | 65.0% |
| Renter-Occupied Housing Units | 23,979 | 35.0% |
| Total Occupied Housing Units | 68,491 | 100.0% |
Occupancy by Household Size in McLean County
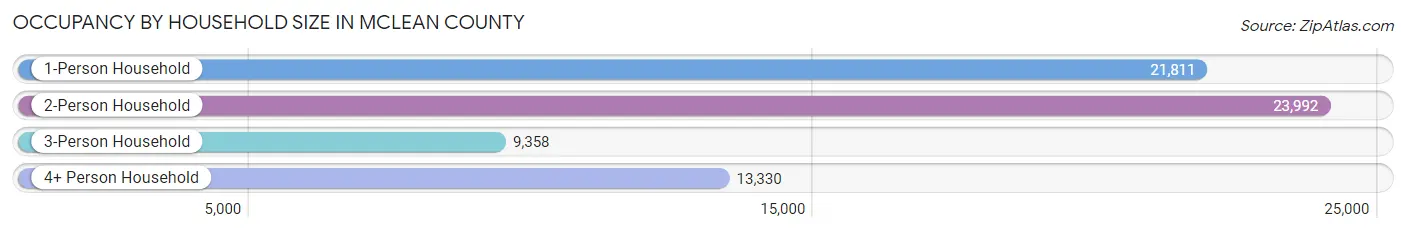
| Household Size | # Housing Units | % Housing Units |
| 1-Person Household | 21,811 | 31.9% |
| 2-Person Household | 23,992 | 35.0% |
| 3-Person Household | 9,358 | 13.7% |
| 4+ Person Household | 13,330 | 19.5% |
| Total Housing Units | 68,491 | 100.0% |
Occupancy by Ownership by Household Size in McLean County
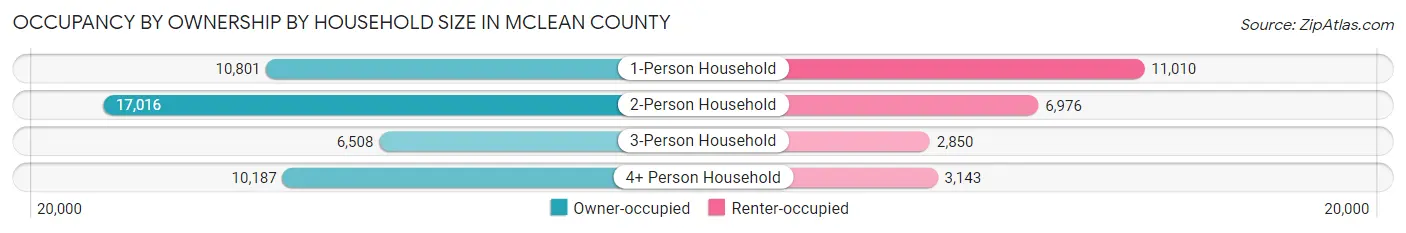
| Household Size | Owner-occupied | Renter-occupied |
| 1-Person Household | 10,801 (49.5%) | 11,010 (50.5%) |
| 2-Person Household | 17,016 (70.9%) | 6,976 (29.1%) |
| 3-Person Household | 6,508 (69.5%) | 2,850 (30.5%) |
| 4+ Person Household | 10,187 (76.4%) | 3,143 (23.6%) |
| Total Housing Units | 44,512 (65.0%) | 23,979 (35.0%) |
Occupancy by Educational Attainment in McLean County
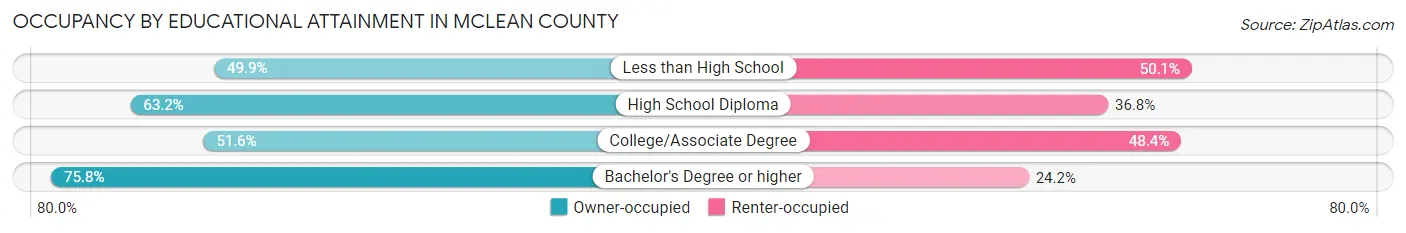
| Household Size | Owner-occupied | Renter-occupied |
| Less than High School | 1,057 (49.9%) | 1,060 (50.1%) |
| High School Diploma | 8,724 (63.2%) | 5,078 (36.8%) |
| College/Associate Degree | 10,942 (51.6%) | 10,246 (48.4%) |
| Bachelor's Degree or higher | 23,789 (75.8%) | 7,595 (24.2%) |
Occupancy by Age of Householder in McLean County
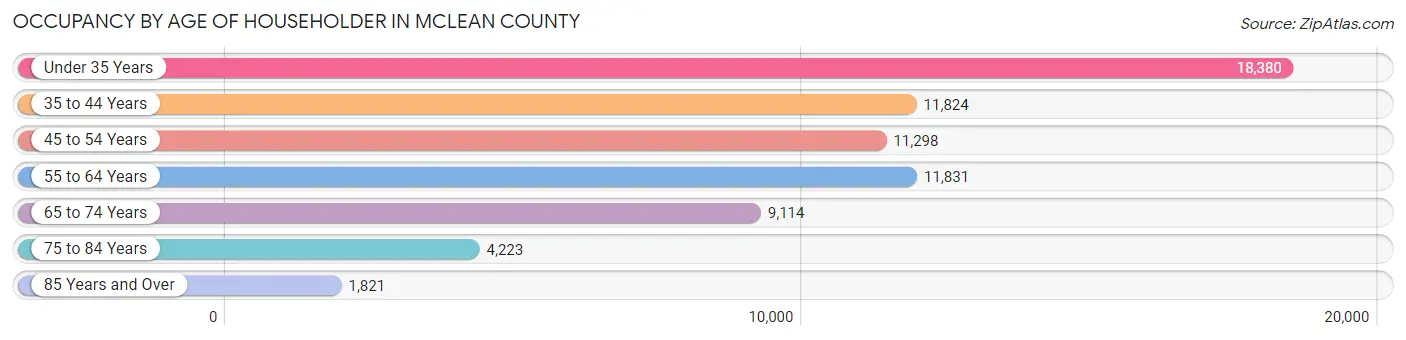
| Age Bracket | # Households | % Households |
| Under 35 Years | 18,380 | 26.8% |
| 35 to 44 Years | 11,824 | 17.3% |
| 45 to 54 Years | 11,298 | 16.5% |
| 55 to 64 Years | 11,831 | 17.3% |
| 65 to 74 Years | 9,114 | 13.3% |
| 75 to 84 Years | 4,223 | 6.2% |
| 85 Years and Over | 1,821 | 2.7% |
| Total | 68,491 | 100.0% |
Housing Finances in McLean County
Median Income by Occupancy in McLean County
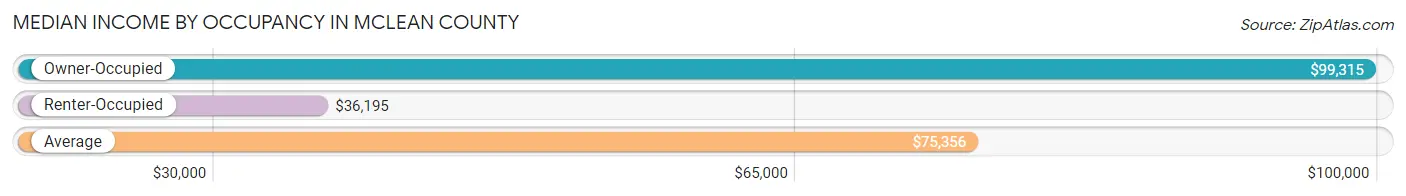
| Occupancy Type | # Households | Median Income |
| Owner-Occupied | 44,512 (65.0%) | $99,315 |
| Renter-Occupied | 23,979 (35.0%) | $36,195 |
| Average | 68,491 (100.0%) | $75,356 |
Occupancy by Householder Income Bracket in McLean County
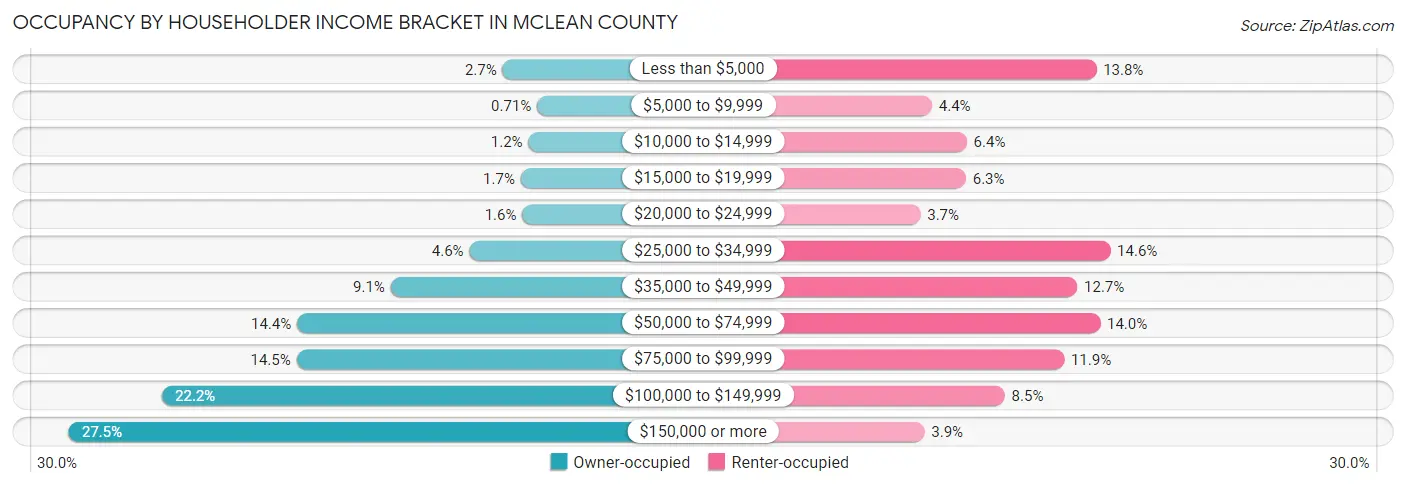
| Income Bracket | Owner-occupied | Renter-occupied |
| Less than $5,000 | 1,199 (2.7%) | 3,297 (13.8%) |
| $5,000 to $9,999 | 315 (0.7%) | 1,045 (4.4%) |
| $10,000 to $14,999 | 540 (1.2%) | 1,523 (6.4%) |
| $15,000 to $19,999 | 736 (1.7%) | 1,511 (6.3%) |
| $20,000 to $24,999 | 693 (1.6%) | 887 (3.7%) |
| $25,000 to $34,999 | 2,038 (4.6%) | 3,489 (14.5%) |
| $35,000 to $49,999 | 4,041 (9.1%) | 3,035 (12.7%) |
| $50,000 to $74,999 | 6,424 (14.4%) | 3,350 (14.0%) |
| $75,000 to $99,999 | 6,438 (14.5%) | 2,855 (11.9%) |
| $100,000 to $149,999 | 9,861 (22.2%) | 2,044 (8.5%) |
| $150,000 or more | 12,227 (27.5%) | 943 (3.9%) |
| Total | 44,512 (100.0%) | 23,979 (100.0%) |
Monthly Housing Cost Tiers in McLean County

| Monthly Cost | Owner-occupied | Renter-occupied |
| Less than $300 | 1,261 (2.8%) | 409 (1.7%) |
| $300 to $499 | 3,038 (6.8%) | 1,142 (4.8%) |
| $500 to $799 | 8,377 (18.8%) | 6,346 (26.5%) |
| $800 to $999 | 4,582 (10.3%) | 5,439 (22.7%) |
| $1,000 to $1,499 | 10,727 (24.1%) | 7,163 (29.9%) |
| $1,500 to $1,999 | 7,984 (17.9%) | 1,695 (7.1%) |
| $2,000 to $2,499 | 4,371 (9.8%) | 388 (1.6%) |
| $2,500 to $2,999 | 1,966 (4.4%) | 194 (0.8%) |
| $3,000 or more | 2,206 (5.0%) | 442 (1.8%) |
| Total | 44,512 (100.0%) | 23,979 (100.0%) |
Physical Housing Characteristics in McLean County
Housing Structures in McLean County
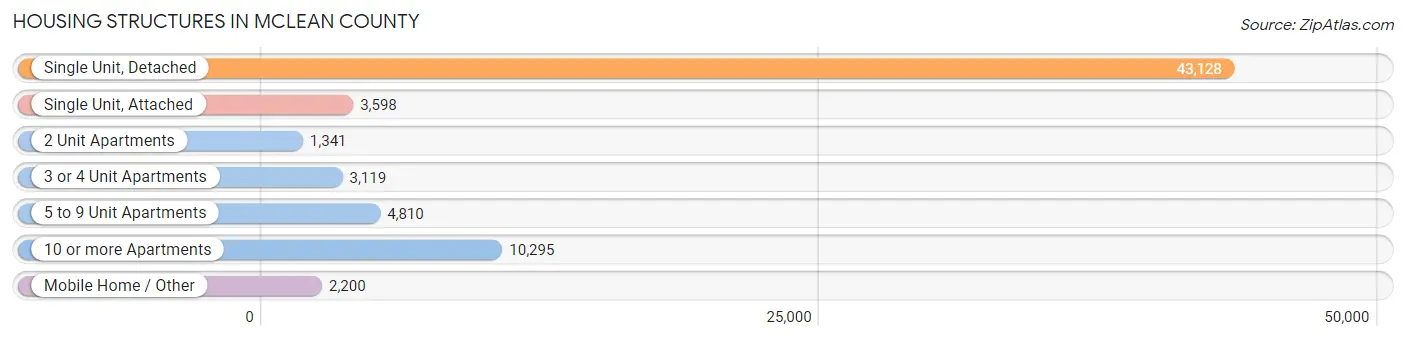
| Structure Type | # Housing Units | % Housing Units |
| Single Unit, Detached | 43,128 | 63.0% |
| Single Unit, Attached | 3,598 | 5.2% |
| 2 Unit Apartments | 1,341 | 2.0% |
| 3 or 4 Unit Apartments | 3,119 | 4.5% |
| 5 to 9 Unit Apartments | 4,810 | 7.0% |
| 10 or more Apartments | 10,295 | 15.0% |
| Mobile Home / Other | 2,200 | 3.2% |
| Total | 68,491 | 100.0% |
Housing Structures by Occupancy in McLean County
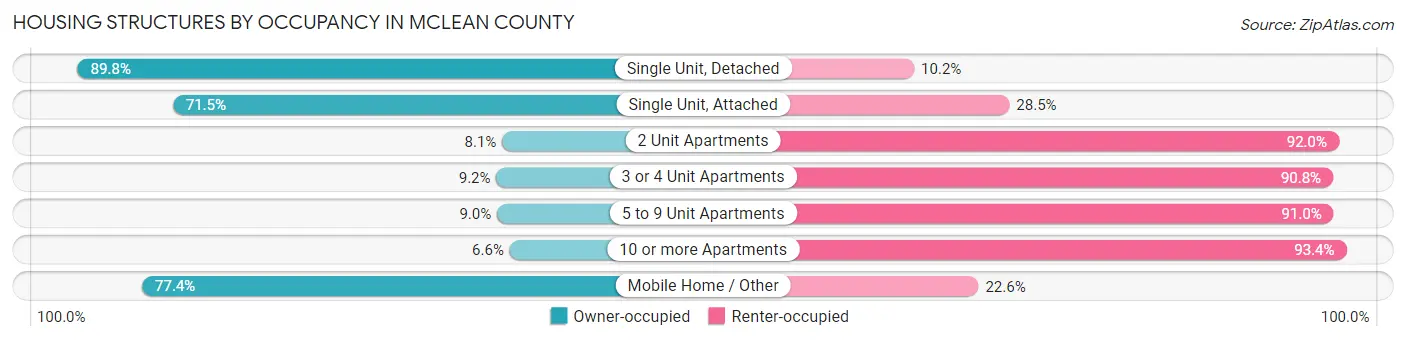
| Structure Type | Owner-occupied | Renter-occupied |
| Single Unit, Detached | 38,731 (89.8%) | 4,397 (10.2%) |
| Single Unit, Attached | 2,571 (71.5%) | 1,027 (28.5%) |
| 2 Unit Apartments | 108 (8.1%) | 1,233 (91.9%) |
| 3 or 4 Unit Apartments | 286 (9.2%) | 2,833 (90.8%) |
| 5 to 9 Unit Apartments | 435 (9.0%) | 4,375 (91.0%) |
| 10 or more Apartments | 678 (6.6%) | 9,617 (93.4%) |
| Mobile Home / Other | 1,703 (77.4%) | 497 (22.6%) |
| Total | 44,512 (65.0%) | 23,979 (35.0%) |
Housing Structures by Number of Rooms in McLean County
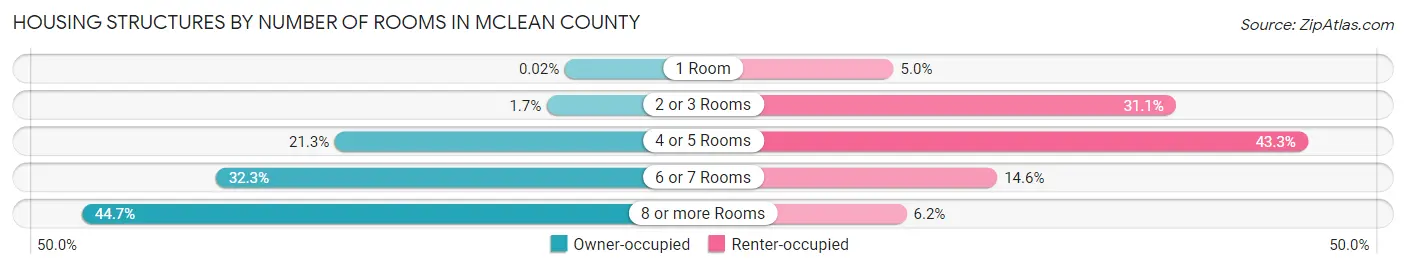
| Number of Rooms | Owner-occupied | Renter-occupied |
| 1 Room | 7 (0.0%) | 1,191 (5.0%) |
| 2 or 3 Rooms | 748 (1.7%) | 7,446 (31.0%) |
| 4 or 5 Rooms | 9,476 (21.3%) | 10,374 (43.3%) |
| 6 or 7 Rooms | 14,386 (32.3%) | 3,489 (14.5%) |
| 8 or more Rooms | 19,895 (44.7%) | 1,479 (6.2%) |
| Total | 44,512 (100.0%) | 23,979 (100.0%) |
Housing Structure by Heating Type in McLean County
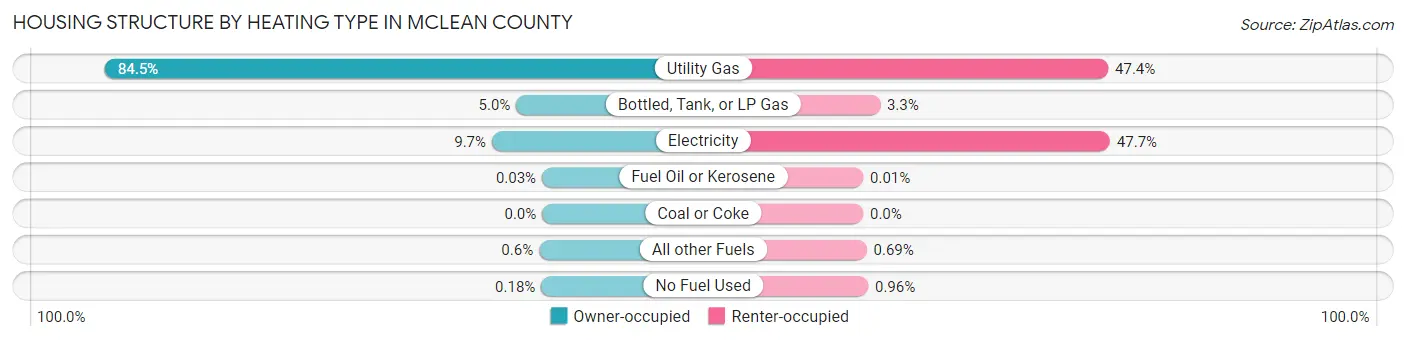
| Heating Type | Owner-occupied | Renter-occupied |
| Utility Gas | 37,599 (84.5%) | 11,357 (47.4%) |
| Bottled, Tank, or LP Gas | 2,232 (5.0%) | 784 (3.3%) |
| Electricity | 4,320 (9.7%) | 11,439 (47.7%) |
| Fuel Oil or Kerosene | 14 (0.0%) | 3 (0.0%) |
| Coal or Coke | 0 (0.0%) | 0 (0.0%) |
| All other Fuels | 265 (0.6%) | 166 (0.7%) |
| No Fuel Used | 82 (0.2%) | 230 (1.0%) |
| Total | 44,512 (100.0%) | 23,979 (100.0%) |
Household Vehicle Usage in McLean County
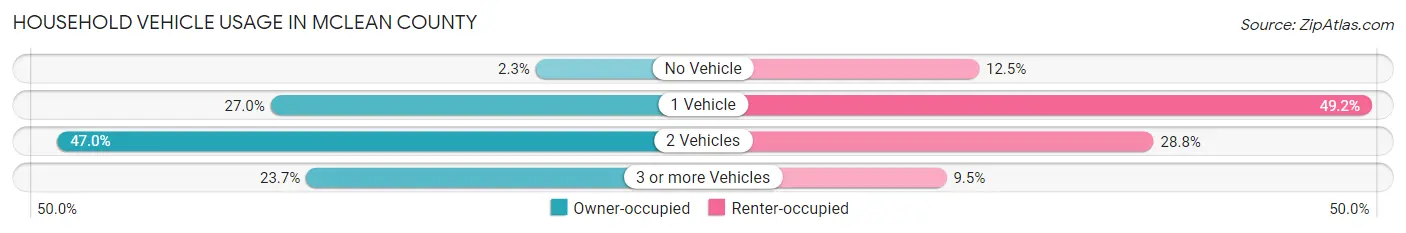
| Vehicles per Household | Owner-occupied | Renter-occupied |
| No Vehicle | 1,018 (2.3%) | 3,003 (12.5%) |
| 1 Vehicle | 12,035 (27.0%) | 11,792 (49.2%) |
| 2 Vehicles | 20,898 (46.9%) | 6,910 (28.8%) |
| 3 or more Vehicles | 10,561 (23.7%) | 2,274 (9.5%) |
| Total | 44,512 (100.0%) | 23,979 (100.0%) |
Real Estate & Mortgages in McLean County
Real Estate and Mortgage Overview in McLean County
| Characteristic | Without Mortgage | With Mortgage |
| Housing Units | 16,270 | 28,242 |
| Median Property Value | $172,600 | $199,600 |
| Median Household Income | $75,392 | $8,813 |
| Monthly Housing Costs | $666 | $2,169 |
| Real Estate Taxes | $3,968 | $262 |
Property Value by Mortgage Status in McLean County
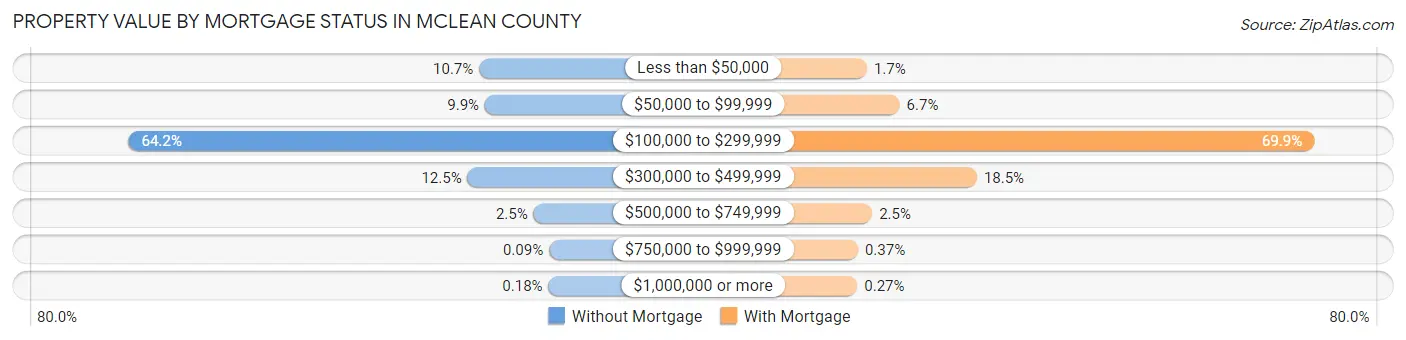
| Property Value | Without Mortgage | With Mortgage |
| Less than $50,000 | 1,748 (10.7%) | 492 (1.7%) |
| $50,000 to $99,999 | 1,605 (9.9%) | 1,898 (6.7%) |
| $100,000 to $299,999 | 10,439 (64.2%) | 19,730 (69.9%) |
| $300,000 to $499,999 | 2,035 (12.5%) | 5,226 (18.5%) |
| $500,000 to $749,999 | 399 (2.5%) | 716 (2.5%) |
| $750,000 to $999,999 | 14 (0.1%) | 104 (0.4%) |
| $1,000,000 or more | 30 (0.2%) | 76 (0.3%) |
| Total | 16,270 (100.0%) | 28,242 (100.0%) |
Household Income by Mortgage Status in McLean County
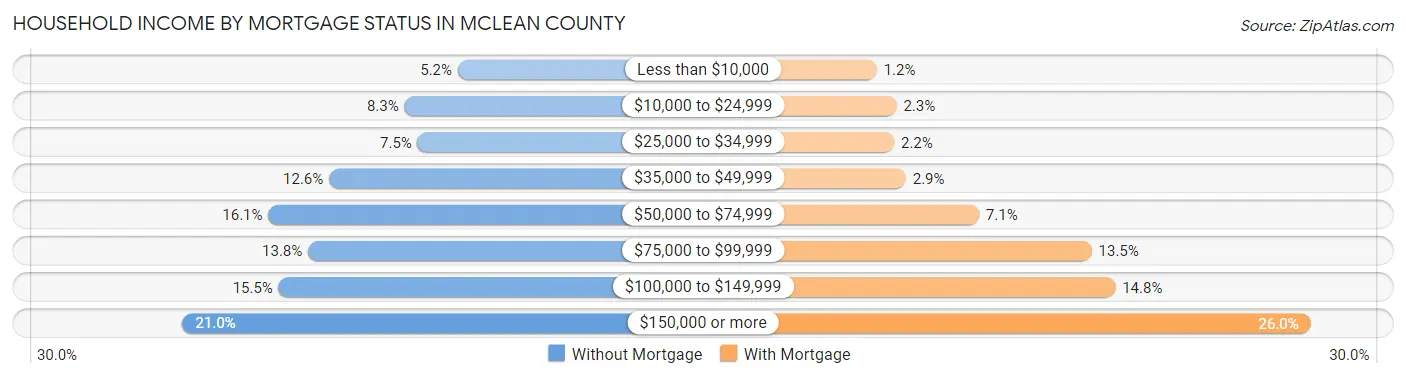
| Household Income | Without Mortgage | With Mortgage |
| Less than $10,000 | 853 (5.2%) | 343 (1.2%) |
| $10,000 to $24,999 | 1,348 (8.3%) | 661 (2.3%) |
| $25,000 to $34,999 | 1,227 (7.5%) | 621 (2.2%) |
| $35,000 to $49,999 | 2,050 (12.6%) | 811 (2.9%) |
| $50,000 to $74,999 | 2,614 (16.1%) | 1,991 (7.0%) |
| $75,000 to $99,999 | 2,246 (13.8%) | 3,810 (13.5%) |
| $100,000 to $149,999 | 2,518 (15.5%) | 4,192 (14.8%) |
| $150,000 or more | 3,414 (21.0%) | 7,343 (26.0%) |
| Total | 16,270 (100.0%) | 28,242 (100.0%) |
Property Value to Household Income Ratio in McLean County
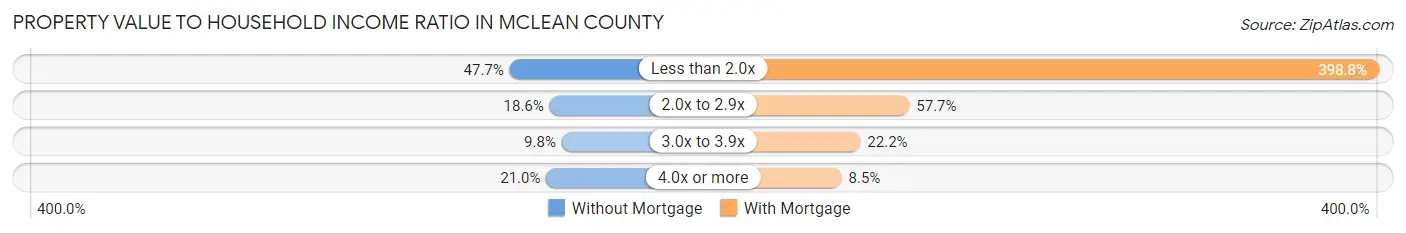
| Value-to-Income Ratio | Without Mortgage | With Mortgage |
| Less than 2.0x | 7,756 (47.7%) | 112,619 (398.8%) |
| 2.0x to 2.9x | 3,024 (18.6%) | 16,302 (57.7%) |
| 3.0x to 3.9x | 1,594 (9.8%) | 6,256 (22.2%) |
| 4.0x or more | 3,416 (21.0%) | 2,403 (8.5%) |
| Total | 16,270 (100.0%) | 28,242 (100.0%) |
Real Estate Taxes by Mortgage Status in McLean County
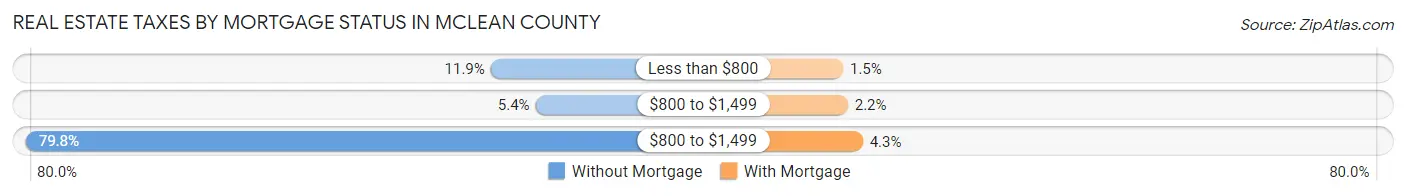
| Property Taxes | Without Mortgage | With Mortgage |
| Less than $800 | 1,937 (11.9%) | 413 (1.5%) |
| $800 to $1,499 | 872 (5.4%) | 608 (2.1%) |
| $800 to $1,499 | 12,986 (79.8%) | 1,223 (4.3%) |
| Total | 16,270 (100.0%) | 28,242 (100.0%) |
Health & Disability in McLean County
Health Insurance Coverage by Age in McLean County
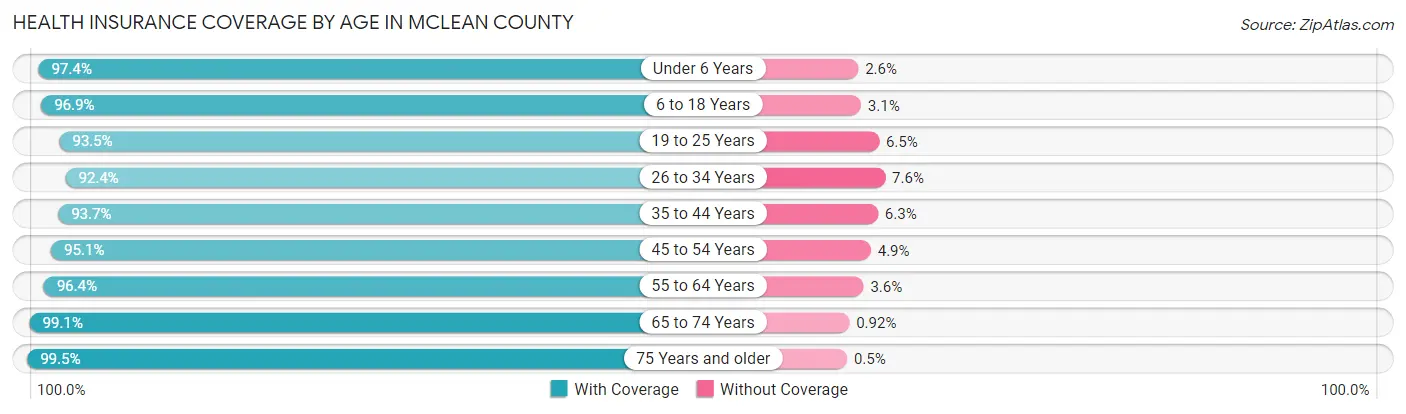
| Age Bracket | With Coverage | Without Coverage |
| Under 6 Years | 10,986 (97.4%) | 293 (2.6%) |
| 6 to 18 Years | 28,284 (96.9%) | 905 (3.1%) |
| 19 to 25 Years | 25,609 (93.5%) | 1,772 (6.5%) |
| 26 to 34 Years | 18,093 (92.4%) | 1,492 (7.6%) |
| 35 to 44 Years | 19,649 (93.7%) | 1,314 (6.3%) |
| 45 to 54 Years | 18,058 (95.1%) | 939 (4.9%) |
| 55 to 64 Years | 18,986 (96.4%) | 704 (3.6%) |
| 65 to 74 Years | 14,138 (99.1%) | 131 (0.9%) |
| 75 Years and older | 8,892 (99.5%) | 45 (0.5%) |
| Total | 162,695 (95.5%) | 7,595 (4.5%) |
Health Insurance Coverage by Citizenship Status in McLean County
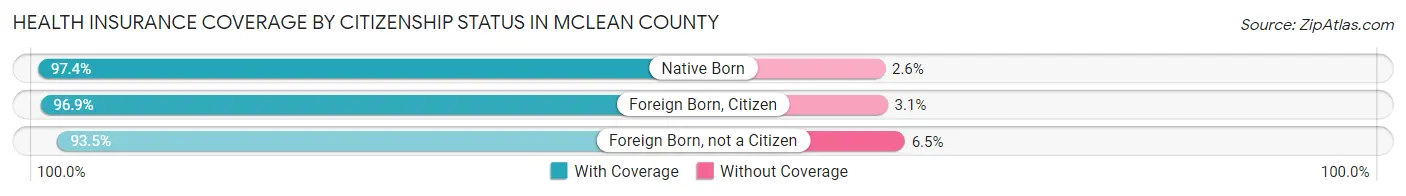
| Citizenship Status | With Coverage | Without Coverage |
| Native Born | 10,986 (97.4%) | 293 (2.6%) |
| Foreign Born, Citizen | 28,284 (96.9%) | 905 (3.1%) |
| Foreign Born, not a Citizen | 25,609 (93.5%) | 1,772 (6.5%) |
Health Insurance Coverage by Household Income in McLean County
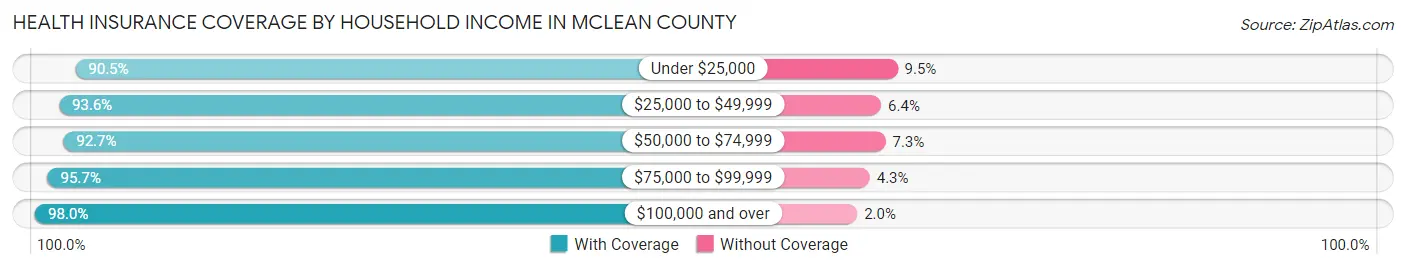
| Household Income | With Coverage | Without Coverage |
| Under $25,000 | 18,168 (90.5%) | 1,912 (9.5%) |
| $25,000 to $49,999 | 21,460 (93.6%) | 1,476 (6.4%) |
| $50,000 to $74,999 | 20,356 (92.7%) | 1,593 (7.3%) |
| $75,000 to $99,999 | 21,421 (95.7%) | 965 (4.3%) |
| $100,000 and over | 74,053 (98.0%) | 1,479 (2.0%) |
Public vs Private Health Insurance Coverage by Age in McLean County
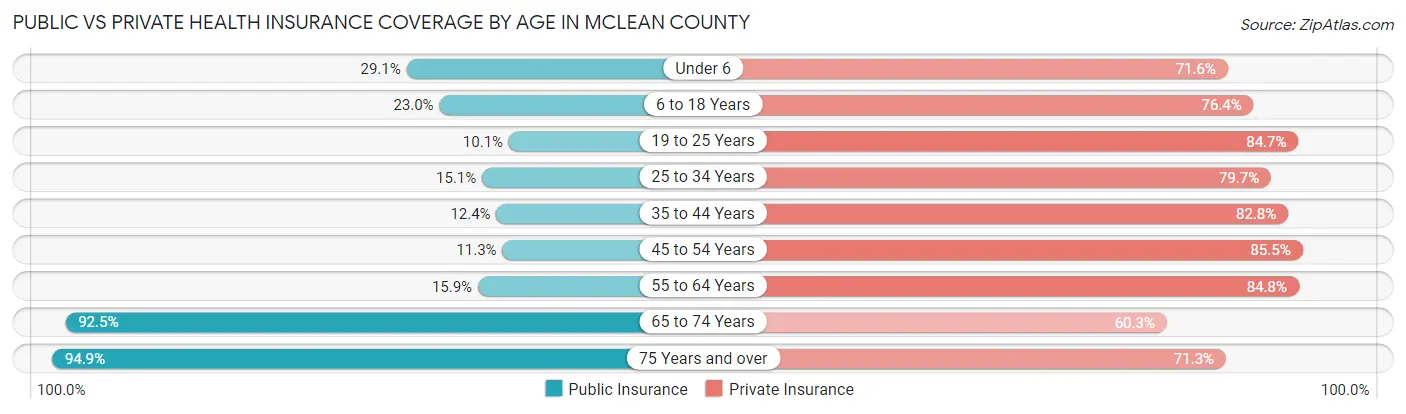
| Age Bracket | Public Insurance | Private Insurance |
| Under 6 | 3,282 (29.1%) | 8,078 (71.6%) |
| 6 to 18 Years | 6,714 (23.0%) | 22,313 (76.4%) |
| 19 to 25 Years | 2,769 (10.1%) | 23,196 (84.7%) |
| 25 to 34 Years | 2,953 (15.1%) | 15,603 (79.7%) |
| 35 to 44 Years | 2,603 (12.4%) | 17,366 (82.8%) |
| 45 to 54 Years | 2,149 (11.3%) | 16,243 (85.5%) |
| 55 to 64 Years | 3,120 (15.9%) | 16,702 (84.8%) |
| 65 to 74 Years | 13,191 (92.4%) | 8,606 (60.3%) |
| 75 Years and over | 8,484 (94.9%) | 6,371 (71.3%) |
| Total | 45,265 (26.6%) | 134,478 (79.0%) |
Disability Status by Sex by Age in McLean County
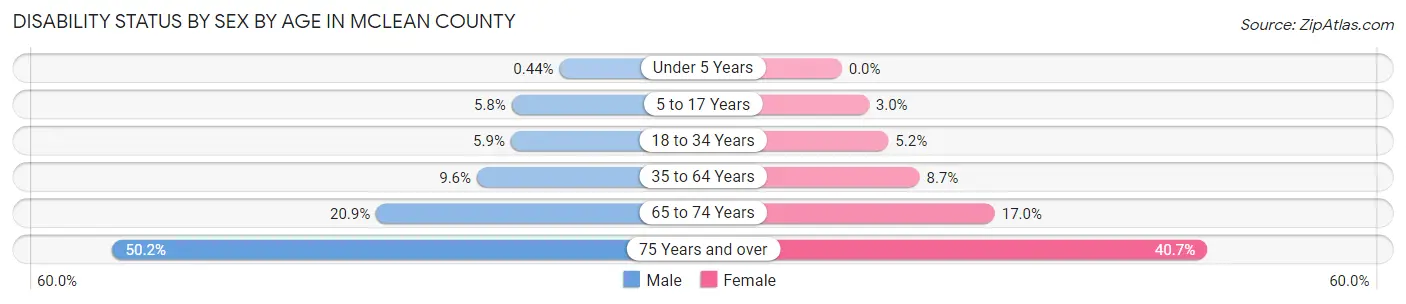
| Age Bracket | Male | Female |
| Under 5 Years | 21 (0.4%) | 0 (0.0%) |
| 5 to 17 Years | 790 (5.8%) | 400 (3.0%) |
| 18 to 34 Years | 1,450 (5.9%) | 1,359 (5.2%) |
| 35 to 64 Years | 2,859 (9.6%) | 2,593 (8.7%) |
| 65 to 74 Years | 1,400 (20.9%) | 1,288 (17.0%) |
| 75 Years and over | 1,879 (50.2%) | 2,112 (40.7%) |
Disability Class by Sex by Age in McLean County
Disability Class: Hearing Difficulty
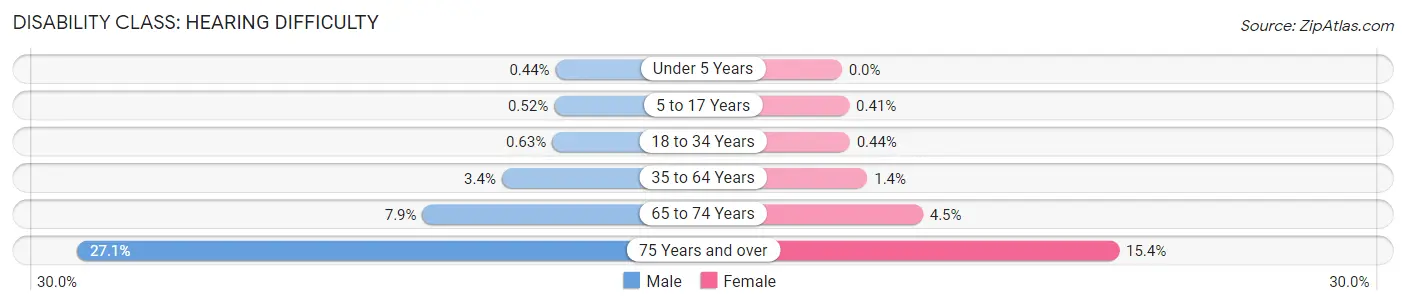
| Age Bracket | Male | Female |
| Under 5 Years | 21 (0.4%) | 0 (0.0%) |
| 5 to 17 Years | 71 (0.5%) | 54 (0.4%) |
| 18 to 34 Years | 155 (0.6%) | 116 (0.4%) |
| 35 to 64 Years | 1,019 (3.4%) | 424 (1.4%) |
| 65 to 74 Years | 527 (7.9%) | 341 (4.5%) |
| 75 Years and over | 1,014 (27.1%) | 802 (15.4%) |
Disability Class: Vision Difficulty
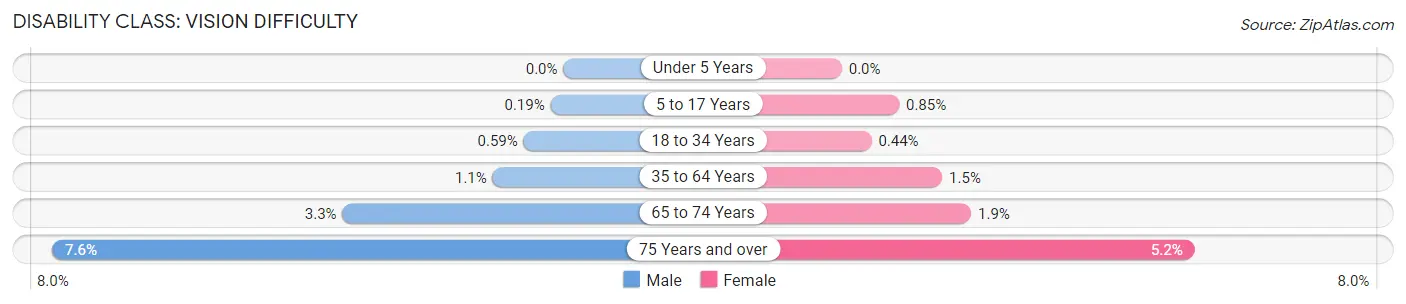
| Age Bracket | Male | Female |
| Under 5 Years | 0 (0.0%) | 0 (0.0%) |
| 5 to 17 Years | 26 (0.2%) | 113 (0.9%) |
| 18 to 34 Years | 146 (0.6%) | 115 (0.4%) |
| 35 to 64 Years | 312 (1.1%) | 446 (1.5%) |
| 65 to 74 Years | 220 (3.3%) | 145 (1.9%) |
| 75 Years and over | 284 (7.6%) | 272 (5.2%) |
Disability Class: Cognitive Difficulty
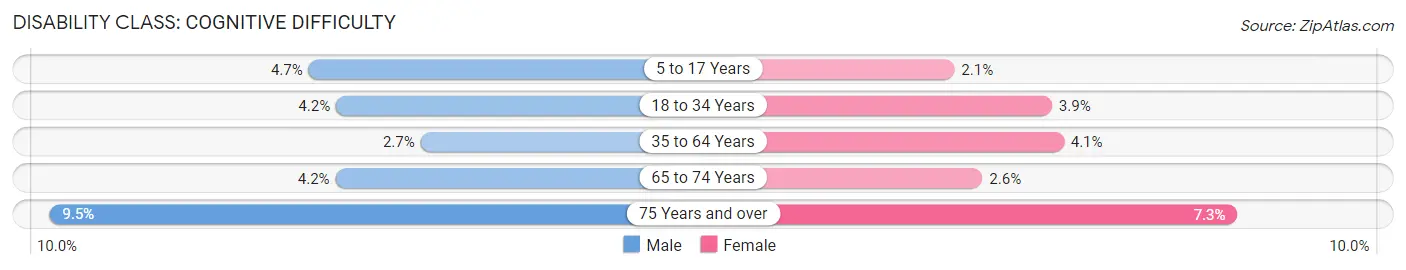
| Age Bracket | Male | Female |
| 5 to 17 Years | 649 (4.7%) | 278 (2.1%) |
| 18 to 34 Years | 1,045 (4.2%) | 1,021 (3.9%) |
| 35 to 64 Years | 786 (2.6%) | 1,234 (4.1%) |
| 65 to 74 Years | 284 (4.2%) | 197 (2.6%) |
| 75 Years and over | 357 (9.5%) | 381 (7.3%) |
Disability Class: Ambulatory Difficulty
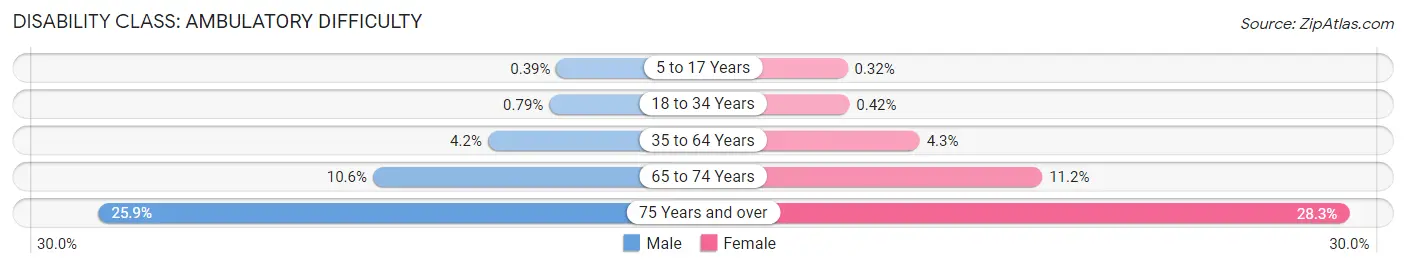
| Age Bracket | Male | Female |
| 5 to 17 Years | 53 (0.4%) | 42 (0.3%) |
| 18 to 34 Years | 195 (0.8%) | 110 (0.4%) |
| 35 to 64 Years | 1,250 (4.2%) | 1,301 (4.3%) |
| 65 to 74 Years | 712 (10.6%) | 843 (11.2%) |
| 75 Years and over | 969 (25.9%) | 1,467 (28.2%) |
Disability Class: Self-Care Difficulty
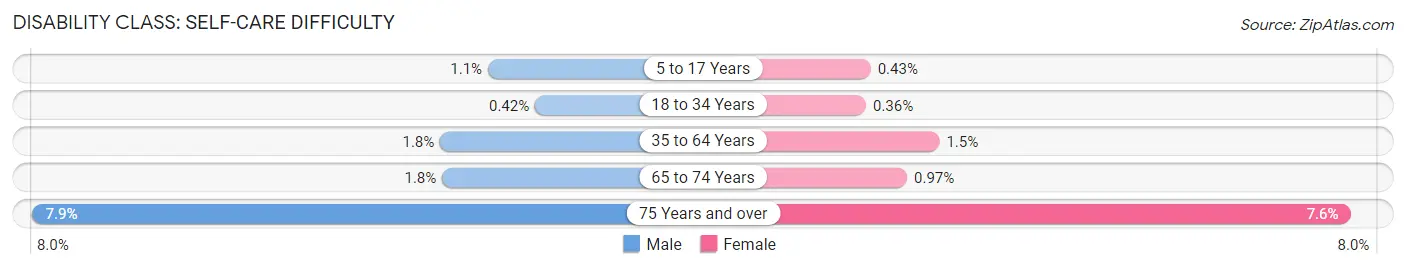
| Age Bracket | Male | Female |
| 5 to 17 Years | 153 (1.1%) | 57 (0.4%) |
| 18 to 34 Years | 105 (0.4%) | 95 (0.4%) |
| 35 to 64 Years | 544 (1.8%) | 435 (1.5%) |
| 65 to 74 Years | 121 (1.8%) | 73 (1.0%) |
| 75 Years and over | 295 (7.9%) | 392 (7.5%) |
Technology Access in McLean County
Computing Device Access in McLean County
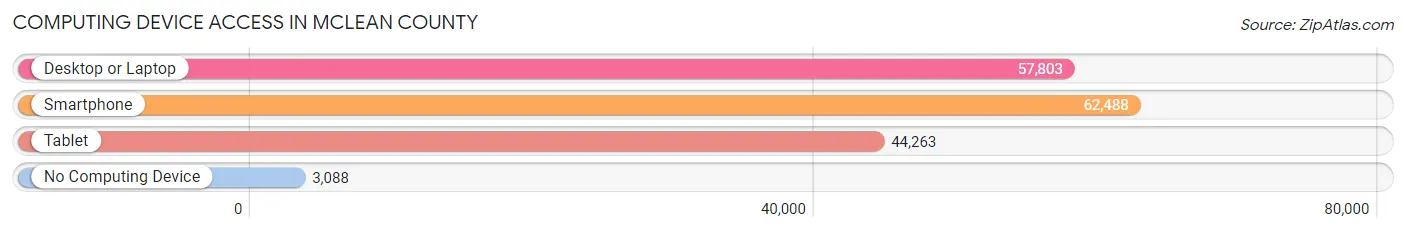
| Device Type | # Households | % Households |
| Desktop or Laptop | 57,803 | 84.4% |
| Smartphone | 62,488 | 91.2% |
| Tablet | 44,263 | 64.6% |
| No Computing Device | 3,088 | 4.5% |
| Total | 68,491 | 100.0% |
Internet Access in McLean County
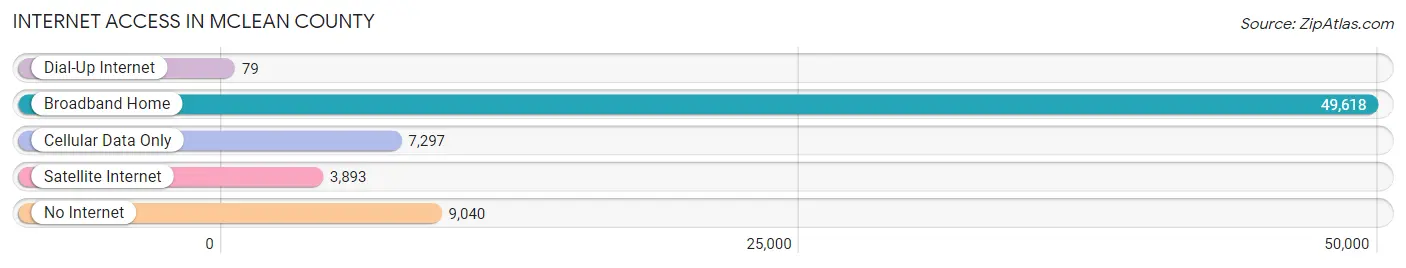
| Internet Type | # Households | % Households |
| Dial-Up Internet | 79 | 0.1% |
| Broadband Home | 49,618 | 72.4% |
| Cellular Data Only | 7,297 | 10.6% |
| Satellite Internet | 3,893 | 5.7% |
| No Internet | 9,040 | 13.2% |
| Total | 68,491 | 100.0% |
McLean County Summary
Mclean County, Illinois is located in the central part of the state, and is part of the Bloomington-Normal Metropolitan Statistical Area. It is bordered by Woodford County to the north, Livingston County to the east, Ford County to the south, and McDonough County to the west. The county seat is Bloomington, and the county has a total area of 576 square miles.
History
Mclean County was formed in 1830 from parts of Tazewell and McDonough counties. It was named after John McLean, a United States Senator from Illinois. The county was initially settled by pioneers from the East Coast, and the first county seat was located in Calhoun. In 1831, the county seat was moved to Bloomington, which was then a small village.
The county experienced rapid growth in the late 19th century, due to the construction of the Illinois Central Railroad. This allowed for the transportation of goods and people to and from the county, and helped to spur economic growth. The county also experienced a population boom, as many people moved to the area to take advantage of the new opportunities.
Geography
Mclean County is located in the central part of the state, and is part of the Bloomington-Normal Metropolitan Statistical Area. It is bordered by Woodford County to the north, Livingston County to the east, Ford County to the south, and McDonough County to the west. The county has a total area of 576 square miles, and is mostly flat, with some rolling hills in the northern part of the county. The county is drained by the Mackinaw River, which flows through the county from north to south.
The county is home to several state parks, including Kickapoo State Park, which is located in the northern part of the county. The park is home to a variety of wildlife, including deer, turkey, and waterfowl. The county also contains several lakes, including Lake Bloomington, which is a popular destination for fishing and boating.
Economy
Mclean County has a diverse economy, with a variety of industries represented. The county is home to several large employers, including State Farm Insurance, Country Financial, and Mitsubishi Motors. The county is also home to several higher education institutions, including Illinois State University, Heartland Community College, and Lincoln College.
The county is also home to several manufacturing companies, including Mitsubishi Motors, which produces cars and trucks in the county. The county is also home to several agricultural operations, including corn, soybeans, and livestock.
Demographics
As of the 2010 census, the population of Mclean County was 169,572. The population is fairly evenly split between men and women, with 50.3% of the population being male and 49.7% being female. The median age of the population is 36.7 years, and the median household income is $60,945.
The racial makeup of the county is 87.3% White, 8.2% African American, 0.7% Asian, 0.3% Native American, and 3.5% from other races. The largest ancestry groups in the county are German (25.3%), Irish (17.2%), English (14.2%), and American (10.2%).
Conclusion
Mclean County, Illinois is a diverse county located in the central part of the state. It is home to a variety of industries, including manufacturing, agriculture, and higher education. The county has a population of 169,572, and is fairly evenly split between men and women. The largest ancestry groups in the county are German, Irish, English, and American. The county is home to several state parks and lakes, and is a popular destination for fishing and boating.
Common Questions
What is the Total Population of McLean County?
Total Population of McLean County is 171,284.
What is the Total Male Population of McLean County?
Total Male Population of McLean County is 83,922.
What is the Total Female Population of McLean County?
Total Female Population of McLean County is 87,362.
What is the Ratio of Males per 100 Females in McLean County?
There are 96.06 Males per 100 Females in McLean County.
What is the Ratio of Females per 100 Males in McLean County?
There are 104.10 Females per 100 Males in McLean County.
What is the Median Population Age in McLean County?
Median Population Age in McLean County is 34.0 Years.
What is the Average Family Size in McLean County
Average Family Size in McLean County is 3.0 People.
What is the Average Household Size in McLean County
Average Household Size in McLean County is 2.4 People.
What is Per Capita Income in McLean County?
Per Capita income in McLean County is $40,252.
What is the Median Family Income in McLean County?
Median Family Income in McLean County is $105,528.
What is the Median Household income in McLean County?
Median Household Income in McLean County is $75,356.
What is Income or Wage Gap in McLean County?
Income or Wage Gap in McLean County is 35.4%.
Women in McLean County earn 64.6 cents for every dollar earned by a man.
What is Family Income Deficit in McLean County?
Family Income Deficit in McLean County is $12,319.
Families that are below poverty line in McLean County earn $12,319 less on average than the poverty threshold level.
What is Inequality or Gini Index in McLean County?
Inequality or Gini Index in McLean County is 0.48.
How Large is the Labor Force in McLean County?
There are 88,779 People in the Labor Forcein in McLean County.
What is the Percentage of People in the Labor Force in McLean County?
63.9% of People are in the Labor Force in McLean County.
What is the Unemployment Rate in McLean County?
Unemployment Rate in McLean County is 3.2%.