Massac County, IL
Massac County Map
Massac County Overview
14,135
TOTAL POPULATION
6,869
MALE POPULATION
7,266
FEMALE POPULATION
94.54
MALES / 100 FEMALES
105.78
FEMALES / 100 MALES
44.1
MEDIAN AGE
3.0
AVG FAMILY SIZE
2.6
AVG HOUSEHOLD SIZE
$28,817
PER CAPITA INCOME
$69,664
AVG FAMILY INCOME
$57,365
AVG HOUSEHOLD INCOME
44.4%
WAGE / INCOME GAP [ % ]
55.6¢/ $1
WAGE / INCOME GAP [ $ ]
$10,216
FAMILY INCOME DEFICIT
0.40
INEQUALITY / GINI INDEX
5,941
LABOR FORCE [ PEOPLE ]
52.1%
PERCENT IN LABOR FORCE
3.7%
UNEMPLOYMENT RATE
Massac County Area Codes
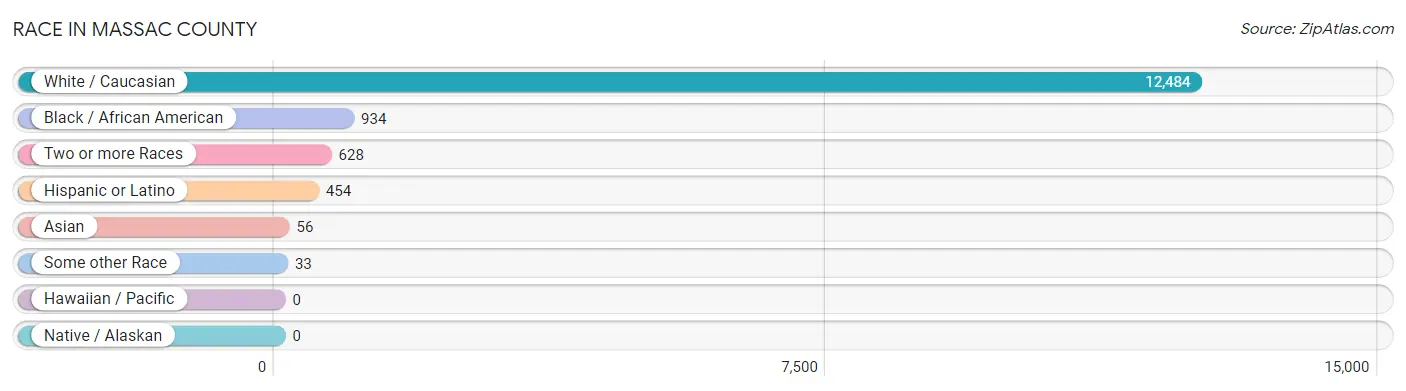
Race in Massac County
The most populous races in Massac County are White / Caucasian (12,484 | 88.3%), Black / African American (934 | 6.6%), and Two or more Races (628 | 4.4%).
| Race | # Population | % Population |
| Asian | 56 | 0.4% |
| Black / African American | 934 | 6.6% |
| Hawaiian / Pacific | 0 | 0.0% |
| Hispanic or Latino | 454 | 3.2% |
| Native / Alaskan | 0 | 0.0% |
| White / Caucasian | 12,484 | 88.3% |
| Two or more Races | 628 | 4.4% |
| Some other Race | 33 | 0.2% |
| Total | 14,135 | 100.0% |
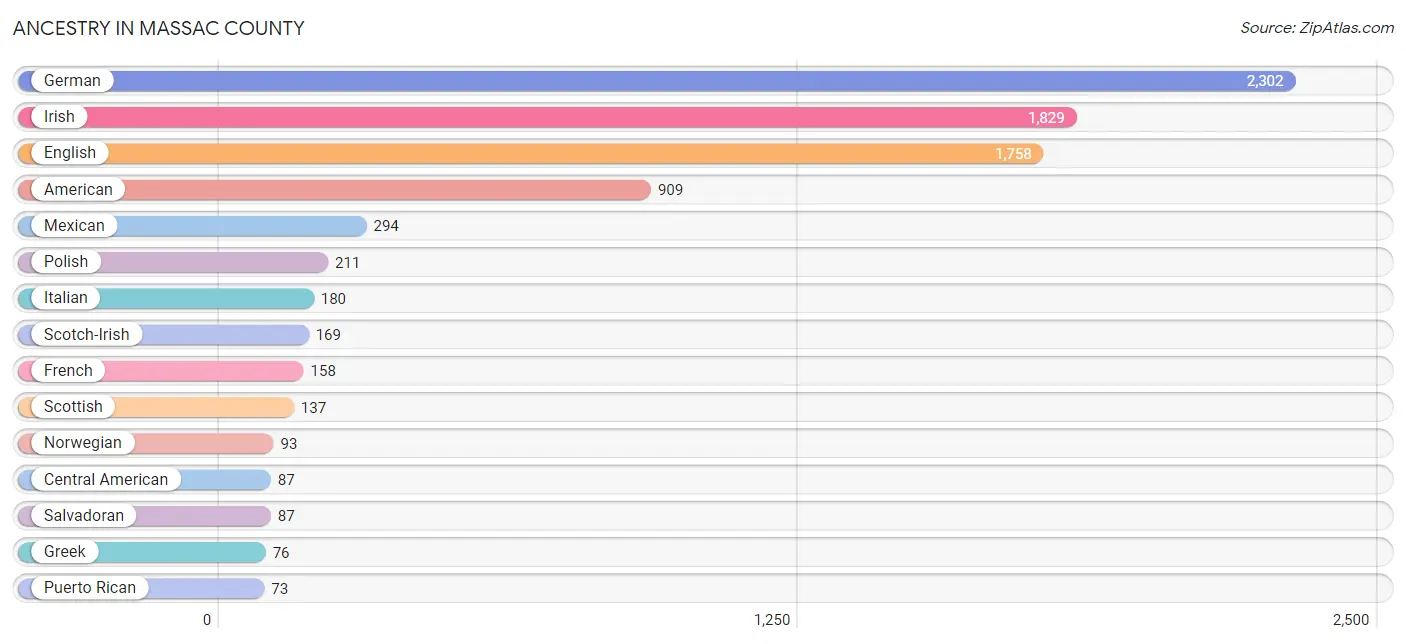
Ancestry in Massac County
The most populous ancestries reported in Massac County are German (2,302 | 16.3%), Irish (1,829 | 12.9%), English (1,758 | 12.4%), American (909 | 6.4%), and Mexican (294 | 2.1%), together accounting for 50.2% of all Massac County residents.
| Ancestry | # Population | % Population |
| African | 48 | 0.3% |
| American | 909 | 6.4% |
| Arab | 30 | 0.2% |
| Belgian | 3 | 0.0% |
| Bhutanese | 11 | 0.1% |
| Blackfeet | 8 | 0.1% |
| British | 50 | 0.4% |
| Burmese | 37 | 0.3% |
| Central American | 87 | 0.6% |
| Cherokee | 56 | 0.4% |
| Chinese | 6 | 0.0% |
| Chippewa | 4 | 0.0% |
| Czech | 11 | 0.1% |
| Dutch | 49 | 0.4% |
| English | 1,758 | 12.4% |
| European | 49 | 0.4% |
| French | 158 | 1.1% |
| French Canadian | 31 | 0.2% |
| German | 2,302 | 16.3% |
| Greek | 76 | 0.5% |
| Hungarian | 37 | 0.3% |
| Indian (Asian) | 3 | 0.0% |
| Iranian | 7 | 0.1% |
| Irish | 1,829 | 12.9% |
| Italian | 180 | 1.3% |
| Japanese | 15 | 0.1% |
| Jordanian | 9 | 0.1% |
| Korean | 1 | 0.0% |
| Lithuanian | 12 | 0.1% |
| Mexican | 294 | 2.1% |
| Northern European | 16 | 0.1% |
| Norwegian | 93 | 0.7% |
| Palestinian | 21 | 0.2% |
| Polish | 211 | 1.5% |
| Portuguese | 4 | 0.0% |
| Puerto Rican | 73 | 0.5% |
| Romanian | 4 | 0.0% |
| Russian | 4 | 0.0% |
| Salvadoran | 87 | 0.6% |
| Scandinavian | 9 | 0.1% |
| Scotch-Irish | 169 | 1.2% |
| Scottish | 137 | 1.0% |
| Subsaharan African | 48 | 0.3% |
| Swedish | 53 | 0.4% |
| Swiss | 69 | 0.5% |
| Welsh | 2 | 0.0% |
| Yugoslavian | 4 | 0.0% | View All 47 Rows |
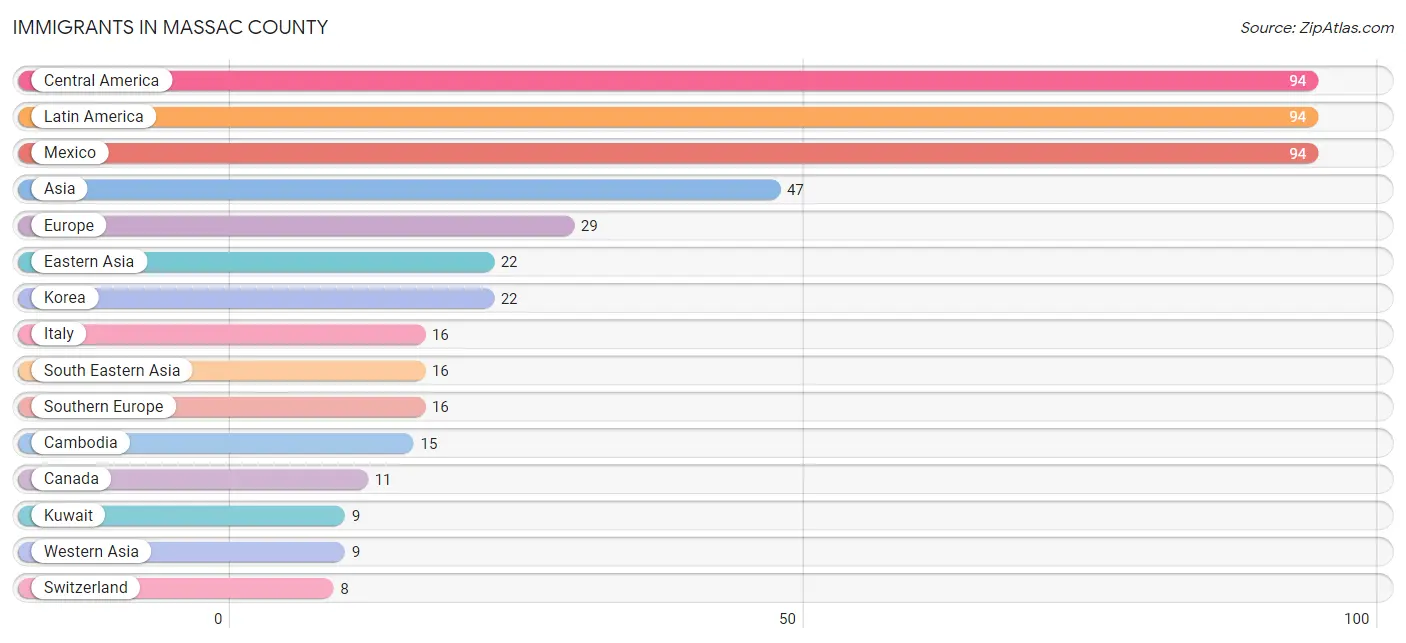
Immigrants in Massac County
The most numerous immigrant groups reported in Massac County came from Central America (94 | 0.7%), Latin America (94 | 0.7%), Mexico (94 | 0.7%), Asia (47 | 0.3%), and Europe (29 | 0.2%), together accounting for 2.6% of all Massac County residents.
| Immigration Origin | # Population | % Population |
| Asia | 47 | 0.3% |
| Bosnia and Herzegovina | 4 | 0.0% |
| Cambodia | 15 | 0.1% |
| Canada | 11 | 0.1% |
| Central America | 94 | 0.7% |
| Eastern Asia | 22 | 0.2% |
| Eastern Europe | 4 | 0.0% |
| England | 1 | 0.0% |
| Europe | 29 | 0.2% |
| Italy | 16 | 0.1% |
| Korea | 22 | 0.2% |
| Kuwait | 9 | 0.1% |
| Latin America | 94 | 0.7% |
| Mexico | 94 | 0.7% |
| Northern Europe | 1 | 0.0% |
| Philippines | 1 | 0.0% |
| South Eastern Asia | 16 | 0.1% |
| Southern Europe | 16 | 0.1% |
| Switzerland | 8 | 0.1% |
| Western Asia | 9 | 0.1% |
| Western Europe | 8 | 0.1% | View All 21 Rows |
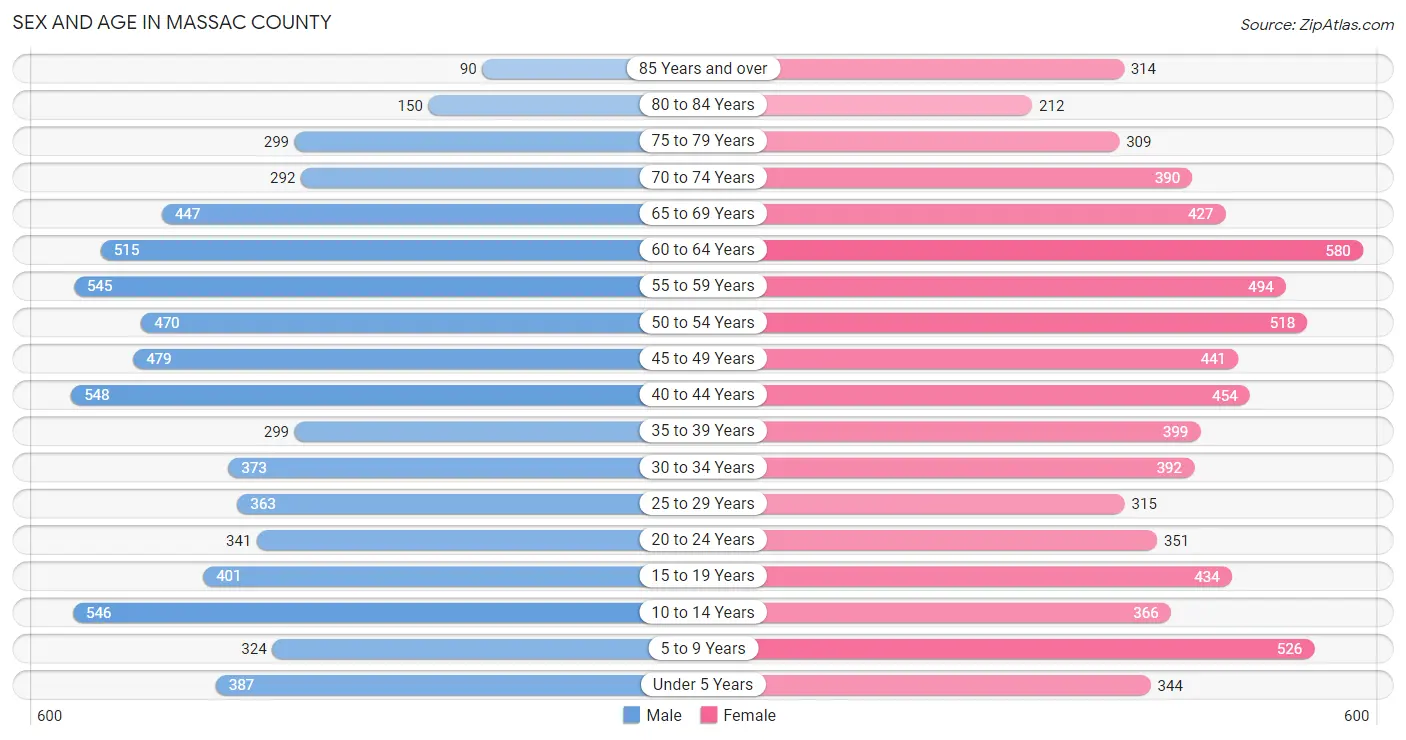
Sex and Age in Massac County
Sex and Age in Massac County
The most populous age groups in Massac County are 40 to 44 Years (548 | 8.0%) for men and 60 to 64 Years (580 | 8.0%) for women.
| Age Bracket | Male | Female |
| Under 5 Years | 387 (5.6%) | 344 (4.7%) |
| 5 to 9 Years | 324 (4.7%) | 526 (7.2%) |
| 10 to 14 Years | 546 (8.0%) | 366 (5.0%) |
| 15 to 19 Years | 401 (5.8%) | 434 (6.0%) |
| 20 to 24 Years | 341 (5.0%) | 351 (4.8%) |
| 25 to 29 Years | 363 (5.3%) | 315 (4.3%) |
| 30 to 34 Years | 373 (5.4%) | 392 (5.4%) |
| 35 to 39 Years | 299 (4.3%) | 399 (5.5%) |
| 40 to 44 Years | 548 (8.0%) | 454 (6.2%) |
| 45 to 49 Years | 479 (7.0%) | 441 (6.1%) |
| 50 to 54 Years | 470 (6.8%) | 518 (7.1%) |
| 55 to 59 Years | 545 (7.9%) | 494 (6.8%) |
| 60 to 64 Years | 515 (7.5%) | 580 (8.0%) |
| 65 to 69 Years | 447 (6.5%) | 427 (5.9%) |
| 70 to 74 Years | 292 (4.3%) | 390 (5.4%) |
| 75 to 79 Years | 299 (4.3%) | 309 (4.3%) |
| 80 to 84 Years | 150 (2.2%) | 212 (2.9%) |
| 85 Years and over | 90 (1.3%) | 314 (4.3%) |
| Total | 6,869 (100.0%) | 7,266 (100.0%) |
Families and Households in Massac County
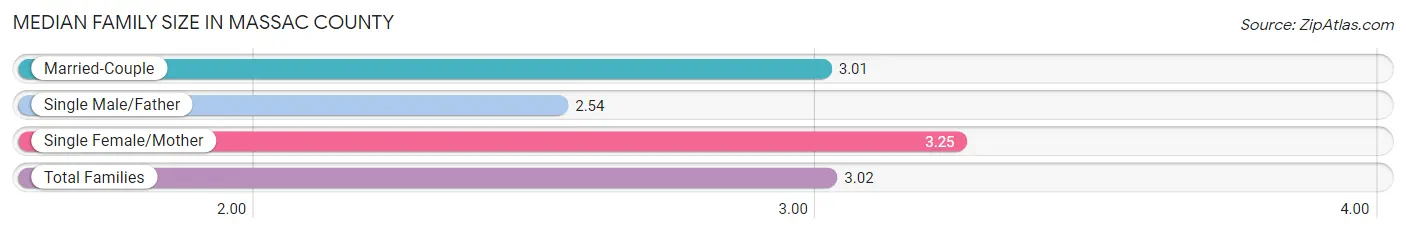
Median Family Size in Massac County
The median family size in Massac County is 3.02 persons per family, with single female/mother families (593 | 16.1%) accounting for the largest median family size of 3.25 persons per family. On the other hand, single male/father families (197 | 5.3%) represent the smallest median family size with 2.54 persons per family.
| Family Type | # Families | Family Size |
| Married-Couple | 2,897 (78.6%) | 3.01 |
| Single Male/Father | 197 (5.3%) | 2.54 |
| Single Female/Mother | 593 (16.1%) | 3.25 |
| Total Families | 3,687 (100.0%) | 3.02 |
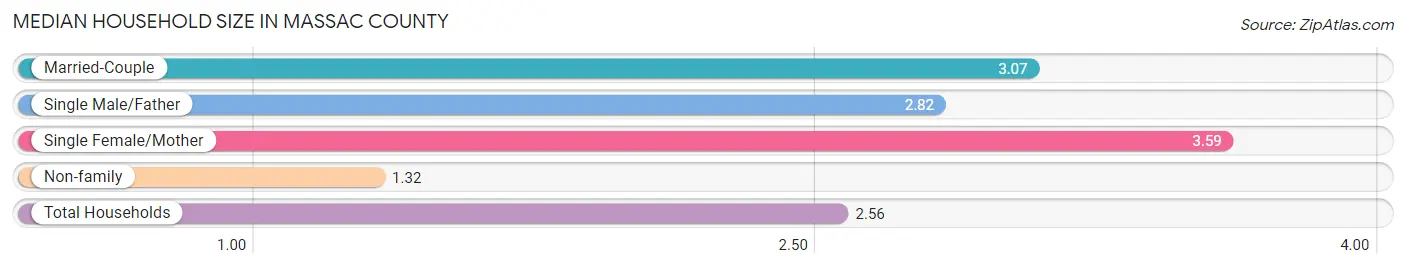
Median Household Size in Massac County
The median household size in Massac County is 2.56 persons per household, with single female/mother households (593 | 11.0%) accounting for the largest median household size of 3.59 persons per household. non-family households (1,726 | 31.9%) represent the smallest median household size with 1.32 persons per household.
| Household Type | # Households | Household Size |
| Married-Couple | 2,897 (53.5%) | 3.07 |
| Single Male/Father | 197 (3.6%) | 2.82 |
| Single Female/Mother | 593 (11.0%) | 3.59 |
| Non-family | 1,726 (31.9%) | 1.32 |
| Total Households | 5,413 (100.0%) | 2.56 |
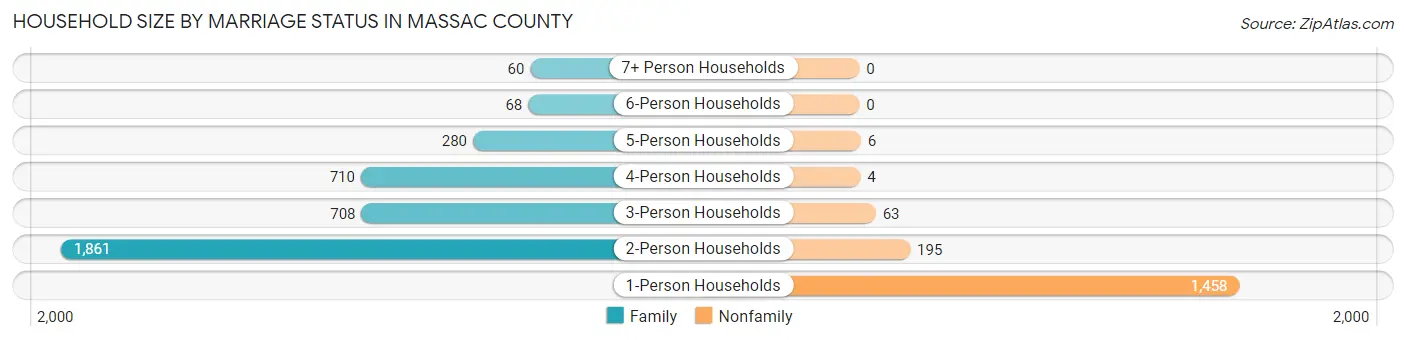
Household Size by Marriage Status in Massac County
Out of a total of 5,413 households in Massac County, 3,687 (68.1%) are family households, while 1,726 (31.9%) are nonfamily households. The most numerous type of family households are 2-person households, comprising 1,861, and the most common type of nonfamily households are 1-person households, comprising 1,458.
| Household Size | Family Households | Nonfamily Households |
| 1-Person Households | - | 1,458 (26.9%) |
| 2-Person Households | 1,861 (34.4%) | 195 (3.6%) |
| 3-Person Households | 708 (13.1%) | 63 (1.2%) |
| 4-Person Households | 710 (13.1%) | 4 (0.1%) |
| 5-Person Households | 280 (5.2%) | 6 (0.1%) |
| 6-Person Households | 68 (1.3%) | 0 (0.0%) |
| 7+ Person Households | 60 (1.1%) | 0 (0.0%) |
| Total | 3,687 (68.1%) | 1,726 (31.9%) |
Female Fertility in Massac County
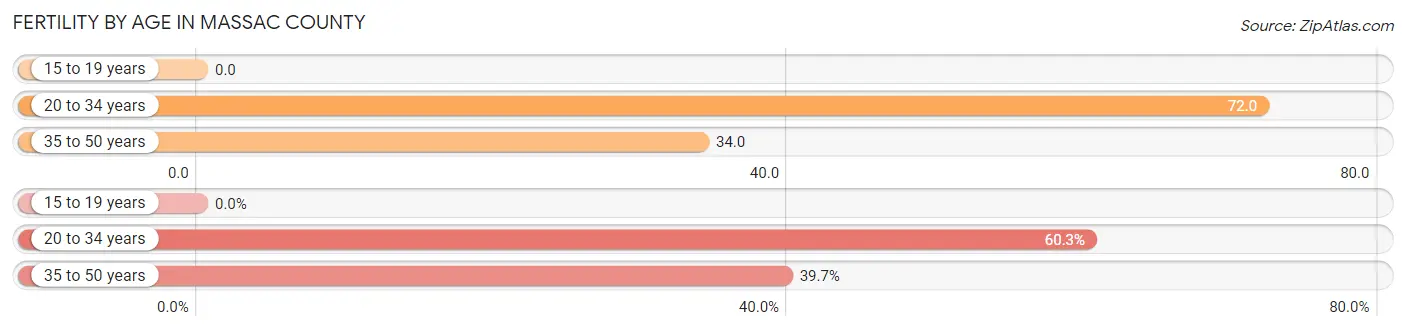
Fertility by Age in Massac County
Average fertility rate in Massac County is 43.0 births per 1,000 women. Women in the age bracket of 20 to 34 years have the highest fertility rate with 72.0 births per 1,000 women. Women in the age bracket of 20 to 34 years acount for 60.3% of all women with births.
| Age Bracket | Women with Births | Births / 1,000 Women |
| 15 to 19 years | 0 (0.0%) | 0.0 |
| 20 to 34 years | 76 (60.3%) | 72.0 |
| 35 to 50 years | 50 (39.7%) | 34.0 |
| Total | 126 (100.0%) | 43.0 |
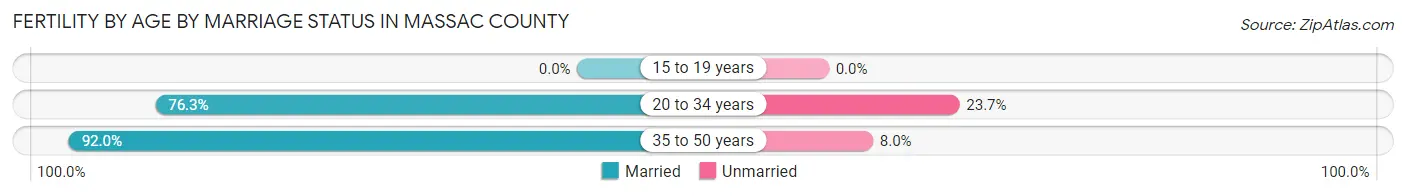
Fertility by Age by Marriage Status in Massac County
82.5% of women with births (126) in Massac County are married. The highest percentage of unmarried women with births falls into 20 to 34 years age bracket with 23.7% of them unmarried at the time of birth, while the lowest percentage of unmarried women with births belong to 35 to 50 years age bracket with 8.0% of them unmarried.
| Age Bracket | Married | Unmarried |
| 15 to 19 years | 0 (0.0%) | 0 (0.0%) |
| 20 to 34 years | 58 (76.3%) | 18 (23.7%) |
| 35 to 50 years | 46 (92.0%) | 4 (8.0%) |
| Total | 104 (82.5%) | 22 (17.5%) |
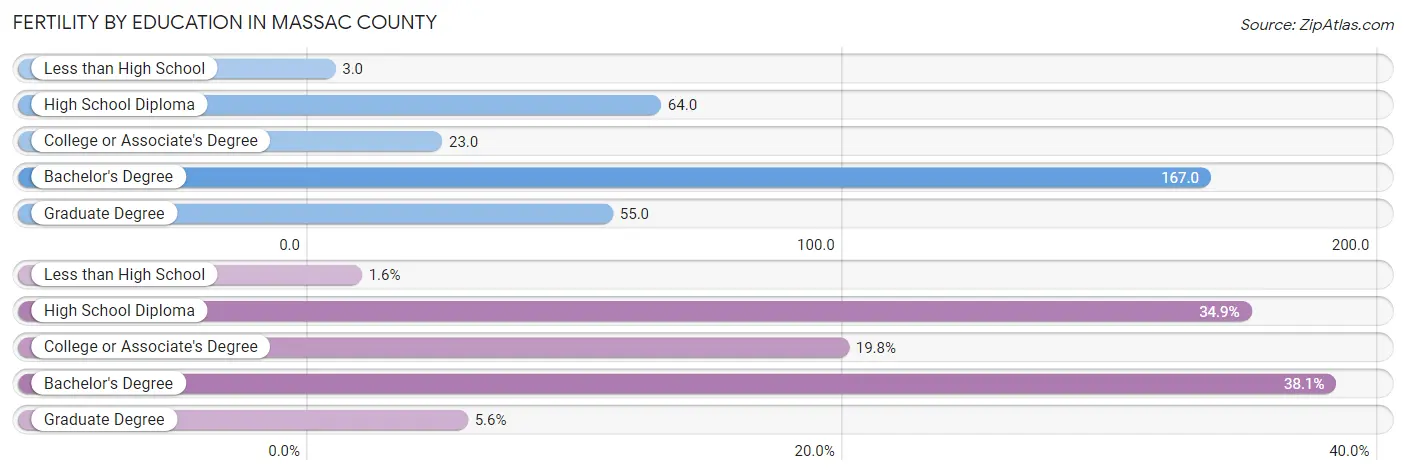
Fertility by Education in Massac County
Average fertility rate in Massac County is 43.0 births per 1,000 women. Women with the education attainment of bachelor's degree have the highest fertility rate of 167.0 births per 1,000 women, while women with the education attainment of less than high school have the lowest fertility at 3.0 births per 1,000 women. Women with the education attainment of bachelor's degree represent 38.1% of all women with births.
| Educational Attainment | Women with Births | Births / 1,000 Women |
| Less than High School | 2 (1.6%) | 3.0 |
| High School Diploma | 44 (34.9%) | 64.0 |
| College or Associate's Degree | 25 (19.8%) | 23.0 |
| Bachelor's Degree | 48 (38.1%) | 167.0 |
| Graduate Degree | 7 (5.6%) | 55.0 |
| Total | 126 (100.0%) | 43.0 |
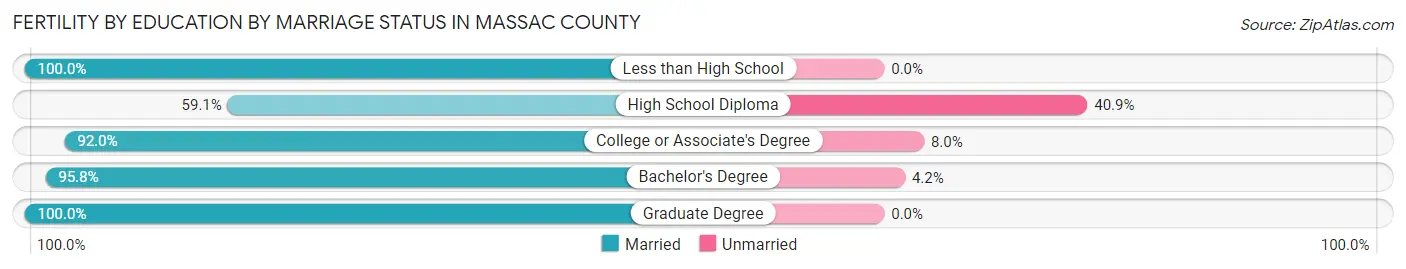
Fertility by Education by Marriage Status in Massac County
17.5% of women with births in Massac County are unmarried. Women with the educational attainment of less than high school are most likely to be married with 100.0% of them married at childbirth, while women with the educational attainment of high school diploma are least likely to be married with 40.9% of them unmarried at childbirth.
| Educational Attainment | Married | Unmarried |
| Less than High School | 2 (100.0%) | 0 (0.0%) |
| High School Diploma | 26 (59.1%) | 18 (40.9%) |
| College or Associate's Degree | 23 (92.0%) | 2 (8.0%) |
| Bachelor's Degree | 46 (95.8%) | 2 (4.2%) |
| Graduate Degree | 7 (100.0%) | 0 (0.0%) |
| Total | 104 (82.5%) | 22 (17.5%) |
Income in Massac County
Income Overview in Massac County
Per Capita Income in Massac County is $28,817, while median incomes of families and households are $69,664 and $57,365 respectively.
| Characteristic | Number | Measure |
| Per Capita Income | 14,135 | $28,817 |
| Median Family Income | 3,687 | $69,664 |
| Mean Family Income | 3,687 | $81,528 |
| Median Household Income | 5,413 | $57,365 |
| Mean Household Income | 5,413 | $70,962 |
| Income Deficit | 3,687 | $10,216 |
| Wage / Income Gap (%) | 14,135 | 44.38% |
| Wage / Income Gap ($) | 14,135 | 55.62¢ per $1 |
| Gini / Inequality Index | 14,135 | 0.40 |
Earnings by Sex in Massac County
Average Earnings in Massac County are $34,868, $47,623 for men and $26,488 for women, a difference of 44.4%.
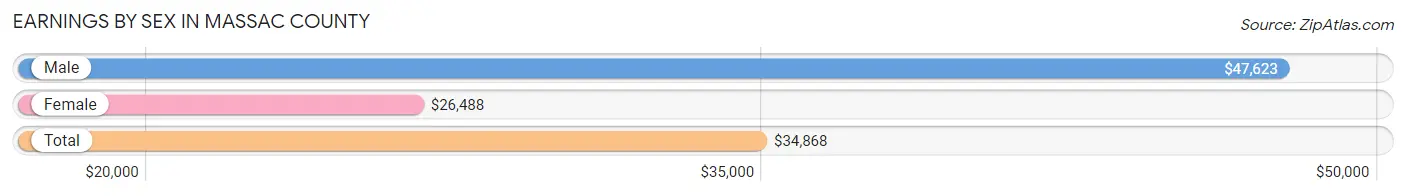
| Sex | Number | Average Earnings |
| Male | 3,222 (51.8%) | $47,623 |
| Female | 3,001 (48.2%) | $26,488 |
| Total | 6,223 (100.0%) | $34,868 |
Earnings by Sex by Income Bracket in Massac County
The most common earnings brackets in Massac County are $100,000+ for men (441 | 13.7%) and $25,000 to $29,999 for women (406 | 13.5%).
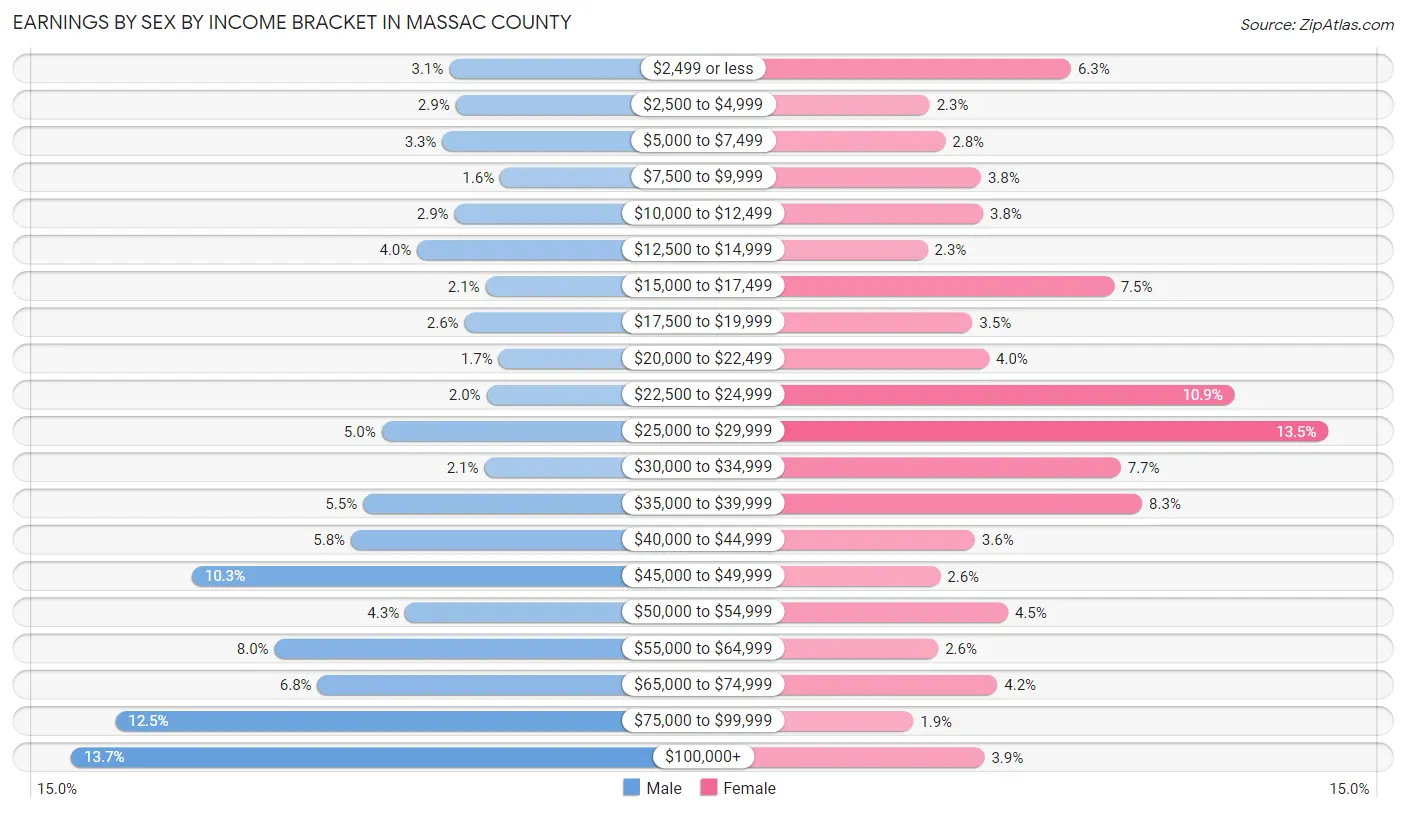
| Income | Male | Female |
| $2,499 or less | 99 (3.1%) | 189 (6.3%) |
| $2,500 to $4,999 | 93 (2.9%) | 70 (2.3%) |
| $5,000 to $7,499 | 105 (3.3%) | 83 (2.8%) |
| $7,500 to $9,999 | 53 (1.6%) | 113 (3.8%) |
| $10,000 to $12,499 | 94 (2.9%) | 115 (3.8%) |
| $12,500 to $14,999 | 128 (4.0%) | 68 (2.3%) |
| $15,000 to $17,499 | 66 (2.1%) | 225 (7.5%) |
| $17,500 to $19,999 | 85 (2.6%) | 106 (3.5%) |
| $20,000 to $22,499 | 54 (1.7%) | 120 (4.0%) |
| $22,500 to $24,999 | 65 (2.0%) | 327 (10.9%) |
| $25,000 to $29,999 | 160 (5.0%) | 406 (13.5%) |
| $30,000 to $34,999 | 67 (2.1%) | 231 (7.7%) |
| $35,000 to $39,999 | 177 (5.5%) | 249 (8.3%) |
| $40,000 to $44,999 | 188 (5.8%) | 108 (3.6%) |
| $45,000 to $49,999 | 332 (10.3%) | 79 (2.6%) |
| $50,000 to $54,999 | 139 (4.3%) | 136 (4.5%) |
| $55,000 to $64,999 | 257 (8.0%) | 77 (2.6%) |
| $65,000 to $74,999 | 218 (6.8%) | 127 (4.2%) |
| $75,000 to $99,999 | 401 (12.4%) | 56 (1.9%) |
| $100,000+ | 441 (13.7%) | 116 (3.9%) |
| Total | 3,222 (100.0%) | 3,001 (100.0%) |
Earnings by Sex by Educational Attainment in Massac County
Average earnings in Massac County are $50,601 for men and $28,890 for women, a difference of 42.9%. Men with an educational attainment of bachelor's degree enjoy the highest average annual earnings of $95,909, while those with less than high school education earn the least with $18,516. Women with an educational attainment of graduate degree earn the most with the average annual earnings of $61,394, while those with high school diploma education have the smallest earnings of $17,727.
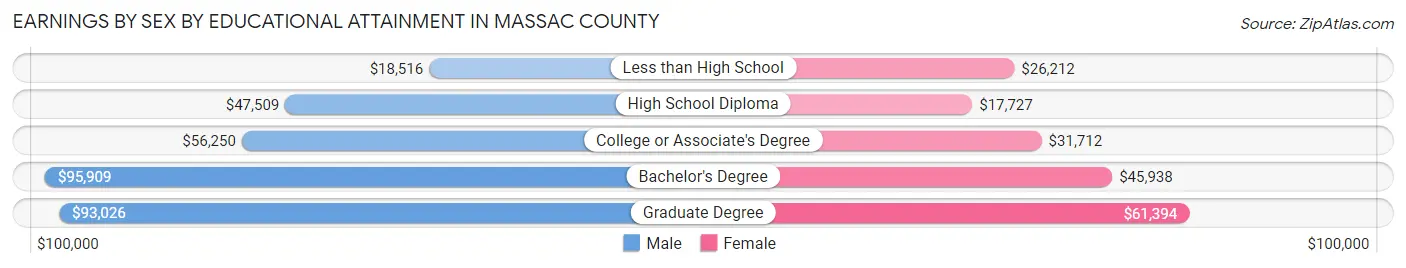
| Educational Attainment | Male Income | Female Income |
| Less than High School | $18,516 | $26,212 |
| High School Diploma | $47,509 | $17,727 |
| College or Associate's Degree | $56,250 | $31,712 |
| Bachelor's Degree | $95,909 | $45,938 |
| Graduate Degree | $93,026 | $61,394 |
| Total | $50,601 | $28,890 |
Family Income in Massac County
Family Income Brackets in Massac County
According to the Massac County family income data, there are 774 families falling into the $50,000 to $74,999 income range, which is the most common income bracket and makes up 21.0% of all families. Conversely, the $10,000 to $14,999 income bracket is the least frequent group with only 55 families (1.5%) belonging to this category.
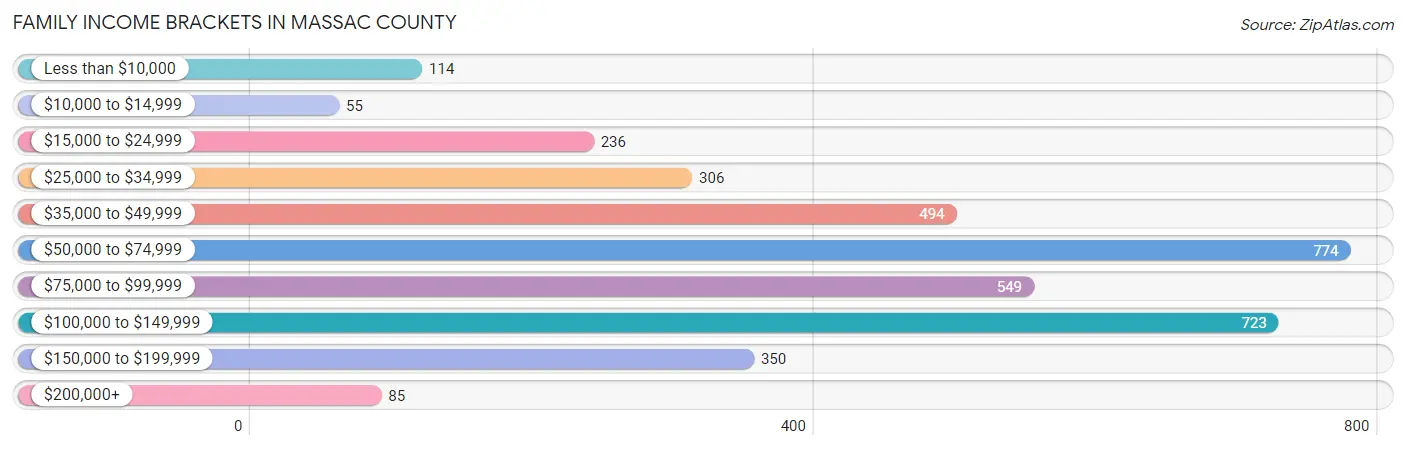
| Income Bracket | # Families | % Families |
| Less than $10,000 | 114 | 3.1% |
| $10,000 to $14,999 | 55 | 1.5% |
| $15,000 to $24,999 | 236 | 6.4% |
| $25,000 to $34,999 | 306 | 8.3% |
| $35,000 to $49,999 | 494 | 13.4% |
| $50,000 to $74,999 | 774 | 21.0% |
| $75,000 to $99,999 | 549 | 14.9% |
| $100,000 to $149,999 | 723 | 19.6% |
| $150,000 to $199,999 | 350 | 9.5% |
| $200,000+ | 85 | 2.3% |
Family Income by Famaliy Size in Massac County
4-person families (635 | 17.2%) account for the highest median family income in Massac County with $95,859 per family, while 2-person families (1,916 | 52.0%) have the highest median income of $34,318 per family member.
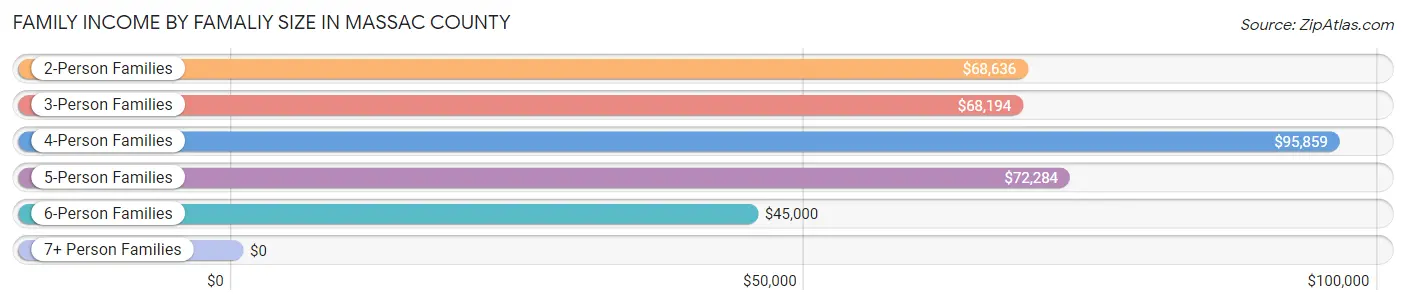
| Income Bracket | # Families | Median Income |
| 2-Person Families | 1,916 (52.0%) | $68,636 |
| 3-Person Families | 768 (20.8%) | $68,194 |
| 4-Person Families | 635 (17.2%) | $95,859 |
| 5-Person Families | 289 (7.8%) | $72,284 |
| 6-Person Families | 60 (1.6%) | $45,000 |
| 7+ Person Families | 19 (0.5%) | $0 |
| Total | 3,687 (100.0%) | $69,664 |
Family Income by Number of Earners in Massac County
The median family income in Massac County is $69,664, with families comprising 3+ earners (348) having the highest median family income of $138,750, while families with no earners (872) have the lowest median family income of $52,424, accounting for 9.4% and 23.6% of families, respectively.
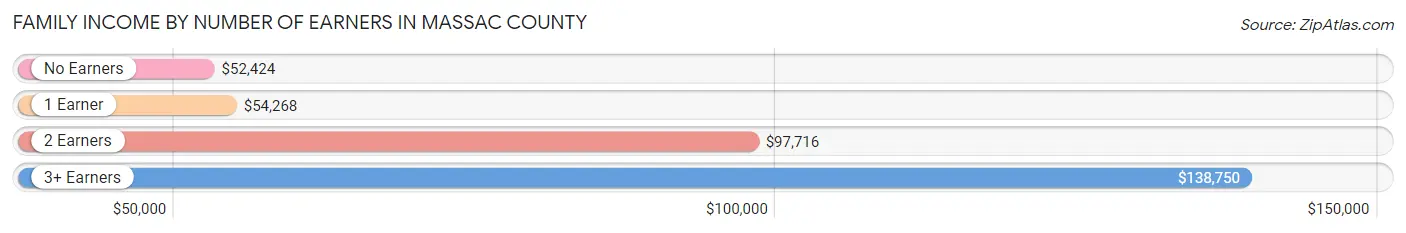
| Number of Earners | # Families | Median Income |
| No Earners | 872 (23.6%) | $52,424 |
| 1 Earner | 1,386 (37.6%) | $54,268 |
| 2 Earners | 1,081 (29.3%) | $97,716 |
| 3+ Earners | 348 (9.4%) | $138,750 |
| Total | 3,687 (100.0%) | $69,664 |
Household Income in Massac County
Household Income Brackets in Massac County
With 1,131 households falling in the category, the $50,000 to $74,999 income range is the most frequent in Massac County, accounting for 20.9% of all households. In contrast, only 135 households (2.5%) fall into the $200,000+ income bracket, making it the least populous group.
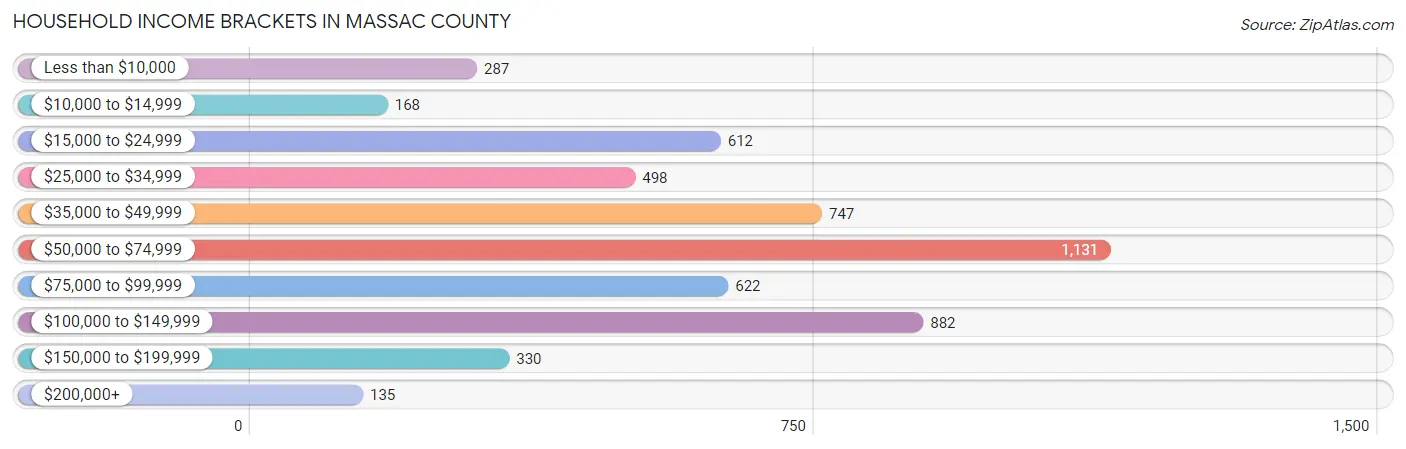
| Income Bracket | # Households | % Households |
| Less than $10,000 | 287 | 5.3% |
| $10,000 to $14,999 | 168 | 3.1% |
| $15,000 to $24,999 | 612 | 11.3% |
| $25,000 to $34,999 | 498 | 9.2% |
| $35,000 to $49,999 | 747 | 13.8% |
| $50,000 to $74,999 | 1,131 | 20.9% |
| $75,000 to $99,999 | 622 | 11.5% |
| $100,000 to $149,999 | 882 | 16.3% |
| $150,000 to $199,999 | 330 | 6.1% |
| $200,000+ | 135 | 2.5% |
Household Income by Householder Age in Massac County
The median household income in Massac County is $57,365, with the highest median household income of $69,852 found in the 45 to 64 years age bracket for the primary householder. A total of 2,079 households (38.4%) fall into this category. Meanwhile, the 15 to 24 years age bracket for the primary householder has the lowest median household income of $0, with 86 households (1.6%) in this group.
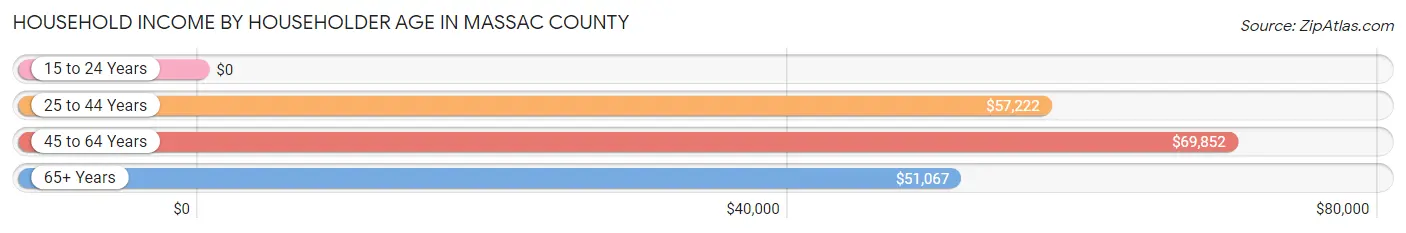
| Income Bracket | # Households | Median Income |
| 15 to 24 Years | 86 (1.6%) | $0 |
| 25 to 44 Years | 1,532 (28.3%) | $57,222 |
| 45 to 64 Years | 2,079 (38.4%) | $69,852 |
| 65+ Years | 1,716 (31.7%) | $51,067 |
| Total | 5,413 (100.0%) | $57,365 |
Poverty in Massac County
Income Below Poverty by Sex and Age in Massac County
With 11.2% poverty level for males and 16.2% for females among the residents of Massac County, 18 to 24 year old males and 16 and 17 year old females are the most vulnerable to poverty, with 113 males (24.1%) and 42 females (31.8%) in their respective age groups living below the poverty level.

| Age Bracket | Male | Female |
| Under 5 Years | 76 (21.0%) | 90 (28.6%) |
| 5 Years | 6 (7.3%) | 0 (0.0%) |
| 6 to 11 Years | 64 (14.0%) | 130 (22.5%) |
| 12 to 14 Years | 32 (9.7%) | 45 (19.9%) |
| 15 Years | 0 (0.0%) | 14 (9.1%) |
| 16 and 17 Years | 5 (2.6%) | 42 (31.8%) |
| 18 to 24 Years | 113 (24.1%) | 129 (25.9%) |
| 25 to 34 Years | 68 (9.2%) | 88 (12.4%) |
| 35 to 44 Years | 157 (18.5%) | 216 (25.3%) |
| 45 to 54 Years | 98 (10.3%) | 92 (9.6%) |
| 55 to 64 Years | 63 (6.0%) | 129 (12.1%) |
| 65 to 74 Years | 25 (3.4%) | 110 (13.8%) |
| 75 Years and over | 56 (10.9%) | 53 (7.7%) |
| Total | 763 (11.2%) | 1,138 (16.2%) |
Income Above Poverty by Sex and Age in Massac County
According to the poverty statistics in Massac County, males aged 15 years and females aged 5 years are the age groups that are most secure financially, with 100.0% of males and 100.0% of females in these age groups living above the poverty line.
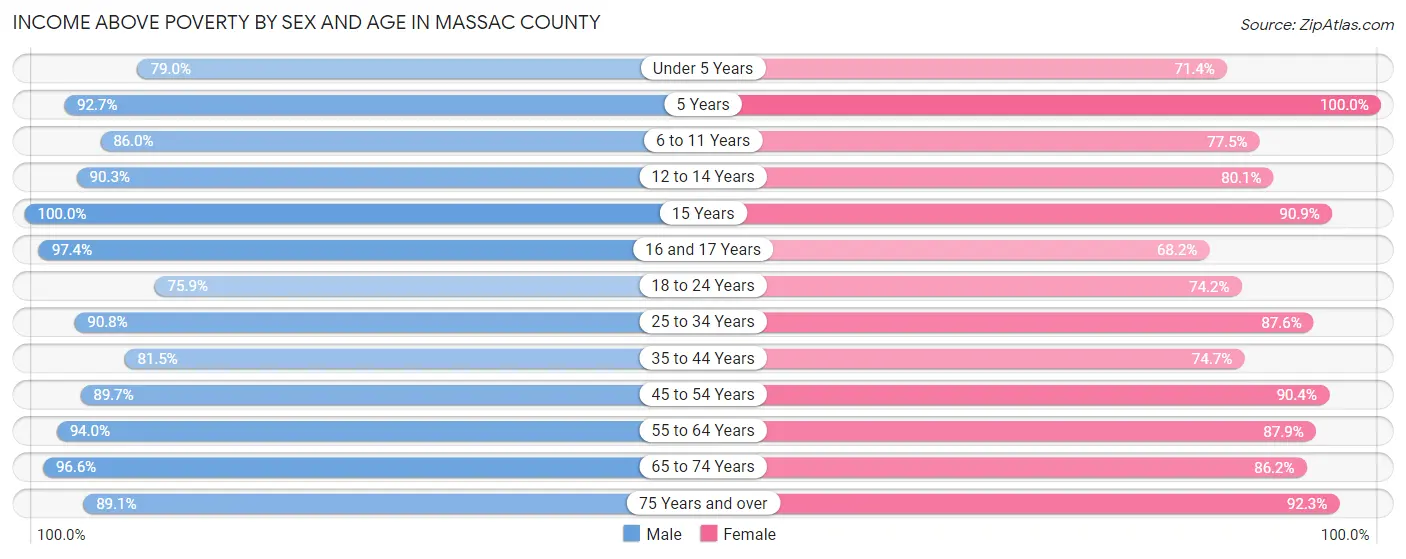
| Age Bracket | Male | Female |
| Under 5 Years | 286 (79.0%) | 225 (71.4%) |
| 5 Years | 76 (92.7%) | 42 (100.0%) |
| 6 to 11 Years | 392 (86.0%) | 448 (77.5%) |
| 12 to 14 Years | 299 (90.3%) | 181 (80.1%) |
| 15 Years | 85 (100.0%) | 140 (90.9%) |
| 16 and 17 Years | 184 (97.4%) | 90 (68.2%) |
| 18 to 24 Years | 355 (75.8%) | 370 (74.2%) |
| 25 to 34 Years | 668 (90.8%) | 619 (87.5%) |
| 35 to 44 Years | 690 (81.5%) | 637 (74.7%) |
| 45 to 54 Years | 849 (89.6%) | 864 (90.4%) |
| 55 to 64 Years | 992 (94.0%) | 941 (87.9%) |
| 65 to 74 Years | 709 (96.6%) | 688 (86.2%) |
| 75 Years and over | 458 (89.1%) | 634 (92.3%) |
| Total | 6,043 (88.8%) | 5,879 (83.8%) |
Income Below Poverty Among Married-Couple Families in Massac County
The poverty statistics for married-couple families in Massac County show that 5.0% or 144 of the total 2,897 families live below the poverty line. Families with 3 or 4 children have the highest poverty rate of 10.8%, comprising of 20 families. On the other hand, families with 5 or more children have the lowest poverty rate of 0.0%, which includes 0 families.
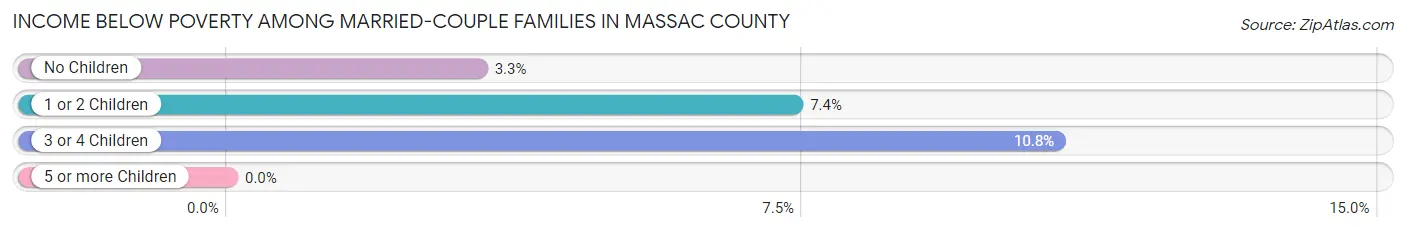
| Children | Above Poverty | Below Poverty |
| No Children | 1,753 (96.7%) | 59 (3.3%) |
| 1 or 2 Children | 816 (92.6%) | 65 (7.4%) |
| 3 or 4 Children | 165 (89.2%) | 20 (10.8%) |
| 5 or more Children | 19 (100.0%) | 0 (0.0%) |
| Total | 2,753 (95.0%) | 144 (5.0%) |
Income Below Poverty Among Single-Parent Households in Massac County
According to the poverty data in Massac County, 16.2% or 32 single-father households and 24.4% or 145 single-mother households are living below the poverty line. Among single-father households, those with 3 or 4 children have the highest poverty rate, with 7 households (30.4%) experiencing poverty. Likewise, among single-mother households, those with 3 or 4 children have the highest poverty rate, with 30 households (71.4%) falling below the poverty line.
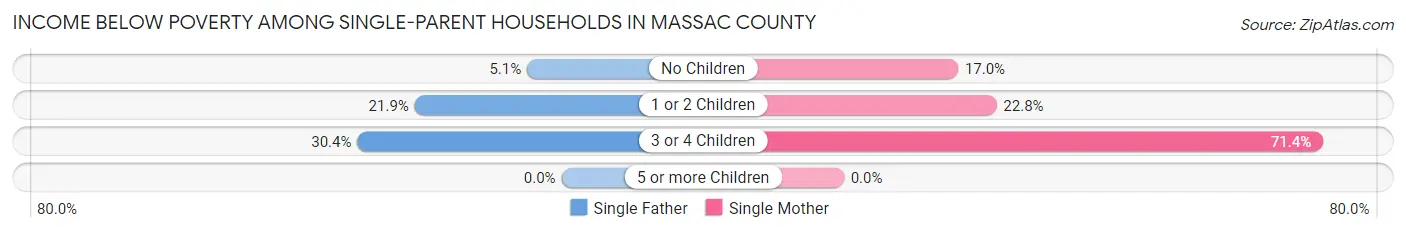
| Children | Single Father | Single Mother |
| No Children | 4 (5.1%) | 31 (17.0%) |
| 1 or 2 Children | 21 (21.9%) | 84 (22.8%) |
| 3 or 4 Children | 7 (30.4%) | 30 (71.4%) |
| 5 or more Children | 0 (0.0%) | 0 (0.0%) |
| Total | 32 (16.2%) | 145 (24.4%) |
Income Below Poverty Among Married-Couple vs Single-Parent Households in Massac County
The poverty data for Massac County shows that 144 of the married-couple family households (5.0%) and 177 of the single-parent households (22.4%) are living below the poverty level. Within the married-couple family households, those with 3 or 4 children have the highest poverty rate, with 20 households (10.8%) falling below the poverty line. Among the single-parent households, those with 3 or 4 children have the highest poverty rate, with 37 household (56.9%) living below poverty.
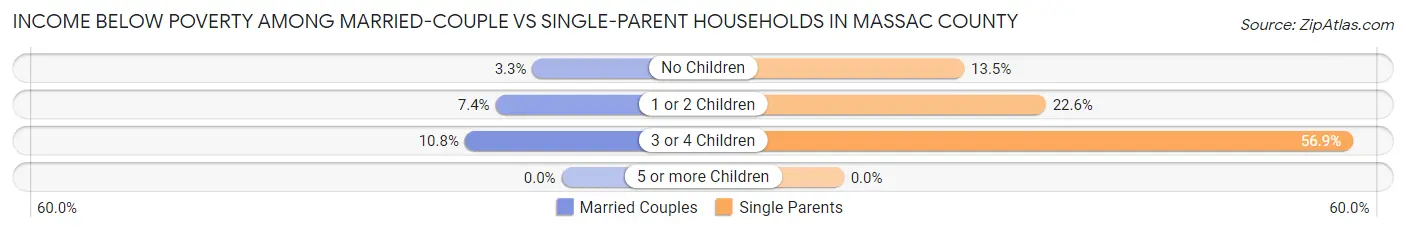
| Children | Married-Couple Families | Single-Parent Households |
| No Children | 59 (3.3%) | 35 (13.5%) |
| 1 or 2 Children | 65 (7.4%) | 105 (22.6%) |
| 3 or 4 Children | 20 (10.8%) | 37 (56.9%) |
| 5 or more Children | 0 (0.0%) | 0 (0.0%) |
| Total | 144 (5.0%) | 177 (22.4%) |
Employment Characteristics in Massac County
Employment by Class of Employer in Massac County
Among the 5,704 employed individuals in Massac County, private company employees (4,178 | 73.3%), local government employees (338 | 5.9%), and state government employees (328 | 5.8%) make up the most common classes of employment.
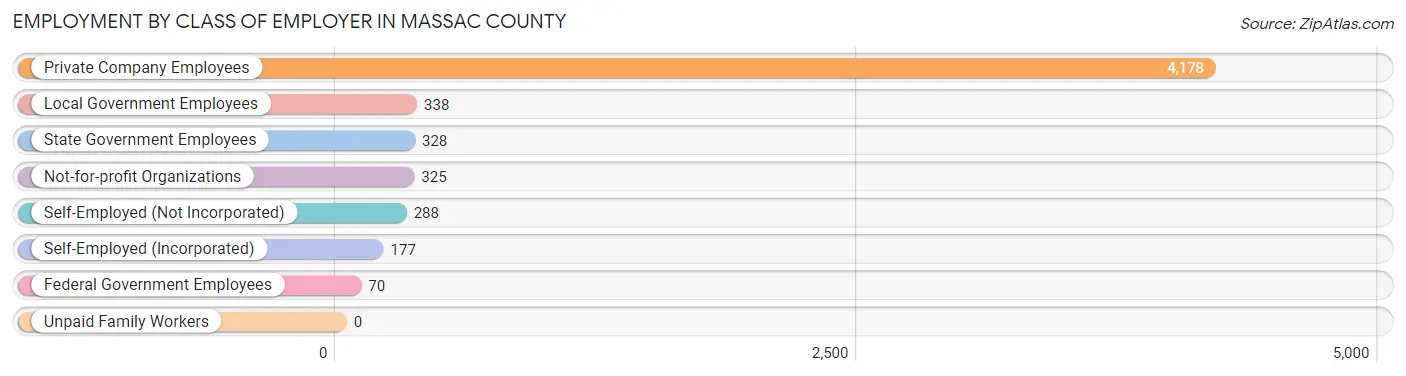
| Employer Class | # Employees | % Employees |
| Private Company Employees | 4,178 | 73.3% |
| Self-Employed (Incorporated) | 177 | 3.1% |
| Self-Employed (Not Incorporated) | 288 | 5.1% |
| Not-for-profit Organizations | 325 | 5.7% |
| Local Government Employees | 338 | 5.9% |
| State Government Employees | 328 | 5.8% |
| Federal Government Employees | 70 | 1.2% |
| Unpaid Family Workers | 0 | 0.0% |
| Total | 5,704 | 100.0% |
Employment Status by Age in Massac County
According to the labor force statistics for Massac County, out of the total population over 16 years of age (11,403), 52.1% or 5,941 individuals are in the labor force, with 3.7% or 220 of them unemployed. The age group with the highest labor force participation rate is 30 to 34 years, with 89.2% or 682 individuals in the labor force. Within the labor force, the 16 to 19 years age range has the highest percentage of unemployed individuals, with 12.9% or 15 of them being unemployed.
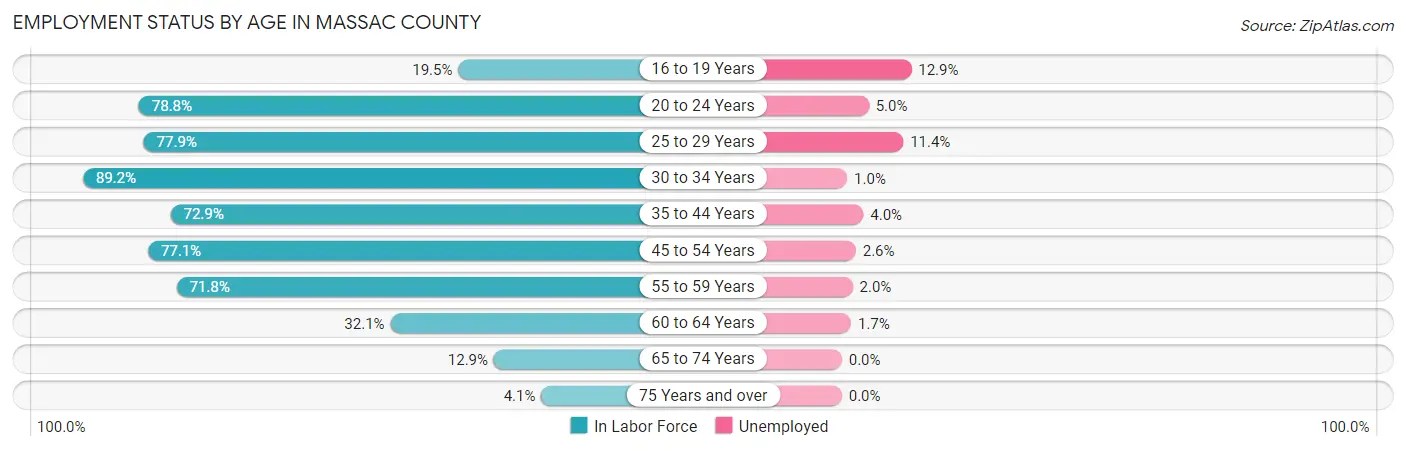
| Age Bracket | In Labor Force | Unemployed |
| 16 to 19 Years | 116 (19.5%) | 15 (12.9%) |
| 20 to 24 Years | 545 (78.8%) | 27 (5.0%) |
| 25 to 29 Years | 528 (77.9%) | 60 (11.4%) |
| 30 to 34 Years | 682 (89.2%) | 7 (1.0%) |
| 35 to 44 Years | 1,239 (72.9%) | 50 (4.0%) |
| 45 to 54 Years | 1,471 (77.1%) | 38 (2.6%) |
| 55 to 59 Years | 746 (71.8%) | 15 (2.0%) |
| 60 to 64 Years | 351 (32.1%) | 6 (1.7%) |
| 65 to 74 Years | 201 (12.9%) | 0 (0.0%) |
| 75 Years and over | 56 (4.1%) | 0 (0.0%) |
| Total | 5,941 (52.1%) | 220 (3.7%) |
Employment Status by Educational Attainment in Massac County
According to labor force statistics for Massac County, 69.9% of individuals (5,022) out of the total population between 25 and 64 years of age (7,185) are in the labor force, with 3.5% or 176 of them being unemployed. The group with the highest labor force participation rate are those with the educational attainment of bachelor's degree or higher, with 85.9% or 905 individuals in the labor force. Within the labor force, individuals with college / associate degree education have the highest percentage of unemployment, with 4.6% or 93 of them being unemployed.
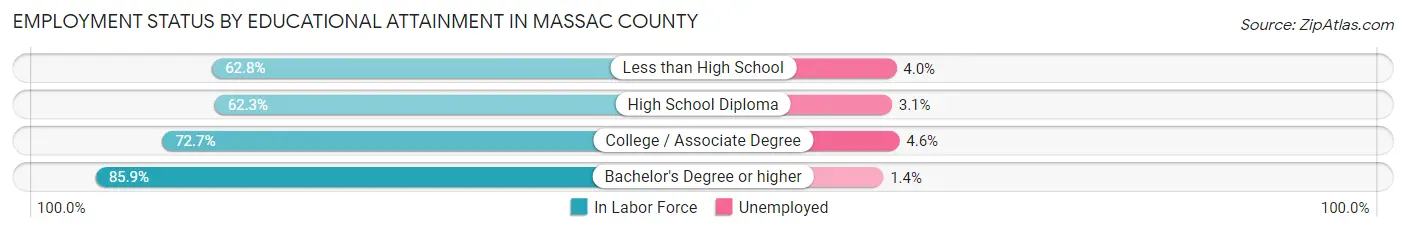
| Educational Attainment | In Labor Force | Unemployed |
| Less than High School | 500 (62.8%) | 32 (4.0%) |
| High School Diploma | 1,591 (62.3%) | 79 (3.1%) |
| College / Associate Degree | 2,022 (72.7%) | 128 (4.6%) |
| Bachelor's Degree or higher | 905 (85.9%) | 15 (1.4%) |
| Total | 5,022 (69.9%) | 251 (3.5%) |
Employment Occupations by Sex in Massac County
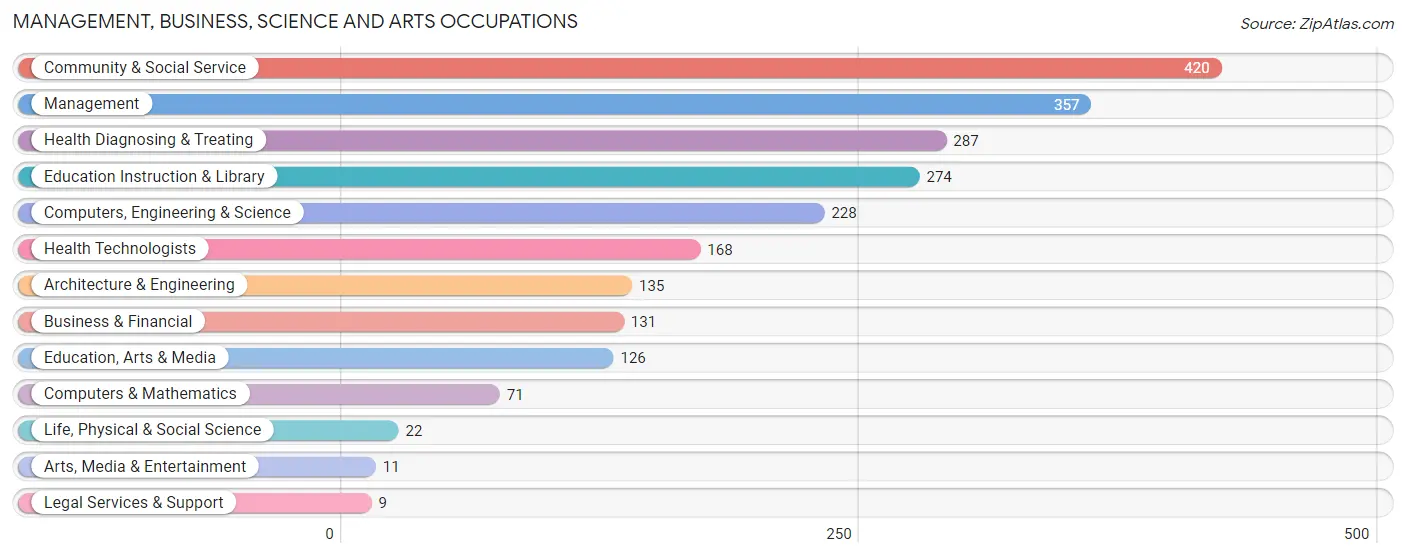
Management, Business, Science and Arts Occupations
The most common Management, Business, Science and Arts occupations in Massac County are Community & Social Service (420 | 7.3%), Management (357 | 6.2%), Health Diagnosing & Treating (287 | 5.0%), Education Instruction & Library (274 | 4.8%), and Computers, Engineering & Science (228 | 4.0%).
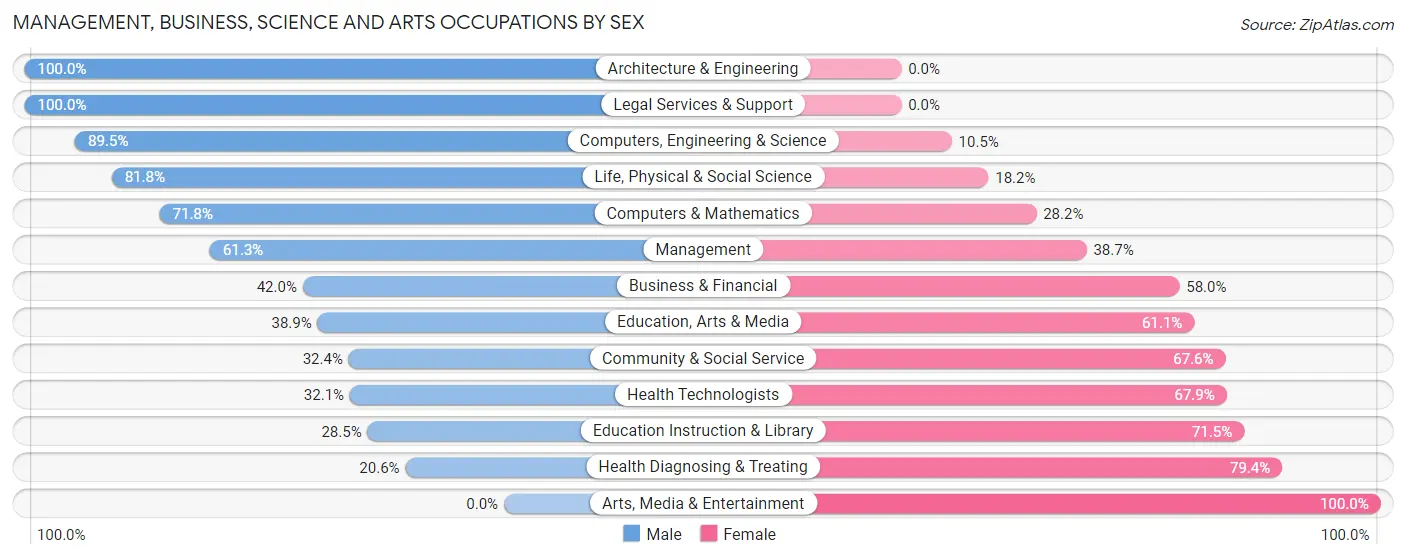
Management, Business, Science and Arts Occupations by Sex
Within the Management, Business, Science and Arts occupations in Massac County, the most male-oriented occupations are Architecture & Engineering (100.0%), Legal Services & Support (100.0%), and Computers, Engineering & Science (89.5%), while the most female-oriented occupations are Arts, Media & Entertainment (100.0%), Health Diagnosing & Treating (79.4%), and Education Instruction & Library (71.5%).
| Occupation | Male | Female |
| Management | 219 (61.3%) | 138 (38.7%) |
| Business & Financial | 55 (42.0%) | 76 (58.0%) |
| Computers, Engineering & Science | 204 (89.5%) | 24 (10.5%) |
| Computers & Mathematics | 51 (71.8%) | 20 (28.2%) |
| Architecture & Engineering | 135 (100.0%) | 0 (0.0%) |
| Life, Physical & Social Science | 18 (81.8%) | 4 (18.2%) |
| Community & Social Service | 136 (32.4%) | 284 (67.6%) |
| Education, Arts & Media | 49 (38.9%) | 77 (61.1%) |
| Legal Services & Support | 9 (100.0%) | 0 (0.0%) |
| Education Instruction & Library | 78 (28.5%) | 196 (71.5%) |
| Arts, Media & Entertainment | 0 (0.0%) | 11 (100.0%) |
| Health Diagnosing & Treating | 59 (20.6%) | 228 (79.4%) |
| Health Technologists | 54 (32.1%) | 114 (67.9%) |
| Total (Category) | 673 (47.3%) | 750 (52.7%) |
| Total (Overall) | 2,979 (52.1%) | 2,739 (47.9%) |
Services Occupations
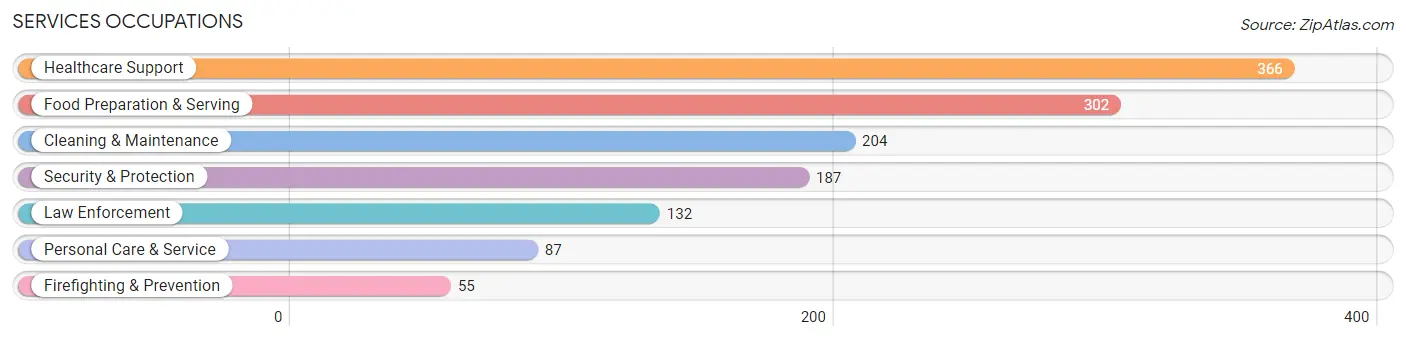
The most common Services occupations in Massac County are Healthcare Support (366 | 6.4%), Food Preparation & Serving (302 | 5.3%), Cleaning & Maintenance (204 | 3.6%), Security & Protection (187 | 3.3%), and Law Enforcement (132 | 2.3%).
Services Occupations by Sex
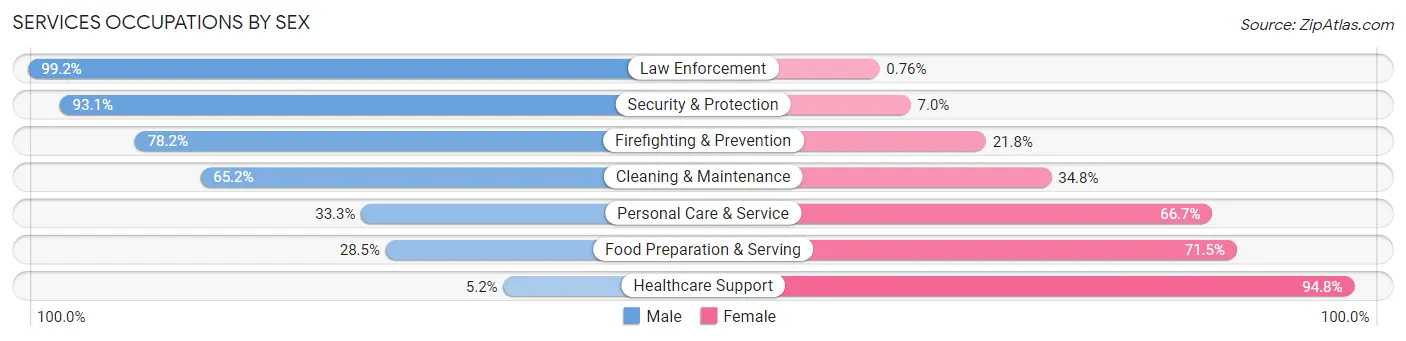
Within the Services occupations in Massac County, the most male-oriented occupations are Law Enforcement (99.2%), Security & Protection (93.0%), and Firefighting & Prevention (78.2%), while the most female-oriented occupations are Healthcare Support (94.8%), Food Preparation & Serving (71.5%), and Personal Care & Service (66.7%).
| Occupation | Male | Female |
| Healthcare Support | 19 (5.2%) | 347 (94.8%) |
| Security & Protection | 174 (93.0%) | 13 (7.0%) |
| Firefighting & Prevention | 43 (78.2%) | 12 (21.8%) |
| Law Enforcement | 131 (99.2%) | 1 (0.8%) |
| Food Preparation & Serving | 86 (28.5%) | 216 (71.5%) |
| Cleaning & Maintenance | 133 (65.2%) | 71 (34.8%) |
| Personal Care & Service | 29 (33.3%) | 58 (66.7%) |
| Total (Category) | 441 (38.5%) | 705 (61.5%) |
| Total (Overall) | 2,979 (52.1%) | 2,739 (47.9%) |
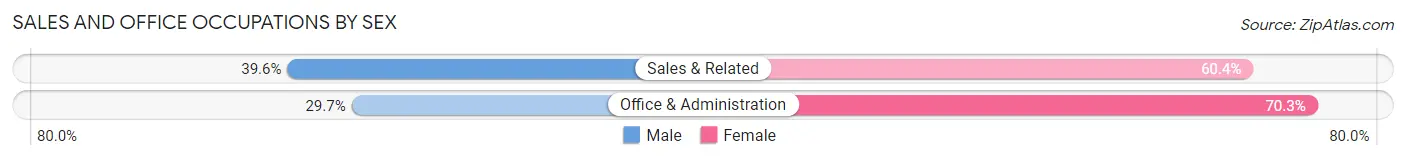
Sales and Office Occupations
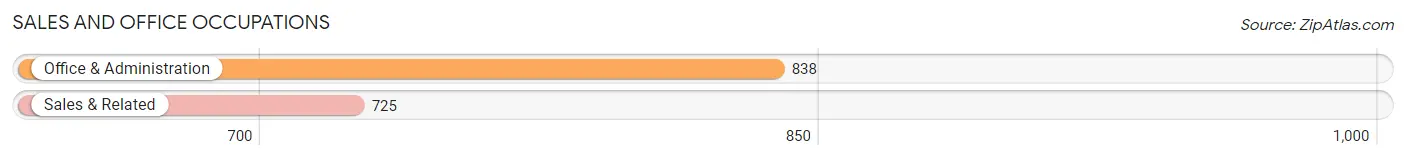
The most common Sales and Office occupations in Massac County are Office & Administration (838 | 14.7%), and Sales & Related (725 | 12.7%).
Sales and Office Occupations by Sex
| Occupation | Male | Female |
| Sales & Related | 287 (39.6%) | 438 (60.4%) |
| Office & Administration | 249 (29.7%) | 589 (70.3%) |
| Total (Category) | 536 (34.3%) | 1,027 (65.7%) |
| Total (Overall) | 2,979 (52.1%) | 2,739 (47.9%) |
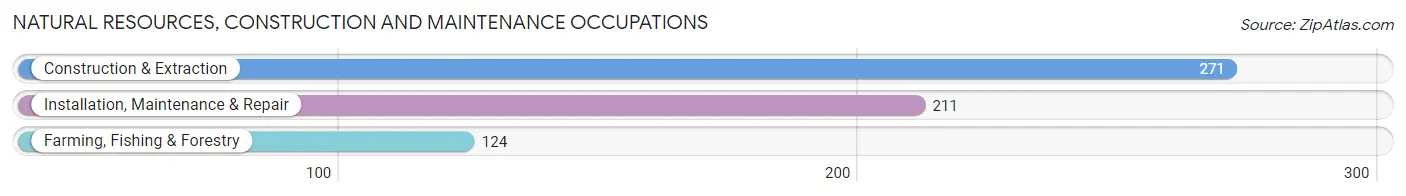
Natural Resources, Construction and Maintenance Occupations
The most common Natural Resources, Construction and Maintenance occupations in Massac County are Construction & Extraction (271 | 4.7%), Installation, Maintenance & Repair (211 | 3.7%), and Farming, Fishing & Forestry (124 | 2.2%).
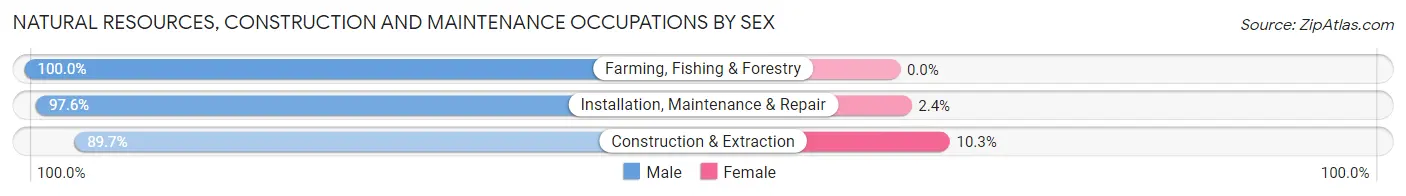
Natural Resources, Construction and Maintenance Occupations by Sex
| Occupation | Male | Female |
| Farming, Fishing & Forestry | 124 (100.0%) | 0 (0.0%) |
| Construction & Extraction | 243 (89.7%) | 28 (10.3%) |
| Installation, Maintenance & Repair | 206 (97.6%) | 5 (2.4%) |
| Total (Category) | 573 (94.6%) | 33 (5.4%) |
| Total (Overall) | 2,979 (52.1%) | 2,739 (47.9%) |
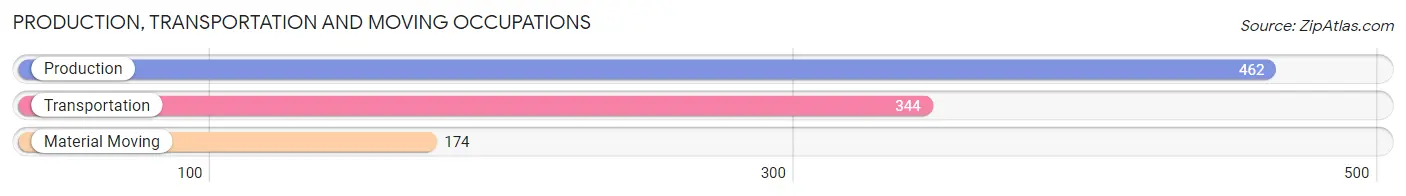
Production, Transportation and Moving Occupations
The most common Production, Transportation and Moving occupations in Massac County are Production (462 | 8.1%), Transportation (344 | 6.0%), and Material Moving (174 | 3.0%).
Production, Transportation and Moving Occupations by Sex
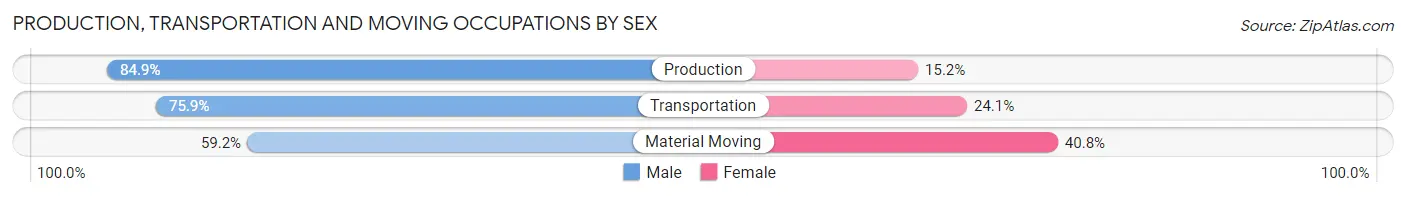
| Occupation | Male | Female |
| Production | 392 (84.9%) | 70 (15.1%) |
| Transportation | 261 (75.9%) | 83 (24.1%) |
| Material Moving | 103 (59.2%) | 71 (40.8%) |
| Total (Category) | 756 (77.1%) | 224 (22.9%) |
| Total (Overall) | 2,979 (52.1%) | 2,739 (47.9%) |
Employment Industries by Sex in Massac County
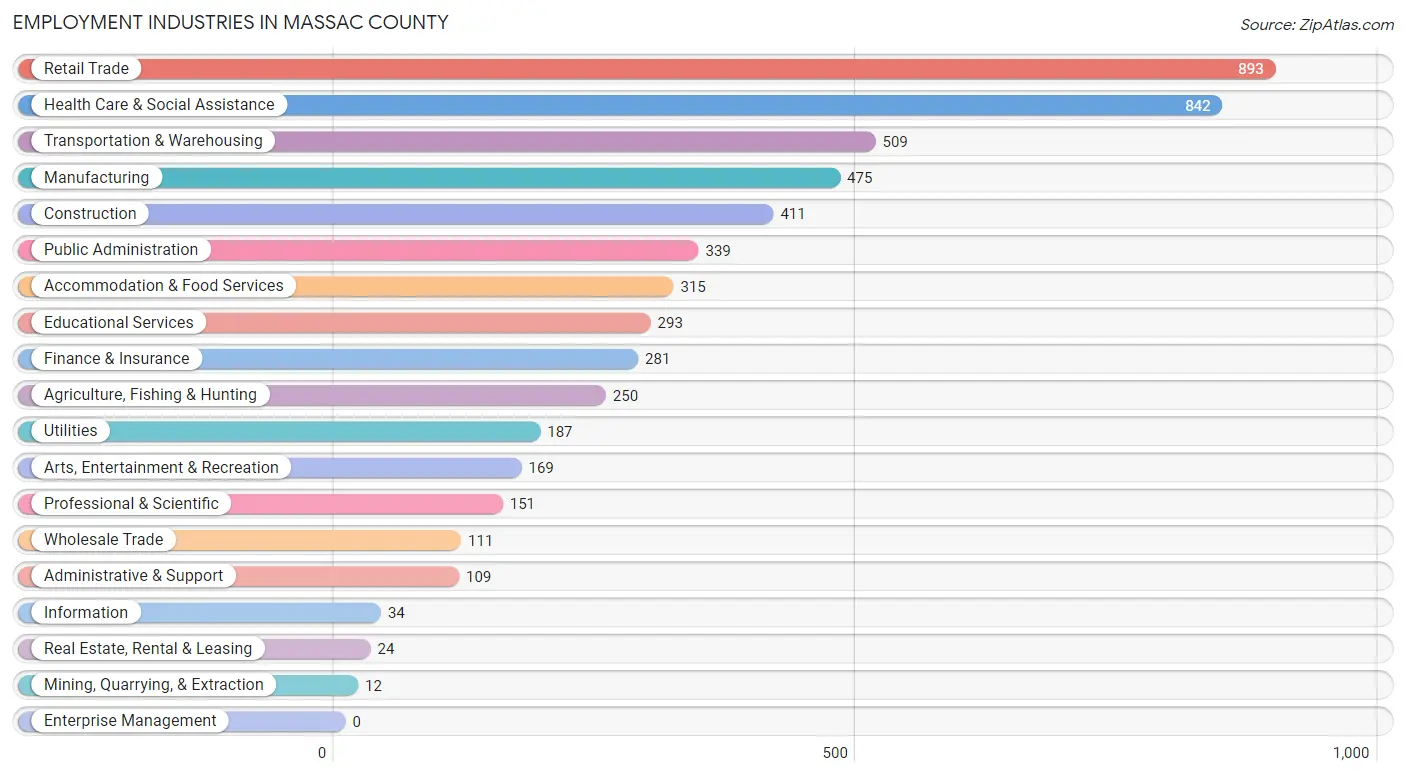
Employment Industries in Massac County
The major employment industries in Massac County include Retail Trade (893 | 15.6%), Health Care & Social Assistance (842 | 14.7%), Transportation & Warehousing (509 | 8.9%), Manufacturing (475 | 8.3%), and Construction (411 | 7.2%).
Employment Industries by Sex in Massac County
The Massac County industries that see more men than women are Mining, Quarrying, & Extraction (100.0%), Utilities (100.0%), and Information (100.0%), whereas the industries that tend to have a higher number of women are Real Estate, Rental & Leasing (95.8%), Health Care & Social Assistance (84.4%), and Finance & Insurance (75.4%).
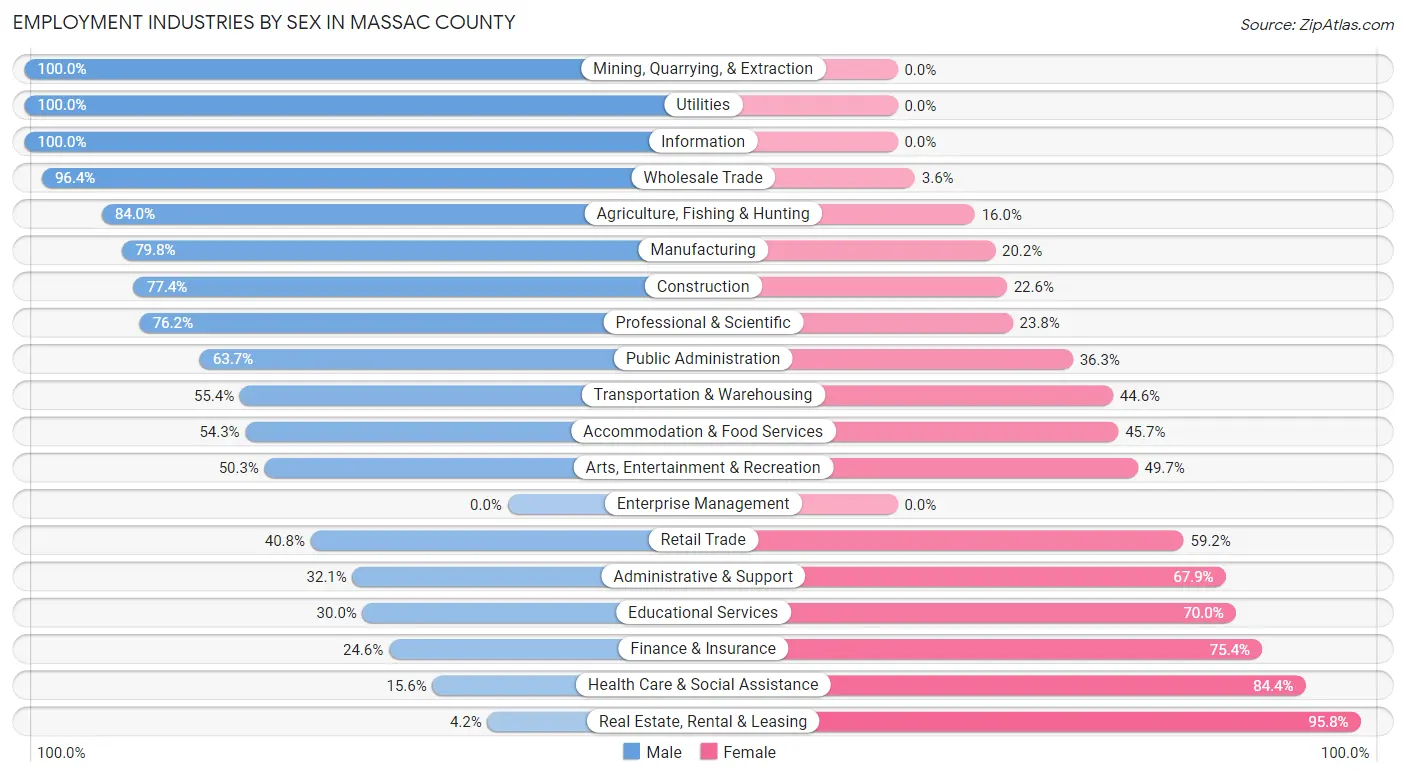
| Industry | Male | Female |
| Agriculture, Fishing & Hunting | 210 (84.0%) | 40 (16.0%) |
| Mining, Quarrying, & Extraction | 12 (100.0%) | 0 (0.0%) |
| Construction | 318 (77.4%) | 93 (22.6%) |
| Manufacturing | 379 (79.8%) | 96 (20.2%) |
| Wholesale Trade | 107 (96.4%) | 4 (3.6%) |
| Retail Trade | 364 (40.8%) | 529 (59.2%) |
| Transportation & Warehousing | 282 (55.4%) | 227 (44.6%) |
| Utilities | 187 (100.0%) | 0 (0.0%) |
| Information | 34 (100.0%) | 0 (0.0%) |
| Finance & Insurance | 69 (24.6%) | 212 (75.4%) |
| Real Estate, Rental & Leasing | 1 (4.2%) | 23 (95.8%) |
| Professional & Scientific | 115 (76.2%) | 36 (23.8%) |
| Enterprise Management | 0 (0.0%) | 0 (0.0%) |
| Administrative & Support | 35 (32.1%) | 74 (67.9%) |
| Educational Services | 88 (30.0%) | 205 (70.0%) |
| Health Care & Social Assistance | 131 (15.6%) | 711 (84.4%) |
| Arts, Entertainment & Recreation | 85 (50.3%) | 84 (49.7%) |
| Accommodation & Food Services | 171 (54.3%) | 144 (45.7%) |
| Public Administration | 216 (63.7%) | 123 (36.3%) |
| Total | 2,979 (52.1%) | 2,739 (47.9%) |
Education in Massac County
School Enrollment in Massac County
The most common levels of schooling among the 2,723 students in Massac County are high school (757 | 27.8%), middle school (737 | 27.1%), and elementary school (615 | 22.6%).
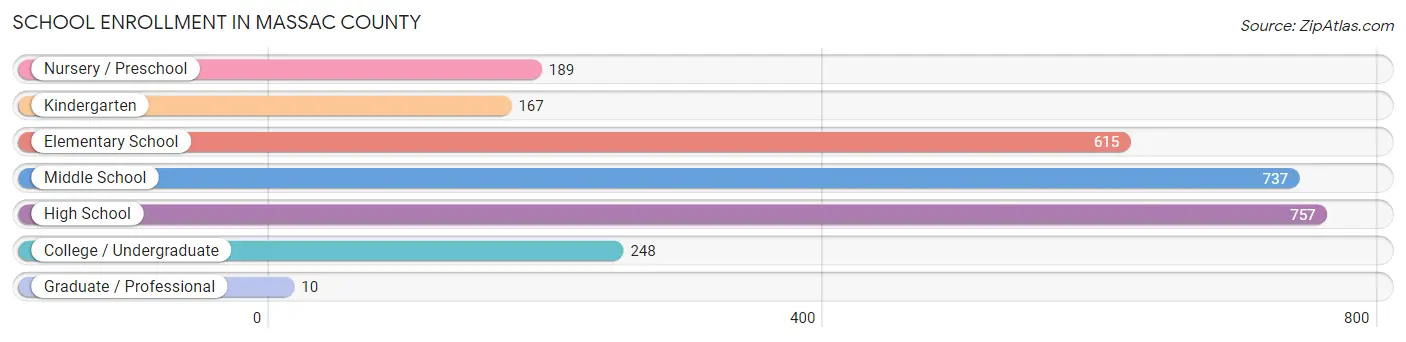
| School Level | # Students | % Students |
| Nursery / Preschool | 189 | 6.9% |
| Kindergarten | 167 | 6.1% |
| Elementary School | 615 | 22.6% |
| Middle School | 737 | 27.1% |
| High School | 757 | 27.8% |
| College / Undergraduate | 248 | 9.1% |
| Graduate / Professional | 10 | 0.4% |
| Total | 2,723 | 100.0% |
School Enrollment by Age by Funding Source in Massac County
Out of a total of 2,723 students who are enrolled in schools in Massac County, 305 (11.2%) attend a private institution, while the remaining 2,418 (88.8%) are enrolled in public schools. The age group of 20 to 24 year olds has the highest likelihood of being enrolled in private schools, with 35 (22.6% in the age bracket) enrolled. Conversely, the age group of 3 to 4 year olds has the lowest likelihood of being enrolled in a private school, with 133 (100.0% in the age bracket) attending a public institution.
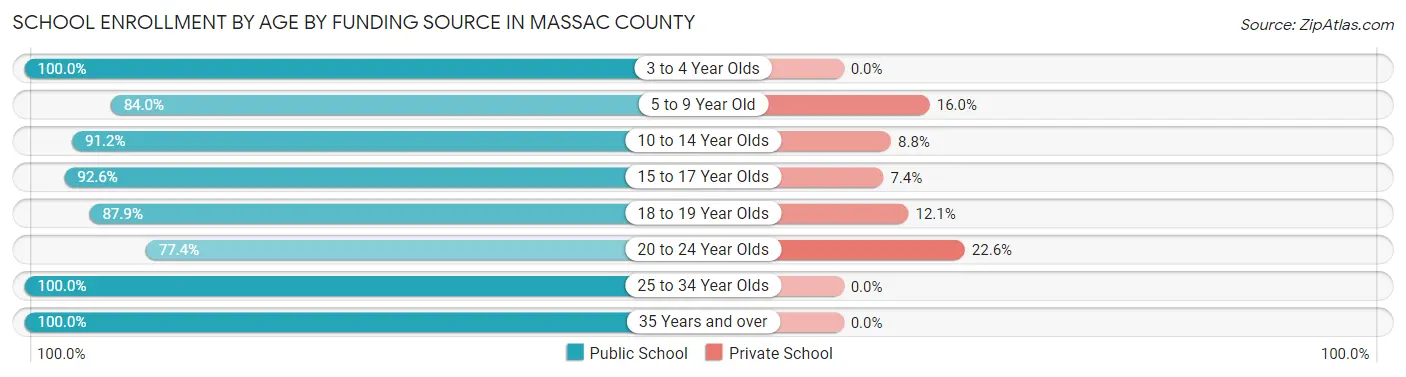
| Age Bracket | Public School | Private School |
| 3 to 4 Year Olds | 133 (100.0%) | 0 (0.0%) |
| 5 to 9 Year Old | 691 (84.0%) | 132 (16.0%) |
| 10 to 14 Year Olds | 784 (91.2%) | 76 (8.8%) |
| 15 to 17 Year Olds | 499 (92.6%) | 40 (7.4%) |
| 18 to 19 Year Olds | 160 (87.9%) | 22 (12.1%) |
| 20 to 24 Year Olds | 120 (77.4%) | 35 (22.6%) |
| 25 to 34 Year Olds | 19 (100.0%) | 0 (0.0%) |
| 35 Years and over | 12 (100.0%) | 0 (0.0%) |
| Total | 2,418 (88.8%) | 305 (11.2%) |
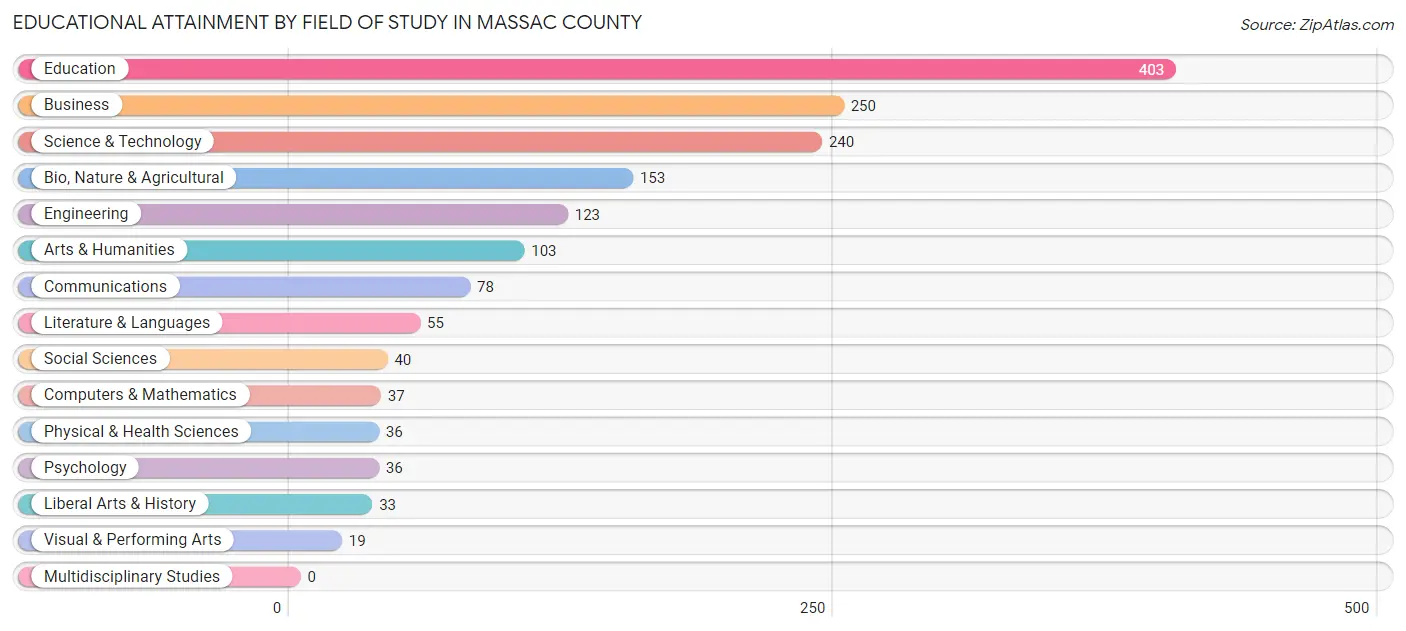
Educational Attainment by Field of Study in Massac County
Education (403 | 25.1%), business (250 | 15.6%), science & technology (240 | 14.9%), bio, nature & agricultural (153 | 9.5%), and engineering (123 | 7.7%) are the most common fields of study among 1,606 individuals in Massac County who have obtained a bachelor's degree or higher.
| Field of Study | # Graduates | % Graduates |
| Computers & Mathematics | 37 | 2.3% |
| Bio, Nature & Agricultural | 153 | 9.5% |
| Physical & Health Sciences | 36 | 2.2% |
| Psychology | 36 | 2.2% |
| Social Sciences | 40 | 2.5% |
| Engineering | 123 | 7.7% |
| Multidisciplinary Studies | 0 | 0.0% |
| Science & Technology | 240 | 14.9% |
| Business | 250 | 15.6% |
| Education | 403 | 25.1% |
| Literature & Languages | 55 | 3.4% |
| Liberal Arts & History | 33 | 2.1% |
| Visual & Performing Arts | 19 | 1.2% |
| Communications | 78 | 4.9% |
| Arts & Humanities | 103 | 6.4% |
| Total | 1,606 | 100.0% |
Transportation & Commute in Massac County
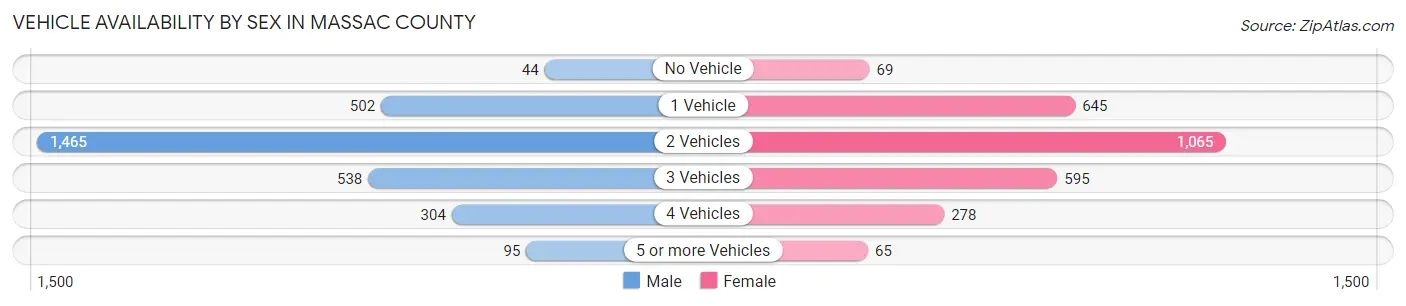
Vehicle Availability by Sex in Massac County
The most prevalent vehicle ownership categories in Massac County are males with 2 vehicles (1,465, accounting for 49.7%) and females with 2 vehicles (1,065, making up 53.9%).
| Vehicles Available | Male | Female |
| No Vehicle | 44 (1.5%) | 69 (2.5%) |
| 1 Vehicle | 502 (17.0%) | 645 (23.7%) |
| 2 Vehicles | 1,465 (49.7%) | 1,065 (39.2%) |
| 3 Vehicles | 538 (18.2%) | 595 (21.9%) |
| 4 Vehicles | 304 (10.3%) | 278 (10.2%) |
| 5 or more Vehicles | 95 (3.2%) | 65 (2.4%) |
| Total | 2,948 (100.0%) | 2,717 (100.0%) |
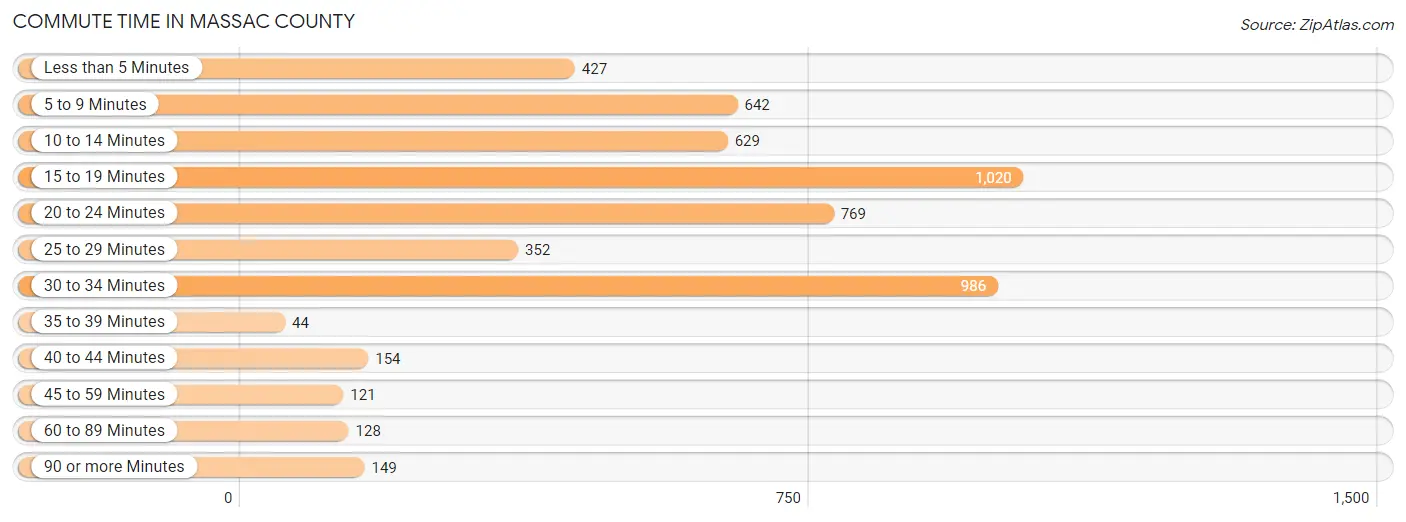
Commute Time in Massac County
The most frequently occuring commute durations in Massac County are 15 to 19 minutes (1,020 commuters, 18.8%), 30 to 34 minutes (986 commuters, 18.2%), and 20 to 24 minutes (769 commuters, 14.2%).
| Commute Time | # Commuters | % Commuters |
| Less than 5 Minutes | 427 | 7.9% |
| 5 to 9 Minutes | 642 | 11.8% |
| 10 to 14 Minutes | 629 | 11.6% |
| 15 to 19 Minutes | 1,020 | 18.8% |
| 20 to 24 Minutes | 769 | 14.2% |
| 25 to 29 Minutes | 352 | 6.5% |
| 30 to 34 Minutes | 986 | 18.2% |
| 35 to 39 Minutes | 44 | 0.8% |
| 40 to 44 Minutes | 154 | 2.8% |
| 45 to 59 Minutes | 121 | 2.2% |
| 60 to 89 Minutes | 128 | 2.4% |
| 90 or more Minutes | 149 | 2.8% |
Commute Time by Sex in Massac County
The most common commute times in Massac County are 30 to 34 minutes (629 commuters, 22.1%) for males and 15 to 19 minutes (599 commuters, 23.3%) for females.
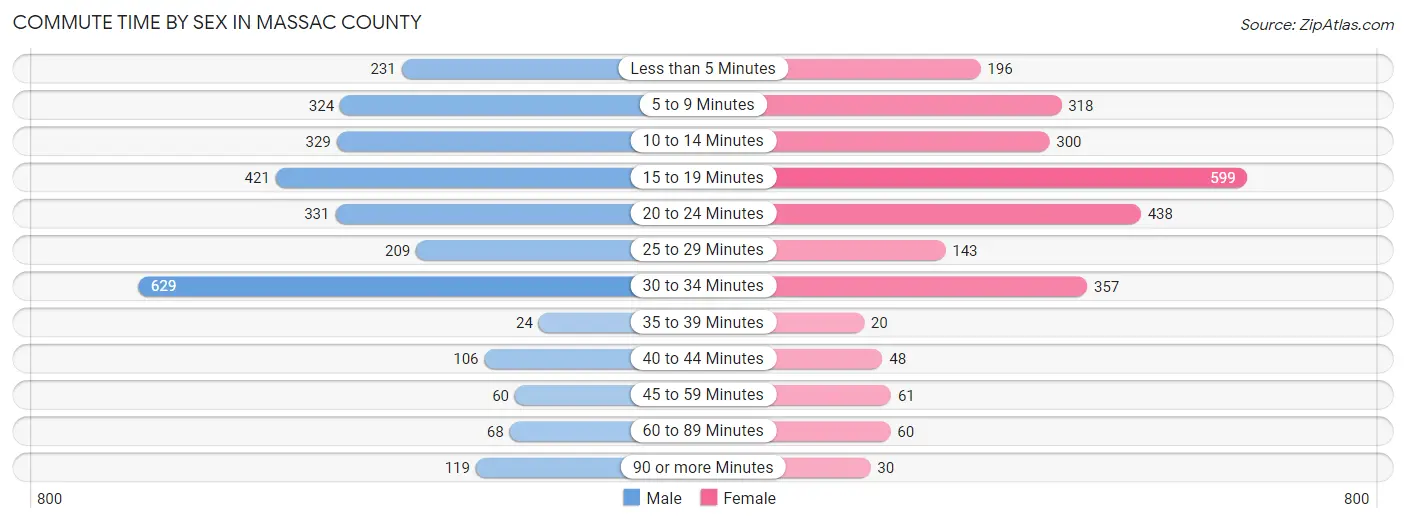
| Commute Time | Male | Female |
| Less than 5 Minutes | 231 (8.1%) | 196 (7.6%) |
| 5 to 9 Minutes | 324 (11.4%) | 318 (12.4%) |
| 10 to 14 Minutes | 329 (11.5%) | 300 (11.7%) |
| 15 to 19 Minutes | 421 (14.8%) | 599 (23.3%) |
| 20 to 24 Minutes | 331 (11.6%) | 438 (17.0%) |
| 25 to 29 Minutes | 209 (7.3%) | 143 (5.6%) |
| 30 to 34 Minutes | 629 (22.1%) | 357 (13.9%) |
| 35 to 39 Minutes | 24 (0.8%) | 20 (0.8%) |
| 40 to 44 Minutes | 106 (3.7%) | 48 (1.9%) |
| 45 to 59 Minutes | 60 (2.1%) | 61 (2.4%) |
| 60 to 89 Minutes | 68 (2.4%) | 60 (2.3%) |
| 90 or more Minutes | 119 (4.2%) | 30 (1.2%) |
Time of Departure to Work by Sex in Massac County
The most frequent times of departure to work in Massac County are 8:00 AM to 8:29 AM (741, 26.0%) for males and 8:00 AM to 8:29 AM (623, 24.2%) for females.
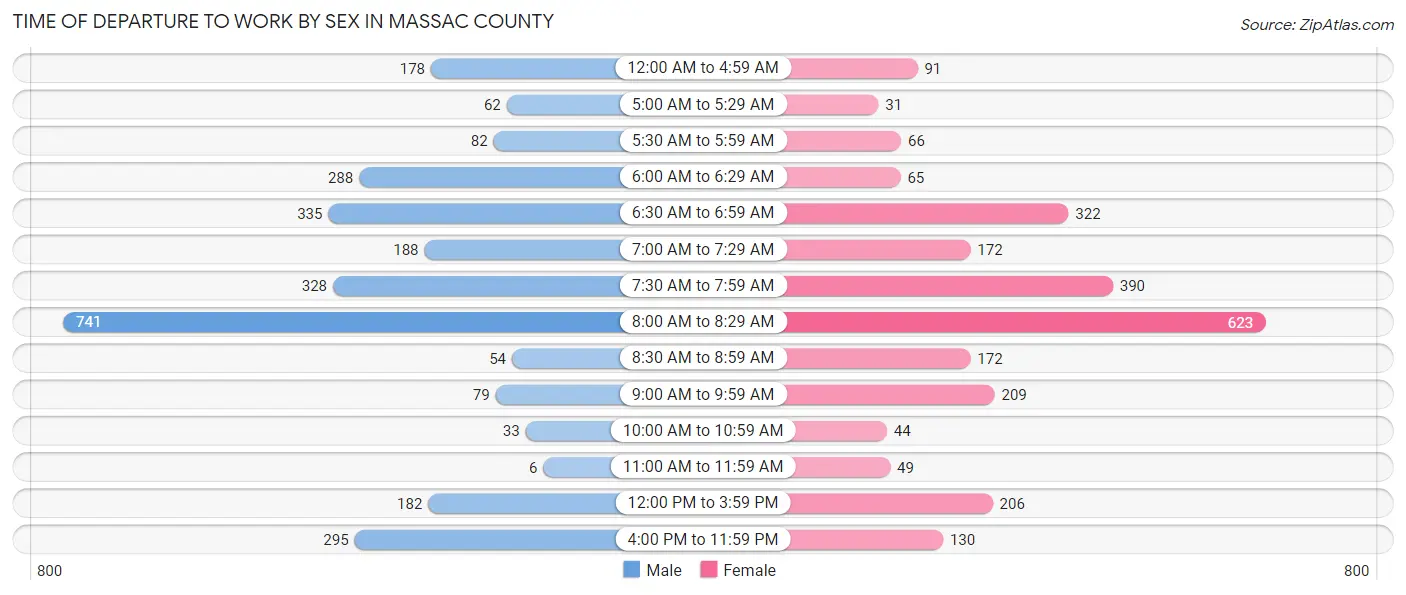
| Time of Departure | Male | Female |
| 12:00 AM to 4:59 AM | 178 (6.2%) | 91 (3.5%) |
| 5:00 AM to 5:29 AM | 62 (2.2%) | 31 (1.2%) |
| 5:30 AM to 5:59 AM | 82 (2.9%) | 66 (2.6%) |
| 6:00 AM to 6:29 AM | 288 (10.1%) | 65 (2.5%) |
| 6:30 AM to 6:59 AM | 335 (11.7%) | 322 (12.5%) |
| 7:00 AM to 7:29 AM | 188 (6.6%) | 172 (6.7%) |
| 7:30 AM to 7:59 AM | 328 (11.5%) | 390 (15.2%) |
| 8:00 AM to 8:29 AM | 741 (26.0%) | 623 (24.2%) |
| 8:30 AM to 8:59 AM | 54 (1.9%) | 172 (6.7%) |
| 9:00 AM to 9:59 AM | 79 (2.8%) | 209 (8.1%) |
| 10:00 AM to 10:59 AM | 33 (1.2%) | 44 (1.7%) |
| 11:00 AM to 11:59 AM | 6 (0.2%) | 49 (1.9%) |
| 12:00 PM to 3:59 PM | 182 (6.4%) | 206 (8.0%) |
| 4:00 PM to 11:59 PM | 295 (10.3%) | 130 (5.1%) |
| Total | 2,851 (100.0%) | 2,570 (100.0%) |
Housing Occupancy in Massac County
Occupancy by Ownership in Massac County
Of the total 5,413 dwellings in Massac County, owner-occupied units account for 4,227 (78.1%), while renter-occupied units make up 1,186 (21.9%).
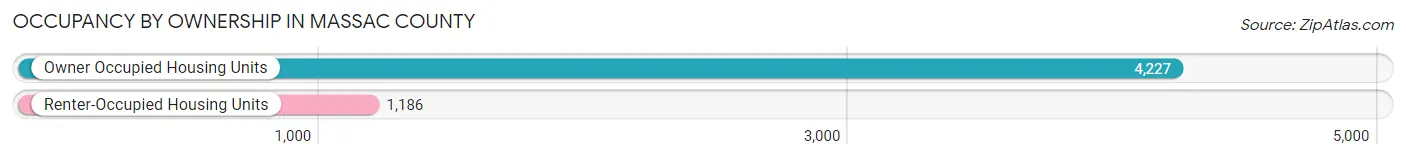
| Occupancy | # Housing Units | % Housing Units |
| Owner Occupied Housing Units | 4,227 | 78.1% |
| Renter-Occupied Housing Units | 1,186 | 21.9% |
| Total Occupied Housing Units | 5,413 | 100.0% |
Occupancy by Household Size in Massac County
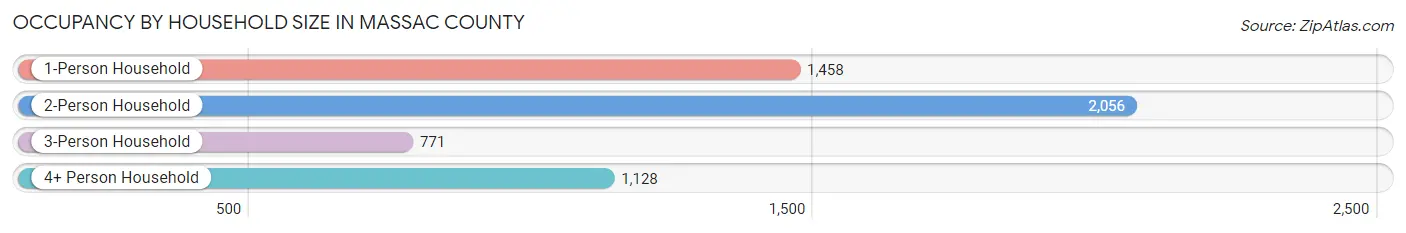
| Household Size | # Housing Units | % Housing Units |
| 1-Person Household | 1,458 | 26.9% |
| 2-Person Household | 2,056 | 38.0% |
| 3-Person Household | 771 | 14.2% |
| 4+ Person Household | 1,128 | 20.8% |
| Total Housing Units | 5,413 | 100.0% |
Occupancy by Ownership by Household Size in Massac County
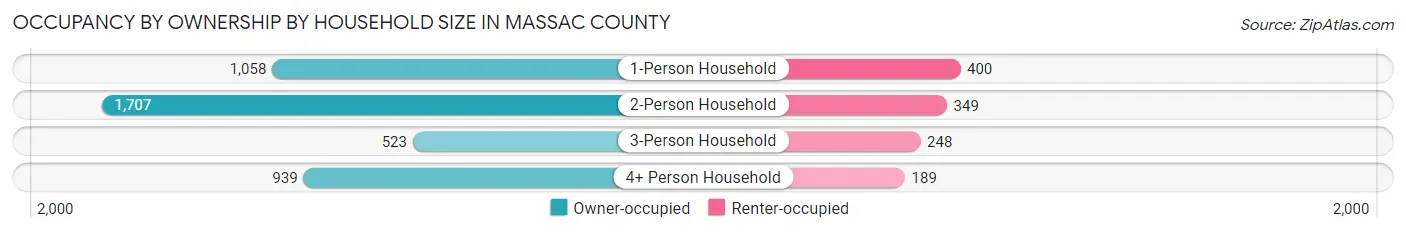
| Household Size | Owner-occupied | Renter-occupied |
| 1-Person Household | 1,058 (72.6%) | 400 (27.4%) |
| 2-Person Household | 1,707 (83.0%) | 349 (17.0%) |
| 3-Person Household | 523 (67.8%) | 248 (32.2%) |
| 4+ Person Household | 939 (83.2%) | 189 (16.8%) |
| Total Housing Units | 4,227 (78.1%) | 1,186 (21.9%) |
Occupancy by Educational Attainment in Massac County
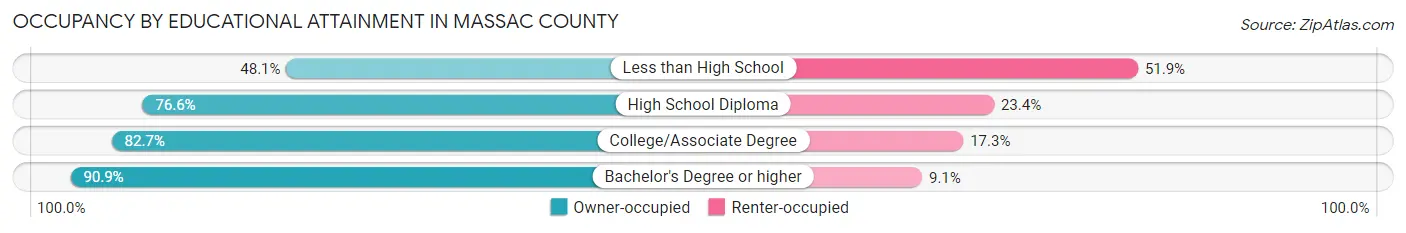
| Household Size | Owner-occupied | Renter-occupied |
| Less than High School | 317 (48.1%) | 342 (51.9%) |
| High School Diploma | 1,230 (76.6%) | 375 (23.4%) |
| College/Associate Degree | 1,851 (82.7%) | 386 (17.3%) |
| Bachelor's Degree or higher | 829 (90.9%) | 83 (9.1%) |
Occupancy by Age of Householder in Massac County
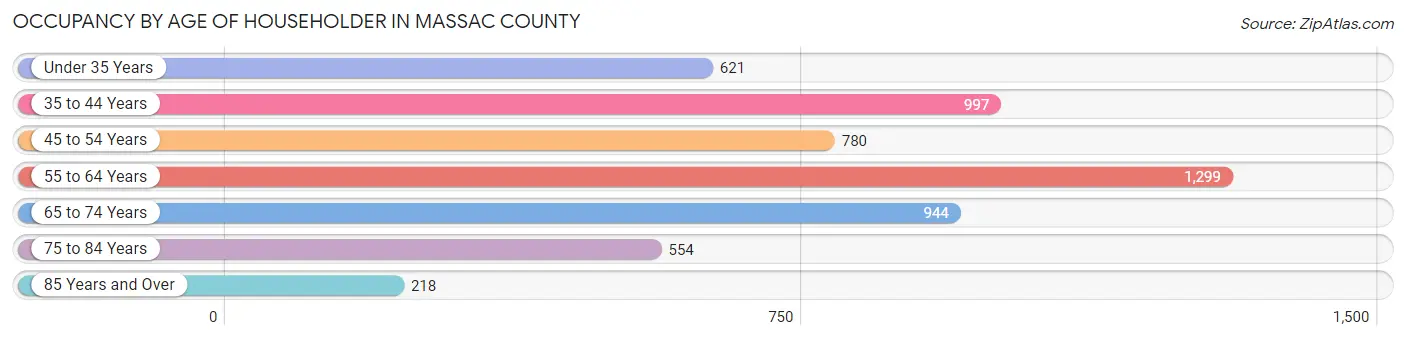
| Age Bracket | # Households | % Households |
| Under 35 Years | 621 | 11.5% |
| 35 to 44 Years | 997 | 18.4% |
| 45 to 54 Years | 780 | 14.4% |
| 55 to 64 Years | 1,299 | 24.0% |
| 65 to 74 Years | 944 | 17.4% |
| 75 to 84 Years | 554 | 10.2% |
| 85 Years and Over | 218 | 4.0% |
| Total | 5,413 | 100.0% |
Housing Finances in Massac County
Median Income by Occupancy in Massac County
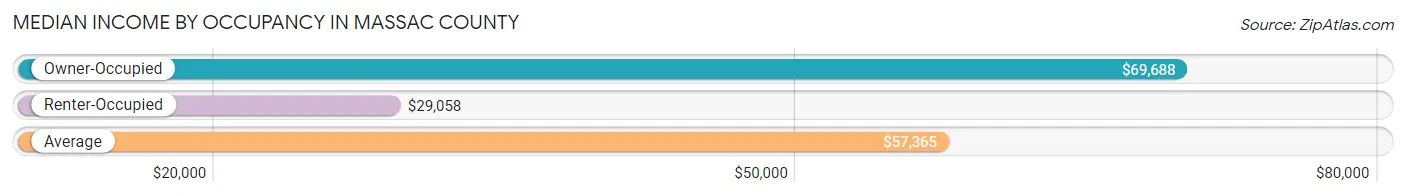
| Occupancy Type | # Households | Median Income |
| Owner-Occupied | 4,227 (78.1%) | $69,688 |
| Renter-Occupied | 1,186 (21.9%) | $29,058 |
| Average | 5,413 (100.0%) | $57,365 |
Occupancy by Householder Income Bracket in Massac County
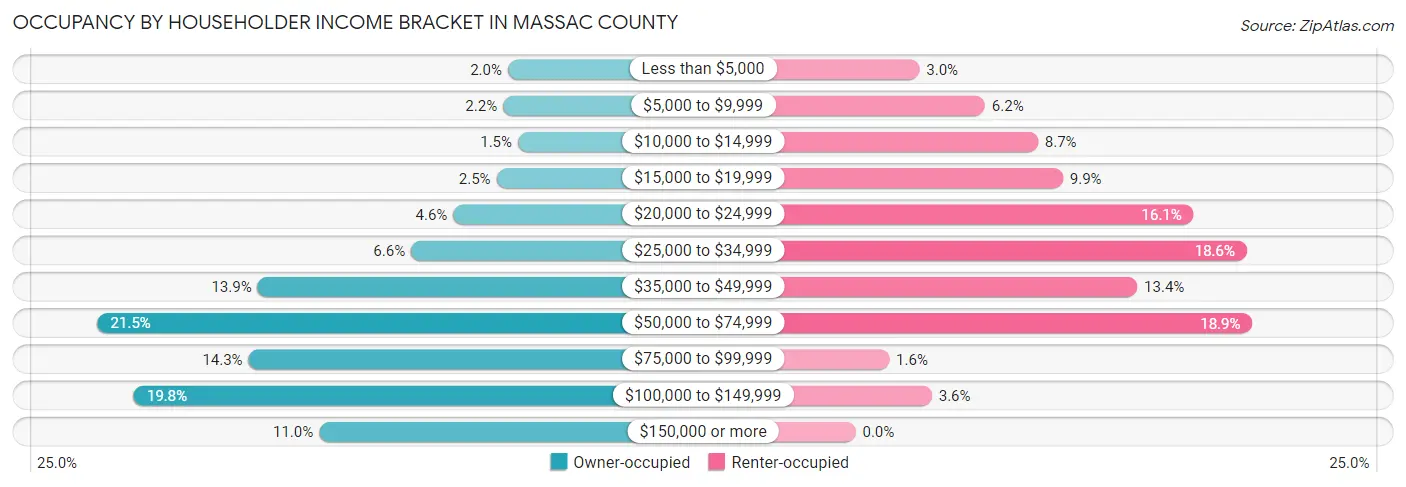
| Income Bracket | Owner-occupied | Renter-occupied |
| Less than $5,000 | 84 (2.0%) | 36 (3.0%) |
| $5,000 to $9,999 | 94 (2.2%) | 73 (6.2%) |
| $10,000 to $14,999 | 64 (1.5%) | 103 (8.7%) |
| $15,000 to $19,999 | 107 (2.5%) | 117 (9.9%) |
| $20,000 to $24,999 | 194 (4.6%) | 191 (16.1%) |
| $25,000 to $34,999 | 279 (6.6%) | 221 (18.6%) |
| $35,000 to $49,999 | 588 (13.9%) | 159 (13.4%) |
| $50,000 to $74,999 | 910 (21.5%) | 224 (18.9%) |
| $75,000 to $99,999 | 606 (14.3%) | 19 (1.6%) |
| $100,000 to $149,999 | 837 (19.8%) | 43 (3.6%) |
| $150,000 or more | 464 (11.0%) | 0 (0.0%) |
| Total | 4,227 (100.0%) | 1,186 (100.0%) |
Monthly Housing Cost Tiers in Massac County
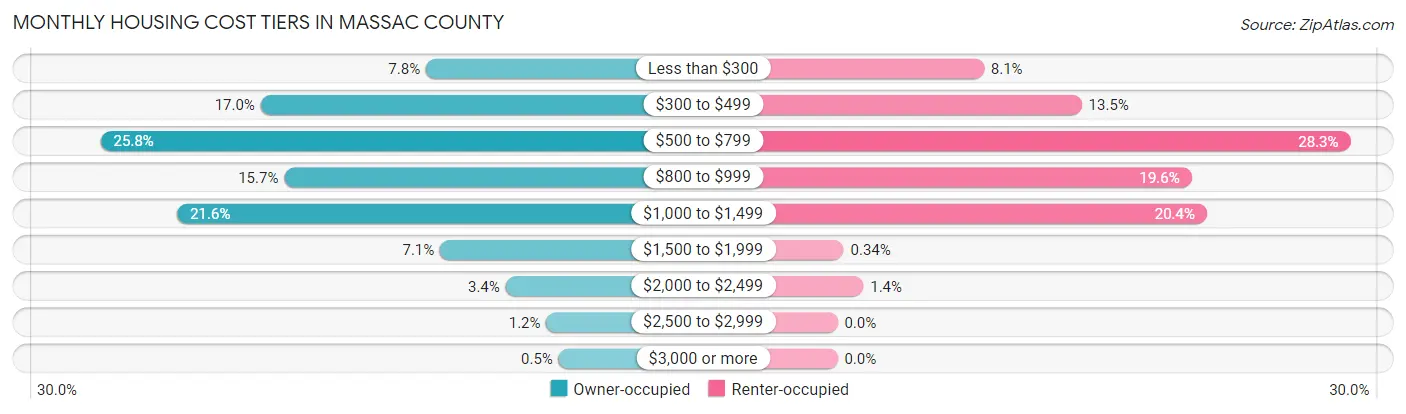
| Monthly Cost | Owner-occupied | Renter-occupied |
| Less than $300 | 331 (7.8%) | 96 (8.1%) |
| $300 to $499 | 717 (17.0%) | 160 (13.5%) |
| $500 to $799 | 1,091 (25.8%) | 336 (28.3%) |
| $800 to $999 | 662 (15.7%) | 232 (19.6%) |
| $1,000 to $1,499 | 912 (21.6%) | 242 (20.4%) |
| $1,500 to $1,999 | 298 (7.0%) | 4 (0.3%) |
| $2,000 to $2,499 | 145 (3.4%) | 17 (1.4%) |
| $2,500 to $2,999 | 50 (1.2%) | 0 (0.0%) |
| $3,000 or more | 21 (0.5%) | 0 (0.0%) |
| Total | 4,227 (100.0%) | 1,186 (100.0%) |
Physical Housing Characteristics in Massac County
Housing Structures in Massac County
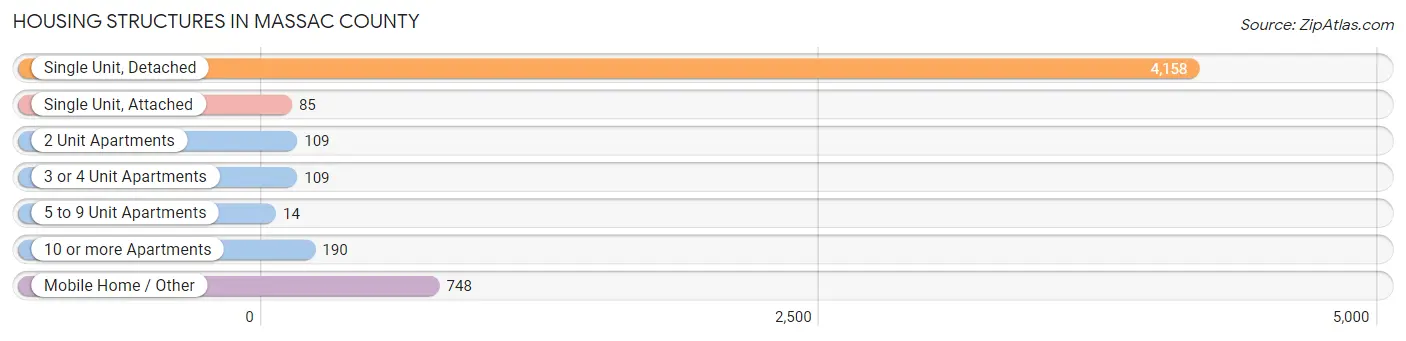
| Structure Type | # Housing Units | % Housing Units |
| Single Unit, Detached | 4,158 | 76.8% |
| Single Unit, Attached | 85 | 1.6% |
| 2 Unit Apartments | 109 | 2.0% |
| 3 or 4 Unit Apartments | 109 | 2.0% |
| 5 to 9 Unit Apartments | 14 | 0.3% |
| 10 or more Apartments | 190 | 3.5% |
| Mobile Home / Other | 748 | 13.8% |
| Total | 5,413 | 100.0% |
Housing Structures by Occupancy in Massac County
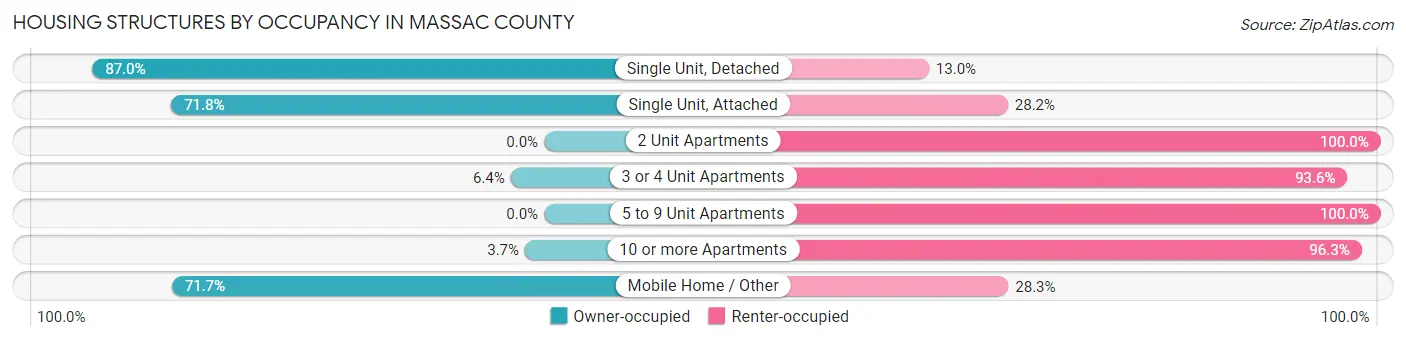
| Structure Type | Owner-occupied | Renter-occupied |
| Single Unit, Detached | 3,616 (87.0%) | 542 (13.0%) |
| Single Unit, Attached | 61 (71.8%) | 24 (28.2%) |
| 2 Unit Apartments | 0 (0.0%) | 109 (100.0%) |
| 3 or 4 Unit Apartments | 7 (6.4%) | 102 (93.6%) |
| 5 to 9 Unit Apartments | 0 (0.0%) | 14 (100.0%) |
| 10 or more Apartments | 7 (3.7%) | 183 (96.3%) |
| Mobile Home / Other | 536 (71.7%) | 212 (28.3%) |
| Total | 4,227 (78.1%) | 1,186 (21.9%) |
Housing Structures by Number of Rooms in Massac County
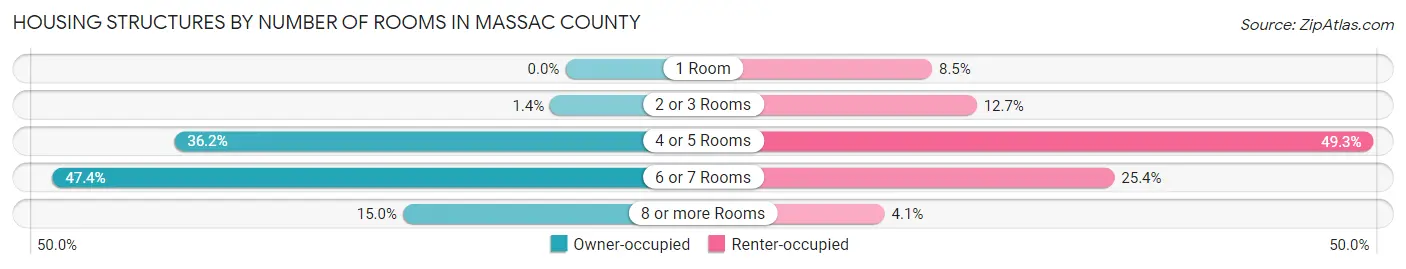
| Number of Rooms | Owner-occupied | Renter-occupied |
| 1 Room | 0 (0.0%) | 101 (8.5%) |
| 2 or 3 Rooms | 59 (1.4%) | 150 (12.7%) |
| 4 or 5 Rooms | 1,528 (36.1%) | 585 (49.3%) |
| 6 or 7 Rooms | 2,005 (47.4%) | 301 (25.4%) |
| 8 or more Rooms | 635 (15.0%) | 49 (4.1%) |
| Total | 4,227 (100.0%) | 1,186 (100.0%) |
Housing Structure by Heating Type in Massac County
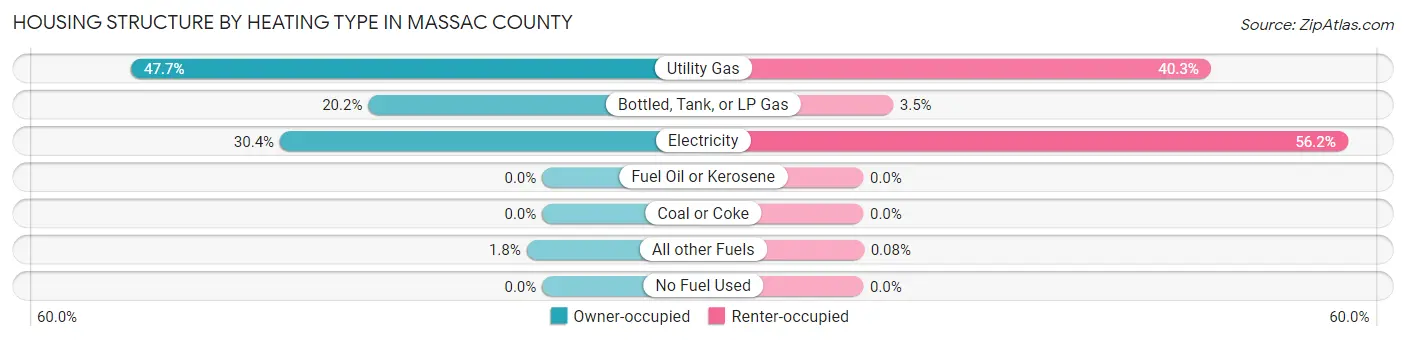
| Heating Type | Owner-occupied | Renter-occupied |
| Utility Gas | 2,014 (47.6%) | 478 (40.3%) |
| Bottled, Tank, or LP Gas | 852 (20.2%) | 41 (3.5%) |
| Electricity | 1,285 (30.4%) | 666 (56.2%) |
| Fuel Oil or Kerosene | 0 (0.0%) | 0 (0.0%) |
| Coal or Coke | 0 (0.0%) | 0 (0.0%) |
| All other Fuels | 76 (1.8%) | 1 (0.1%) |
| No Fuel Used | 0 (0.0%) | 0 (0.0%) |
| Total | 4,227 (100.0%) | 1,186 (100.0%) |
Household Vehicle Usage in Massac County
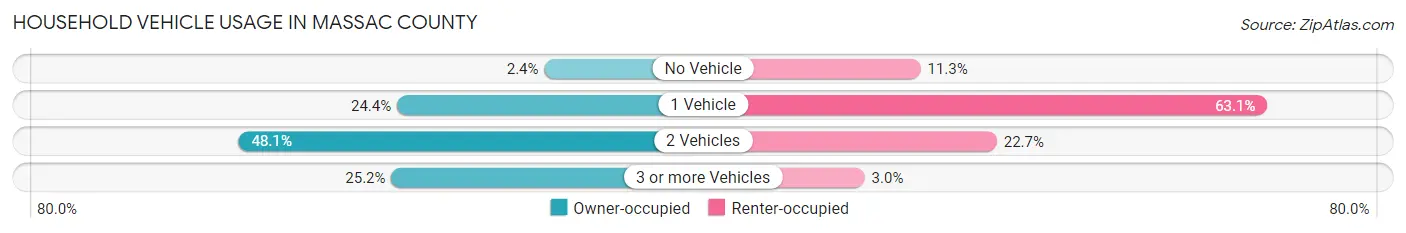
| Vehicles per Household | Owner-occupied | Renter-occupied |
| No Vehicle | 100 (2.4%) | 134 (11.3%) |
| 1 Vehicle | 1,030 (24.4%) | 748 (63.1%) |
| 2 Vehicles | 2,031 (48.0%) | 269 (22.7%) |
| 3 or more Vehicles | 1,066 (25.2%) | 35 (2.9%) |
| Total | 4,227 (100.0%) | 1,186 (100.0%) |
Real Estate & Mortgages in Massac County
Real Estate and Mortgage Overview in Massac County
| Characteristic | Without Mortgage | With Mortgage |
| Housing Units | 2,224 | 2,003 |
| Median Property Value | $106,700 | $125,900 |
| Median Household Income | $61,450 | $246 |
| Monthly Housing Costs | $519 | $21 |
| Real Estate Taxes | $1,524 | $42 |
Property Value by Mortgage Status in Massac County
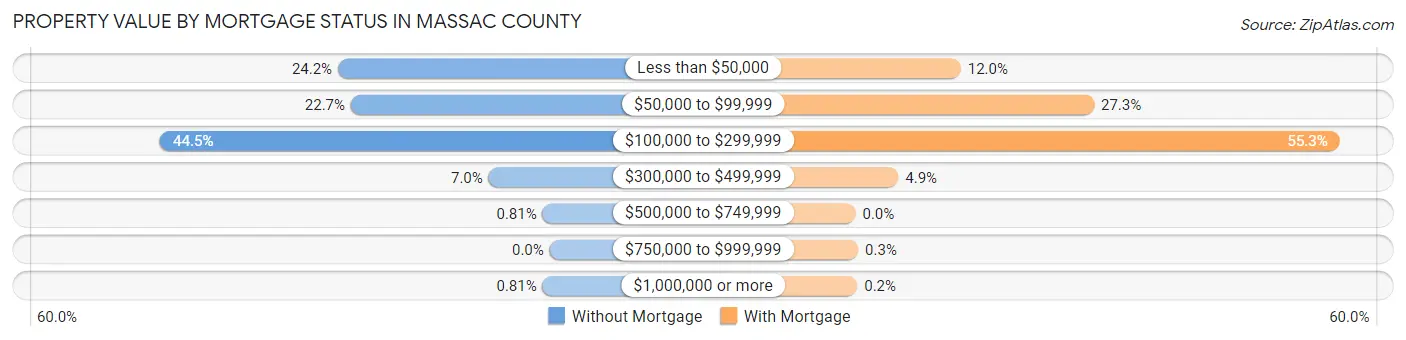
| Property Value | Without Mortgage | With Mortgage |
| Less than $50,000 | 538 (24.2%) | 241 (12.0%) |
| $50,000 to $99,999 | 505 (22.7%) | 546 (27.3%) |
| $100,000 to $299,999 | 990 (44.5%) | 1,108 (55.3%) |
| $300,000 to $499,999 | 155 (7.0%) | 98 (4.9%) |
| $500,000 to $749,999 | 18 (0.8%) | 0 (0.0%) |
| $750,000 to $999,999 | 0 (0.0%) | 6 (0.3%) |
| $1,000,000 or more | 18 (0.8%) | 4 (0.2%) |
| Total | 2,224 (100.0%) | 2,003 (100.0%) |
Household Income by Mortgage Status in Massac County
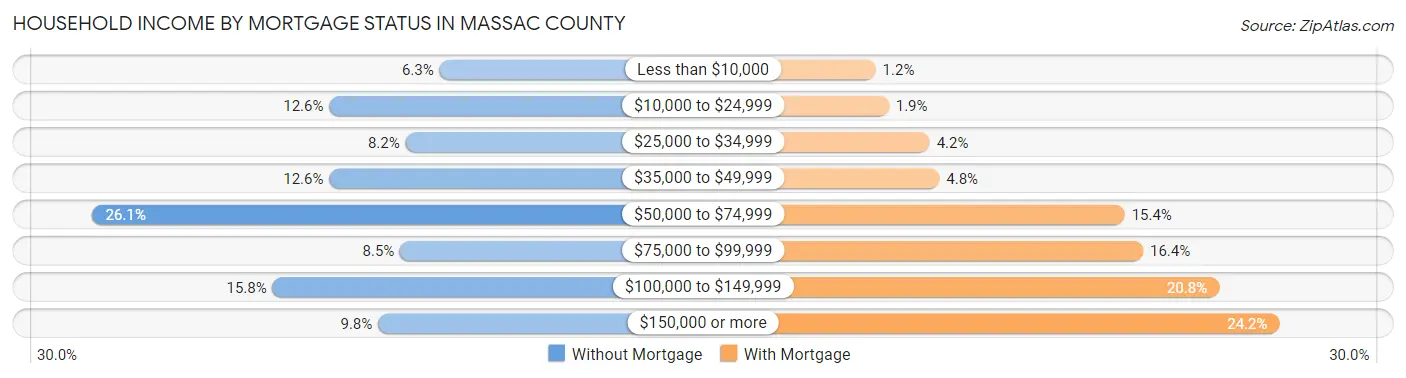
| Household Income | Without Mortgage | With Mortgage |
| Less than $10,000 | 140 (6.3%) | 23 (1.1%) |
| $10,000 to $24,999 | 280 (12.6%) | 38 (1.9%) |
| $25,000 to $34,999 | 183 (8.2%) | 85 (4.2%) |
| $35,000 to $49,999 | 280 (12.6%) | 96 (4.8%) |
| $50,000 to $74,999 | 581 (26.1%) | 308 (15.4%) |
| $75,000 to $99,999 | 190 (8.5%) | 329 (16.4%) |
| $100,000 to $149,999 | 352 (15.8%) | 416 (20.8%) |
| $150,000 or more | 218 (9.8%) | 485 (24.2%) |
| Total | 2,224 (100.0%) | 2,003 (100.0%) |
Property Value to Household Income Ratio in Massac County
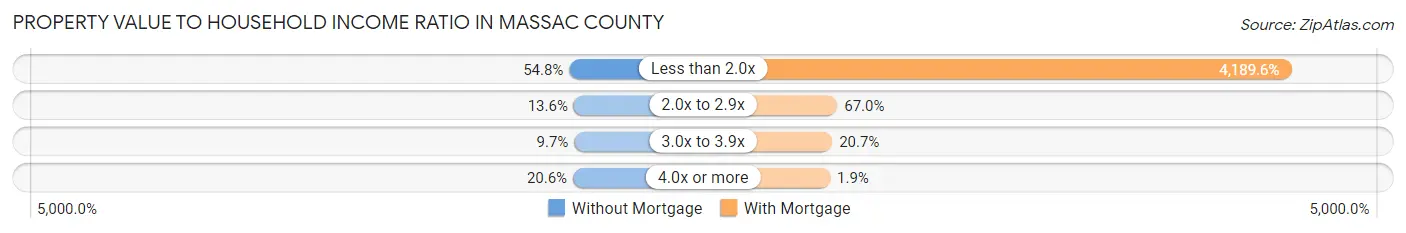
| Value-to-Income Ratio | Without Mortgage | With Mortgage |
| Less than 2.0x | 1,218 (54.8%) | 83,918 (4,189.6%) |
| 2.0x to 2.9x | 302 (13.6%) | 1,341 (66.9%) |
| 3.0x to 3.9x | 216 (9.7%) | 415 (20.7%) |
| 4.0x or more | 459 (20.6%) | 37 (1.8%) |
| Total | 2,224 (100.0%) | 2,003 (100.0%) |
Real Estate Taxes by Mortgage Status in Massac County
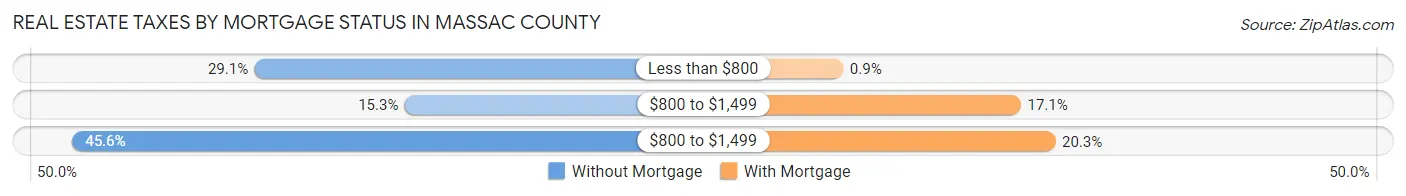
| Property Taxes | Without Mortgage | With Mortgage |
| Less than $800 | 646 (29.0%) | 18 (0.9%) |
| $800 to $1,499 | 341 (15.3%) | 343 (17.1%) |
| $800 to $1,499 | 1,015 (45.6%) | 406 (20.3%) |
| Total | 2,224 (100.0%) | 2,003 (100.0%) |
Health & Disability in Massac County
Health Insurance Coverage by Age in Massac County
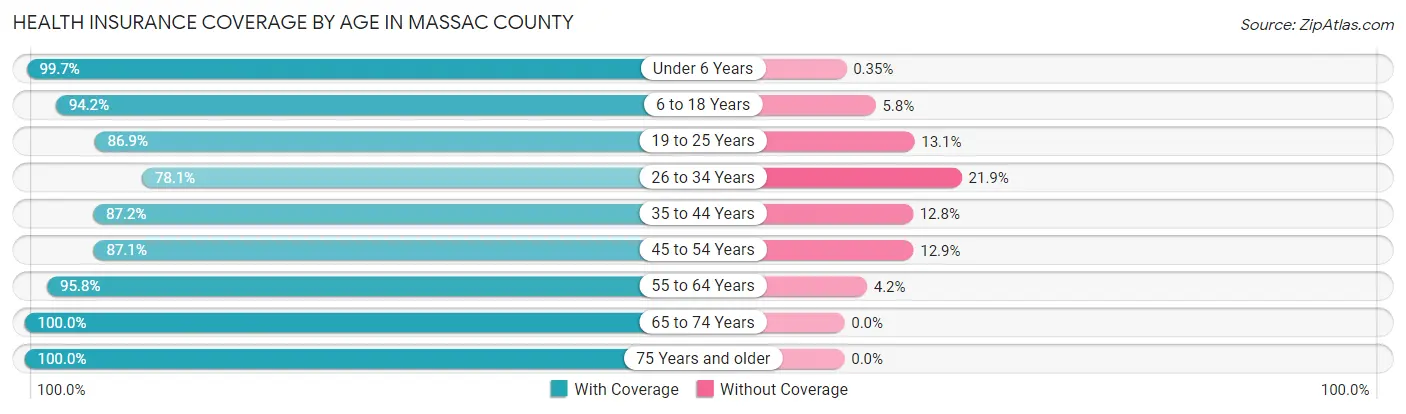
| Age Bracket | With Coverage | Without Coverage |
| Under 6 Years | 852 (99.7%) | 3 (0.4%) |
| 6 to 18 Years | 2,235 (94.2%) | 138 (5.8%) |
| 19 to 25 Years | 779 (86.9%) | 117 (13.1%) |
| 26 to 34 Years | 1,046 (78.1%) | 293 (21.9%) |
| 35 to 44 Years | 1,483 (87.2%) | 217 (12.8%) |
| 45 to 54 Years | 1,658 (87.1%) | 245 (12.9%) |
| 55 to 64 Years | 2,036 (95.8%) | 89 (4.2%) |
| 65 to 74 Years | 1,532 (100.0%) | 0 (0.0%) |
| 75 Years and older | 1,201 (100.0%) | 0 (0.0%) |
| Total | 12,822 (92.1%) | 1,102 (7.9%) |
Health Insurance Coverage by Citizenship Status in Massac County
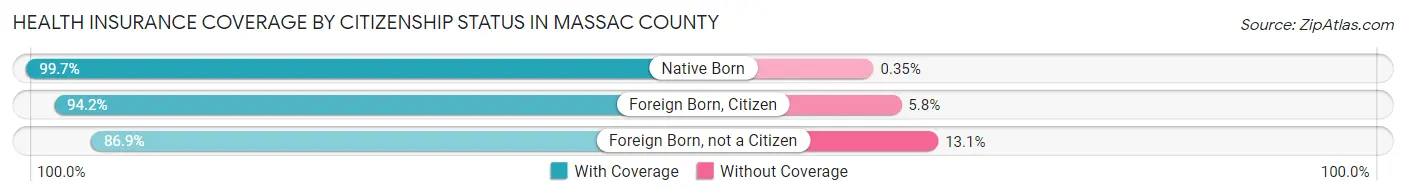
| Citizenship Status | With Coverage | Without Coverage |
| Native Born | 852 (99.7%) | 3 (0.4%) |
| Foreign Born, Citizen | 2,235 (94.2%) | 138 (5.8%) |
| Foreign Born, not a Citizen | 779 (86.9%) | 117 (13.1%) |
Health Insurance Coverage by Household Income in Massac County
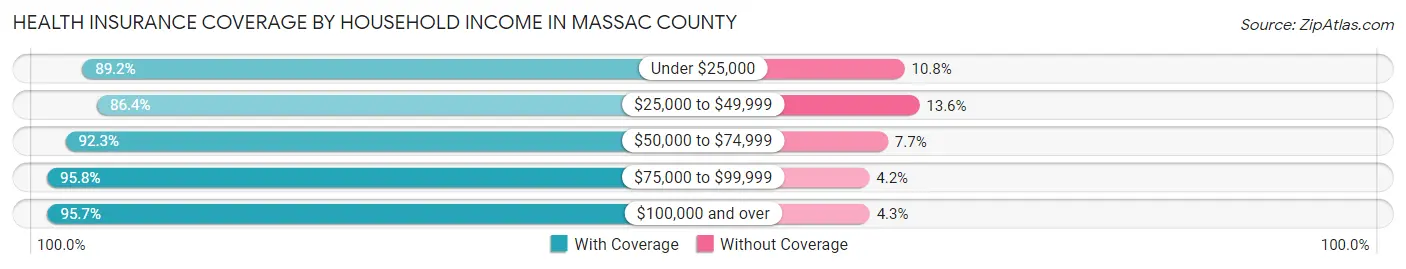
| Household Income | With Coverage | Without Coverage |
| Under $25,000 | 1,689 (89.2%) | 205 (10.8%) |
| $25,000 to $49,999 | 2,637 (86.4%) | 415 (13.6%) |
| $50,000 to $74,999 | 2,734 (92.3%) | 228 (7.7%) |
| $75,000 to $99,999 | 1,678 (95.8%) | 74 (4.2%) |
| $100,000 and over | 4,003 (95.7%) | 180 (4.3%) |
Public vs Private Health Insurance Coverage by Age in Massac County
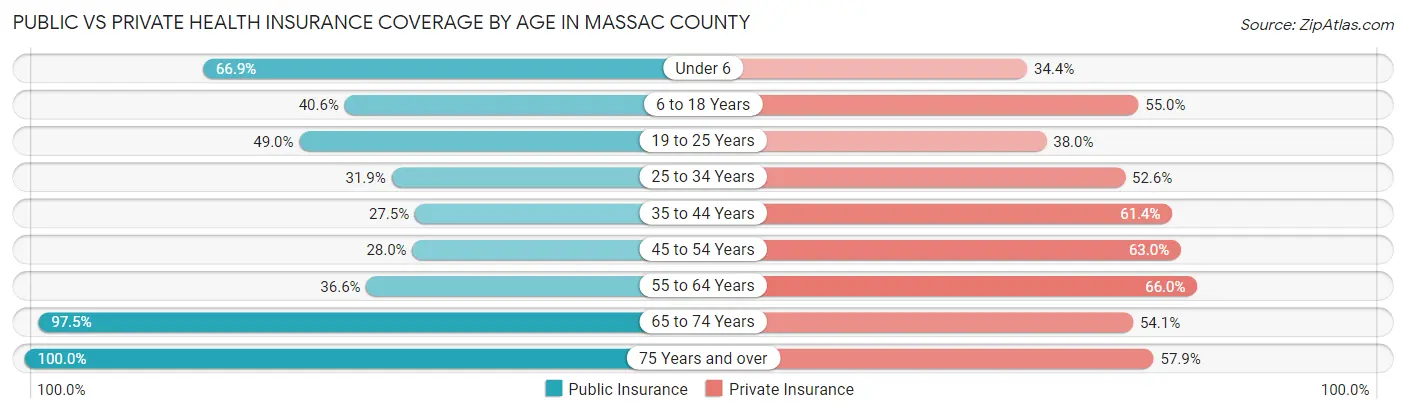
| Age Bracket | Public Insurance | Private Insurance |
| Under 6 | 572 (66.9%) | 294 (34.4%) |
| 6 to 18 Years | 963 (40.6%) | 1,306 (55.0%) |
| 19 to 25 Years | 439 (49.0%) | 340 (38.0%) |
| 25 to 34 Years | 427 (31.9%) | 704 (52.6%) |
| 35 to 44 Years | 468 (27.5%) | 1,043 (61.4%) |
| 45 to 54 Years | 533 (28.0%) | 1,198 (62.9%) |
| 55 to 64 Years | 777 (36.6%) | 1,402 (66.0%) |
| 65 to 74 Years | 1,493 (97.5%) | 828 (54.0%) |
| 75 Years and over | 1,201 (100.0%) | 695 (57.9%) |
| Total | 6,873 (49.4%) | 7,810 (56.1%) |
Disability Status by Sex by Age in Massac County
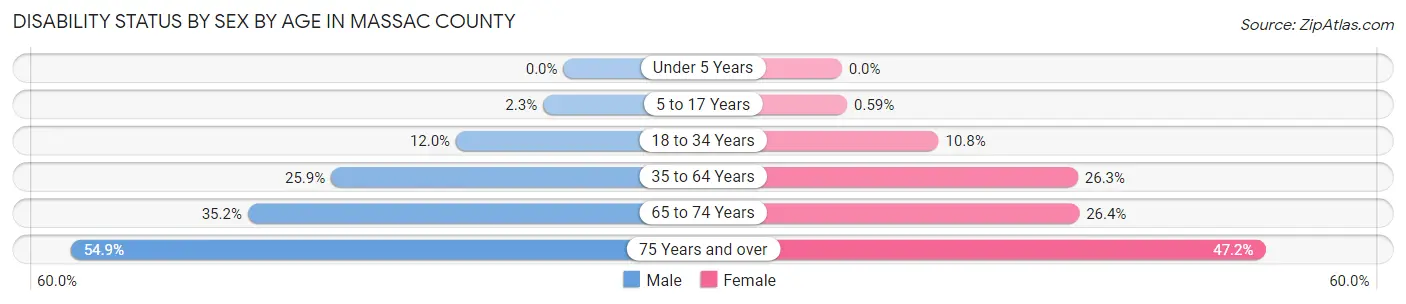
| Age Bracket | Male | Female |
| Under 5 Years | 0 (0.0%) | 0 (0.0%) |
| 5 to 17 Years | 26 (2.3%) | 7 (0.6%) |
| 18 to 34 Years | 144 (12.0%) | 130 (10.8%) |
| 35 to 64 Years | 737 (25.9%) | 757 (26.3%) |
| 65 to 74 Years | 258 (35.1%) | 211 (26.4%) |
| 75 Years and over | 282 (54.9%) | 324 (47.2%) |
Disability Class by Sex by Age in Massac County
Disability Class: Hearing Difficulty
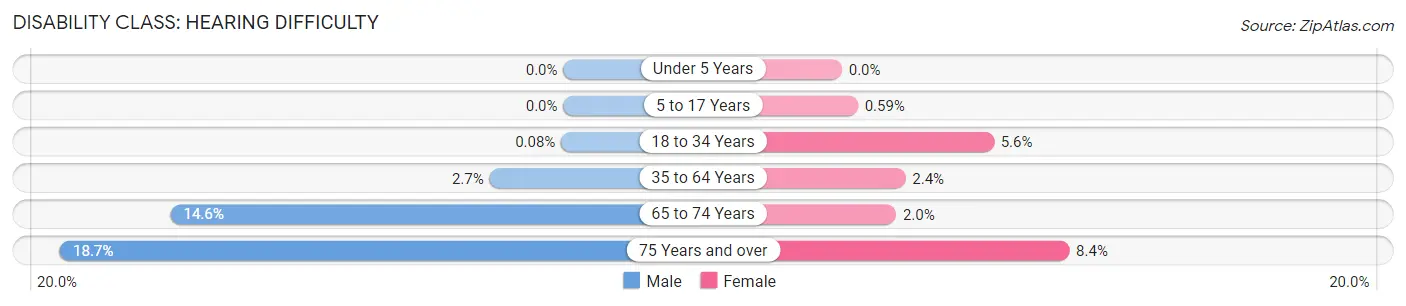
| Age Bracket | Male | Female |
| Under 5 Years | 0 (0.0%) | 0 (0.0%) |
| 5 to 17 Years | 0 (0.0%) | 7 (0.6%) |
| 18 to 34 Years | 1 (0.1%) | 68 (5.6%) |
| 35 to 64 Years | 78 (2.7%) | 68 (2.4%) |
| 65 to 74 Years | 107 (14.6%) | 16 (2.0%) |
| 75 Years and over | 96 (18.7%) | 58 (8.4%) |
Disability Class: Vision Difficulty
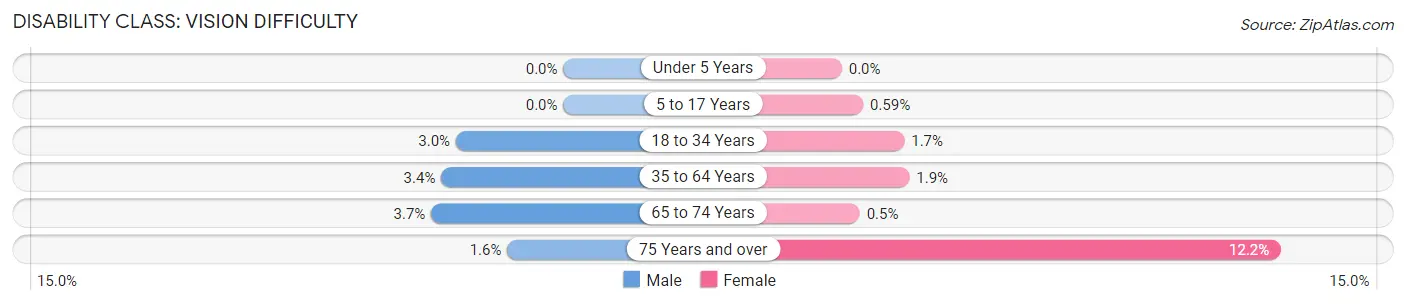
| Age Bracket | Male | Female |
| Under 5 Years | 0 (0.0%) | 0 (0.0%) |
| 5 to 17 Years | 0 (0.0%) | 7 (0.6%) |
| 18 to 34 Years | 36 (3.0%) | 21 (1.7%) |
| 35 to 64 Years | 97 (3.4%) | 54 (1.9%) |
| 65 to 74 Years | 27 (3.7%) | 4 (0.5%) |
| 75 Years and over | 8 (1.6%) | 84 (12.2%) |
Disability Class: Cognitive Difficulty
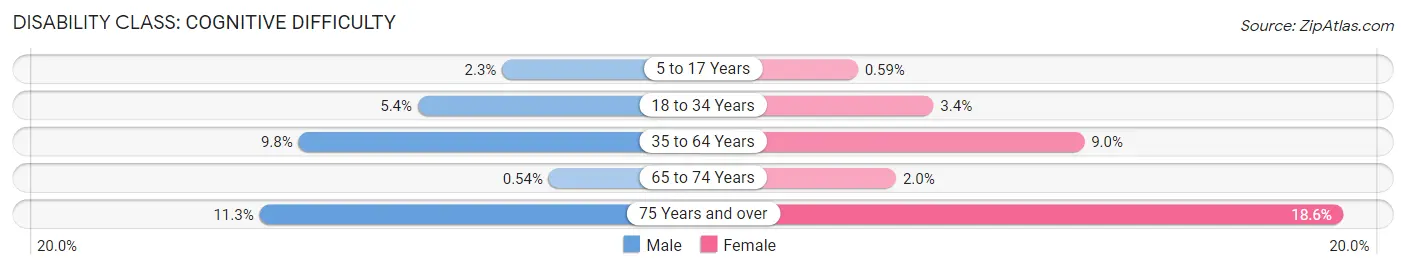
| Age Bracket | Male | Female |
| 5 to 17 Years | 26 (2.3%) | 7 (0.6%) |
| 18 to 34 Years | 65 (5.4%) | 41 (3.4%) |
| 35 to 64 Years | 280 (9.8%) | 259 (9.0%) |
| 65 to 74 Years | 4 (0.5%) | 16 (2.0%) |
| 75 Years and over | 58 (11.3%) | 128 (18.6%) |
Disability Class: Ambulatory Difficulty
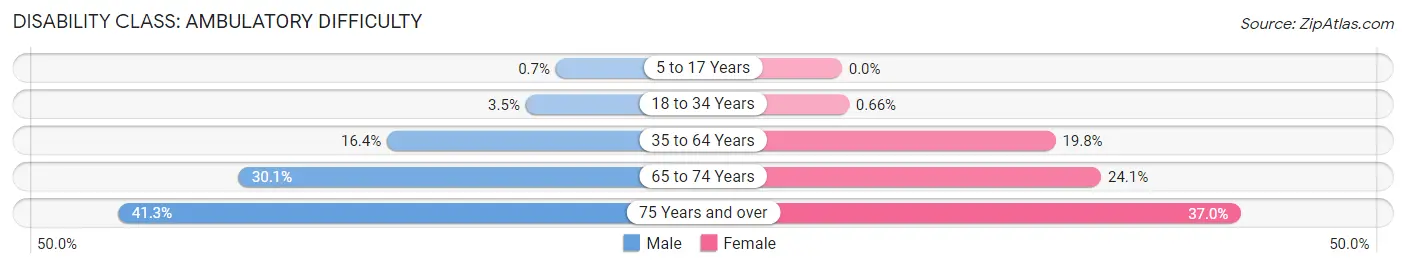
| Age Bracket | Male | Female |
| 5 to 17 Years | 8 (0.7%) | 0 (0.0%) |
| 18 to 34 Years | 42 (3.5%) | 8 (0.7%) |
| 35 to 64 Years | 466 (16.4%) | 571 (19.8%) |
| 65 to 74 Years | 221 (30.1%) | 192 (24.1%) |
| 75 Years and over | 212 (41.2%) | 254 (37.0%) |
Disability Class: Self-Care Difficulty
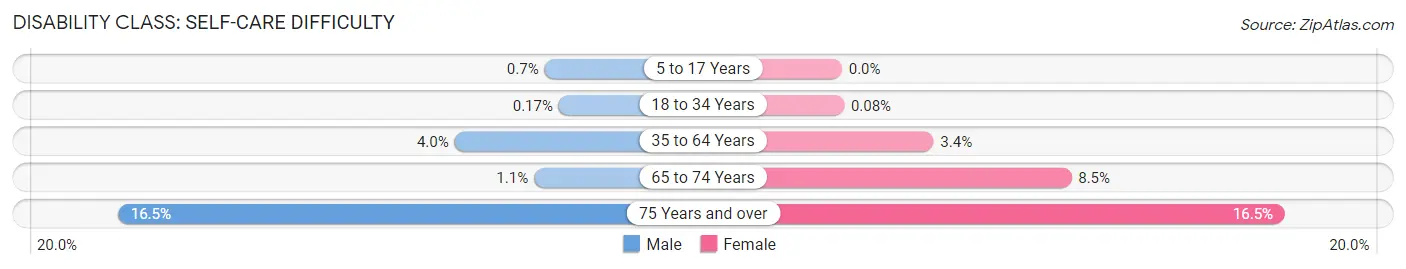
| Age Bracket | Male | Female |
| 5 to 17 Years | 8 (0.7%) | 0 (0.0%) |
| 18 to 34 Years | 2 (0.2%) | 1 (0.1%) |
| 35 to 64 Years | 115 (4.0%) | 98 (3.4%) |
| 65 to 74 Years | 8 (1.1%) | 68 (8.5%) |
| 75 Years and over | 85 (16.5%) | 113 (16.5%) |
Technology Access in Massac County
Computing Device Access in Massac County
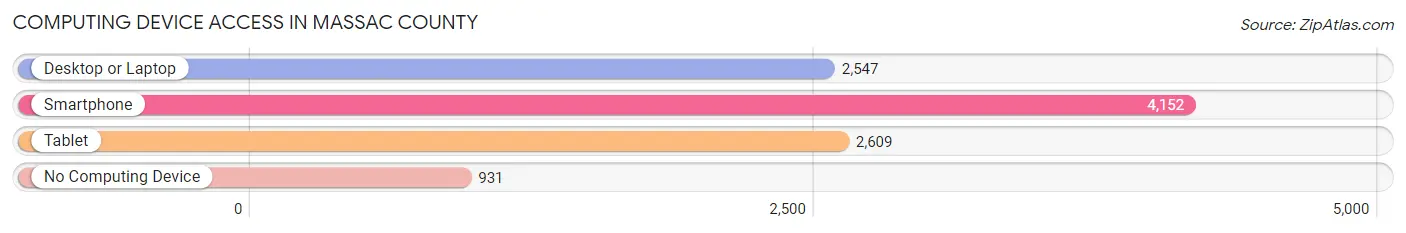
| Device Type | # Households | % Households |
| Desktop or Laptop | 2,547 | 47.0% |
| Smartphone | 4,152 | 76.7% |
| Tablet | 2,609 | 48.2% |
| No Computing Device | 931 | 17.2% |
| Total | 5,413 | 100.0% |
Internet Access in Massac County
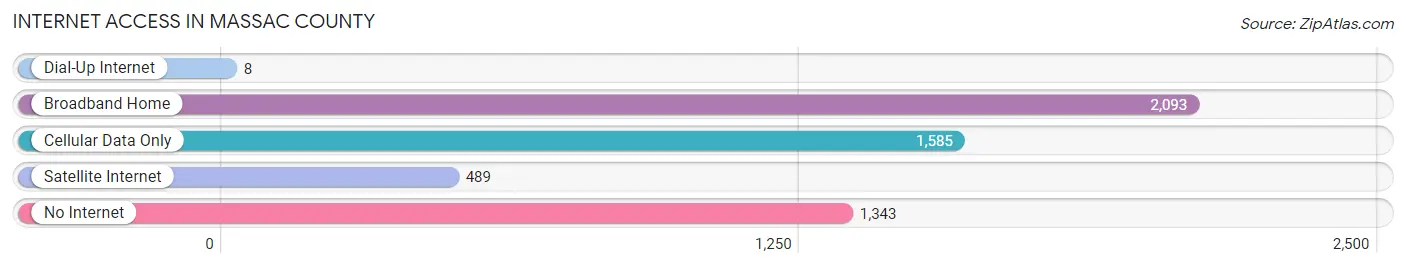
| Internet Type | # Households | % Households |
| Dial-Up Internet | 8 | 0.2% |
| Broadband Home | 2,093 | 38.7% |
| Cellular Data Only | 1,585 | 29.3% |
| Satellite Internet | 489 | 9.0% |
| No Internet | 1,343 | 24.8% |
| Total | 5,413 | 100.0% |
Massac County Summary
Massac County is located in the southernmost part of Illinois, bordering Kentucky and Missouri. It is part of the Metro East region of the state, and is the only county in the region that is not part of the St. Louis metropolitan area. The county seat is Metropolis, and the county is named after Fort Massac, which was built in 1794.
Geography
Massac County covers an area of 545 square miles, and is located in the western part of the state. The county is bordered by the Ohio River to the south, and the Mississippi River to the west. The terrain is mostly flat, with some rolling hills in the northern part of the county. The highest point in the county is located in the northwest corner, at an elevation of 590 feet. The county is home to several state parks, including Fort Massac State Park, which is located on the banks of the Ohio River.
The climate of Massac County is humid continental, with hot summers and cold winters. The average annual temperature is around 54 degrees Fahrenheit, and the average annual precipitation is around 40 inches.
Demographics
As of the 2010 census, Massac County had a population of 15,429. The population density was 28.3 people per square mile. The racial makeup of the county was 95.2% White, 2.2% African American, 0.3% Native American, 0.3% Asian, 0.1% Pacific Islander, 0.7% from other races, and 1.2% from two or more races. Hispanic or Latino of any race were 1.9% of the population.
The median income for a household in the county was $37,945, and the median income for a family was $45,945. The per capita income for the county was $18,945. About 11.2% of families and 14.2% of the population were below the poverty line, including 19.2% of those under age 18 and 8.2% of those age 65 or over.
Economy
Massac County is largely rural, and the economy is based on agriculture and manufacturing. The county is home to several large farms, and the main crops grown are corn, soybeans, and wheat. The county is also home to several manufacturing companies, including a paper mill, a steel mill, and a chemical plant.
The county is also home to several tourist attractions, including Fort Massac State Park, the Metropolis Super Museum, and the Massac County Museum. The county is also home to several wineries, and is a popular destination for wine tasting.
Conclusion
Massac County is a rural county located in the southernmost part of Illinois. It is home to several state parks, and is a popular destination for wine tasting. The economy is based on agriculture and manufacturing, and the county is home to several large farms and manufacturing companies. The population of the county is largely white, and the median income for a household is around $37,945.
Common Questions
What is the Total Population of Massac County?
Total Population of Massac County is 14,135.
What is the Total Male Population of Massac County?
Total Male Population of Massac County is 6,869.
What is the Total Female Population of Massac County?
Total Female Population of Massac County is 7,266.
What is the Ratio of Males per 100 Females in Massac County?
There are 94.54 Males per 100 Females in Massac County.
What is the Ratio of Females per 100 Males in Massac County?
There are 105.78 Females per 100 Males in Massac County.
What is the Median Population Age in Massac County?
Median Population Age in Massac County is 44.1 Years.
What is the Average Family Size in Massac County
Average Family Size in Massac County is 3.0 People.
What is the Average Household Size in Massac County
Average Household Size in Massac County is 2.6 People.
What is Per Capita Income in Massac County?
Per Capita income in Massac County is $28,817.
What is the Median Family Income in Massac County?
Median Family Income in Massac County is $69,664.
What is the Median Household income in Massac County?
Median Household Income in Massac County is $57,365.
What is Income or Wage Gap in Massac County?
Income or Wage Gap in Massac County is 44.4%.
Women in Massac County earn 55.6 cents for every dollar earned by a man.
What is Family Income Deficit in Massac County?
Family Income Deficit in Massac County is $10,216.
Families that are below poverty line in Massac County earn $10,216 less on average than the poverty threshold level.
What is Inequality or Gini Index in Massac County?
Inequality or Gini Index in Massac County is 0.40.
How Large is the Labor Force in Massac County?
There are 5,941 People in the Labor Forcein in Massac County.
What is the Percentage of People in the Labor Force in Massac County?
52.1% of People are in the Labor Force in Massac County.
What is the Unemployment Rate in Massac County?
Unemployment Rate in Massac County is 3.7%.