Madison County, IL
Madison County Map

Madison County Overview
265,512
TOTAL POPULATION
130,136
MALE POPULATION
135,376
FEMALE POPULATION
96.13
MALES / 100 FEMALES
104.03
FEMALES / 100 MALES
39.9
MEDIAN AGE
3.0
AVG FAMILY SIZE
2.4
AVG HOUSEHOLD SIZE
$38,828
PER CAPITA INCOME
$91,366
AVG FAMILY INCOME
$71,759
AVG HOUSEHOLD INCOME
32.6%
WAGE / INCOME GAP [ % ]
67.4¢/ $1
WAGE / INCOME GAP [ $ ]
$10,864
FAMILY INCOME DEFICIT
0.44
INEQUALITY / GINI INDEX
136,668
LABOR FORCE [ PEOPLE ]
63.4%
PERCENT IN LABOR FORCE
5.2%
UNEMPLOYMENT RATE
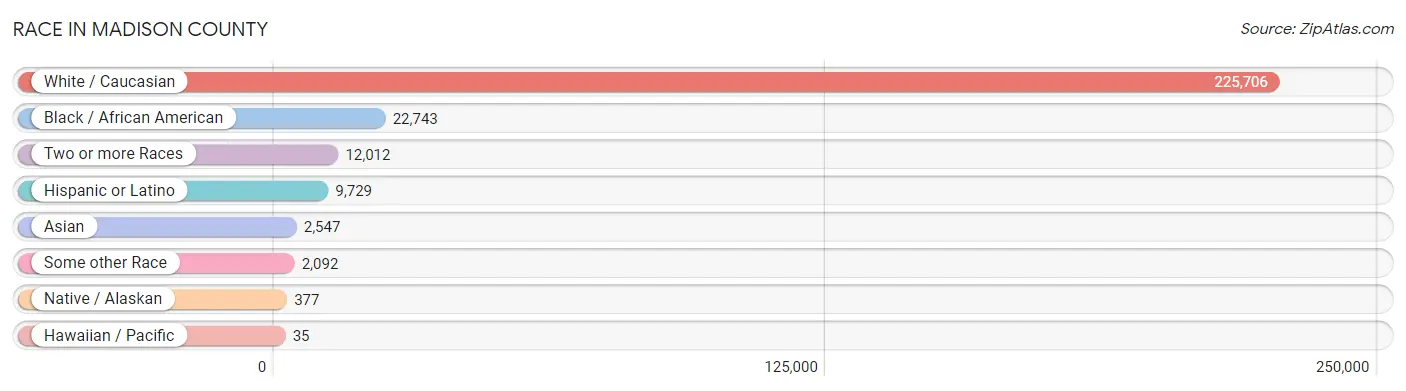
Race in Madison County
The most populous races in Madison County are White / Caucasian (225,706 | 85.0%), Black / African American (22,743 | 8.6%), and Two or more Races (12,012 | 4.5%).
| Race | # Population | % Population |
| Asian | 2,547 | 1.0% |
| Black / African American | 22,743 | 8.6% |
| Hawaiian / Pacific | 35 | 0.0% |
| Hispanic or Latino | 9,729 | 3.7% |
| Native / Alaskan | 377 | 0.1% |
| White / Caucasian | 225,706 | 85.0% |
| Two or more Races | 12,012 | 4.5% |
| Some other Race | 2,092 | 0.8% |
| Total | 265,512 | 100.0% |
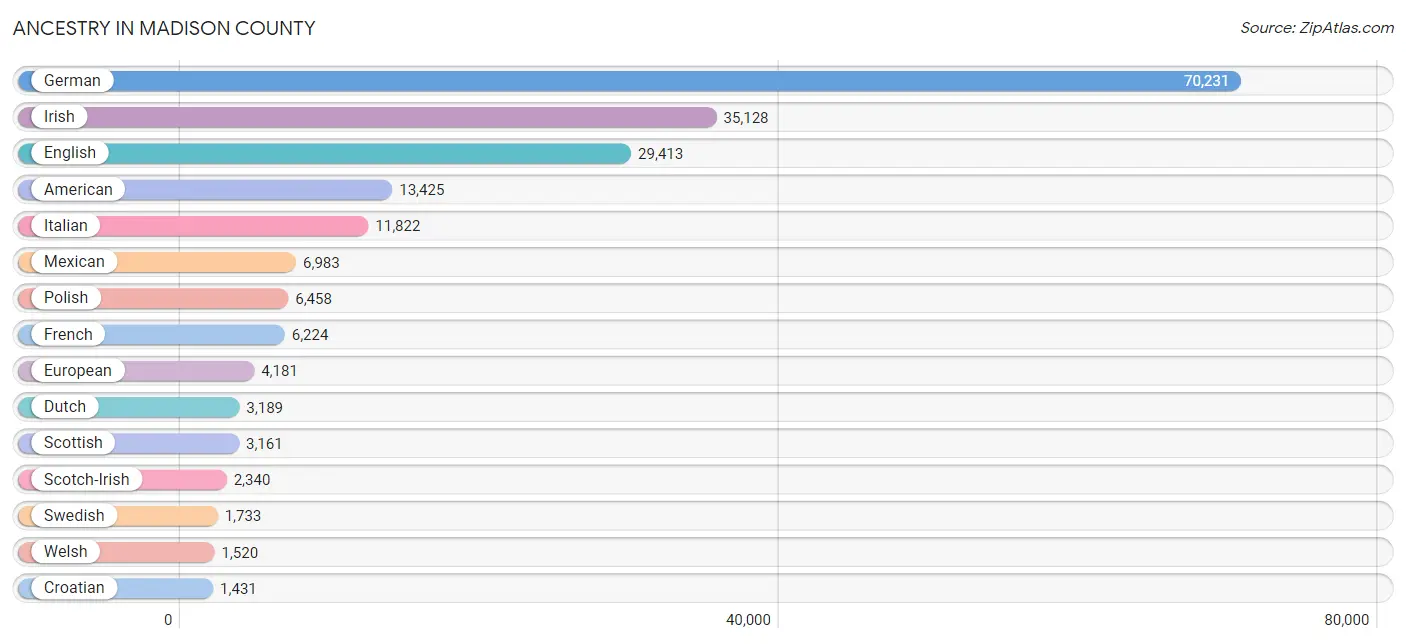
Ancestry in Madison County
The most populous ancestries reported in Madison County are German (70,231 | 26.5%), Irish (35,128 | 13.2%), English (29,413 | 11.1%), American (13,425 | 5.1%), and Italian (11,822 | 4.4%), together accounting for 60.3% of all Madison County residents.
| Ancestry | # Population | % Population |
| African | 751 | 0.3% |
| Albanian | 155 | 0.1% |
| American | 13,425 | 5.1% |
| Apache | 21 | 0.0% |
| Arab | 197 | 0.1% |
| Argentinean | 88 | 0.0% |
| Armenian | 206 | 0.1% |
| Assyrian / Chaldean / Syriac | 20 | 0.0% |
| Australian | 56 | 0.0% |
| Austrian | 411 | 0.2% |
| Bahamian | 23 | 0.0% |
| Barbadian | 6 | 0.0% |
| Belgian | 240 | 0.1% |
| Belizean | 7 | 0.0% |
| Bermudan | 5 | 0.0% |
| Bhutanese | 401 | 0.2% |
| Blackfeet | 47 | 0.0% |
| Bolivian | 7 | 0.0% |
| British | 926 | 0.4% |
| Bulgarian | 242 | 0.1% |
| Burmese | 488 | 0.2% |
| Canadian | 140 | 0.1% |
| Cape Verdean | 8 | 0.0% |
| Celtic | 9 | 0.0% |
| Central American | 617 | 0.2% |
| Central American Indian | 34 | 0.0% |
| Cherokee | 516 | 0.2% |
| Chickasaw | 10 | 0.0% |
| Chilean | 42 | 0.0% |
| Chinese | 28 | 0.0% |
| Chippewa | 16 | 0.0% |
| Choctaw | 24 | 0.0% |
| Colombian | 154 | 0.1% |
| Comanche | 8 | 0.0% |
| Creek | 16 | 0.0% |
| Croatian | 1,431 | 0.5% |
| Crow | 1 | 0.0% |
| Cuban | 268 | 0.1% |
| Czech | 1,286 | 0.5% |
| Czechoslovakian | 514 | 0.2% |
| Danish | 328 | 0.1% |
| Dominican | 16 | 0.0% |
| Dutch | 3,189 | 1.2% |
| Dutch West Indian | 74 | 0.0% |
| Eastern European | 657 | 0.3% |
| Ecuadorian | 128 | 0.1% |
| Egyptian | 48 | 0.0% |
| English | 29,413 | 11.1% |
| Ethiopian | 37 | 0.0% |
| European | 4,181 | 1.6% |
| Finnish | 70 | 0.0% |
| French | 6,224 | 2.3% |
| French American Indian | 17 | 0.0% |
| French Canadian | 737 | 0.3% |
| German | 70,231 | 26.5% |
| German Russian | 15 | 0.0% |
| Ghanaian | 325 | 0.1% |
| Greek | 554 | 0.2% |
| Guamanian / Chamorro | 4 | 0.0% |
| Guatemalan | 487 | 0.2% |
| Honduran | 19 | 0.0% |
| Hungarian | 888 | 0.3% |
| Indian (Asian) | 1,023 | 0.4% |
| Indonesian | 18 | 0.0% |
| Iranian | 98 | 0.0% |
| Irish | 35,128 | 13.2% |
| Iroquois | 1 | 0.0% |
| Israeli | 90 | 0.0% |
| Italian | 11,822 | 4.4% |
| Jamaican | 107 | 0.0% |
| Jordanian | 46 | 0.0% |
| Kenyan | 28 | 0.0% |
| Kiowa | 6 | 0.0% |
| Korean | 939 | 0.4% |
| Laotian | 102 | 0.0% |
| Latvian | 37 | 0.0% |
| Lebanese | 29 | 0.0% |
| Lithuanian | 798 | 0.3% |
| Lumbee | 10 | 0.0% |
| Macedonian | 259 | 0.1% |
| Malaysian | 74 | 0.0% |
| Maltese | 6 | 0.0% |
| Menominee | 1 | 0.0% |
| Mexican | 6,983 | 2.6% |
| Mexican American Indian | 257 | 0.1% |
| Native Hawaiian | 80 | 0.0% |
| Navajo | 105 | 0.0% |
| New Zealander | 13 | 0.0% |
| Nicaraguan | 44 | 0.0% |
| Nigerian | 57 | 0.0% |
| Northern European | 743 | 0.3% |
| Norwegian | 1,171 | 0.4% |
| Pakistani | 117 | 0.0% |
| Palestinian | 10 | 0.0% |
| Panamanian | 55 | 0.0% |
| Pennsylvania German | 78 | 0.0% |
| Peruvian | 116 | 0.0% |
| Polish | 6,458 | 2.4% |
| Portuguese | 293 | 0.1% |
| Potawatomi | 11 | 0.0% |
| Pueblo | 2 | 0.0% |
| Puerto Rican | 509 | 0.2% |
| Romanian | 212 | 0.1% |
| Russian | 685 | 0.3% |
| Salvadoran | 12 | 0.0% |
| Samoan | 35 | 0.0% |
| Scandinavian | 831 | 0.3% |
| Scotch-Irish | 2,340 | 0.9% |
| Scottish | 3,161 | 1.2% |
| Serbian | 129 | 0.1% |
| Sioux | 26 | 0.0% |
| Slavic | 181 | 0.1% |
| Slovak | 842 | 0.3% |
| Slovene | 38 | 0.0% |
| South African | 33 | 0.0% |
| South American | 560 | 0.2% |
| South American Indian | 87 | 0.0% |
| Spaniard | 195 | 0.1% |
| Spanish | 248 | 0.1% |
| Sri Lankan | 626 | 0.2% |
| Subsaharan African | 1,373 | 0.5% |
| Swedish | 1,733 | 0.6% |
| Swiss | 1,425 | 0.5% |
| Syrian | 35 | 0.0% |
| Thai | 546 | 0.2% |
| Turkish | 54 | 0.0% |
| Ukrainian | 260 | 0.1% |
| Welsh | 1,520 | 0.6% |
| West Indian | 20 | 0.0% |
| Yaqui | 4 | 0.0% |
| Yugoslavian | 374 | 0.1% |
| Yup'ik | 3 | 0.0% | View All 132 Rows |
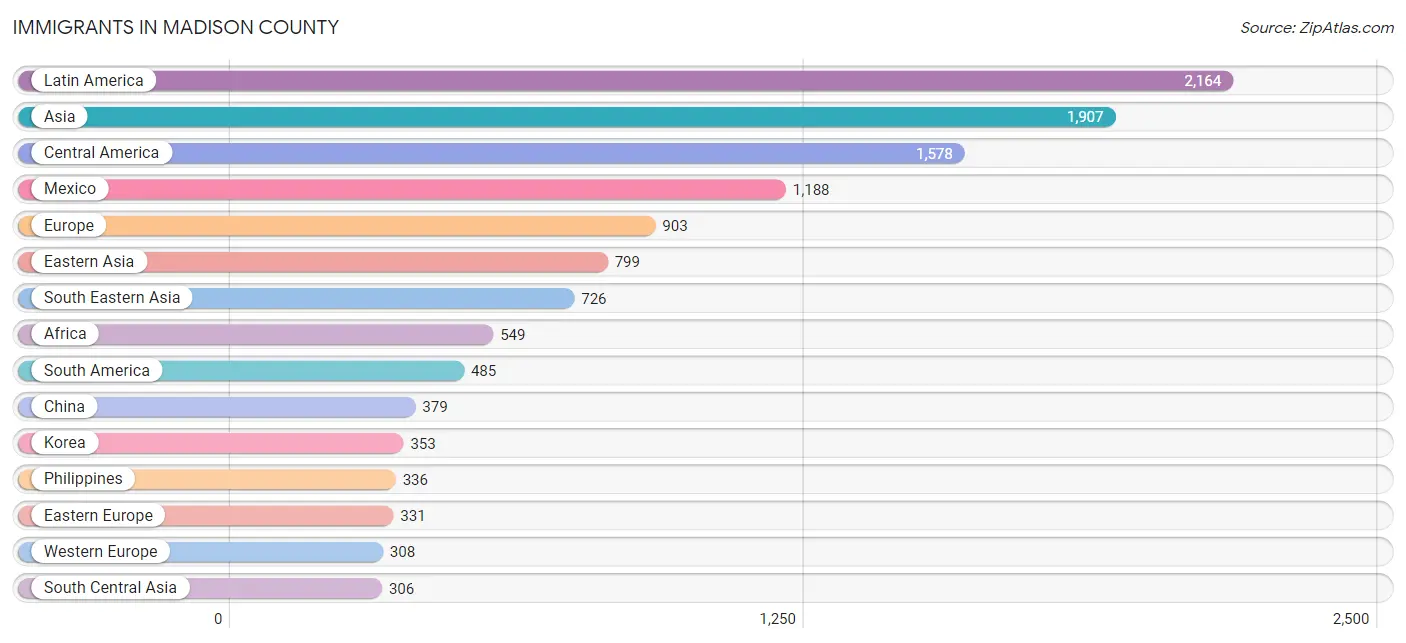
Immigrants in Madison County
The most numerous immigrant groups reported in Madison County came from Latin America (2,164 | 0.8%), Asia (1,907 | 0.7%), Central America (1,578 | 0.6%), Mexico (1,188 | 0.4%), and Europe (903 | 0.3%), together accounting for 2.9% of all Madison County residents.
| Immigration Origin | # Population | % Population |
| Africa | 549 | 0.2% |
| Argentina | 100 | 0.0% |
| Asia | 1,907 | 0.7% |
| Australia | 8 | 0.0% |
| Austria | 17 | 0.0% |
| Azores | 13 | 0.0% |
| Bahamas | 13 | 0.0% |
| Barbados | 6 | 0.0% |
| Bolivia | 7 | 0.0% |
| Bosnia and Herzegovina | 18 | 0.0% |
| Brazil | 17 | 0.0% |
| Bulgaria | 33 | 0.0% |
| Cambodia | 4 | 0.0% |
| Canada | 201 | 0.1% |
| Caribbean | 101 | 0.0% |
| Central America | 1,578 | 0.6% |
| Chile | 13 | 0.0% |
| China | 379 | 0.1% |
| Colombia | 53 | 0.0% |
| Croatia | 1 | 0.0% |
| Cuba | 28 | 0.0% |
| Dominican Republic | 16 | 0.0% |
| Eastern Africa | 227 | 0.1% |
| Eastern Asia | 799 | 0.3% |
| Eastern Europe | 331 | 0.1% |
| Ecuador | 84 | 0.0% |
| Egypt | 40 | 0.0% |
| El Salvador | 12 | 0.0% |
| England | 114 | 0.0% |
| Ethiopia | 80 | 0.0% |
| Europe | 903 | 0.3% |
| France | 50 | 0.0% |
| Germany | 218 | 0.1% |
| Ghana | 228 | 0.1% |
| Guatemala | 289 | 0.1% |
| Honduras | 19 | 0.0% |
| India | 280 | 0.1% |
| Iran | 11 | 0.0% |
| Ireland | 45 | 0.0% |
| Jamaica | 38 | 0.0% |
| Japan | 67 | 0.0% |
| Kazakhstan | 8 | 0.0% |
| Kenya | 50 | 0.0% |
| Korea | 353 | 0.1% |
| Laos | 41 | 0.0% |
| Latin America | 2,164 | 0.8% |
| Latvia | 13 | 0.0% |
| Lebanon | 19 | 0.0% |
| Mexico | 1,188 | 0.4% |
| Netherlands | 23 | 0.0% |
| Nigeria | 54 | 0.0% |
| North Macedonia | 34 | 0.0% |
| Northern Africa | 40 | 0.0% |
| Northern Europe | 213 | 0.1% |
| Oceania | 17 | 0.0% |
| Pakistan | 7 | 0.0% |
| Panama | 70 | 0.0% |
| Peru | 186 | 0.1% |
| Philippines | 336 | 0.1% |
| Poland | 57 | 0.0% |
| Portugal | 43 | 0.0% |
| Romania | 96 | 0.0% |
| Russia | 50 | 0.0% |
| South America | 485 | 0.2% |
| South Central Asia | 306 | 0.1% |
| South Eastern Asia | 726 | 0.3% |
| Southern Europe | 49 | 0.0% |
| Taiwan | 35 | 0.0% |
| Thailand | 45 | 0.0% |
| Turkey | 47 | 0.0% |
| Uganda | 5 | 0.0% |
| Ukraine | 26 | 0.0% |
| Vietnam | 282 | 0.1% |
| Western Africa | 282 | 0.1% |
| Western Asia | 76 | 0.0% |
| Western Europe | 308 | 0.1% |
| Zimbabwe | 24 | 0.0% | View All 77 Rows |
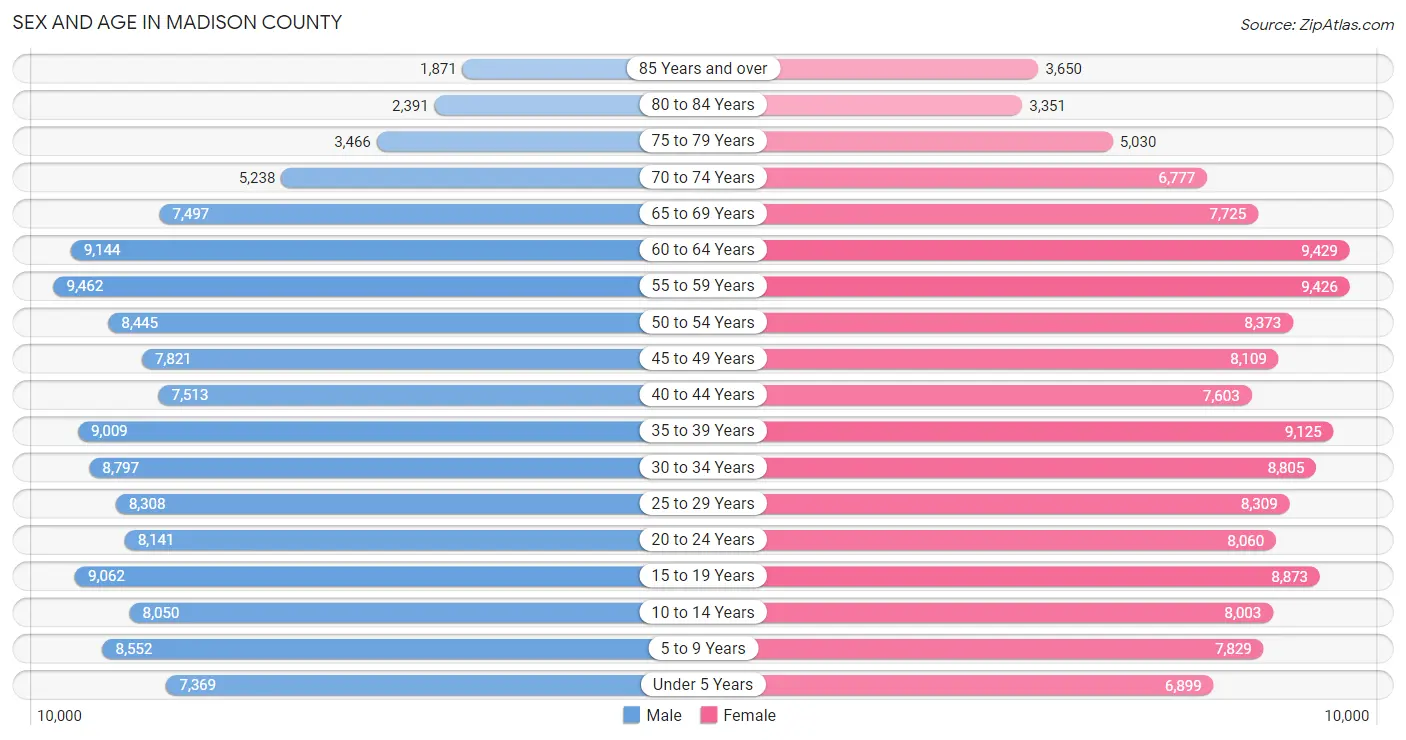
Sex and Age in Madison County
Sex and Age in Madison County
The most populous age groups in Madison County are 55 to 59 Years (9,462 | 7.3%) for men and 60 to 64 Years (9,429 | 7.0%) for women.
| Age Bracket | Male | Female |
| Under 5 Years | 7,369 (5.7%) | 6,899 (5.1%) |
| 5 to 9 Years | 8,552 (6.6%) | 7,829 (5.8%) |
| 10 to 14 Years | 8,050 (6.2%) | 8,003 (5.9%) |
| 15 to 19 Years | 9,062 (7.0%) | 8,873 (6.6%) |
| 20 to 24 Years | 8,141 (6.3%) | 8,060 (5.9%) |
| 25 to 29 Years | 8,308 (6.4%) | 8,309 (6.1%) |
| 30 to 34 Years | 8,797 (6.8%) | 8,805 (6.5%) |
| 35 to 39 Years | 9,009 (6.9%) | 9,125 (6.7%) |
| 40 to 44 Years | 7,513 (5.8%) | 7,603 (5.6%) |
| 45 to 49 Years | 7,821 (6.0%) | 8,109 (6.0%) |
| 50 to 54 Years | 8,445 (6.5%) | 8,373 (6.2%) |
| 55 to 59 Years | 9,462 (7.3%) | 9,426 (7.0%) |
| 60 to 64 Years | 9,144 (7.0%) | 9,429 (7.0%) |
| 65 to 69 Years | 7,497 (5.8%) | 7,725 (5.7%) |
| 70 to 74 Years | 5,238 (4.0%) | 6,777 (5.0%) |
| 75 to 79 Years | 3,466 (2.7%) | 5,030 (3.7%) |
| 80 to 84 Years | 2,391 (1.8%) | 3,351 (2.5%) |
| 85 Years and over | 1,871 (1.4%) | 3,650 (2.7%) |
| Total | 130,136 (100.0%) | 135,376 (100.0%) |
Families and Households in Madison County
Median Family Size in Madison County
The median family size in Madison County is 2.96 persons per family, with married-couple families (51,678 | 73.8%) accounting for the largest median family size of 3.03 persons per family. On the other hand, single male/father families (5,095 | 7.3%) represent the smallest median family size with 2.53 persons per family.
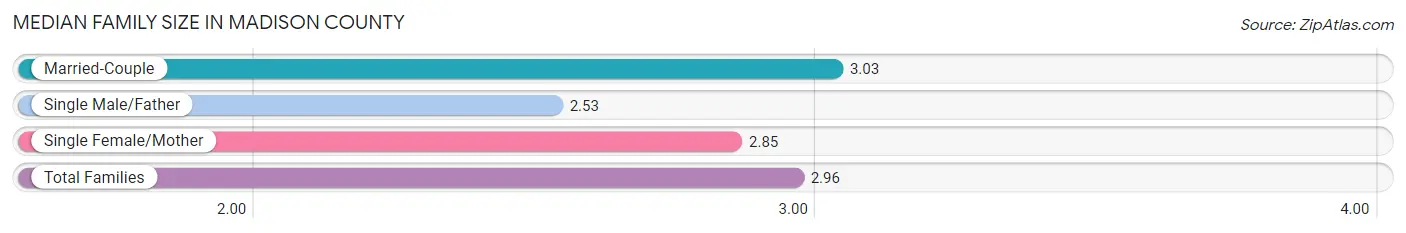
| Family Type | # Families | Family Size |
| Married-Couple | 51,678 (73.8%) | 3.03 |
| Single Male/Father | 5,095 (7.3%) | 2.53 |
| Single Female/Mother | 13,277 (19.0%) | 2.85 |
| Total Families | 70,050 (100.0%) | 2.96 |
Median Household Size in Madison County
The median household size in Madison County is 2.39 persons per household, with single female/mother households (13,277 | 12.2%) accounting for the largest median household size of 3.08 persons per household. non-family households (38,864 | 35.7%) represent the smallest median household size with 1.24 persons per household.
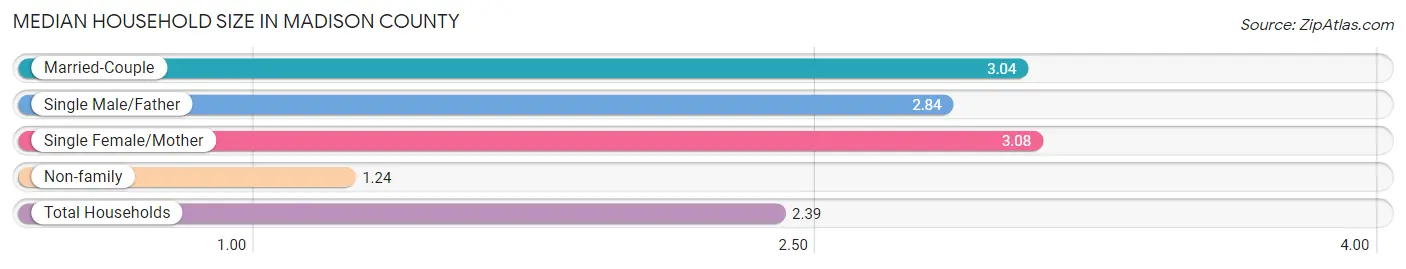
| Household Type | # Households | Household Size |
| Married-Couple | 51,678 (47.4%) | 3.04 |
| Single Male/Father | 5,095 (4.7%) | 2.84 |
| Single Female/Mother | 13,277 (12.2%) | 3.08 |
| Non-family | 38,864 (35.7%) | 1.24 |
| Total Households | 108,914 (100.0%) | 2.39 |
Household Size by Marriage Status in Madison County
Out of a total of 108,914 households in Madison County, 70,050 (64.3%) are family households, while 38,864 (35.7%) are nonfamily households. The most numerous type of family households are 2-person households, comprising 31,853, and the most common type of nonfamily households are 1-person households, comprising 31,829.
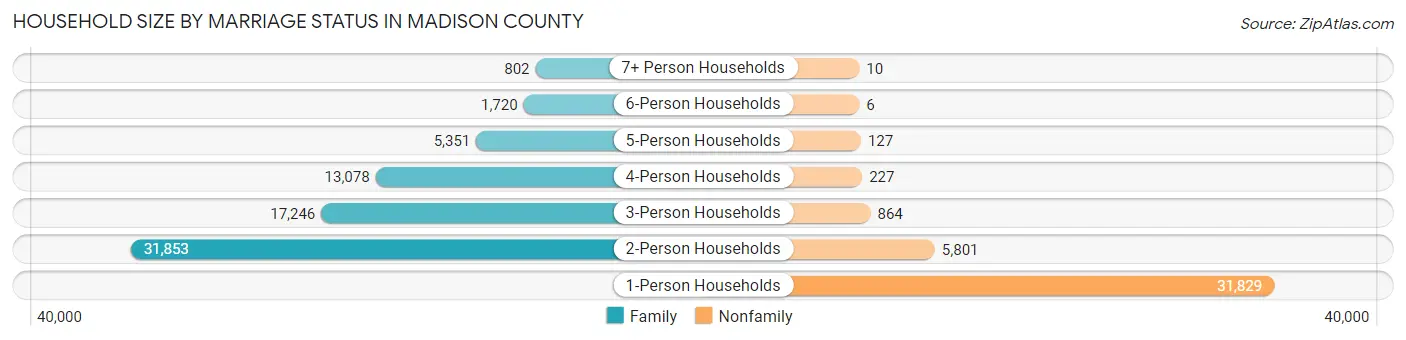
| Household Size | Family Households | Nonfamily Households |
| 1-Person Households | - | 31,829 (29.2%) |
| 2-Person Households | 31,853 (29.2%) | 5,801 (5.3%) |
| 3-Person Households | 17,246 (15.8%) | 864 (0.8%) |
| 4-Person Households | 13,078 (12.0%) | 227 (0.2%) |
| 5-Person Households | 5,351 (4.9%) | 127 (0.1%) |
| 6-Person Households | 1,720 (1.6%) | 6 (0.0%) |
| 7+ Person Households | 802 (0.7%) | 10 (0.0%) |
| Total | 70,050 (64.3%) | 38,864 (35.7%) |
Female Fertility in Madison County
Fertility by Age in Madison County
Average fertility rate in Madison County is 50.0 births per 1,000 women. Women in the age bracket of 20 to 34 years have the highest fertility rate with 84.0 births per 1,000 women. Women in the age bracket of 20 to 34 years acount for 70.6% of all women with births.
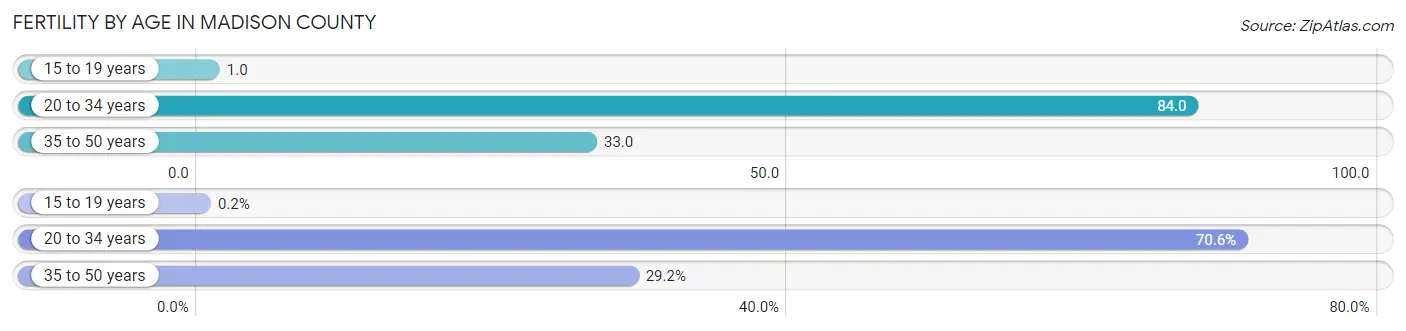
| Age Bracket | Women with Births | Births / 1,000 Women |
| 15 to 19 years | 6 (0.2%) | 1.0 |
| 20 to 34 years | 2,117 (70.6%) | 84.0 |
| 35 to 50 years | 877 (29.2%) | 33.0 |
| Total | 3,000 (100.0%) | 50.0 |
Fertility by Age by Marriage Status in Madison County
71.3% of women with births (3,000) in Madison County are married. The highest percentage of unmarried women with births falls into 15 to 19 years age bracket with 100.0% of them unmarried at the time of birth, while the lowest percentage of unmarried women with births belong to 20 to 34 years age bracket with 28.2% of them unmarried.
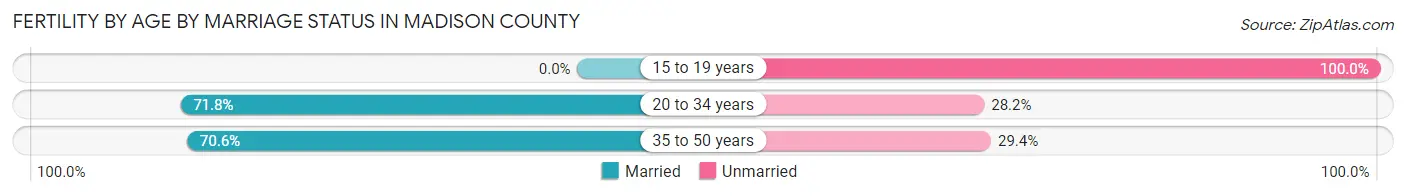
| Age Bracket | Married | Unmarried |
| 15 to 19 years | 0 (0.0%) | 6 (100.0%) |
| 20 to 34 years | 1,520 (71.8%) | 597 (28.2%) |
| 35 to 50 years | 619 (70.6%) | 258 (29.4%) |
| Total | 2,139 (71.3%) | 861 (28.7%) |
Fertility by Education in Madison County
Average fertility rate in Madison County is 50.0 births per 1,000 women. Women with the education attainment of graduate degree have the highest fertility rate of 94.0 births per 1,000 women, while women with the education attainment of less than high school have the lowest fertility at 13.0 births per 1,000 women. Women with the education attainment of bachelor's degree represent 28.9% of all women with births.
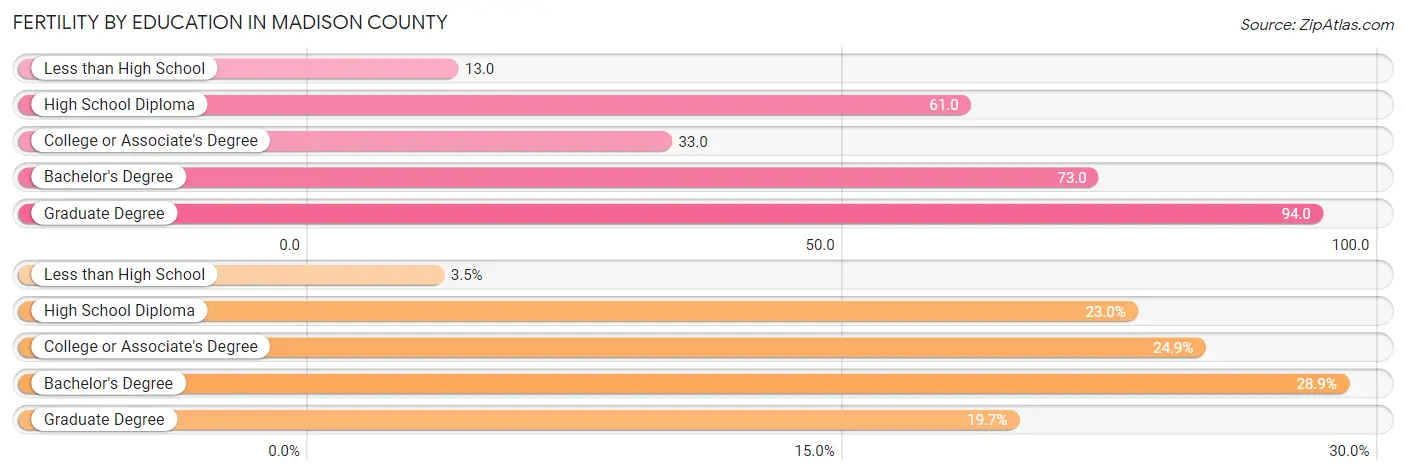
| Educational Attainment | Women with Births | Births / 1,000 Women |
| Less than High School | 105 (3.5%) | 13.0 |
| High School Diploma | 690 (23.0%) | 61.0 |
| College or Associate's Degree | 747 (24.9%) | 33.0 |
| Bachelor's Degree | 868 (28.9%) | 73.0 |
| Graduate Degree | 590 (19.7%) | 94.0 |
| Total | 3,000 (100.0%) | 50.0 |
Fertility by Education by Marriage Status in Madison County
28.7% of women with births in Madison County are unmarried. Women with the educational attainment of graduate degree are most likely to be married with 97.3% of them married at childbirth, while women with the educational attainment of less than high school are least likely to be married with 99.1% of them unmarried at childbirth.
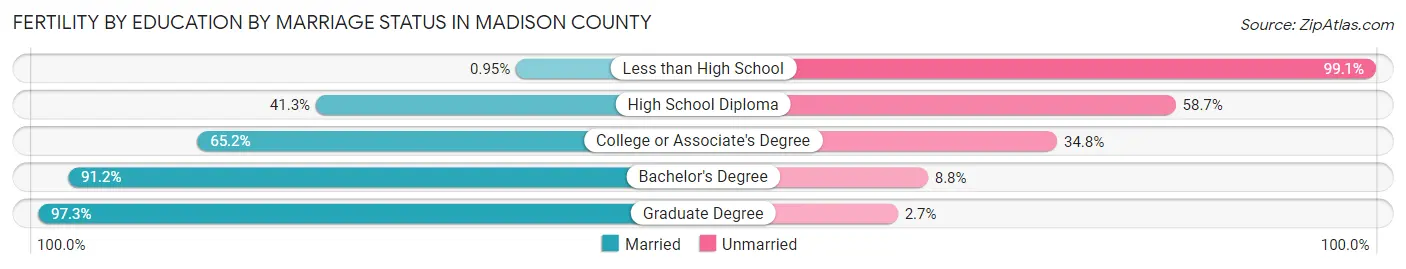
| Educational Attainment | Married | Unmarried |
| Less than High School | 1 (0.9%) | 104 (99.1%) |
| High School Diploma | 285 (41.3%) | 405 (58.7%) |
| College or Associate's Degree | 487 (65.2%) | 260 (34.8%) |
| Bachelor's Degree | 792 (91.2%) | 76 (8.8%) |
| Graduate Degree | 574 (97.3%) | 16 (2.7%) |
| Total | 2,139 (71.3%) | 861 (28.7%) |
Income in Madison County
Income Overview in Madison County
Per Capita Income in Madison County is $38,828, while median incomes of families and households are $91,366 and $71,759 respectively.
| Characteristic | Number | Measure |
| Per Capita Income | 265,512 | $38,828 |
| Median Family Income | 70,050 | $91,366 |
| Mean Family Income | 70,050 | $112,388 |
| Median Household Income | 108,914 | $71,759 |
| Mean Household Income | 108,914 | $93,528 |
| Income Deficit | 70,050 | $10,864 |
| Wage / Income Gap (%) | 265,512 | 32.65% |
| Wage / Income Gap ($) | 265,512 | 67.35¢ per $1 |
| Gini / Inequality Index | 265,512 | 0.44 |
Earnings by Sex in Madison County
Average Earnings in Madison County are $42,333, $51,632 for men and $34,776 for women, a difference of 32.7%.
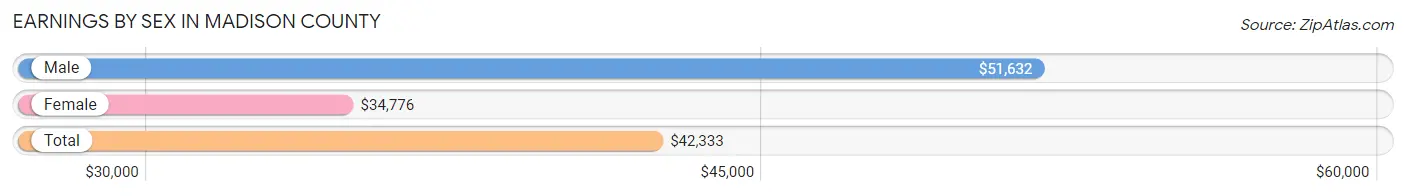
| Sex | Number | Average Earnings |
| Male | 73,769 (51.9%) | $51,632 |
| Female | 68,297 (48.1%) | $34,776 |
| Total | 142,066 (100.0%) | $42,333 |
Earnings by Sex by Income Bracket in Madison County
The most common earnings brackets in Madison County are $100,000+ for men (12,485 | 16.9%) and $75,000 to $99,999 for women (5,840 | 8.6%).
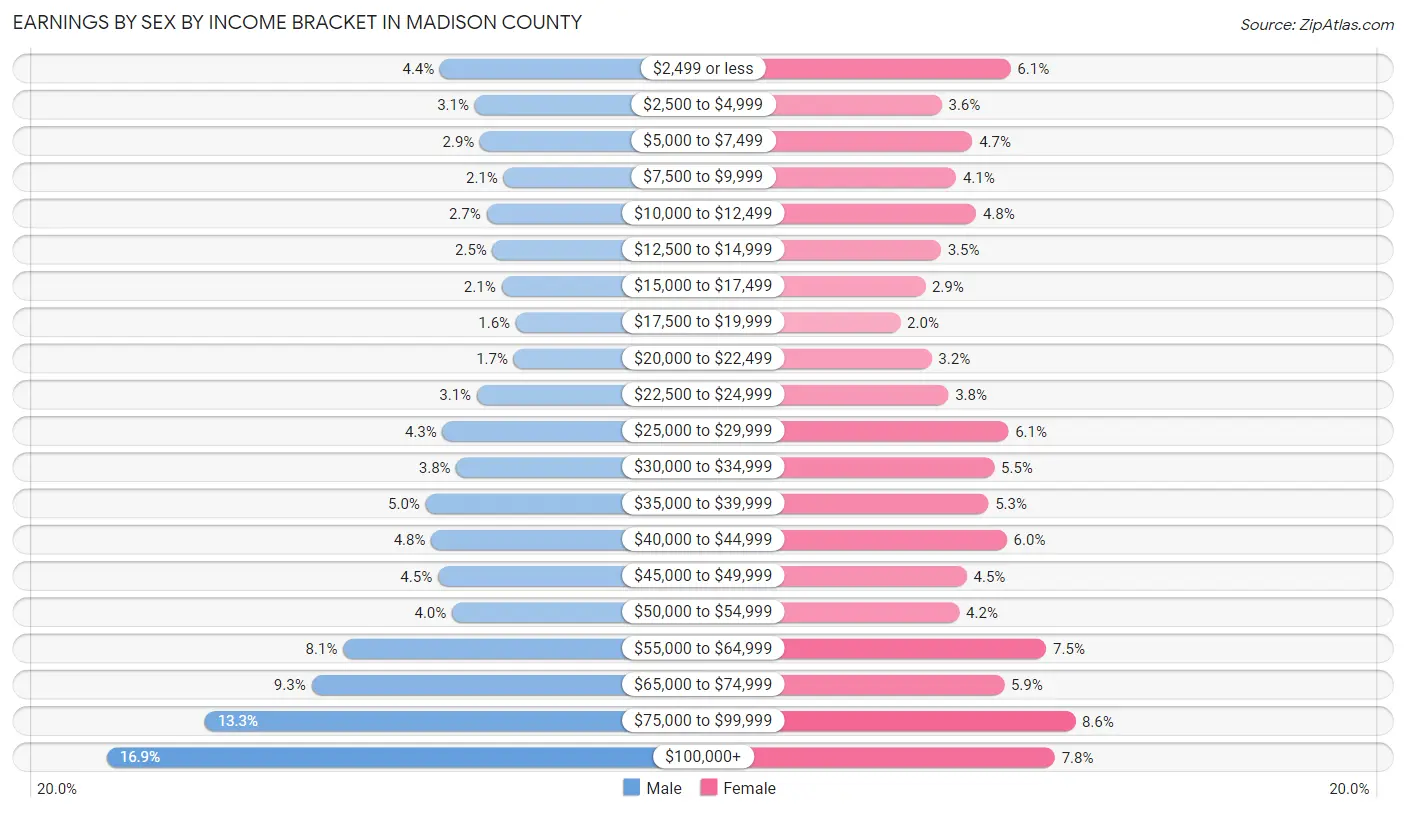
| Income | Male | Female |
| $2,499 or less | 3,271 (4.4%) | 4,189 (6.1%) |
| $2,500 to $4,999 | 2,308 (3.1%) | 2,427 (3.5%) |
| $5,000 to $7,499 | 2,158 (2.9%) | 3,209 (4.7%) |
| $7,500 to $9,999 | 1,513 (2.1%) | 2,795 (4.1%) |
| $10,000 to $12,499 | 1,982 (2.7%) | 3,305 (4.8%) |
| $12,500 to $14,999 | 1,813 (2.5%) | 2,407 (3.5%) |
| $15,000 to $17,499 | 1,574 (2.1%) | 1,998 (2.9%) |
| $17,500 to $19,999 | 1,170 (1.6%) | 1,365 (2.0%) |
| $20,000 to $22,499 | 1,230 (1.7%) | 2,168 (3.2%) |
| $22,500 to $24,999 | 2,250 (3.0%) | 2,592 (3.8%) |
| $25,000 to $29,999 | 3,203 (4.3%) | 4,131 (6.0%) |
| $30,000 to $34,999 | 2,820 (3.8%) | 3,771 (5.5%) |
| $35,000 to $39,999 | 3,670 (5.0%) | 3,620 (5.3%) |
| $40,000 to $44,999 | 3,514 (4.8%) | 4,093 (6.0%) |
| $45,000 to $49,999 | 3,326 (4.5%) | 3,066 (4.5%) |
| $50,000 to $54,999 | 2,939 (4.0%) | 2,875 (4.2%) |
| $55,000 to $64,999 | 5,949 (8.1%) | 5,100 (7.5%) |
| $65,000 to $74,999 | 6,823 (9.2%) | 4,025 (5.9%) |
| $75,000 to $99,999 | 9,771 (13.3%) | 5,840 (8.6%) |
| $100,000+ | 12,485 (16.9%) | 5,321 (7.8%) |
| Total | 73,769 (100.0%) | 68,297 (100.0%) |
Earnings by Sex by Educational Attainment in Madison County
Average earnings in Madison County are $59,856 for men and $41,179 for women, a difference of 31.2%. Men with an educational attainment of graduate degree enjoy the highest average annual earnings of $98,032, while those with less than high school education earn the least with $32,557. Women with an educational attainment of graduate degree earn the most with the average annual earnings of $76,015, while those with less than high school education have the smallest earnings of $15,529.

| Educational Attainment | Male Income | Female Income |
| Less than High School | $32,557 | $15,529 |
| High School Diploma | $45,718 | $28,994 |
| College or Associate's Degree | $60,306 | $37,161 |
| Bachelor's Degree | $76,490 | $52,238 |
| Graduate Degree | $98,032 | $76,015 |
| Total | $59,856 | $41,179 |
Family Income in Madison County
Family Income Brackets in Madison County
According to the Madison County family income data, there are 15,201 families falling into the $100,000 to $149,999 income range, which is the most common income bracket and makes up 21.7% of all families. Conversely, the $10,000 to $14,999 income bracket is the least frequent group with only 1,331 families (1.9%) belonging to this category.
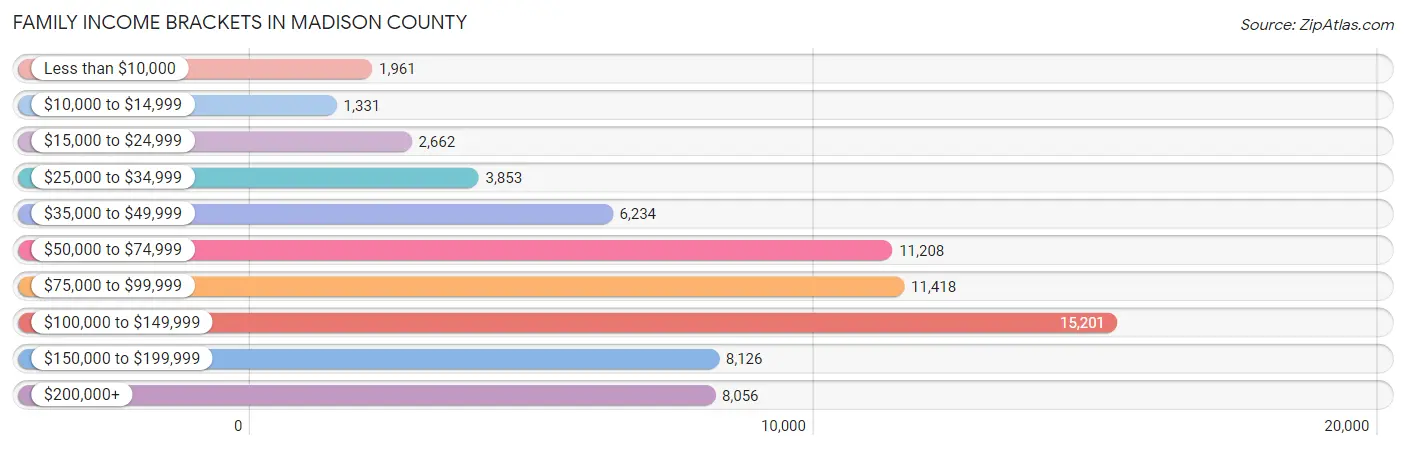
| Income Bracket | # Families | % Families |
| Less than $10,000 | 1,961 | 2.8% |
| $10,000 to $14,999 | 1,331 | 1.9% |
| $15,000 to $24,999 | 2,662 | 3.8% |
| $25,000 to $34,999 | 3,853 | 5.5% |
| $35,000 to $49,999 | 6,234 | 8.9% |
| $50,000 to $74,999 | 11,208 | 16.0% |
| $75,000 to $99,999 | 11,418 | 16.3% |
| $100,000 to $149,999 | 15,201 | 21.7% |
| $150,000 to $199,999 | 8,126 | 11.6% |
| $200,000+ | 8,056 | 11.5% |
Family Income by Famaliy Size in Madison County
6-person families (1,536 | 2.2%) account for the highest median family income in Madison County with $127,022 per family, while 2-person families (34,389 | 49.1%) have the highest median income of $39,825 per family member.
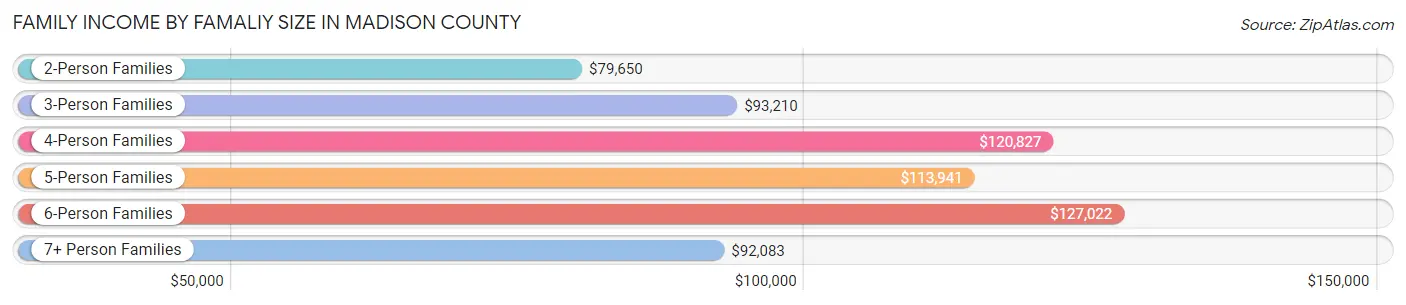
| Income Bracket | # Families | Median Income |
| 2-Person Families | 34,389 (49.1%) | $79,650 |
| 3-Person Families | 16,243 (23.2%) | $93,210 |
| 4-Person Families | 12,060 (17.2%) | $120,827 |
| 5-Person Families | 5,134 (7.3%) | $113,941 |
| 6-Person Families | 1,536 (2.2%) | $127,022 |
| 7+ Person Families | 688 (1.0%) | $92,083 |
| Total | 70,050 (100.0%) | $91,366 |
Family Income by Number of Earners in Madison County
The median family income in Madison County is $91,366, with families comprising 3+ earners (8,110) having the highest median family income of $151,693, while families with no earners (11,009) have the lowest median family income of $58,207, accounting for 11.6% and 15.7% of families, respectively.
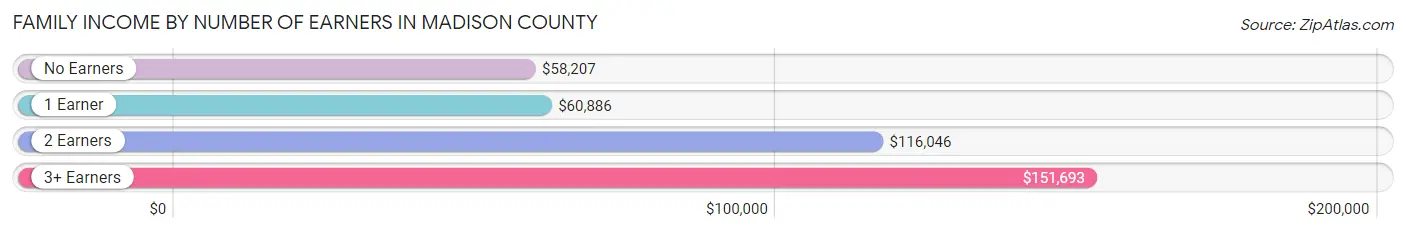
| Number of Earners | # Families | Median Income |
| No Earners | 11,009 (15.7%) | $58,207 |
| 1 Earner | 22,039 (31.5%) | $60,886 |
| 2 Earners | 28,892 (41.2%) | $116,046 |
| 3+ Earners | 8,110 (11.6%) | $151,693 |
| Total | 70,050 (100.0%) | $91,366 |
Household Income in Madison County
Household Income Brackets in Madison County
With 19,822 households falling in the category, the $50,000 to $74,999 income range is the most frequent in Madison County, accounting for 18.2% of all households. In contrast, only 3,703 households (3.4%) fall into the $10,000 to $14,999 income bracket, making it the least populous group.
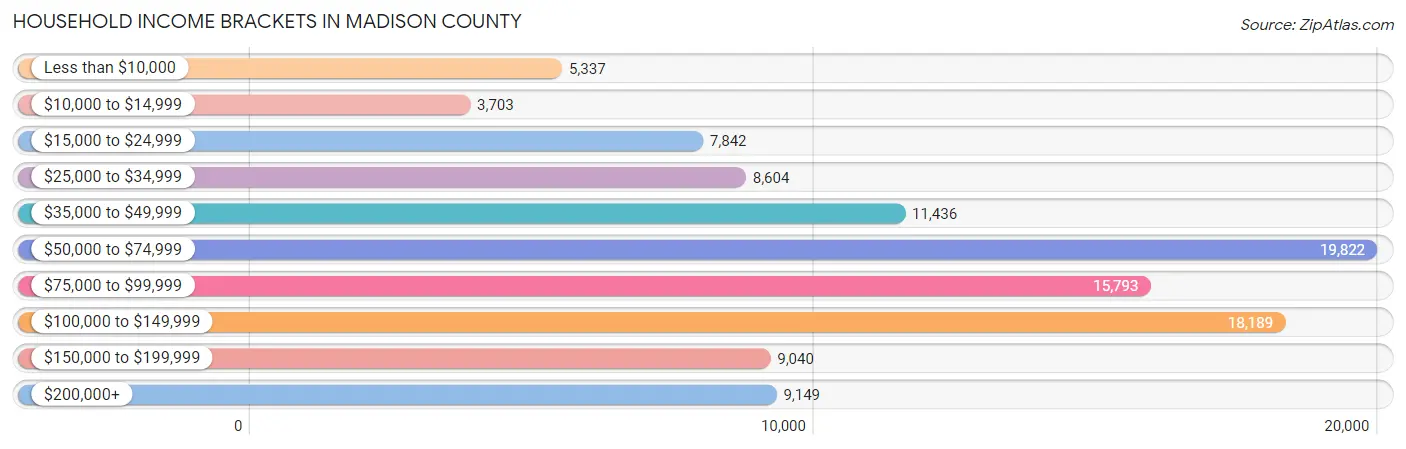
| Income Bracket | # Households | % Households |
| Less than $10,000 | 5,337 | 4.9% |
| $10,000 to $14,999 | 3,703 | 3.4% |
| $15,000 to $24,999 | 7,842 | 7.2% |
| $25,000 to $34,999 | 8,604 | 7.9% |
| $35,000 to $49,999 | 11,436 | 10.5% |
| $50,000 to $74,999 | 19,822 | 18.2% |
| $75,000 to $99,999 | 15,793 | 14.5% |
| $100,000 to $149,999 | 18,189 | 16.7% |
| $150,000 to $199,999 | 9,040 | 8.3% |
| $200,000+ | 9,149 | 8.4% |
Household Income by Householder Age in Madison County
The median household income in Madison County is $71,759, with the highest median household income of $86,301 found in the 45 to 64 years age bracket for the primary householder. A total of 39,445 households (36.2%) fall into this category. Meanwhile, the 15 to 24 years age bracket for the primary householder has the lowest median household income of $37,539, with 4,366 households (4.0%) in this group.
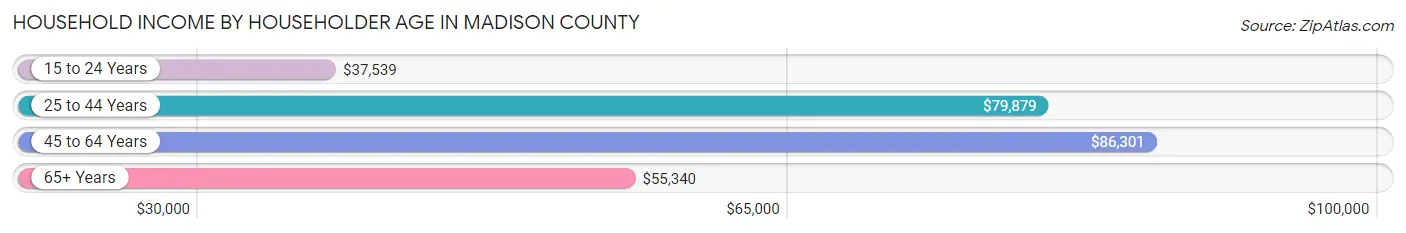
| Income Bracket | # Households | Median Income |
| 15 to 24 Years | 4,366 (4.0%) | $37,539 |
| 25 to 44 Years | 34,368 (31.6%) | $79,879 |
| 45 to 64 Years | 39,445 (36.2%) | $86,301 |
| 65+ Years | 30,735 (28.2%) | $55,340 |
| Total | 108,914 (100.0%) | $71,759 |
Poverty in Madison County
Income Below Poverty by Sex and Age in Madison County
With 10.6% poverty level for males and 13.3% for females among the residents of Madison County, 18 to 24 year old males and 18 to 24 year old females are the most vulnerable to poverty, with 2,376 males (21.8%) and 3,001 females (27.8%) in their respective age groups living below the poverty level.
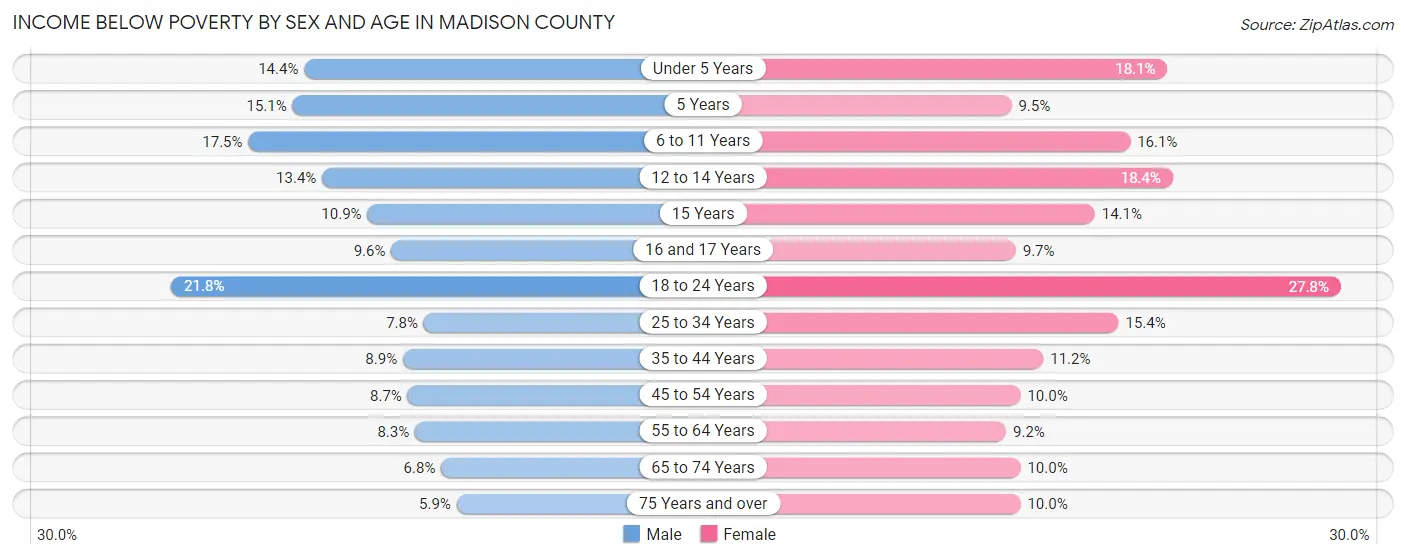
| Age Bracket | Male | Female |
| Under 5 Years | 1,056 (14.4%) | 1,234 (18.1%) |
| 5 Years | 230 (15.1%) | 144 (9.5%) |
| 6 to 11 Years | 1,722 (17.5%) | 1,484 (16.1%) |
| 12 to 14 Years | 663 (13.4%) | 847 (18.4%) |
| 15 Years | 183 (10.9%) | 220 (14.1%) |
| 16 and 17 Years | 339 (9.6%) | 324 (9.7%) |
| 18 to 24 Years | 2,376 (21.8%) | 3,001 (27.8%) |
| 25 to 34 Years | 1,319 (7.8%) | 2,636 (15.4%) |
| 35 to 44 Years | 1,469 (8.9%) | 1,869 (11.2%) |
| 45 to 54 Years | 1,405 (8.7%) | 1,633 (10.0%) |
| 55 to 64 Years | 1,530 (8.3%) | 1,717 (9.1%) |
| 65 to 74 Years | 852 (6.8%) | 1,430 (10.0%) |
| 75 Years and over | 442 (5.9%) | 1,120 (10.0%) |
| Total | 13,586 (10.6%) | 17,659 (13.3%) |
Income Above Poverty by Sex and Age in Madison County
According to the poverty statistics in Madison County, males aged 75 years and over and females aged 55 to 64 years are the age groups that are most secure financially, with 94.1% of males and 90.8% of females in these age groups living above the poverty line.
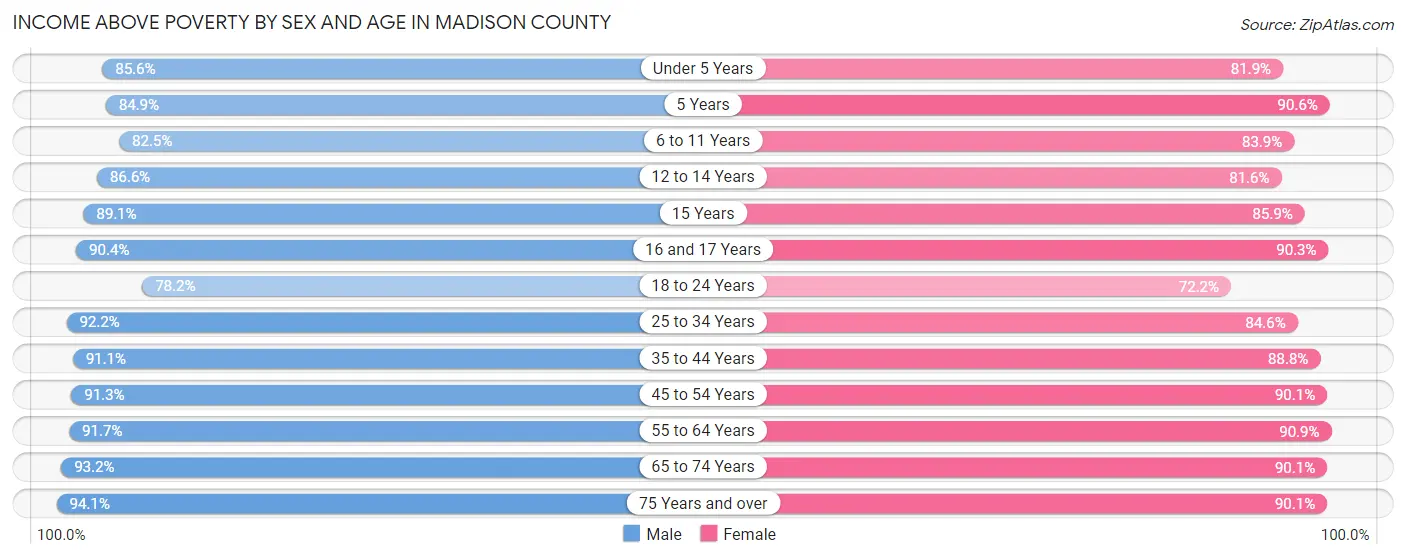
| Age Bracket | Male | Female |
| Under 5 Years | 6,262 (85.6%) | 5,573 (81.9%) |
| 5 Years | 1,295 (84.9%) | 1,380 (90.5%) |
| 6 to 11 Years | 8,094 (82.5%) | 7,756 (83.9%) |
| 12 to 14 Years | 4,272 (86.6%) | 3,748 (81.6%) |
| 15 Years | 1,494 (89.1%) | 1,341 (85.9%) |
| 16 and 17 Years | 3,198 (90.4%) | 3,019 (90.3%) |
| 18 to 24 Years | 8,504 (78.2%) | 7,799 (72.2%) |
| 25 to 34 Years | 15,654 (92.2%) | 14,465 (84.6%) |
| 35 to 44 Years | 14,976 (91.1%) | 14,794 (88.8%) |
| 45 to 54 Years | 14,791 (91.3%) | 14,773 (90.0%) |
| 55 to 64 Years | 16,995 (91.7%) | 17,047 (90.8%) |
| 65 to 74 Years | 11,675 (93.2%) | 12,940 (90.0%) |
| 75 Years and over | 7,000 (94.1%) | 10,137 (90.0%) |
| Total | 114,210 (89.4%) | 114,772 (86.7%) |
Income Below Poverty Among Married-Couple Families in Madison County
The poverty statistics for married-couple families in Madison County show that 3.0% or 1,574 of the total 51,678 families live below the poverty line. Families with 5 or more children have the highest poverty rate of 29.8%, comprising of 76 families. On the other hand, families with no children have the lowest poverty rate of 2.2%, which includes 676 families.
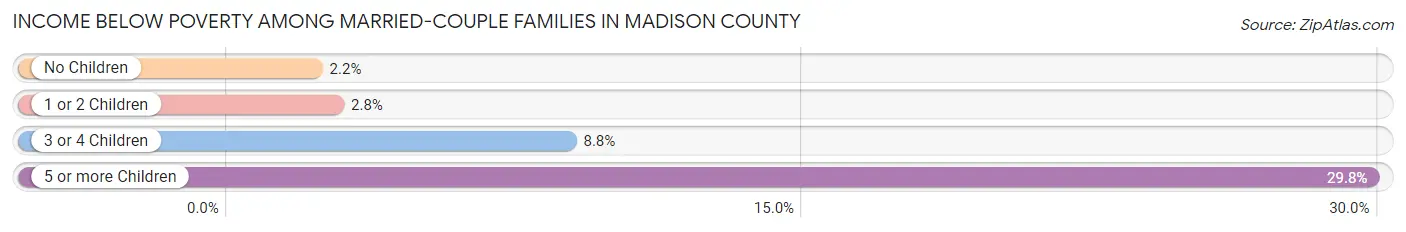
| Children | Above Poverty | Below Poverty |
| No Children | 29,944 (97.8%) | 676 (2.2%) |
| 1 or 2 Children | 16,301 (97.2%) | 465 (2.8%) |
| 3 or 4 Children | 3,680 (91.2%) | 357 (8.8%) |
| 5 or more Children | 179 (70.2%) | 76 (29.8%) |
| Total | 50,104 (97.0%) | 1,574 (3.0%) |
Income Below Poverty Among Single-Parent Households in Madison County
According to the poverty data in Madison County, 14.9% or 757 single-father households and 24.1% or 3,204 single-mother households are living below the poverty line. Among single-father households, those with 3 or 4 children have the highest poverty rate, with 105 households (41.7%) experiencing poverty. Likewise, among single-mother households, those with 5 or more children have the highest poverty rate, with 114 households (78.1%) falling below the poverty line.
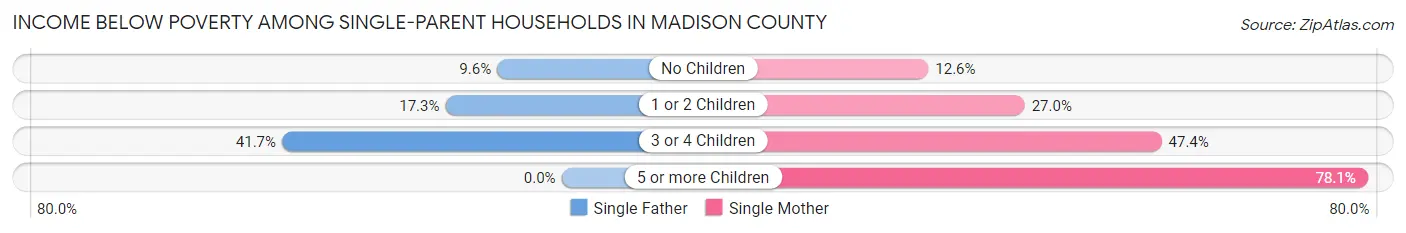
| Children | Single Father | Single Mother |
| No Children | 231 (9.6%) | 617 (12.6%) |
| 1 or 2 Children | 421 (17.3%) | 1,894 (27.0%) |
| 3 or 4 Children | 105 (41.7%) | 579 (47.4%) |
| 5 or more Children | 0 (0.0%) | 114 (78.1%) |
| Total | 757 (14.9%) | 3,204 (24.1%) |
Income Below Poverty Among Married-Couple vs Single-Parent Households in Madison County
The poverty data for Madison County shows that 1,574 of the married-couple family households (3.0%) and 3,961 of the single-parent households (21.6%) are living below the poverty level. Within the married-couple family households, those with 5 or more children have the highest poverty rate, with 76 households (29.8%) falling below the poverty line. Among the single-parent households, those with 5 or more children have the highest poverty rate, with 114 household (74.5%) living below poverty.
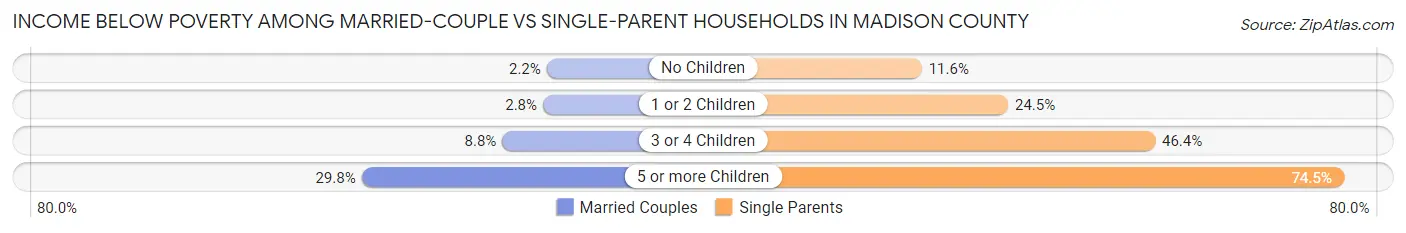
| Children | Married-Couple Families | Single-Parent Households |
| No Children | 676 (2.2%) | 848 (11.6%) |
| 1 or 2 Children | 465 (2.8%) | 2,315 (24.5%) |
| 3 or 4 Children | 357 (8.8%) | 684 (46.4%) |
| 5 or more Children | 76 (29.8%) | 114 (74.5%) |
| Total | 1,574 (3.0%) | 3,961 (21.6%) |
Employment Characteristics in Madison County
Employment by Class of Employer in Madison County
Among the 127,321 employed individuals in Madison County, private company employees (89,920 | 70.6%), not-for-profit organizations (11,821 | 9.3%), and local government employees (8,744 | 6.9%) make up the most common classes of employment.
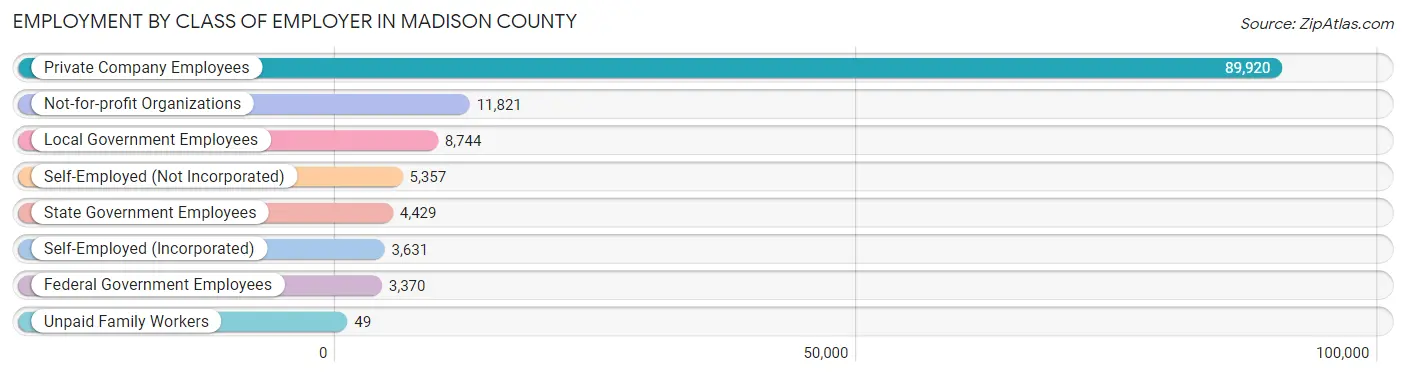
| Employer Class | # Employees | % Employees |
| Private Company Employees | 89,920 | 70.6% |
| Self-Employed (Incorporated) | 3,631 | 2.9% |
| Self-Employed (Not Incorporated) | 5,357 | 4.2% |
| Not-for-profit Organizations | 11,821 | 9.3% |
| Local Government Employees | 8,744 | 6.9% |
| State Government Employees | 4,429 | 3.5% |
| Federal Government Employees | 3,370 | 2.6% |
| Unpaid Family Workers | 49 | 0.0% |
| Total | 127,321 | 100.0% |
Employment Status by Age in Madison County
According to the labor force statistics for Madison County, out of the total population over 16 years of age (215,565), 63.4% or 136,668 individuals are in the labor force, with 5.2% or 7,107 of them unemployed. The age group with the highest labor force participation rate is 30 to 34 years, with 88.8% or 15,631 individuals in the labor force. Within the labor force, the 16 to 19 years age range has the highest percentage of unemployed individuals, with 15.8% or 1,086 of them being unemployed.

| Age Bracket | In Labor Force | Unemployed |
| 16 to 19 Years | 6,875 (46.8%) | 1,086 (15.8%) |
| 20 to 24 Years | 12,167 (75.1%) | 1,022 (8.4%) |
| 25 to 29 Years | 14,390 (86.6%) | 1,007 (7.0%) |
| 30 to 34 Years | 15,631 (88.8%) | 922 (5.9%) |
| 35 to 44 Years | 28,828 (86.7%) | 1,095 (3.8%) |
| 45 to 54 Years | 27,705 (84.6%) | 720 (2.6%) |
| 55 to 59 Years | 13,920 (73.7%) | 710 (5.1%) |
| 60 to 64 Years | 9,677 (52.1%) | 310 (3.2%) |
| 65 to 74 Years | 6,047 (22.2%) | 224 (3.7%) |
| 75 Years and over | 1,482 (7.5%) | 34 (2.3%) |
| Total | 136,668 (63.4%) | 7,107 (5.2%) |
Employment Status by Educational Attainment in Madison County
According to labor force statistics for Madison County, 80.0% of individuals (110,142) out of the total population between 25 and 64 years of age (137,678) are in the labor force, with 4.3% or 4,736 of them being unemployed. The group with the highest labor force participation rate are those with the educational attainment of bachelor's degree or higher, with 89.8% or 38,379 individuals in the labor force. Within the labor force, individuals with less than high school education have the highest percentage of unemployment, with 12.9% or 667 of them being unemployed.
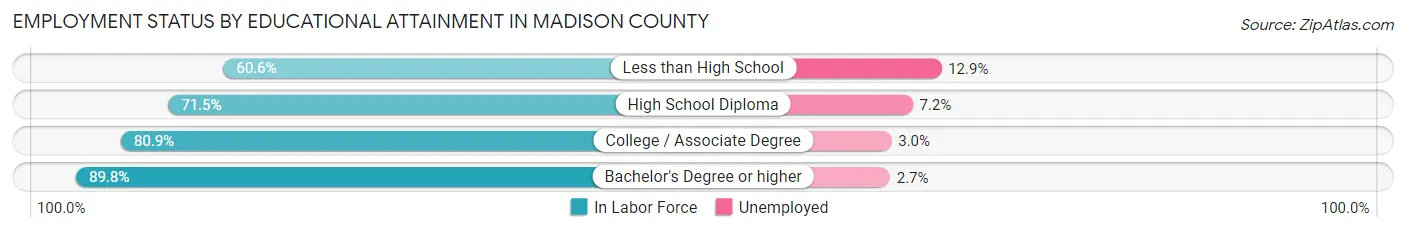
| Educational Attainment | In Labor Force | Unemployed |
| Less than High School | 5,171 (60.6%) | 1,101 (12.9%) |
| High School Diploma | 25,304 (71.5%) | 2,548 (7.2%) |
| College / Associate Degree | 41,273 (80.9%) | 1,531 (3.0%) |
| Bachelor's Degree or higher | 38,379 (89.8%) | 1,154 (2.7%) |
| Total | 110,142 (80.0%) | 5,920 (4.3%) |
Employment Occupations by Sex in Madison County
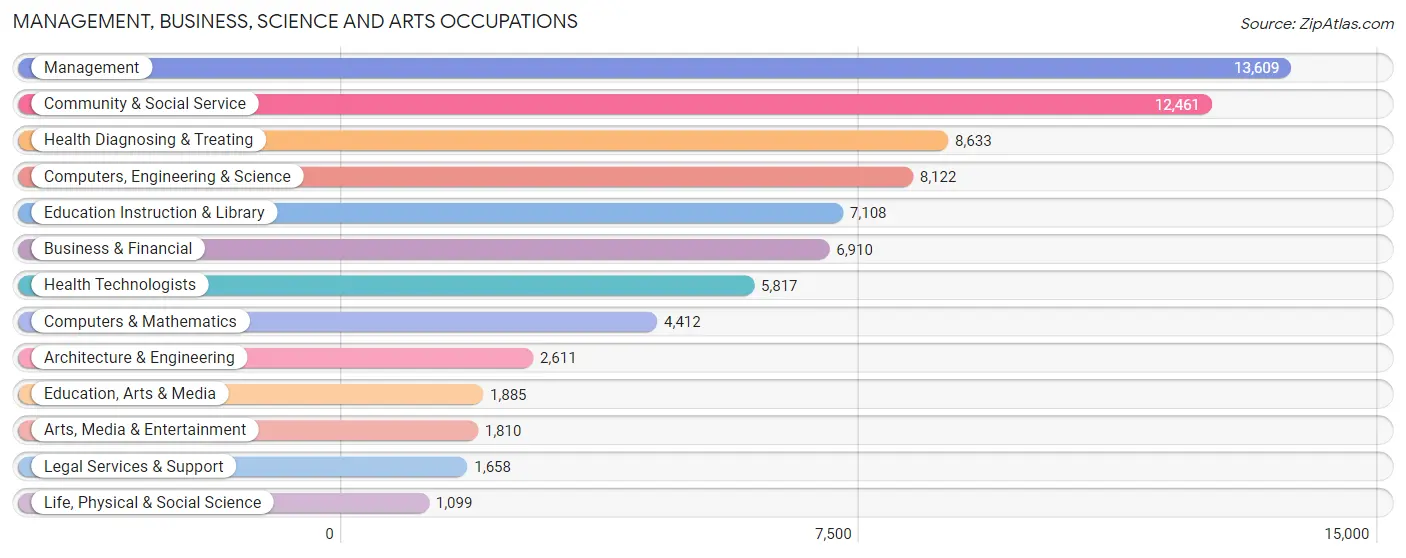
Management, Business, Science and Arts Occupations
The most common Management, Business, Science and Arts occupations in Madison County are Management (13,609 | 10.5%), Community & Social Service (12,461 | 9.6%), Health Diagnosing & Treating (8,633 | 6.7%), Computers, Engineering & Science (8,122 | 6.3%), and Education Instruction & Library (7,108 | 5.5%).
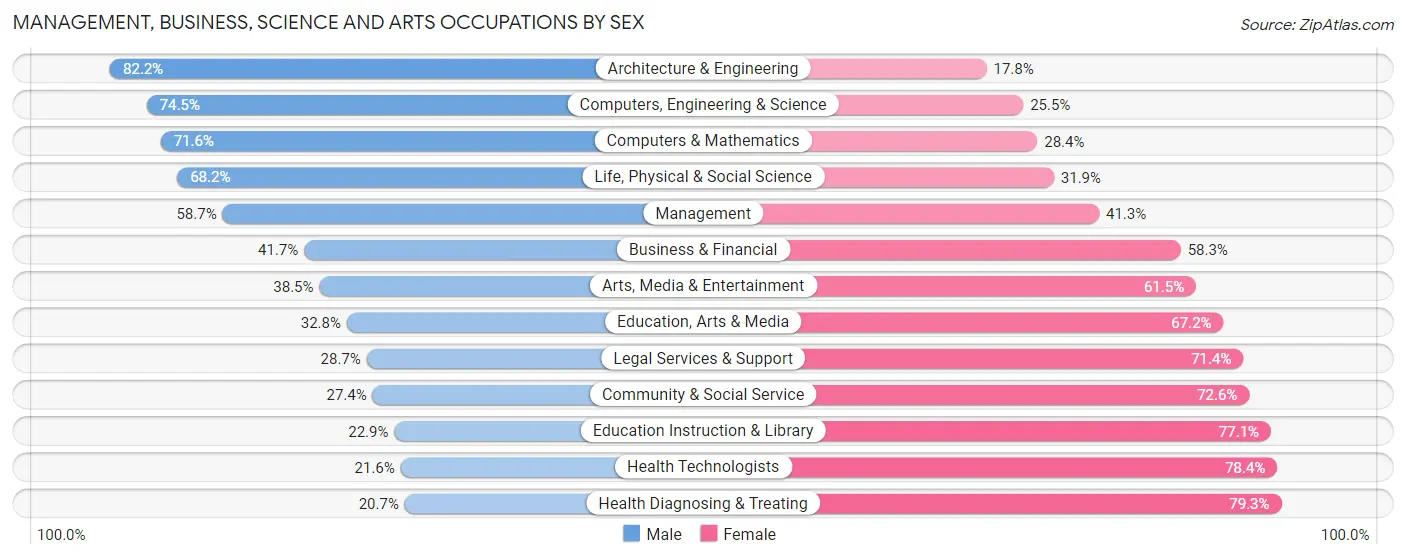
Management, Business, Science and Arts Occupations by Sex
Within the Management, Business, Science and Arts occupations in Madison County, the most male-oriented occupations are Architecture & Engineering (82.2%), Computers, Engineering & Science (74.5%), and Computers & Mathematics (71.6%), while the most female-oriented occupations are Health Diagnosing & Treating (79.3%), Health Technologists (78.4%), and Education Instruction & Library (77.1%).
| Occupation | Male | Female |
| Management | 7,991 (58.7%) | 5,618 (41.3%) |
| Business & Financial | 2,881 (41.7%) | 4,029 (58.3%) |
| Computers, Engineering & Science | 6,054 (74.5%) | 2,068 (25.5%) |
| Computers & Mathematics | 3,159 (71.6%) | 1,253 (28.4%) |
| Architecture & Engineering | 2,146 (82.2%) | 465 (17.8%) |
| Life, Physical & Social Science | 749 (68.1%) | 350 (31.9%) |
| Community & Social Service | 3,416 (27.4%) | 9,045 (72.6%) |
| Education, Arts & Media | 618 (32.8%) | 1,267 (67.2%) |
| Legal Services & Support | 475 (28.6%) | 1,183 (71.4%) |
| Education Instruction & Library | 1,626 (22.9%) | 5,482 (77.1%) |
| Arts, Media & Entertainment | 697 (38.5%) | 1,113 (61.5%) |
| Health Diagnosing & Treating | 1,787 (20.7%) | 6,846 (79.3%) |
| Health Technologists | 1,254 (21.6%) | 4,563 (78.4%) |
| Total (Category) | 22,129 (44.5%) | 27,606 (55.5%) |
| Total (Overall) | 66,966 (51.8%) | 62,345 (48.2%) |
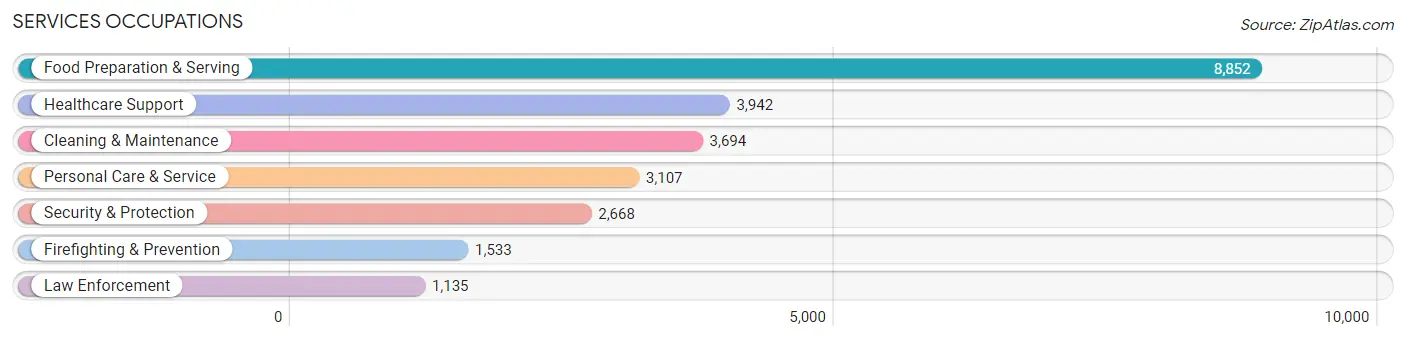
Services Occupations
The most common Services occupations in Madison County are Food Preparation & Serving (8,852 | 6.9%), Healthcare Support (3,942 | 3.0%), Cleaning & Maintenance (3,694 | 2.9%), Personal Care & Service (3,107 | 2.4%), and Security & Protection (2,668 | 2.1%).
Services Occupations by Sex
Within the Services occupations in Madison County, the most male-oriented occupations are Law Enforcement (98.2%), Security & Protection (84.2%), and Firefighting & Prevention (73.7%), while the most female-oriented occupations are Healthcare Support (85.2%), Personal Care & Service (76.9%), and Food Preparation & Serving (62.0%).
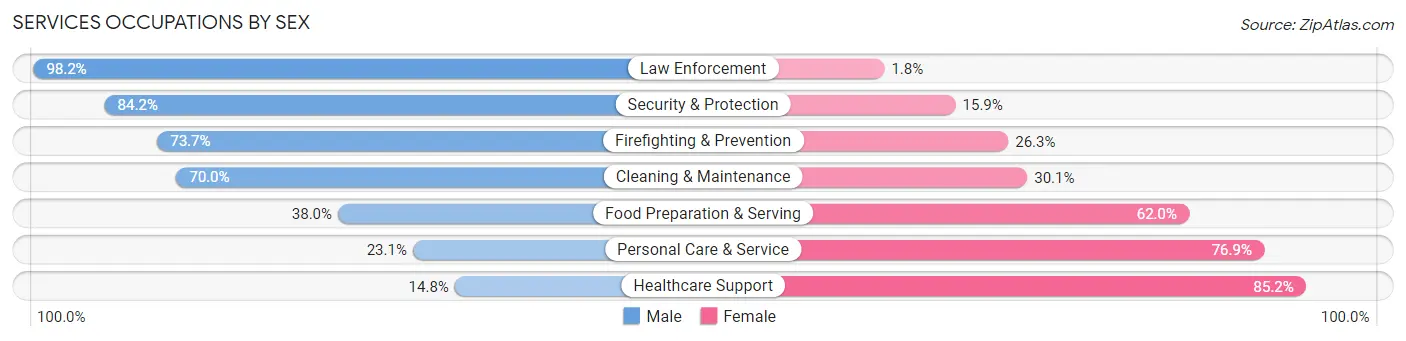
| Occupation | Male | Female |
| Healthcare Support | 585 (14.8%) | 3,357 (85.2%) |
| Security & Protection | 2,245 (84.2%) | 423 (15.9%) |
| Firefighting & Prevention | 1,130 (73.7%) | 403 (26.3%) |
| Law Enforcement | 1,115 (98.2%) | 20 (1.8%) |
| Food Preparation & Serving | 3,361 (38.0%) | 5,491 (62.0%) |
| Cleaning & Maintenance | 2,584 (70.0%) | 1,110 (30.0%) |
| Personal Care & Service | 719 (23.1%) | 2,388 (76.9%) |
| Total (Category) | 9,494 (42.6%) | 12,769 (57.4%) |
| Total (Overall) | 66,966 (51.8%) | 62,345 (48.2%) |
Sales and Office Occupations
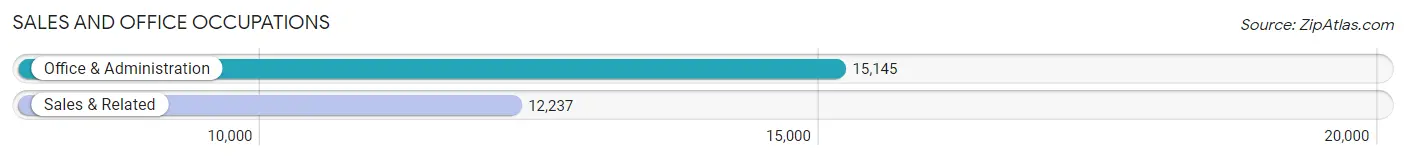
The most common Sales and Office occupations in Madison County are Office & Administration (15,145 | 11.7%), and Sales & Related (12,237 | 9.5%).
Sales and Office Occupations by Sex
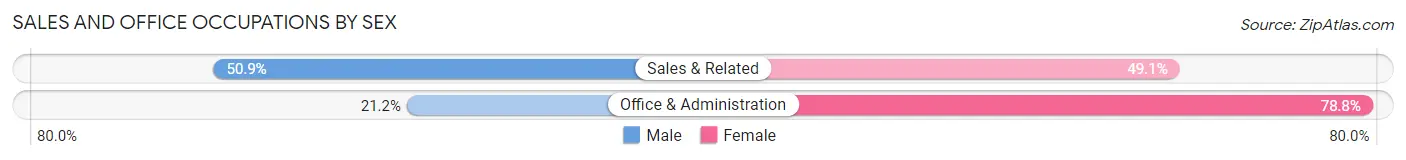
| Occupation | Male | Female |
| Sales & Related | 6,234 (50.9%) | 6,003 (49.1%) |
| Office & Administration | 3,211 (21.2%) | 11,934 (78.8%) |
| Total (Category) | 9,445 (34.5%) | 17,937 (65.5%) |
| Total (Overall) | 66,966 (51.8%) | 62,345 (48.2%) |
Natural Resources, Construction and Maintenance Occupations
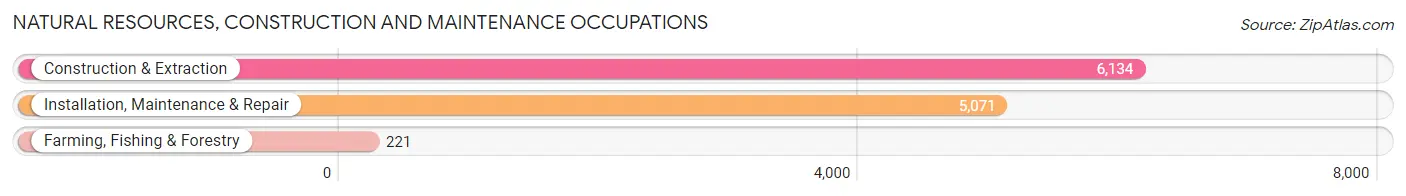
The most common Natural Resources, Construction and Maintenance occupations in Madison County are Construction & Extraction (6,134 | 4.7%), Installation, Maintenance & Repair (5,071 | 3.9%), and Farming, Fishing & Forestry (221 | 0.2%).
Natural Resources, Construction and Maintenance Occupations by Sex
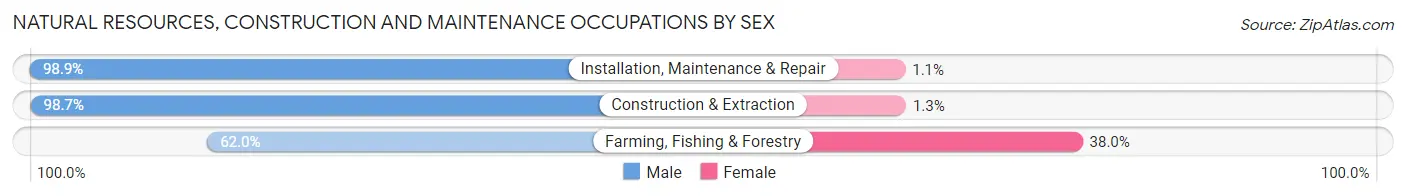
| Occupation | Male | Female |
| Farming, Fishing & Forestry | 137 (62.0%) | 84 (38.0%) |
| Construction & Extraction | 6,057 (98.7%) | 77 (1.3%) |
| Installation, Maintenance & Repair | 5,014 (98.9%) | 57 (1.1%) |
| Total (Category) | 11,208 (98.1%) | 218 (1.9%) |
| Total (Overall) | 66,966 (51.8%) | 62,345 (48.2%) |
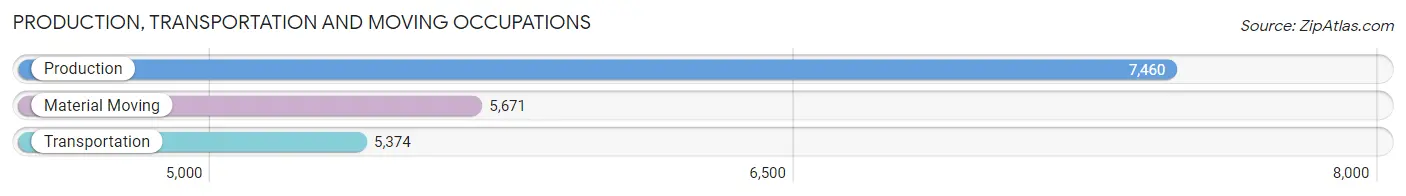
Production, Transportation and Moving Occupations
The most common Production, Transportation and Moving occupations in Madison County are Production (7,460 | 5.8%), Material Moving (5,671 | 4.4%), and Transportation (5,374 | 4.2%).
Production, Transportation and Moving Occupations by Sex
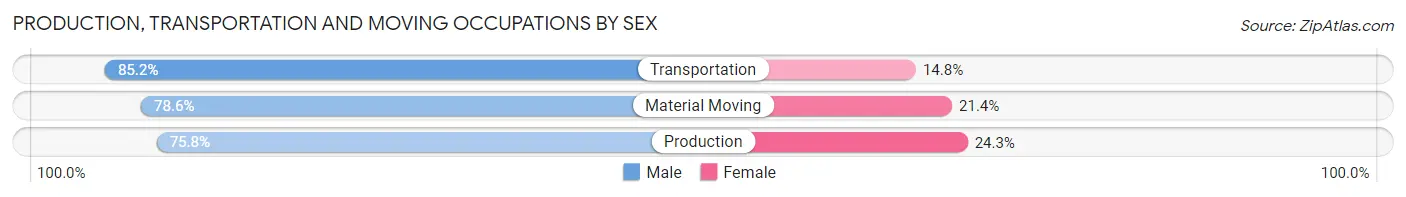
| Occupation | Male | Female |
| Production | 5,651 (75.7%) | 1,809 (24.2%) |
| Transportation | 4,581 (85.2%) | 793 (14.8%) |
| Material Moving | 4,458 (78.6%) | 1,213 (21.4%) |
| Total (Category) | 14,690 (79.4%) | 3,815 (20.6%) |
| Total (Overall) | 66,966 (51.8%) | 62,345 (48.2%) |
Employment Industries by Sex in Madison County
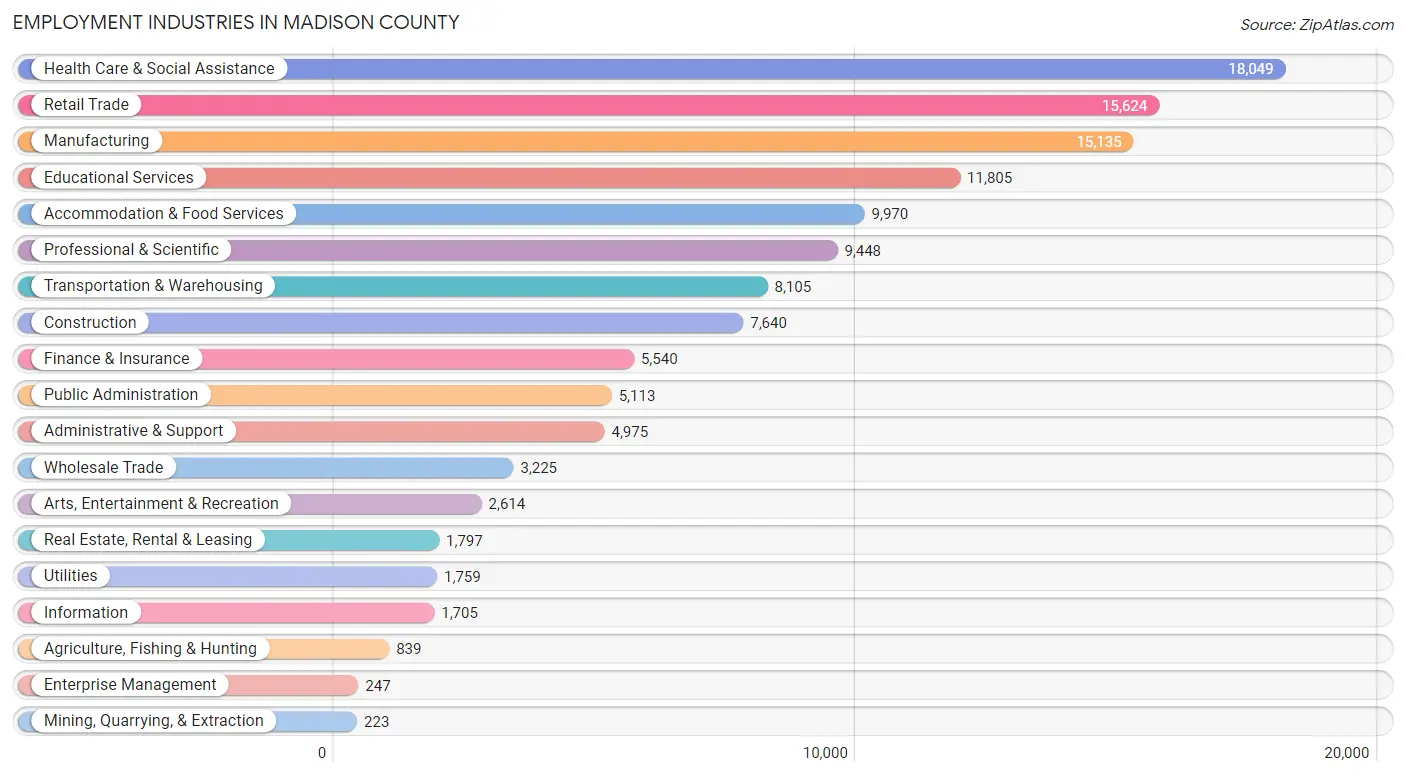
Employment Industries in Madison County
The major employment industries in Madison County include Health Care & Social Assistance (18,049 | 14.0%), Retail Trade (15,624 | 12.1%), Manufacturing (15,135 | 11.7%), Educational Services (11,805 | 9.1%), and Accommodation & Food Services (9,970 | 7.7%).
Employment Industries by Sex in Madison County
The Madison County industries that see more men than women are Construction (85.4%), Manufacturing (77.7%), and Transportation & Warehousing (76.2%), whereas the industries that tend to have a higher number of women are Enterprise Management (89.5%), Health Care & Social Assistance (80.5%), and Educational Services (73.3%).
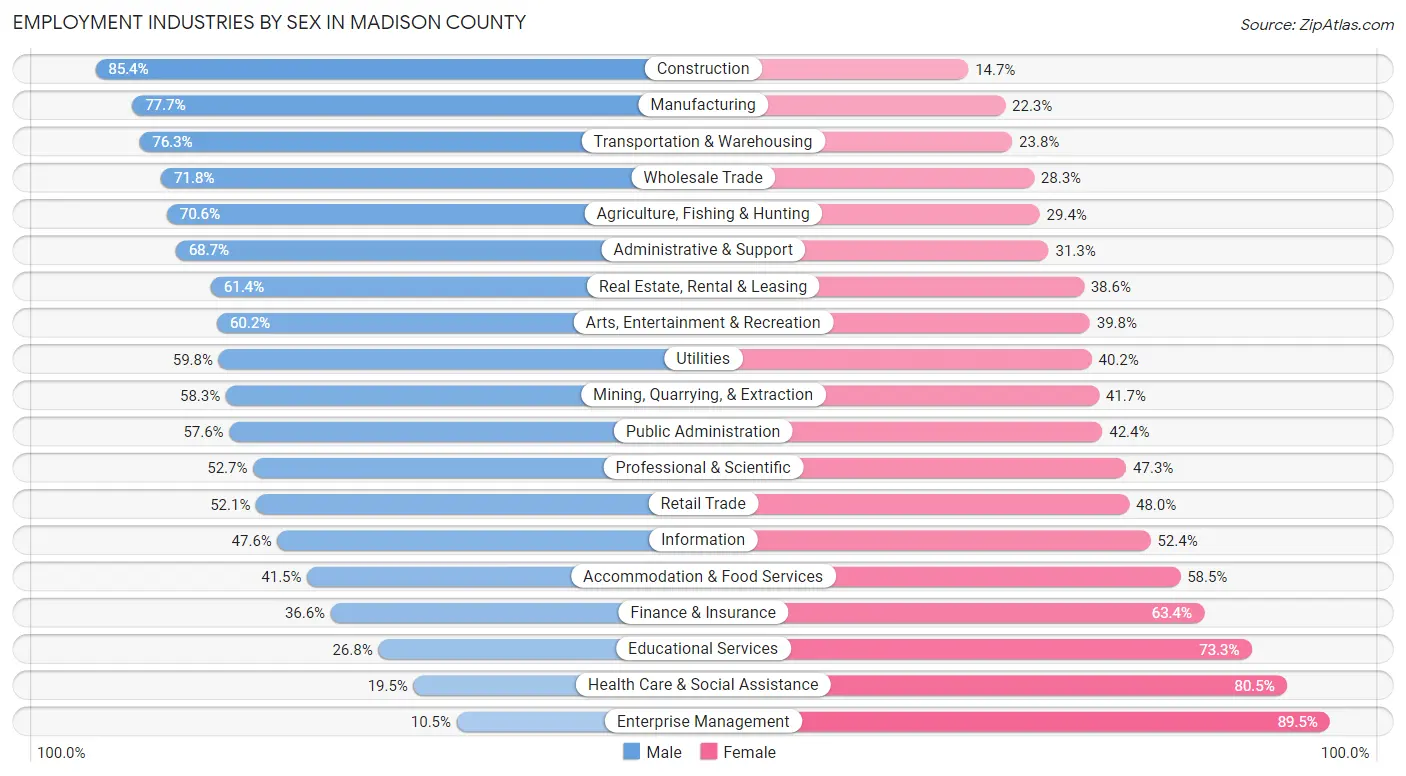
| Industry | Male | Female |
| Agriculture, Fishing & Hunting | 592 (70.6%) | 247 (29.4%) |
| Mining, Quarrying, & Extraction | 130 (58.3%) | 93 (41.7%) |
| Construction | 6,521 (85.4%) | 1,119 (14.6%) |
| Manufacturing | 11,761 (77.7%) | 3,374 (22.3%) |
| Wholesale Trade | 2,314 (71.8%) | 911 (28.2%) |
| Retail Trade | 8,132 (52.0%) | 7,492 (47.9%) |
| Transportation & Warehousing | 6,180 (76.2%) | 1,925 (23.7%) |
| Utilities | 1,052 (59.8%) | 707 (40.2%) |
| Information | 812 (47.6%) | 893 (52.4%) |
| Finance & Insurance | 2,027 (36.6%) | 3,513 (63.4%) |
| Real Estate, Rental & Leasing | 1,104 (61.4%) | 693 (38.6%) |
| Professional & Scientific | 4,975 (52.7%) | 4,473 (47.3%) |
| Enterprise Management | 26 (10.5%) | 221 (89.5%) |
| Administrative & Support | 3,419 (68.7%) | 1,556 (31.3%) |
| Educational Services | 3,158 (26.8%) | 8,647 (73.3%) |
| Health Care & Social Assistance | 3,512 (19.5%) | 14,537 (80.5%) |
| Arts, Entertainment & Recreation | 1,573 (60.2%) | 1,041 (39.8%) |
| Accommodation & Food Services | 4,135 (41.5%) | 5,835 (58.5%) |
| Public Administration | 2,945 (57.6%) | 2,168 (42.4%) |
| Total | 66,966 (51.8%) | 62,345 (48.2%) |
Education in Madison County
School Enrollment in Madison County
The most common levels of schooling among the 65,516 students in Madison County are college / undergraduate (15,794 | 24.1%), high school (13,269 | 20.3%), and elementary school (13,129 | 20.0%).
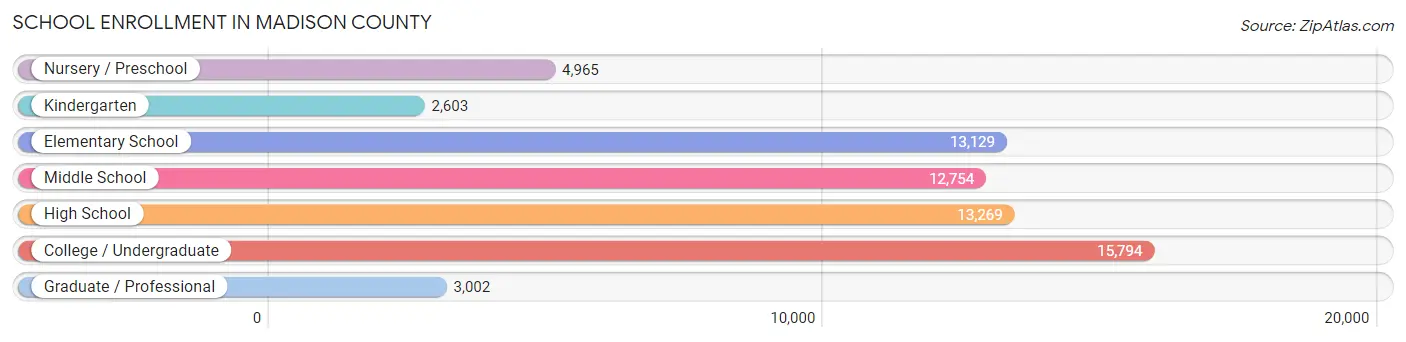
| School Level | # Students | % Students |
| Nursery / Preschool | 4,965 | 7.6% |
| Kindergarten | 2,603 | 4.0% |
| Elementary School | 13,129 | 20.0% |
| Middle School | 12,754 | 19.5% |
| High School | 13,269 | 20.3% |
| College / Undergraduate | 15,794 | 24.1% |
| Graduate / Professional | 3,002 | 4.6% |
| Total | 65,516 | 100.0% |
School Enrollment by Age by Funding Source in Madison County
Out of a total of 65,516 students who are enrolled in schools in Madison County, 10,614 (16.2%) attend a private institution, while the remaining 54,902 (83.8%) are enrolled in public schools. The age group of 3 to 4 year olds has the highest likelihood of being enrolled in private schools, with 1,157 (32.1% in the age bracket) enrolled. Conversely, the age group of 20 to 24 year olds has the lowest likelihood of being enrolled in a private school, with 7,459 (92.5% in the age bracket) attending a public institution.
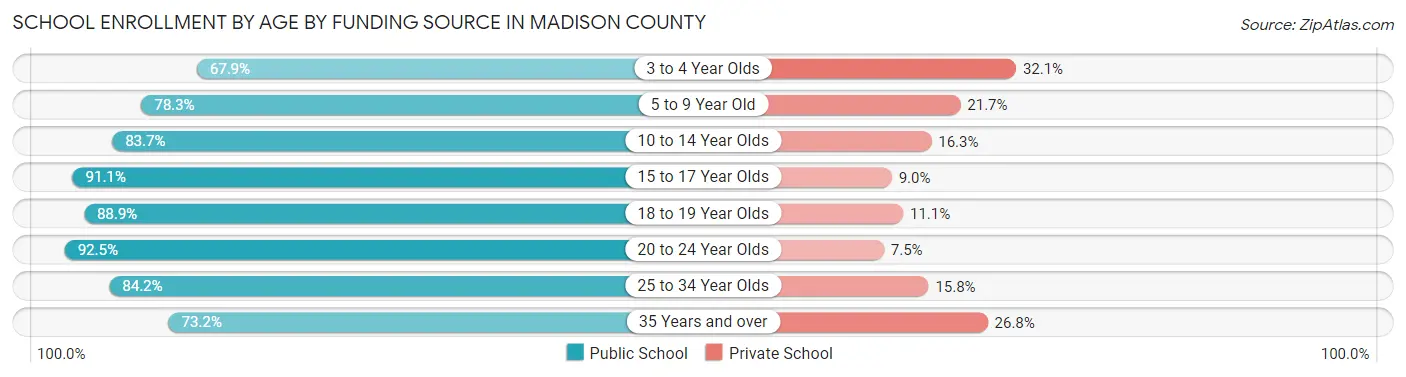
| Age Bracket | Public School | Private School |
| 3 to 4 Year Olds | 2,448 (67.9%) | 1,157 (32.1%) |
| 5 to 9 Year Old | 12,089 (78.3%) | 3,359 (21.7%) |
| 10 to 14 Year Olds | 13,195 (83.7%) | 2,573 (16.3%) |
| 15 to 17 Year Olds | 8,994 (91.0%) | 884 (8.9%) |
| 18 to 19 Year Olds | 5,266 (88.9%) | 655 (11.1%) |
| 20 to 24 Year Olds | 7,459 (92.5%) | 603 (7.5%) |
| 25 to 34 Year Olds | 3,248 (84.2%) | 609 (15.8%) |
| 35 Years and over | 2,179 (73.2%) | 798 (26.8%) |
| Total | 54,902 (83.8%) | 10,614 (16.2%) |
Educational Attainment by Field of Study in Madison County
Business (11,609 | 20.0%), education (9,164 | 15.8%), science & technology (7,381 | 12.7%), social sciences (3,464 | 6.0%), and engineering (3,447 | 5.9%) are the most common fields of study among 58,088 individuals in Madison County who have obtained a bachelor's degree or higher.
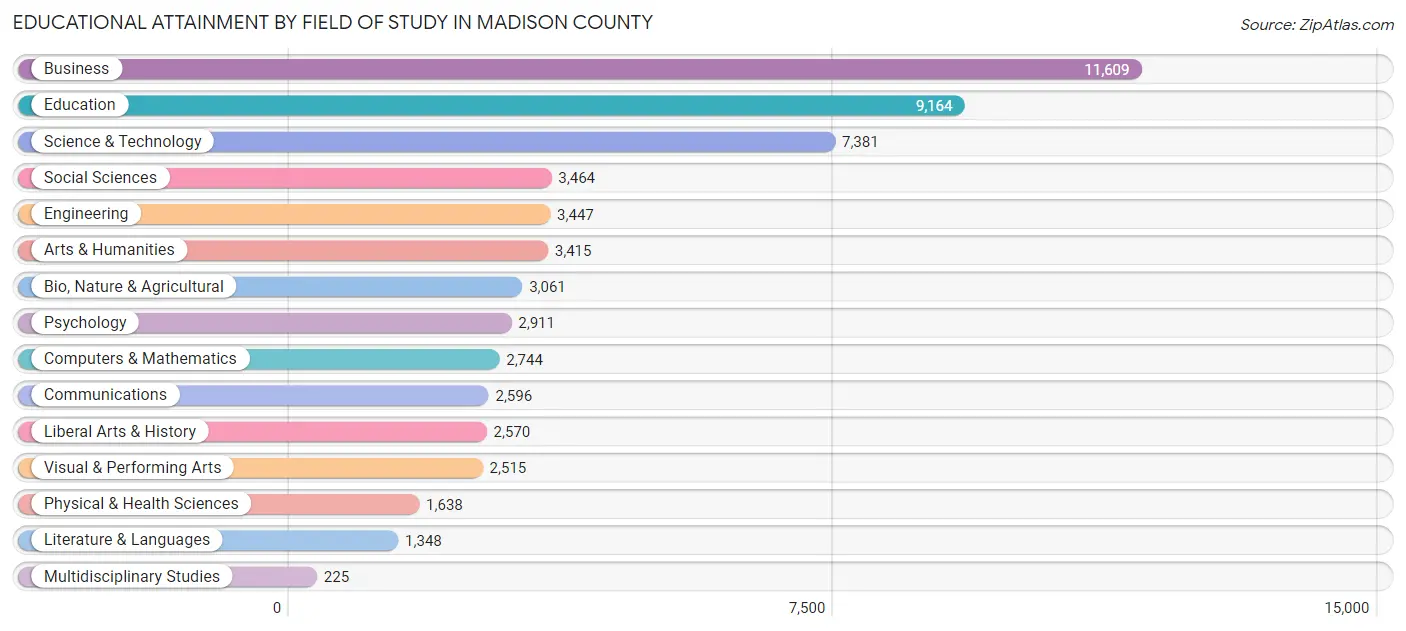
| Field of Study | # Graduates | % Graduates |
| Computers & Mathematics | 2,744 | 4.7% |
| Bio, Nature & Agricultural | 3,061 | 5.3% |
| Physical & Health Sciences | 1,638 | 2.8% |
| Psychology | 2,911 | 5.0% |
| Social Sciences | 3,464 | 6.0% |
| Engineering | 3,447 | 5.9% |
| Multidisciplinary Studies | 225 | 0.4% |
| Science & Technology | 7,381 | 12.7% |
| Business | 11,609 | 20.0% |
| Education | 9,164 | 15.8% |
| Literature & Languages | 1,348 | 2.3% |
| Liberal Arts & History | 2,570 | 4.4% |
| Visual & Performing Arts | 2,515 | 4.3% |
| Communications | 2,596 | 4.5% |
| Arts & Humanities | 3,415 | 5.9% |
| Total | 58,088 | 100.0% |
Transportation & Commute in Madison County
Vehicle Availability by Sex in Madison County
The most prevalent vehicle ownership categories in Madison County are males with 2 vehicles (29,148, accounting for 44.2%) and females with 2 vehicles (25,316, making up 47.8%).
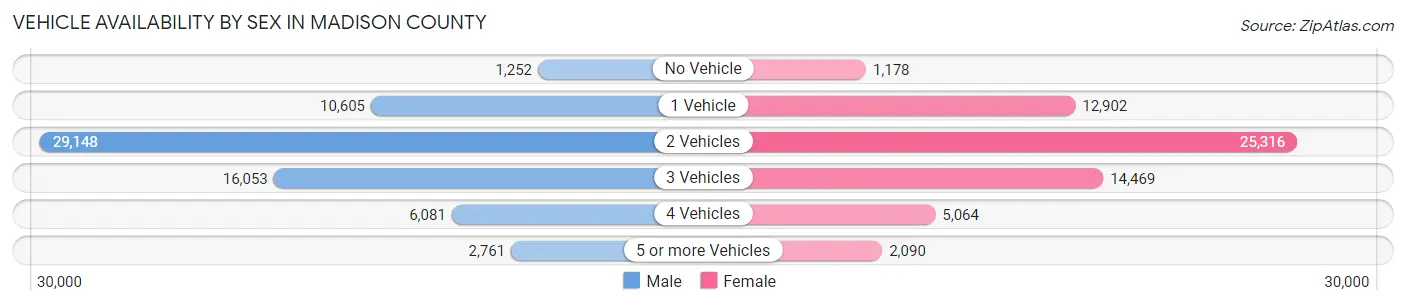
| Vehicles Available | Male | Female |
| No Vehicle | 1,252 (1.9%) | 1,178 (1.9%) |
| 1 Vehicle | 10,605 (16.1%) | 12,902 (21.1%) |
| 2 Vehicles | 29,148 (44.2%) | 25,316 (41.5%) |
| 3 Vehicles | 16,053 (24.4%) | 14,469 (23.7%) |
| 4 Vehicles | 6,081 (9.2%) | 5,064 (8.3%) |
| 5 or more Vehicles | 2,761 (4.2%) | 2,090 (3.4%) |
| Total | 65,900 (100.0%) | 61,019 (100.0%) |
Commute Time in Madison County
The most frequently occuring commute durations in Madison County are 30 to 34 minutes (16,671 commuters, 14.5%), 5 to 9 minutes (14,549 commuters, 12.7%), and 15 to 19 minutes (14,514 commuters, 12.7%).

| Commute Time | # Commuters | % Commuters |
| Less than 5 Minutes | 3,223 | 2.8% |
| 5 to 9 Minutes | 14,549 | 12.7% |
| 10 to 14 Minutes | 14,444 | 12.6% |
| 15 to 19 Minutes | 14,514 | 12.7% |
| 20 to 24 Minutes | 13,972 | 12.2% |
| 25 to 29 Minutes | 8,446 | 7.4% |
| 30 to 34 Minutes | 16,671 | 14.5% |
| 35 to 39 Minutes | 5,671 | 5.0% |
| 40 to 44 Minutes | 6,292 | 5.5% |
| 45 to 59 Minutes | 10,892 | 9.5% |
| 60 to 89 Minutes | 4,256 | 3.7% |
| 90 or more Minutes | 1,723 | 1.5% |
Commute Time by Sex in Madison County
The most common commute times in Madison County are 30 to 34 minutes (9,063 commuters, 15.1%) for males and 5 to 9 minutes (7,929 commuters, 14.5%) for females.
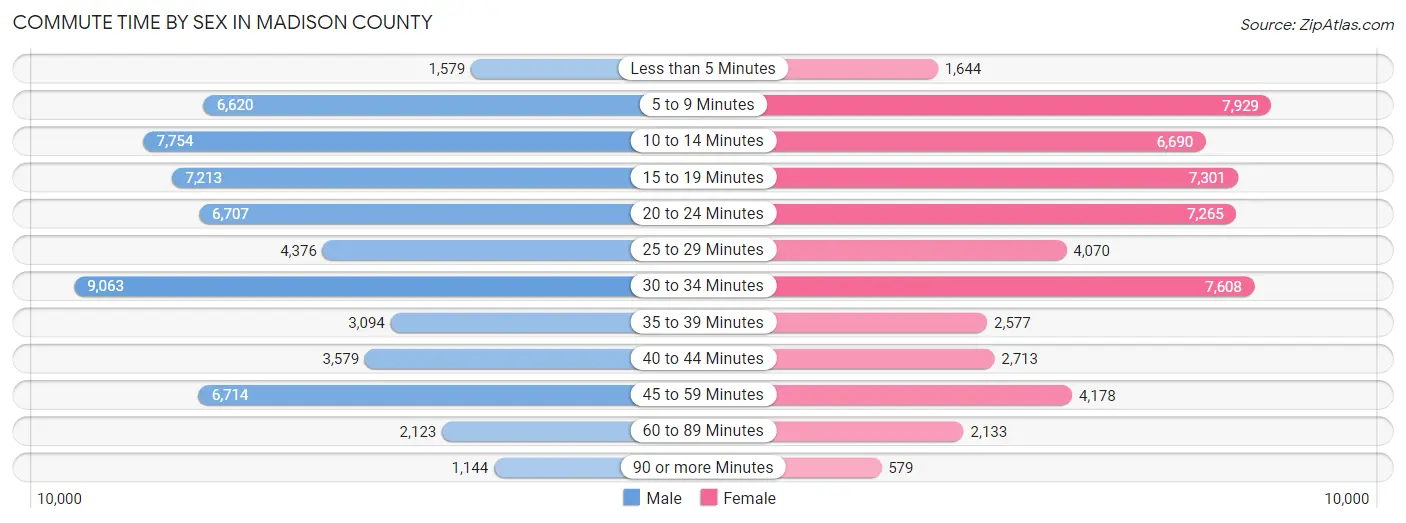
| Commute Time | Male | Female |
| Less than 5 Minutes | 1,579 (2.6%) | 1,644 (3.0%) |
| 5 to 9 Minutes | 6,620 (11.0%) | 7,929 (14.5%) |
| 10 to 14 Minutes | 7,754 (12.9%) | 6,690 (12.2%) |
| 15 to 19 Minutes | 7,213 (12.0%) | 7,301 (13.4%) |
| 20 to 24 Minutes | 6,707 (11.2%) | 7,265 (13.3%) |
| 25 to 29 Minutes | 4,376 (7.3%) | 4,070 (7.4%) |
| 30 to 34 Minutes | 9,063 (15.1%) | 7,608 (13.9%) |
| 35 to 39 Minutes | 3,094 (5.2%) | 2,577 (4.7%) |
| 40 to 44 Minutes | 3,579 (6.0%) | 2,713 (5.0%) |
| 45 to 59 Minutes | 6,714 (11.2%) | 4,178 (7.6%) |
| 60 to 89 Minutes | 2,123 (3.5%) | 2,133 (3.9%) |
| 90 or more Minutes | 1,144 (1.9%) | 579 (1.1%) |
Time of Departure to Work by Sex in Madison County
The most frequent times of departure to work in Madison County are 7:00 AM to 7:29 AM (7,984, 13.3%) for males and 7:00 AM to 7:29 AM (8,441, 15.4%) for females.
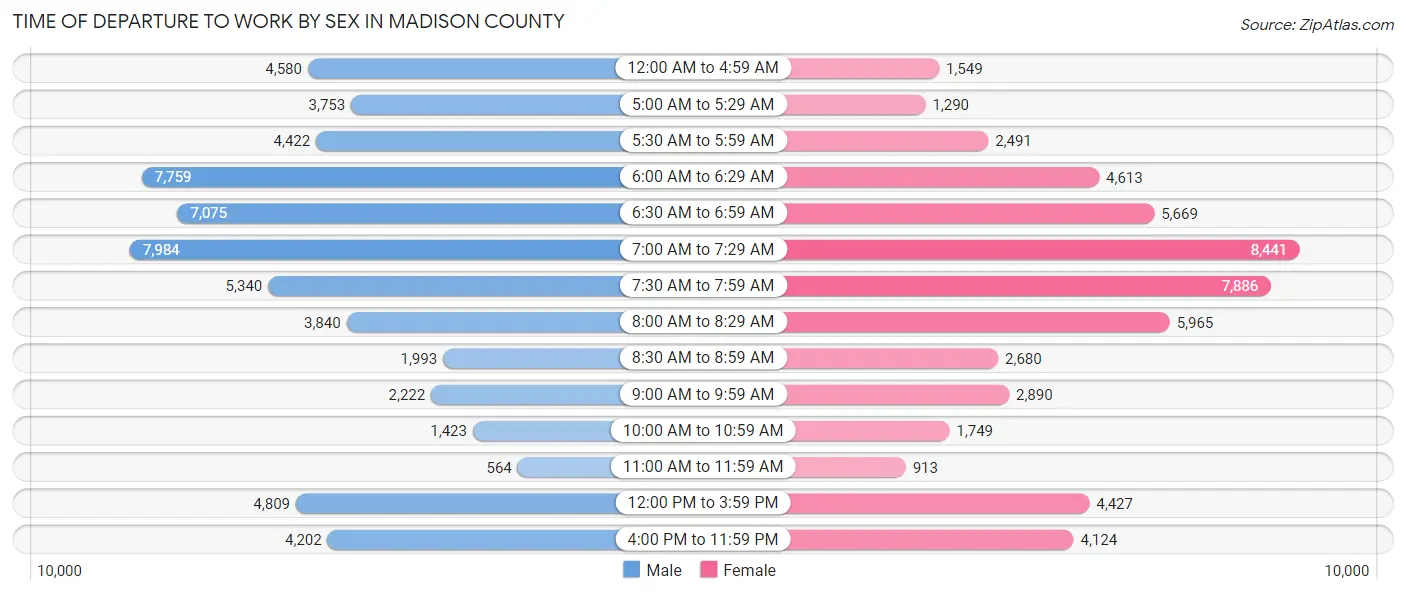
| Time of Departure | Male | Female |
| 12:00 AM to 4:59 AM | 4,580 (7.6%) | 1,549 (2.8%) |
| 5:00 AM to 5:29 AM | 3,753 (6.3%) | 1,290 (2.4%) |
| 5:30 AM to 5:59 AM | 4,422 (7.4%) | 2,491 (4.6%) |
| 6:00 AM to 6:29 AM | 7,759 (12.9%) | 4,613 (8.4%) |
| 6:30 AM to 6:59 AM | 7,075 (11.8%) | 5,669 (10.4%) |
| 7:00 AM to 7:29 AM | 7,984 (13.3%) | 8,441 (15.4%) |
| 7:30 AM to 7:59 AM | 5,340 (8.9%) | 7,886 (14.4%) |
| 8:00 AM to 8:29 AM | 3,840 (6.4%) | 5,965 (10.9%) |
| 8:30 AM to 8:59 AM | 1,993 (3.3%) | 2,680 (4.9%) |
| 9:00 AM to 9:59 AM | 2,222 (3.7%) | 2,890 (5.3%) |
| 10:00 AM to 10:59 AM | 1,423 (2.4%) | 1,749 (3.2%) |
| 11:00 AM to 11:59 AM | 564 (0.9%) | 913 (1.7%) |
| 12:00 PM to 3:59 PM | 4,809 (8.0%) | 4,427 (8.1%) |
| 4:00 PM to 11:59 PM | 4,202 (7.0%) | 4,124 (7.5%) |
| Total | 59,966 (100.0%) | 54,687 (100.0%) |
Housing Occupancy in Madison County
Occupancy by Ownership in Madison County
Of the total 108,914 dwellings in Madison County, owner-occupied units account for 79,667 (73.2%), while renter-occupied units make up 29,247 (26.9%).
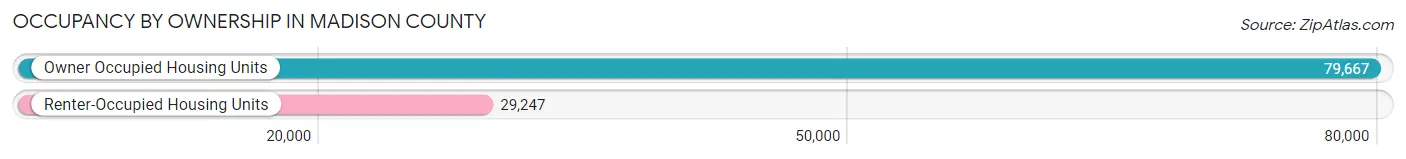
| Occupancy | # Housing Units | % Housing Units |
| Owner Occupied Housing Units | 79,667 | 73.2% |
| Renter-Occupied Housing Units | 29,247 | 26.9% |
| Total Occupied Housing Units | 108,914 | 100.0% |
Occupancy by Household Size in Madison County
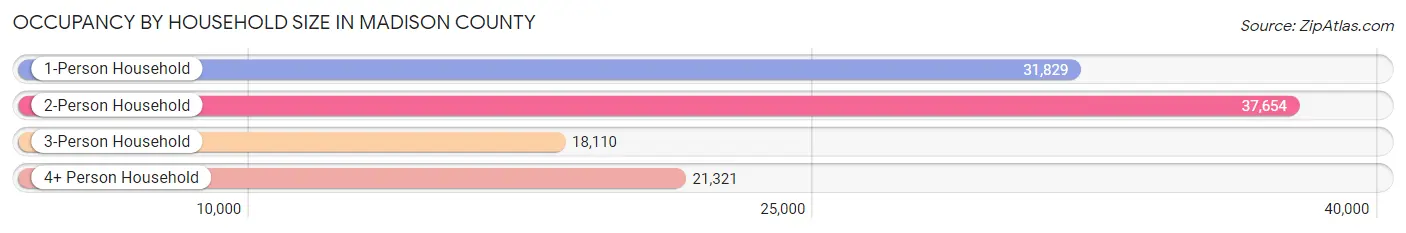
| Household Size | # Housing Units | % Housing Units |
| 1-Person Household | 31,829 | 29.2% |
| 2-Person Household | 37,654 | 34.6% |
| 3-Person Household | 18,110 | 16.6% |
| 4+ Person Household | 21,321 | 19.6% |
| Total Housing Units | 108,914 | 100.0% |
Occupancy by Ownership by Household Size in Madison County
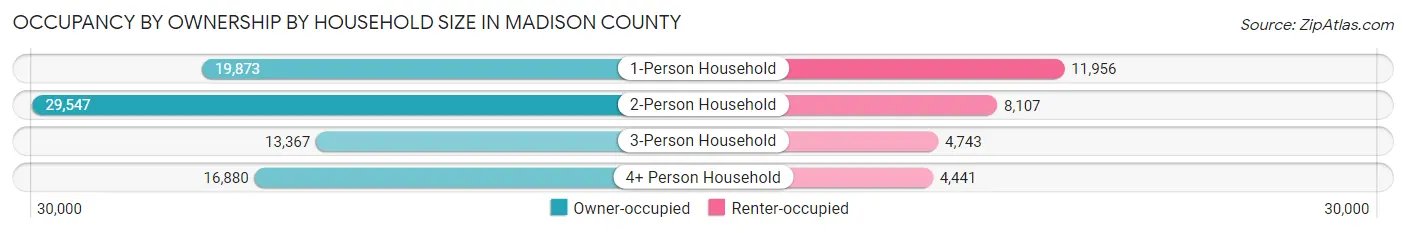
| Household Size | Owner-occupied | Renter-occupied |
| 1-Person Household | 19,873 (62.4%) | 11,956 (37.6%) |
| 2-Person Household | 29,547 (78.5%) | 8,107 (21.5%) |
| 3-Person Household | 13,367 (73.8%) | 4,743 (26.2%) |
| 4+ Person Household | 16,880 (79.2%) | 4,441 (20.8%) |
| Total Housing Units | 79,667 (73.2%) | 29,247 (26.9%) |
Occupancy by Educational Attainment in Madison County
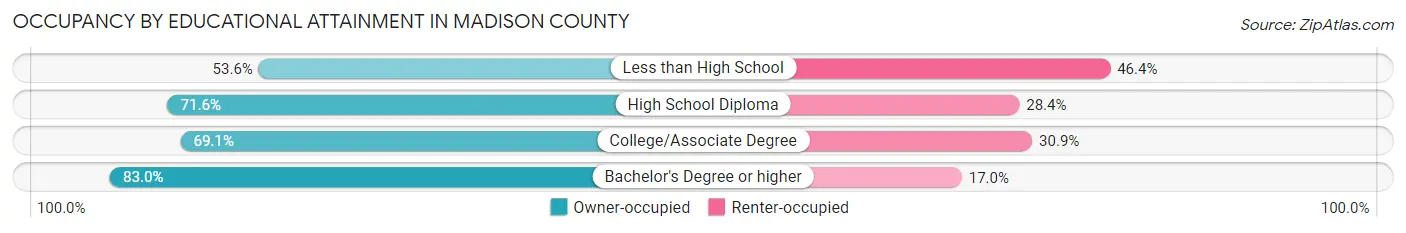
| Household Size | Owner-occupied | Renter-occupied |
| Less than High School | 3,458 (53.6%) | 2,995 (46.4%) |
| High School Diploma | 20,340 (71.6%) | 8,054 (28.4%) |
| College/Associate Degree | 27,861 (69.1%) | 12,475 (30.9%) |
| Bachelor's Degree or higher | 28,008 (83.0%) | 5,723 (17.0%) |
Occupancy by Age of Householder in Madison County
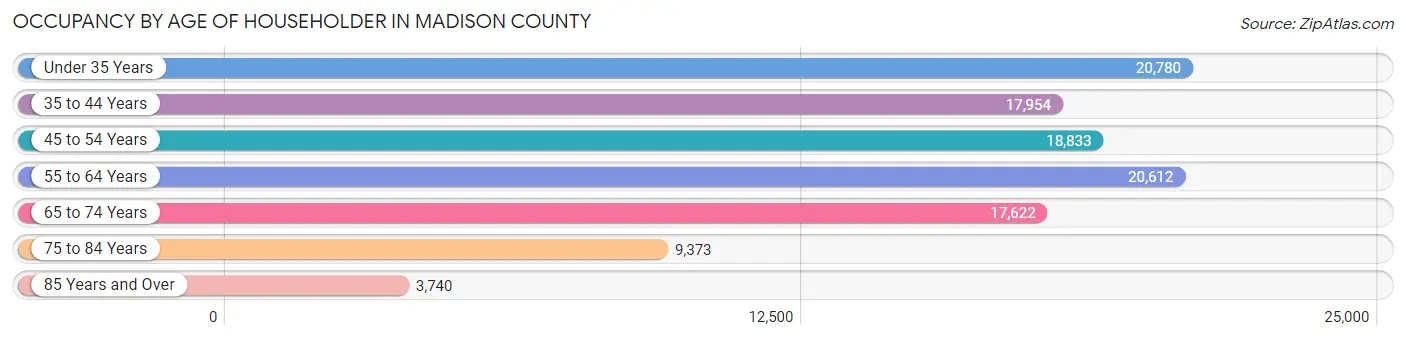
| Age Bracket | # Households | % Households |
| Under 35 Years | 20,780 | 19.1% |
| 35 to 44 Years | 17,954 | 16.5% |
| 45 to 54 Years | 18,833 | 17.3% |
| 55 to 64 Years | 20,612 | 18.9% |
| 65 to 74 Years | 17,622 | 16.2% |
| 75 to 84 Years | 9,373 | 8.6% |
| 85 Years and Over | 3,740 | 3.4% |
| Total | 108,914 | 100.0% |
Housing Finances in Madison County
Median Income by Occupancy in Madison County
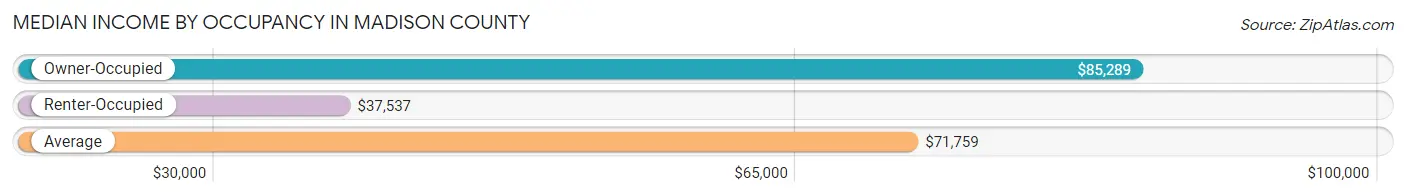
| Occupancy Type | # Households | Median Income |
| Owner-Occupied | 79,667 (73.2%) | $85,289 |
| Renter-Occupied | 29,247 (26.9%) | $37,537 |
| Average | 108,914 (100.0%) | $71,759 |
Occupancy by Householder Income Bracket in Madison County
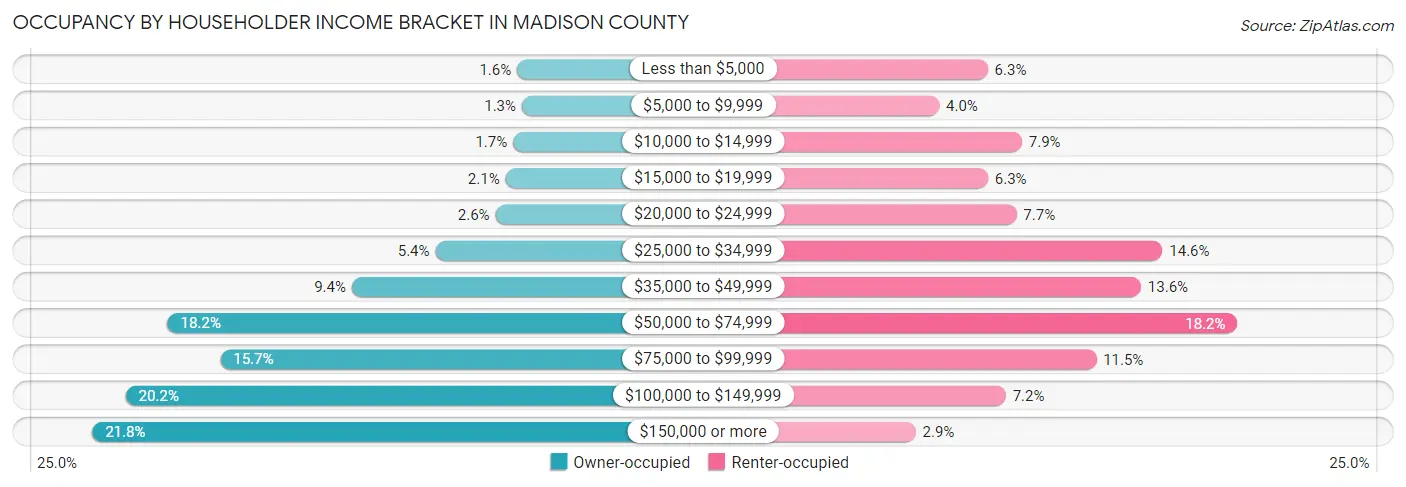
| Income Bracket | Owner-occupied | Renter-occupied |
| Less than $5,000 | 1,235 (1.5%) | 1,840 (6.3%) |
| $5,000 to $9,999 | 1,055 (1.3%) | 1,165 (4.0%) |
| $10,000 to $14,999 | 1,387 (1.7%) | 2,315 (7.9%) |
| $15,000 to $19,999 | 1,670 (2.1%) | 1,843 (6.3%) |
| $20,000 to $24,999 | 2,054 (2.6%) | 2,239 (7.7%) |
| $25,000 to $34,999 | 4,336 (5.4%) | 4,274 (14.6%) |
| $35,000 to $49,999 | 7,507 (9.4%) | 3,974 (13.6%) |
| $50,000 to $74,999 | 14,492 (18.2%) | 5,317 (18.2%) |
| $75,000 to $99,999 | 12,495 (15.7%) | 3,351 (11.5%) |
| $100,000 to $149,999 | 16,085 (20.2%) | 2,092 (7.1%) |
| $150,000 or more | 17,351 (21.8%) | 837 (2.9%) |
| Total | 79,667 (100.0%) | 29,247 (100.0%) |
Monthly Housing Cost Tiers in Madison County
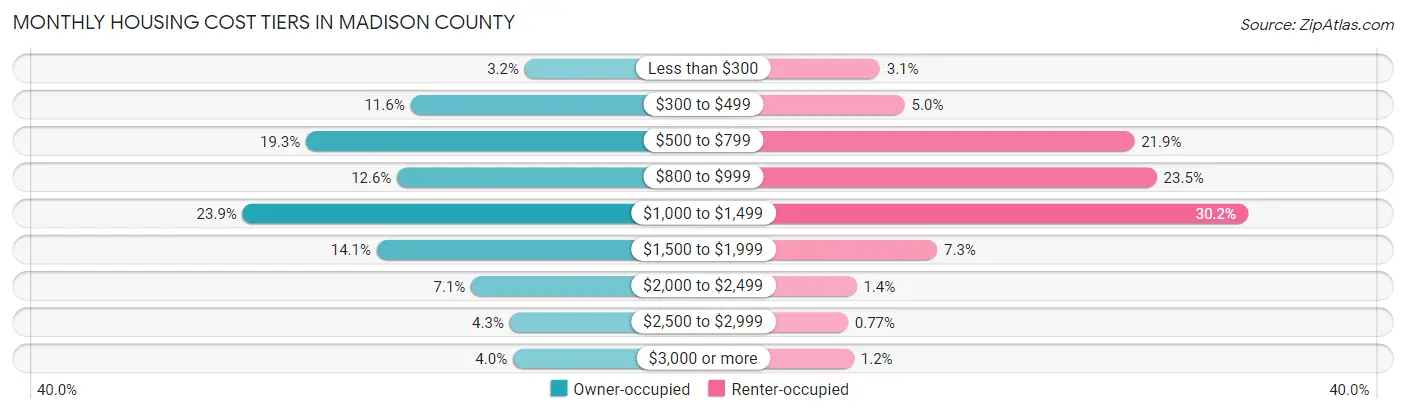
| Monthly Cost | Owner-occupied | Renter-occupied |
| Less than $300 | 2,517 (3.2%) | 913 (3.1%) |
| $300 to $499 | 9,229 (11.6%) | 1,449 (5.0%) |
| $500 to $799 | 15,352 (19.3%) | 6,392 (21.9%) |
| $800 to $999 | 10,008 (12.6%) | 6,875 (23.5%) |
| $1,000 to $1,499 | 19,073 (23.9%) | 8,838 (30.2%) |
| $1,500 to $1,999 | 11,204 (14.1%) | 2,148 (7.3%) |
| $2,000 to $2,499 | 5,667 (7.1%) | 409 (1.4%) |
| $2,500 to $2,999 | 3,404 (4.3%) | 226 (0.8%) |
| $3,000 or more | 3,213 (4.0%) | 354 (1.2%) |
| Total | 79,667 (100.0%) | 29,247 (100.0%) |
Physical Housing Characteristics in Madison County
Housing Structures in Madison County
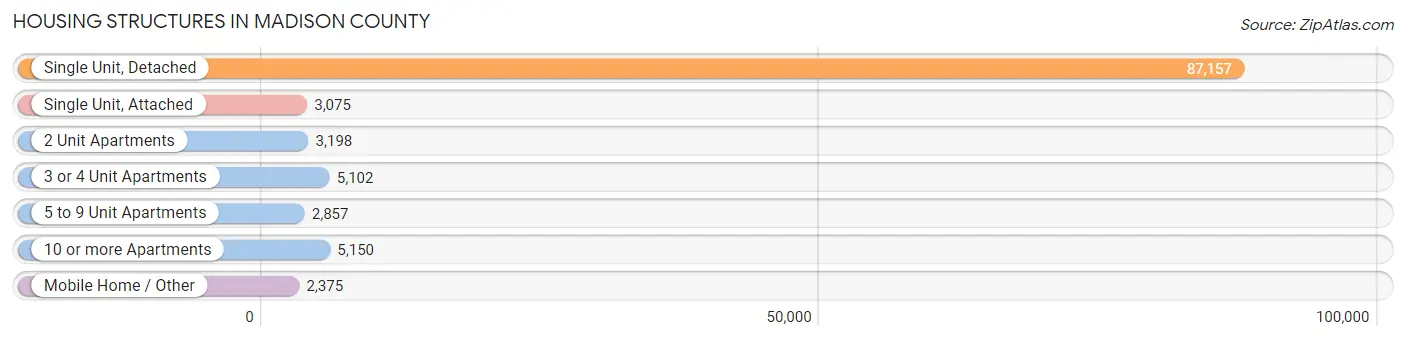
| Structure Type | # Housing Units | % Housing Units |
| Single Unit, Detached | 87,157 | 80.0% |
| Single Unit, Attached | 3,075 | 2.8% |
| 2 Unit Apartments | 3,198 | 2.9% |
| 3 or 4 Unit Apartments | 5,102 | 4.7% |
| 5 to 9 Unit Apartments | 2,857 | 2.6% |
| 10 or more Apartments | 5,150 | 4.7% |
| Mobile Home / Other | 2,375 | 2.2% |
| Total | 108,914 | 100.0% |
Housing Structures by Occupancy in Madison County
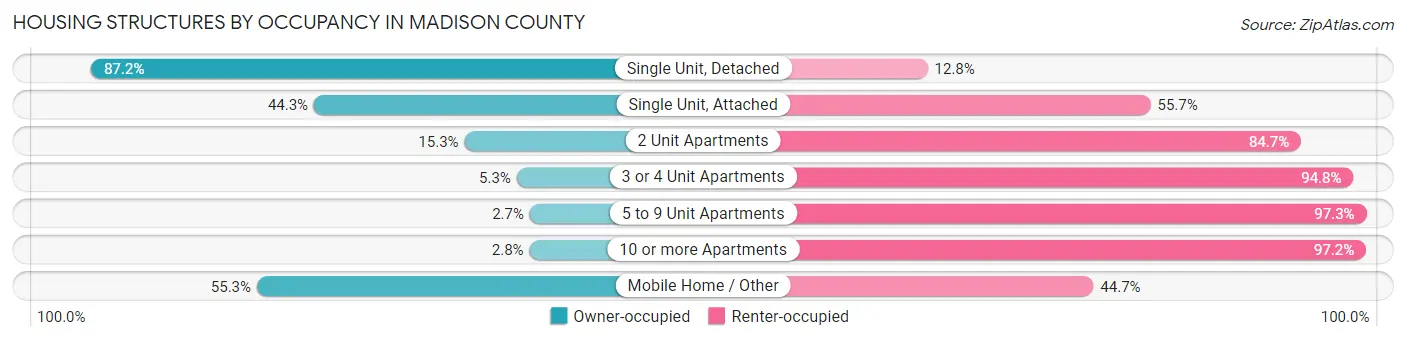
| Structure Type | Owner-occupied | Renter-occupied |
| Single Unit, Detached | 76,012 (87.2%) | 11,145 (12.8%) |
| Single Unit, Attached | 1,362 (44.3%) | 1,713 (55.7%) |
| 2 Unit Apartments | 490 (15.3%) | 2,708 (84.7%) |
| 3 or 4 Unit Apartments | 268 (5.2%) | 4,834 (94.8%) |
| 5 to 9 Unit Apartments | 78 (2.7%) | 2,779 (97.3%) |
| 10 or more Apartments | 144 (2.8%) | 5,006 (97.2%) |
| Mobile Home / Other | 1,313 (55.3%) | 1,062 (44.7%) |
| Total | 79,667 (73.2%) | 29,247 (26.9%) |
Housing Structures by Number of Rooms in Madison County
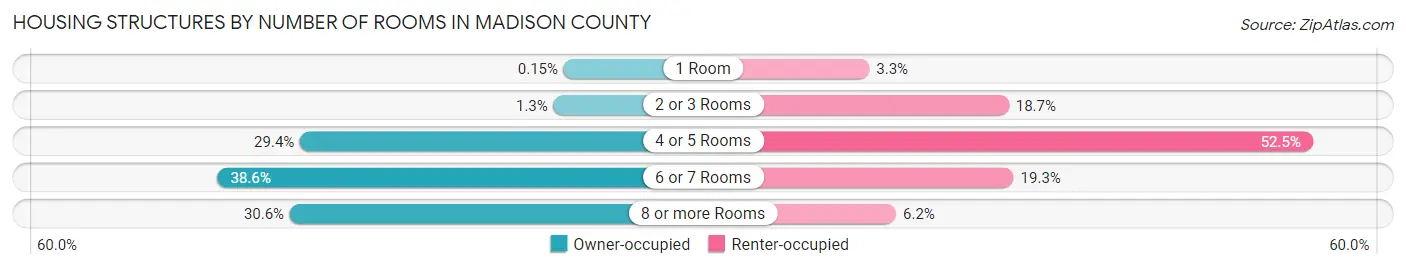
| Number of Rooms | Owner-occupied | Renter-occupied |
| 1 Room | 117 (0.2%) | 957 (3.3%) |
| 2 or 3 Rooms | 1,029 (1.3%) | 5,481 (18.7%) |
| 4 or 5 Rooms | 23,438 (29.4%) | 15,347 (52.5%) |
| 6 or 7 Rooms | 30,747 (38.6%) | 5,640 (19.3%) |
| 8 or more Rooms | 24,336 (30.5%) | 1,822 (6.2%) |
| Total | 79,667 (100.0%) | 29,247 (100.0%) |
Housing Structure by Heating Type in Madison County
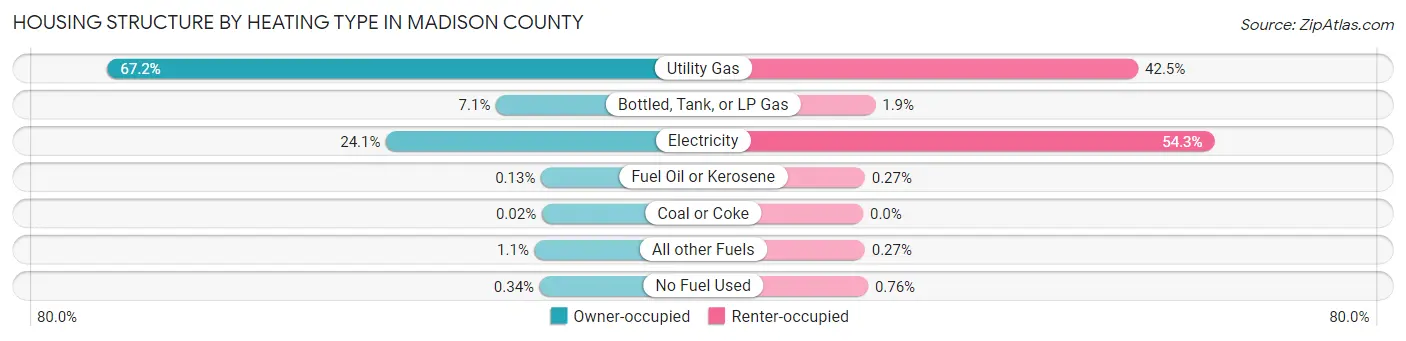
| Heating Type | Owner-occupied | Renter-occupied |
| Utility Gas | 53,529 (67.2%) | 12,437 (42.5%) |
| Bottled, Tank, or LP Gas | 5,645 (7.1%) | 553 (1.9%) |
| Electricity | 19,188 (24.1%) | 15,880 (54.3%) |
| Fuel Oil or Kerosene | 105 (0.1%) | 78 (0.3%) |
| Coal or Coke | 18 (0.0%) | 0 (0.0%) |
| All other Fuels | 908 (1.1%) | 78 (0.3%) |
| No Fuel Used | 274 (0.3%) | 221 (0.8%) |
| Total | 79,667 (100.0%) | 29,247 (100.0%) |
Household Vehicle Usage in Madison County
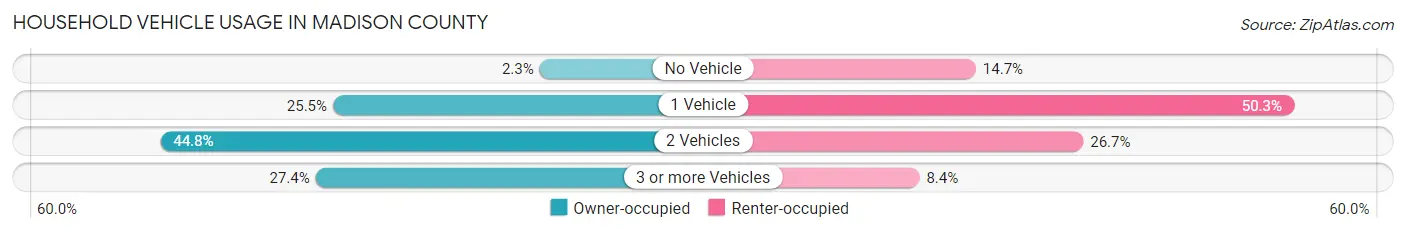
| Vehicles per Household | Owner-occupied | Renter-occupied |
| No Vehicle | 1,850 (2.3%) | 4,290 (14.7%) |
| 1 Vehicle | 20,295 (25.5%) | 14,706 (50.3%) |
| 2 Vehicles | 35,687 (44.8%) | 7,808 (26.7%) |
| 3 or more Vehicles | 21,835 (27.4%) | 2,443 (8.4%) |
| Total | 79,667 (100.0%) | 29,247 (100.0%) |
Real Estate & Mortgages in Madison County
Real Estate and Mortgage Overview in Madison County
| Characteristic | Without Mortgage | With Mortgage |
| Housing Units | 30,622 | 49,045 |
| Median Property Value | $140,300 | $170,400 |
| Median Household Income | $64,646 | $13,196 |
| Monthly Housing Costs | $591 | $3,045 |
| Real Estate Taxes | $2,603 | $978 |
Property Value by Mortgage Status in Madison County

| Property Value | Without Mortgage | With Mortgage |
| Less than $50,000 | 3,726 (12.2%) | 1,911 (3.9%) |
| $50,000 to $99,999 | 6,566 (21.4%) | 8,342 (17.0%) |
| $100,000 to $299,999 | 16,390 (53.5%) | 29,611 (60.4%) |
| $300,000 to $499,999 | 2,992 (9.8%) | 7,026 (14.3%) |
| $500,000 to $749,999 | 457 (1.5%) | 1,570 (3.2%) |
| $750,000 to $999,999 | 228 (0.7%) | 202 (0.4%) |
| $1,000,000 or more | 263 (0.9%) | 383 (0.8%) |
| Total | 30,622 (100.0%) | 49,045 (100.0%) |
Household Income by Mortgage Status in Madison County

| Household Income | Without Mortgage | With Mortgage |
| Less than $10,000 | 1,588 (5.2%) | 966 (2.0%) |
| $10,000 to $24,999 | 3,417 (11.2%) | 702 (1.4%) |
| $25,000 to $34,999 | 2,559 (8.4%) | 1,694 (3.5%) |
| $35,000 to $49,999 | 3,932 (12.8%) | 1,777 (3.6%) |
| $50,000 to $74,999 | 6,485 (21.2%) | 3,575 (7.3%) |
| $75,000 to $99,999 | 3,990 (13.0%) | 8,007 (16.3%) |
| $100,000 to $149,999 | 4,496 (14.7%) | 8,505 (17.3%) |
| $150,000 or more | 4,155 (13.6%) | 11,589 (23.6%) |
| Total | 30,622 (100.0%) | 49,045 (100.0%) |
Property Value to Household Income Ratio in Madison County
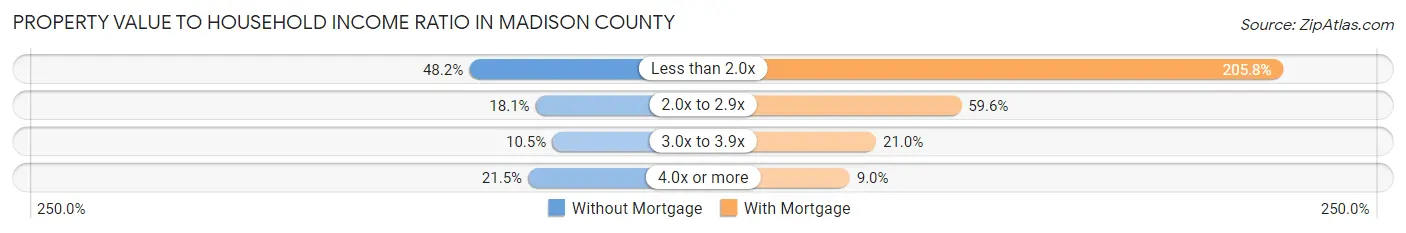
| Value-to-Income Ratio | Without Mortgage | With Mortgage |
| Less than 2.0x | 14,770 (48.2%) | 100,952 (205.8%) |
| 2.0x to 2.9x | 5,538 (18.1%) | 29,230 (59.6%) |
| 3.0x to 3.9x | 3,218 (10.5%) | 10,275 (20.9%) |
| 4.0x or more | 6,580 (21.5%) | 4,424 (9.0%) |
| Total | 30,622 (100.0%) | 49,045 (100.0%) |
Real Estate Taxes by Mortgage Status in Madison County
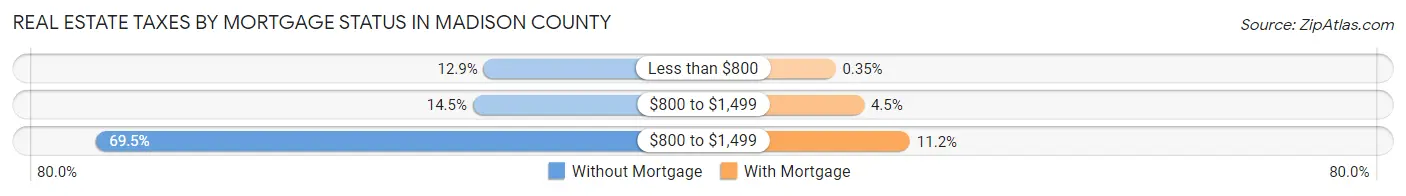
| Property Taxes | Without Mortgage | With Mortgage |
| Less than $800 | 3,962 (12.9%) | 170 (0.4%) |
| $800 to $1,499 | 4,444 (14.5%) | 2,216 (4.5%) |
| $800 to $1,499 | 21,284 (69.5%) | 5,506 (11.2%) |
| Total | 30,622 (100.0%) | 49,045 (100.0%) |
Health & Disability in Madison County
Health Insurance Coverage by Age in Madison County
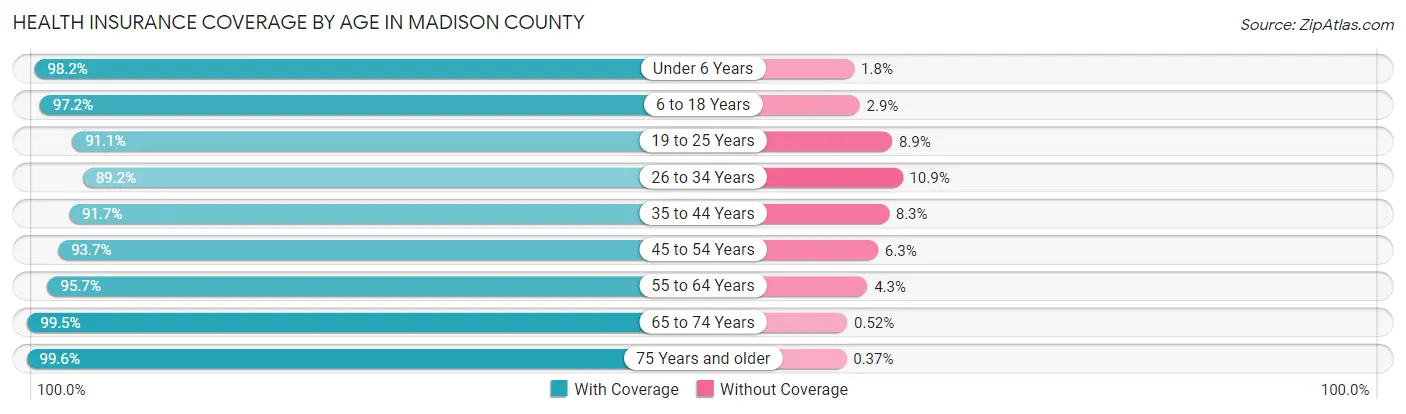
| Age Bracket | With Coverage | Without Coverage |
| Under 6 Years | 17,123 (98.2%) | 321 (1.8%) |
| 6 to 18 Years | 42,575 (97.2%) | 1,250 (2.9%) |
| 19 to 25 Years | 21,032 (91.1%) | 2,052 (8.9%) |
| 26 to 34 Years | 27,086 (89.1%) | 3,296 (10.8%) |
| 35 to 44 Years | 30,259 (91.7%) | 2,738 (8.3%) |
| 45 to 54 Years | 30,522 (93.7%) | 2,041 (6.3%) |
| 55 to 64 Years | 35,696 (95.7%) | 1,593 (4.3%) |
| 65 to 74 Years | 26,756 (99.5%) | 141 (0.5%) |
| 75 Years and older | 18,630 (99.6%) | 69 (0.4%) |
| Total | 249,679 (94.9%) | 13,501 (5.1%) |
Health Insurance Coverage by Citizenship Status in Madison County

| Citizenship Status | With Coverage | Without Coverage |
| Native Born | 17,123 (98.2%) | 321 (1.8%) |
| Foreign Born, Citizen | 42,575 (97.2%) | 1,250 (2.9%) |
| Foreign Born, not a Citizen | 21,032 (91.1%) | 2,052 (8.9%) |
Health Insurance Coverage by Household Income in Madison County
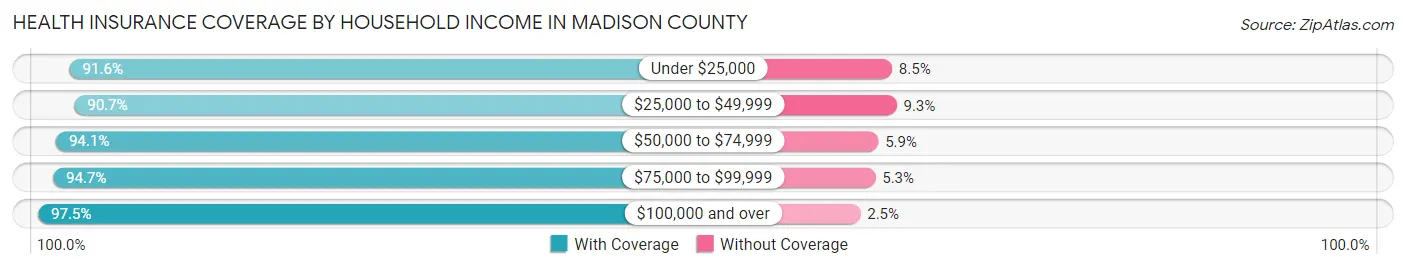
| Household Income | With Coverage | Without Coverage |
| Under $25,000 | 26,011 (91.5%) | 2,401 (8.5%) |
| $25,000 to $49,999 | 35,205 (90.7%) | 3,617 (9.3%) |
| $50,000 to $74,999 | 40,623 (94.1%) | 2,544 (5.9%) |
| $75,000 to $99,999 | 36,957 (94.7%) | 2,084 (5.3%) |
| $100,000 and over | 107,988 (97.5%) | 2,806 (2.5%) |
Public vs Private Health Insurance Coverage by Age in Madison County
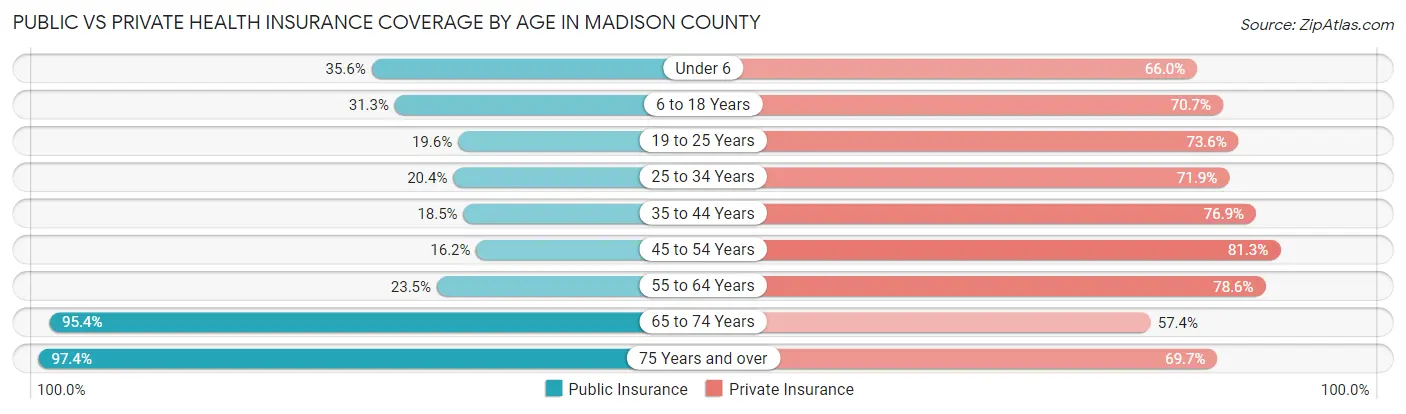
| Age Bracket | Public Insurance | Private Insurance |
| Under 6 | 6,210 (35.6%) | 11,505 (65.9%) |
| 6 to 18 Years | 13,715 (31.3%) | 30,994 (70.7%) |
| 19 to 25 Years | 4,516 (19.6%) | 16,999 (73.6%) |
| 25 to 34 Years | 6,209 (20.4%) | 21,842 (71.9%) |
| 35 to 44 Years | 6,117 (18.5%) | 25,361 (76.9%) |
| 45 to 54 Years | 5,260 (16.2%) | 26,483 (81.3%) |
| 55 to 64 Years | 8,754 (23.5%) | 29,314 (78.6%) |
| 65 to 74 Years | 25,671 (95.4%) | 15,429 (57.4%) |
| 75 Years and over | 18,212 (97.4%) | 13,031 (69.7%) |
| Total | 94,664 (36.0%) | 190,958 (72.6%) |
Disability Status by Sex by Age in Madison County
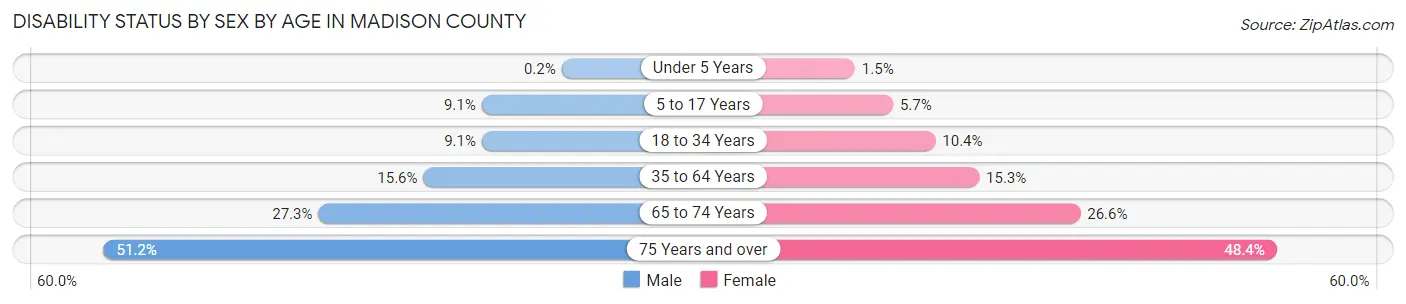
| Age Bracket | Male | Female |
| Under 5 Years | 15 (0.2%) | 101 (1.5%) |
| 5 to 17 Years | 1,987 (9.1%) | 1,181 (5.7%) |
| 18 to 34 Years | 2,616 (9.1%) | 3,033 (10.4%) |
| 35 to 64 Years | 7,954 (15.6%) | 7,927 (15.3%) |
| 65 to 74 Years | 3,419 (27.3%) | 3,817 (26.6%) |
| 75 Years and over | 3,810 (51.2%) | 5,451 (48.4%) |
Disability Class by Sex by Age in Madison County
Disability Class: Hearing Difficulty
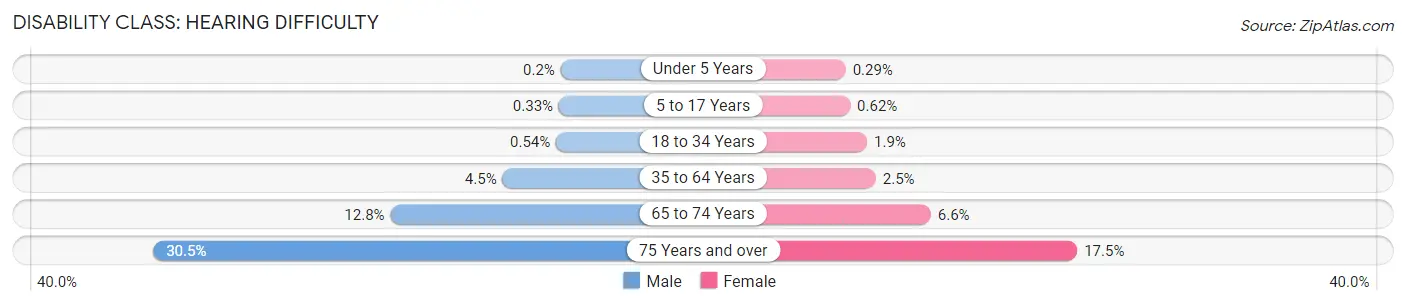
| Age Bracket | Male | Female |
| Under 5 Years | 15 (0.2%) | 20 (0.3%) |
| 5 to 17 Years | 73 (0.3%) | 129 (0.6%) |
| 18 to 34 Years | 156 (0.5%) | 546 (1.9%) |
| 35 to 64 Years | 2,305 (4.5%) | 1,311 (2.5%) |
| 65 to 74 Years | 1,608 (12.8%) | 950 (6.6%) |
| 75 Years and over | 2,266 (30.4%) | 1,968 (17.5%) |
Disability Class: Vision Difficulty
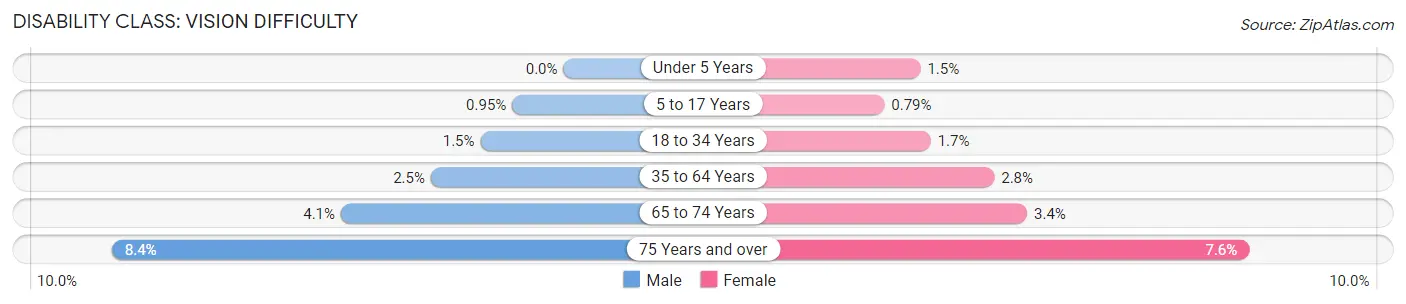
| Age Bracket | Male | Female |
| Under 5 Years | 0 (0.0%) | 101 (1.5%) |
| 5 to 17 Years | 208 (0.9%) | 164 (0.8%) |
| 18 to 34 Years | 445 (1.5%) | 479 (1.7%) |
| 35 to 64 Years | 1,255 (2.5%) | 1,467 (2.8%) |
| 65 to 74 Years | 517 (4.1%) | 495 (3.4%) |
| 75 Years and over | 624 (8.4%) | 851 (7.6%) |
Disability Class: Cognitive Difficulty
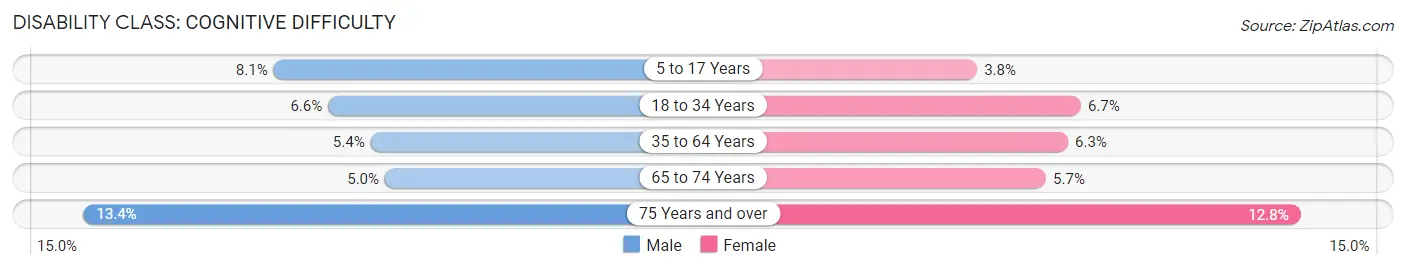
| Age Bracket | Male | Female |
| 5 to 17 Years | 1,761 (8.1%) | 782 (3.8%) |
| 18 to 34 Years | 1,888 (6.6%) | 1,938 (6.7%) |
| 35 to 64 Years | 2,738 (5.4%) | 3,263 (6.3%) |
| 65 to 74 Years | 622 (5.0%) | 818 (5.7%) |
| 75 Years and over | 994 (13.4%) | 1,438 (12.8%) |
Disability Class: Ambulatory Difficulty
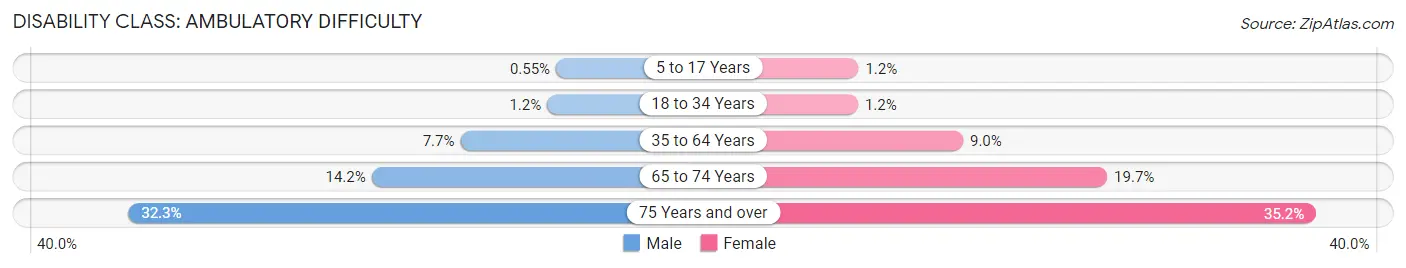
| Age Bracket | Male | Female |
| 5 to 17 Years | 119 (0.5%) | 258 (1.2%) |
| 18 to 34 Years | 348 (1.2%) | 349 (1.2%) |
| 35 to 64 Years | 3,905 (7.6%) | 4,663 (9.0%) |
| 65 to 74 Years | 1,784 (14.2%) | 2,831 (19.7%) |
| 75 Years and over | 2,404 (32.3%) | 3,964 (35.2%) |
Disability Class: Self-Care Difficulty
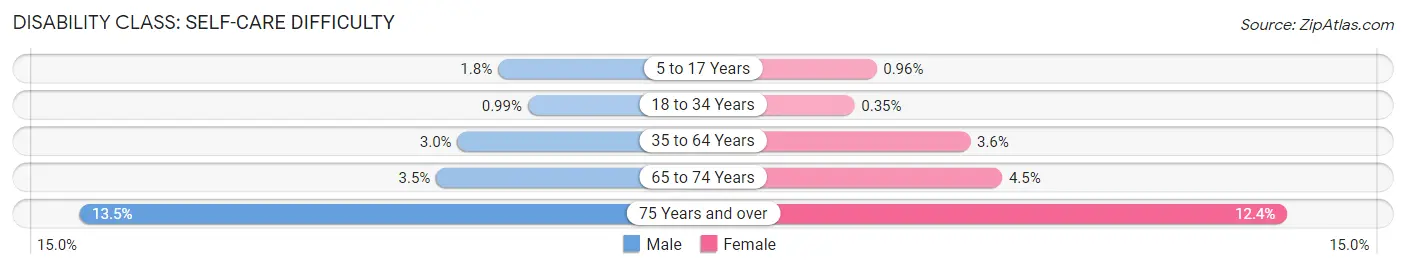
| Age Bracket | Male | Female |
| 5 to 17 Years | 397 (1.8%) | 200 (1.0%) |
| 18 to 34 Years | 286 (1.0%) | 102 (0.4%) |
| 35 to 64 Years | 1,507 (2.9%) | 1,851 (3.6%) |
| 65 to 74 Years | 444 (3.5%) | 641 (4.5%) |
| 75 Years and over | 1,003 (13.5%) | 1,396 (12.4%) |
Technology Access in Madison County
Computing Device Access in Madison County
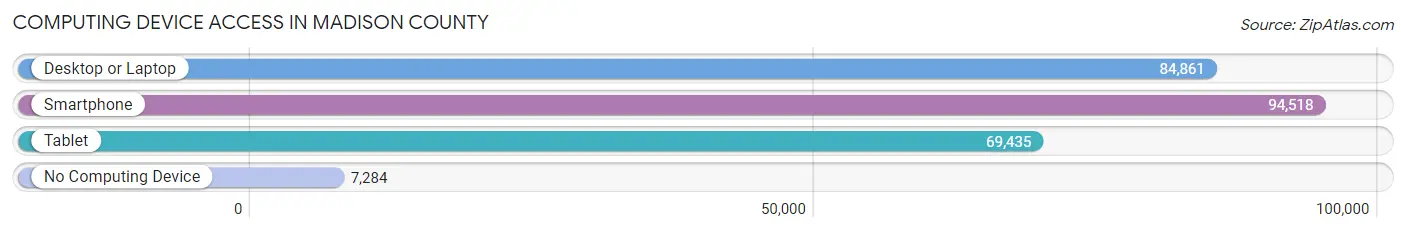
| Device Type | # Households | % Households |
| Desktop or Laptop | 84,861 | 77.9% |
| Smartphone | 94,518 | 86.8% |
| Tablet | 69,435 | 63.7% |
| No Computing Device | 7,284 | 6.7% |
| Total | 108,914 | 100.0% |
Internet Access in Madison County
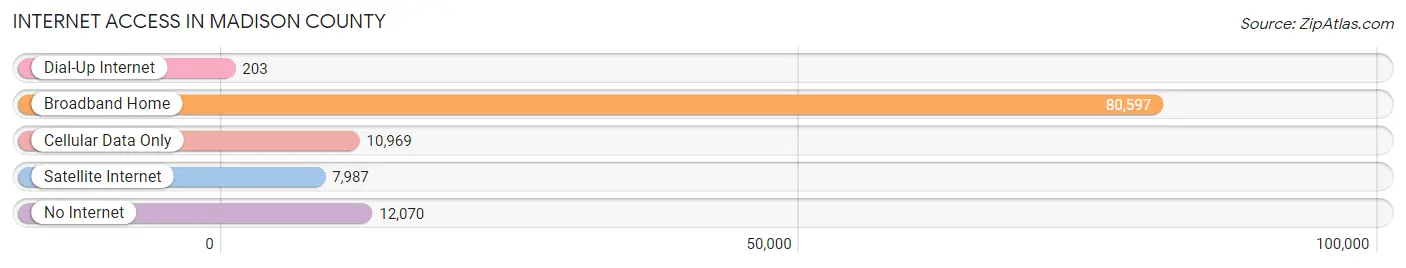
| Internet Type | # Households | % Households |
| Dial-Up Internet | 203 | 0.2% |
| Broadband Home | 80,597 | 74.0% |
| Cellular Data Only | 10,969 | 10.1% |
| Satellite Internet | 7,987 | 7.3% |
| No Internet | 12,070 | 11.1% |
| Total | 108,914 | 100.0% |
Madison County Summary
Madison County is located in the southwestern corner of Illinois, and is part of the St. Louis Metropolitan Statistical Area. It is bordered by the Mississippi River to the west, the Illinois River to the east, and the Missouri border to the south. The county seat is Edwardsville, and the largest city is Granite City. As of the 2010 census, the population was 269,282, making it the sixth-most populous county in Illinois.
History
Madison County was formed in 1812 from St. Clair County. It was named after James Madison, the fourth President of the United States. The county was initially divided into three townships: Edwardsville, Madison, and St. Jacob. The county was later divided into additional townships, including Alton, Collinsville, Godfrey, Granite City, Hamel, Highland, Marine, Moro, New Douglas, and Worden.
In the early 19th century, the county was home to a number of Native American tribes, including the Kickapoo, Potawatomi, and Sac and Fox. The first European settlers arrived in the area in the late 18th century, and the county was officially organized in 1812.
In the mid-19th century, the county was a major center of the abolitionist movement. The county was also home to a number of prominent abolitionists, including Elijah P. Lovejoy, who was killed in Alton in 1837 while defending his printing press from a pro-slavery mob.
Geography
Madison County covers an area of 817 square miles, making it the fourth-largest county in Illinois. The county is located in the southwestern corner of the state, and is bordered by the Mississippi River to the west, the Illinois River to the east, and the Missouri border to the south. The county is mostly flat, with some rolling hills in the northern and western parts of the county. The highest point in the county is located in the northern part of the county, near the town of Worden, and is 890 feet above sea level.
The county is home to a number of rivers and streams, including the Kaskaskia River, the Silver Creek, and the Cahokia Creek. The county is also home to a number of lakes, including Lake Lou Yaeger, Lake Kincaid, and Lake Le-Aqua-Na.
Economy
Madison County is home to a number of major industries, including manufacturing, healthcare, and education. The county is home to a number of major employers, including Olin Corporation, Anderson Hospital, and Southern Illinois University Edwardsville.
The county is also home to a number of smaller businesses, including restaurants, retail stores, and service providers. The county is home to a number of shopping centers, including the Alton Square Mall, the Edwardsville Crossing Shopping Center, and the Granite City Plaza Shopping Center.
Demographics
As of the 2010 census, the population of Madison County was 269,282. The racial makeup of the county was 87.3% White, 8.2% African American, 0.7% Native American, 1.2% Asian, 0.1% Pacific Islander, 1.2% from other races, and 1.5% from two or more races. Hispanic or Latino of any race were 3.3% of the population.
The median income for a household in the county was $50,867, and the median income for a family was $62,845. The per capita income for the county was $25,945. About 8.2% of families and 11.2% of the population were below the poverty line, including 15.2% of those under age 18 and 6.7% of those age 65 or over.
Common Questions
What is the Total Population of Madison County?
Total Population of Madison County is 265,512.
What is the Total Male Population of Madison County?
Total Male Population of Madison County is 130,136.
What is the Total Female Population of Madison County?
Total Female Population of Madison County is 135,376.
What is the Ratio of Males per 100 Females in Madison County?
There are 96.13 Males per 100 Females in Madison County.
What is the Ratio of Females per 100 Males in Madison County?
There are 104.03 Females per 100 Males in Madison County.
What is the Median Population Age in Madison County?
Median Population Age in Madison County is 39.9 Years.
What is the Average Family Size in Madison County
Average Family Size in Madison County is 3.0 People.
What is the Average Household Size in Madison County
Average Household Size in Madison County is 2.4 People.
What is Per Capita Income in Madison County?
Per Capita income in Madison County is $38,828.
What is the Median Family Income in Madison County?
Median Family Income in Madison County is $91,366.
What is the Median Household income in Madison County?
Median Household Income in Madison County is $71,759.
What is Income or Wage Gap in Madison County?
Income or Wage Gap in Madison County is 32.6%.
Women in Madison County earn 67.4 cents for every dollar earned by a man.
What is Family Income Deficit in Madison County?
Family Income Deficit in Madison County is $10,864.
Families that are below poverty line in Madison County earn $10,864 less on average than the poverty threshold level.
What is Inequality or Gini Index in Madison County?
Inequality or Gini Index in Madison County is 0.44.
How Large is the Labor Force in Madison County?
There are 136,668 People in the Labor Forcein in Madison County.
What is the Percentage of People in the Labor Force in Madison County?
63.4% of People are in the Labor Force in Madison County.
What is the Unemployment Rate in Madison County?
Unemployment Rate in Madison County is 5.2%.