Macon County, IL
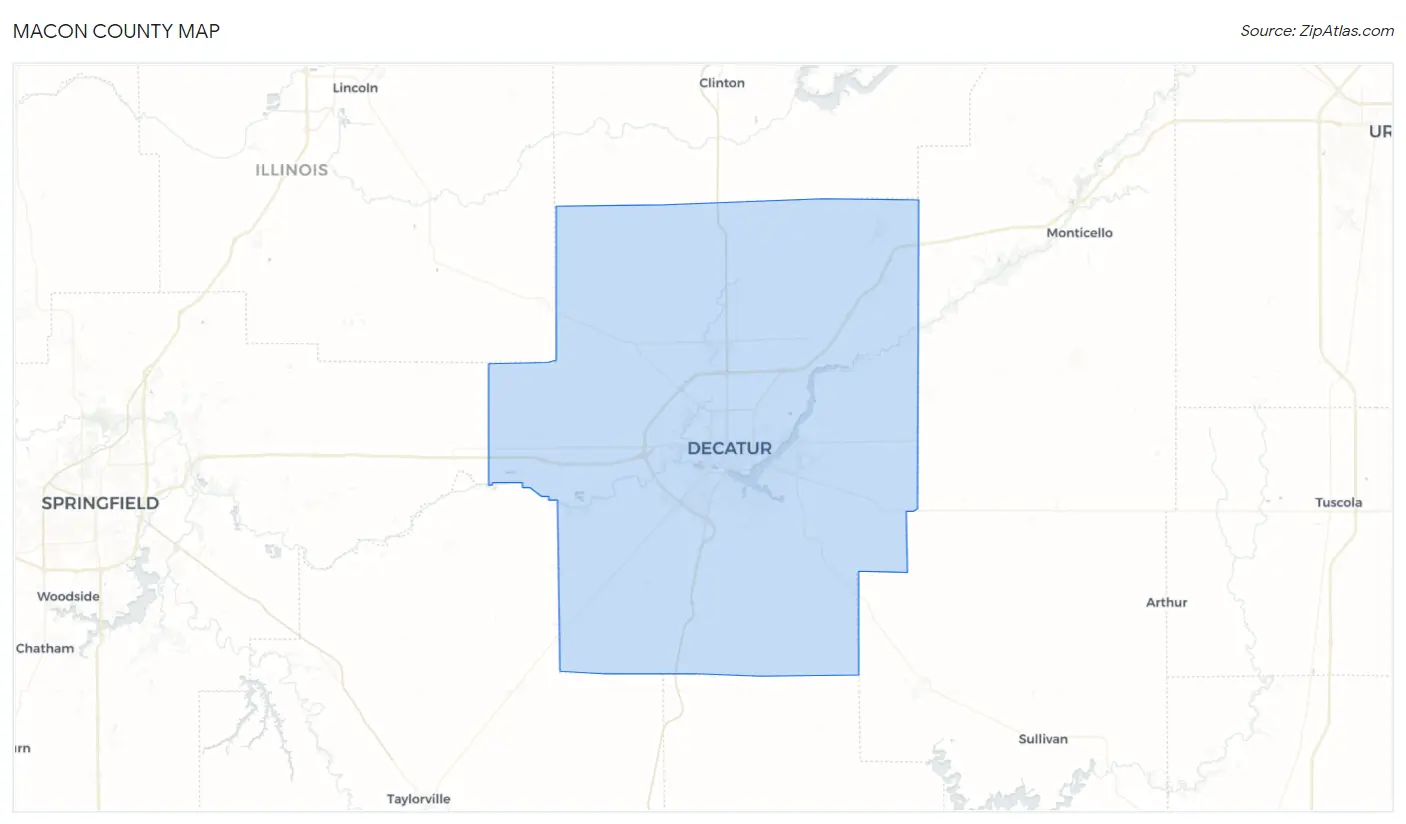
Macon County Map
Macon County Overview
103,542
TOTAL POPULATION
49,921
MALE POPULATION
53,621
FEMALE POPULATION
93.10
MALES / 100 FEMALES
107.41
FEMALES / 100 MALES
40.7
MEDIAN AGE
3.0
AVG FAMILY SIZE
2.3
AVG HOUSEHOLD SIZE
$34,644
PER CAPITA INCOME
$81,771
AVG FAMILY INCOME
$59,622
AVG HOUSEHOLD INCOME
30.4%
WAGE / INCOME GAP [ % ]
69.6¢/ $1
WAGE / INCOME GAP [ $ ]
$11,732
FAMILY INCOME DEFICIT
0.47
INEQUALITY / GINI INDEX
48,459
LABOR FORCE [ PEOPLE ]
58.5%
PERCENT IN LABOR FORCE
7.2%
UNEMPLOYMENT RATE
Macon County Area Codes
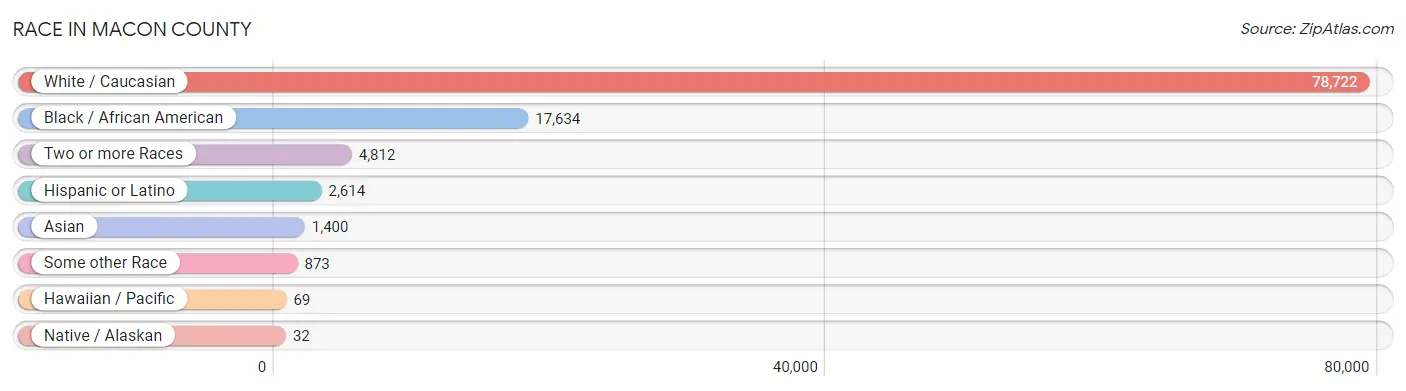
Race in Macon County
The most populous races in Macon County are White / Caucasian (78,722 | 76.0%), Black / African American (17,634 | 17.0%), and Two or more Races (4,812 | 4.6%).
| Race | # Population | % Population |
| Asian | 1,400 | 1.3% |
| Black / African American | 17,634 | 17.0% |
| Hawaiian / Pacific | 69 | 0.1% |
| Hispanic or Latino | 2,614 | 2.5% |
| Native / Alaskan | 32 | 0.0% |
| White / Caucasian | 78,722 | 76.0% |
| Two or more Races | 4,812 | 4.6% |
| Some other Race | 873 | 0.8% |
| Total | 103,542 | 100.0% |
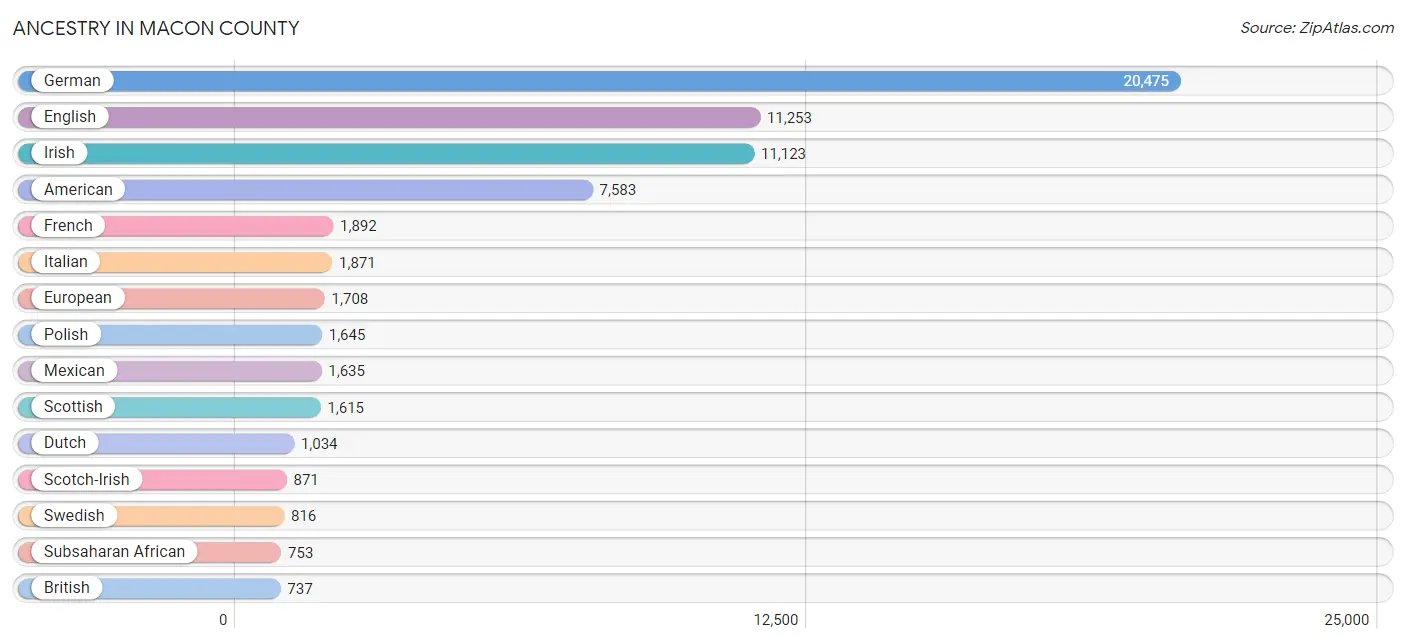
Ancestry in Macon County
The most populous ancestries reported in Macon County are German (20,475 | 19.8%), English (11,253 | 10.9%), Irish (11,123 | 10.7%), American (7,583 | 7.3%), and French (1,892 | 1.8%), together accounting for 50.5% of all Macon County residents.
| Ancestry | # Population | % Population |
| African | 431 | 0.4% |
| Albanian | 39 | 0.0% |
| American | 7,583 | 7.3% |
| Arab | 132 | 0.1% |
| Australian | 9 | 0.0% |
| Austrian | 125 | 0.1% |
| Belgian | 73 | 0.1% |
| Bhutanese | 42 | 0.0% |
| Blackfeet | 78 | 0.1% |
| Bolivian | 256 | 0.3% |
| Brazilian | 24 | 0.0% |
| British | 737 | 0.7% |
| Burmese | 174 | 0.2% |
| Canadian | 60 | 0.1% |
| Central American | 60 | 0.1% |
| Cherokee | 226 | 0.2% |
| Cheyenne | 4 | 0.0% |
| Chickasaw | 23 | 0.0% |
| Chilean | 38 | 0.0% |
| Chippewa | 4 | 0.0% |
| Choctaw | 67 | 0.1% |
| Colombian | 43 | 0.0% |
| Cree | 8 | 0.0% |
| Croatian | 52 | 0.1% |
| Cuban | 105 | 0.1% |
| Czech | 113 | 0.1% |
| Czechoslovakian | 54 | 0.1% |
| Danish | 176 | 0.2% |
| Dominican | 12 | 0.0% |
| Dutch | 1,034 | 1.0% |
| Eastern European | 224 | 0.2% |
| Ecuadorian | 15 | 0.0% |
| English | 11,253 | 10.9% |
| European | 1,708 | 1.7% |
| Finnish | 28 | 0.0% |
| French | 1,892 | 1.8% |
| French Canadian | 96 | 0.1% |
| German | 20,475 | 19.8% |
| Ghanaian | 5 | 0.0% |
| Greek | 228 | 0.2% |
| Guamanian / Chamorro | 101 | 0.1% |
| Guatemalan | 53 | 0.1% |
| Hungarian | 198 | 0.2% |
| Indian (Asian) | 171 | 0.2% |
| Inupiat | 2 | 0.0% |
| Irish | 11,123 | 10.7% |
| Iroquois | 5 | 0.0% |
| Israeli | 3 | 0.0% |
| Italian | 1,871 | 1.8% |
| Jordanian | 4 | 0.0% |
| Korean | 449 | 0.4% |
| Laotian | 15 | 0.0% |
| Latvian | 87 | 0.1% |
| Lebanese | 70 | 0.1% |
| Lithuanian | 116 | 0.1% |
| Menominee | 49 | 0.1% |
| Mexican | 1,635 | 1.6% |
| Mexican American Indian | 22 | 0.0% |
| Moroccan | 8 | 0.0% |
| Native Hawaiian | 25 | 0.0% |
| Navajo | 18 | 0.0% |
| New Zealander | 6 | 0.0% |
| Nigerian | 132 | 0.1% |
| Northern European | 70 | 0.1% |
| Norwegian | 707 | 0.7% |
| Paiute | 3 | 0.0% |
| Pakistani | 68 | 0.1% |
| Pennsylvania German | 146 | 0.1% |
| Polish | 1,645 | 1.6% |
| Portuguese | 54 | 0.1% |
| Puerto Rican | 233 | 0.2% |
| Romanian | 56 | 0.1% |
| Russian | 167 | 0.2% |
| Salvadoran | 7 | 0.0% |
| Scandinavian | 261 | 0.3% |
| Scotch-Irish | 871 | 0.8% |
| Scottish | 1,615 | 1.6% |
| Serbian | 34 | 0.0% |
| Sioux | 5 | 0.0% |
| Slavic | 44 | 0.0% |
| Slovak | 117 | 0.1% |
| Slovene | 20 | 0.0% |
| Somali | 14 | 0.0% |
| South American | 405 | 0.4% |
| Spaniard | 31 | 0.0% |
| Spanish | 66 | 0.1% |
| Sri Lankan | 244 | 0.2% |
| Subsaharan African | 753 | 0.7% |
| Swedish | 816 | 0.8% |
| Swiss | 181 | 0.2% |
| Thai | 355 | 0.3% |
| Turkish | 34 | 0.0% |
| Ugandan | 1 | 0.0% |
| Ukrainian | 37 | 0.0% |
| Uruguayan | 11 | 0.0% |
| Venezuelan | 42 | 0.0% |
| Welsh | 545 | 0.5% |
| Yaqui | 9 | 0.0% |
| Yugoslavian | 12 | 0.0% |
| Zimbabwean | 80 | 0.1% | View All 100 Rows |
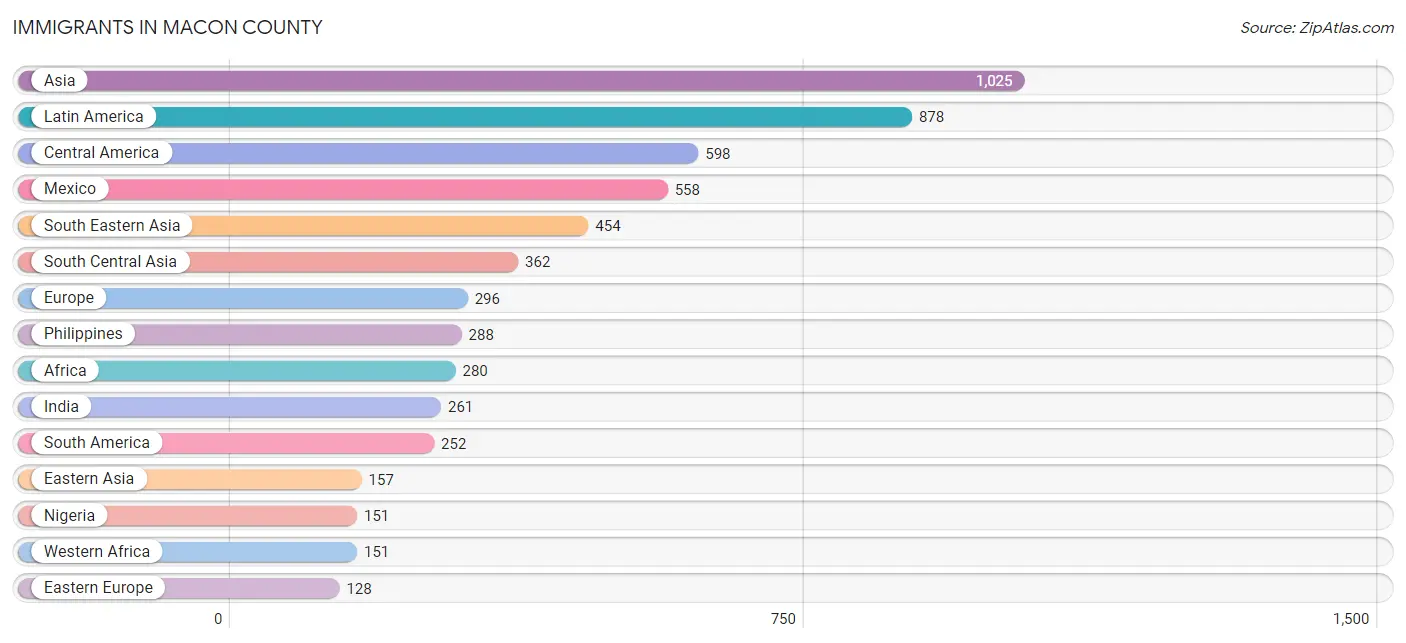
Immigrants in Macon County
The most numerous immigrant groups reported in Macon County came from Asia (1,025 | 1.0%), Latin America (878 | 0.9%), Central America (598 | 0.6%), Mexico (558 | 0.5%), and South Eastern Asia (454 | 0.4%), together accounting for 3.4% of all Macon County residents.
| Immigration Origin | # Population | % Population |
| Africa | 280 | 0.3% |
| Asia | 1,025 | 1.0% |
| Austria | 6 | 0.0% |
| Bolivia | 118 | 0.1% |
| Brazil | 50 | 0.1% |
| Canada | 86 | 0.1% |
| Caribbean | 28 | 0.0% |
| Central America | 598 | 0.6% |
| Chile | 13 | 0.0% |
| China | 114 | 0.1% |
| Colombia | 34 | 0.0% |
| Croatia | 8 | 0.0% |
| Cuba | 22 | 0.0% |
| Dominican Republic | 6 | 0.0% |
| Eastern Africa | 121 | 0.1% |
| Eastern Asia | 157 | 0.2% |
| Eastern Europe | 128 | 0.1% |
| El Salvador | 7 | 0.0% |
| England | 24 | 0.0% |
| Europe | 296 | 0.3% |
| Germany | 54 | 0.1% |
| Greece | 12 | 0.0% |
| Guatemala | 33 | 0.0% |
| Hong Kong | 13 | 0.0% |
| India | 261 | 0.3% |
| Indonesia | 15 | 0.0% |
| Israel | 15 | 0.0% |
| Italy | 6 | 0.0% |
| Japan | 23 | 0.0% |
| Korea | 20 | 0.0% |
| Latin America | 878 | 0.9% |
| Lebanon | 3 | 0.0% |
| Malaysia | 10 | 0.0% |
| Mexico | 558 | 0.5% |
| Morocco | 8 | 0.0% |
| Netherlands | 51 | 0.1% |
| Nigeria | 151 | 0.2% |
| North Macedonia | 49 | 0.1% |
| Northern Africa | 8 | 0.0% |
| Northern Europe | 39 | 0.0% |
| Oceania | 16 | 0.0% |
| Pakistan | 91 | 0.1% |
| Philippines | 288 | 0.3% |
| Poland | 8 | 0.0% |
| Romania | 21 | 0.0% |
| Russia | 11 | 0.0% |
| Scotland | 8 | 0.0% |
| Serbia | 17 | 0.0% |
| Somalia | 49 | 0.1% |
| South America | 252 | 0.2% |
| South Central Asia | 362 | 0.4% |
| South Eastern Asia | 454 | 0.4% |
| Southern Europe | 18 | 0.0% |
| Sri Lanka | 10 | 0.0% |
| Thailand | 24 | 0.0% |
| Uganda | 1 | 0.0% |
| Ukraine | 14 | 0.0% |
| Uruguay | 11 | 0.0% |
| Venezuela | 26 | 0.0% |
| Vietnam | 117 | 0.1% |
| Western Africa | 151 | 0.2% |
| Western Asia | 26 | 0.0% |
| Western Europe | 111 | 0.1% |
| Zimbabwe | 36 | 0.0% | View All 64 Rows |
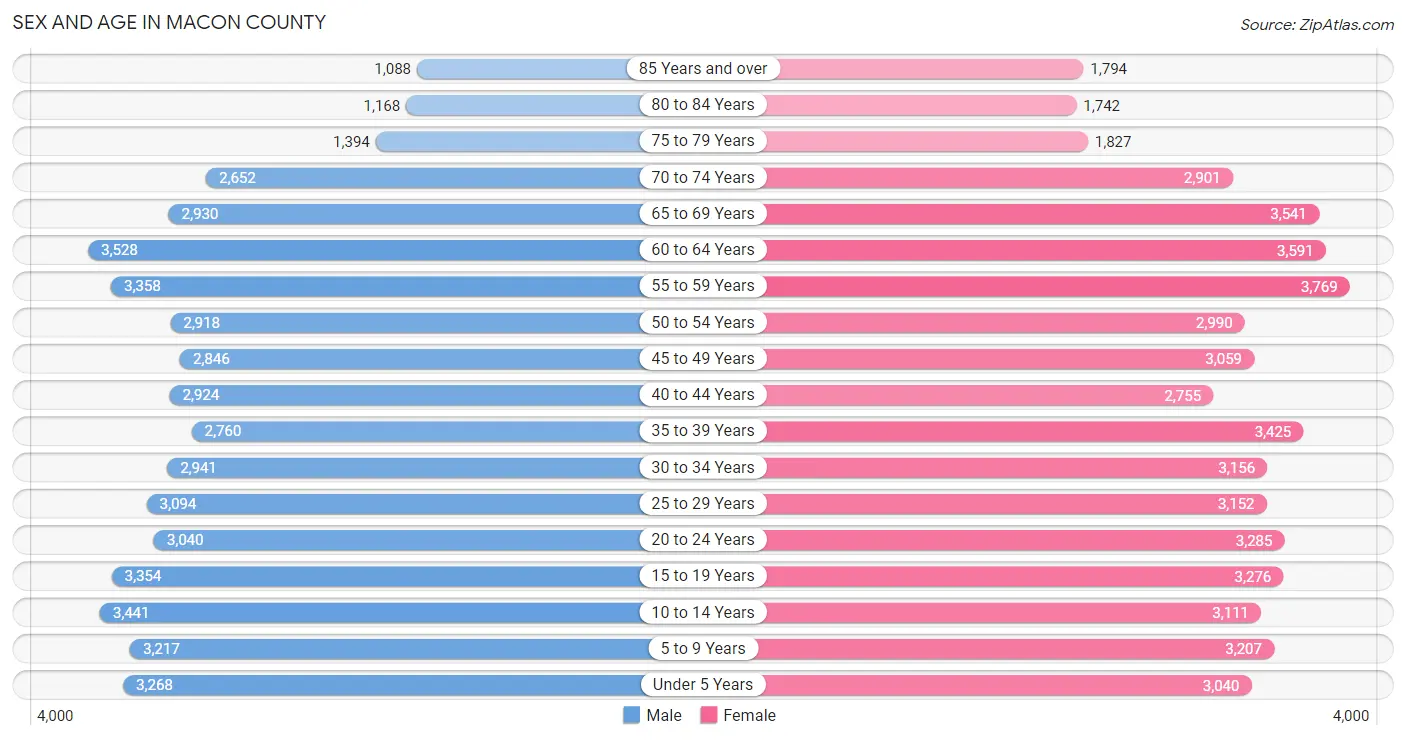
Sex and Age in Macon County
Sex and Age in Macon County
The most populous age groups in Macon County are 60 to 64 Years (3,528 | 7.1%) for men and 55 to 59 Years (3,769 | 7.0%) for women.
| Age Bracket | Male | Female |
| Under 5 Years | 3,268 (6.6%) | 3,040 (5.7%) |
| 5 to 9 Years | 3,217 (6.4%) | 3,207 (6.0%) |
| 10 to 14 Years | 3,441 (6.9%) | 3,111 (5.8%) |
| 15 to 19 Years | 3,354 (6.7%) | 3,276 (6.1%) |
| 20 to 24 Years | 3,040 (6.1%) | 3,285 (6.1%) |
| 25 to 29 Years | 3,094 (6.2%) | 3,152 (5.9%) |
| 30 to 34 Years | 2,941 (5.9%) | 3,156 (5.9%) |
| 35 to 39 Years | 2,760 (5.5%) | 3,425 (6.4%) |
| 40 to 44 Years | 2,924 (5.9%) | 2,755 (5.1%) |
| 45 to 49 Years | 2,846 (5.7%) | 3,059 (5.7%) |
| 50 to 54 Years | 2,918 (5.9%) | 2,990 (5.6%) |
| 55 to 59 Years | 3,358 (6.7%) | 3,769 (7.0%) |
| 60 to 64 Years | 3,528 (7.1%) | 3,591 (6.7%) |
| 65 to 69 Years | 2,930 (5.9%) | 3,541 (6.6%) |
| 70 to 74 Years | 2,652 (5.3%) | 2,901 (5.4%) |
| 75 to 79 Years | 1,394 (2.8%) | 1,827 (3.4%) |
| 80 to 84 Years | 1,168 (2.3%) | 1,742 (3.3%) |
| 85 Years and over | 1,088 (2.2%) | 1,794 (3.4%) |
| Total | 49,921 (100.0%) | 53,621 (100.0%) |
Families and Households in Macon County
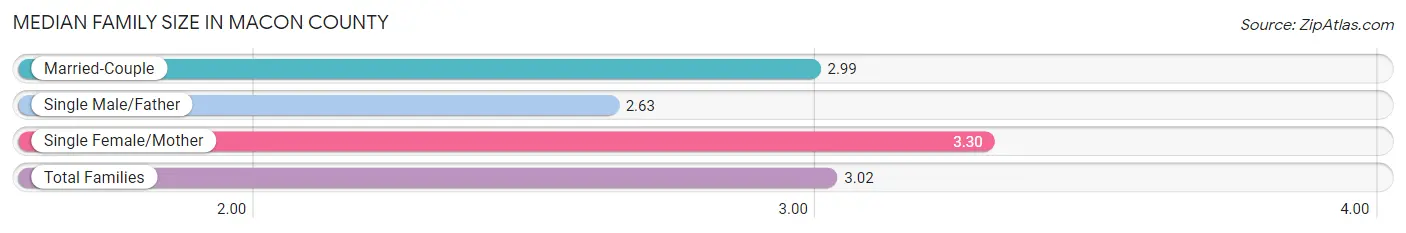
Median Family Size in Macon County
The median family size in Macon County is 3.02 persons per family, with single female/mother families (4,607 | 17.9%) accounting for the largest median family size of 3.3 persons per family. On the other hand, single male/father families (1,670 | 6.5%) represent the smallest median family size with 2.63 persons per family.
| Family Type | # Families | Family Size |
| Married-Couple | 19,409 (75.6%) | 2.99 |
| Single Male/Father | 1,670 (6.5%) | 2.63 |
| Single Female/Mother | 4,607 (17.9%) | 3.30 |
| Total Families | 25,686 (100.0%) | 3.02 |
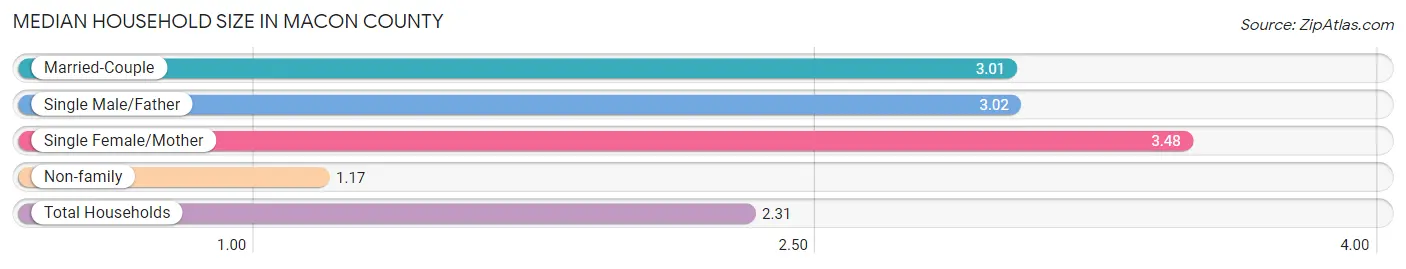
Median Household Size in Macon County
The median household size in Macon County is 2.31 persons per household, with single female/mother households (4,607 | 10.6%) accounting for the largest median household size of 3.48 persons per household. non-family households (17,676 | 40.8%) represent the smallest median household size with 1.17 persons per household.
| Household Type | # Households | Household Size |
| Married-Couple | 19,409 (44.8%) | 3.01 |
| Single Male/Father | 1,670 (3.8%) | 3.02 |
| Single Female/Mother | 4,607 (10.6%) | 3.48 |
| Non-family | 17,676 (40.8%) | 1.17 |
| Total Households | 43,362 (100.0%) | 2.31 |
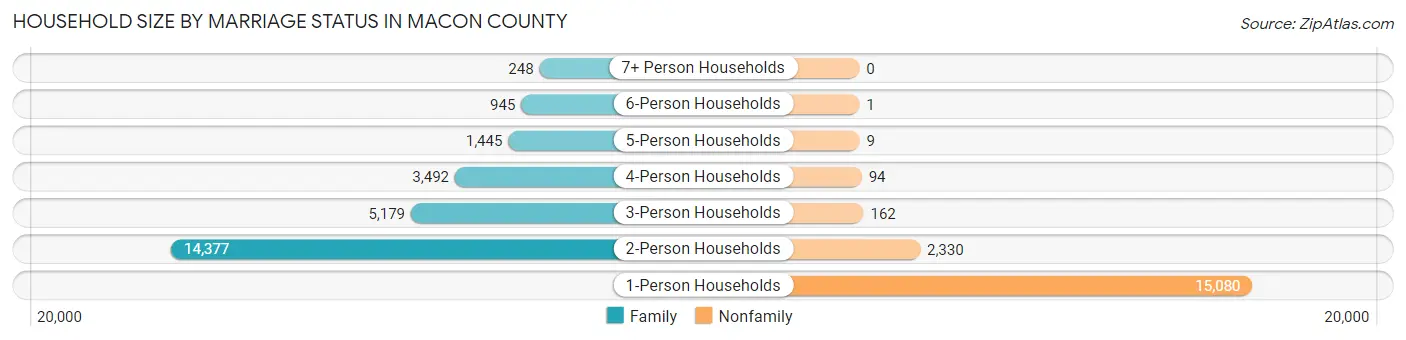
Household Size by Marriage Status in Macon County
Out of a total of 43,362 households in Macon County, 25,686 (59.2%) are family households, while 17,676 (40.8%) are nonfamily households. The most numerous type of family households are 2-person households, comprising 14,377, and the most common type of nonfamily households are 1-person households, comprising 15,080.
| Household Size | Family Households | Nonfamily Households |
| 1-Person Households | - | 15,080 (34.8%) |
| 2-Person Households | 14,377 (33.2%) | 2,330 (5.4%) |
| 3-Person Households | 5,179 (11.9%) | 162 (0.4%) |
| 4-Person Households | 3,492 (8.1%) | 94 (0.2%) |
| 5-Person Households | 1,445 (3.3%) | 9 (0.0%) |
| 6-Person Households | 945 (2.2%) | 1 (0.0%) |
| 7+ Person Households | 248 (0.6%) | 0 (0.0%) |
| Total | 25,686 (59.2%) | 17,676 (40.8%) |
Female Fertility in Macon County
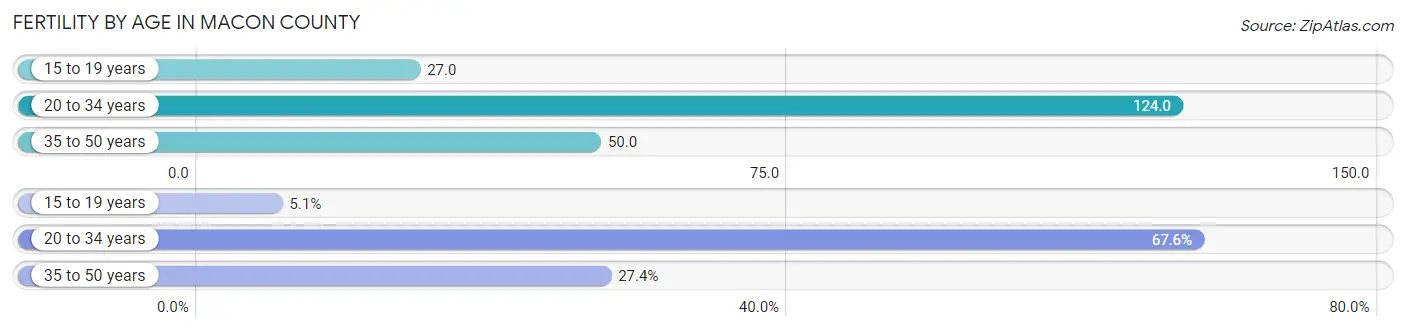
Fertility by Age in Macon County
Average fertility rate in Macon County is 78.0 births per 1,000 women. Women in the age bracket of 20 to 34 years have the highest fertility rate with 124.0 births per 1,000 women. Women in the age bracket of 20 to 34 years acount for 67.6% of all women with births.
| Age Bracket | Women with Births | Births / 1,000 Women |
| 15 to 19 years | 89 (5.1%) | 27.0 |
| 20 to 34 years | 1,188 (67.6%) | 124.0 |
| 35 to 50 years | 481 (27.4%) | 50.0 |
| Total | 1,758 (100.0%) | 78.0 |
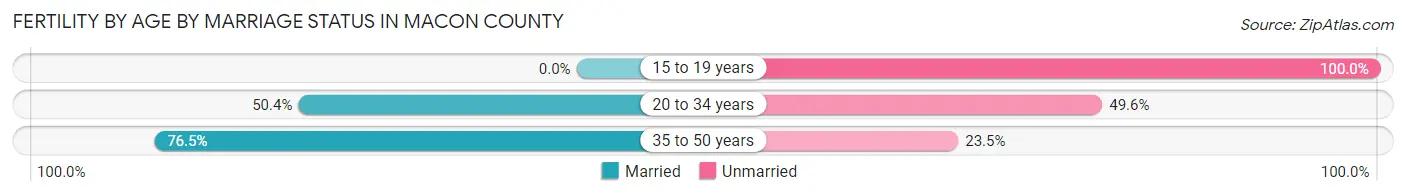
Fertility by Age by Marriage Status in Macon County
55.0% of women with births (1,758) in Macon County are married. The highest percentage of unmarried women with births falls into 15 to 19 years age bracket with 100.0% of them unmarried at the time of birth, while the lowest percentage of unmarried women with births belong to 35 to 50 years age bracket with 23.5% of them unmarried.
| Age Bracket | Married | Unmarried |
| 15 to 19 years | 0 (0.0%) | 89 (100.0%) |
| 20 to 34 years | 599 (50.4%) | 589 (49.6%) |
| 35 to 50 years | 368 (76.5%) | 113 (23.5%) |
| Total | 967 (55.0%) | 791 (45.0%) |
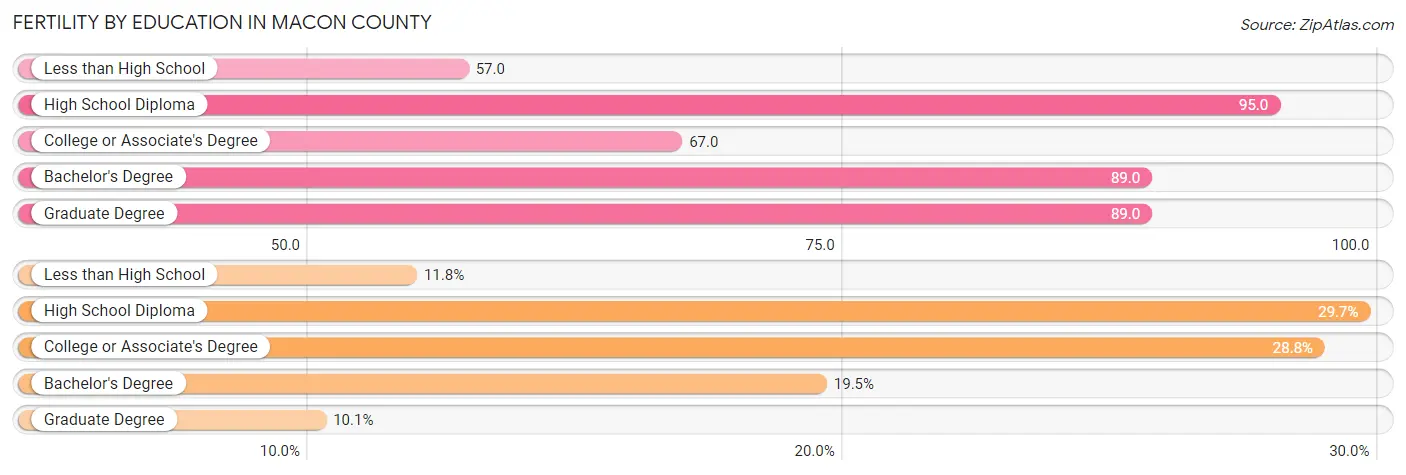
Fertility by Education in Macon County
Average fertility rate in Macon County is 78.0 births per 1,000 women. Women with the education attainment of high school diploma have the highest fertility rate of 95.0 births per 1,000 women, while women with the education attainment of less than high school have the lowest fertility at 57.0 births per 1,000 women. Women with the education attainment of high school diploma represent 29.7% of all women with births.
| Educational Attainment | Women with Births | Births / 1,000 Women |
| Less than High School | 208 (11.8%) | 57.0 |
| High School Diploma | 522 (29.7%) | 95.0 |
| College or Associate's Degree | 507 (28.8%) | 67.0 |
| Bachelor's Degree | 343 (19.5%) | 89.0 |
| Graduate Degree | 178 (10.1%) | 89.0 |
| Total | 1,758 (100.0%) | 78.0 |
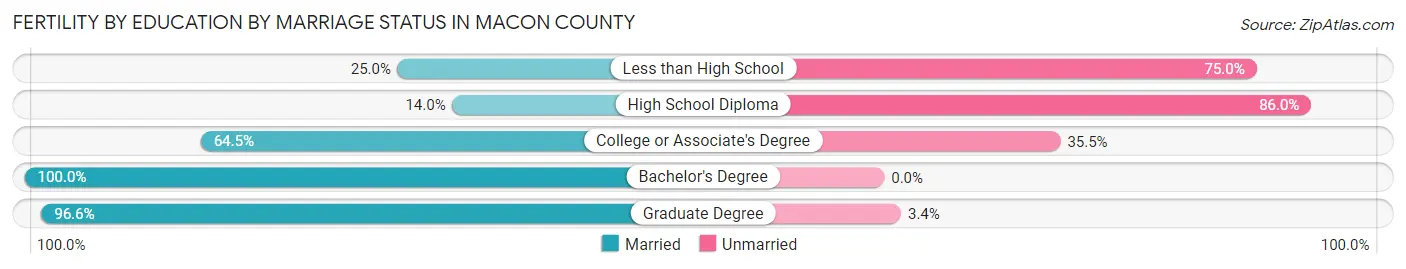
Fertility by Education by Marriage Status in Macon County
45.0% of women with births in Macon County are unmarried. Women with the educational attainment of bachelor's degree are most likely to be married with 100.0% of them married at childbirth, while women with the educational attainment of high school diploma are least likely to be married with 86.0% of them unmarried at childbirth.
| Educational Attainment | Married | Unmarried |
| Less than High School | 52 (25.0%) | 156 (75.0%) |
| High School Diploma | 73 (14.0%) | 449 (86.0%) |
| College or Associate's Degree | 327 (64.5%) | 180 (35.5%) |
| Bachelor's Degree | 343 (100.0%) | 0 (0.0%) |
| Graduate Degree | 172 (96.6%) | 6 (3.4%) |
| Total | 967 (55.0%) | 791 (45.0%) |
Income in Macon County
Income Overview in Macon County
Per Capita Income in Macon County is $34,644, while median incomes of families and households are $81,771 and $59,622 respectively.
| Characteristic | Number | Measure |
| Per Capita Income | 103,542 | $34,644 |
| Median Family Income | 25,686 | $81,771 |
| Mean Family Income | 25,686 | $101,009 |
| Median Household Income | 43,362 | $59,622 |
| Mean Household Income | 43,362 | $81,114 |
| Income Deficit | 25,686 | $11,732 |
| Wage / Income Gap (%) | 103,542 | 30.45% |
| Wage / Income Gap ($) | 103,542 | 69.55¢ per $1 |
| Gini / Inequality Index | 103,542 | 0.47 |
Earnings by Sex in Macon County
Average Earnings in Macon County are $39,428, $47,054 for men and $32,727 for women, a difference of 30.4%.
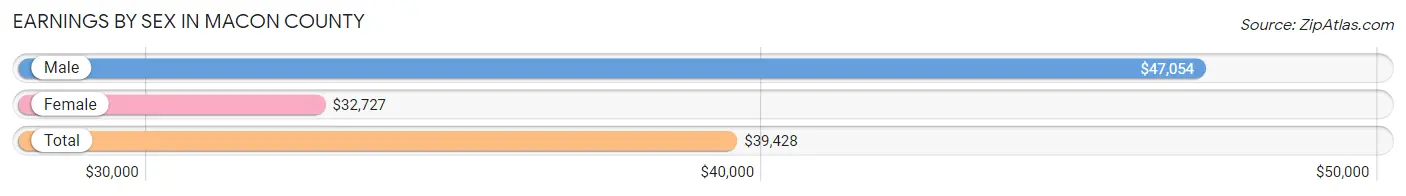
| Sex | Number | Average Earnings |
| Male | 25,266 (50.6%) | $47,054 |
| Female | 24,699 (49.4%) | $32,727 |
| Total | 49,965 (100.0%) | $39,428 |
Earnings by Sex by Income Bracket in Macon County
The most common earnings brackets in Macon County are $100,000+ for men (3,315 | 13.1%) and $25,000 to $29,999 for women (2,120 | 8.6%).
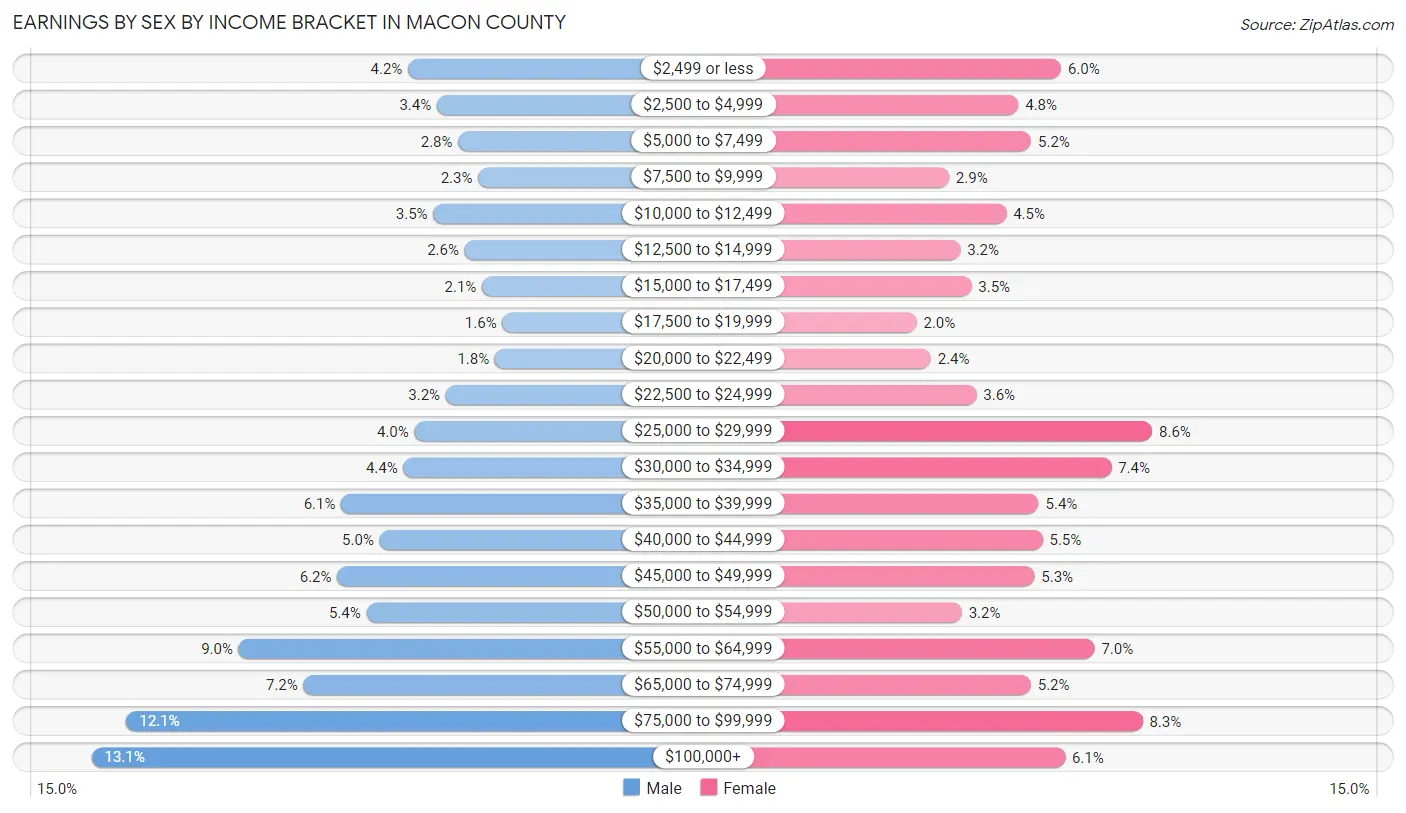
| Income | Male | Female |
| $2,499 or less | 1,067 (4.2%) | 1,486 (6.0%) |
| $2,500 to $4,999 | 862 (3.4%) | 1,190 (4.8%) |
| $5,000 to $7,499 | 710 (2.8%) | 1,279 (5.2%) |
| $7,500 to $9,999 | 569 (2.2%) | 710 (2.9%) |
| $10,000 to $12,499 | 886 (3.5%) | 1,107 (4.5%) |
| $12,500 to $14,999 | 664 (2.6%) | 788 (3.2%) |
| $15,000 to $17,499 | 540 (2.1%) | 865 (3.5%) |
| $17,500 to $19,999 | 396 (1.6%) | 485 (2.0%) |
| $20,000 to $22,499 | 450 (1.8%) | 583 (2.4%) |
| $22,500 to $24,999 | 798 (3.2%) | 898 (3.6%) |
| $25,000 to $29,999 | 1,020 (4.0%) | 2,120 (8.6%) |
| $30,000 to $34,999 | 1,100 (4.3%) | 1,834 (7.4%) |
| $35,000 to $39,999 | 1,542 (6.1%) | 1,331 (5.4%) |
| $40,000 to $44,999 | 1,269 (5.0%) | 1,359 (5.5%) |
| $45,000 to $49,999 | 1,570 (6.2%) | 1,301 (5.3%) |
| $50,000 to $54,999 | 1,362 (5.4%) | 797 (3.2%) |
| $55,000 to $64,999 | 2,270 (9.0%) | 1,720 (7.0%) |
| $65,000 to $74,999 | 1,809 (7.2%) | 1,278 (5.2%) |
| $75,000 to $99,999 | 3,067 (12.1%) | 2,053 (8.3%) |
| $100,000+ | 3,315 (13.1%) | 1,515 (6.1%) |
| Total | 25,266 (100.0%) | 24,699 (100.0%) |
Earnings by Sex by Educational Attainment in Macon County
Average earnings in Macon County are $52,633 for men and $36,969 for women, a difference of 29.8%. Men with an educational attainment of graduate degree enjoy the highest average annual earnings of $103,357, while those with less than high school education earn the least with $31,330. Women with an educational attainment of graduate degree earn the most with the average annual earnings of $71,055, while those with less than high school education have the smallest earnings of $21,300.

| Educational Attainment | Male Income | Female Income |
| Less than High School | $31,330 | $21,300 |
| High School Diploma | $48,172 | $29,258 |
| College or Associate's Degree | $52,974 | $34,901 |
| Bachelor's Degree | $64,265 | $47,149 |
| Graduate Degree | $103,357 | $71,055 |
| Total | $52,633 | $36,969 |
Family Income in Macon County
Family Income Brackets in Macon County
According to the Macon County family income data, there are 5,522 families falling into the $100,000 to $149,999 income range, which is the most common income bracket and makes up 21.5% of all families. Conversely, the $10,000 to $14,999 income bracket is the least frequent group with only 565 families (2.2%) belonging to this category.
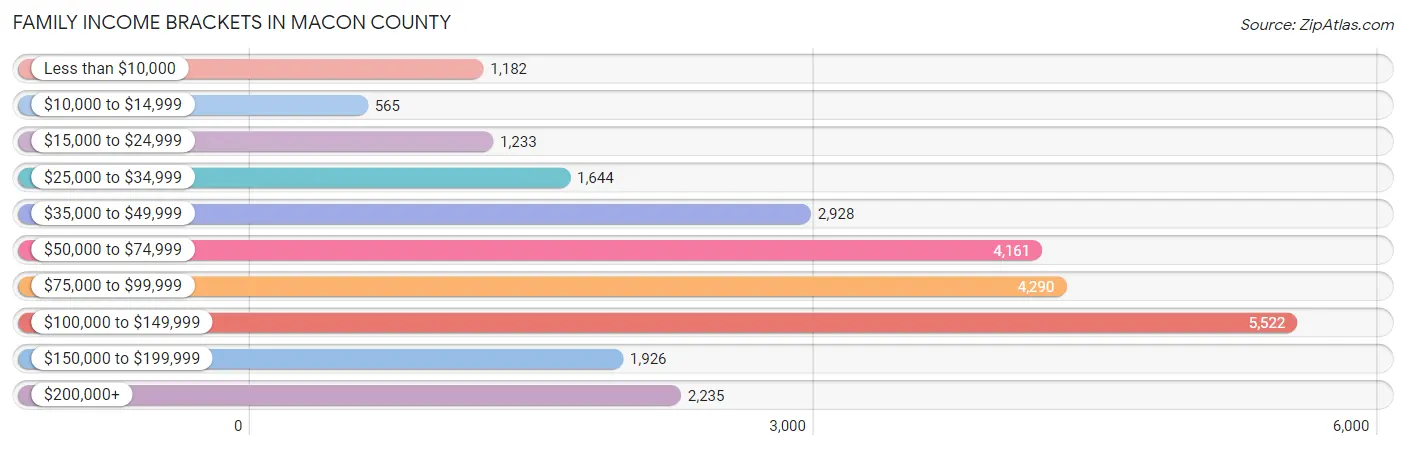
| Income Bracket | # Families | % Families |
| Less than $10,000 | 1,182 | 4.6% |
| $10,000 to $14,999 | 565 | 2.2% |
| $15,000 to $24,999 | 1,233 | 4.8% |
| $25,000 to $34,999 | 1,644 | 6.4% |
| $35,000 to $49,999 | 2,928 | 11.4% |
| $50,000 to $74,999 | 4,161 | 16.2% |
| $75,000 to $99,999 | 4,290 | 16.7% |
| $100,000 to $149,999 | 5,522 | 21.5% |
| $150,000 to $199,999 | 1,926 | 7.5% |
| $200,000+ | 2,235 | 8.7% |
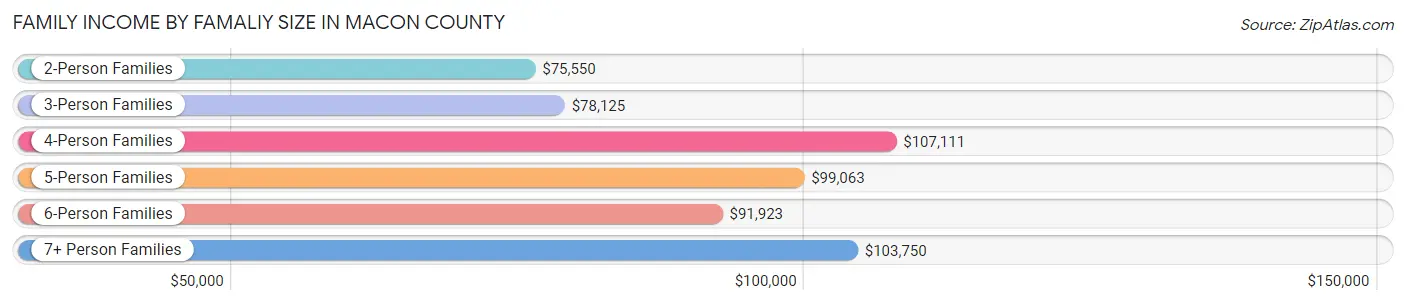
Family Income by Famaliy Size in Macon County
4-person families (3,161 | 12.3%) account for the highest median family income in Macon County with $107,111 per family, while 2-person families (15,096 | 58.8%) have the highest median income of $37,775 per family member.
| Income Bracket | # Families | Median Income |
| 2-Person Families | 15,096 (58.8%) | $75,550 |
| 3-Person Families | 4,953 (19.3%) | $78,125 |
| 4-Person Families | 3,161 (12.3%) | $107,111 |
| 5-Person Families | 1,432 (5.6%) | $99,063 |
| 6-Person Families | 846 (3.3%) | $91,923 |
| 7+ Person Families | 198 (0.8%) | $103,750 |
| Total | 25,686 (100.0%) | $81,771 |
Family Income by Number of Earners in Macon County
The median family income in Macon County is $81,771, with families comprising 3+ earners (1,576) having the highest median family income of $121,667, while families with no earners (5,163) have the lowest median family income of $49,809, accounting for 6.1% and 20.1% of families, respectively.
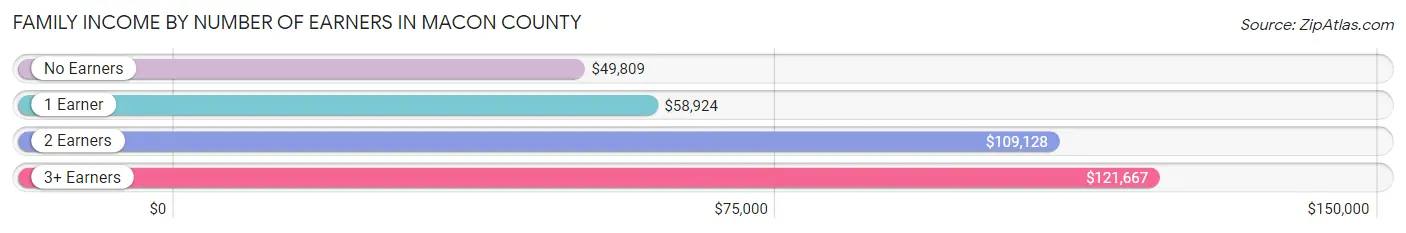
| Number of Earners | # Families | Median Income |
| No Earners | 5,163 (20.1%) | $49,809 |
| 1 Earner | 8,478 (33.0%) | $58,924 |
| 2 Earners | 10,469 (40.8%) | $109,128 |
| 3+ Earners | 1,576 (6.1%) | $121,667 |
| Total | 25,686 (100.0%) | $81,771 |
Household Income in Macon County
Household Income Brackets in Macon County
With 7,241 households falling in the category, the $50,000 to $74,999 income range is the most frequent in Macon County, accounting for 16.7% of all households. In contrast, only 1,995 households (4.6%) fall into the $10,000 to $14,999 income bracket, making it the least populous group.
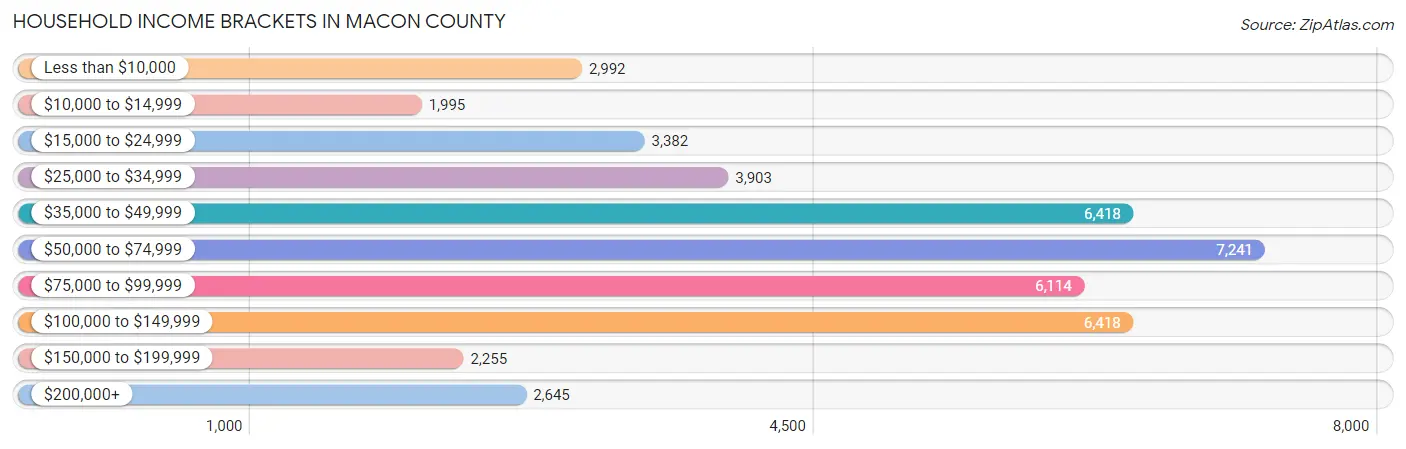
| Income Bracket | # Households | % Households |
| Less than $10,000 | 2,992 | 6.9% |
| $10,000 to $14,999 | 1,995 | 4.6% |
| $15,000 to $24,999 | 3,382 | 7.8% |
| $25,000 to $34,999 | 3,903 | 9.0% |
| $35,000 to $49,999 | 6,418 | 14.8% |
| $50,000 to $74,999 | 7,241 | 16.7% |
| $75,000 to $99,999 | 6,114 | 14.1% |
| $100,000 to $149,999 | 6,418 | 14.8% |
| $150,000 to $199,999 | 2,255 | 5.2% |
| $200,000+ | 2,645 | 6.1% |
Household Income by Householder Age in Macon County
The median household income in Macon County is $59,622, with the highest median household income of $73,264 found in the 45 to 64 years age bracket for the primary householder. A total of 15,048 households (34.7%) fall into this category. Meanwhile, the 15 to 24 years age bracket for the primary householder has the lowest median household income of $31,307, with 1,938 households (4.5%) in this group.
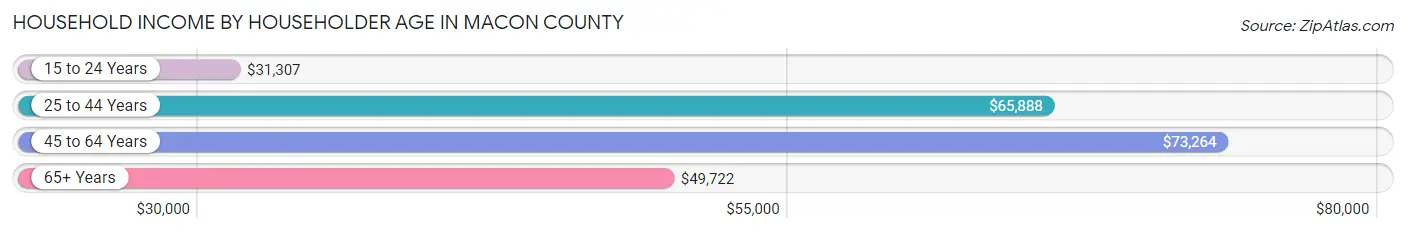
| Income Bracket | # Households | Median Income |
| 15 to 24 Years | 1,938 (4.5%) | $31,307 |
| 25 to 44 Years | 12,930 (29.8%) | $65,888 |
| 45 to 64 Years | 15,048 (34.7%) | $73,264 |
| 65+ Years | 13,446 (31.0%) | $49,722 |
| Total | 43,362 (100.0%) | $59,622 |
Poverty in Macon County
Income Below Poverty by Sex and Age in Macon County
With 13.5% poverty level for males and 17.4% for females among the residents of Macon County, under 5 year old males and 18 to 24 year old females are the most vulnerable to poverty, with 670 males (21.8%) and 1,305 females (32.1%) in their respective age groups living below the poverty level.
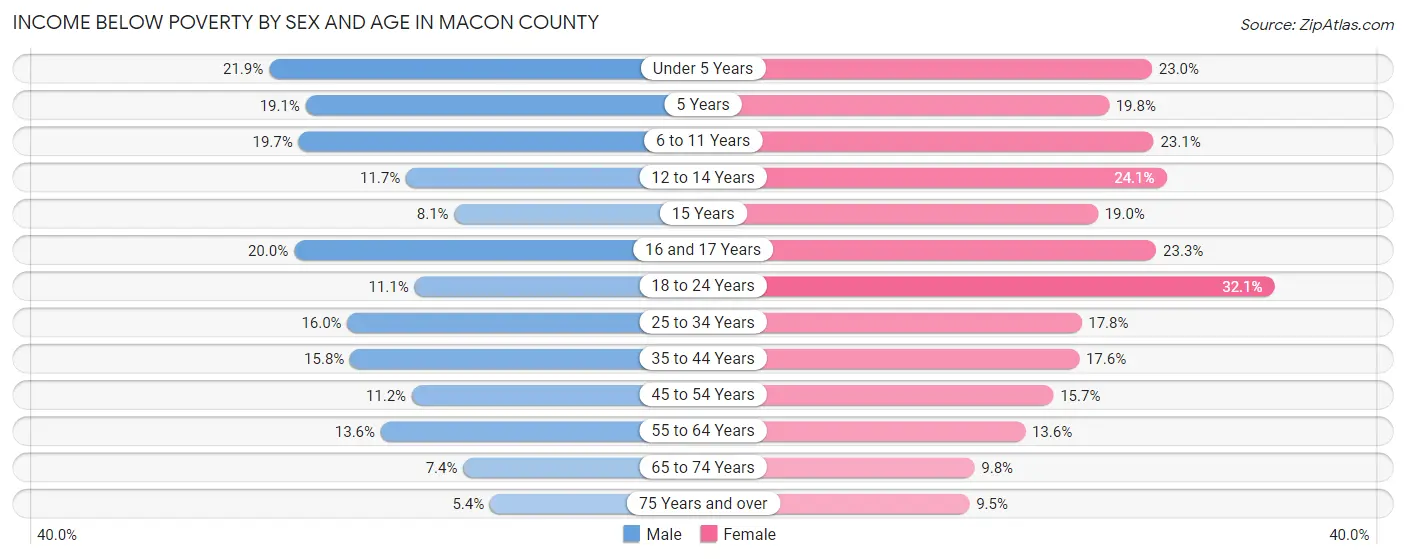
| Age Bracket | Male | Female |
| Under 5 Years | 670 (21.8%) | 680 (23.0%) |
| 5 Years | 127 (19.1%) | 150 (19.8%) |
| 6 to 11 Years | 738 (19.7%) | 851 (23.1%) |
| 12 to 14 Years | 249 (11.7%) | 429 (24.1%) |
| 15 Years | 50 (8.1%) | 152 (19.0%) |
| 16 and 17 Years | 278 (20.0%) | 264 (23.3%) |
| 18 to 24 Years | 439 (11.1%) | 1,305 (32.1%) |
| 25 to 34 Years | 935 (16.0%) | 1,082 (17.8%) |
| 35 to 44 Years | 878 (15.8%) | 1,063 (17.6%) |
| 45 to 54 Years | 638 (11.2%) | 927 (15.7%) |
| 55 to 64 Years | 918 (13.6%) | 993 (13.6%) |
| 65 to 74 Years | 408 (7.4%) | 621 (9.8%) |
| 75 Years and over | 193 (5.4%) | 472 (9.5%) |
| Total | 6,521 (13.5%) | 8,989 (17.4%) |
Income Above Poverty by Sex and Age in Macon County
According to the poverty statistics in Macon County, males aged 75 years and over and females aged 75 years and over are the age groups that are most secure financially, with 94.6% of males and 90.5% of females in these age groups living above the poverty line.
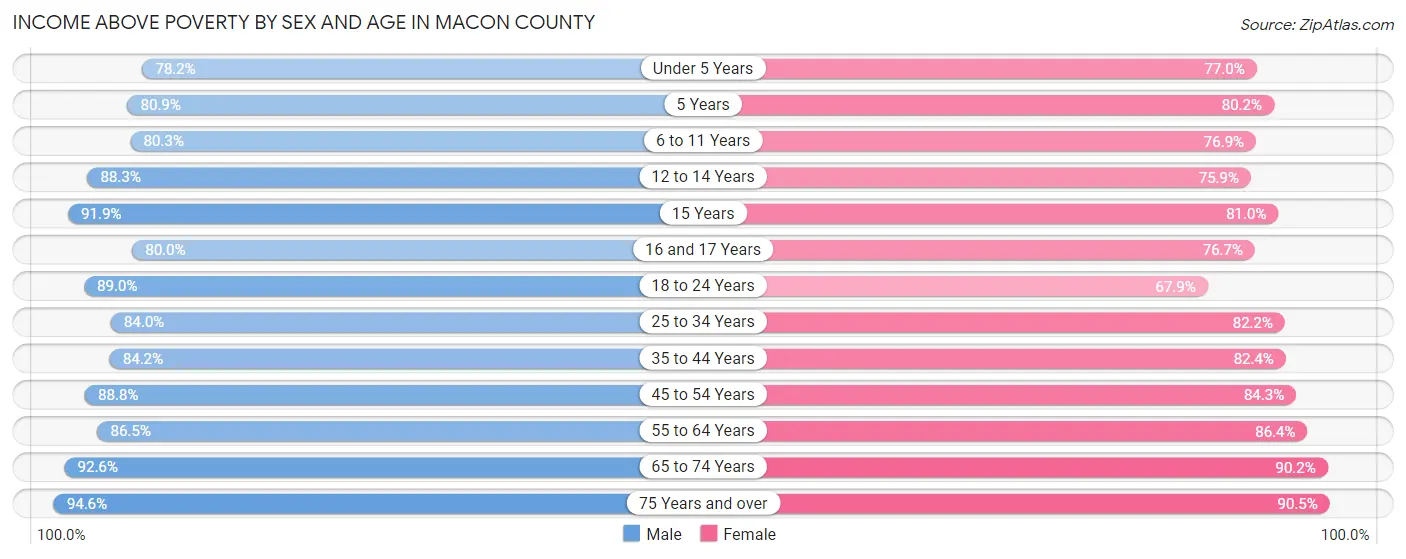
| Age Bracket | Male | Female |
| Under 5 Years | 2,396 (78.1%) | 2,274 (77.0%) |
| 5 Years | 537 (80.9%) | 607 (80.2%) |
| 6 to 11 Years | 3,015 (80.3%) | 2,826 (76.9%) |
| 12 to 14 Years | 1,882 (88.3%) | 1,352 (75.9%) |
| 15 Years | 568 (91.9%) | 648 (81.0%) |
| 16 and 17 Years | 1,112 (80.0%) | 867 (76.7%) |
| 18 to 24 Years | 3,533 (88.9%) | 2,759 (67.9%) |
| 25 to 34 Years | 4,899 (84.0%) | 5,002 (82.2%) |
| 35 to 44 Years | 4,670 (84.2%) | 4,973 (82.4%) |
| 45 to 54 Years | 5,038 (88.8%) | 4,976 (84.3%) |
| 55 to 64 Years | 5,857 (86.5%) | 6,307 (86.4%) |
| 65 to 74 Years | 5,084 (92.6%) | 5,690 (90.2%) |
| 75 Years and over | 3,355 (94.6%) | 4,516 (90.5%) |
| Total | 41,946 (86.6%) | 42,797 (82.6%) |
Income Below Poverty Among Married-Couple Families in Macon County
The poverty statistics for married-couple families in Macon County show that 5.9% or 1,137 of the total 19,409 families live below the poverty line. Families with 5 or more children have the highest poverty rate of 48.6%, comprising of 68 families. On the other hand, families with no children have the lowest poverty rate of 4.5%, which includes 580 families.
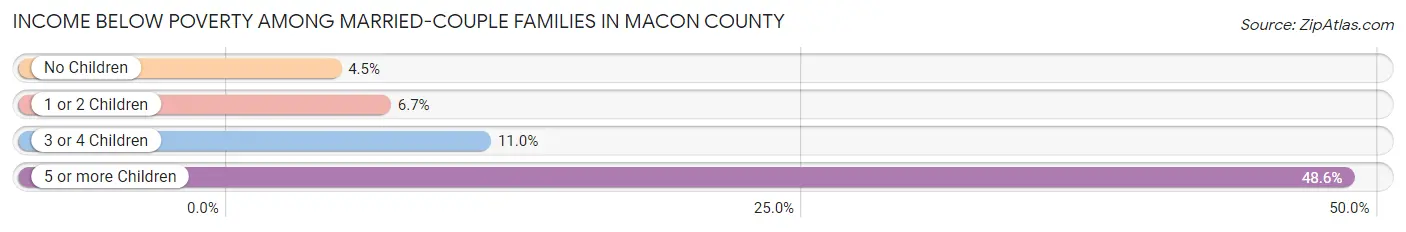
| Children | Above Poverty | Below Poverty |
| No Children | 12,329 (95.5%) | 580 (4.5%) |
| 1 or 2 Children | 4,521 (93.3%) | 322 (6.7%) |
| 3 or 4 Children | 1,350 (89.0%) | 167 (11.0%) |
| 5 or more Children | 72 (51.4%) | 68 (48.6%) |
| Total | 18,272 (94.1%) | 1,137 (5.9%) |
Income Below Poverty Among Single-Parent Households in Macon County
According to the poverty data in Macon County, 13.7% or 229 single-father households and 29.6% or 1,366 single-mother households are living below the poverty line. Among single-father households, those with 3 or 4 children have the highest poverty rate, with 15 households (26.8%) experiencing poverty. Likewise, among single-mother households, those with 5 or more children have the highest poverty rate, with 95 households (83.3%) falling below the poverty line.
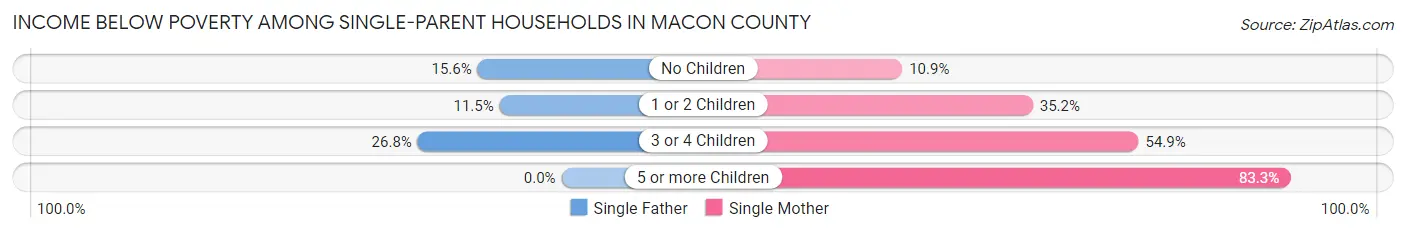
| Children | Single Father | Single Mother |
| No Children | 106 (15.6%) | 166 (10.9%) |
| 1 or 2 Children | 108 (11.5%) | 943 (35.2%) |
| 3 or 4 Children | 15 (26.8%) | 162 (54.9%) |
| 5 or more Children | 0 (0.0%) | 95 (83.3%) |
| Total | 229 (13.7%) | 1,366 (29.6%) |
Income Below Poverty Among Married-Couple vs Single-Parent Households in Macon County
The poverty data for Macon County shows that 1,137 of the married-couple family households (5.9%) and 1,595 of the single-parent households (25.4%) are living below the poverty level. Within the married-couple family households, those with 5 or more children have the highest poverty rate, with 68 households (48.6%) falling below the poverty line. Among the single-parent households, those with 5 or more children have the highest poverty rate, with 95 household (83.3%) living below poverty.
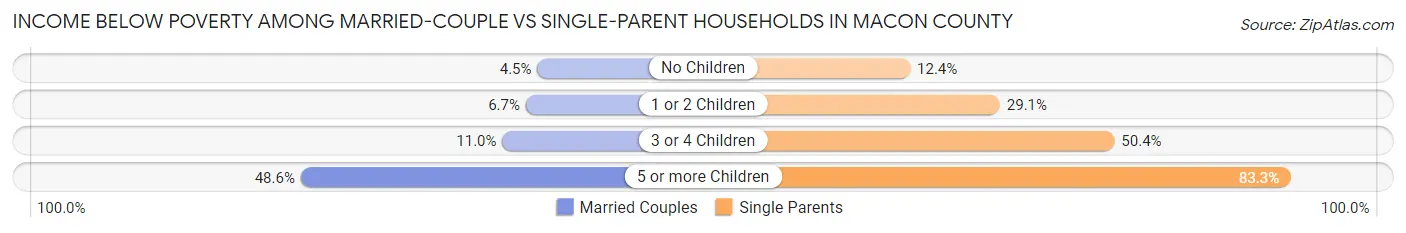
| Children | Married-Couple Families | Single-Parent Households |
| No Children | 580 (4.5%) | 272 (12.4%) |
| 1 or 2 Children | 322 (6.7%) | 1,051 (29.1%) |
| 3 or 4 Children | 167 (11.0%) | 177 (50.4%) |
| 5 or more Children | 68 (48.6%) | 95 (83.3%) |
| Total | 1,137 (5.9%) | 1,595 (25.4%) |
Employment Characteristics in Macon County
Employment by Class of Employer in Macon County
Among the 44,302 employed individuals in Macon County, private company employees (31,649 | 71.4%), not-for-profit organizations (4,240 | 9.6%), and local government employees (3,486 | 7.9%) make up the most common classes of employment.
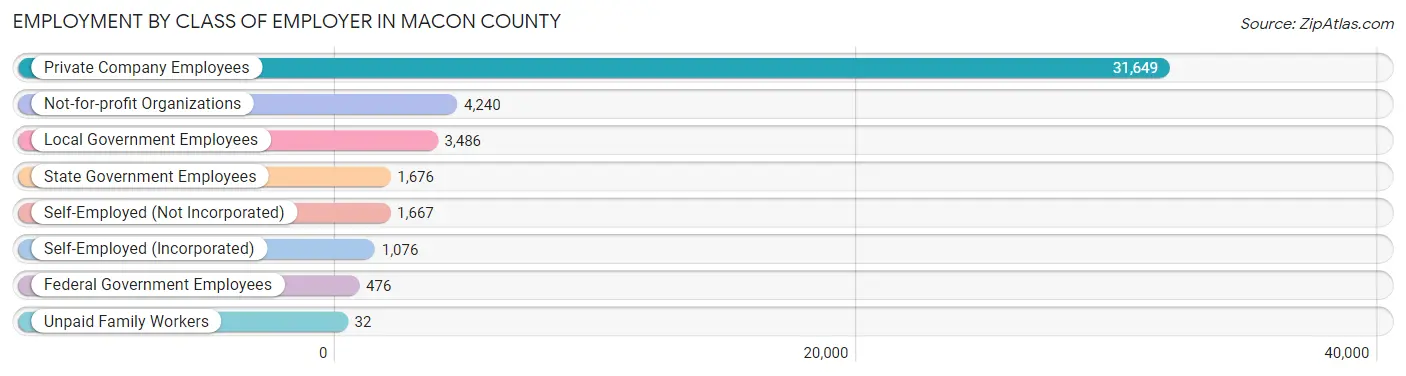
| Employer Class | # Employees | % Employees |
| Private Company Employees | 31,649 | 71.4% |
| Self-Employed (Incorporated) | 1,076 | 2.4% |
| Self-Employed (Not Incorporated) | 1,667 | 3.8% |
| Not-for-profit Organizations | 4,240 | 9.6% |
| Local Government Employees | 3,486 | 7.9% |
| State Government Employees | 1,676 | 3.8% |
| Federal Government Employees | 476 | 1.1% |
| Unpaid Family Workers | 32 | 0.1% |
| Total | 44,302 | 100.0% |
Employment Status by Age in Macon County
According to the labor force statistics for Macon County, out of the total population over 16 years of age (82,836), 58.5% or 48,459 individuals are in the labor force, with 7.2% or 3,489 of them unemployed. The age group with the highest labor force participation rate is 35 to 44 years, with 83.5% or 9,906 individuals in the labor force. Within the labor force, the 20 to 24 years age range has the highest percentage of unemployed individuals, with 13.6% or 638 of them being unemployed.
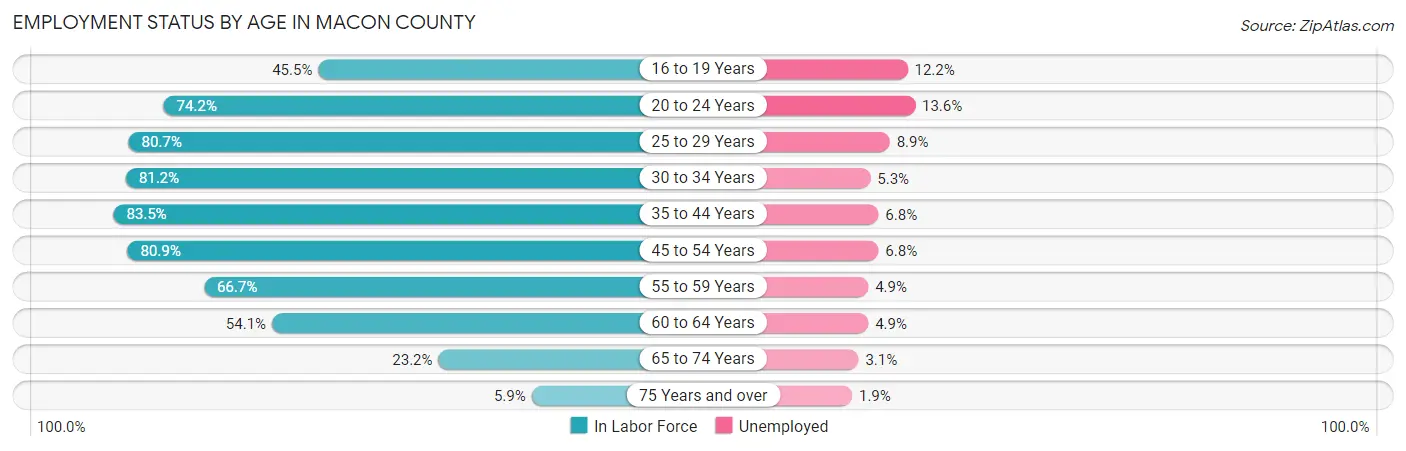
| Age Bracket | In Labor Force | Unemployed |
| 16 to 19 Years | 2,370 (45.5%) | 289 (12.2%) |
| 20 to 24 Years | 4,693 (74.2%) | 638 (13.6%) |
| 25 to 29 Years | 5,041 (80.7%) | 449 (8.9%) |
| 30 to 34 Years | 4,951 (81.2%) | 262 (5.3%) |
| 35 to 44 Years | 9,906 (83.5%) | 674 (6.8%) |
| 45 to 54 Years | 9,557 (80.9%) | 650 (6.8%) |
| 55 to 59 Years | 4,754 (66.7%) | 233 (4.9%) |
| 60 to 64 Years | 3,851 (54.1%) | 189 (4.9%) |
| 65 to 74 Years | 2,790 (23.2%) | 86 (3.1%) |
| 75 Years and over | 532 (5.9%) | 10 (1.9%) |
| Total | 48,459 (58.5%) | 3,489 (7.2%) |
Employment Status by Educational Attainment in Macon County
According to labor force statistics for Macon County, 75.7% of individuals (38,051) out of the total population between 25 and 64 years of age (50,266) are in the labor force, with 6.5% or 2,473 of them being unemployed. The group with the highest labor force participation rate are those with the educational attainment of bachelor's degree or higher, with 88.2% or 11,054 individuals in the labor force. Within the labor force, individuals with less than high school education have the highest percentage of unemployment, with 18.0% or 330 of them being unemployed.
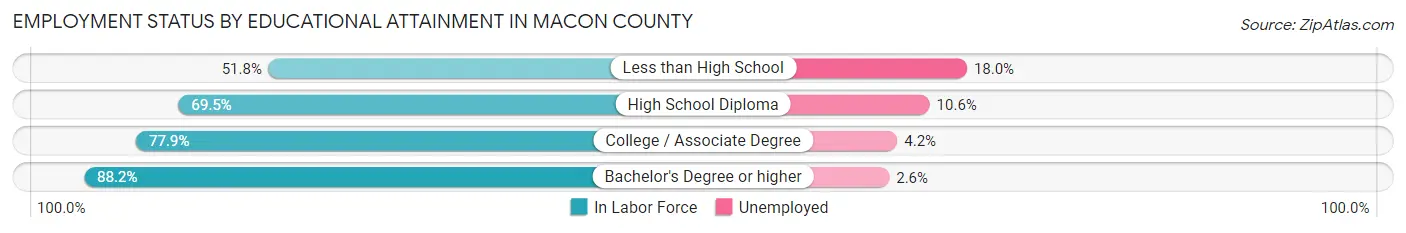
| Educational Attainment | In Labor Force | Unemployed |
| Less than High School | 1,833 (51.8%) | 637 (18.0%) |
| High School Diploma | 12,149 (69.5%) | 1,853 (10.6%) |
| College / Associate Degree | 13,020 (77.9%) | 702 (4.2%) |
| Bachelor's Degree or higher | 11,054 (88.2%) | 326 (2.6%) |
| Total | 38,051 (75.7%) | 3,267 (6.5%) |
Employment Occupations by Sex in Macon County
Management, Business, Science and Arts Occupations
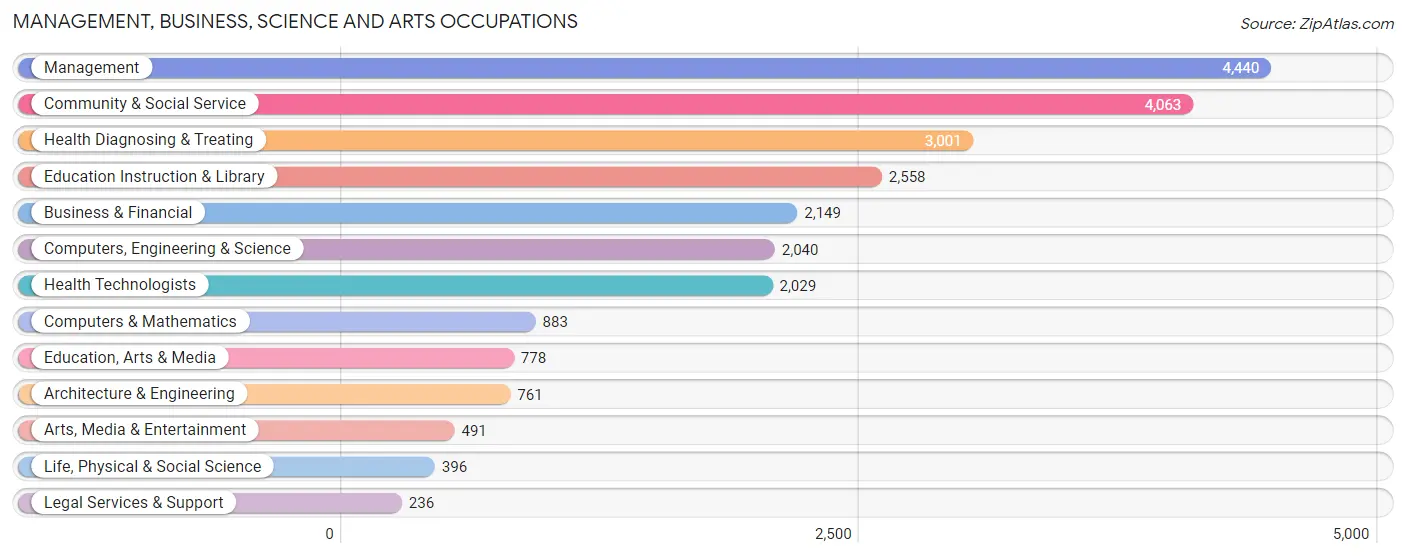
The most common Management, Business, Science and Arts occupations in Macon County are Management (4,440 | 9.9%), Community & Social Service (4,063 | 9.0%), Health Diagnosing & Treating (3,001 | 6.7%), Education Instruction & Library (2,558 | 5.7%), and Business & Financial (2,149 | 4.8%).
Management, Business, Science and Arts Occupations by Sex
Within the Management, Business, Science and Arts occupations in Macon County, the most male-oriented occupations are Architecture & Engineering (69.1%), Computers, Engineering & Science (63.9%), and Computers & Mathematics (61.2%), while the most female-oriented occupations are Health Technologists (81.7%), Health Diagnosing & Treating (79.6%), and Education, Arts & Media (77.8%).
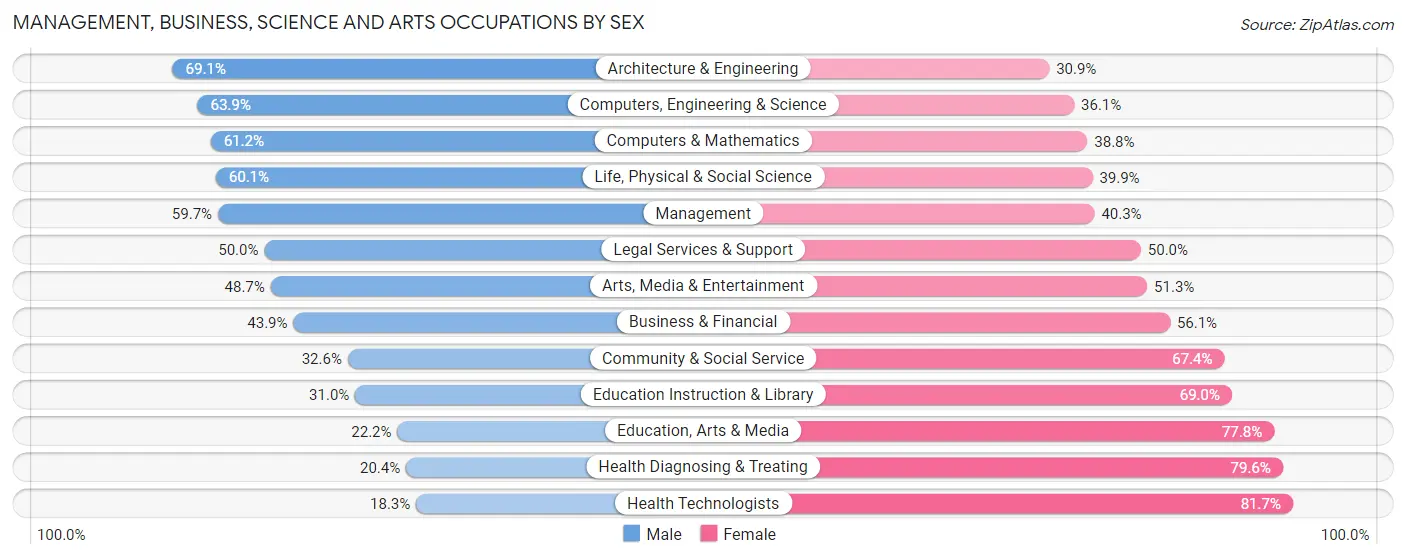
| Occupation | Male | Female |
| Management | 2,650 (59.7%) | 1,790 (40.3%) |
| Business & Financial | 944 (43.9%) | 1,205 (56.1%) |
| Computers, Engineering & Science | 1,304 (63.9%) | 736 (36.1%) |
| Computers & Mathematics | 540 (61.2%) | 343 (38.8%) |
| Architecture & Engineering | 526 (69.1%) | 235 (30.9%) |
| Life, Physical & Social Science | 238 (60.1%) | 158 (39.9%) |
| Community & Social Service | 1,324 (32.6%) | 2,739 (67.4%) |
| Education, Arts & Media | 173 (22.2%) | 605 (77.8%) |
| Legal Services & Support | 118 (50.0%) | 118 (50.0%) |
| Education Instruction & Library | 794 (31.0%) | 1,764 (69.0%) |
| Arts, Media & Entertainment | 239 (48.7%) | 252 (51.3%) |
| Health Diagnosing & Treating | 613 (20.4%) | 2,388 (79.6%) |
| Health Technologists | 372 (18.3%) | 1,657 (81.7%) |
| Total (Category) | 6,835 (43.5%) | 8,858 (56.5%) |
| Total (Overall) | 22,905 (51.0%) | 22,023 (49.0%) |
Services Occupations
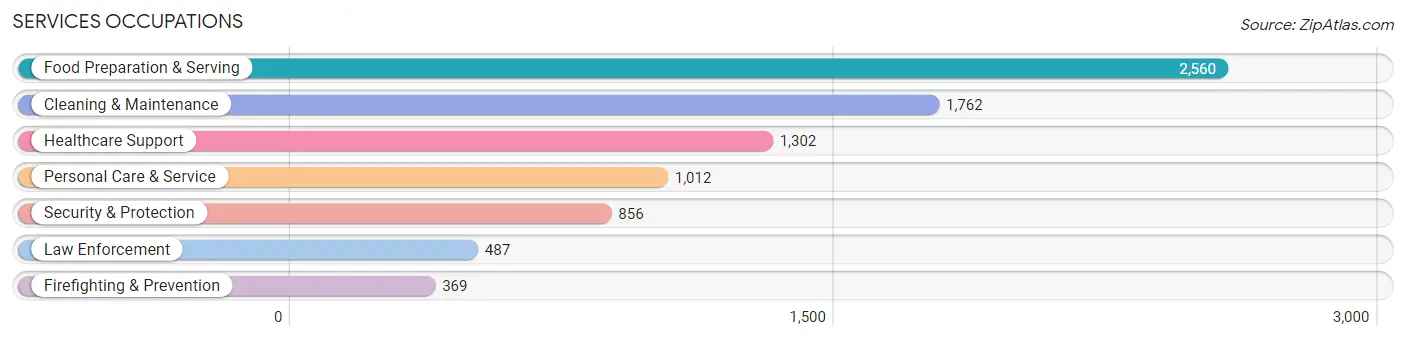
The most common Services occupations in Macon County are Food Preparation & Serving (2,560 | 5.7%), Cleaning & Maintenance (1,762 | 3.9%), Healthcare Support (1,302 | 2.9%), Personal Care & Service (1,012 | 2.2%), and Security & Protection (856 | 1.9%).
Services Occupations by Sex
Within the Services occupations in Macon County, the most male-oriented occupations are Firefighting & Prevention (78.3%), Security & Protection (72.7%), and Law Enforcement (68.4%), while the most female-oriented occupations are Healthcare Support (93.1%), Personal Care & Service (80.9%), and Food Preparation & Serving (61.6%).
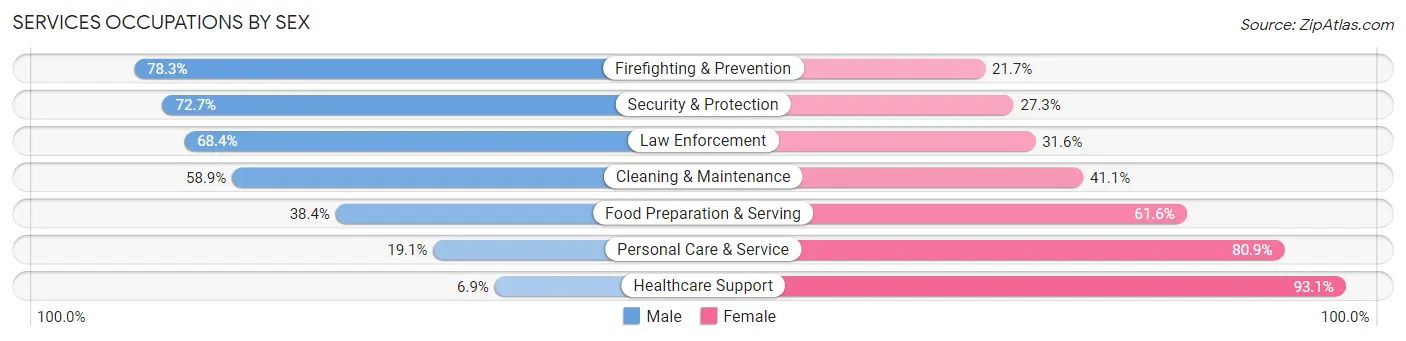
| Occupation | Male | Female |
| Healthcare Support | 90 (6.9%) | 1,212 (93.1%) |
| Security & Protection | 622 (72.7%) | 234 (27.3%) |
| Firefighting & Prevention | 289 (78.3%) | 80 (21.7%) |
| Law Enforcement | 333 (68.4%) | 154 (31.6%) |
| Food Preparation & Serving | 983 (38.4%) | 1,577 (61.6%) |
| Cleaning & Maintenance | 1,038 (58.9%) | 724 (41.1%) |
| Personal Care & Service | 193 (19.1%) | 819 (80.9%) |
| Total (Category) | 2,926 (39.1%) | 4,566 (61.0%) |
| Total (Overall) | 22,905 (51.0%) | 22,023 (49.0%) |
Sales and Office Occupations
The most common Sales and Office occupations in Macon County are Office & Administration (5,548 | 12.3%), and Sales & Related (4,408 | 9.8%).

Sales and Office Occupations by Sex
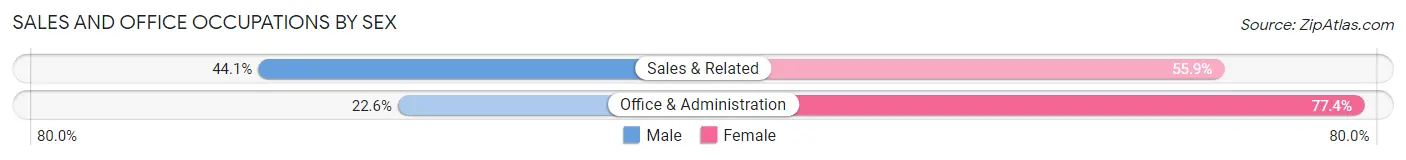
| Occupation | Male | Female |
| Sales & Related | 1,942 (44.1%) | 2,466 (55.9%) |
| Office & Administration | 1,253 (22.6%) | 4,295 (77.4%) |
| Total (Category) | 3,195 (32.1%) | 6,761 (67.9%) |
| Total (Overall) | 22,905 (51.0%) | 22,023 (49.0%) |
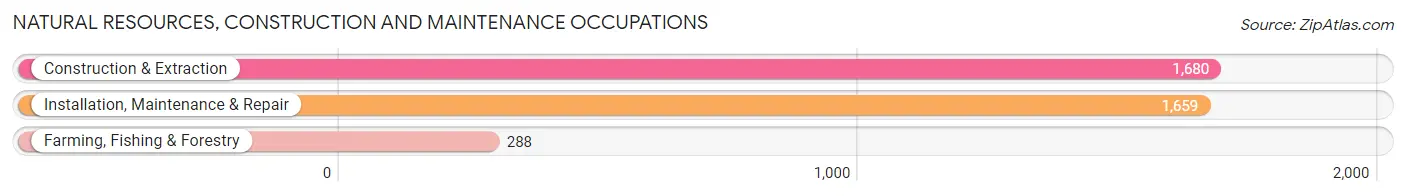
Natural Resources, Construction and Maintenance Occupations
The most common Natural Resources, Construction and Maintenance occupations in Macon County are Construction & Extraction (1,680 | 3.7%), Installation, Maintenance & Repair (1,659 | 3.7%), and Farming, Fishing & Forestry (288 | 0.6%).
Natural Resources, Construction and Maintenance Occupations by Sex

| Occupation | Male | Female |
| Farming, Fishing & Forestry | 257 (89.2%) | 31 (10.8%) |
| Construction & Extraction | 1,670 (99.4%) | 10 (0.6%) |
| Installation, Maintenance & Repair | 1,574 (94.9%) | 85 (5.1%) |
| Total (Category) | 3,501 (96.5%) | 126 (3.5%) |
| Total (Overall) | 22,905 (51.0%) | 22,023 (49.0%) |
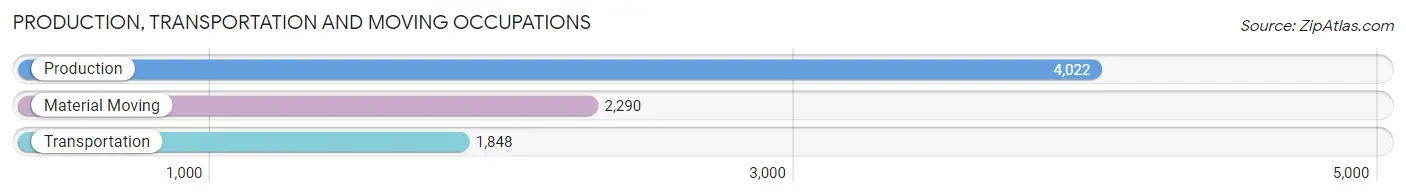
Production, Transportation and Moving Occupations
The most common Production, Transportation and Moving occupations in Macon County are Production (4,022 | 8.9%), Material Moving (2,290 | 5.1%), and Transportation (1,848 | 4.1%).
Production, Transportation and Moving Occupations by Sex
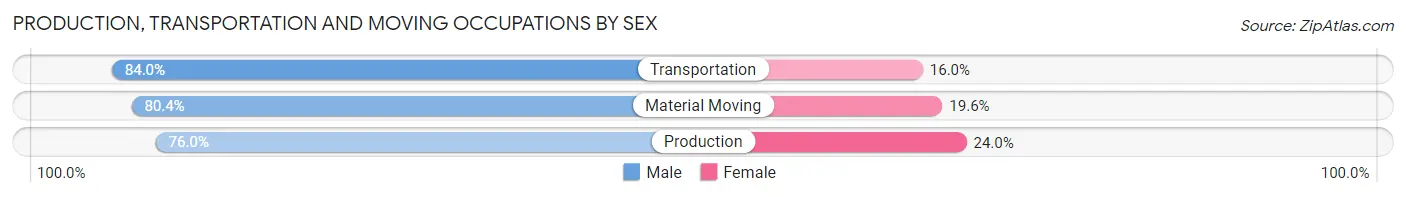
| Occupation | Male | Female |
| Production | 3,055 (76.0%) | 967 (24.0%) |
| Transportation | 1,552 (84.0%) | 296 (16.0%) |
| Material Moving | 1,841 (80.4%) | 449 (19.6%) |
| Total (Category) | 6,448 (79.0%) | 1,712 (21.0%) |
| Total (Overall) | 22,905 (51.0%) | 22,023 (49.0%) |
Employment Industries by Sex in Macon County
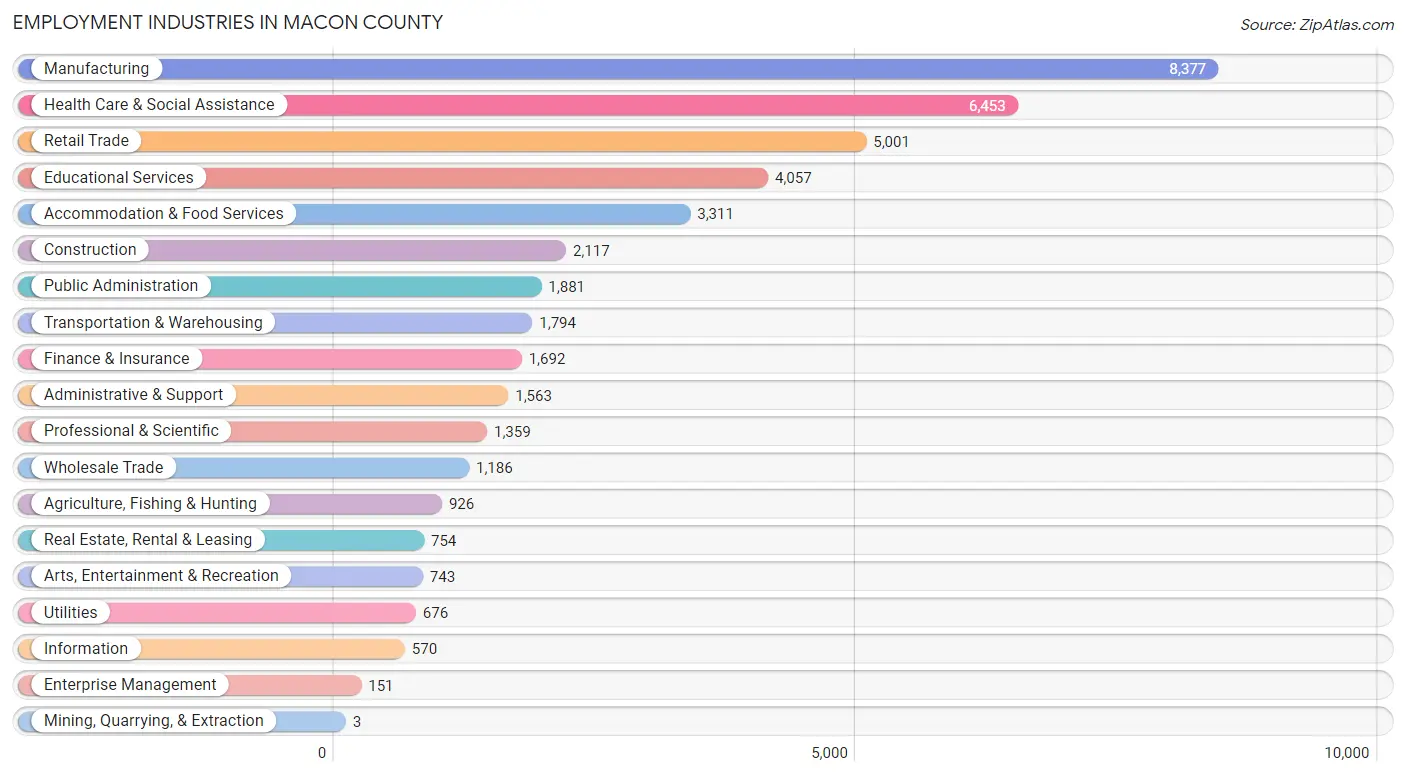
Employment Industries in Macon County
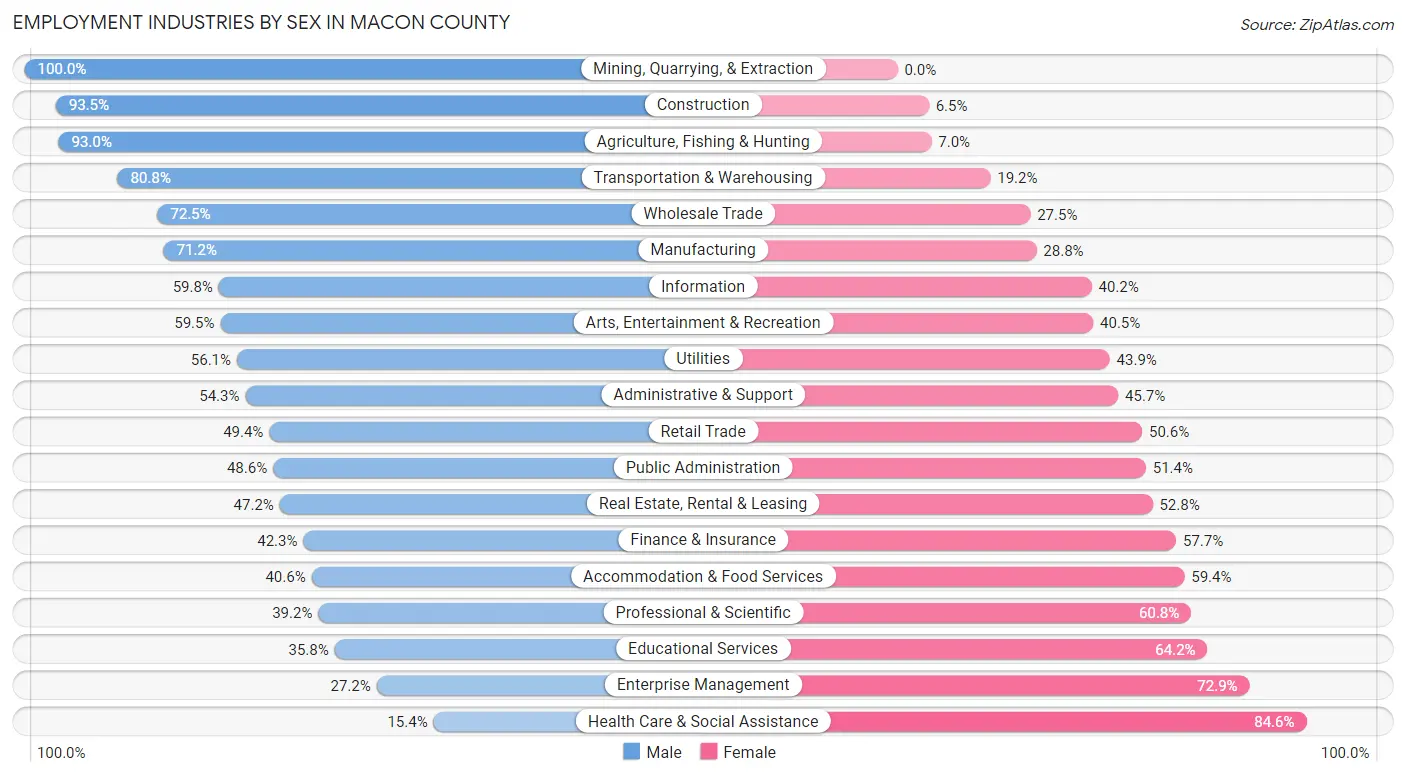
The major employment industries in Macon County include Manufacturing (8,377 | 18.6%), Health Care & Social Assistance (6,453 | 14.4%), Retail Trade (5,001 | 11.1%), Educational Services (4,057 | 9.0%), and Accommodation & Food Services (3,311 | 7.4%).
Employment Industries by Sex in Macon County
The Macon County industries that see more men than women are Mining, Quarrying, & Extraction (100.0%), Construction (93.5%), and Agriculture, Fishing & Hunting (93.0%), whereas the industries that tend to have a higher number of women are Health Care & Social Assistance (84.6%), Enterprise Management (72.9%), and Educational Services (64.2%).
| Industry | Male | Female |
| Agriculture, Fishing & Hunting | 861 (93.0%) | 65 (7.0%) |
| Mining, Quarrying, & Extraction | 3 (100.0%) | 0 (0.0%) |
| Construction | 1,980 (93.5%) | 137 (6.5%) |
| Manufacturing | 5,967 (71.2%) | 2,410 (28.8%) |
| Wholesale Trade | 860 (72.5%) | 326 (27.5%) |
| Retail Trade | 2,469 (49.4%) | 2,532 (50.6%) |
| Transportation & Warehousing | 1,449 (80.8%) | 345 (19.2%) |
| Utilities | 379 (56.1%) | 297 (43.9%) |
| Information | 341 (59.8%) | 229 (40.2%) |
| Finance & Insurance | 716 (42.3%) | 976 (57.7%) |
| Real Estate, Rental & Leasing | 356 (47.2%) | 398 (52.8%) |
| Professional & Scientific | 533 (39.2%) | 826 (60.8%) |
| Enterprise Management | 41 (27.2%) | 110 (72.9%) |
| Administrative & Support | 849 (54.3%) | 714 (45.7%) |
| Educational Services | 1,454 (35.8%) | 2,603 (64.2%) |
| Health Care & Social Assistance | 992 (15.4%) | 5,461 (84.6%) |
| Arts, Entertainment & Recreation | 442 (59.5%) | 301 (40.5%) |
| Accommodation & Food Services | 1,345 (40.6%) | 1,966 (59.4%) |
| Public Administration | 914 (48.6%) | 967 (51.4%) |
| Total | 22,905 (51.0%) | 22,023 (49.0%) |
Education in Macon County
School Enrollment in Macon County
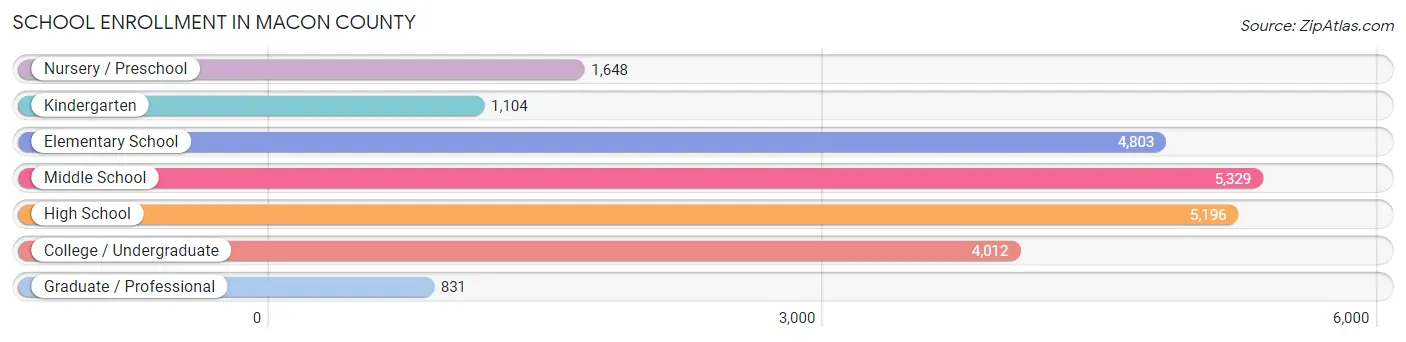
The most common levels of schooling among the 22,923 students in Macon County are middle school (5,329 | 23.3%), high school (5,196 | 22.7%), and elementary school (4,803 | 20.9%).
| School Level | # Students | % Students |
| Nursery / Preschool | 1,648 | 7.2% |
| Kindergarten | 1,104 | 4.8% |
| Elementary School | 4,803 | 20.9% |
| Middle School | 5,329 | 23.3% |
| High School | 5,196 | 22.7% |
| College / Undergraduate | 4,012 | 17.5% |
| Graduate / Professional | 831 | 3.6% |
| Total | 22,923 | 100.0% |
School Enrollment by Age by Funding Source in Macon County
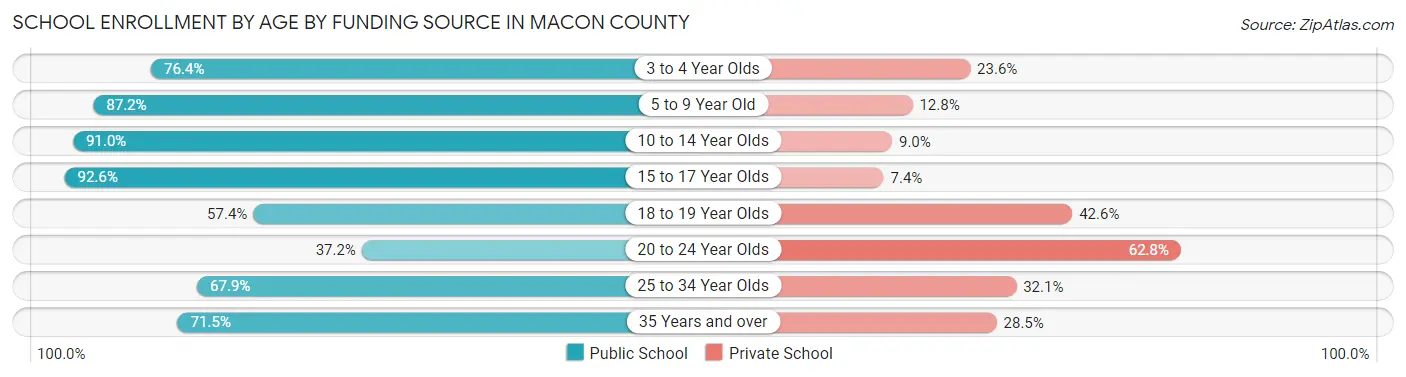
Out of a total of 22,923 students who are enrolled in schools in Macon County, 4,424 (19.3%) attend a private institution, while the remaining 18,499 (80.7%) are enrolled in public schools. The age group of 20 to 24 year olds has the highest likelihood of being enrolled in private schools, with 1,149 (62.8% in the age bracket) enrolled. Conversely, the age group of 15 to 17 year olds has the lowest likelihood of being enrolled in a private school, with 3,481 (92.6% in the age bracket) attending a public institution.
| Age Bracket | Public School | Private School |
| 3 to 4 Year Olds | 980 (76.4%) | 302 (23.6%) |
| 5 to 9 Year Old | 5,142 (87.2%) | 756 (12.8%) |
| 10 to 14 Year Olds | 5,795 (91.0%) | 574 (9.0%) |
| 15 to 17 Year Olds | 3,481 (92.6%) | 280 (7.4%) |
| 18 to 19 Year Olds | 1,017 (57.4%) | 754 (42.6%) |
| 20 to 24 Year Olds | 681 (37.2%) | 1,149 (62.8%) |
| 25 to 34 Year Olds | 646 (67.9%) | 306 (32.1%) |
| 35 Years and over | 758 (71.5%) | 302 (28.5%) |
| Total | 18,499 (80.7%) | 4,424 (19.3%) |
Educational Attainment by Field of Study in Macon County
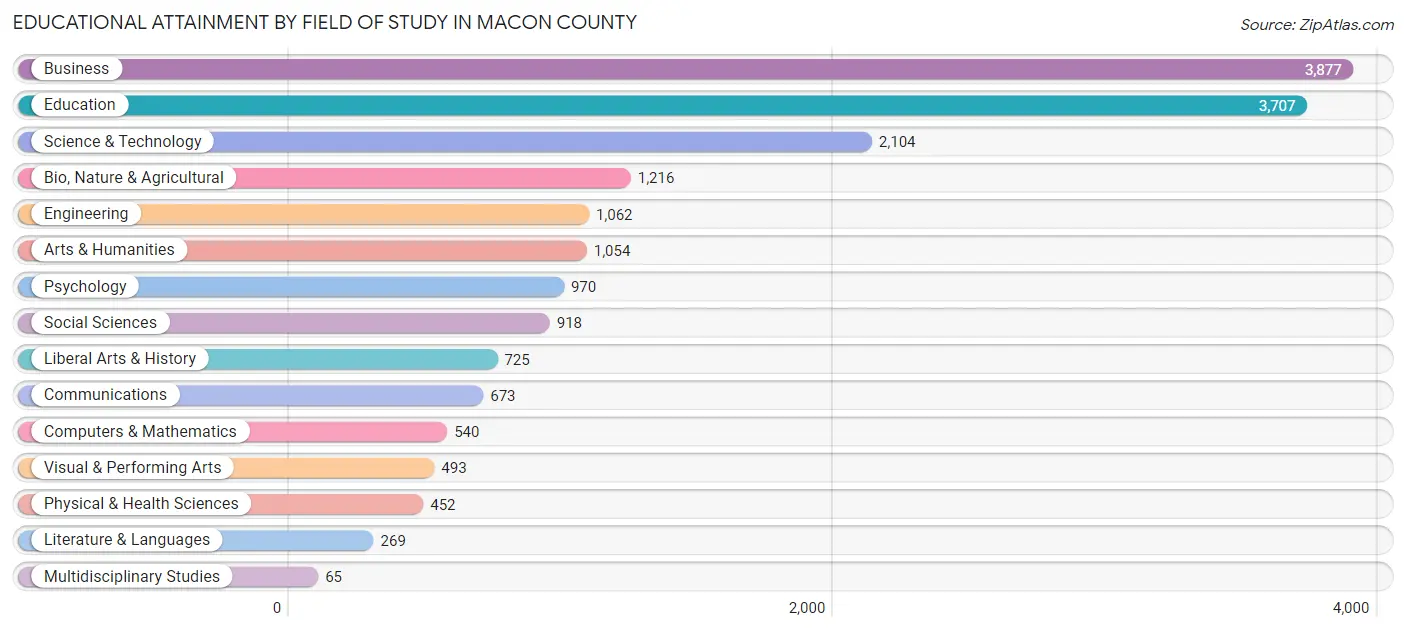
Business (3,877 | 21.4%), education (3,707 | 20.4%), science & technology (2,104 | 11.6%), bio, nature & agricultural (1,216 | 6.7%), and engineering (1,062 | 5.9%) are the most common fields of study among 18,125 individuals in Macon County who have obtained a bachelor's degree or higher.
| Field of Study | # Graduates | % Graduates |
| Computers & Mathematics | 540 | 3.0% |
| Bio, Nature & Agricultural | 1,216 | 6.7% |
| Physical & Health Sciences | 452 | 2.5% |
| Psychology | 970 | 5.3% |
| Social Sciences | 918 | 5.1% |
| Engineering | 1,062 | 5.9% |
| Multidisciplinary Studies | 65 | 0.4% |
| Science & Technology | 2,104 | 11.6% |
| Business | 3,877 | 21.4% |
| Education | 3,707 | 20.4% |
| Literature & Languages | 269 | 1.5% |
| Liberal Arts & History | 725 | 4.0% |
| Visual & Performing Arts | 493 | 2.7% |
| Communications | 673 | 3.7% |
| Arts & Humanities | 1,054 | 5.8% |
| Total | 18,125 | 100.0% |
Transportation & Commute in Macon County
Vehicle Availability by Sex in Macon County
The most prevalent vehicle ownership categories in Macon County are males with 2 vehicles (10,075, accounting for 45.1%) and females with 2 vehicles (9,632, making up 46.7%).
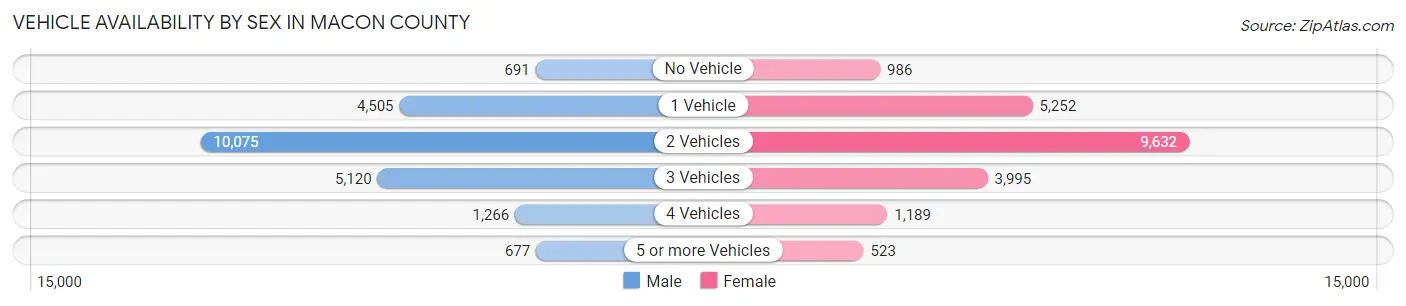
| Vehicles Available | Male | Female |
| No Vehicle | 691 (3.1%) | 986 (4.6%) |
| 1 Vehicle | 4,505 (20.2%) | 5,252 (24.3%) |
| 2 Vehicles | 10,075 (45.1%) | 9,632 (44.6%) |
| 3 Vehicles | 5,120 (22.9%) | 3,995 (18.5%) |
| 4 Vehicles | 1,266 (5.7%) | 1,189 (5.5%) |
| 5 or more Vehicles | 677 (3.0%) | 523 (2.4%) |
| Total | 22,334 (100.0%) | 21,577 (100.0%) |
Commute Time in Macon County
The most frequently occuring commute durations in Macon County are 15 to 19 minutes (10,073 commuters, 24.2%), 10 to 14 minutes (9,772 commuters, 23.5%), and 20 to 24 minutes (6,565 commuters, 15.8%).
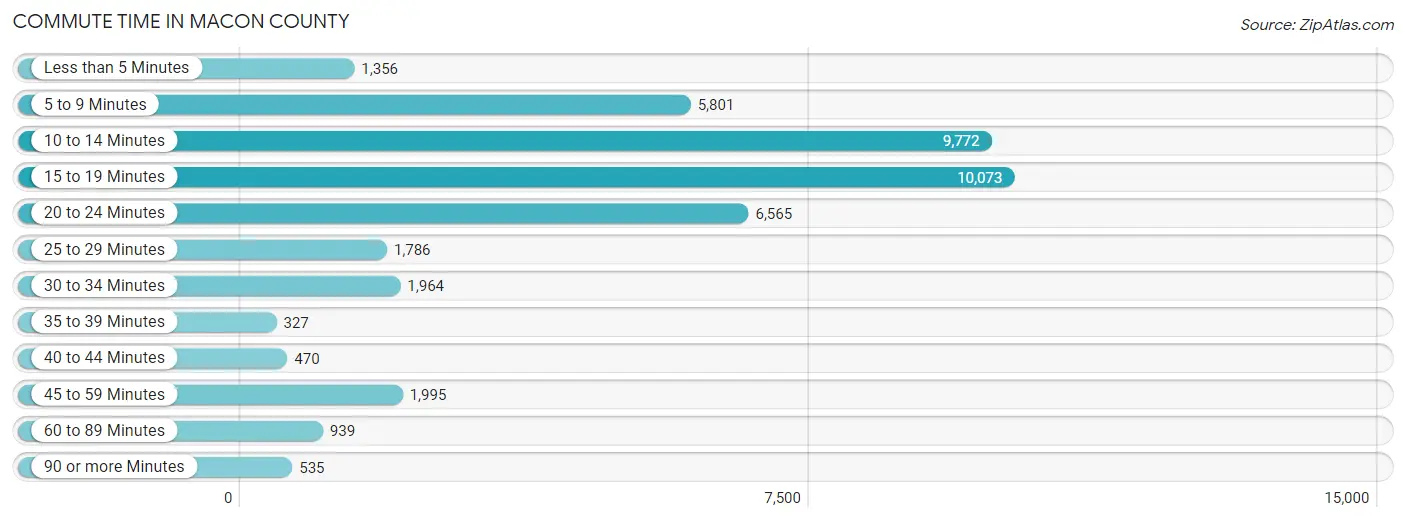
| Commute Time | # Commuters | % Commuters |
| Less than 5 Minutes | 1,356 | 3.3% |
| 5 to 9 Minutes | 5,801 | 14.0% |
| 10 to 14 Minutes | 9,772 | 23.5% |
| 15 to 19 Minutes | 10,073 | 24.2% |
| 20 to 24 Minutes | 6,565 | 15.8% |
| 25 to 29 Minutes | 1,786 | 4.3% |
| 30 to 34 Minutes | 1,964 | 4.7% |
| 35 to 39 Minutes | 327 | 0.8% |
| 40 to 44 Minutes | 470 | 1.1% |
| 45 to 59 Minutes | 1,995 | 4.8% |
| 60 to 89 Minutes | 939 | 2.3% |
| 90 or more Minutes | 535 | 1.3% |
Commute Time by Sex in Macon County
The most common commute times in Macon County are 15 to 19 minutes (5,430 commuters, 25.3%) for males and 10 to 14 minutes (5,125 commuters, 25.5%) for females.
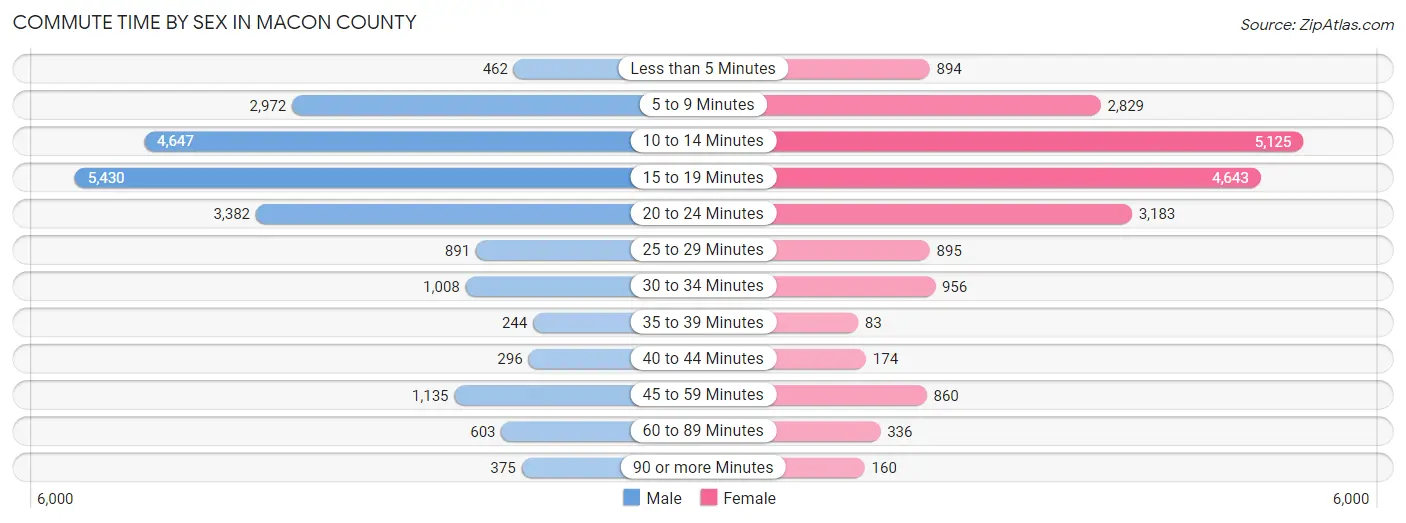
| Commute Time | Male | Female |
| Less than 5 Minutes | 462 (2.1%) | 894 (4.4%) |
| 5 to 9 Minutes | 2,972 (13.9%) | 2,829 (14.1%) |
| 10 to 14 Minutes | 4,647 (21.7%) | 5,125 (25.5%) |
| 15 to 19 Minutes | 5,430 (25.3%) | 4,643 (23.1%) |
| 20 to 24 Minutes | 3,382 (15.8%) | 3,183 (15.8%) |
| 25 to 29 Minutes | 891 (4.2%) | 895 (4.4%) |
| 30 to 34 Minutes | 1,008 (4.7%) | 956 (4.8%) |
| 35 to 39 Minutes | 244 (1.1%) | 83 (0.4%) |
| 40 to 44 Minutes | 296 (1.4%) | 174 (0.9%) |
| 45 to 59 Minutes | 1,135 (5.3%) | 860 (4.3%) |
| 60 to 89 Minutes | 603 (2.8%) | 336 (1.7%) |
| 90 or more Minutes | 375 (1.8%) | 160 (0.8%) |
Time of Departure to Work by Sex in Macon County
The most frequent times of departure to work in Macon County are 7:00 AM to 7:29 AM (3,398, 15.9%) for males and 7:30 AM to 7:59 AM (4,448, 22.1%) for females.
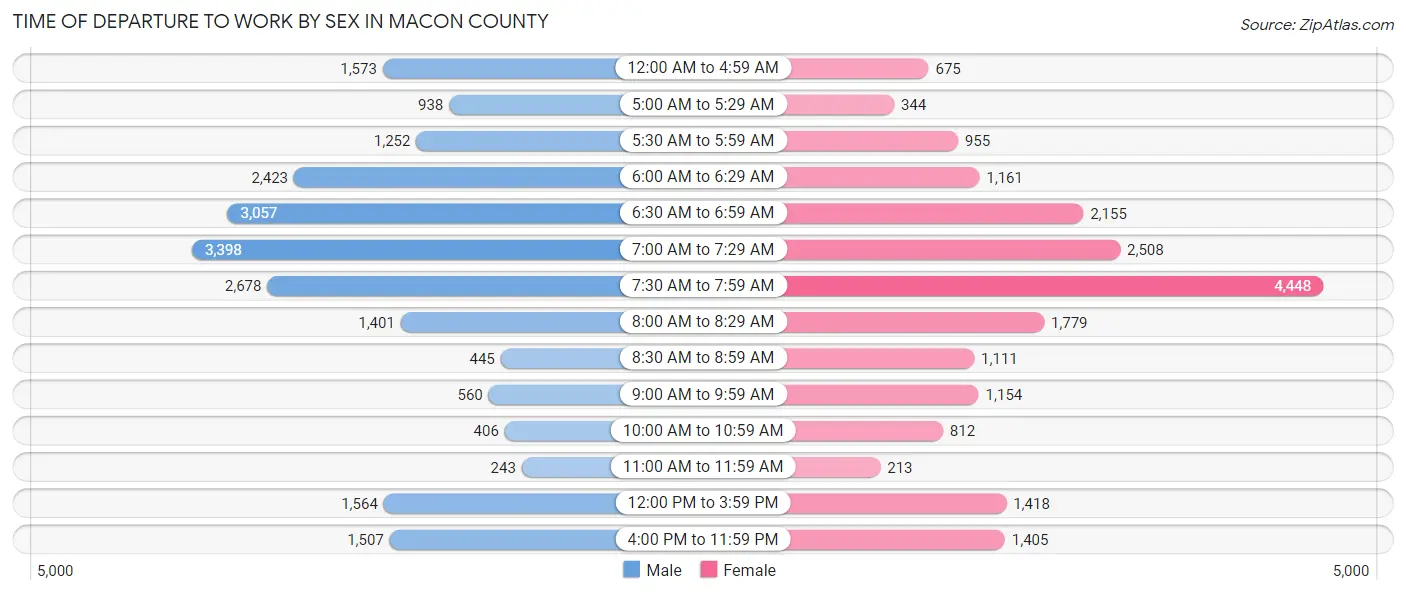
| Time of Departure | Male | Female |
| 12:00 AM to 4:59 AM | 1,573 (7.3%) | 675 (3.4%) |
| 5:00 AM to 5:29 AM | 938 (4.4%) | 344 (1.7%) |
| 5:30 AM to 5:59 AM | 1,252 (5.8%) | 955 (4.7%) |
| 6:00 AM to 6:29 AM | 2,423 (11.3%) | 1,161 (5.8%) |
| 6:30 AM to 6:59 AM | 3,057 (14.3%) | 2,155 (10.7%) |
| 7:00 AM to 7:29 AM | 3,398 (15.9%) | 2,508 (12.4%) |
| 7:30 AM to 7:59 AM | 2,678 (12.5%) | 4,448 (22.1%) |
| 8:00 AM to 8:29 AM | 1,401 (6.5%) | 1,779 (8.8%) |
| 8:30 AM to 8:59 AM | 445 (2.1%) | 1,111 (5.5%) |
| 9:00 AM to 9:59 AM | 560 (2.6%) | 1,154 (5.7%) |
| 10:00 AM to 10:59 AM | 406 (1.9%) | 812 (4.0%) |
| 11:00 AM to 11:59 AM | 243 (1.1%) | 213 (1.1%) |
| 12:00 PM to 3:59 PM | 1,564 (7.3%) | 1,418 (7.0%) |
| 4:00 PM to 11:59 PM | 1,507 (7.0%) | 1,405 (7.0%) |
| Total | 21,445 (100.0%) | 20,138 (100.0%) |
Housing Occupancy in Macon County
Occupancy by Ownership in Macon County
Of the total 43,362 dwellings in Macon County, owner-occupied units account for 29,890 (68.9%), while renter-occupied units make up 13,472 (31.1%).
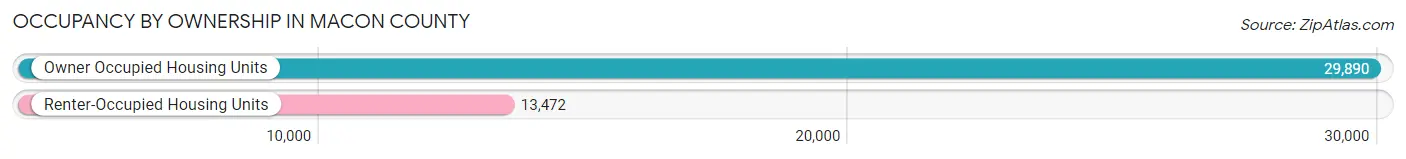
| Occupancy | # Housing Units | % Housing Units |
| Owner Occupied Housing Units | 29,890 | 68.9% |
| Renter-Occupied Housing Units | 13,472 | 31.1% |
| Total Occupied Housing Units | 43,362 | 100.0% |
Occupancy by Household Size in Macon County
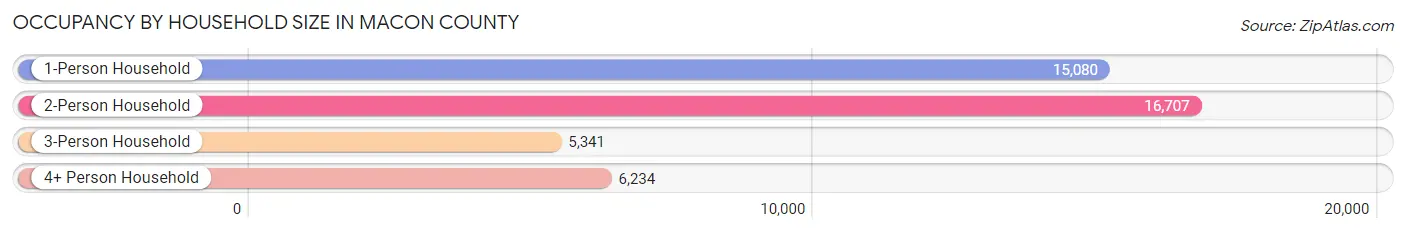
| Household Size | # Housing Units | % Housing Units |
| 1-Person Household | 15,080 | 34.8% |
| 2-Person Household | 16,707 | 38.5% |
| 3-Person Household | 5,341 | 12.3% |
| 4+ Person Household | 6,234 | 14.4% |
| Total Housing Units | 43,362 | 100.0% |
Occupancy by Ownership by Household Size in Macon County
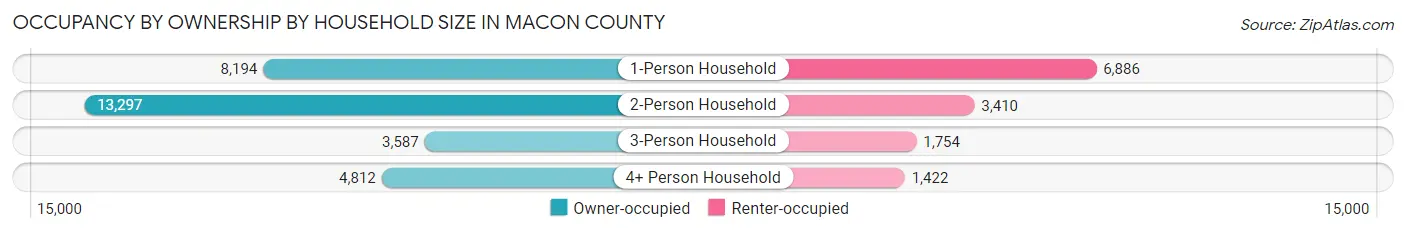
| Household Size | Owner-occupied | Renter-occupied |
| 1-Person Household | 8,194 (54.3%) | 6,886 (45.7%) |
| 2-Person Household | 13,297 (79.6%) | 3,410 (20.4%) |
| 3-Person Household | 3,587 (67.2%) | 1,754 (32.8%) |
| 4+ Person Household | 4,812 (77.2%) | 1,422 (22.8%) |
| Total Housing Units | 29,890 (68.9%) | 13,472 (31.1%) |
Occupancy by Educational Attainment in Macon County
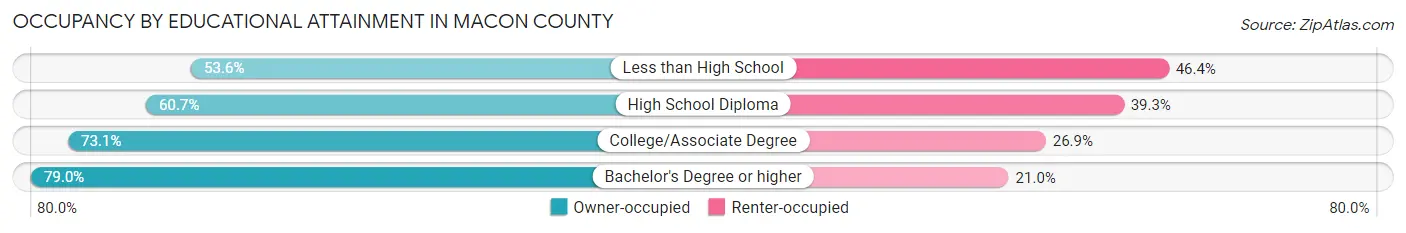
| Household Size | Owner-occupied | Renter-occupied |
| Less than High School | 1,586 (53.6%) | 1,373 (46.4%) |
| High School Diploma | 9,205 (60.7%) | 5,949 (39.3%) |
| College/Associate Degree | 10,497 (73.1%) | 3,862 (26.9%) |
| Bachelor's Degree or higher | 8,602 (79.0%) | 2,288 (21.0%) |
Occupancy by Age of Householder in Macon County
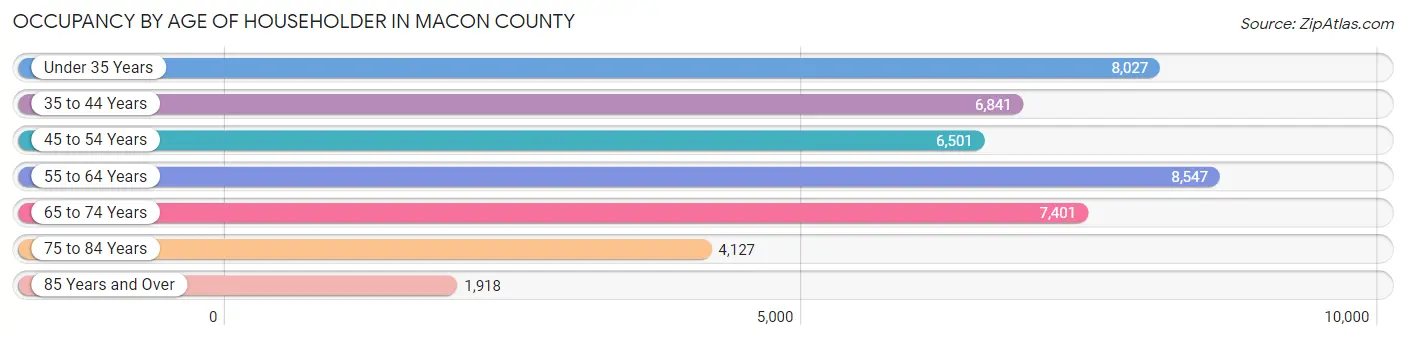
| Age Bracket | # Households | % Households |
| Under 35 Years | 8,027 | 18.5% |
| 35 to 44 Years | 6,841 | 15.8% |
| 45 to 54 Years | 6,501 | 15.0% |
| 55 to 64 Years | 8,547 | 19.7% |
| 65 to 74 Years | 7,401 | 17.1% |
| 75 to 84 Years | 4,127 | 9.5% |
| 85 Years and Over | 1,918 | 4.4% |
| Total | 43,362 | 100.0% |
Housing Finances in Macon County
Median Income by Occupancy in Macon County
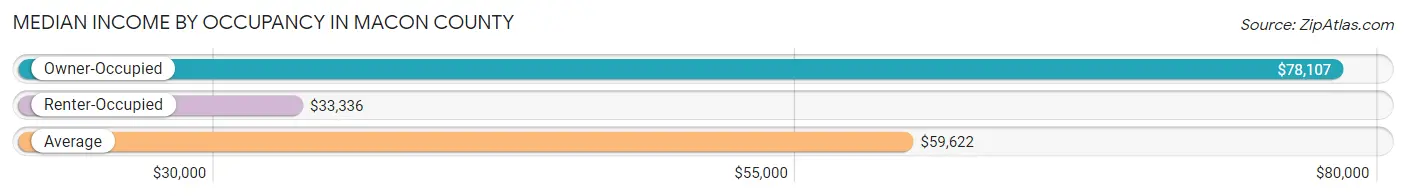
| Occupancy Type | # Households | Median Income |
| Owner-Occupied | 29,890 (68.9%) | $78,107 |
| Renter-Occupied | 13,472 (31.1%) | $33,336 |
| Average | 43,362 (100.0%) | $59,622 |
Occupancy by Householder Income Bracket in Macon County
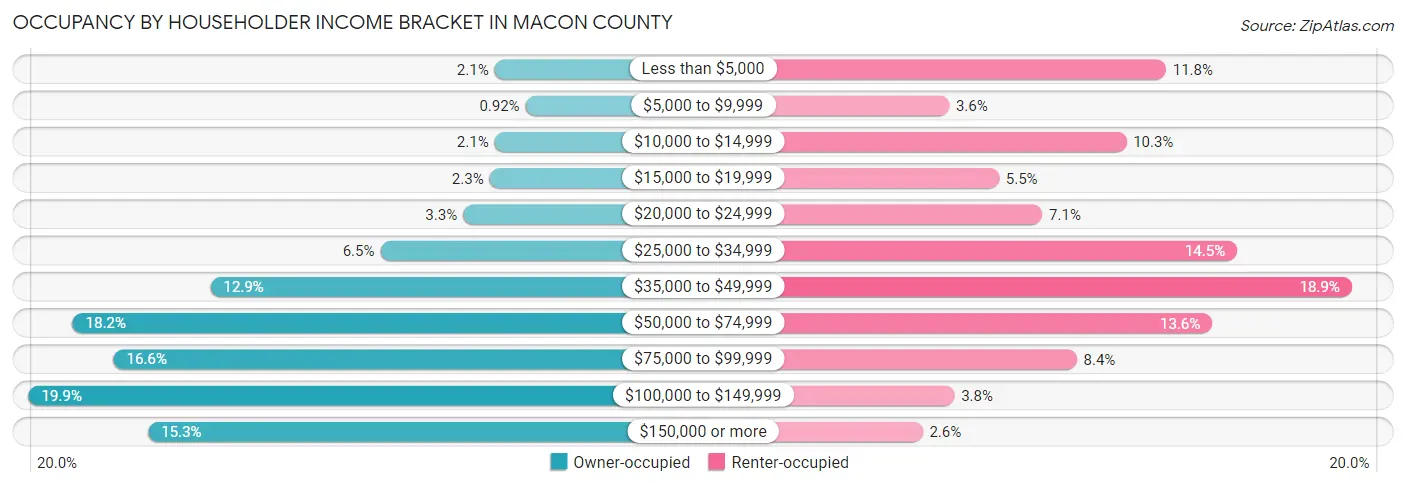
| Income Bracket | Owner-occupied | Renter-occupied |
| Less than $5,000 | 627 (2.1%) | 1,593 (11.8%) |
| $5,000 to $9,999 | 275 (0.9%) | 480 (3.6%) |
| $10,000 to $14,999 | 627 (2.1%) | 1,389 (10.3%) |
| $15,000 to $19,999 | 684 (2.3%) | 735 (5.5%) |
| $20,000 to $24,999 | 985 (3.3%) | 958 (7.1%) |
| $25,000 to $34,999 | 1,929 (6.5%) | 1,957 (14.5%) |
| $35,000 to $49,999 | 3,863 (12.9%) | 2,546 (18.9%) |
| $50,000 to $74,999 | 5,432 (18.2%) | 1,830 (13.6%) |
| $75,000 to $99,999 | 4,965 (16.6%) | 1,135 (8.4%) |
| $100,000 to $149,999 | 5,932 (19.9%) | 506 (3.8%) |
| $150,000 or more | 4,571 (15.3%) | 343 (2.5%) |
| Total | 29,890 (100.0%) | 13,472 (100.0%) |
Monthly Housing Cost Tiers in Macon County
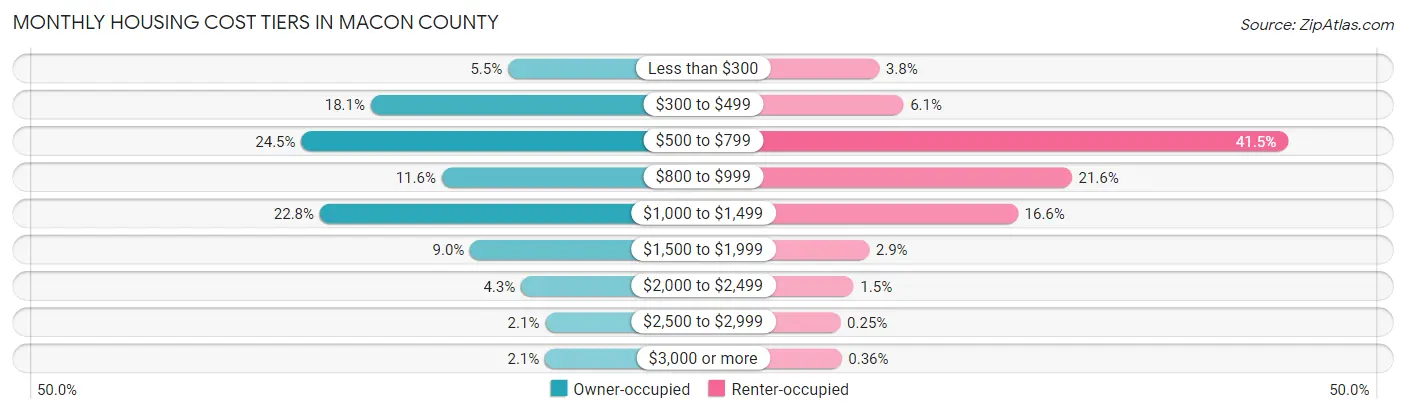
| Monthly Cost | Owner-occupied | Renter-occupied |
| Less than $300 | 1,641 (5.5%) | 514 (3.8%) |
| $300 to $499 | 5,419 (18.1%) | 817 (6.1%) |
| $500 to $799 | 7,330 (24.5%) | 5,588 (41.5%) |
| $800 to $999 | 3,466 (11.6%) | 2,903 (21.5%) |
| $1,000 to $1,499 | 6,822 (22.8%) | 2,235 (16.6%) |
| $1,500 to $1,999 | 2,684 (9.0%) | 390 (2.9%) |
| $2,000 to $2,499 | 1,286 (4.3%) | 198 (1.5%) |
| $2,500 to $2,999 | 619 (2.1%) | 34 (0.3%) |
| $3,000 or more | 623 (2.1%) | 48 (0.4%) |
| Total | 29,890 (100.0%) | 13,472 (100.0%) |
Physical Housing Characteristics in Macon County
Housing Structures in Macon County
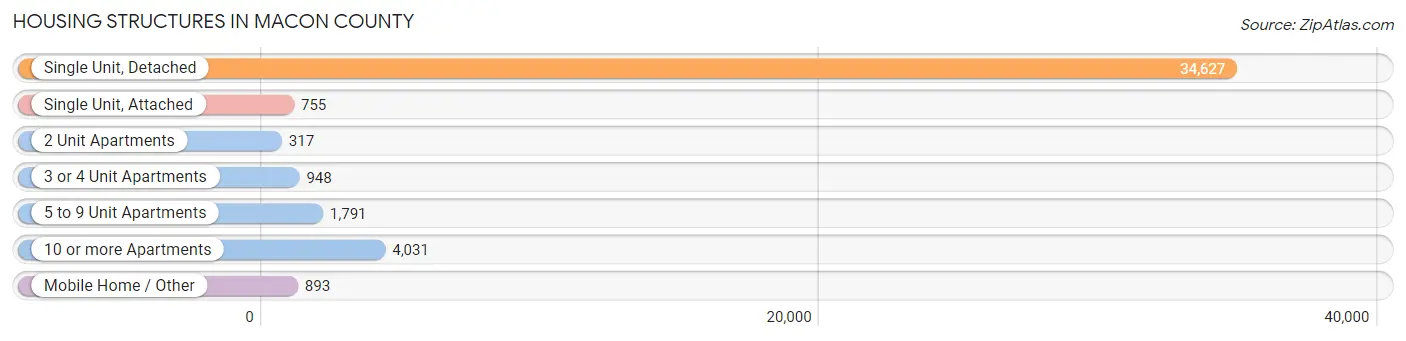
| Structure Type | # Housing Units | % Housing Units |
| Single Unit, Detached | 34,627 | 79.9% |
| Single Unit, Attached | 755 | 1.7% |
| 2 Unit Apartments | 317 | 0.7% |
| 3 or 4 Unit Apartments | 948 | 2.2% |
| 5 to 9 Unit Apartments | 1,791 | 4.1% |
| 10 or more Apartments | 4,031 | 9.3% |
| Mobile Home / Other | 893 | 2.1% |
| Total | 43,362 | 100.0% |
Housing Structures by Occupancy in Macon County
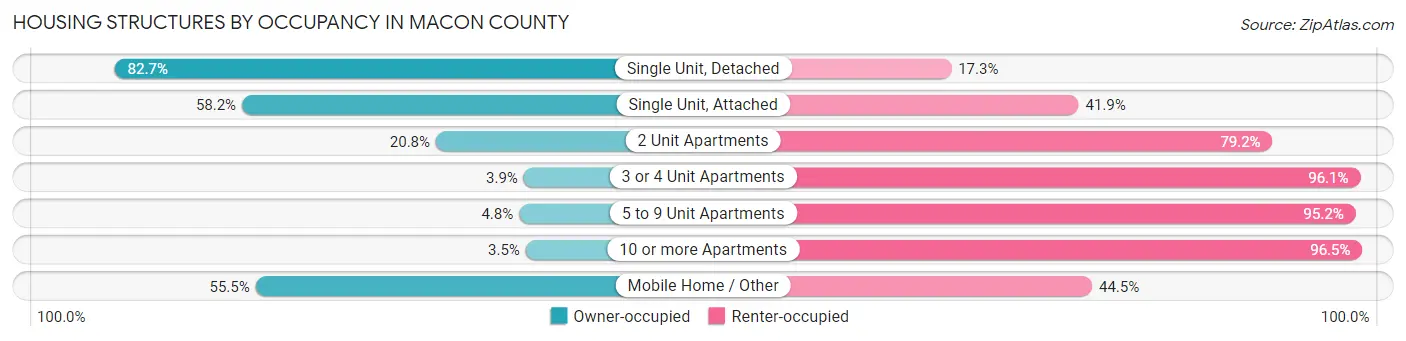
| Structure Type | Owner-occupied | Renter-occupied |
| Single Unit, Detached | 28,624 (82.7%) | 6,003 (17.3%) |
| Single Unit, Attached | 439 (58.2%) | 316 (41.8%) |
| 2 Unit Apartments | 66 (20.8%) | 251 (79.2%) |
| 3 or 4 Unit Apartments | 37 (3.9%) | 911 (96.1%) |
| 5 to 9 Unit Apartments | 86 (4.8%) | 1,705 (95.2%) |
| 10 or more Apartments | 142 (3.5%) | 3,889 (96.5%) |
| Mobile Home / Other | 496 (55.5%) | 397 (44.5%) |
| Total | 29,890 (68.9%) | 13,472 (31.1%) |
Housing Structures by Number of Rooms in Macon County
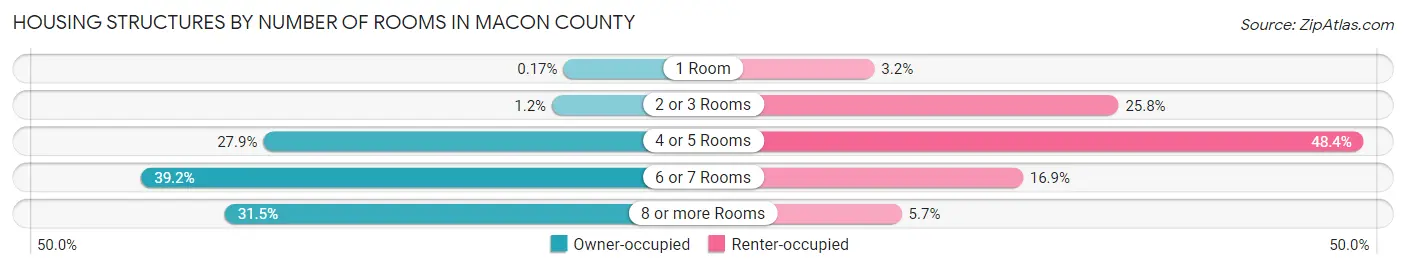
| Number of Rooms | Owner-occupied | Renter-occupied |
| 1 Room | 50 (0.2%) | 430 (3.2%) |
| 2 or 3 Rooms | 367 (1.2%) | 3,471 (25.8%) |
| 4 or 5 Rooms | 8,348 (27.9%) | 6,524 (48.4%) |
| 6 or 7 Rooms | 11,716 (39.2%) | 2,278 (16.9%) |
| 8 or more Rooms | 9,409 (31.5%) | 769 (5.7%) |
| Total | 29,890 (100.0%) | 13,472 (100.0%) |
Housing Structure by Heating Type in Macon County
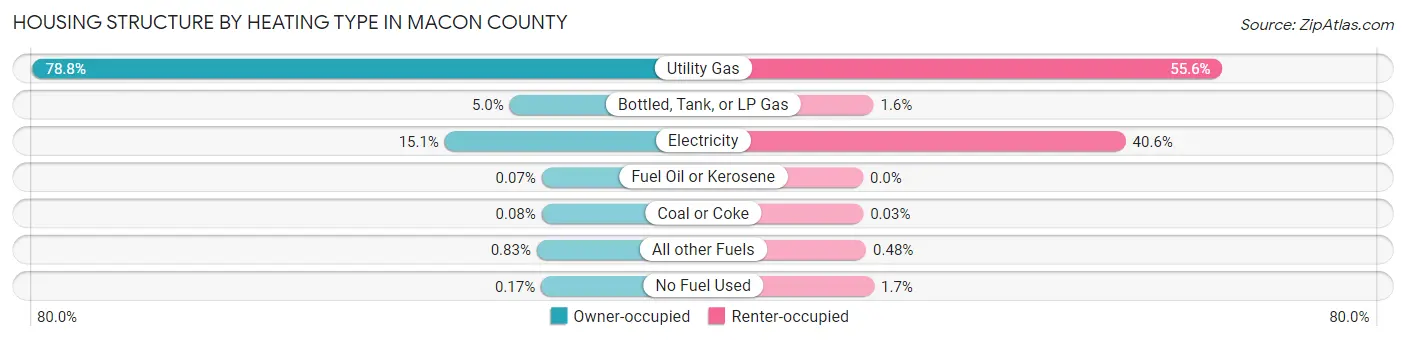
| Heating Type | Owner-occupied | Renter-occupied |
| Utility Gas | 23,544 (78.8%) | 7,484 (55.5%) |
| Bottled, Tank, or LP Gas | 1,499 (5.0%) | 218 (1.6%) |
| Electricity | 4,502 (15.1%) | 5,470 (40.6%) |
| Fuel Oil or Kerosene | 21 (0.1%) | 0 (0.0%) |
| Coal or Coke | 24 (0.1%) | 4 (0.0%) |
| All other Fuels | 248 (0.8%) | 65 (0.5%) |
| No Fuel Used | 52 (0.2%) | 231 (1.7%) |
| Total | 29,890 (100.0%) | 13,472 (100.0%) |
Household Vehicle Usage in Macon County
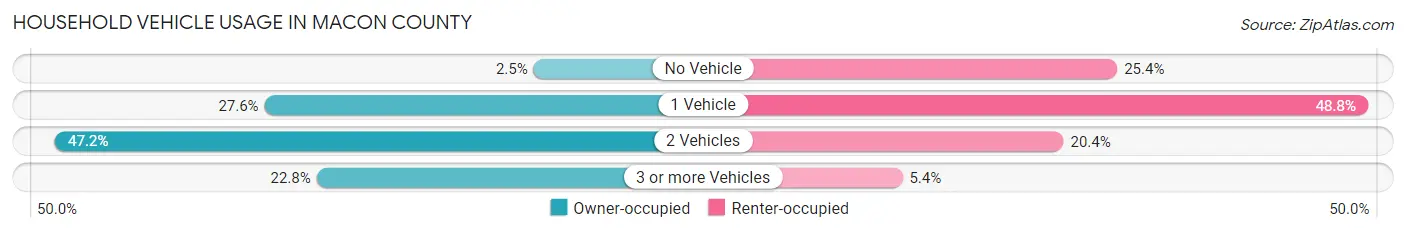
| Vehicles per Household | Owner-occupied | Renter-occupied |
| No Vehicle | 745 (2.5%) | 3,425 (25.4%) |
| 1 Vehicle | 8,252 (27.6%) | 6,574 (48.8%) |
| 2 Vehicles | 14,092 (47.1%) | 2,749 (20.4%) |
| 3 or more Vehicles | 6,801 (22.8%) | 724 (5.4%) |
| Total | 29,890 (100.0%) | 13,472 (100.0%) |
Real Estate & Mortgages in Macon County
Real Estate and Mortgage Overview in Macon County
| Characteristic | Without Mortgage | With Mortgage |
| Housing Units | 14,124 | 15,766 |
| Median Property Value | $109,300 | $129,300 |
| Median Household Income | $66,312 | $2,837 |
| Monthly Housing Costs | $516 | $579 |
| Real Estate Taxes | $2,230 | $219 |
Property Value by Mortgage Status in Macon County
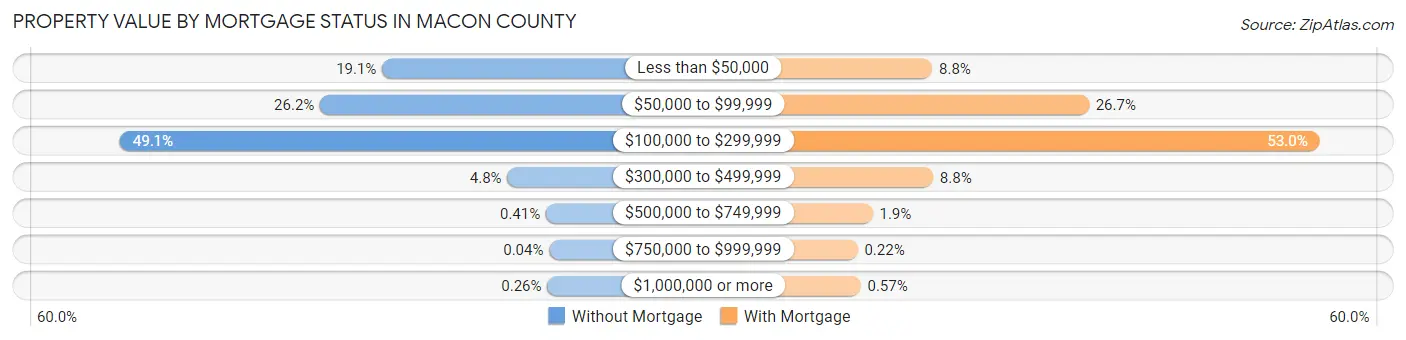
| Property Value | Without Mortgage | With Mortgage |
| Less than $50,000 | 2,702 (19.1%) | 1,380 (8.7%) |
| $50,000 to $99,999 | 3,704 (26.2%) | 4,201 (26.7%) |
| $100,000 to $299,999 | 6,937 (49.1%) | 8,361 (53.0%) |
| $300,000 to $499,999 | 681 (4.8%) | 1,393 (8.8%) |
| $500,000 to $749,999 | 58 (0.4%) | 306 (1.9%) |
| $750,000 to $999,999 | 5 (0.0%) | 35 (0.2%) |
| $1,000,000 or more | 37 (0.3%) | 90 (0.6%) |
| Total | 14,124 (100.0%) | 15,766 (100.0%) |
Household Income by Mortgage Status in Macon County
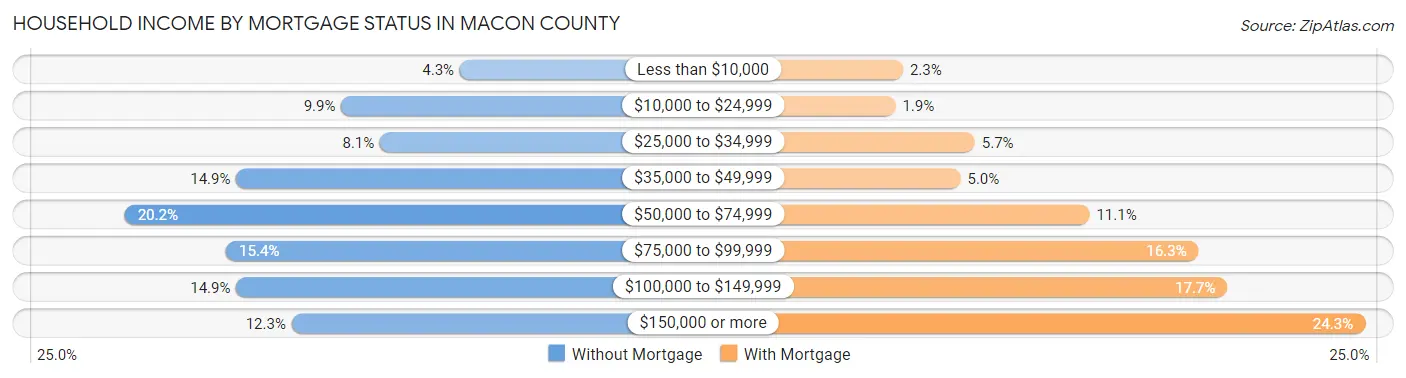
| Household Income | Without Mortgage | With Mortgage |
| Less than $10,000 | 603 (4.3%) | 357 (2.3%) |
| $10,000 to $24,999 | 1,401 (9.9%) | 299 (1.9%) |
| $25,000 to $34,999 | 1,140 (8.1%) | 895 (5.7%) |
| $35,000 to $49,999 | 2,107 (14.9%) | 789 (5.0%) |
| $50,000 to $74,999 | 2,857 (20.2%) | 1,756 (11.1%) |
| $75,000 to $99,999 | 2,175 (15.4%) | 2,575 (16.3%) |
| $100,000 to $149,999 | 2,107 (14.9%) | 2,790 (17.7%) |
| $150,000 or more | 1,734 (12.3%) | 3,825 (24.3%) |
| Total | 14,124 (100.0%) | 15,766 (100.0%) |
Property Value to Household Income Ratio in Macon County
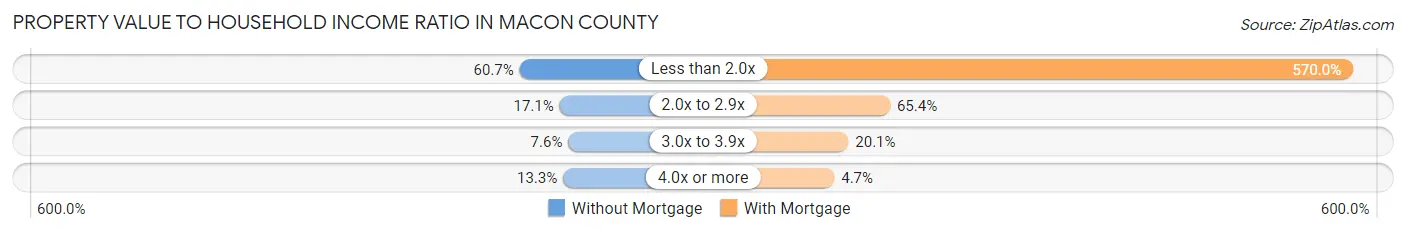
| Value-to-Income Ratio | Without Mortgage | With Mortgage |
| Less than 2.0x | 8,575 (60.7%) | 89,860 (570.0%) |
| 2.0x to 2.9x | 2,413 (17.1%) | 10,318 (65.4%) |
| 3.0x to 3.9x | 1,076 (7.6%) | 3,168 (20.1%) |
| 4.0x or more | 1,879 (13.3%) | 746 (4.7%) |
| Total | 14,124 (100.0%) | 15,766 (100.0%) |
Real Estate Taxes by Mortgage Status in Macon County
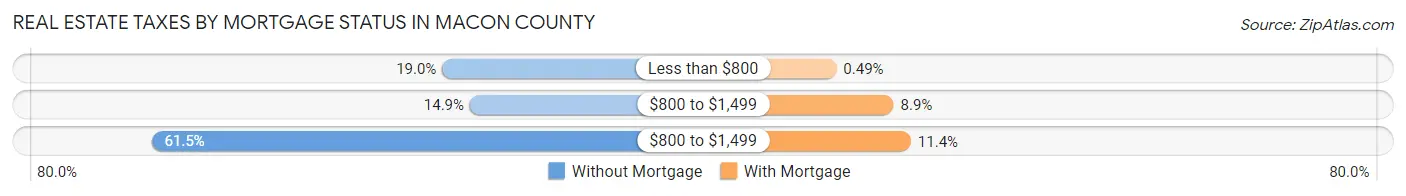
| Property Taxes | Without Mortgage | With Mortgage |
| Less than $800 | 2,681 (19.0%) | 77 (0.5%) |
| $800 to $1,499 | 2,110 (14.9%) | 1,396 (8.8%) |
| $800 to $1,499 | 8,680 (61.5%) | 1,794 (11.4%) |
| Total | 14,124 (100.0%) | 15,766 (100.0%) |
Health & Disability in Macon County
Health Insurance Coverage by Age in Macon County

| Age Bracket | With Coverage | Without Coverage |
| Under 6 Years | 7,534 (97.5%) | 195 (2.5%) |
| 6 to 18 Years | 16,186 (96.2%) | 638 (3.8%) |
| 19 to 25 Years | 7,350 (87.5%) | 1,051 (12.5%) |
| 26 to 34 Years | 10,267 (92.9%) | 785 (7.1%) |
| 35 to 44 Years | 10,779 (93.0%) | 805 (7.0%) |
| 45 to 54 Years | 10,750 (92.8%) | 829 (7.2%) |
| 55 to 64 Years | 13,589 (96.6%) | 486 (3.5%) |
| 65 to 74 Years | 11,712 (99.2%) | 91 (0.8%) |
| 75 Years and older | 8,520 (99.8%) | 16 (0.2%) |
| Total | 96,687 (95.2%) | 4,896 (4.8%) |
Health Insurance Coverage by Citizenship Status in Macon County
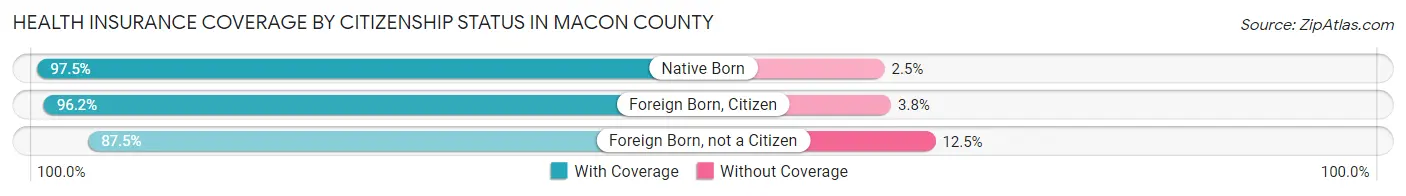
| Citizenship Status | With Coverage | Without Coverage |
| Native Born | 7,534 (97.5%) | 195 (2.5%) |
| Foreign Born, Citizen | 16,186 (96.2%) | 638 (3.8%) |
| Foreign Born, not a Citizen | 7,350 (87.5%) | 1,051 (12.5%) |
Health Insurance Coverage by Household Income in Macon County
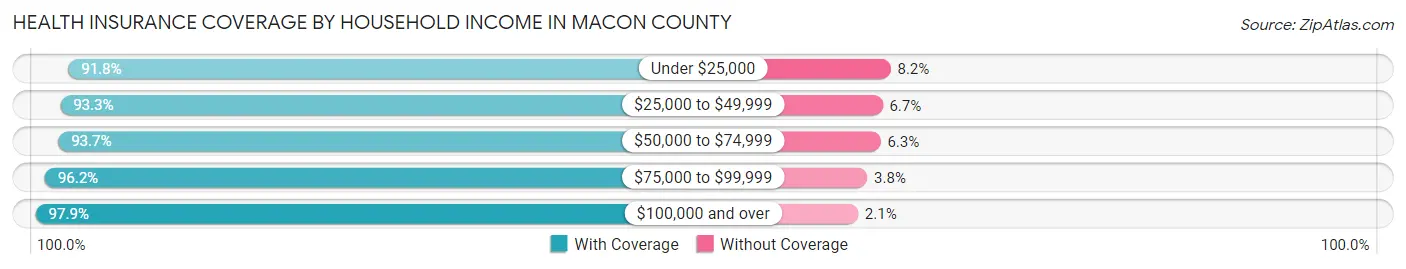
| Household Income | With Coverage | Without Coverage |
| Under $25,000 | 13,591 (91.8%) | 1,212 (8.2%) |
| $25,000 to $49,999 | 18,674 (93.3%) | 1,336 (6.7%) |
| $50,000 to $74,999 | 14,939 (93.7%) | 1,006 (6.3%) |
| $75,000 to $99,999 | 15,181 (96.2%) | 601 (3.8%) |
| $100,000 and over | 33,072 (97.9%) | 703 (2.1%) |
Public vs Private Health Insurance Coverage by Age in Macon County
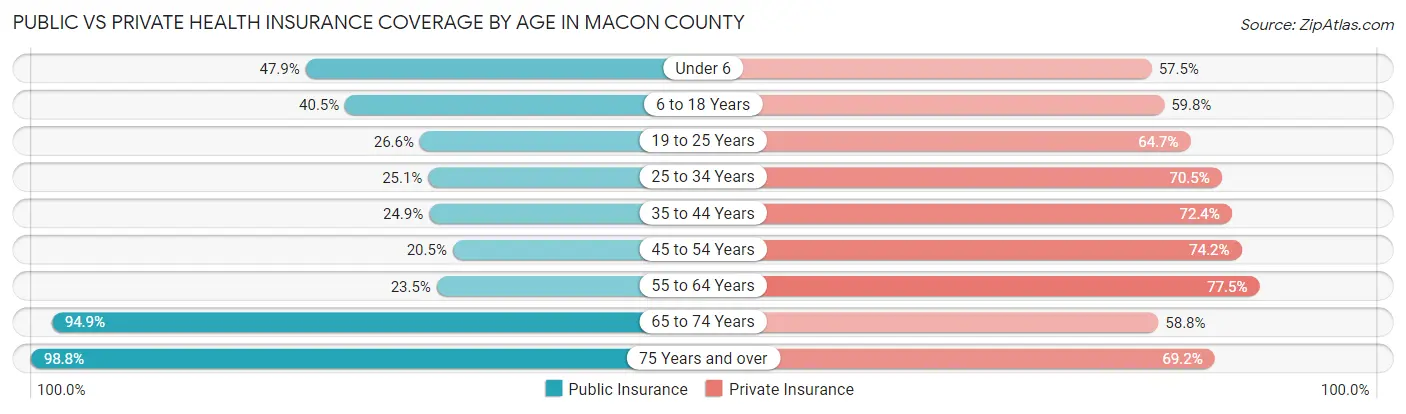
| Age Bracket | Public Insurance | Private Insurance |
| Under 6 | 3,698 (47.8%) | 4,446 (57.5%) |
| 6 to 18 Years | 6,816 (40.5%) | 10,067 (59.8%) |
| 19 to 25 Years | 2,238 (26.6%) | 5,435 (64.7%) |
| 25 to 34 Years | 2,773 (25.1%) | 7,789 (70.5%) |
| 35 to 44 Years | 2,888 (24.9%) | 8,381 (72.4%) |
| 45 to 54 Years | 2,377 (20.5%) | 8,587 (74.2%) |
| 55 to 64 Years | 3,309 (23.5%) | 10,907 (77.5%) |
| 65 to 74 Years | 11,206 (94.9%) | 6,935 (58.8%) |
| 75 Years and over | 8,437 (98.8%) | 5,904 (69.2%) |
| Total | 43,742 (43.1%) | 68,451 (67.4%) |
Disability Status by Sex by Age in Macon County
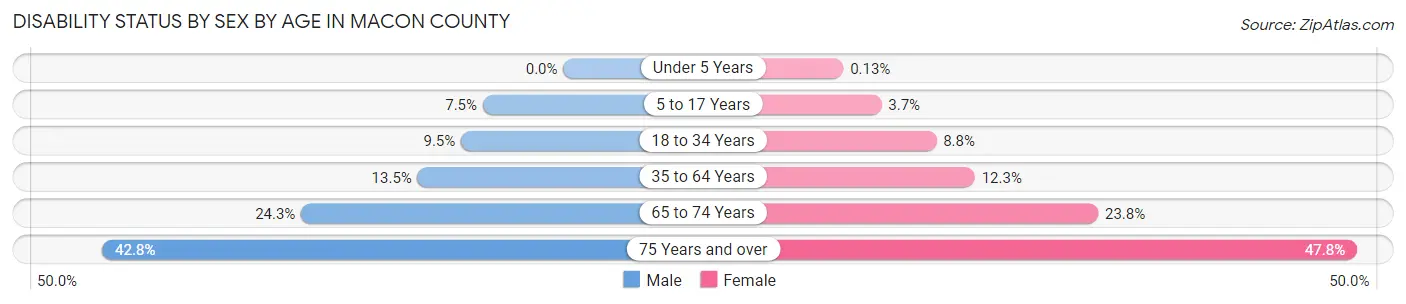
| Age Bracket | Male | Female |
| Under 5 Years | 0 (0.0%) | 4 (0.1%) |
| 5 to 17 Years | 647 (7.5%) | 303 (3.7%) |
| 18 to 34 Years | 961 (9.5%) | 934 (8.8%) |
| 35 to 64 Years | 2,434 (13.5%) | 2,374 (12.3%) |
| 65 to 74 Years | 1,336 (24.3%) | 1,501 (23.8%) |
| 75 Years and over | 1,519 (42.8%) | 2,385 (47.8%) |
Disability Class by Sex by Age in Macon County
Disability Class: Hearing Difficulty
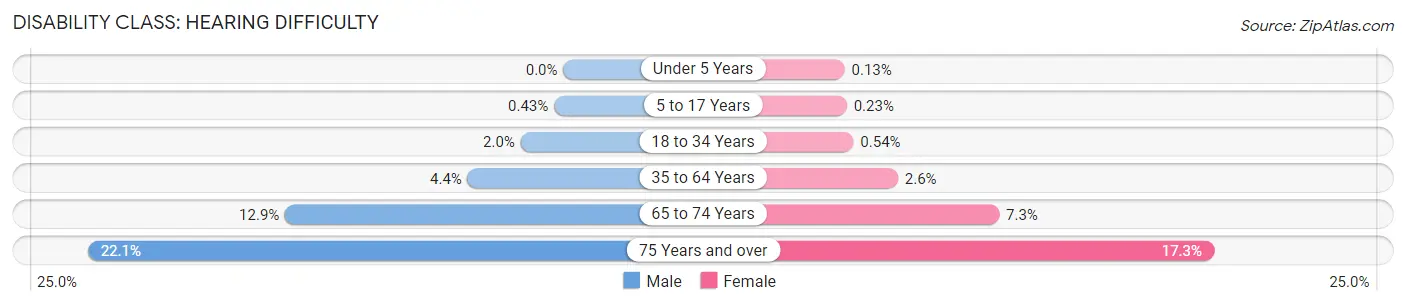
| Age Bracket | Male | Female |
| Under 5 Years | 0 (0.0%) | 4 (0.1%) |
| 5 to 17 Years | 37 (0.4%) | 19 (0.2%) |
| 18 to 34 Years | 201 (2.0%) | 58 (0.5%) |
| 35 to 64 Years | 800 (4.4%) | 501 (2.6%) |
| 65 to 74 Years | 709 (12.9%) | 461 (7.3%) |
| 75 Years and over | 783 (22.1%) | 861 (17.3%) |
Disability Class: Vision Difficulty
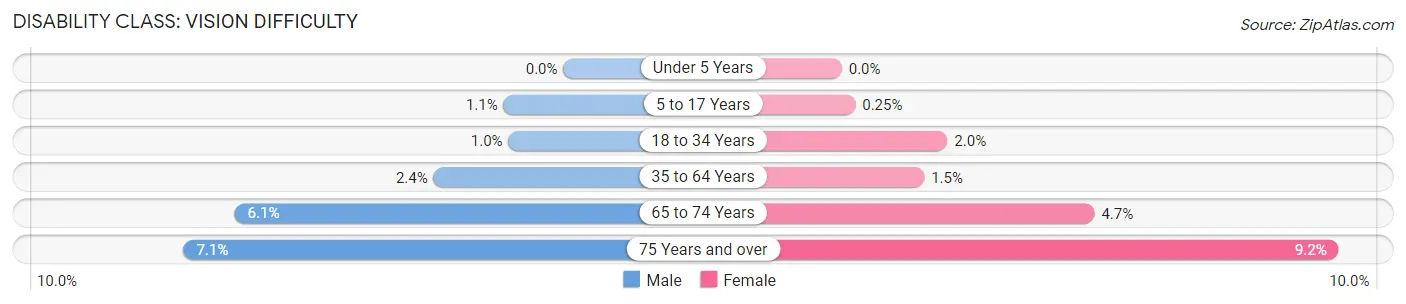
| Age Bracket | Male | Female |
| Under 5 Years | 0 (0.0%) | 0 (0.0%) |
| 5 to 17 Years | 96 (1.1%) | 21 (0.3%) |
| 18 to 34 Years | 103 (1.0%) | 209 (2.0%) |
| 35 to 64 Years | 434 (2.4%) | 295 (1.5%) |
| 65 to 74 Years | 335 (6.1%) | 296 (4.7%) |
| 75 Years and over | 250 (7.0%) | 460 (9.2%) |
Disability Class: Cognitive Difficulty
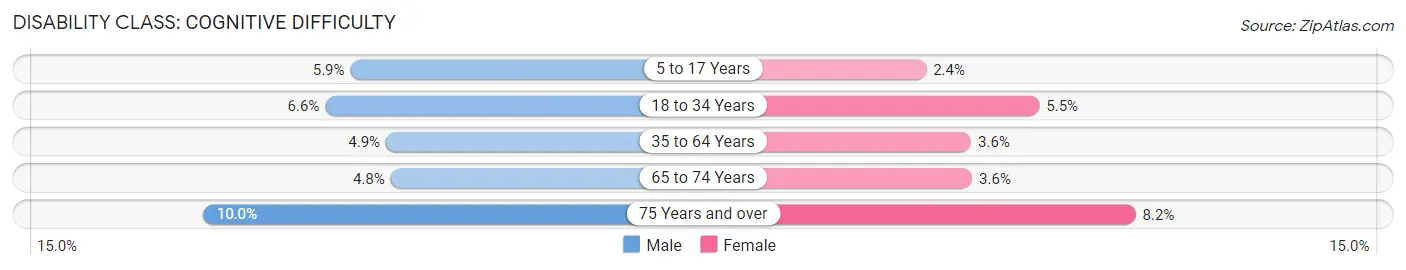
| Age Bracket | Male | Female |
| 5 to 17 Years | 514 (5.9%) | 194 (2.4%) |
| 18 to 34 Years | 671 (6.6%) | 586 (5.5%) |
| 35 to 64 Years | 889 (4.9%) | 692 (3.6%) |
| 65 to 74 Years | 264 (4.8%) | 229 (3.6%) |
| 75 Years and over | 355 (10.0%) | 408 (8.2%) |
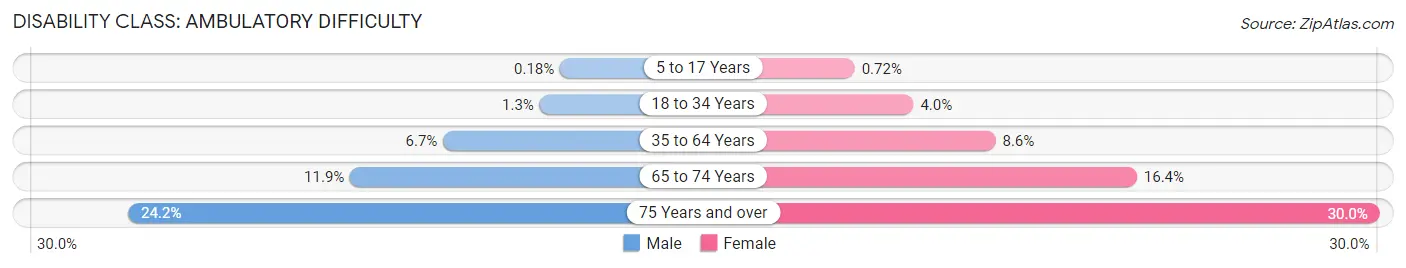
Disability Class: Ambulatory Difficulty
| Age Bracket | Male | Female |
| 5 to 17 Years | 16 (0.2%) | 59 (0.7%) |
| 18 to 34 Years | 134 (1.3%) | 425 (4.0%) |
| 35 to 64 Years | 1,205 (6.7%) | 1,646 (8.6%) |
| 65 to 74 Years | 652 (11.9%) | 1,037 (16.4%) |
| 75 Years and over | 860 (24.2%) | 1,494 (29.9%) |
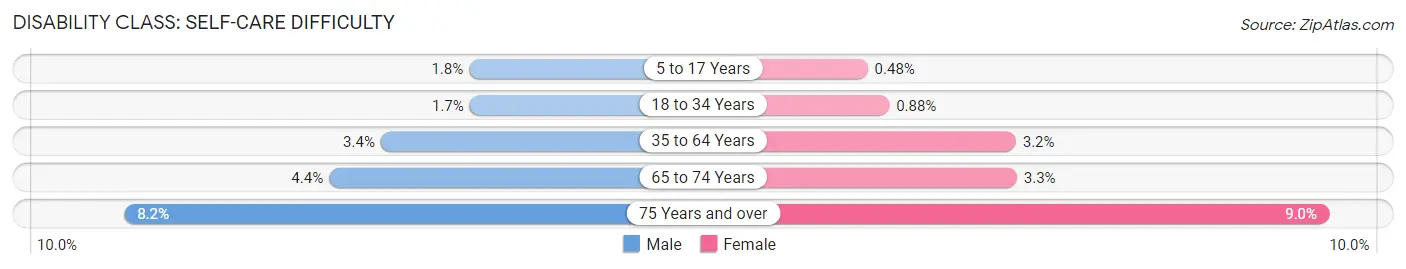
Disability Class: Self-Care Difficulty
| Age Bracket | Male | Female |
| 5 to 17 Years | 152 (1.8%) | 40 (0.5%) |
| 18 to 34 Years | 176 (1.7%) | 94 (0.9%) |
| 35 to 64 Years | 611 (3.4%) | 621 (3.2%) |
| 65 to 74 Years | 239 (4.3%) | 205 (3.3%) |
| 75 Years and over | 289 (8.2%) | 451 (9.0%) |
Technology Access in Macon County
Computing Device Access in Macon County
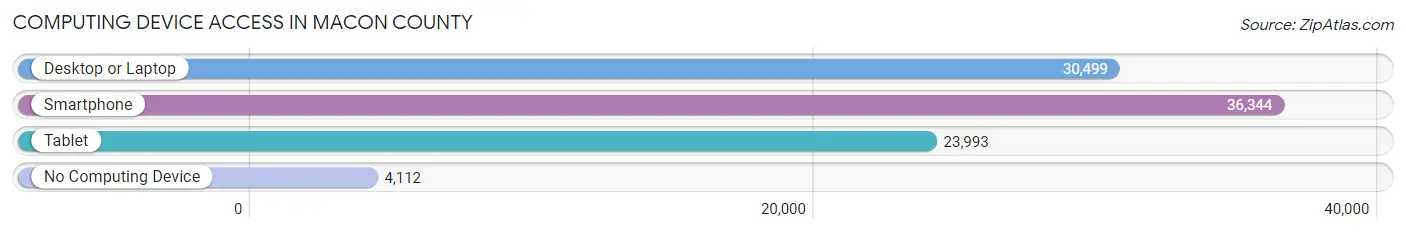
| Device Type | # Households | % Households |
| Desktop or Laptop | 30,499 | 70.3% |
| Smartphone | 36,344 | 83.8% |
| Tablet | 23,993 | 55.3% |
| No Computing Device | 4,112 | 9.5% |
| Total | 43,362 | 100.0% |
Internet Access in Macon County
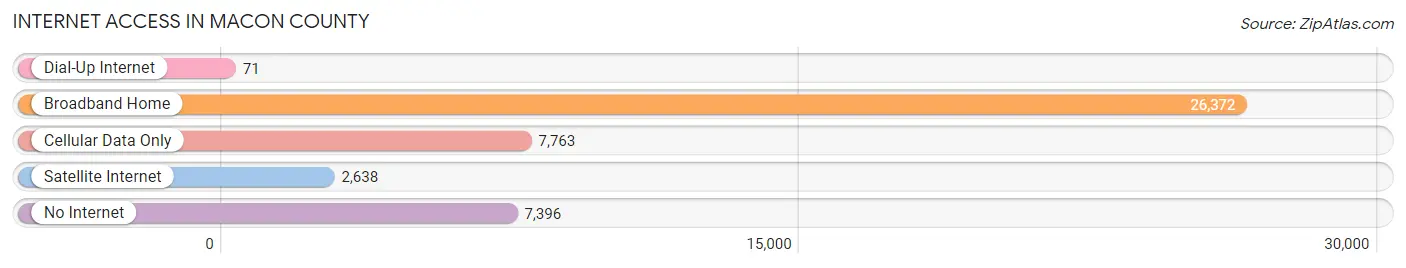
| Internet Type | # Households | % Households |
| Dial-Up Internet | 71 | 0.2% |
| Broadband Home | 26,372 | 60.8% |
| Cellular Data Only | 7,763 | 17.9% |
| Satellite Internet | 2,638 | 6.1% |
| No Internet | 7,396 | 17.1% |
| Total | 43,362 | 100.0% |
Macon County Summary
Macon County is located in the central part of the state of Illinois, in the United States. It is part of the Decatur Metropolitan Statistical Area and is bordered by the counties of Piatt, DeWitt, Logan, Shelby, Christian, and Sangamon. The county seat is Decatur, which is also the largest city in the county. The county was established in 1829 and named after Nathaniel Macon, a Revolutionary War hero and U.S. Senator from North Carolina.
Geography
Macon County covers an area of 576 square miles and is located in the central part of the state of Illinois. It is bordered by the counties of Piatt, DeWitt, Logan, Shelby, Christian, and Sangamon. The county is mostly flat, with some rolling hills in the northern and western parts. The Sangamon River flows through the county, and there are several small lakes and ponds scattered throughout the area. The county is part of the Decatur Metropolitan Statistical Area.
Climate
Macon County has a humid continental climate, with hot, humid summers and cold, dry winters. The average annual temperature is around 54°F, with an average high of around 78°F in the summer and an average low of around 30°F in the winter. The average annual precipitation is around 40 inches, with most of it falling in the spring and summer months.
Demographics
As of the 2010 census, Macon County had a population of 110,768. The racial makeup of the county was 87.3% White, 8.2% African American, 0.5% Native American, 1.2% Asian, 0.1% Pacific Islander, 1.3% from other races, and 1.5% from two or more races. Hispanic or Latino of any race were 3.3% of the population.
The median household income in Macon County was $45,945 in 2019, and the median family income was $54,945. The per capita income was $25,845. About 11.3% of the population was below the poverty line.
Economy
Macon County is home to several major employers, including Archer Daniels Midland, Tate & Lyle, and Caterpillar. The county is also home to several smaller businesses, including manufacturing, retail, and service industries. The county is also home to several educational institutions, including Millikin University, Richland Community College, and the University of Illinois at Urbana-Champaign.
The county is served by several major highways, including Interstate 72, U.S. Route 51, and U.S. Route 36. The Decatur Airport is located in the county, and Amtrak provides rail service to the area.
Macon County is a major agricultural center, with corn, soybeans, and wheat being the main crops. Livestock production is also important to the county's economy, with cattle, hogs, and poultry being the main animals raised. The county is also home to several wineries and breweries.
Conclusion
Macon County is a vibrant and diverse county located in the central part of the state of Illinois. It is home to several major employers, educational institutions, and agricultural operations. The county is served by several major highways and rail lines, and the Decatur Airport provides air service to the area. The county has a population of 110,768, with a median household income of $45,945. Macon County is a great place to live, work, and play.
Common Questions
What is the Total Population of Macon County?
Total Population of Macon County is 103,542.
What is the Total Male Population of Macon County?
Total Male Population of Macon County is 49,921.
What is the Total Female Population of Macon County?
Total Female Population of Macon County is 53,621.
What is the Ratio of Males per 100 Females in Macon County?
There are 93.10 Males per 100 Females in Macon County.
What is the Ratio of Females per 100 Males in Macon County?
There are 107.41 Females per 100 Males in Macon County.
What is the Median Population Age in Macon County?
Median Population Age in Macon County is 40.7 Years.
What is the Average Family Size in Macon County
Average Family Size in Macon County is 3.0 People.
What is the Average Household Size in Macon County
Average Household Size in Macon County is 2.3 People.
What is Per Capita Income in Macon County?
Per Capita income in Macon County is $34,644.
What is the Median Family Income in Macon County?
Median Family Income in Macon County is $81,771.
What is the Median Household income in Macon County?
Median Household Income in Macon County is $59,622.
What is Income or Wage Gap in Macon County?
Income or Wage Gap in Macon County is 30.4%.
Women in Macon County earn 69.6 cents for every dollar earned by a man.
What is Family Income Deficit in Macon County?
Family Income Deficit in Macon County is $11,732.
Families that are below poverty line in Macon County earn $11,732 less on average than the poverty threshold level.
What is Inequality or Gini Index in Macon County?
Inequality or Gini Index in Macon County is 0.47.
How Large is the Labor Force in Macon County?
There are 48,459 People in the Labor Forcein in Macon County.
What is the Percentage of People in the Labor Force in Macon County?
58.5% of People are in the Labor Force in Macon County.
What is the Unemployment Rate in Macon County?
Unemployment Rate in Macon County is 7.2%.