Logan County, IL
Logan County Map
Logan County Overview
28,027
TOTAL POPULATION
13,619
MALE POPULATION
14,408
FEMALE POPULATION
94.52
MALES / 100 FEMALES
105.79
FEMALES / 100 MALES
40.3
MEDIAN AGE
2.8
AVG FAMILY SIZE
2.2
AVG HOUSEHOLD SIZE
$33,280
PER CAPITA INCOME
$80,993
AVG FAMILY INCOME
$62,547
AVG HOUSEHOLD INCOME
36.7%
WAGE / INCOME GAP [ % ]
63.3¢/ $1
WAGE / INCOME GAP [ $ ]
0.44
INEQUALITY / GINI INDEX
12,938
LABOR FORCE [ PEOPLE ]
55.7%
PERCENT IN LABOR FORCE
5.2%
UNEMPLOYMENT RATE
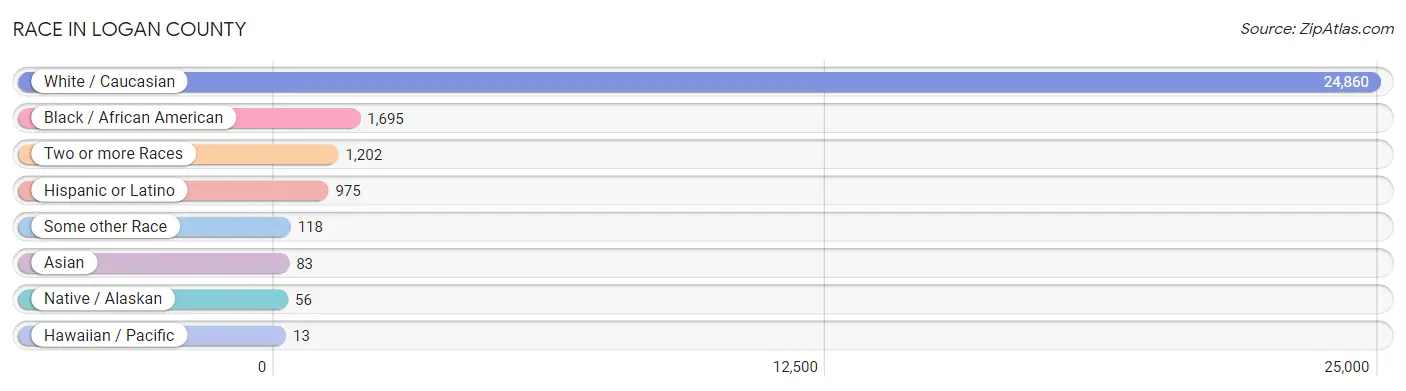
Race in Logan County
The most populous races in Logan County are White / Caucasian (24,860 | 88.7%), Black / African American (1,695 | 6.0%), and Two or more Races (1,202 | 4.3%).
| Race | # Population | % Population |
| Asian | 83 | 0.3% |
| Black / African American | 1,695 | 6.0% |
| Hawaiian / Pacific | 13 | 0.1% |
| Hispanic or Latino | 975 | 3.5% |
| Native / Alaskan | 56 | 0.2% |
| White / Caucasian | 24,860 | 88.7% |
| Two or more Races | 1,202 | 4.3% |
| Some other Race | 118 | 0.4% |
| Total | 28,027 | 100.0% |
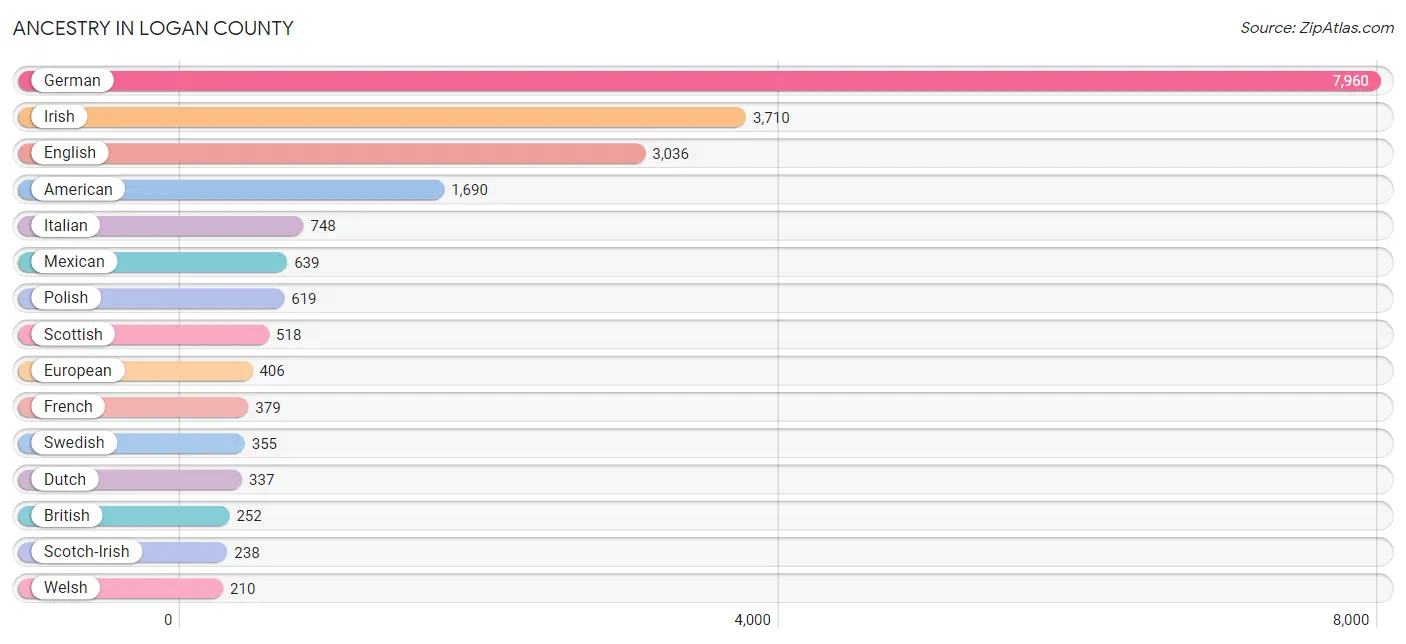
Ancestry in Logan County
The most populous ancestries reported in Logan County are German (7,960 | 28.4%), Irish (3,710 | 13.2%), English (3,036 | 10.8%), American (1,690 | 6.0%), and Italian (748 | 2.7%), together accounting for 61.2% of all Logan County residents.
| Ancestry | # Population | % Population |
| African | 22 | 0.1% |
| American | 1,690 | 6.0% |
| Apache | 8 | 0.0% |
| Argentinean | 1 | 0.0% |
| Armenian | 23 | 0.1% |
| Assyrian / Chaldean / Syriac | 26 | 0.1% |
| Austrian | 42 | 0.2% |
| Belgian | 40 | 0.1% |
| Blackfeet | 80 | 0.3% |
| British | 252 | 0.9% |
| Burmese | 40 | 0.1% |
| Canadian | 10 | 0.0% |
| Central American | 63 | 0.2% |
| Central American Indian | 42 | 0.2% |
| Cherokee | 85 | 0.3% |
| Colombian | 75 | 0.3% |
| Comanche | 32 | 0.1% |
| Creek | 14 | 0.1% |
| Croatian | 33 | 0.1% |
| Czech | 57 | 0.2% |
| Czechoslovakian | 16 | 0.1% |
| Danish | 27 | 0.1% |
| Dutch | 337 | 1.2% |
| Eastern European | 22 | 0.1% |
| English | 3,036 | 10.8% |
| European | 406 | 1.5% |
| Filipino | 18 | 0.1% |
| Finnish | 5 | 0.0% |
| French | 379 | 1.3% |
| French Canadian | 54 | 0.2% |
| German | 7,960 | 28.4% |
| Greek | 5 | 0.0% |
| Guatemalan | 42 | 0.2% |
| Hungarian | 65 | 0.2% |
| Indian (Asian) | 46 | 0.2% |
| Indonesian | 1 | 0.0% |
| Irish | 3,710 | 13.2% |
| Israeli | 5 | 0.0% |
| Italian | 748 | 2.7% |
| Jamaican | 4 | 0.0% |
| Kiowa | 5 | 0.0% |
| Korean | 192 | 0.7% |
| Laotian | 19 | 0.1% |
| Latvian | 6 | 0.0% |
| Lithuanian | 82 | 0.3% |
| Menominee | 7 | 0.0% |
| Mexican | 639 | 2.3% |
| Mexican American Indian | 9 | 0.0% |
| Native Hawaiian | 37 | 0.1% |
| Northern European | 61 | 0.2% |
| Norwegian | 148 | 0.5% |
| Panamanian | 21 | 0.1% |
| Polish | 619 | 2.2% |
| Portuguese | 12 | 0.0% |
| Potawatomi | 2 | 0.0% |
| Puerto Rican | 136 | 0.5% |
| Romanian | 9 | 0.0% |
| Russian | 38 | 0.1% |
| Scandinavian | 78 | 0.3% |
| Scotch-Irish | 238 | 0.9% |
| Scottish | 518 | 1.8% |
| Serbian | 18 | 0.1% |
| Sioux | 9 | 0.0% |
| Slovak | 17 | 0.1% |
| Slovene | 26 | 0.1% |
| South American | 76 | 0.3% |
| Spaniard | 18 | 0.1% |
| Spanish | 9 | 0.0% |
| Subsaharan African | 26 | 0.1% |
| Swedish | 355 | 1.3% |
| Swiss | 74 | 0.3% |
| Ukrainian | 8 | 0.0% |
| Welsh | 210 | 0.7% |
| Yugoslavian | 7 | 0.0% | View All 74 Rows |
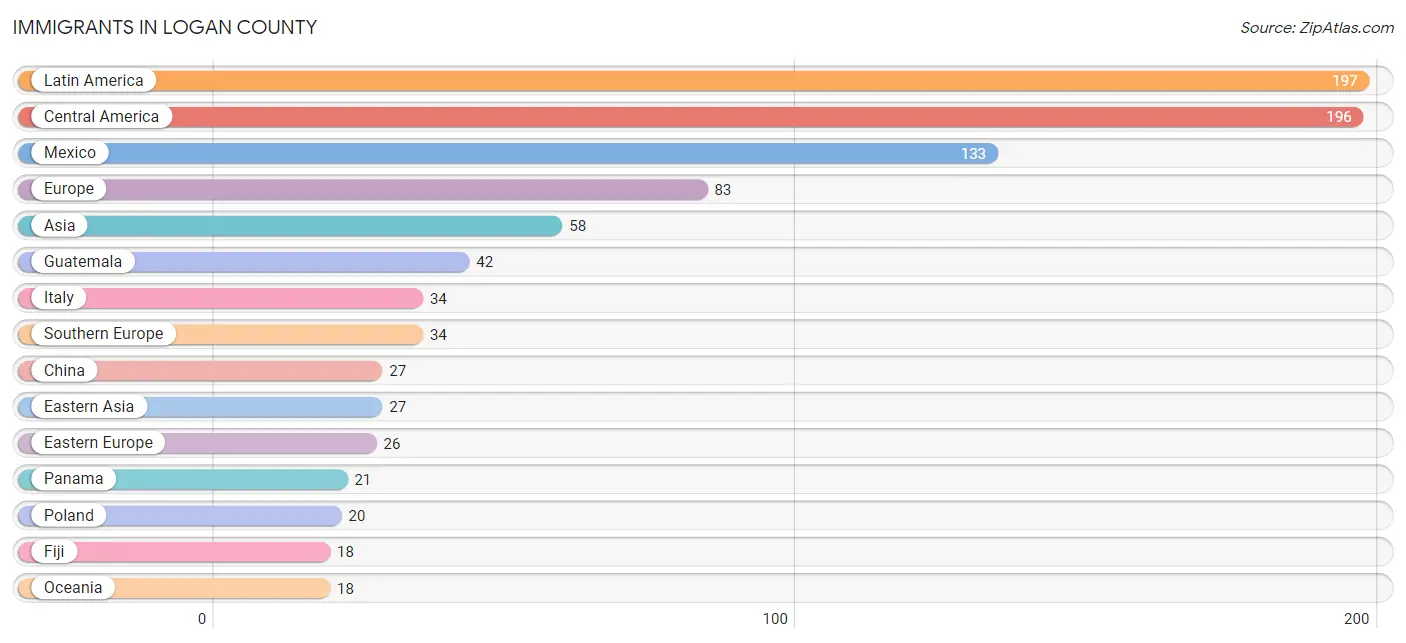
Immigrants in Logan County
The most numerous immigrant groups reported in Logan County came from Latin America (197 | 0.7%), Central America (196 | 0.7%), Mexico (133 | 0.5%), Europe (83 | 0.3%), and Asia (58 | 0.2%), together accounting for 2.4% of all Logan County residents.
| Immigration Origin | # Population | % Population |
| Argentina | 1 | 0.0% |
| Asia | 58 | 0.2% |
| Austria | 1 | 0.0% |
| Bosnia and Herzegovina | 5 | 0.0% |
| Central America | 196 | 0.7% |
| China | 27 | 0.1% |
| Czechoslovakia | 1 | 0.0% |
| Eastern Asia | 27 | 0.1% |
| Eastern Europe | 26 | 0.1% |
| Europe | 83 | 0.3% |
| Fiji | 18 | 0.1% |
| Germany | 10 | 0.0% |
| Guatemala | 42 | 0.2% |
| India | 4 | 0.0% |
| Italy | 34 | 0.1% |
| Latin America | 197 | 0.7% |
| Mexico | 133 | 0.5% |
| Northern Europe | 12 | 0.0% |
| Oceania | 18 | 0.1% |
| Panama | 21 | 0.1% |
| Philippines | 12 | 0.0% |
| Poland | 20 | 0.1% |
| Scotland | 6 | 0.0% |
| South America | 1 | 0.0% |
| South Central Asia | 4 | 0.0% |
| South Eastern Asia | 13 | 0.1% |
| Southern Europe | 34 | 0.1% |
| Sweden | 5 | 0.0% |
| Syria | 14 | 0.1% |
| Vietnam | 1 | 0.0% |
| Western Asia | 14 | 0.1% |
| Western Europe | 11 | 0.0% | View All 32 Rows |
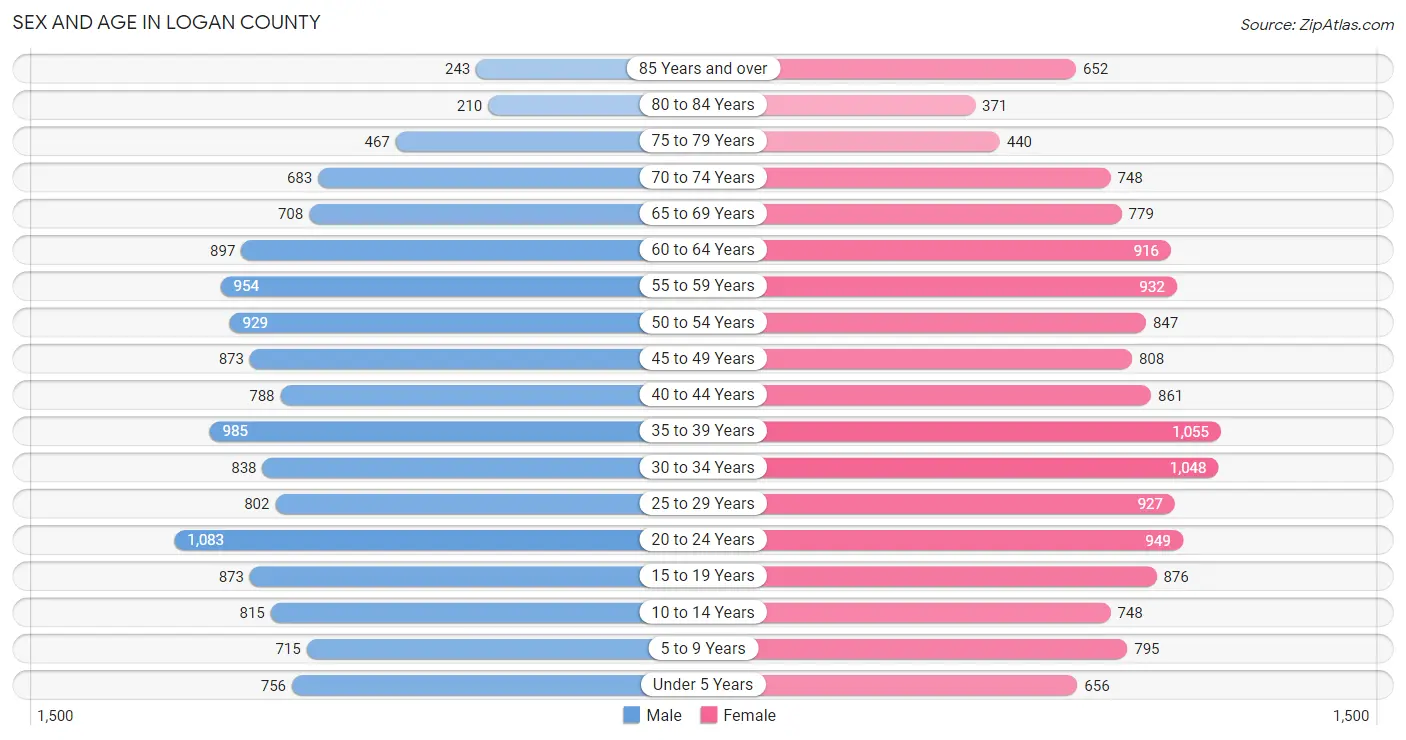
Sex and Age in Logan County
Sex and Age in Logan County
The most populous age groups in Logan County are 20 to 24 Years (1,083 | 8.0%) for men and 35 to 39 Years (1,055 | 7.3%) for women.
| Age Bracket | Male | Female |
| Under 5 Years | 756 (5.6%) | 656 (4.5%) |
| 5 to 9 Years | 715 (5.2%) | 795 (5.5%) |
| 10 to 14 Years | 815 (6.0%) | 748 (5.2%) |
| 15 to 19 Years | 873 (6.4%) | 876 (6.1%) |
| 20 to 24 Years | 1,083 (8.0%) | 949 (6.6%) |
| 25 to 29 Years | 802 (5.9%) | 927 (6.4%) |
| 30 to 34 Years | 838 (6.1%) | 1,048 (7.3%) |
| 35 to 39 Years | 985 (7.2%) | 1,055 (7.3%) |
| 40 to 44 Years | 788 (5.8%) | 861 (6.0%) |
| 45 to 49 Years | 873 (6.4%) | 808 (5.6%) |
| 50 to 54 Years | 929 (6.8%) | 847 (5.9%) |
| 55 to 59 Years | 954 (7.0%) | 932 (6.5%) |
| 60 to 64 Years | 897 (6.6%) | 916 (6.4%) |
| 65 to 69 Years | 708 (5.2%) | 779 (5.4%) |
| 70 to 74 Years | 683 (5.0%) | 748 (5.2%) |
| 75 to 79 Years | 467 (3.4%) | 440 (3.0%) |
| 80 to 84 Years | 210 (1.5%) | 371 (2.6%) |
| 85 Years and over | 243 (1.8%) | 652 (4.5%) |
| Total | 13,619 (100.0%) | 14,408 (100.0%) |
Families and Households in Logan County
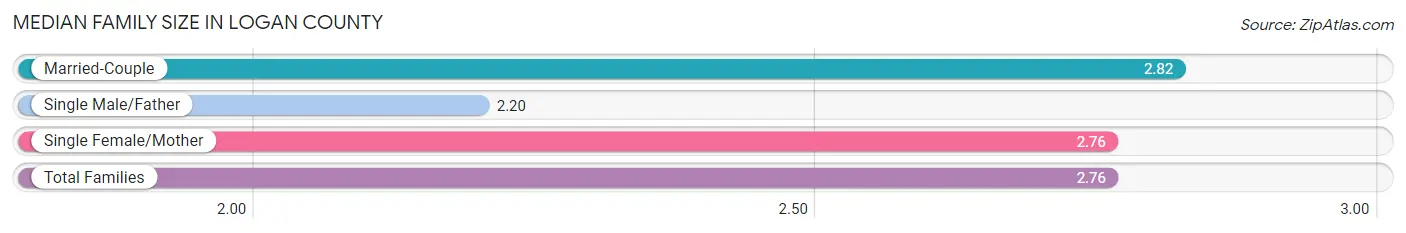
Median Family Size in Logan County
The median family size in Logan County is 2.76 persons per family, with married-couple families (5,158 | 74.7%) accounting for the largest median family size of 2.82 persons per family. On the other hand, single male/father families (534 | 7.7%) represent the smallest median family size with 2.20 persons per family.
| Family Type | # Families | Family Size |
| Married-Couple | 5,158 (74.7%) | 2.82 |
| Single Male/Father | 534 (7.7%) | 2.20 |
| Single Female/Mother | 1,214 (17.6%) | 2.76 |
| Total Families | 6,906 (100.0%) | 2.76 |
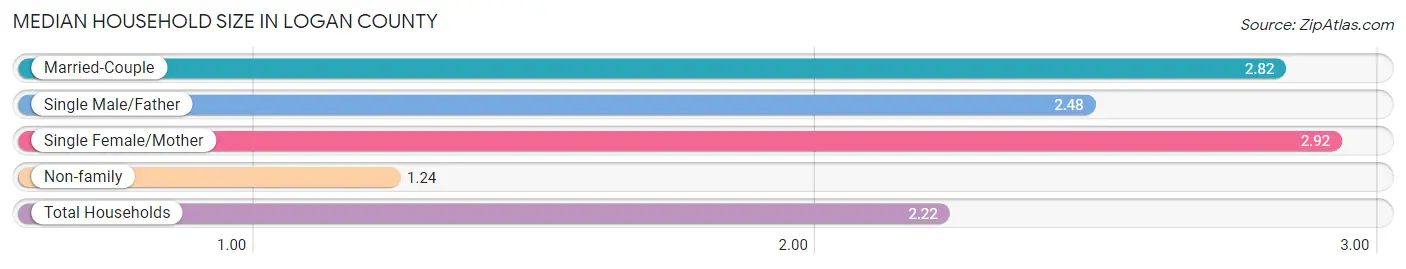
Median Household Size in Logan County
The median household size in Logan County is 2.22 persons per household, with single female/mother households (1,214 | 10.9%) accounting for the largest median household size of 2.92 persons per household. non-family households (4,195 | 37.8%) represent the smallest median household size with 1.24 persons per household.
| Household Type | # Households | Household Size |
| Married-Couple | 5,158 (46.5%) | 2.82 |
| Single Male/Father | 534 (4.8%) | 2.48 |
| Single Female/Mother | 1,214 (10.9%) | 2.92 |
| Non-family | 4,195 (37.8%) | 1.24 |
| Total Households | 11,101 (100.0%) | 2.22 |
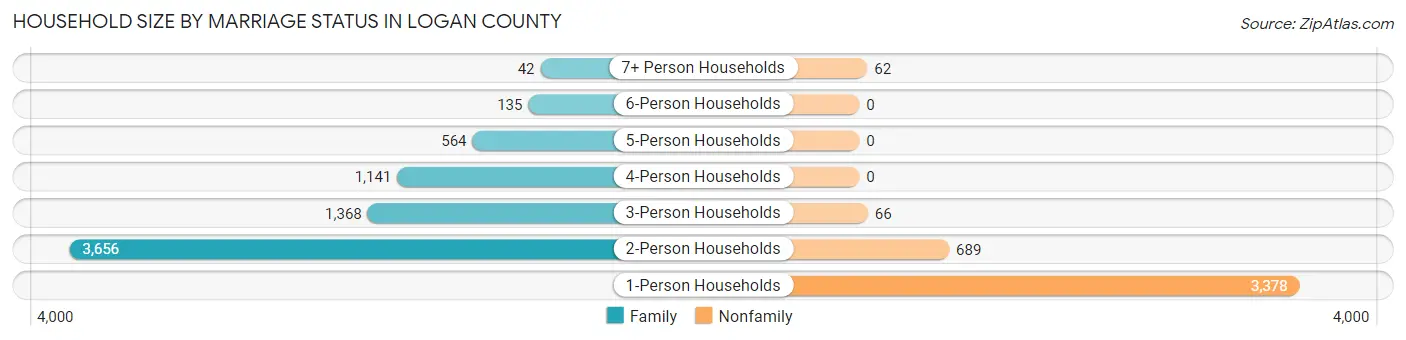
Household Size by Marriage Status in Logan County
Out of a total of 11,101 households in Logan County, 6,906 (62.2%) are family households, while 4,195 (37.8%) are nonfamily households. The most numerous type of family households are 2-person households, comprising 3,656, and the most common type of nonfamily households are 1-person households, comprising 3,378.
| Household Size | Family Households | Nonfamily Households |
| 1-Person Households | - | 3,378 (30.4%) |
| 2-Person Households | 3,656 (32.9%) | 689 (6.2%) |
| 3-Person Households | 1,368 (12.3%) | 66 (0.6%) |
| 4-Person Households | 1,141 (10.3%) | 0 (0.0%) |
| 5-Person Households | 564 (5.1%) | 0 (0.0%) |
| 6-Person Households | 135 (1.2%) | 0 (0.0%) |
| 7+ Person Households | 42 (0.4%) | 62 (0.6%) |
| Total | 6,906 (62.2%) | 4,195 (37.8%) |
Female Fertility in Logan County
Fertility by Age in Logan County
Average fertility rate in Logan County is 49.0 births per 1,000 women. Women in the age bracket of 20 to 34 years have the highest fertility rate with 64.0 births per 1,000 women. Women in the age bracket of 20 to 34 years acount for 56.7% of all women with births.
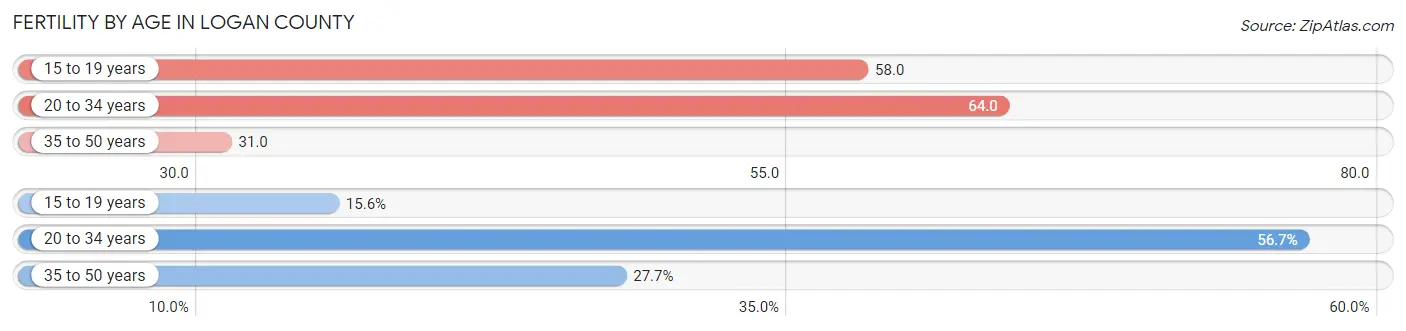
| Age Bracket | Women with Births | Births / 1,000 Women |
| 15 to 19 years | 51 (15.5%) | 58.0 |
| 20 to 34 years | 186 (56.7%) | 64.0 |
| 35 to 50 years | 91 (27.7%) | 31.0 |
| Total | 328 (100.0%) | 49.0 |
Fertility by Age by Marriage Status in Logan County
49.4% of women with births (328) in Logan County are married. The highest percentage of unmarried women with births falls into 15 to 19 years age bracket with 100.0% of them unmarried at the time of birth, while the lowest percentage of unmarried women with births belong to 35 to 50 years age bracket with 15.4% of them unmarried.
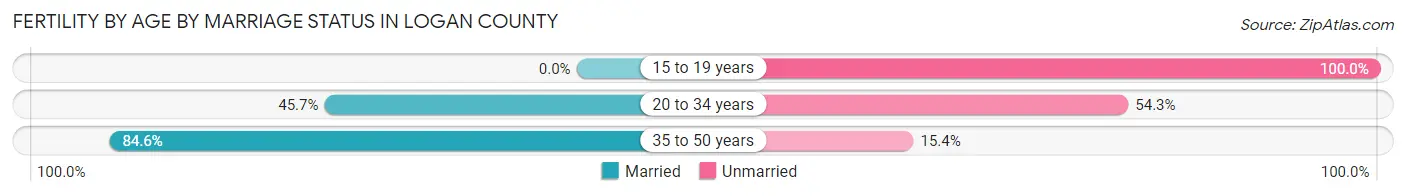
| Age Bracket | Married | Unmarried |
| 15 to 19 years | 0 (0.0%) | 51 (100.0%) |
| 20 to 34 years | 85 (45.7%) | 101 (54.3%) |
| 35 to 50 years | 77 (84.6%) | 14 (15.4%) |
| Total | 162 (49.4%) | 166 (50.6%) |
Fertility by Education in Logan County
Average fertility rate in Logan County is 49.0 births per 1,000 women. Women with the education attainment of graduate degree have the highest fertility rate of 107.0 births per 1,000 women, while women with the education attainment of college or associate's degree have the lowest fertility at 20.0 births per 1,000 women. Women with the education attainment of high school diploma represent 37.8% of all women with births.
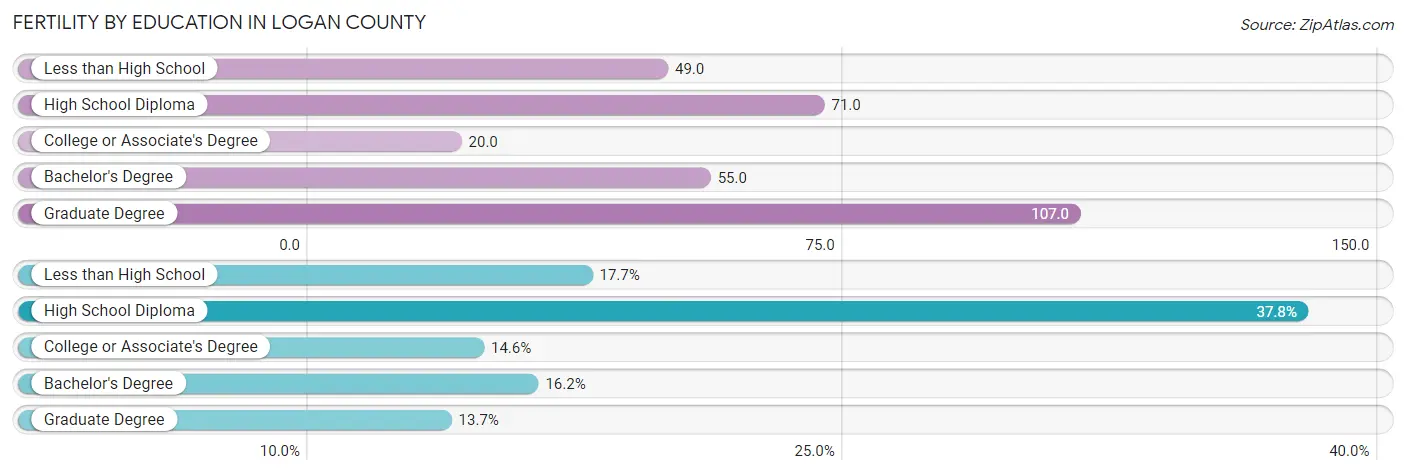
| Educational Attainment | Women with Births | Births / 1,000 Women |
| Less than High School | 58 (17.7%) | 49.0 |
| High School Diploma | 124 (37.8%) | 71.0 |
| College or Associate's Degree | 48 (14.6%) | 20.0 |
| Bachelor's Degree | 53 (16.2%) | 55.0 |
| Graduate Degree | 45 (13.7%) | 107.0 |
| Total | 328 (100.0%) | 49.0 |
Fertility by Education by Marriage Status in Logan County
50.6% of women with births in Logan County are unmarried. Women with the educational attainment of bachelor's degree are most likely to be married with 100.0% of them married at childbirth, while women with the educational attainment of less than high school are least likely to be married with 94.8% of them unmarried at childbirth.
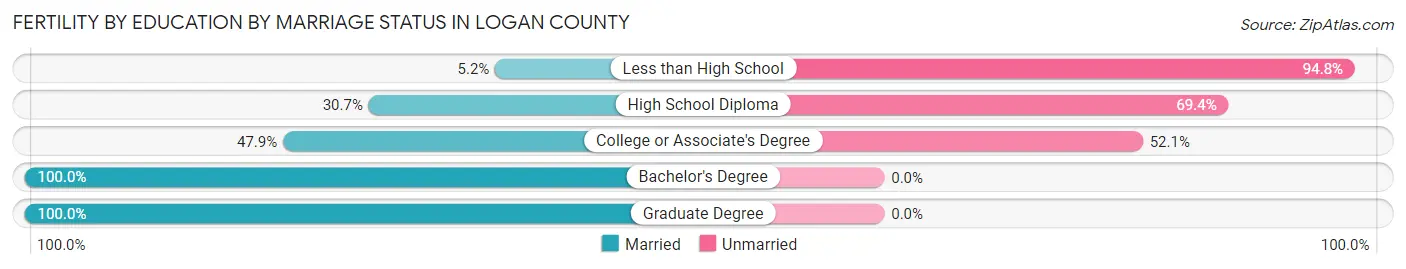
| Educational Attainment | Married | Unmarried |
| Less than High School | 3 (5.2%) | 55 (94.8%) |
| High School Diploma | 38 (30.6%) | 86 (69.4%) |
| College or Associate's Degree | 23 (47.9%) | 25 (52.1%) |
| Bachelor's Degree | 53 (100.0%) | 0 (0.0%) |
| Graduate Degree | 45 (100.0%) | 0 (0.0%) |
| Total | 162 (49.4%) | 166 (50.6%) |
Income in Logan County
Income Overview in Logan County
Per Capita Income in Logan County is $33,280, while median incomes of families and households are $80,993 and $62,547 respectively.
| Characteristic | Number | Measure |
| Per Capita Income | 28,027 | $33,280 |
| Median Family Income | 6,906 | $80,993 |
| Mean Family Income | 6,906 | $97,217 |
| Median Household Income | 11,101 | $62,547 |
| Mean Household Income | 11,101 | $83,002 |
| Income Deficit | 6,906 | $0 |
| Wage / Income Gap (%) | 28,027 | 36.68% |
| Wage / Income Gap ($) | 28,027 | 63.32¢ per $1 |
| Gini / Inequality Index | 28,027 | 0.44 |
Earnings by Sex in Logan County
Average Earnings in Logan County are $37,175, $45,092 for men and $28,550 for women, a difference of 36.7%.
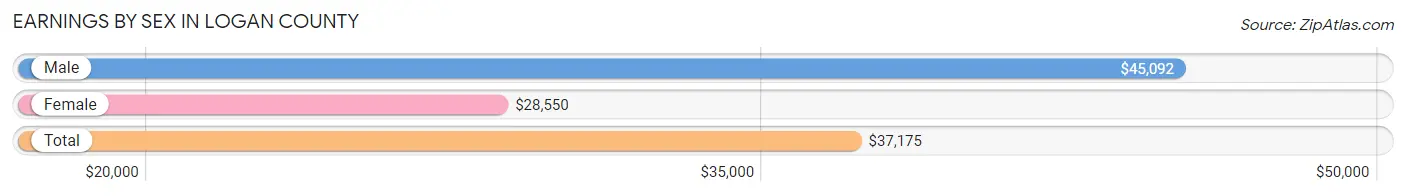
| Sex | Number | Average Earnings |
| Male | 7,466 (53.3%) | $45,092 |
| Female | 6,536 (46.7%) | $28,550 |
| Total | 14,002 (100.0%) | $37,175 |
Earnings by Sex by Income Bracket in Logan County
The most common earnings brackets in Logan County are $75,000 to $99,999 for men (1,086 | 14.5%) and $2,499 or less for women (604 | 9.2%).
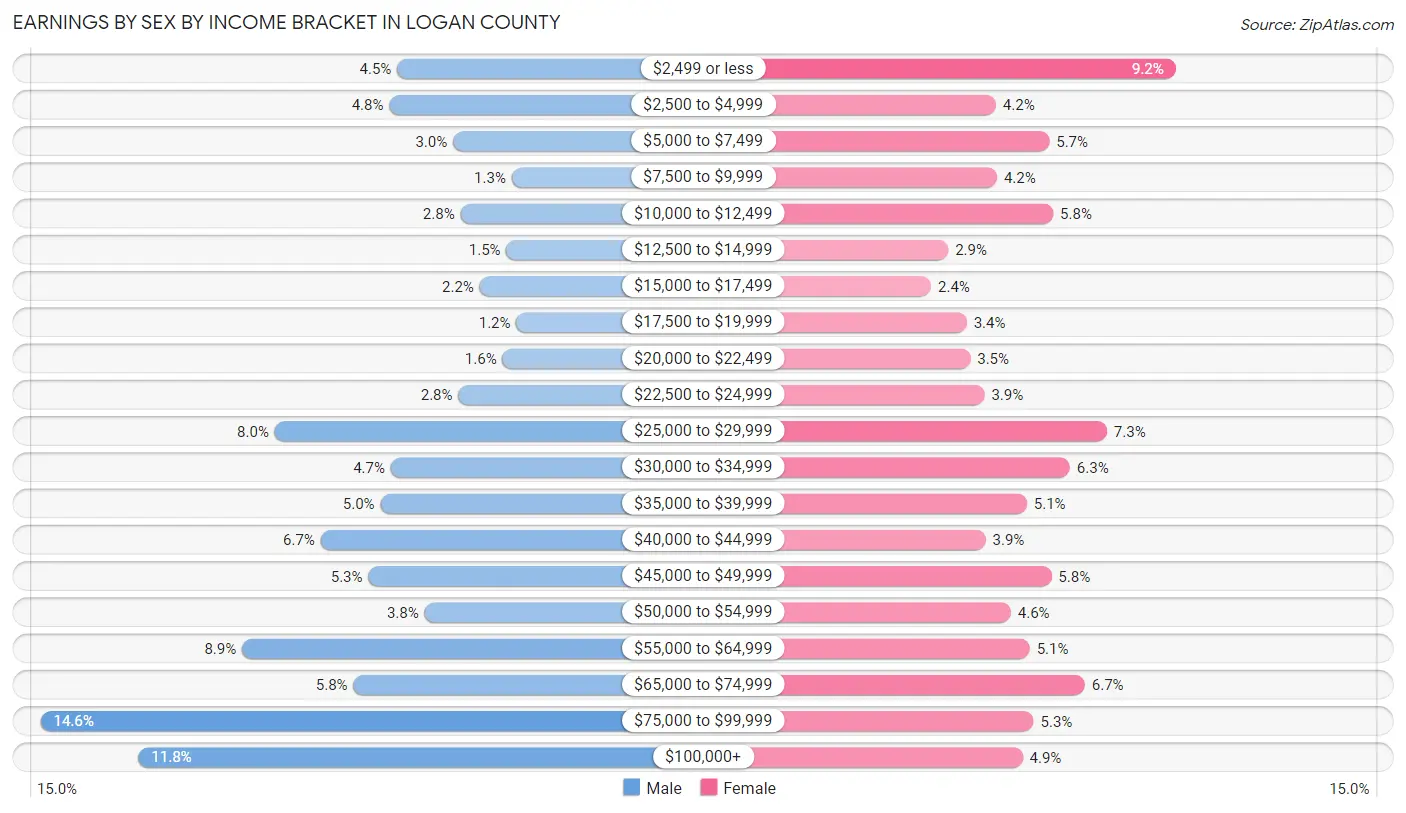
| Income | Male | Female |
| $2,499 or less | 338 (4.5%) | 604 (9.2%) |
| $2,500 to $4,999 | 355 (4.8%) | 274 (4.2%) |
| $5,000 to $7,499 | 221 (3.0%) | 372 (5.7%) |
| $7,500 to $9,999 | 98 (1.3%) | 276 (4.2%) |
| $10,000 to $12,499 | 205 (2.8%) | 379 (5.8%) |
| $12,500 to $14,999 | 109 (1.5%) | 186 (2.9%) |
| $15,000 to $17,499 | 165 (2.2%) | 155 (2.4%) |
| $17,500 to $19,999 | 88 (1.2%) | 220 (3.4%) |
| $20,000 to $22,499 | 117 (1.6%) | 227 (3.5%) |
| $22,500 to $24,999 | 210 (2.8%) | 253 (3.9%) |
| $25,000 to $29,999 | 595 (8.0%) | 478 (7.3%) |
| $30,000 to $34,999 | 352 (4.7%) | 410 (6.3%) |
| $35,000 to $39,999 | 373 (5.0%) | 331 (5.1%) |
| $40,000 to $44,999 | 499 (6.7%) | 255 (3.9%) |
| $45,000 to $49,999 | 399 (5.3%) | 376 (5.8%) |
| $50,000 to $54,999 | 281 (3.8%) | 301 (4.6%) |
| $55,000 to $64,999 | 664 (8.9%) | 336 (5.1%) |
| $65,000 to $74,999 | 430 (5.8%) | 437 (6.7%) |
| $75,000 to $99,999 | 1,086 (14.5%) | 343 (5.2%) |
| $100,000+ | 881 (11.8%) | 323 (4.9%) |
| Total | 7,466 (100.0%) | 6,536 (100.0%) |
Earnings by Sex by Educational Attainment in Logan County
Average earnings in Logan County are $52,067 for men and $33,910 for women, a difference of 34.9%. Men with an educational attainment of graduate degree enjoy the highest average annual earnings of $80,021, while those with less than high school education earn the least with $26,406. Women with an educational attainment of graduate degree earn the most with the average annual earnings of $66,637, while those with less than high school education have the smallest earnings of $11,615.
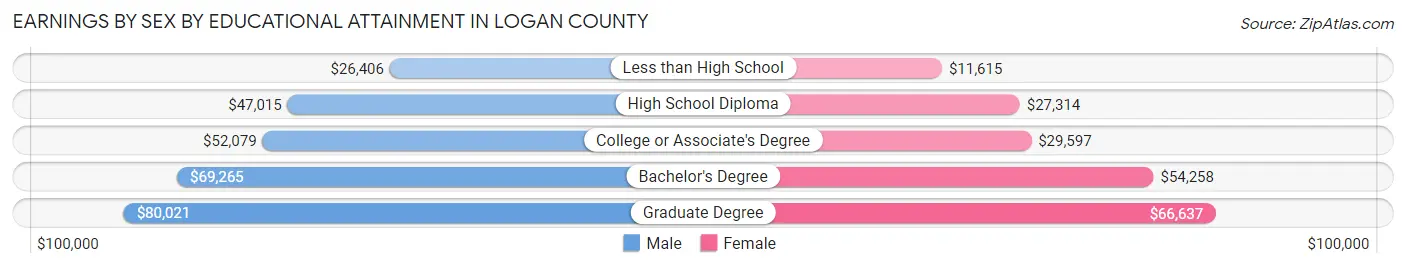
| Educational Attainment | Male Income | Female Income |
| Less than High School | $26,406 | $11,615 |
| High School Diploma | $47,015 | $27,314 |
| College or Associate's Degree | $52,079 | $29,597 |
| Bachelor's Degree | $69,265 | $54,258 |
| Graduate Degree | $80,021 | $66,637 |
| Total | $52,067 | $33,910 |
Family Income in Logan County
Family Income Brackets in Logan County
According to the Logan County family income data, there are 1,423 families falling into the $50,000 to $74,999 income range, which is the most common income bracket and makes up 20.6% of all families. Conversely, the $10,000 to $14,999 income bracket is the least frequent group with only 28 families (0.4%) belonging to this category.
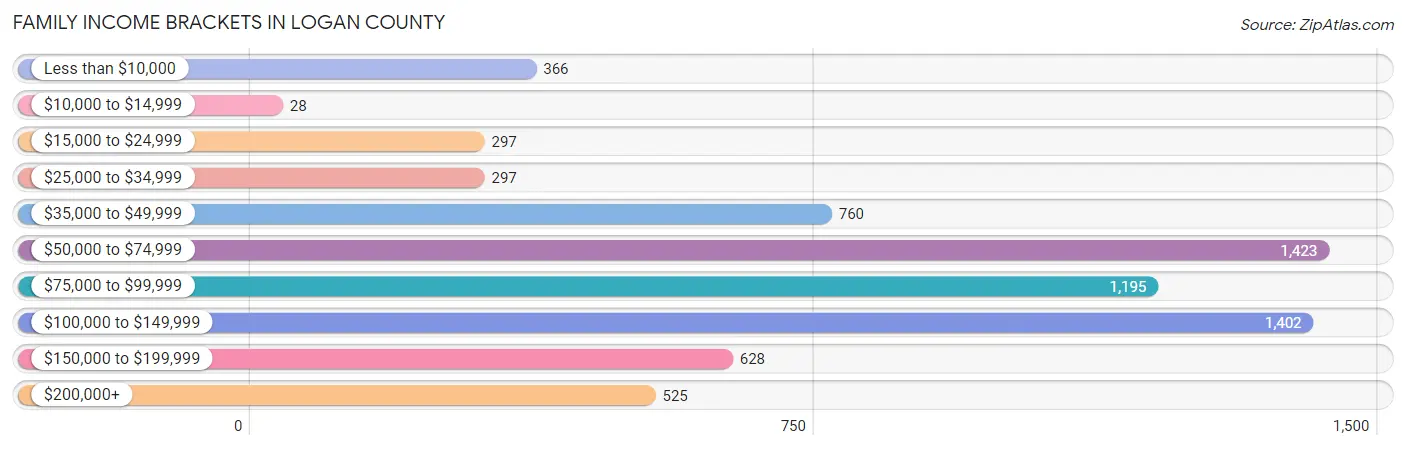
| Income Bracket | # Families | % Families |
| Less than $10,000 | 366 | 5.3% |
| $10,000 to $14,999 | 28 | 0.4% |
| $15,000 to $24,999 | 297 | 4.3% |
| $25,000 to $34,999 | 297 | 4.3% |
| $35,000 to $49,999 | 760 | 11.0% |
| $50,000 to $74,999 | 1,423 | 20.6% |
| $75,000 to $99,999 | 1,195 | 17.3% |
| $100,000 to $149,999 | 1,402 | 20.3% |
| $150,000 to $199,999 | 628 | 9.1% |
| $200,000+ | 525 | 7.6% |
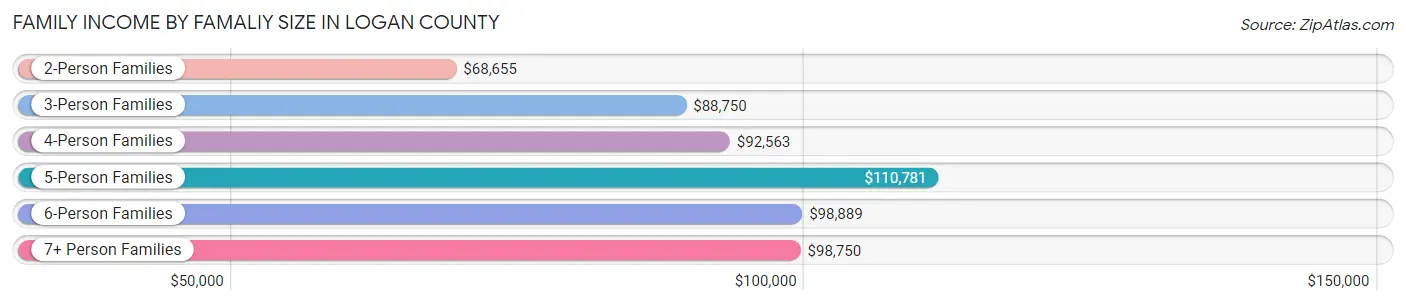
Family Income by Famaliy Size in Logan County
5-person families (506 | 7.3%) account for the highest median family income in Logan County with $110,781 per family, while 2-person families (3,769 | 54.6%) have the highest median income of $34,328 per family member.
| Income Bracket | # Families | Median Income |
| 2-Person Families | 3,769 (54.6%) | $68,655 |
| 3-Person Families | 1,419 (20.5%) | $88,750 |
| 4-Person Families | 1,053 (15.2%) | $92,563 |
| 5-Person Families | 506 (7.3%) | $110,781 |
| 6-Person Families | 132 (1.9%) | $98,889 |
| 7+ Person Families | 27 (0.4%) | $98,750 |
| Total | 6,906 (100.0%) | $80,993 |
Family Income by Number of Earners in Logan County
The median family income in Logan County is $80,993, with families comprising 3+ earners (691) having the highest median family income of $133,938, while families with no earners (1,262) have the lowest median family income of $52,500, accounting for 10.0% and 18.3% of families, respectively.

| Number of Earners | # Families | Median Income |
| No Earners | 1,262 (18.3%) | $52,500 |
| 1 Earner | 2,147 (31.1%) | $60,318 |
| 2 Earners | 2,806 (40.6%) | $108,693 |
| 3+ Earners | 691 (10.0%) | $133,938 |
| Total | 6,906 (100.0%) | $80,993 |
Household Income in Logan County
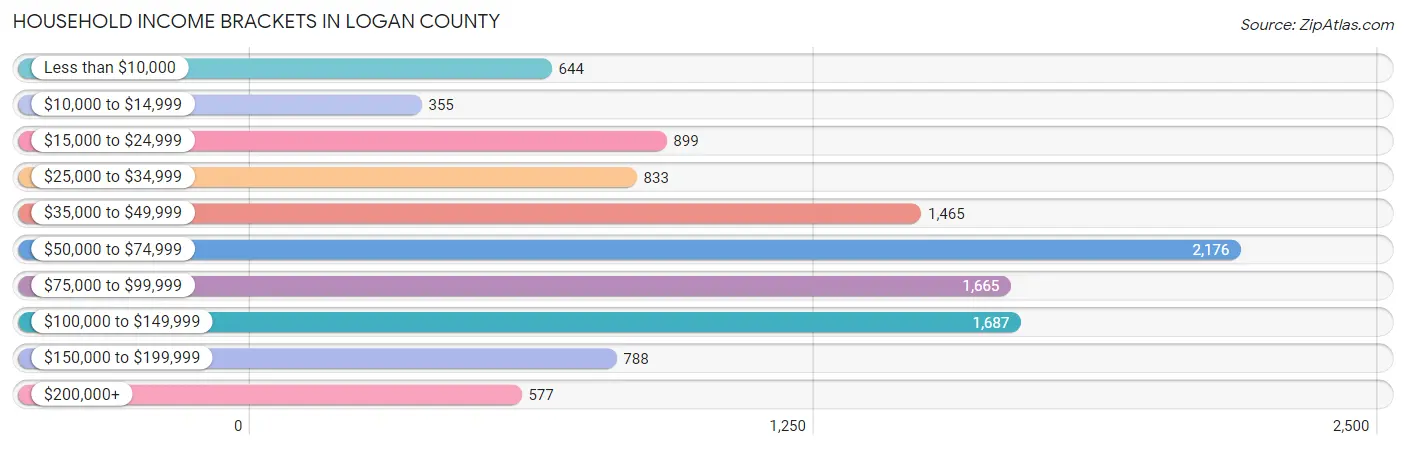
Household Income Brackets in Logan County
With 2,176 households falling in the category, the $50,000 to $74,999 income range is the most frequent in Logan County, accounting for 19.6% of all households. In contrast, only 355 households (3.2%) fall into the $10,000 to $14,999 income bracket, making it the least populous group.
| Income Bracket | # Households | % Households |
| Less than $10,000 | 644 | 5.8% |
| $10,000 to $14,999 | 355 | 3.2% |
| $15,000 to $24,999 | 899 | 8.1% |
| $25,000 to $34,999 | 833 | 7.5% |
| $35,000 to $49,999 | 1,465 | 13.2% |
| $50,000 to $74,999 | 2,176 | 19.6% |
| $75,000 to $99,999 | 1,665 | 15.0% |
| $100,000 to $149,999 | 1,687 | 15.2% |
| $150,000 to $199,999 | 788 | 7.1% |
| $200,000+ | 577 | 5.2% |
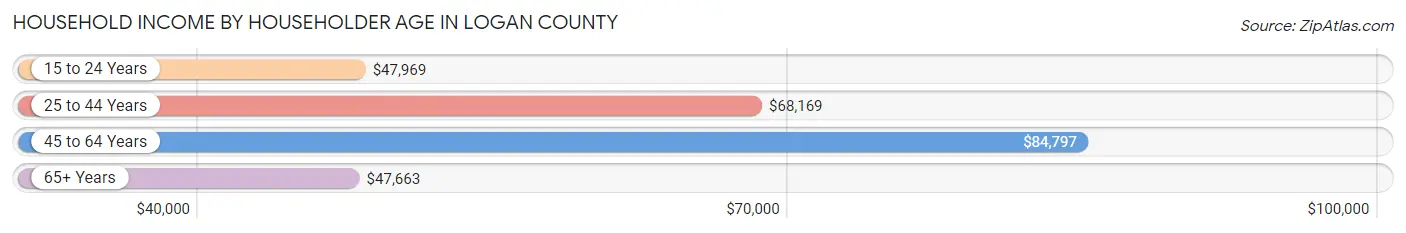
Household Income by Householder Age in Logan County
The median household income in Logan County is $62,547, with the highest median household income of $84,797 found in the 45 to 64 years age bracket for the primary householder. A total of 3,754 households (33.8%) fall into this category. Meanwhile, the 65+ years age bracket for the primary householder has the lowest median household income of $47,663, with 3,466 households (31.2%) in this group.
| Income Bracket | # Households | Median Income |
| 15 to 24 Years | 687 (6.2%) | $47,969 |
| 25 to 44 Years | 3,194 (28.8%) | $68,169 |
| 45 to 64 Years | 3,754 (33.8%) | $84,797 |
| 65+ Years | 3,466 (31.2%) | $47,663 |
| Total | 11,101 (100.0%) | $62,547 |
Poverty in Logan County
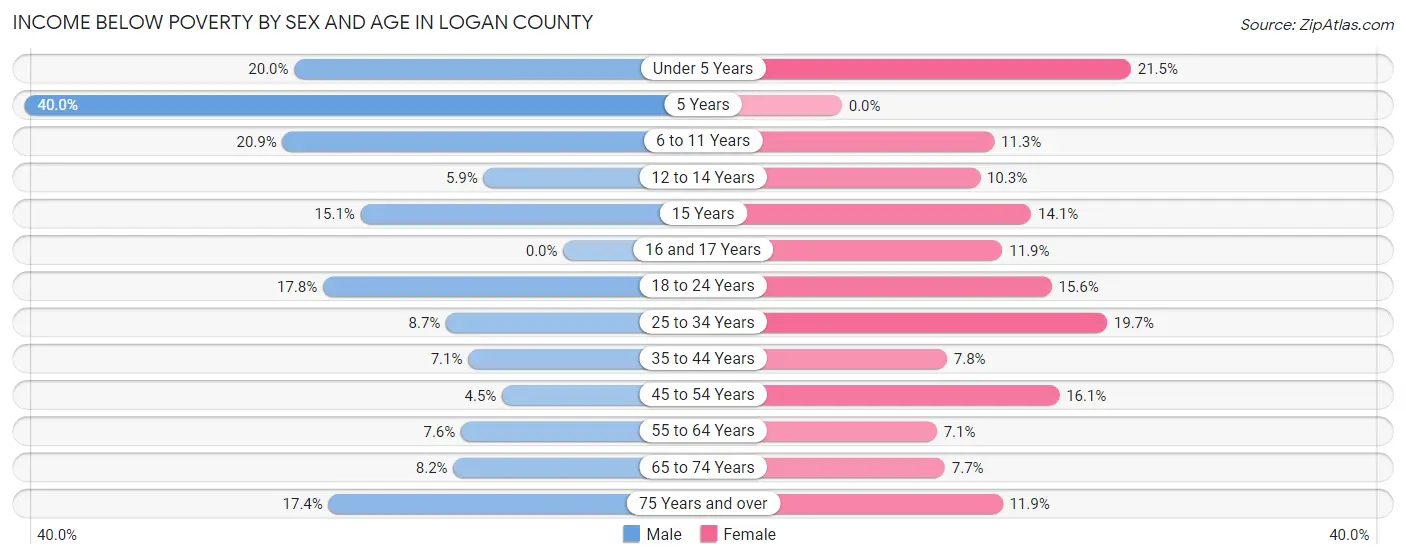
Income Below Poverty by Sex and Age in Logan County
With 10.9% poverty level for males and 12.2% for females among the residents of Logan County, 5 year old males and under 5 year old females are the most vulnerable to poverty, with 56 males (40.0%) and 132 females (21.5%) in their respective age groups living below the poverty level.
| Age Bracket | Male | Female |
| Under 5 Years | 151 (20.0%) | 132 (21.5%) |
| 5 Years | 56 (40.0%) | 0 (0.0%) |
| 6 to 11 Years | 187 (20.8%) | 112 (11.3%) |
| 12 to 14 Years | 27 (5.9%) | 35 (10.3%) |
| 15 Years | 28 (15.0%) | 18 (14.1%) |
| 16 and 17 Years | 0 (0.0%) | 41 (11.9%) |
| 18 to 24 Years | 188 (17.8%) | 153 (15.6%) |
| 25 to 34 Years | 125 (8.7%) | 271 (19.7%) |
| 35 to 44 Years | 110 (7.1%) | 107 (7.8%) |
| 45 to 54 Years | 70 (4.5%) | 235 (16.1%) |
| 55 to 64 Years | 135 (7.6%) | 122 (7.0%) |
| 65 to 74 Years | 111 (8.2%) | 110 (7.6%) |
| 75 Years and over | 157 (17.4%) | 161 (11.9%) |
| Total | 1,345 (10.9%) | 1,497 (12.2%) |
Income Above Poverty by Sex and Age in Logan County
According to the poverty statistics in Logan County, males aged 16 and 17 years and females aged 5 years are the age groups that are most secure financially, with 100.0% of males and 100.0% of females in these age groups living above the poverty line.
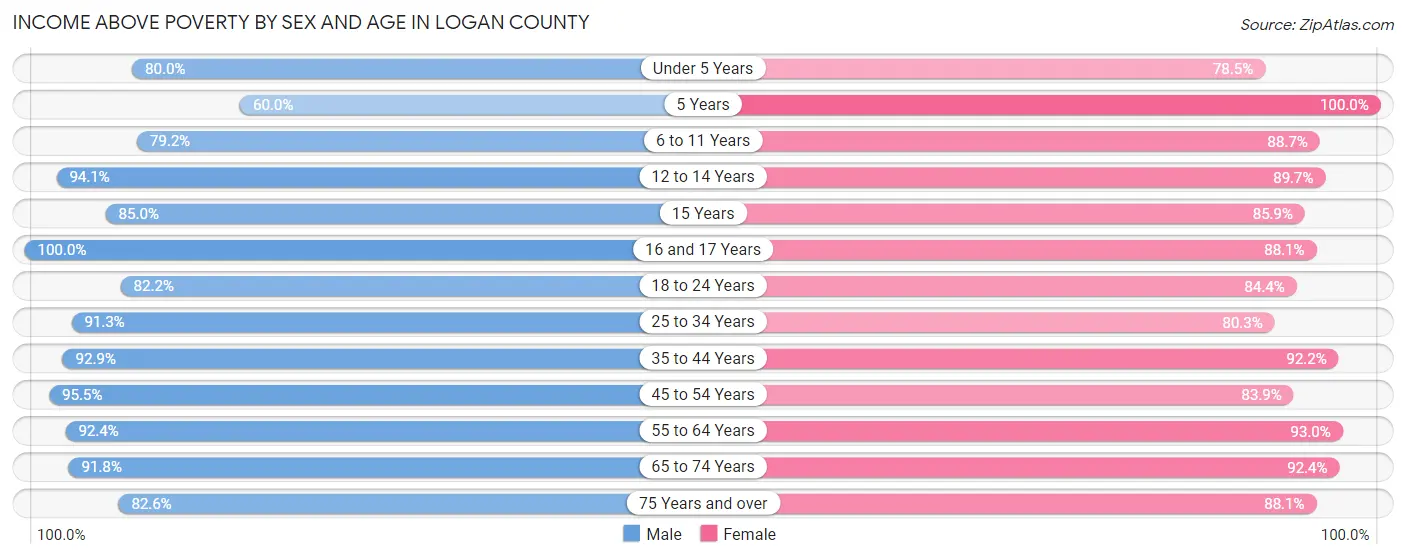
| Age Bracket | Male | Female |
| Under 5 Years | 605 (80.0%) | 483 (78.5%) |
| 5 Years | 84 (60.0%) | 120 (100.0%) |
| 6 to 11 Years | 710 (79.1%) | 878 (88.7%) |
| 12 to 14 Years | 429 (94.1%) | 306 (89.7%) |
| 15 Years | 158 (85.0%) | 110 (85.9%) |
| 16 and 17 Years | 317 (100.0%) | 303 (88.1%) |
| 18 to 24 Years | 866 (82.2%) | 829 (84.4%) |
| 25 to 34 Years | 1,312 (91.3%) | 1,106 (80.3%) |
| 35 to 44 Years | 1,448 (92.9%) | 1,265 (92.2%) |
| 45 to 54 Years | 1,473 (95.5%) | 1,221 (83.9%) |
| 55 to 64 Years | 1,643 (92.4%) | 1,608 (92.9%) |
| 65 to 74 Years | 1,250 (91.8%) | 1,328 (92.3%) |
| 75 Years and over | 744 (82.6%) | 1,188 (88.1%) |
| Total | 11,039 (89.1%) | 10,745 (87.8%) |
Income Below Poverty Among Married-Couple Families in Logan County
The poverty statistics for married-couple families in Logan County show that 4.4% or 227 of the total 5,158 families live below the poverty line. Families with 3 or 4 children have the highest poverty rate of 7.6%, comprising of 30 families. On the other hand, families with 5 or more children have the lowest poverty rate of 0.0%, which includes 0 families.
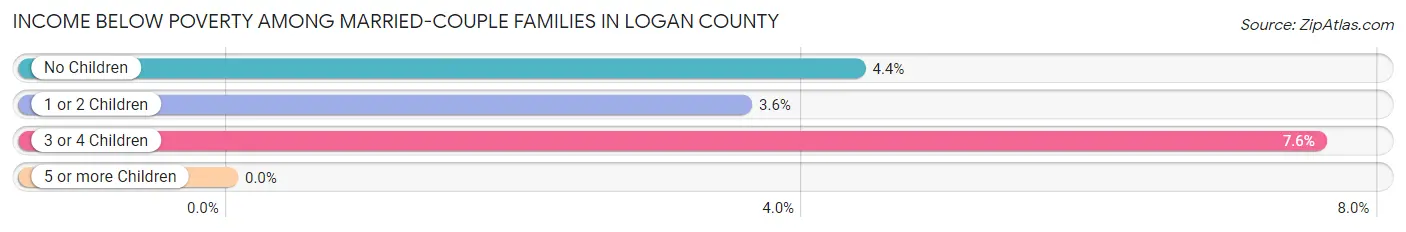
| Children | Above Poverty | Below Poverty |
| No Children | 3,260 (95.6%) | 149 (4.4%) |
| 1 or 2 Children | 1,292 (96.4%) | 48 (3.6%) |
| 3 or 4 Children | 366 (92.4%) | 30 (7.6%) |
| 5 or more Children | 13 (100.0%) | 0 (0.0%) |
| Total | 4,931 (95.6%) | 227 (4.4%) |
Income Below Poverty Among Single-Parent Households in Logan County
According to the poverty data in Logan County, 19.7% or 105 single-father households and 21.7% or 263 single-mother households are living below the poverty line. Among single-father households, those with no children have the highest poverty rate, with 95 households (37.9%) experiencing poverty. Likewise, among single-mother households, those with 5 or more children have the highest poverty rate, with 10 households (100.0%) falling below the poverty line.
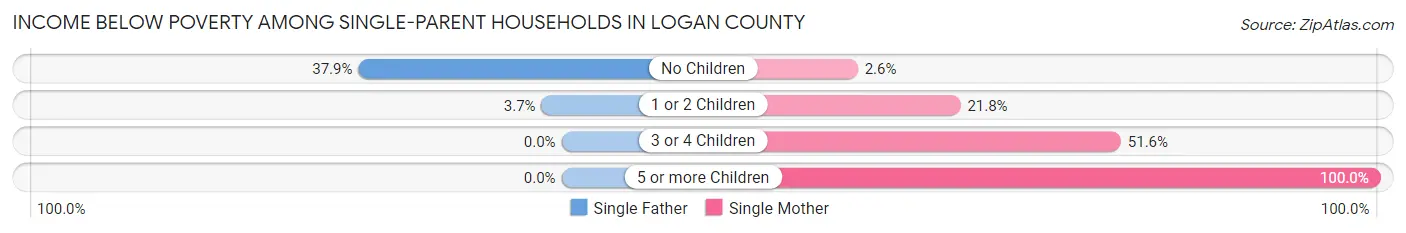
| Children | Single Father | Single Mother |
| No Children | 95 (37.9%) | 10 (2.6%) |
| 1 or 2 Children | 10 (3.7%) | 132 (21.7%) |
| 3 or 4 Children | 0 (0.0%) | 111 (51.6%) |
| 5 or more Children | 0 (0.0%) | 10 (100.0%) |
| Total | 105 (19.7%) | 263 (21.7%) |
Income Below Poverty Among Married-Couple vs Single-Parent Households in Logan County
The poverty data for Logan County shows that 227 of the married-couple family households (4.4%) and 368 of the single-parent households (21.0%) are living below the poverty level. Within the married-couple family households, those with 3 or 4 children have the highest poverty rate, with 30 households (7.6%) falling below the poverty line. Among the single-parent households, those with 5 or more children have the highest poverty rate, with 10 household (83.3%) living below poverty.

| Children | Married-Couple Families | Single-Parent Households |
| No Children | 149 (4.4%) | 105 (16.6%) |
| 1 or 2 Children | 48 (3.6%) | 142 (16.2%) |
| 3 or 4 Children | 30 (7.6%) | 111 (48.7%) |
| 5 or more Children | 0 (0.0%) | 10 (83.3%) |
| Total | 227 (4.4%) | 368 (21.0%) |
Employment Characteristics in Logan County
Employment by Class of Employer in Logan County
Among the 12,076 employed individuals in Logan County, private company employees (7,946 | 65.8%), not-for-profit organizations (1,345 | 11.1%), and local government employees (956 | 7.9%) make up the most common classes of employment.
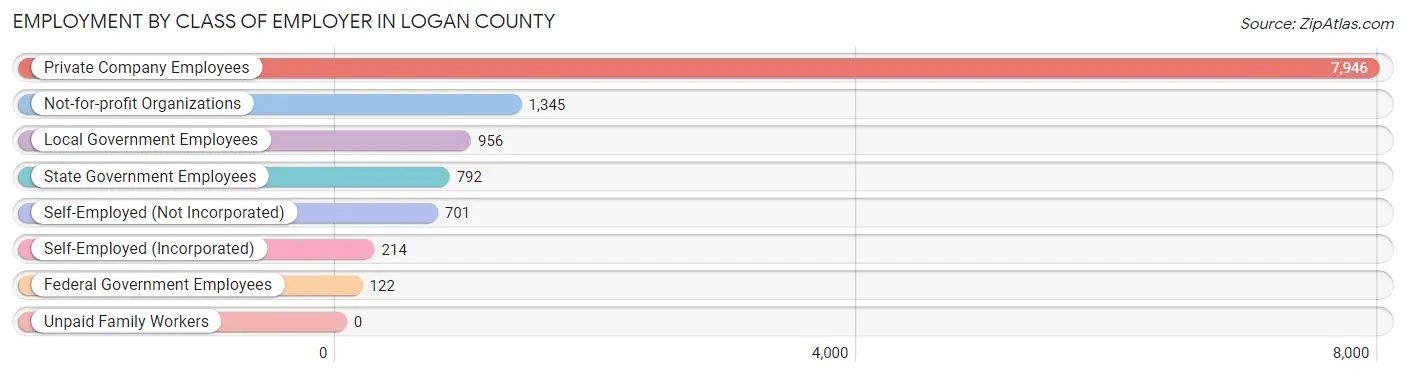
| Employer Class | # Employees | % Employees |
| Private Company Employees | 7,946 | 65.8% |
| Self-Employed (Incorporated) | 214 | 1.8% |
| Self-Employed (Not Incorporated) | 701 | 5.8% |
| Not-for-profit Organizations | 1,345 | 11.1% |
| Local Government Employees | 956 | 7.9% |
| State Government Employees | 792 | 6.6% |
| Federal Government Employees | 122 | 1.0% |
| Unpaid Family Workers | 0 | 0.0% |
| Total | 12,076 | 100.0% |
Employment Status by Age in Logan County
According to the labor force statistics for Logan County, out of the total population over 16 years of age (23,228), 55.7% or 12,938 individuals are in the labor force, with 5.2% or 673 of them unemployed. The age group with the highest labor force participation rate is 20 to 24 years, with 78.2% or 1,589 individuals in the labor force. Within the labor force, the 16 to 19 years age range has the highest percentage of unemployed individuals, with 20.1% or 145 of them being unemployed.
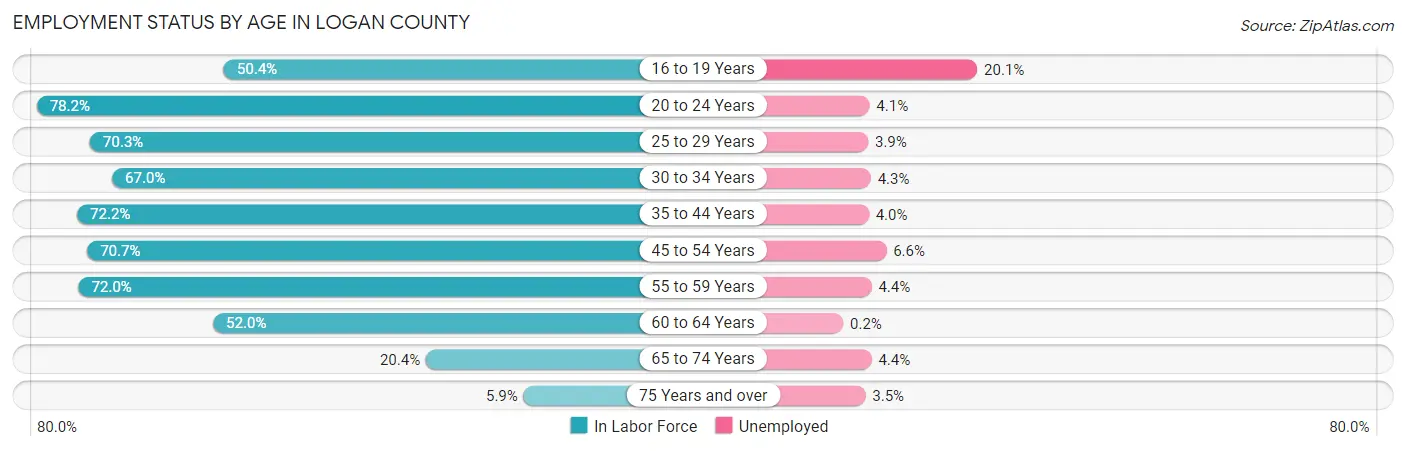
| Age Bracket | In Labor Force | Unemployed |
| 16 to 19 Years | 723 (50.4%) | 145 (20.1%) |
| 20 to 24 Years | 1,589 (78.2%) | 65 (4.1%) |
| 25 to 29 Years | 1,215 (70.3%) | 47 (3.9%) |
| 30 to 34 Years | 1,264 (67.0%) | 54 (4.3%) |
| 35 to 44 Years | 2,663 (72.2%) | 107 (4.0%) |
| 45 to 54 Years | 2,444 (70.7%) | 161 (6.6%) |
| 55 to 59 Years | 1,358 (72.0%) | 60 (4.4%) |
| 60 to 64 Years | 943 (52.0%) | 2 (0.2%) |
| 65 to 74 Years | 595 (20.4%) | 26 (4.4%) |
| 75 Years and over | 141 (5.9%) | 5 (3.5%) |
| Total | 12,938 (55.7%) | 673 (5.2%) |
Employment Status by Educational Attainment in Logan County
According to labor force statistics for Logan County, 68.4% of individuals (9,891) out of the total population between 25 and 64 years of age (14,460) are in the labor force, with 4.3% or 425 of them being unemployed. The group with the highest labor force participation rate are those with the educational attainment of bachelor's degree or higher, with 89.4% or 2,769 individuals in the labor force. Within the labor force, individuals with high school diploma education have the highest percentage of unemployment, with 7.9% or 258 of them being unemployed.
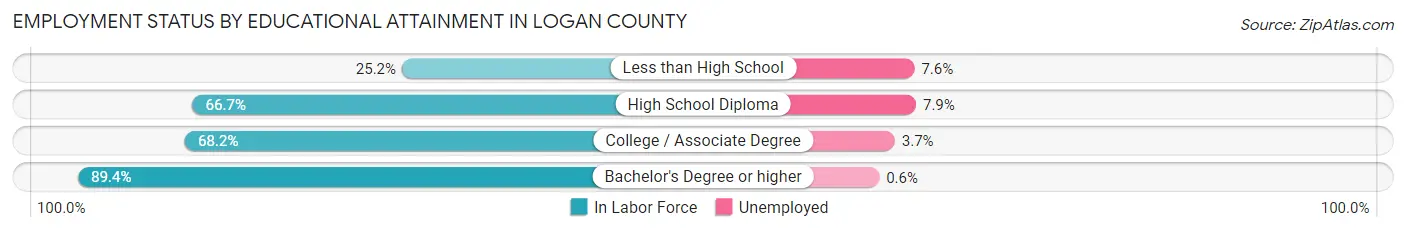
| Educational Attainment | In Labor Force | Unemployed |
| Less than High School | 328 (25.2%) | 99 (7.6%) |
| High School Diploma | 3,260 (66.7%) | 386 (7.9%) |
| College / Associate Degree | 3,530 (68.2%) | 192 (3.7%) |
| Bachelor's Degree or higher | 2,769 (89.4%) | 19 (0.6%) |
| Total | 9,891 (68.4%) | 622 (4.3%) |
Employment Occupations by Sex in Logan County
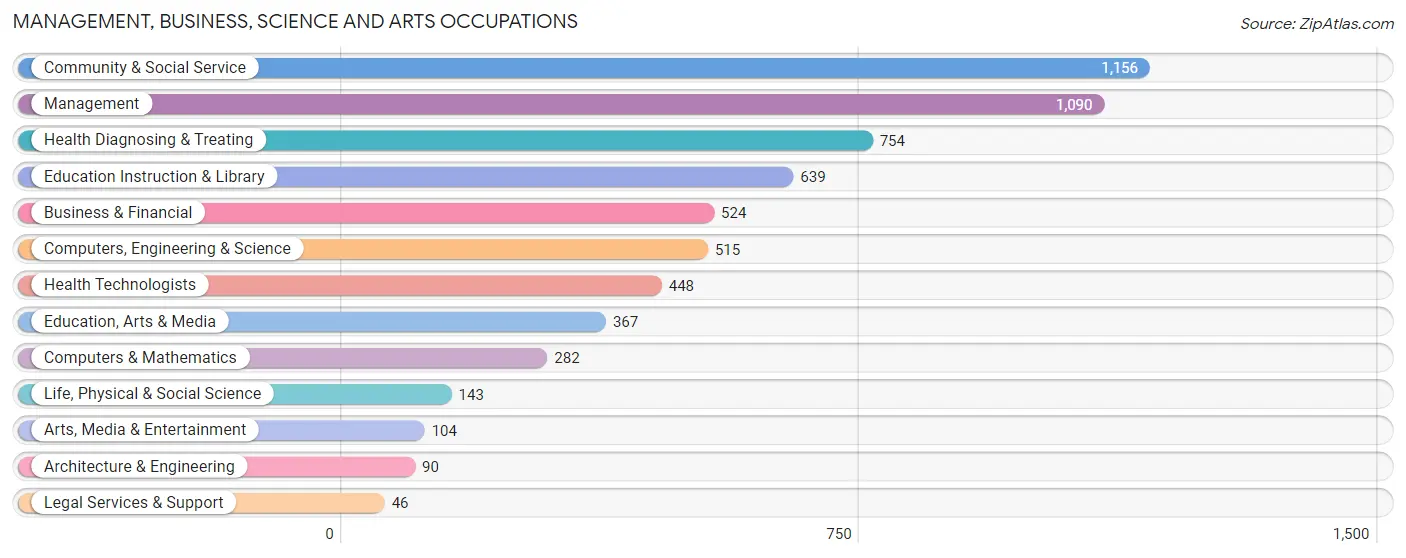
Management, Business, Science and Arts Occupations
The most common Management, Business, Science and Arts occupations in Logan County are Community & Social Service (1,156 | 9.4%), Management (1,090 | 8.9%), Health Diagnosing & Treating (754 | 6.1%), Education Instruction & Library (639 | 5.2%), and Business & Financial (524 | 4.3%).
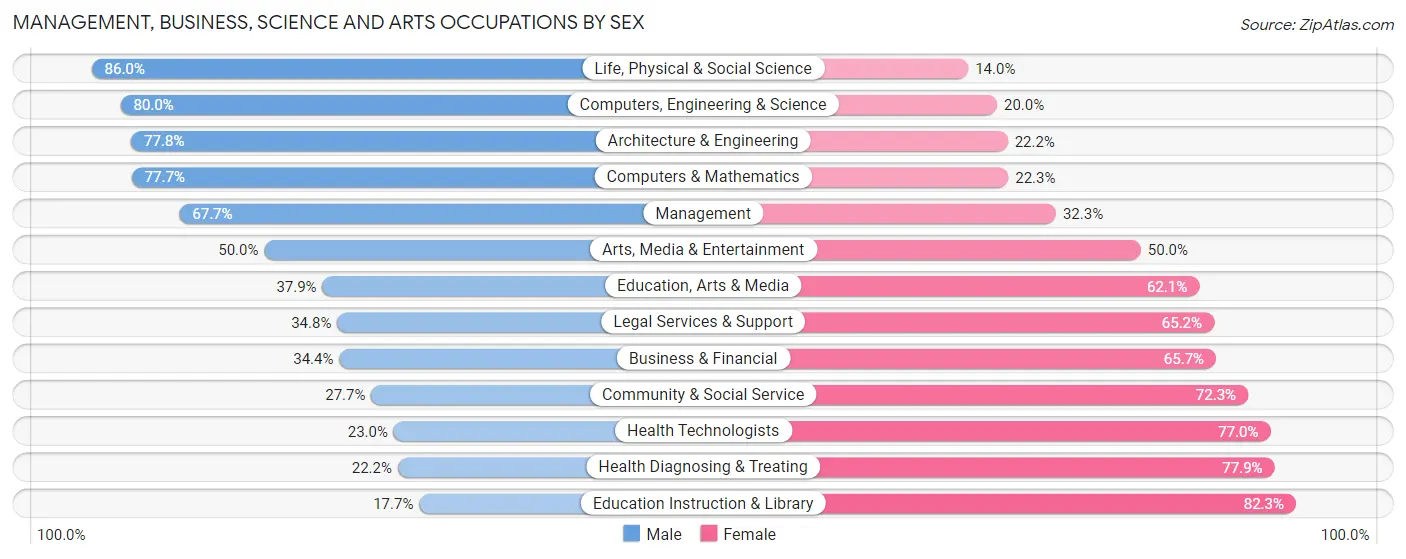
Management, Business, Science and Arts Occupations by Sex
Within the Management, Business, Science and Arts occupations in Logan County, the most male-oriented occupations are Life, Physical & Social Science (86.0%), Computers, Engineering & Science (80.0%), and Architecture & Engineering (77.8%), while the most female-oriented occupations are Education Instruction & Library (82.3%), Health Diagnosing & Treating (77.8%), and Health Technologists (77.0%).
| Occupation | Male | Female |
| Management | 738 (67.7%) | 352 (32.3%) |
| Business & Financial | 180 (34.4%) | 344 (65.6%) |
| Computers, Engineering & Science | 412 (80.0%) | 103 (20.0%) |
| Computers & Mathematics | 219 (77.7%) | 63 (22.3%) |
| Architecture & Engineering | 70 (77.8%) | 20 (22.2%) |
| Life, Physical & Social Science | 123 (86.0%) | 20 (14.0%) |
| Community & Social Service | 320 (27.7%) | 836 (72.3%) |
| Education, Arts & Media | 139 (37.9%) | 228 (62.1%) |
| Legal Services & Support | 16 (34.8%) | 30 (65.2%) |
| Education Instruction & Library | 113 (17.7%) | 526 (82.3%) |
| Arts, Media & Entertainment | 52 (50.0%) | 52 (50.0%) |
| Health Diagnosing & Treating | 167 (22.2%) | 587 (77.8%) |
| Health Technologists | 103 (23.0%) | 345 (77.0%) |
| Total (Category) | 1,817 (45.0%) | 2,222 (55.0%) |
| Total (Overall) | 6,778 (55.3%) | 5,477 (44.7%) |
Services Occupations
The most common Services occupations in Logan County are Food Preparation & Serving (782 | 6.4%), Healthcare Support (440 | 3.6%), Security & Protection (435 | 3.5%), Personal Care & Service (334 | 2.7%), and Law Enforcement (321 | 2.6%).

Services Occupations by Sex
Within the Services occupations in Logan County, the most male-oriented occupations are Firefighting & Prevention (95.6%), Security & Protection (81.4%), and Law Enforcement (76.3%), while the most female-oriented occupations are Healthcare Support (92.0%), Personal Care & Service (90.1%), and Food Preparation & Serving (70.8%).
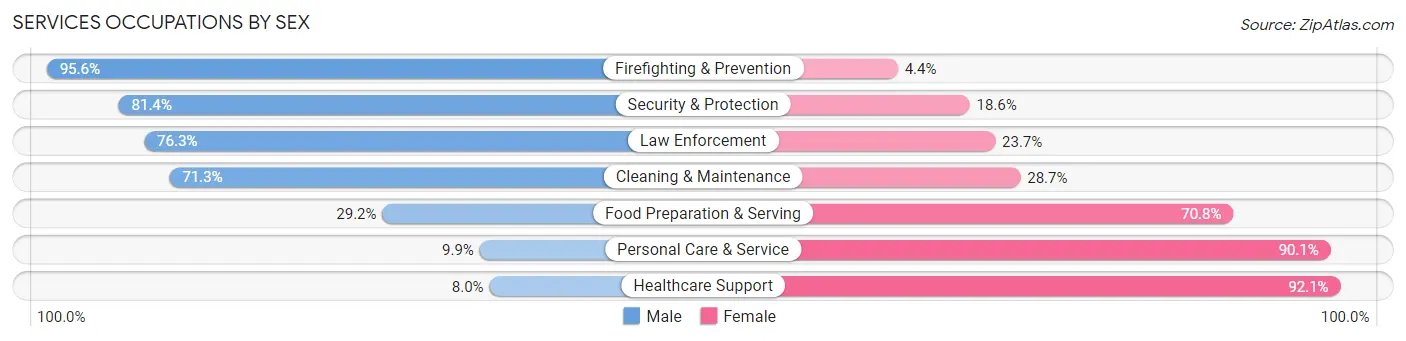
| Occupation | Male | Female |
| Healthcare Support | 35 (8.0%) | 405 (92.0%) |
| Security & Protection | 354 (81.4%) | 81 (18.6%) |
| Firefighting & Prevention | 109 (95.6%) | 5 (4.4%) |
| Law Enforcement | 245 (76.3%) | 76 (23.7%) |
| Food Preparation & Serving | 228 (29.2%) | 554 (70.8%) |
| Cleaning & Maintenance | 219 (71.3%) | 88 (28.7%) |
| Personal Care & Service | 33 (9.9%) | 301 (90.1%) |
| Total (Category) | 869 (37.8%) | 1,429 (62.2%) |
| Total (Overall) | 6,778 (55.3%) | 5,477 (44.7%) |
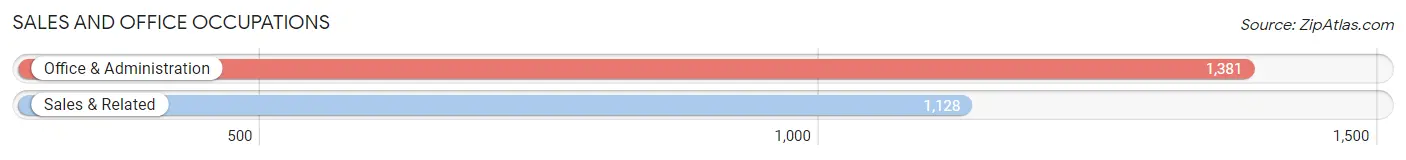
Sales and Office Occupations
The most common Sales and Office occupations in Logan County are Office & Administration (1,381 | 11.3%), and Sales & Related (1,128 | 9.2%).
Sales and Office Occupations by Sex
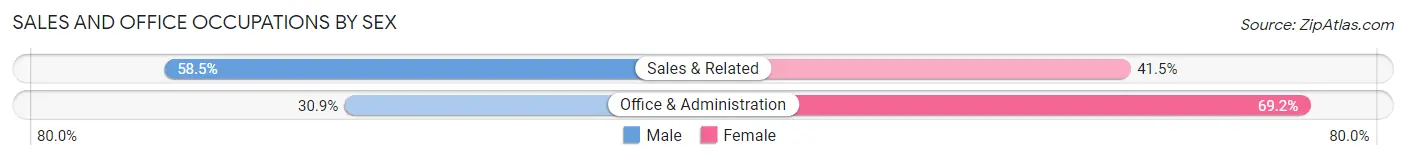
| Occupation | Male | Female |
| Sales & Related | 660 (58.5%) | 468 (41.5%) |
| Office & Administration | 426 (30.8%) | 955 (69.2%) |
| Total (Category) | 1,086 (43.3%) | 1,423 (56.7%) |
| Total (Overall) | 6,778 (55.3%) | 5,477 (44.7%) |
Natural Resources, Construction and Maintenance Occupations
The most common Natural Resources, Construction and Maintenance occupations in Logan County are Installation, Maintenance & Repair (625 | 5.1%), Construction & Extraction (494 | 4.0%), and Farming, Fishing & Forestry (155 | 1.3%).
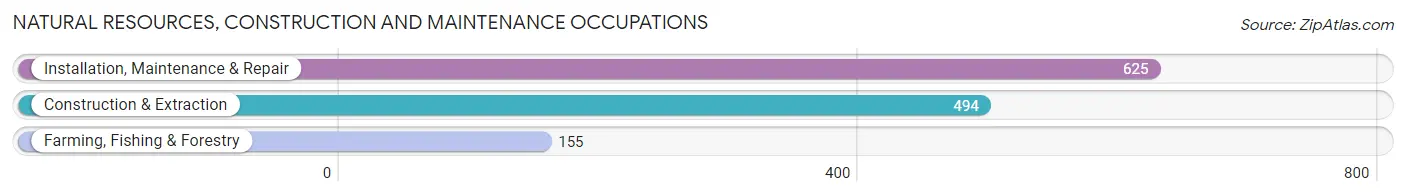
Natural Resources, Construction and Maintenance Occupations by Sex
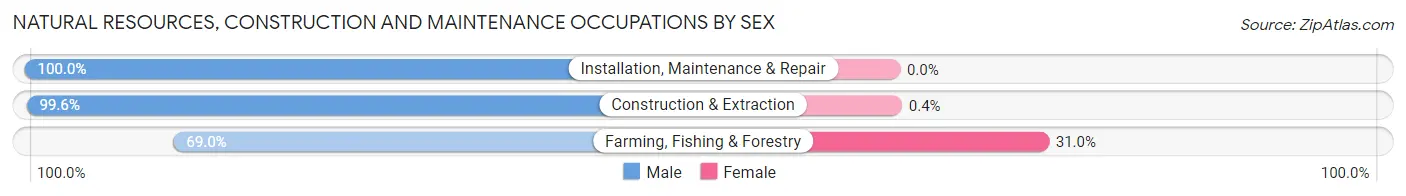
| Occupation | Male | Female |
| Farming, Fishing & Forestry | 107 (69.0%) | 48 (31.0%) |
| Construction & Extraction | 492 (99.6%) | 2 (0.4%) |
| Installation, Maintenance & Repair | 625 (100.0%) | 0 (0.0%) |
| Total (Category) | 1,224 (96.1%) | 50 (3.9%) |
| Total (Overall) | 6,778 (55.3%) | 5,477 (44.7%) |
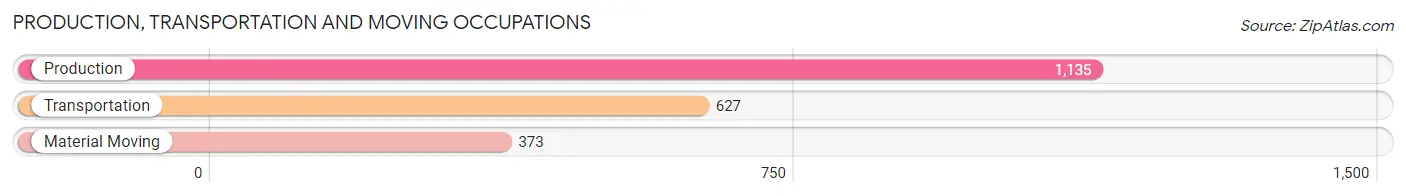
Production, Transportation and Moving Occupations
The most common Production, Transportation and Moving occupations in Logan County are Production (1,135 | 9.3%), Transportation (627 | 5.1%), and Material Moving (373 | 3.0%).
Production, Transportation and Moving Occupations by Sex
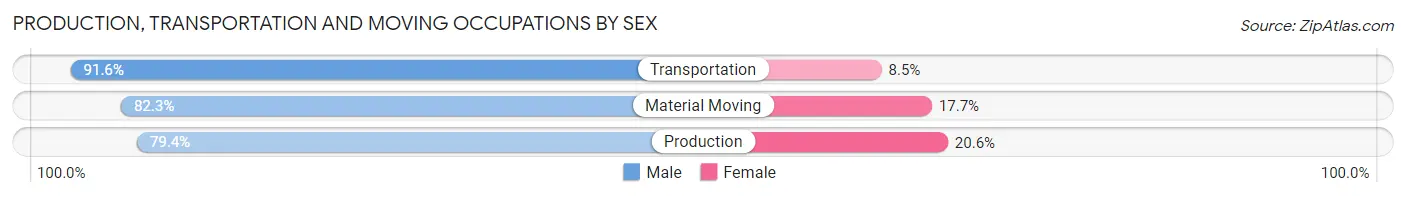
| Occupation | Male | Female |
| Production | 901 (79.4%) | 234 (20.6%) |
| Transportation | 574 (91.5%) | 53 (8.5%) |
| Material Moving | 307 (82.3%) | 66 (17.7%) |
| Total (Category) | 1,782 (83.5%) | 353 (16.5%) |
| Total (Overall) | 6,778 (55.3%) | 5,477 (44.7%) |
Employment Industries by Sex in Logan County
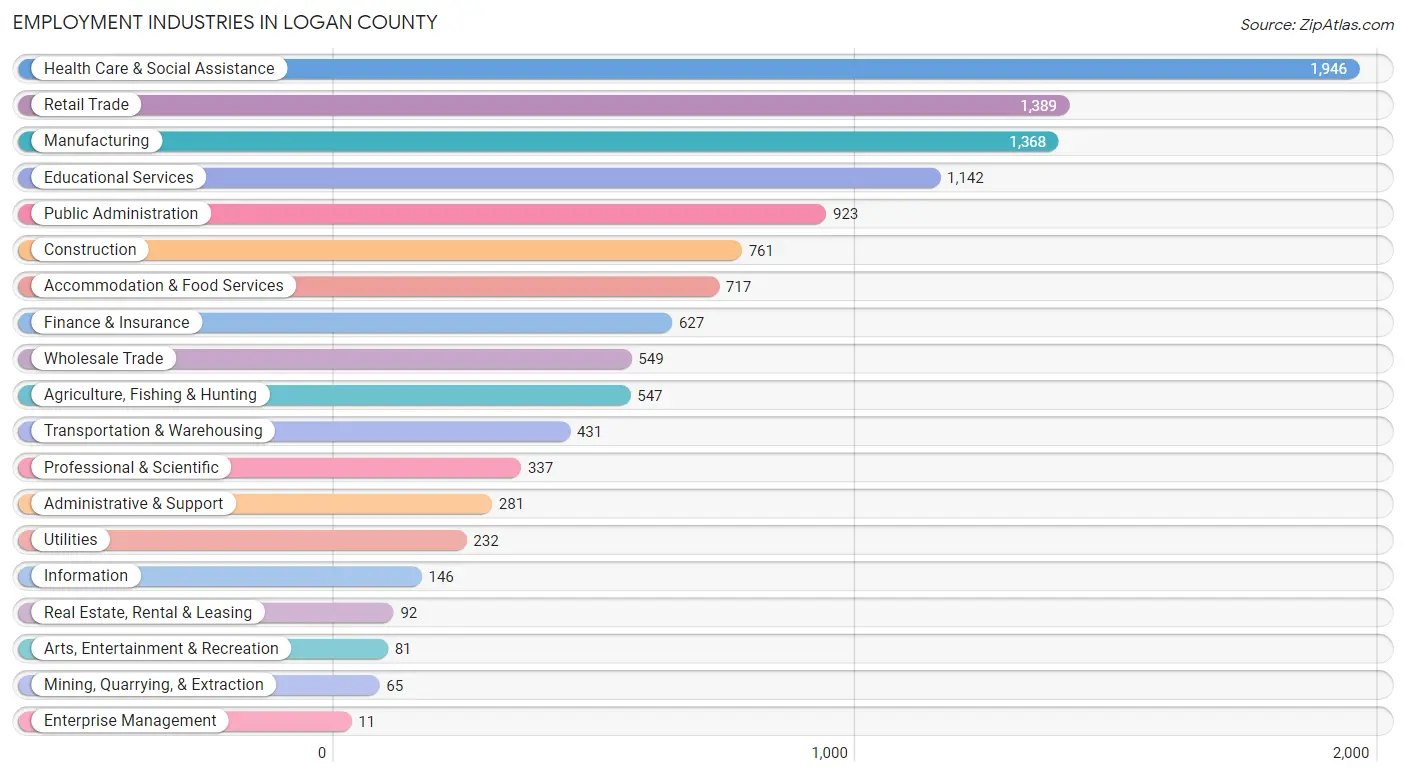
Employment Industries in Logan County
The major employment industries in Logan County include Health Care & Social Assistance (1,946 | 15.9%), Retail Trade (1,389 | 11.3%), Manufacturing (1,368 | 11.2%), Educational Services (1,142 | 9.3%), and Public Administration (923 | 7.5%).
Employment Industries by Sex in Logan County
The Logan County industries that see more men than women are Mining, Quarrying, & Extraction (100.0%), Construction (94.2%), and Utilities (94.0%), whereas the industries that tend to have a higher number of women are Enterprise Management (100.0%), Health Care & Social Assistance (77.4%), and Educational Services (71.0%).
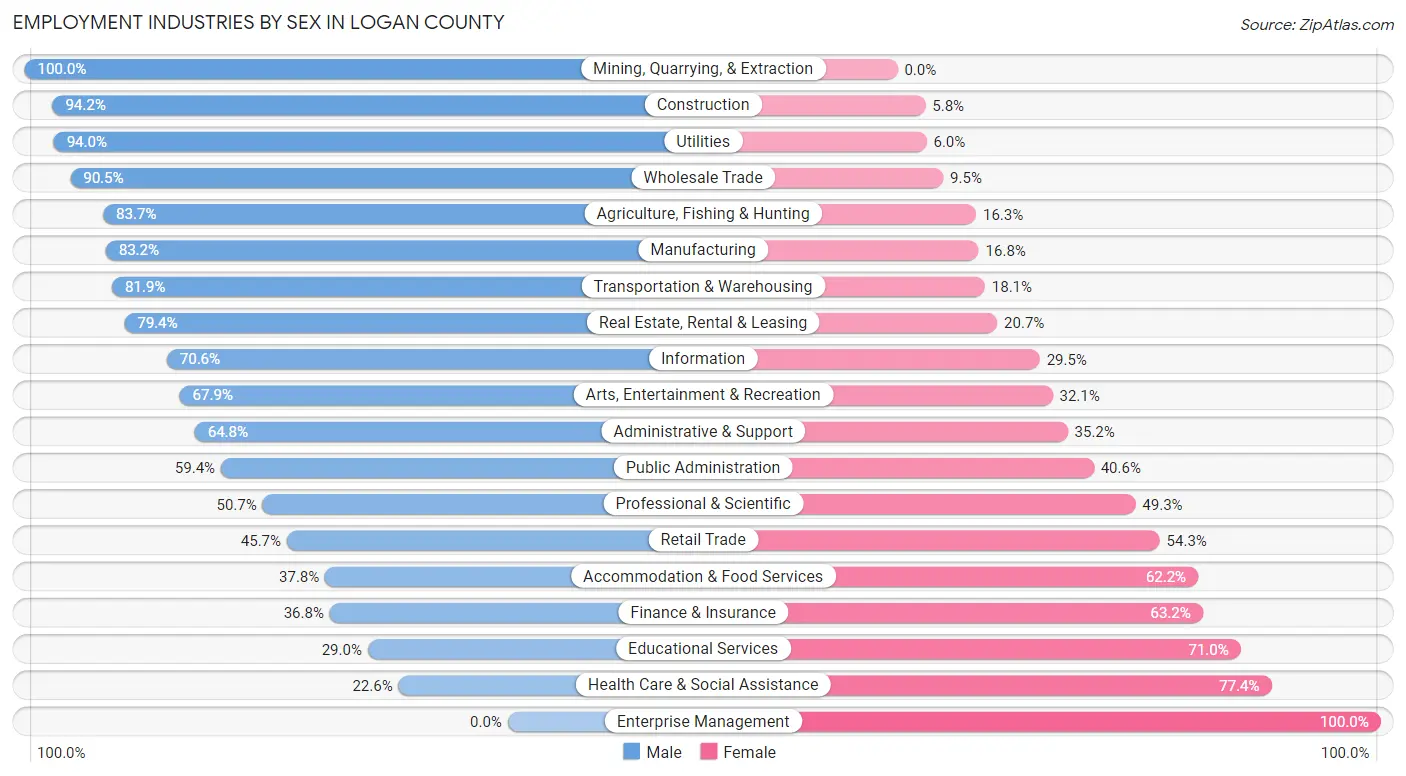
| Industry | Male | Female |
| Agriculture, Fishing & Hunting | 458 (83.7%) | 89 (16.3%) |
| Mining, Quarrying, & Extraction | 65 (100.0%) | 0 (0.0%) |
| Construction | 717 (94.2%) | 44 (5.8%) |
| Manufacturing | 1,138 (83.2%) | 230 (16.8%) |
| Wholesale Trade | 497 (90.5%) | 52 (9.5%) |
| Retail Trade | 635 (45.7%) | 754 (54.3%) |
| Transportation & Warehousing | 353 (81.9%) | 78 (18.1%) |
| Utilities | 218 (94.0%) | 14 (6.0%) |
| Information | 103 (70.6%) | 43 (29.4%) |
| Finance & Insurance | 231 (36.8%) | 396 (63.2%) |
| Real Estate, Rental & Leasing | 73 (79.3%) | 19 (20.6%) |
| Professional & Scientific | 171 (50.7%) | 166 (49.3%) |
| Enterprise Management | 0 (0.0%) | 11 (100.0%) |
| Administrative & Support | 182 (64.8%) | 99 (35.2%) |
| Educational Services | 331 (29.0%) | 811 (71.0%) |
| Health Care & Social Assistance | 440 (22.6%) | 1,506 (77.4%) |
| Arts, Entertainment & Recreation | 55 (67.9%) | 26 (32.1%) |
| Accommodation & Food Services | 271 (37.8%) | 446 (62.2%) |
| Public Administration | 548 (59.4%) | 375 (40.6%) |
| Total | 6,778 (55.3%) | 5,477 (44.7%) |
Education in Logan County
School Enrollment in Logan County
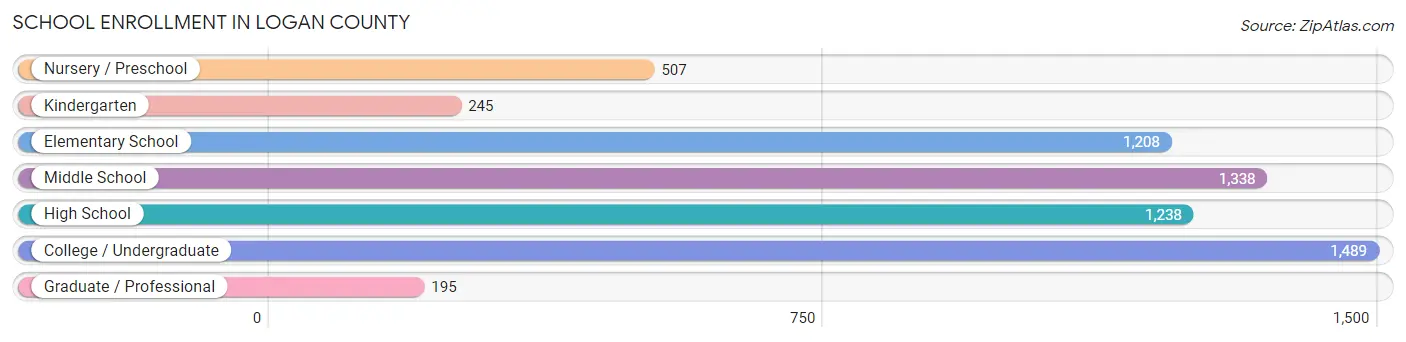
The most common levels of schooling among the 6,220 students in Logan County are college / undergraduate (1,489 | 23.9%), middle school (1,338 | 21.5%), and high school (1,238 | 19.9%).
| School Level | # Students | % Students |
| Nursery / Preschool | 507 | 8.2% |
| Kindergarten | 245 | 3.9% |
| Elementary School | 1,208 | 19.4% |
| Middle School | 1,338 | 21.5% |
| High School | 1,238 | 19.9% |
| College / Undergraduate | 1,489 | 23.9% |
| Graduate / Professional | 195 | 3.1% |
| Total | 6,220 | 100.0% |
School Enrollment by Age by Funding Source in Logan County
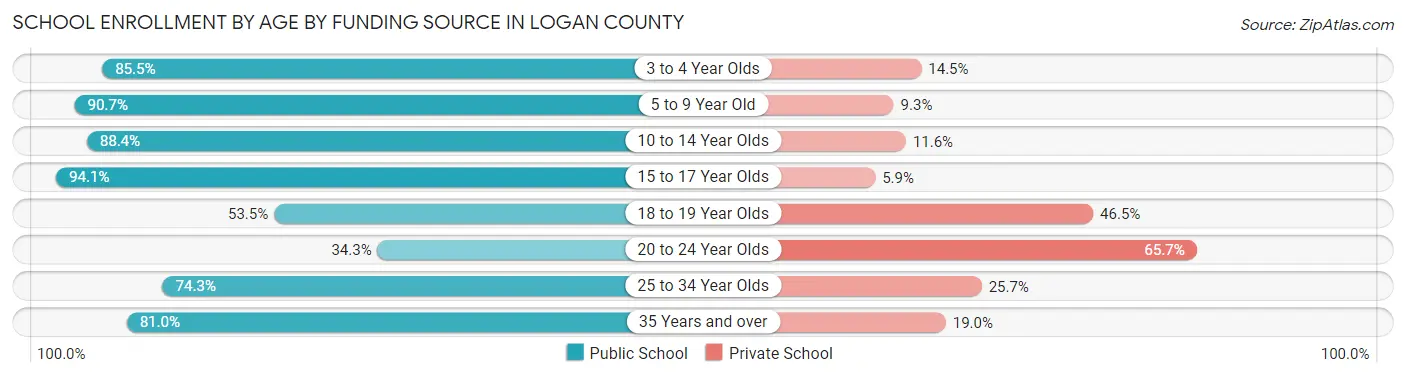
Out of a total of 6,220 students who are enrolled in schools in Logan County, 1,325 (21.3%) attend a private institution, while the remaining 4,895 (78.7%) are enrolled in public schools. The age group of 20 to 24 year olds has the highest likelihood of being enrolled in private schools, with 491 (65.7% in the age bracket) enrolled. Conversely, the age group of 15 to 17 year olds has the lowest likelihood of being enrolled in a private school, with 880 (94.1% in the age bracket) attending a public institution.
| Age Bracket | Public School | Private School |
| 3 to 4 Year Olds | 337 (85.5%) | 57 (14.5%) |
| 5 to 9 Year Old | 1,276 (90.7%) | 131 (9.3%) |
| 10 to 14 Year Olds | 1,357 (88.4%) | 178 (11.6%) |
| 15 to 17 Year Olds | 880 (94.1%) | 55 (5.9%) |
| 18 to 19 Year Olds | 303 (53.5%) | 263 (46.5%) |
| 20 to 24 Year Olds | 256 (34.3%) | 491 (65.7%) |
| 25 to 34 Year Olds | 289 (74.3%) | 100 (25.7%) |
| 35 Years and over | 200 (81.0%) | 47 (19.0%) |
| Total | 4,895 (78.7%) | 1,325 (21.3%) |
Educational Attainment by Field of Study in Logan County
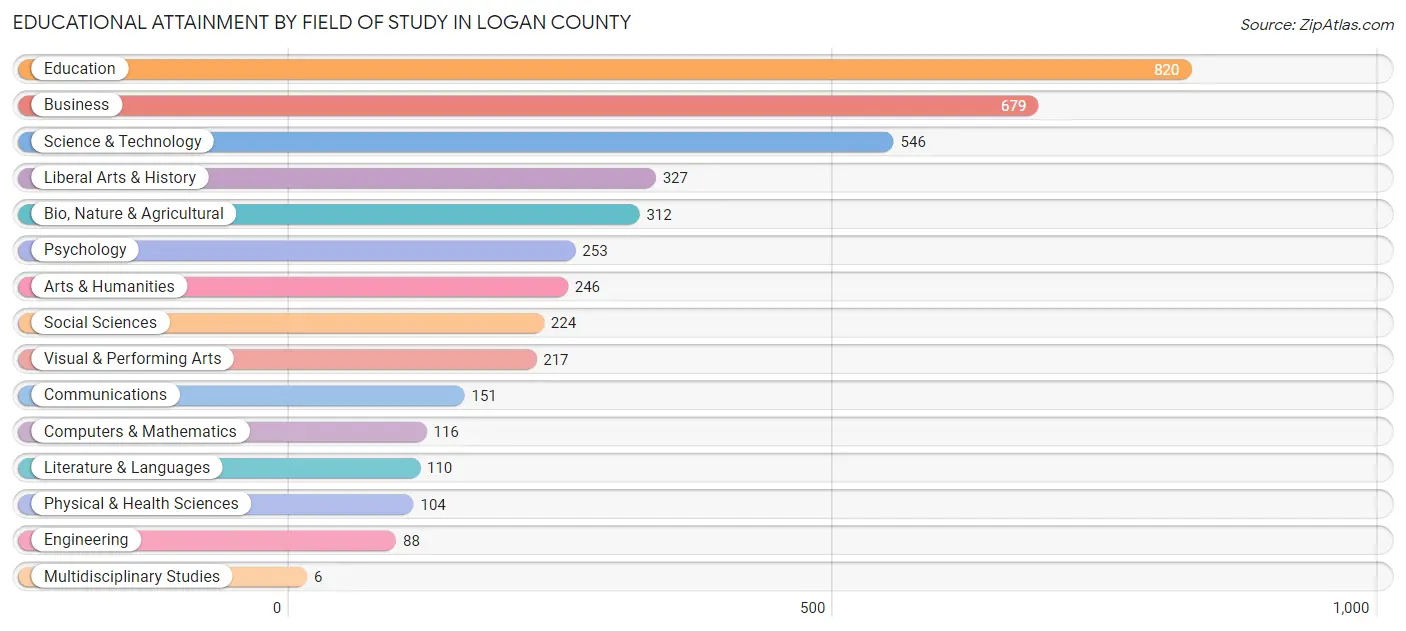
Education (820 | 19.5%), business (679 | 16.2%), science & technology (546 | 13.0%), liberal arts & history (327 | 7.8%), and bio, nature & agricultural (312 | 7.4%) are the most common fields of study among 4,199 individuals in Logan County who have obtained a bachelor's degree or higher.
| Field of Study | # Graduates | % Graduates |
| Computers & Mathematics | 116 | 2.8% |
| Bio, Nature & Agricultural | 312 | 7.4% |
| Physical & Health Sciences | 104 | 2.5% |
| Psychology | 253 | 6.0% |
| Social Sciences | 224 | 5.3% |
| Engineering | 88 | 2.1% |
| Multidisciplinary Studies | 6 | 0.1% |
| Science & Technology | 546 | 13.0% |
| Business | 679 | 16.2% |
| Education | 820 | 19.5% |
| Literature & Languages | 110 | 2.6% |
| Liberal Arts & History | 327 | 7.8% |
| Visual & Performing Arts | 217 | 5.2% |
| Communications | 151 | 3.6% |
| Arts & Humanities | 246 | 5.9% |
| Total | 4,199 | 100.0% |
Transportation & Commute in Logan County
Vehicle Availability by Sex in Logan County
The most prevalent vehicle ownership categories in Logan County are males with 2 vehicles (2,929, accounting for 44.2%) and females with 2 vehicles (2,129, making up 56.4%).
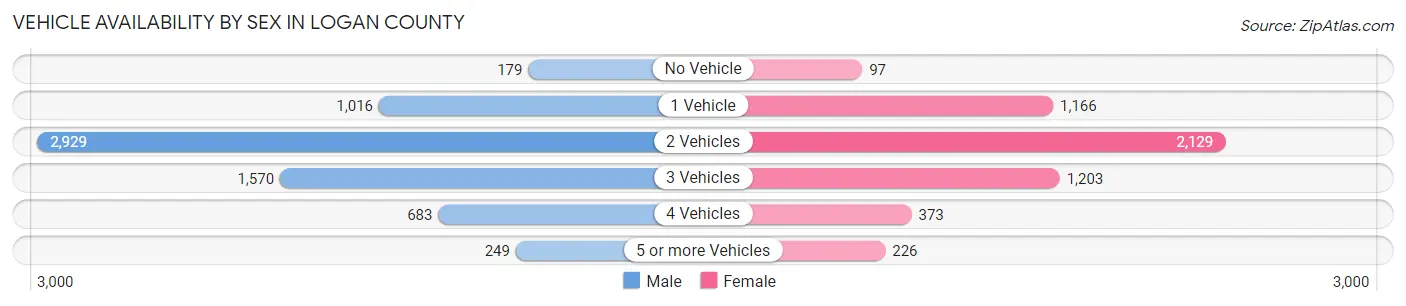
| Vehicles Available | Male | Female |
| No Vehicle | 179 (2.7%) | 97 (1.9%) |
| 1 Vehicle | 1,016 (15.3%) | 1,166 (22.5%) |
| 2 Vehicles | 2,929 (44.2%) | 2,129 (41.0%) |
| 3 Vehicles | 1,570 (23.7%) | 1,203 (23.2%) |
| 4 Vehicles | 683 (10.3%) | 373 (7.2%) |
| 5 or more Vehicles | 249 (3.8%) | 226 (4.3%) |
| Total | 6,626 (100.0%) | 5,194 (100.0%) |
Commute Time in Logan County
The most frequently occuring commute durations in Logan County are 5 to 9 minutes (2,217 commuters, 19.7%), 10 to 14 minutes (2,095 commuters, 18.6%), and 15 to 19 minutes (1,331 commuters, 11.8%).
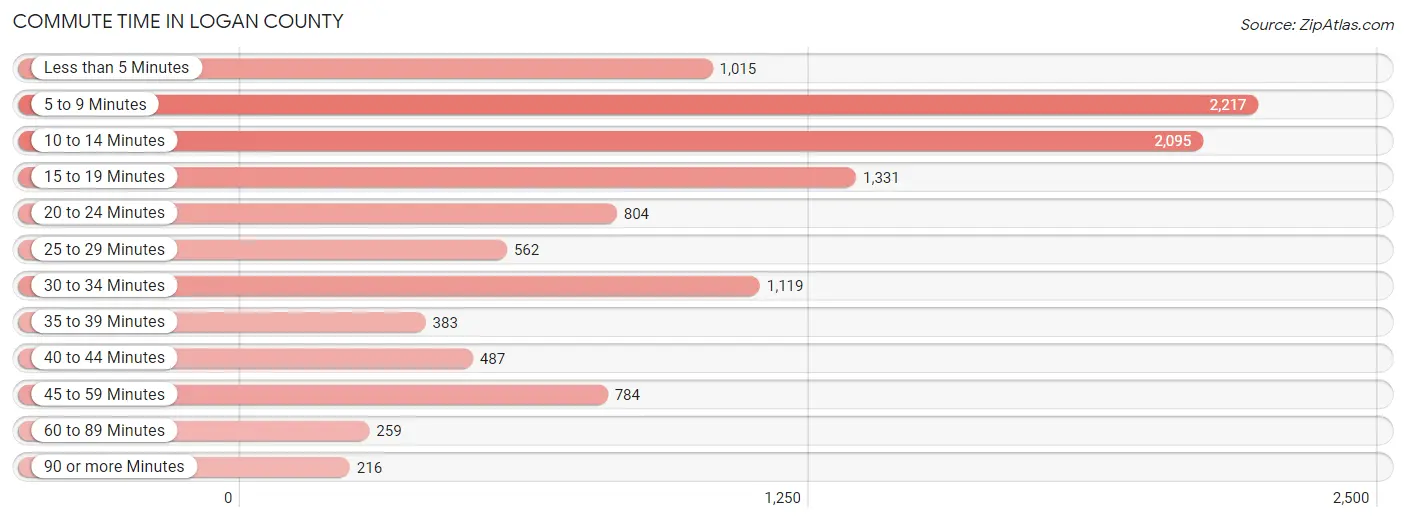
| Commute Time | # Commuters | % Commuters |
| Less than 5 Minutes | 1,015 | 9.0% |
| 5 to 9 Minutes | 2,217 | 19.7% |
| 10 to 14 Minutes | 2,095 | 18.6% |
| 15 to 19 Minutes | 1,331 | 11.8% |
| 20 to 24 Minutes | 804 | 7.1% |
| 25 to 29 Minutes | 562 | 5.0% |
| 30 to 34 Minutes | 1,119 | 9.9% |
| 35 to 39 Minutes | 383 | 3.4% |
| 40 to 44 Minutes | 487 | 4.3% |
| 45 to 59 Minutes | 784 | 7.0% |
| 60 to 89 Minutes | 259 | 2.3% |
| 90 or more Minutes | 216 | 1.9% |
Commute Time by Sex in Logan County
The most common commute times in Logan County are 5 to 9 minutes (1,298 commuters, 20.6%) for males and 5 to 9 minutes (919 commuters, 18.5%) for females.
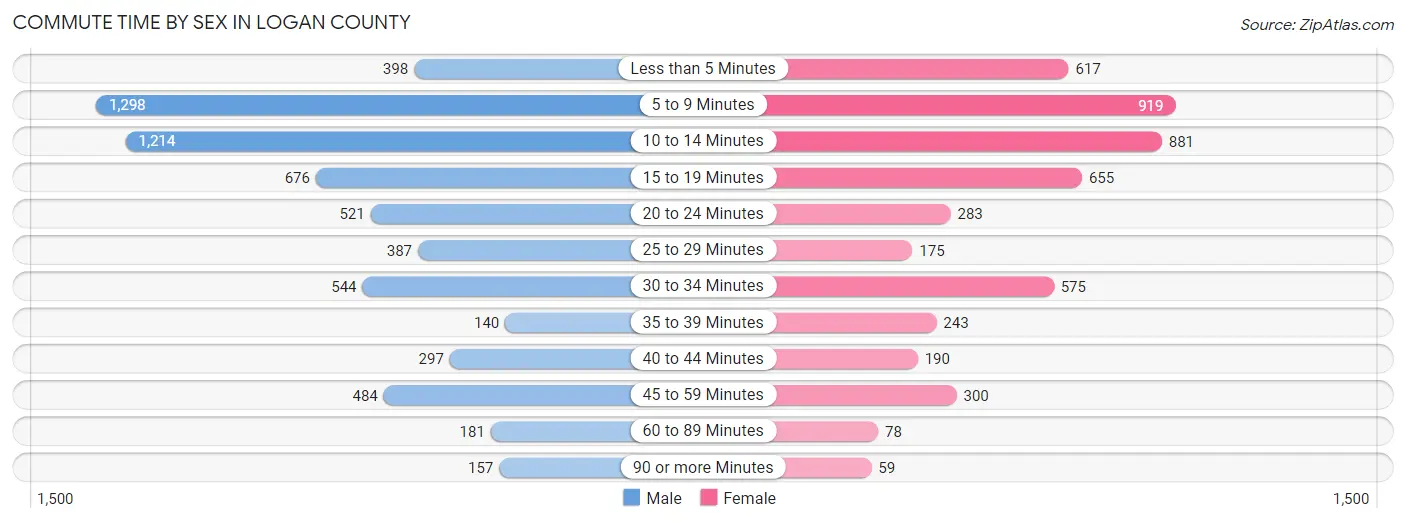
| Commute Time | Male | Female |
| Less than 5 Minutes | 398 (6.3%) | 617 (12.4%) |
| 5 to 9 Minutes | 1,298 (20.6%) | 919 (18.5%) |
| 10 to 14 Minutes | 1,214 (19.3%) | 881 (17.7%) |
| 15 to 19 Minutes | 676 (10.7%) | 655 (13.2%) |
| 20 to 24 Minutes | 521 (8.3%) | 283 (5.7%) |
| 25 to 29 Minutes | 387 (6.1%) | 175 (3.5%) |
| 30 to 34 Minutes | 544 (8.6%) | 575 (11.6%) |
| 35 to 39 Minutes | 140 (2.2%) | 243 (4.9%) |
| 40 to 44 Minutes | 297 (4.7%) | 190 (3.8%) |
| 45 to 59 Minutes | 484 (7.7%) | 300 (6.0%) |
| 60 to 89 Minutes | 181 (2.9%) | 78 (1.6%) |
| 90 or more Minutes | 157 (2.5%) | 59 (1.2%) |
Time of Departure to Work by Sex in Logan County
The most frequent times of departure to work in Logan County are 7:00 AM to 7:29 AM (950, 15.1%) for males and 7:30 AM to 7:59 AM (872, 17.5%) for females.
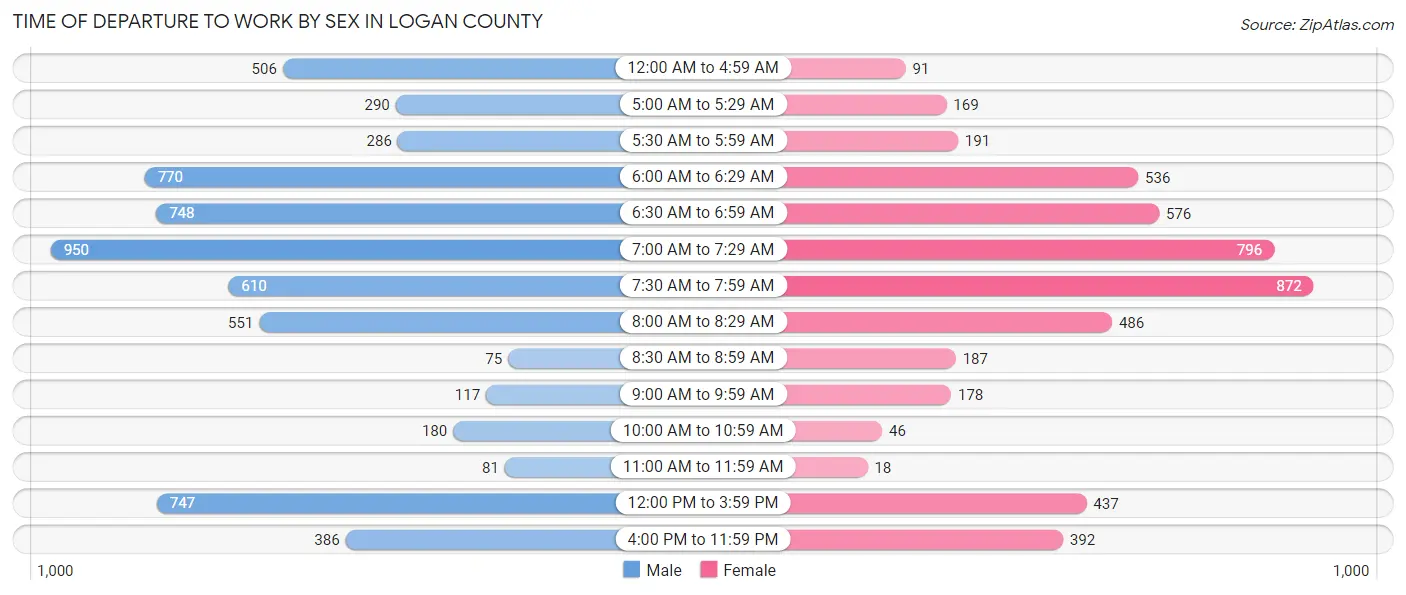
| Time of Departure | Male | Female |
| 12:00 AM to 4:59 AM | 506 (8.0%) | 91 (1.8%) |
| 5:00 AM to 5:29 AM | 290 (4.6%) | 169 (3.4%) |
| 5:30 AM to 5:59 AM | 286 (4.5%) | 191 (3.8%) |
| 6:00 AM to 6:29 AM | 770 (12.2%) | 536 (10.8%) |
| 6:30 AM to 6:59 AM | 748 (11.9%) | 576 (11.6%) |
| 7:00 AM to 7:29 AM | 950 (15.1%) | 796 (16.0%) |
| 7:30 AM to 7:59 AM | 610 (9.7%) | 872 (17.5%) |
| 8:00 AM to 8:29 AM | 551 (8.7%) | 486 (9.8%) |
| 8:30 AM to 8:59 AM | 75 (1.2%) | 187 (3.8%) |
| 9:00 AM to 9:59 AM | 117 (1.9%) | 178 (3.6%) |
| 10:00 AM to 10:59 AM | 180 (2.9%) | 46 (0.9%) |
| 11:00 AM to 11:59 AM | 81 (1.3%) | 18 (0.4%) |
| 12:00 PM to 3:59 PM | 747 (11.9%) | 437 (8.8%) |
| 4:00 PM to 11:59 PM | 386 (6.1%) | 392 (7.9%) |
| Total | 6,297 (100.0%) | 4,975 (100.0%) |
Housing Occupancy in Logan County
Occupancy by Ownership in Logan County
Of the total 11,101 dwellings in Logan County, owner-occupied units account for 7,841 (70.6%), while renter-occupied units make up 3,260 (29.4%).
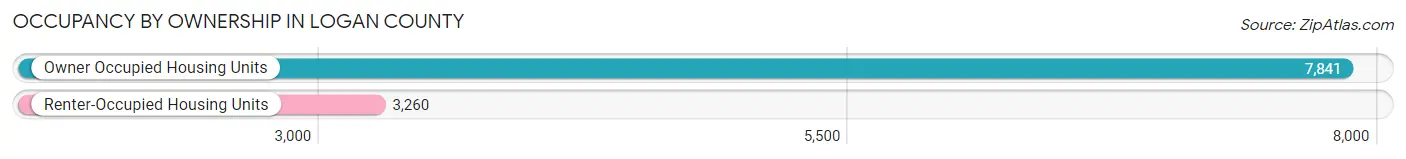
| Occupancy | # Housing Units | % Housing Units |
| Owner Occupied Housing Units | 7,841 | 70.6% |
| Renter-Occupied Housing Units | 3,260 | 29.4% |
| Total Occupied Housing Units | 11,101 | 100.0% |
Occupancy by Household Size in Logan County
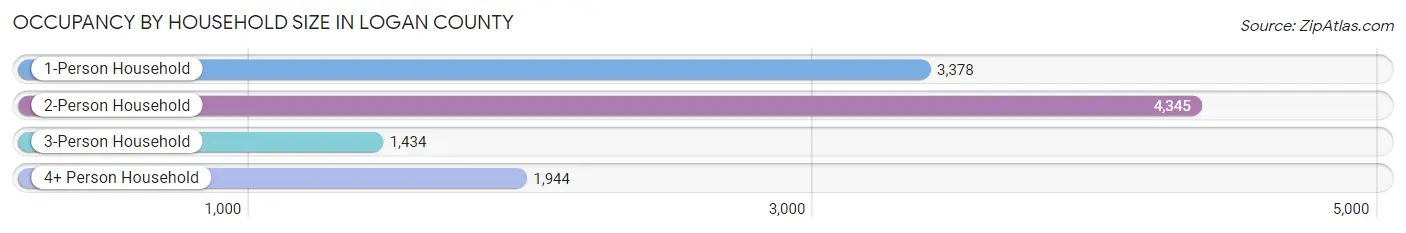
| Household Size | # Housing Units | % Housing Units |
| 1-Person Household | 3,378 | 30.4% |
| 2-Person Household | 4,345 | 39.1% |
| 3-Person Household | 1,434 | 12.9% |
| 4+ Person Household | 1,944 | 17.5% |
| Total Housing Units | 11,101 | 100.0% |
Occupancy by Ownership by Household Size in Logan County
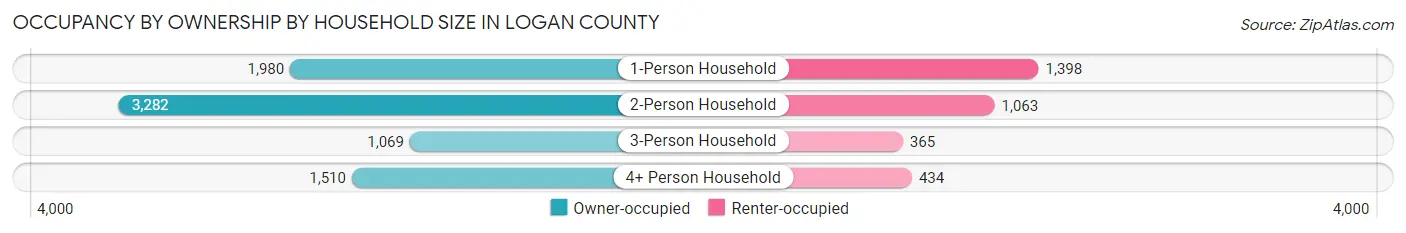
| Household Size | Owner-occupied | Renter-occupied |
| 1-Person Household | 1,980 (58.6%) | 1,398 (41.4%) |
| 2-Person Household | 3,282 (75.5%) | 1,063 (24.5%) |
| 3-Person Household | 1,069 (74.6%) | 365 (25.5%) |
| 4+ Person Household | 1,510 (77.7%) | 434 (22.3%) |
| Total Housing Units | 7,841 (70.6%) | 3,260 (29.4%) |
Occupancy by Educational Attainment in Logan County
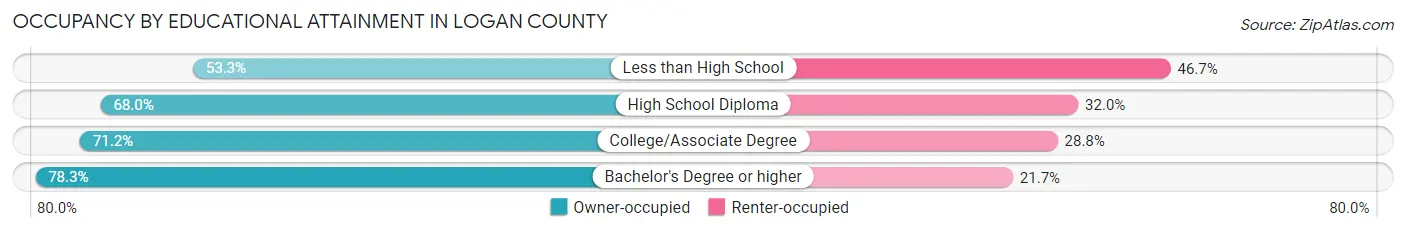
| Household Size | Owner-occupied | Renter-occupied |
| Less than High School | 330 (53.3%) | 289 (46.7%) |
| High School Diploma | 2,881 (68.0%) | 1,358 (32.0%) |
| College/Associate Degree | 2,601 (71.2%) | 1,051 (28.8%) |
| Bachelor's Degree or higher | 2,029 (78.3%) | 562 (21.7%) |
Occupancy by Age of Householder in Logan County
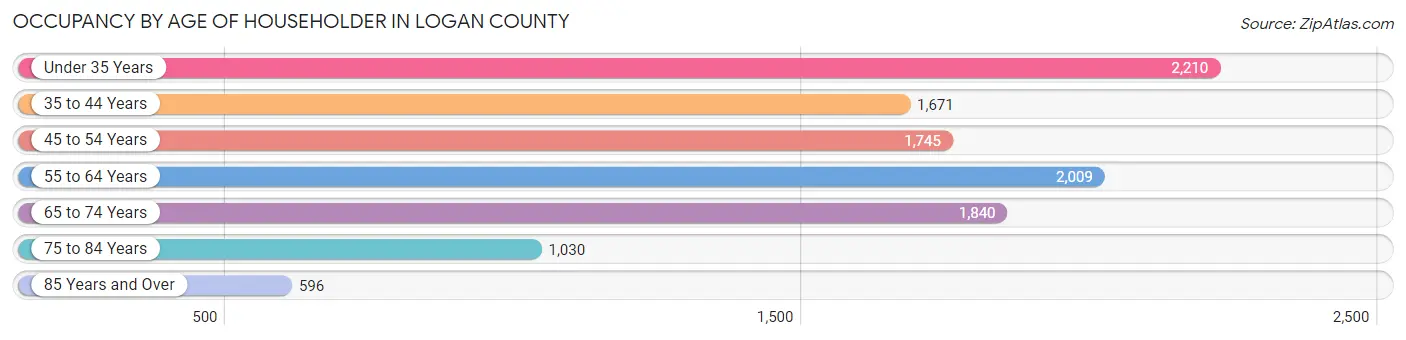
| Age Bracket | # Households | % Households |
| Under 35 Years | 2,210 | 19.9% |
| 35 to 44 Years | 1,671 | 15.0% |
| 45 to 54 Years | 1,745 | 15.7% |
| 55 to 64 Years | 2,009 | 18.1% |
| 65 to 74 Years | 1,840 | 16.6% |
| 75 to 84 Years | 1,030 | 9.3% |
| 85 Years and Over | 596 | 5.4% |
| Total | 11,101 | 100.0% |
Housing Finances in Logan County
Median Income by Occupancy in Logan County
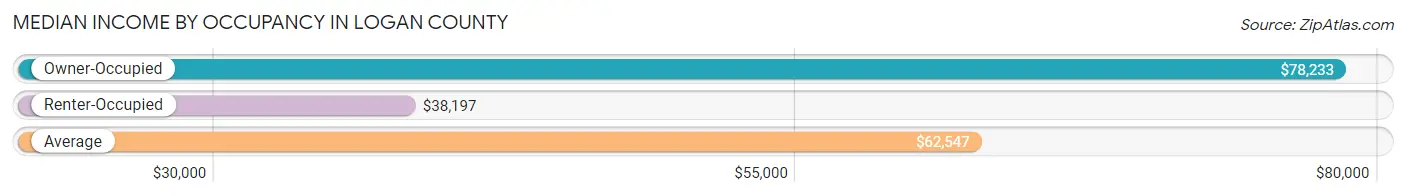
| Occupancy Type | # Households | Median Income |
| Owner-Occupied | 7,841 (70.6%) | $78,233 |
| Renter-Occupied | 3,260 (29.4%) | $38,197 |
| Average | 11,101 (100.0%) | $62,547 |
Occupancy by Householder Income Bracket in Logan County
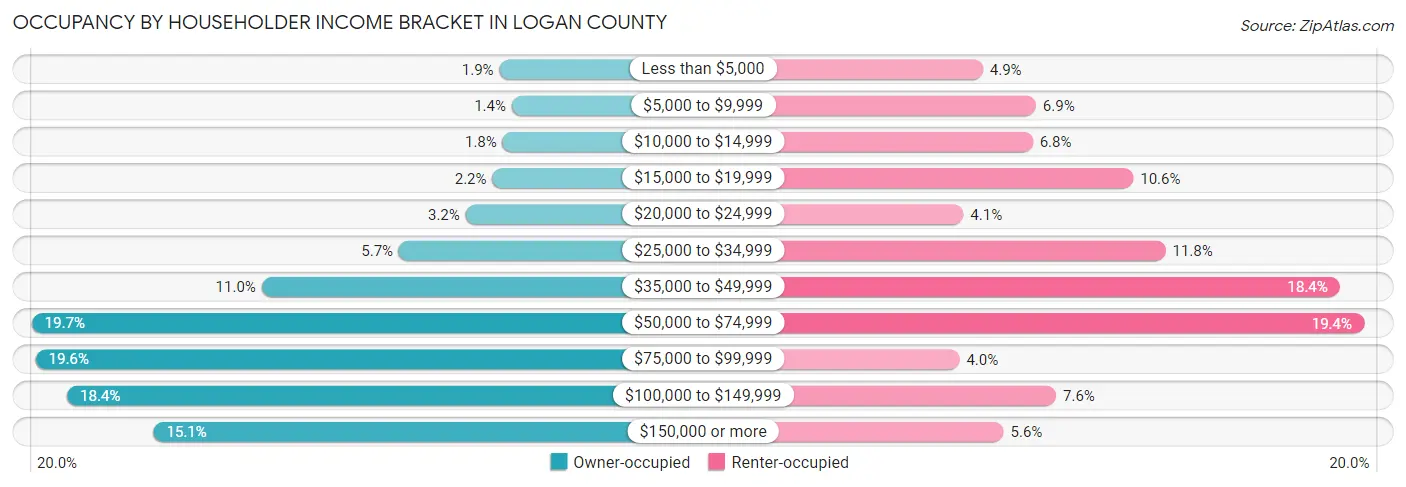
| Income Bracket | Owner-occupied | Renter-occupied |
| Less than $5,000 | 150 (1.9%) | 158 (4.9%) |
| $5,000 to $9,999 | 113 (1.4%) | 224 (6.9%) |
| $10,000 to $14,999 | 140 (1.8%) | 220 (6.8%) |
| $15,000 to $19,999 | 171 (2.2%) | 345 (10.6%) |
| $20,000 to $24,999 | 251 (3.2%) | 134 (4.1%) |
| $25,000 to $34,999 | 450 (5.7%) | 385 (11.8%) |
| $35,000 to $49,999 | 860 (11.0%) | 601 (18.4%) |
| $50,000 to $74,999 | 1,547 (19.7%) | 631 (19.4%) |
| $75,000 to $99,999 | 1,535 (19.6%) | 129 (4.0%) |
| $100,000 to $149,999 | 1,441 (18.4%) | 249 (7.6%) |
| $150,000 or more | 1,183 (15.1%) | 184 (5.6%) |
| Total | 7,841 (100.0%) | 3,260 (100.0%) |
Monthly Housing Cost Tiers in Logan County
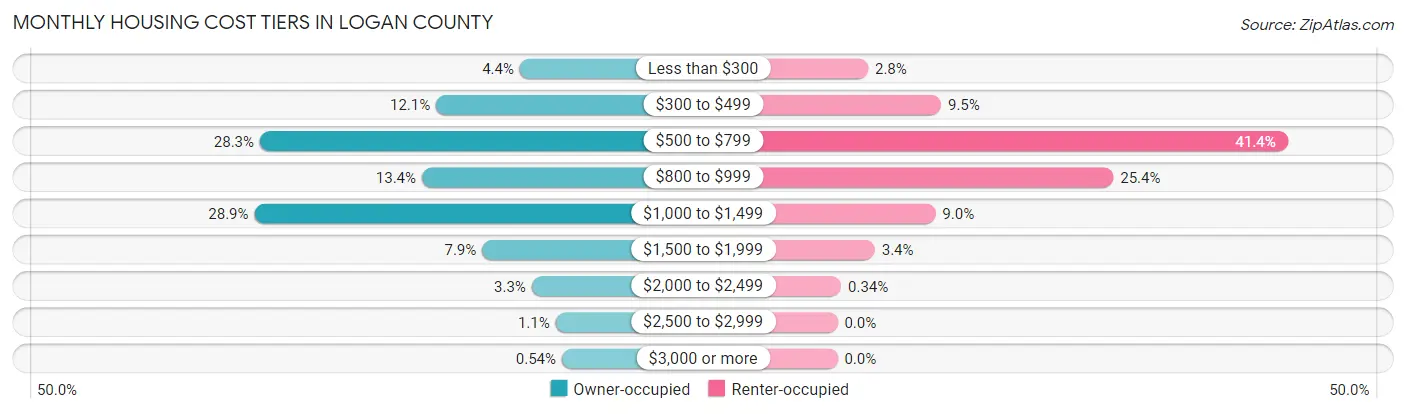
| Monthly Cost | Owner-occupied | Renter-occupied |
| Less than $300 | 346 (4.4%) | 92 (2.8%) |
| $300 to $499 | 950 (12.1%) | 311 (9.5%) |
| $500 to $799 | 2,222 (28.3%) | 1,351 (41.4%) |
| $800 to $999 | 1,053 (13.4%) | 828 (25.4%) |
| $1,000 to $1,499 | 2,262 (28.8%) | 294 (9.0%) |
| $1,500 to $1,999 | 618 (7.9%) | 112 (3.4%) |
| $2,000 to $2,499 | 260 (3.3%) | 11 (0.3%) |
| $2,500 to $2,999 | 88 (1.1%) | 0 (0.0%) |
| $3,000 or more | 42 (0.5%) | 0 (0.0%) |
| Total | 7,841 (100.0%) | 3,260 (100.0%) |
Physical Housing Characteristics in Logan County
Housing Structures in Logan County
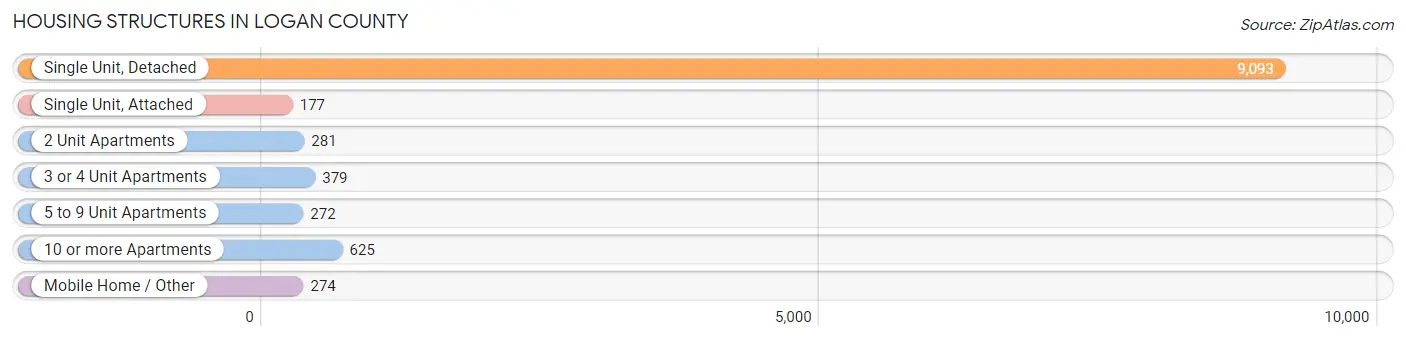
| Structure Type | # Housing Units | % Housing Units |
| Single Unit, Detached | 9,093 | 81.9% |
| Single Unit, Attached | 177 | 1.6% |
| 2 Unit Apartments | 281 | 2.5% |
| 3 or 4 Unit Apartments | 379 | 3.4% |
| 5 to 9 Unit Apartments | 272 | 2.5% |
| 10 or more Apartments | 625 | 5.6% |
| Mobile Home / Other | 274 | 2.5% |
| Total | 11,101 | 100.0% |
Housing Structures by Occupancy in Logan County
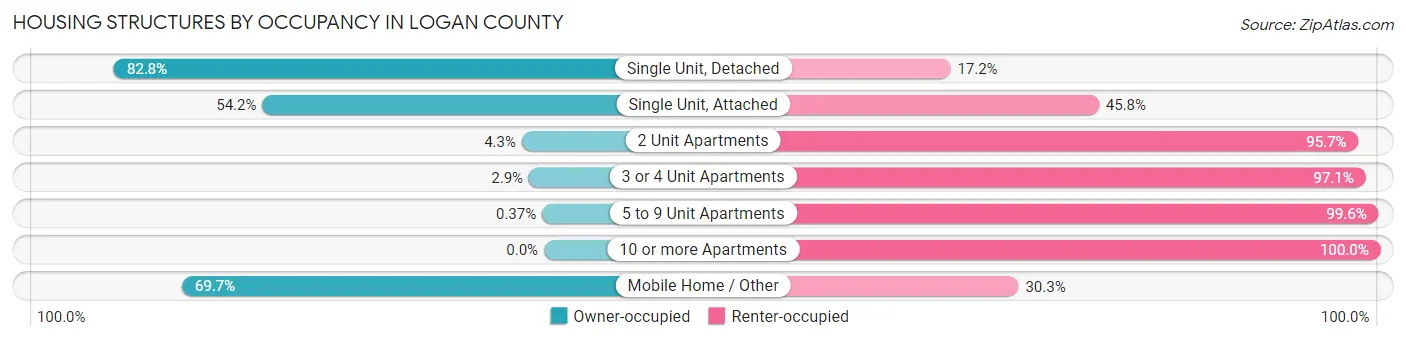
| Structure Type | Owner-occupied | Renter-occupied |
| Single Unit, Detached | 7,530 (82.8%) | 1,563 (17.2%) |
| Single Unit, Attached | 96 (54.2%) | 81 (45.8%) |
| 2 Unit Apartments | 12 (4.3%) | 269 (95.7%) |
| 3 or 4 Unit Apartments | 11 (2.9%) | 368 (97.1%) |
| 5 to 9 Unit Apartments | 1 (0.4%) | 271 (99.6%) |
| 10 or more Apartments | 0 (0.0%) | 625 (100.0%) |
| Mobile Home / Other | 191 (69.7%) | 83 (30.3%) |
| Total | 7,841 (70.6%) | 3,260 (29.4%) |
Housing Structures by Number of Rooms in Logan County
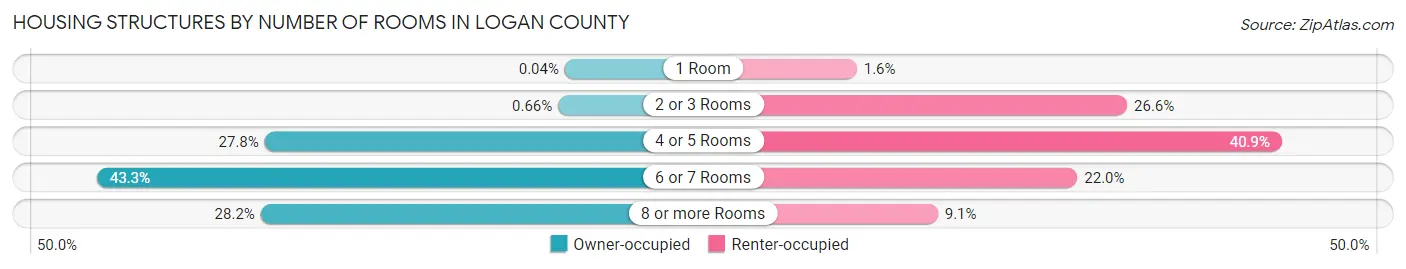
| Number of Rooms | Owner-occupied | Renter-occupied |
| 1 Room | 3 (0.0%) | 51 (1.6%) |
| 2 or 3 Rooms | 52 (0.7%) | 866 (26.6%) |
| 4 or 5 Rooms | 2,180 (27.8%) | 1,332 (40.9%) |
| 6 or 7 Rooms | 3,397 (43.3%) | 716 (22.0%) |
| 8 or more Rooms | 2,209 (28.2%) | 295 (9.0%) |
| Total | 7,841 (100.0%) | 3,260 (100.0%) |
Housing Structure by Heating Type in Logan County
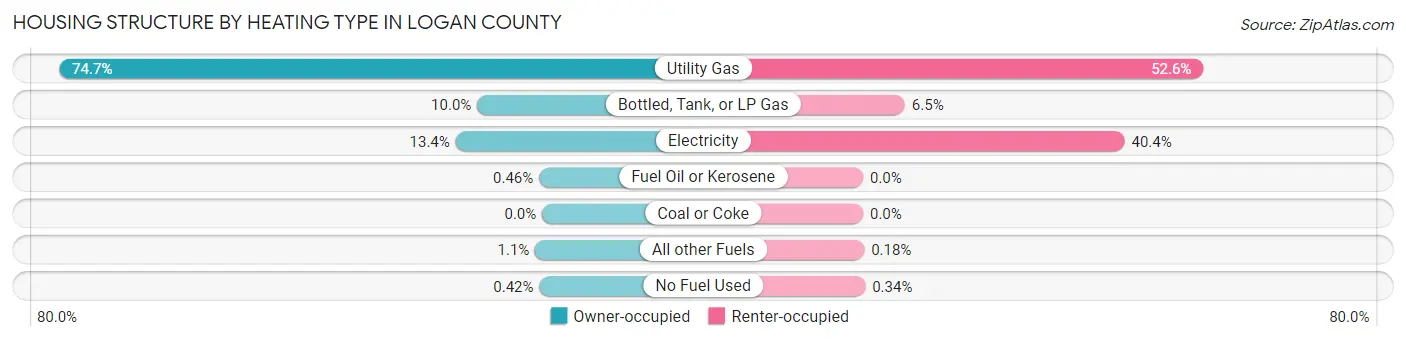
| Heating Type | Owner-occupied | Renter-occupied |
| Utility Gas | 5,853 (74.7%) | 1,714 (52.6%) |
| Bottled, Tank, or LP Gas | 787 (10.0%) | 211 (6.5%) |
| Electricity | 1,048 (13.4%) | 1,318 (40.4%) |
| Fuel Oil or Kerosene | 36 (0.5%) | 0 (0.0%) |
| Coal or Coke | 0 (0.0%) | 0 (0.0%) |
| All other Fuels | 84 (1.1%) | 6 (0.2%) |
| No Fuel Used | 33 (0.4%) | 11 (0.3%) |
| Total | 7,841 (100.0%) | 3,260 (100.0%) |
Household Vehicle Usage in Logan County
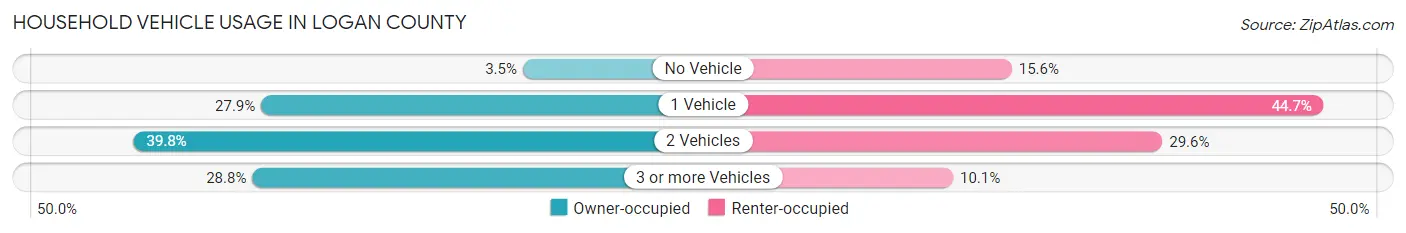
| Vehicles per Household | Owner-occupied | Renter-occupied |
| No Vehicle | 274 (3.5%) | 508 (15.6%) |
| 1 Vehicle | 2,189 (27.9%) | 1,457 (44.7%) |
| 2 Vehicles | 3,124 (39.8%) | 966 (29.6%) |
| 3 or more Vehicles | 2,254 (28.7%) | 329 (10.1%) |
| Total | 7,841 (100.0%) | 3,260 (100.0%) |
Real Estate & Mortgages in Logan County
Real Estate and Mortgage Overview in Logan County
| Characteristic | Without Mortgage | With Mortgage |
| Housing Units | 3,268 | 4,573 |
| Median Property Value | $126,300 | $114,200 |
| Median Household Income | $63,214 | $814 |
| Monthly Housing Costs | $564 | $42 |
| Real Estate Taxes | $2,335 | $63 |
Property Value by Mortgage Status in Logan County
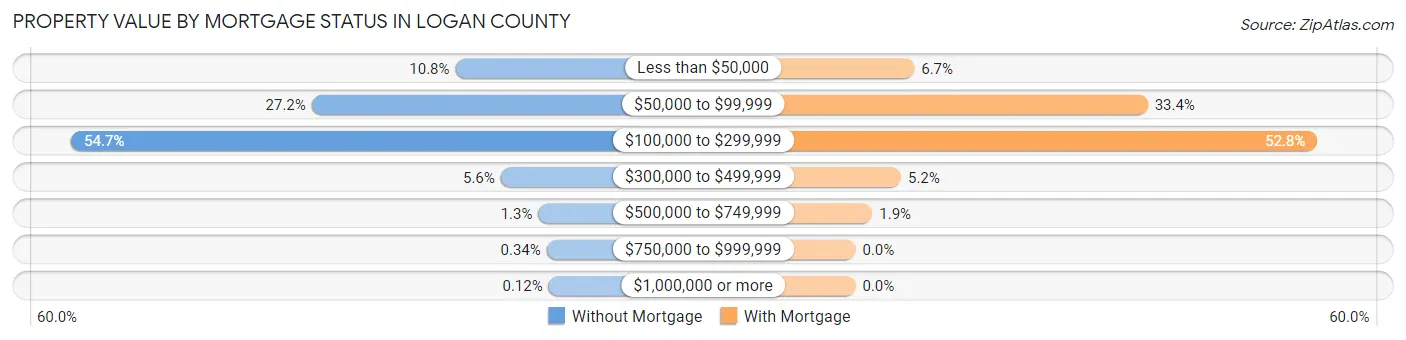
| Property Value | Without Mortgage | With Mortgage |
| Less than $50,000 | 352 (10.8%) | 307 (6.7%) |
| $50,000 to $99,999 | 889 (27.2%) | 1,527 (33.4%) |
| $100,000 to $299,999 | 1,787 (54.7%) | 2,413 (52.8%) |
| $300,000 to $499,999 | 183 (5.6%) | 238 (5.2%) |
| $500,000 to $749,999 | 42 (1.3%) | 88 (1.9%) |
| $750,000 to $999,999 | 11 (0.3%) | 0 (0.0%) |
| $1,000,000 or more | 4 (0.1%) | 0 (0.0%) |
| Total | 3,268 (100.0%) | 4,573 (100.0%) |
Household Income by Mortgage Status in Logan County
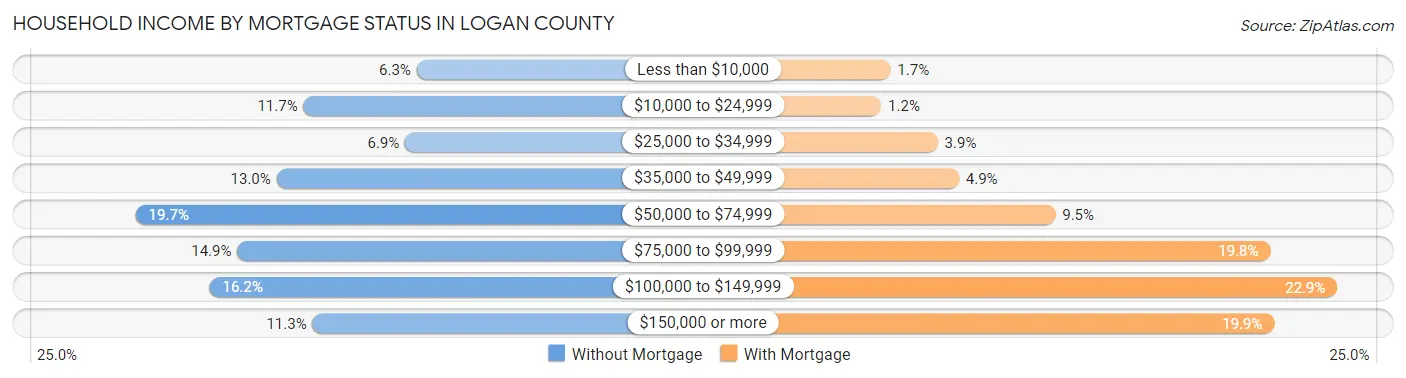
| Household Income | Without Mortgage | With Mortgage |
| Less than $10,000 | 207 (6.3%) | 76 (1.7%) |
| $10,000 to $24,999 | 383 (11.7%) | 56 (1.2%) |
| $25,000 to $34,999 | 225 (6.9%) | 179 (3.9%) |
| $35,000 to $49,999 | 425 (13.0%) | 225 (4.9%) |
| $50,000 to $74,999 | 644 (19.7%) | 435 (9.5%) |
| $75,000 to $99,999 | 486 (14.9%) | 903 (19.8%) |
| $100,000 to $149,999 | 529 (16.2%) | 1,049 (22.9%) |
| $150,000 or more | 369 (11.3%) | 912 (19.9%) |
| Total | 3,268 (100.0%) | 4,573 (100.0%) |
Property Value to Household Income Ratio in Logan County
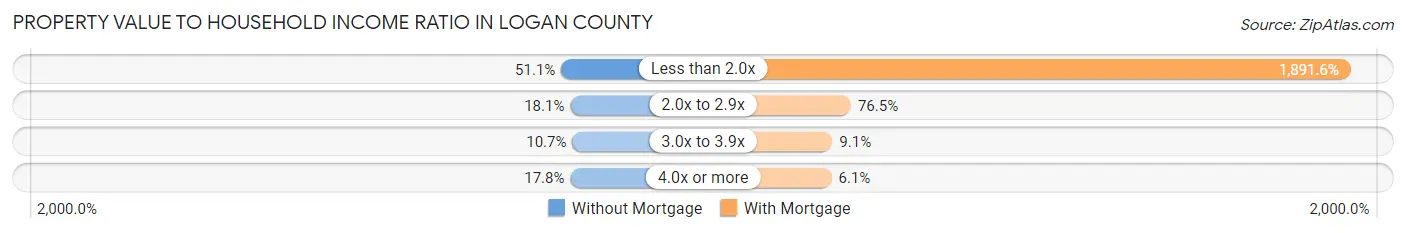
| Value-to-Income Ratio | Without Mortgage | With Mortgage |
| Less than 2.0x | 1,669 (51.1%) | 86,502 (1,891.6%) |
| 2.0x to 2.9x | 592 (18.1%) | 3,496 (76.4%) |
| 3.0x to 3.9x | 350 (10.7%) | 415 (9.1%) |
| 4.0x or more | 581 (17.8%) | 278 (6.1%) |
| Total | 3,268 (100.0%) | 4,573 (100.0%) |
Real Estate Taxes by Mortgage Status in Logan County
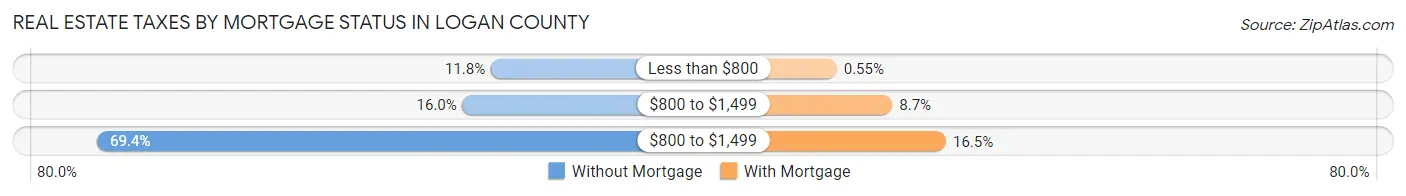
| Property Taxes | Without Mortgage | With Mortgage |
| Less than $800 | 387 (11.8%) | 25 (0.5%) |
| $800 to $1,499 | 523 (16.0%) | 396 (8.7%) |
| $800 to $1,499 | 2,268 (69.4%) | 755 (16.5%) |
| Total | 3,268 (100.0%) | 4,573 (100.0%) |
Health & Disability in Logan County
Health Insurance Coverage by Age in Logan County

| Age Bracket | With Coverage | Without Coverage |
| Under 6 Years | 1,642 (98.2%) | 30 (1.8%) |
| 6 to 18 Years | 4,051 (97.8%) | 91 (2.2%) |
| 19 to 25 Years | 2,316 (92.7%) | 183 (7.3%) |
| 26 to 34 Years | 2,490 (94.6%) | 141 (5.4%) |
| 35 to 44 Years | 2,748 (93.8%) | 182 (6.2%) |
| 45 to 54 Years | 2,874 (95.8%) | 125 (4.2%) |
| 55 to 64 Years | 3,394 (96.8%) | 114 (3.3%) |
| 65 to 74 Years | 2,795 (99.9%) | 4 (0.1%) |
| 75 Years and older | 2,250 (100.0%) | 0 (0.0%) |
| Total | 24,560 (96.6%) | 870 (3.4%) |
Health Insurance Coverage by Citizenship Status in Logan County
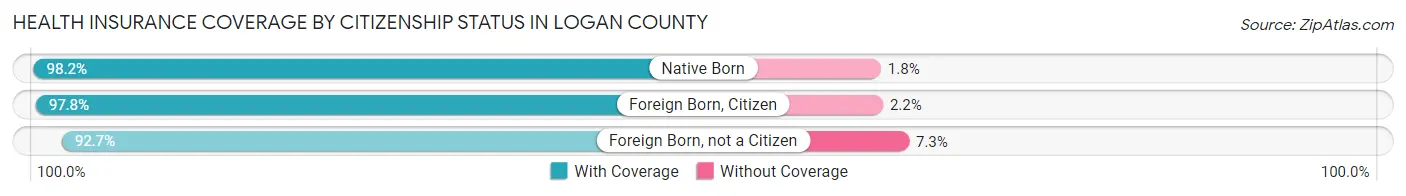
| Citizenship Status | With Coverage | Without Coverage |
| Native Born | 1,642 (98.2%) | 30 (1.8%) |
| Foreign Born, Citizen | 4,051 (97.8%) | 91 (2.2%) |
| Foreign Born, not a Citizen | 2,316 (92.7%) | 183 (7.3%) |
Health Insurance Coverage by Household Income in Logan County
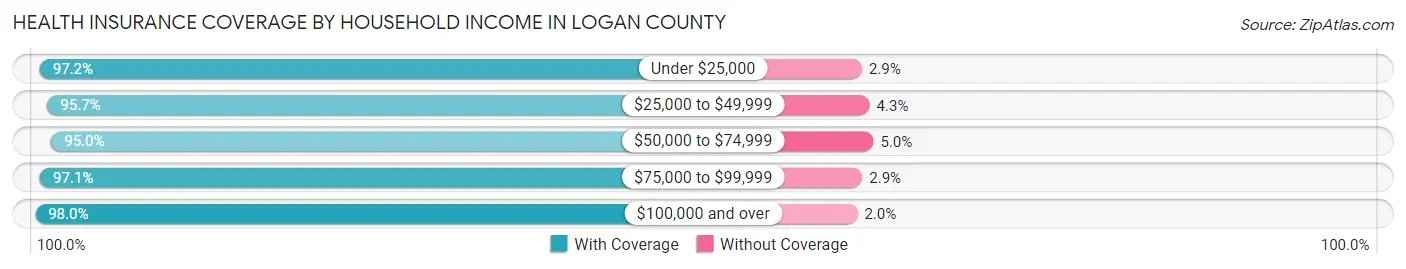
| Household Income | With Coverage | Without Coverage |
| Under $25,000 | 2,929 (97.2%) | 86 (2.9%) |
| $25,000 to $49,999 | 3,760 (95.7%) | 168 (4.3%) |
| $50,000 to $74,999 | 4,685 (95.0%) | 247 (5.0%) |
| $75,000 to $99,999 | 4,222 (97.1%) | 127 (2.9%) |
| $100,000 and over | 8,235 (98.0%) | 168 (2.0%) |
Public vs Private Health Insurance Coverage by Age in Logan County
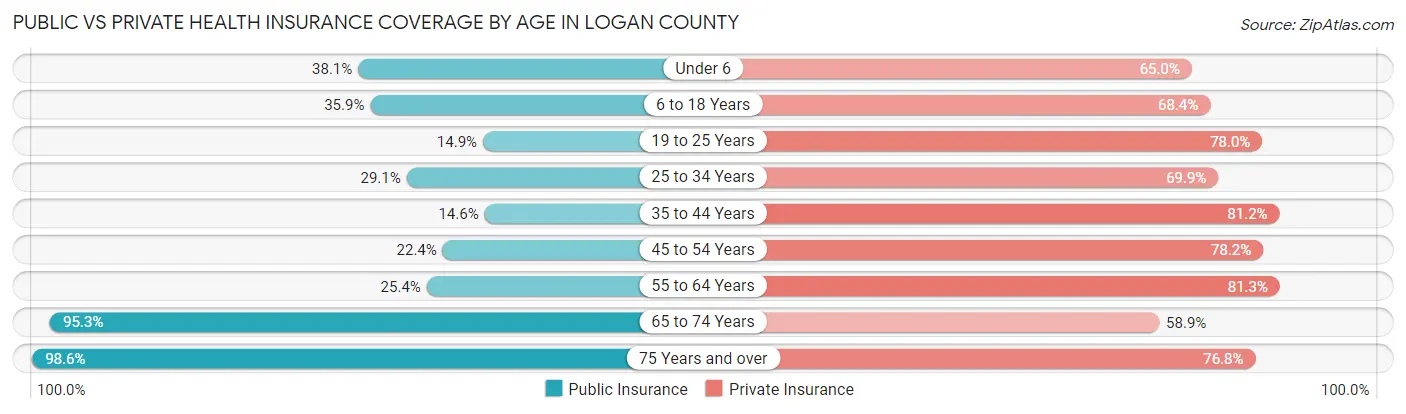
| Age Bracket | Public Insurance | Private Insurance |
| Under 6 | 637 (38.1%) | 1,086 (64.9%) |
| 6 to 18 Years | 1,485 (35.8%) | 2,831 (68.3%) |
| 19 to 25 Years | 373 (14.9%) | 1,950 (78.0%) |
| 25 to 34 Years | 766 (29.1%) | 1,838 (69.9%) |
| 35 to 44 Years | 429 (14.6%) | 2,380 (81.2%) |
| 45 to 54 Years | 672 (22.4%) | 2,345 (78.2%) |
| 55 to 64 Years | 890 (25.4%) | 2,852 (81.3%) |
| 65 to 74 Years | 2,667 (95.3%) | 1,649 (58.9%) |
| 75 Years and over | 2,218 (98.6%) | 1,727 (76.8%) |
| Total | 10,137 (39.9%) | 18,658 (73.4%) |
Disability Status by Sex by Age in Logan County
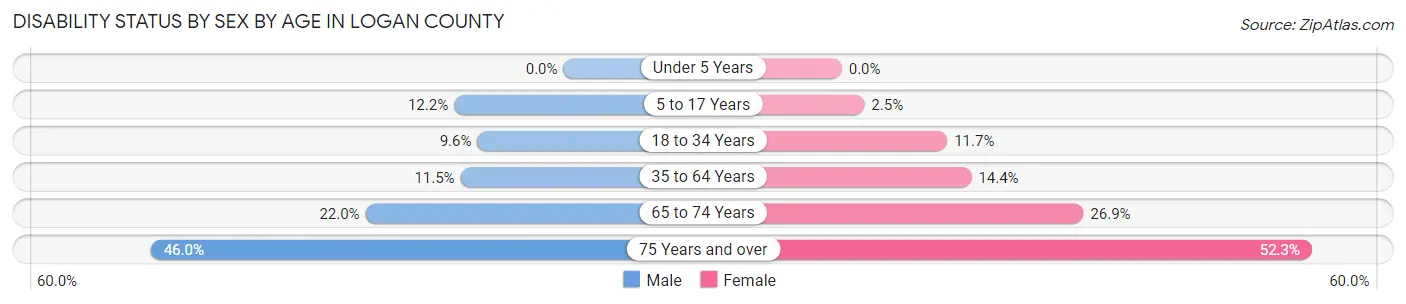
| Age Bracket | Male | Female |
| Under 5 Years | 0 (0.0%) | 0 (0.0%) |
| 5 to 17 Years | 248 (12.2%) | 51 (2.5%) |
| 18 to 34 Years | 269 (9.6%) | 313 (11.7%) |
| 35 to 64 Years | 559 (11.5%) | 658 (14.4%) |
| 65 to 74 Years | 300 (22.0%) | 387 (26.9%) |
| 75 Years and over | 414 (46.0%) | 706 (52.3%) |
Disability Class by Sex by Age in Logan County
Disability Class: Hearing Difficulty
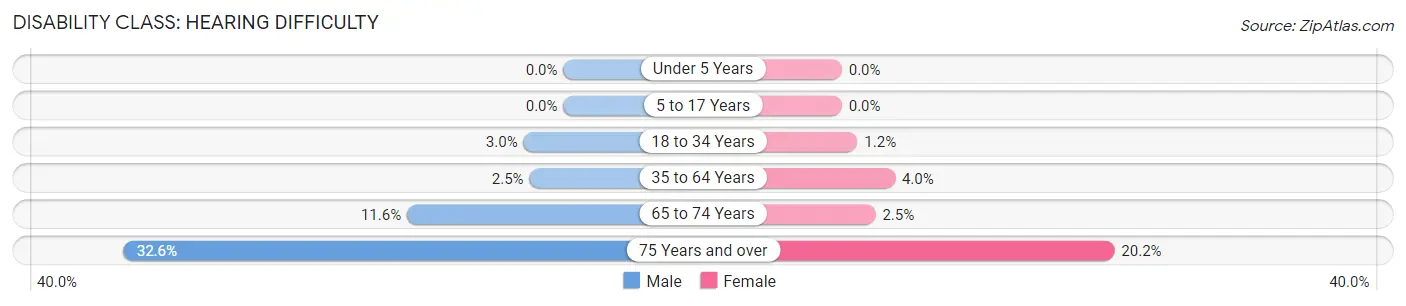
| Age Bracket | Male | Female |
| Under 5 Years | 0 (0.0%) | 0 (0.0%) |
| 5 to 17 Years | 0 (0.0%) | 0 (0.0%) |
| 18 to 34 Years | 83 (3.0%) | 31 (1.2%) |
| 35 to 64 Years | 123 (2.5%) | 180 (4.0%) |
| 65 to 74 Years | 158 (11.6%) | 36 (2.5%) |
| 75 Years and over | 294 (32.6%) | 273 (20.2%) |
Disability Class: Vision Difficulty
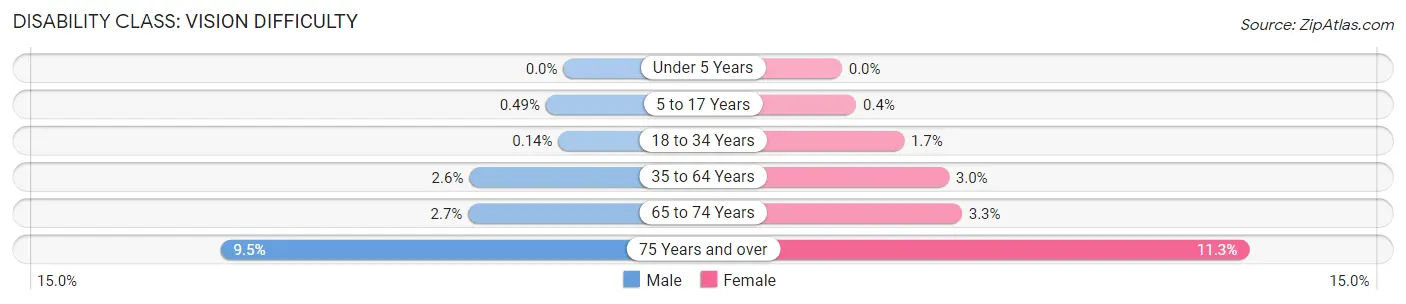
| Age Bracket | Male | Female |
| Under 5 Years | 0 (0.0%) | 0 (0.0%) |
| 5 to 17 Years | 10 (0.5%) | 8 (0.4%) |
| 18 to 34 Years | 4 (0.1%) | 46 (1.7%) |
| 35 to 64 Years | 128 (2.6%) | 136 (3.0%) |
| 65 to 74 Years | 36 (2.6%) | 48 (3.3%) |
| 75 Years and over | 86 (9.5%) | 153 (11.3%) |
Disability Class: Cognitive Difficulty
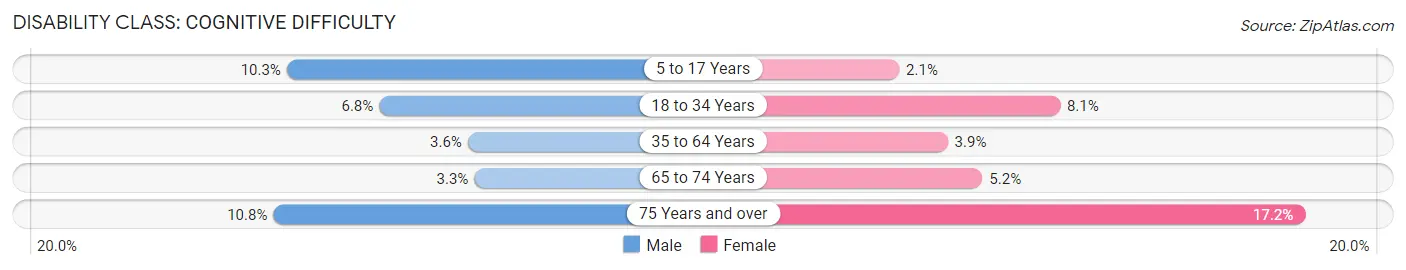
| Age Bracket | Male | Female |
| 5 to 17 Years | 209 (10.3%) | 43 (2.1%) |
| 18 to 34 Years | 192 (6.8%) | 216 (8.1%) |
| 35 to 64 Years | 173 (3.5%) | 179 (3.9%) |
| 65 to 74 Years | 45 (3.3%) | 75 (5.2%) |
| 75 Years and over | 97 (10.8%) | 232 (17.2%) |
Disability Class: Ambulatory Difficulty
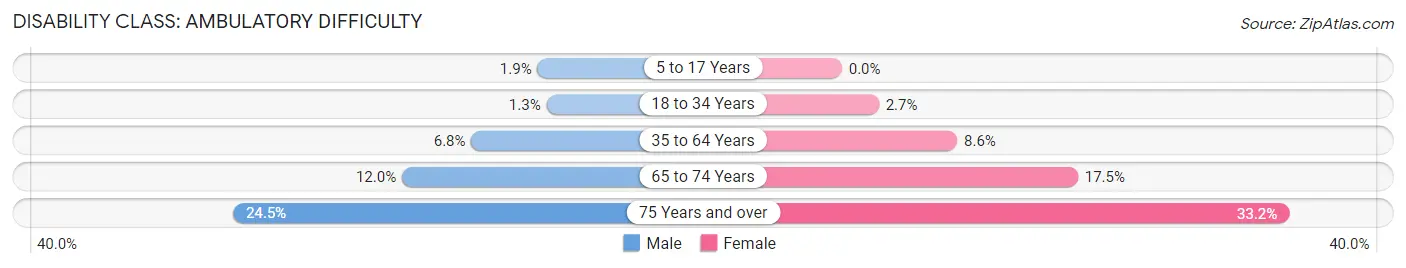
| Age Bracket | Male | Female |
| 5 to 17 Years | 39 (1.9%) | 0 (0.0%) |
| 18 to 34 Years | 35 (1.3%) | 73 (2.7%) |
| 35 to 64 Years | 333 (6.8%) | 390 (8.6%) |
| 65 to 74 Years | 163 (12.0%) | 252 (17.5%) |
| 75 Years and over | 221 (24.5%) | 448 (33.2%) |
Disability Class: Self-Care Difficulty
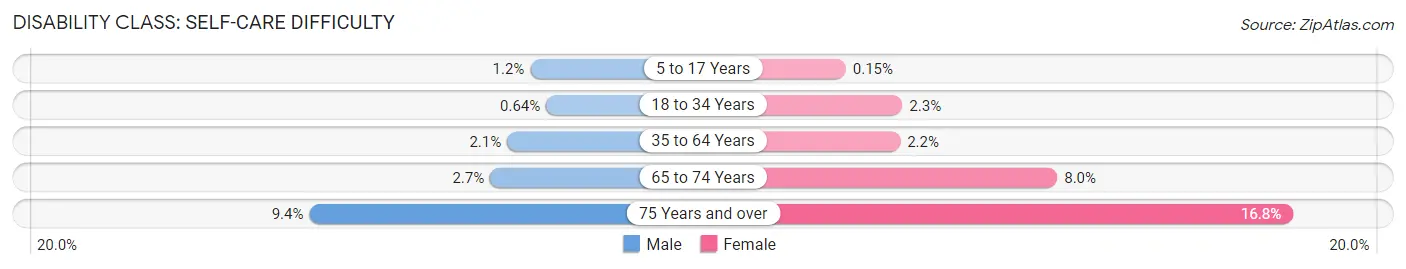
| Age Bracket | Male | Female |
| 5 to 17 Years | 25 (1.2%) | 3 (0.2%) |
| 18 to 34 Years | 18 (0.6%) | 60 (2.2%) |
| 35 to 64 Years | 102 (2.1%) | 99 (2.2%) |
| 65 to 74 Years | 37 (2.7%) | 115 (8.0%) |
| 75 Years and over | 85 (9.4%) | 226 (16.8%) |
Technology Access in Logan County
Computing Device Access in Logan County
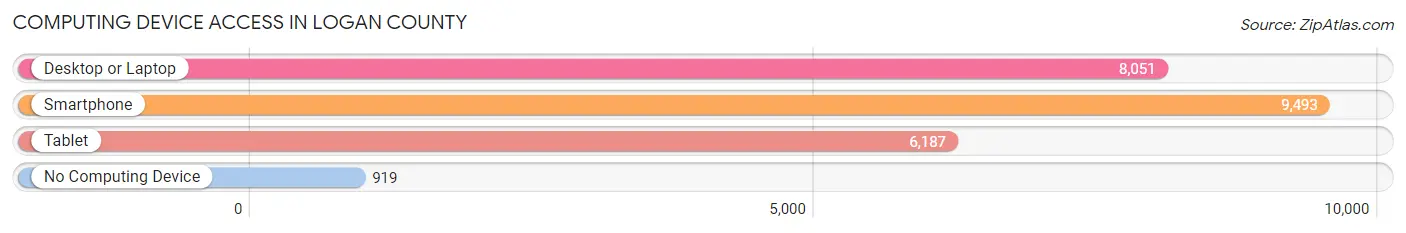
| Device Type | # Households | % Households |
| Desktop or Laptop | 8,051 | 72.5% |
| Smartphone | 9,493 | 85.5% |
| Tablet | 6,187 | 55.7% |
| No Computing Device | 919 | 8.3% |
| Total | 11,101 | 100.0% |
Internet Access in Logan County

| Internet Type | # Households | % Households |
| Dial-Up Internet | 31 | 0.3% |
| Broadband Home | 6,336 | 57.1% |
| Cellular Data Only | 2,189 | 19.7% |
| Satellite Internet | 904 | 8.1% |
| No Internet | 1,772 | 16.0% |
| Total | 11,101 | 100.0% |
Logan County Summary
Logan County is located in the central part of the state of Illinois, in the United States. It is bordered by McLean County to the north, DeWitt County to the east, Macon County to the south, and Sangamon County to the west. The county seat is Lincoln, and the county has a total area of 576 square miles. As of the 2010 census, the population was 30,305.
History
Logan County was formed in 1839 from parts of Sangamon and Tazewell counties. It was named for John A. Logan, a prominent Illinois politician and Civil War general. The county was largely agricultural in its early years, with corn, wheat, and oats being the main crops. The county also had a strong mining industry, with coal being the main mineral mined.
Geography
Logan County is located in the central part of the state of Illinois. It is bordered by McLean County to the north, DeWitt County to the east, Macon County to the south, and Sangamon County to the west. The county has a total area of 576 square miles, of which 574 square miles is land and 2 square miles is water. The county is mostly flat, with some rolling hills in the northern and western parts. The Sangamon River runs through the county, and there are several small lakes and ponds scattered throughout.
Economy
Logan County has a diverse economy, with agriculture, manufacturing, and services being the main industries. Agriculture is the largest sector, with corn, soybeans, and wheat being the main crops. Manufacturing is also important, with food processing, metal fabrication, and plastics being the main industries. The county also has a strong service sector, with healthcare, education, and retail being the main industries.
Demographics
As of the 2010 census, the population of Logan County was 30,305. The population is mostly white (90.2%), with small percentages of African American (3.7%), Hispanic (2.7%), and Asian (1.3%) residents. The median household income is $50,945, and the median age is 40.3 years.
Conclusion
Logan County is a rural county located in the central part of the state of Illinois. It has a diverse economy, with agriculture, manufacturing, and services being the main industries. The population is mostly white, with small percentages of African American, Hispanic, and Asian residents. The median household income is $50,945, and the median age is 40.3 years. Logan County has a rich history and is an important part of the state of Illinois.
Common Questions
What is the Total Population of Logan County?
Total Population of Logan County is 28,027.
What is the Total Male Population of Logan County?
Total Male Population of Logan County is 13,619.
What is the Total Female Population of Logan County?
Total Female Population of Logan County is 14,408.
What is the Ratio of Males per 100 Females in Logan County?
There are 94.52 Males per 100 Females in Logan County.
What is the Ratio of Females per 100 Males in Logan County?
There are 105.79 Females per 100 Males in Logan County.
What is the Median Population Age in Logan County?
Median Population Age in Logan County is 40.3 Years.
What is the Average Family Size in Logan County
Average Family Size in Logan County is 2.8 People.
What is the Average Household Size in Logan County
Average Household Size in Logan County is 2.2 People.
What is Per Capita Income in Logan County?
Per Capita income in Logan County is $33,280.
What is the Median Family Income in Logan County?
Median Family Income in Logan County is $80,993.
What is the Median Household income in Logan County?
Median Household Income in Logan County is $62,547.
What is Income or Wage Gap in Logan County?
Income or Wage Gap in Logan County is 36.7%.
Women in Logan County earn 63.3 cents for every dollar earned by a man.
What is Inequality or Gini Index in Logan County?
Inequality or Gini Index in Logan County is 0.44.
How Large is the Labor Force in Logan County?
There are 12,938 People in the Labor Forcein in Logan County.
What is the Percentage of People in the Labor Force in Logan County?
55.7% of People are in the Labor Force in Logan County.
What is the Unemployment Rate in Logan County?
Unemployment Rate in Logan County is 5.2%.