Lee County, IL
Lee County Map
Lee County Overview
34,221
TOTAL POPULATION
18,205
MALE POPULATION
16,016
FEMALE POPULATION
113.67
MALES / 100 FEMALES
87.98
FEMALES / 100 MALES
42.8
MEDIAN AGE
2.9
AVG FAMILY SIZE
2.3
AVG HOUSEHOLD SIZE
$33,491
PER CAPITA INCOME
$84,695
AVG FAMILY INCOME
$64,588
AVG HOUSEHOLD INCOME
36.7%
WAGE / INCOME GAP [ % ]
63.3¢/ $1
WAGE / INCOME GAP [ $ ]
$10,731
FAMILY INCOME DEFICIT
0.44
INEQUALITY / GINI INDEX
15,846
LABOR FORCE [ PEOPLE ]
56.0%
PERCENT IN LABOR FORCE
3.5%
UNEMPLOYMENT RATE
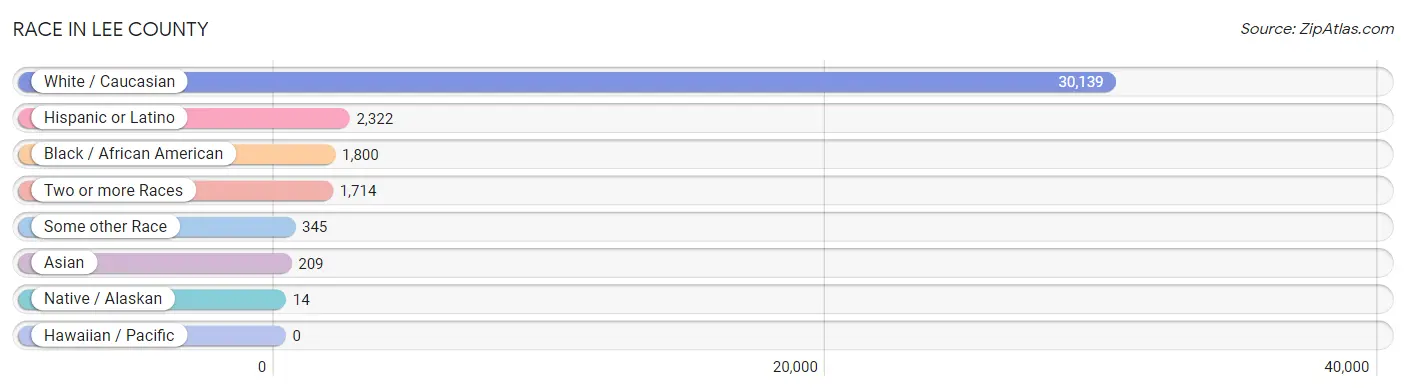
Race in Lee County
The most populous races in Lee County are White / Caucasian (30,139 | 88.1%), Hispanic or Latino (2,322 | 6.8%), and Black / African American (1,800 | 5.3%).
| Race | # Population | % Population |
| Asian | 209 | 0.6% |
| Black / African American | 1,800 | 5.3% |
| Hawaiian / Pacific | 0 | 0.0% |
| Hispanic or Latino | 2,322 | 6.8% |
| Native / Alaskan | 14 | 0.0% |
| White / Caucasian | 30,139 | 88.1% |
| Two or more Races | 1,714 | 5.0% |
| Some other Race | 345 | 1.0% |
| Total | 34,221 | 100.0% |
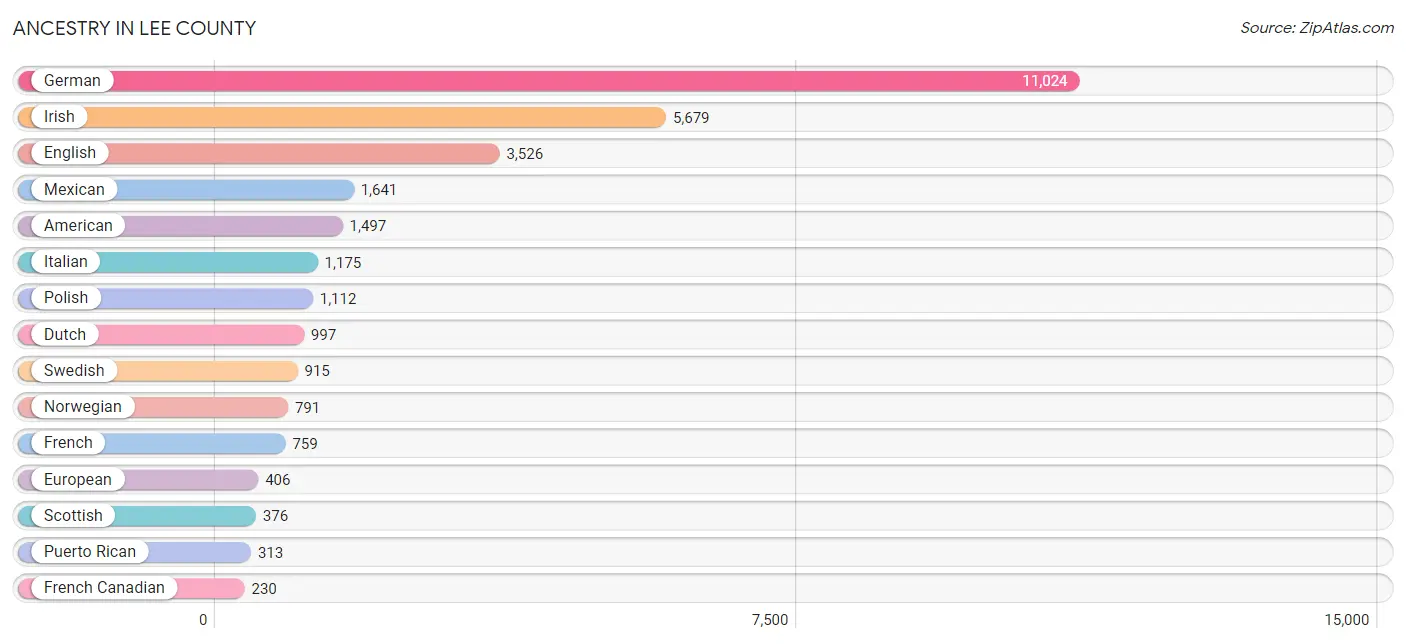
Ancestry in Lee County
The most populous ancestries reported in Lee County are German (11,024 | 32.2%), Irish (5,679 | 16.6%), English (3,526 | 10.3%), Mexican (1,641 | 4.8%), and American (1,497 | 4.4%), together accounting for 68.3% of all Lee County residents.
| Ancestry | # Population | % Population |
| African | 31 | 0.1% |
| Albanian | 19 | 0.1% |
| American | 1,497 | 4.4% |
| Arab | 22 | 0.1% |
| Argentinean | 7 | 0.0% |
| Australian | 4 | 0.0% |
| Austrian | 21 | 0.1% |
| Belgian | 155 | 0.4% |
| Bhutanese | 32 | 0.1% |
| Blackfeet | 3 | 0.0% |
| British | 189 | 0.5% |
| Bulgarian | 43 | 0.1% |
| Burmese | 56 | 0.2% |
| Cambodian | 3 | 0.0% |
| Canadian | 35 | 0.1% |
| Central American | 64 | 0.2% |
| Central American Indian | 16 | 0.1% |
| Cherokee | 67 | 0.2% |
| Chilean | 82 | 0.2% |
| Choctaw | 1 | 0.0% |
| Colombian | 30 | 0.1% |
| Croatian | 15 | 0.0% |
| Cuban | 32 | 0.1% |
| Czech | 172 | 0.5% |
| Czechoslovakian | 30 | 0.1% |
| Danish | 193 | 0.6% |
| Dutch | 997 | 2.9% |
| Eastern European | 79 | 0.2% |
| English | 3,526 | 10.3% |
| European | 406 | 1.2% |
| Finnish | 16 | 0.1% |
| French | 759 | 2.2% |
| French Canadian | 230 | 0.7% |
| German | 11,024 | 32.2% |
| Greek | 100 | 0.3% |
| Guamanian / Chamorro | 30 | 0.1% |
| Guatemalan | 16 | 0.1% |
| Haitian | 7 | 0.0% |
| Hungarian | 154 | 0.4% |
| Indian (Asian) | 77 | 0.2% |
| Irish | 5,679 | 16.6% |
| Italian | 1,175 | 3.4% |
| Jamaican | 9 | 0.0% |
| Korean | 104 | 0.3% |
| Latvian | 3 | 0.0% |
| Lebanese | 8 | 0.0% |
| Lithuanian | 26 | 0.1% |
| Luxembourger | 1 | 0.0% |
| Malaysian | 11 | 0.0% |
| Mexican | 1,641 | 4.8% |
| Mexican American Indian | 6 | 0.0% |
| Northern European | 28 | 0.1% |
| Norwegian | 791 | 2.3% |
| Palestinian | 12 | 0.0% |
| Panamanian | 19 | 0.1% |
| Pennsylvania German | 41 | 0.1% |
| Polish | 1,112 | 3.3% |
| Pueblo | 16 | 0.1% |
| Puerto Rican | 313 | 0.9% |
| Romanian | 8 | 0.0% |
| Russian | 134 | 0.4% |
| Salvadoran | 29 | 0.1% |
| Samoan | 30 | 0.1% |
| Scandinavian | 88 | 0.3% |
| Scotch-Irish | 183 | 0.5% |
| Scottish | 376 | 1.1% |
| Serbian | 20 | 0.1% |
| Sioux | 48 | 0.1% |
| Slavic | 2 | 0.0% |
| Slovak | 31 | 0.1% |
| South American | 119 | 0.4% |
| Spaniard | 7 | 0.0% |
| Spanish American Indian | 11 | 0.0% |
| Sri Lankan | 2 | 0.0% |
| Subsaharan African | 31 | 0.1% |
| Swedish | 915 | 2.7% |
| Swiss | 95 | 0.3% |
| Thai | 130 | 0.4% |
| Ukrainian | 196 | 0.6% |
| Welsh | 108 | 0.3% |
| West Indian | 5 | 0.0% | View All 81 Rows |
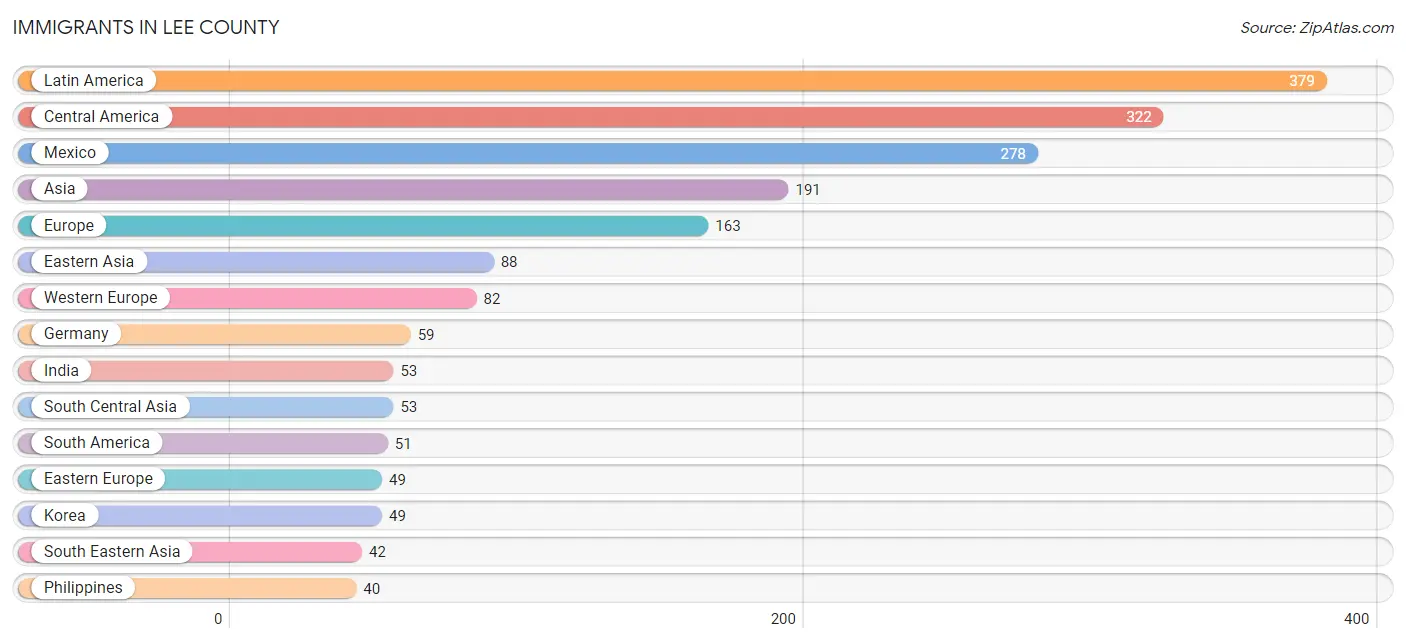
Immigrants in Lee County
The most numerous immigrant groups reported in Lee County came from Latin America (379 | 1.1%), Central America (322 | 0.9%), Mexico (278 | 0.8%), Asia (191 | 0.6%), and Europe (163 | 0.5%), together accounting for 3.9% of all Lee County residents.
| Immigration Origin | # Population | % Population |
| Africa | 9 | 0.0% |
| Argentina | 7 | 0.0% |
| Asia | 191 | 0.6% |
| Australia | 4 | 0.0% |
| Canada | 26 | 0.1% |
| Caribbean | 6 | 0.0% |
| Central America | 322 | 0.9% |
| Chile | 20 | 0.1% |
| China | 13 | 0.0% |
| Colombia | 7 | 0.0% |
| Cuba | 2 | 0.0% |
| Eastern Asia | 88 | 0.3% |
| Eastern Europe | 49 | 0.1% |
| El Salvador | 29 | 0.1% |
| England | 4 | 0.0% |
| Europe | 163 | 0.5% |
| France | 7 | 0.0% |
| Germany | 59 | 0.2% |
| Guatemala | 15 | 0.0% |
| India | 53 | 0.2% |
| Jamaica | 4 | 0.0% |
| Japan | 26 | 0.1% |
| Korea | 49 | 0.1% |
| Latin America | 379 | 1.1% |
| Mexico | 278 | 0.8% |
| Northern Africa | 2 | 0.0% |
| Northern Europe | 20 | 0.1% |
| Oceania | 4 | 0.0% |
| Peru | 17 | 0.1% |
| Philippines | 40 | 0.1% |
| Poland | 24 | 0.1% |
| Russia | 3 | 0.0% |
| Saudi Arabia | 8 | 0.0% |
| South Africa | 7 | 0.0% |
| South America | 51 | 0.2% |
| South Central Asia | 53 | 0.2% |
| South Eastern Asia | 42 | 0.1% |
| Southern Europe | 12 | 0.0% |
| Spain | 7 | 0.0% |
| Switzerland | 16 | 0.1% |
| Ukraine | 4 | 0.0% |
| Vietnam | 2 | 0.0% |
| Western Asia | 8 | 0.0% |
| Western Europe | 82 | 0.2% | View All 44 Rows |
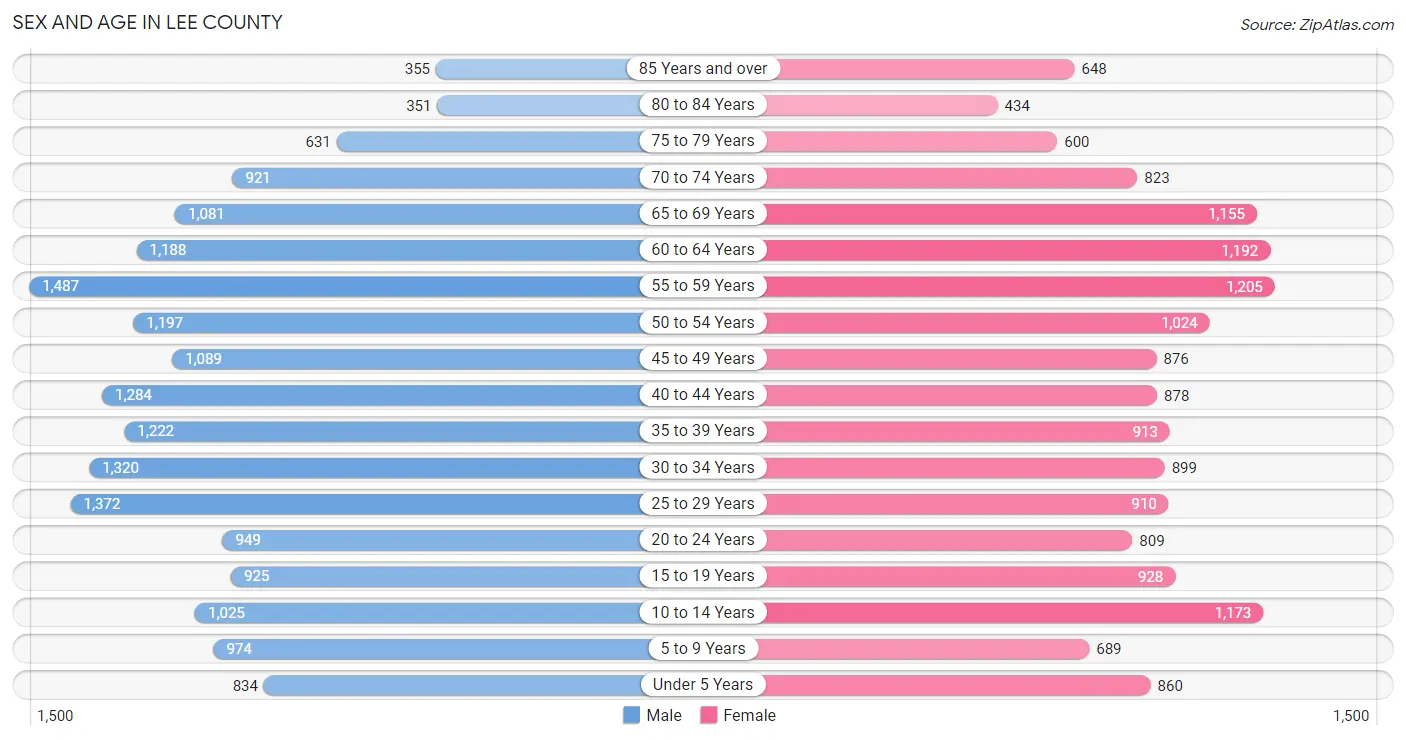
Sex and Age in Lee County
Sex and Age in Lee County
The most populous age groups in Lee County are 55 to 59 Years (1,487 | 8.2%) for men and 55 to 59 Years (1,205 | 7.5%) for women.
| Age Bracket | Male | Female |
| Under 5 Years | 834 (4.6%) | 860 (5.4%) |
| 5 to 9 Years | 974 (5.3%) | 689 (4.3%) |
| 10 to 14 Years | 1,025 (5.6%) | 1,173 (7.3%) |
| 15 to 19 Years | 925 (5.1%) | 928 (5.8%) |
| 20 to 24 Years | 949 (5.2%) | 809 (5.1%) |
| 25 to 29 Years | 1,372 (7.5%) | 910 (5.7%) |
| 30 to 34 Years | 1,320 (7.2%) | 899 (5.6%) |
| 35 to 39 Years | 1,222 (6.7%) | 913 (5.7%) |
| 40 to 44 Years | 1,284 (7.0%) | 878 (5.5%) |
| 45 to 49 Years | 1,089 (6.0%) | 876 (5.5%) |
| 50 to 54 Years | 1,197 (6.6%) | 1,024 (6.4%) |
| 55 to 59 Years | 1,487 (8.2%) | 1,205 (7.5%) |
| 60 to 64 Years | 1,188 (6.5%) | 1,192 (7.4%) |
| 65 to 69 Years | 1,081 (5.9%) | 1,155 (7.2%) |
| 70 to 74 Years | 921 (5.1%) | 823 (5.1%) |
| 75 to 79 Years | 631 (3.5%) | 600 (3.7%) |
| 80 to 84 Years | 351 (1.9%) | 434 (2.7%) |
| 85 Years and over | 355 (1.9%) | 648 (4.1%) |
| Total | 18,205 (100.0%) | 16,016 (100.0%) |
Families and Households in Lee County
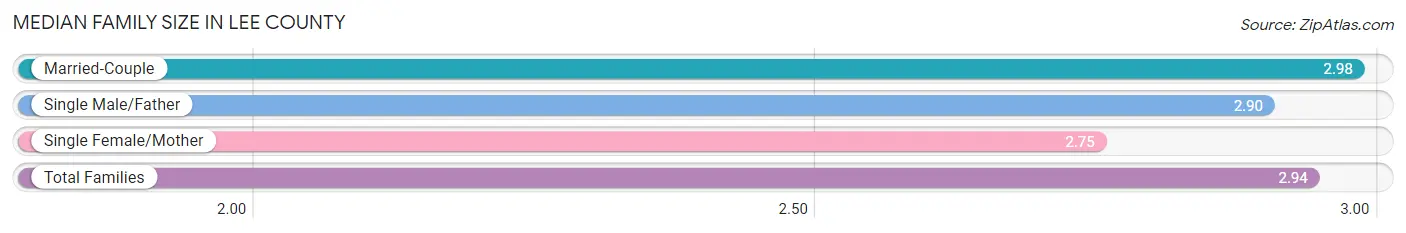
Median Family Size in Lee County
The median family size in Lee County is 2.94 persons per family, with married-couple families (6,191 | 75.3%) accounting for the largest median family size of 2.98 persons per family. On the other hand, single female/mother families (1,461 | 17.8%) represent the smallest median family size with 2.75 persons per family.
| Family Type | # Families | Family Size |
| Married-Couple | 6,191 (75.3%) | 2.98 |
| Single Male/Father | 573 (7.0%) | 2.90 |
| Single Female/Mother | 1,461 (17.8%) | 2.75 |
| Total Families | 8,225 (100.0%) | 2.94 |
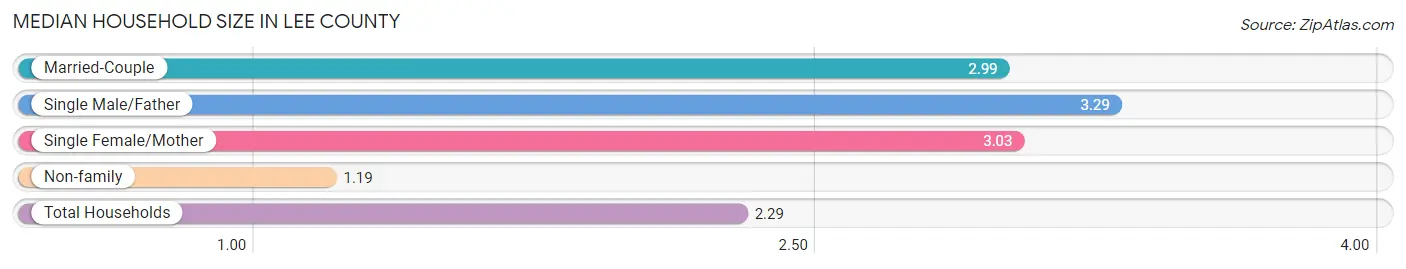
Median Household Size in Lee County
The median household size in Lee County is 2.29 persons per household, with single male/father households (573 | 4.2%) accounting for the largest median household size of 3.29 persons per household. non-family households (5,444 | 39.8%) represent the smallest median household size with 1.19 persons per household.
| Household Type | # Households | Household Size |
| Married-Couple | 6,191 (45.3%) | 2.99 |
| Single Male/Father | 573 (4.2%) | 3.29 |
| Single Female/Mother | 1,461 (10.7%) | 3.03 |
| Non-family | 5,444 (39.8%) | 1.19 |
| Total Households | 13,669 (100.0%) | 2.29 |
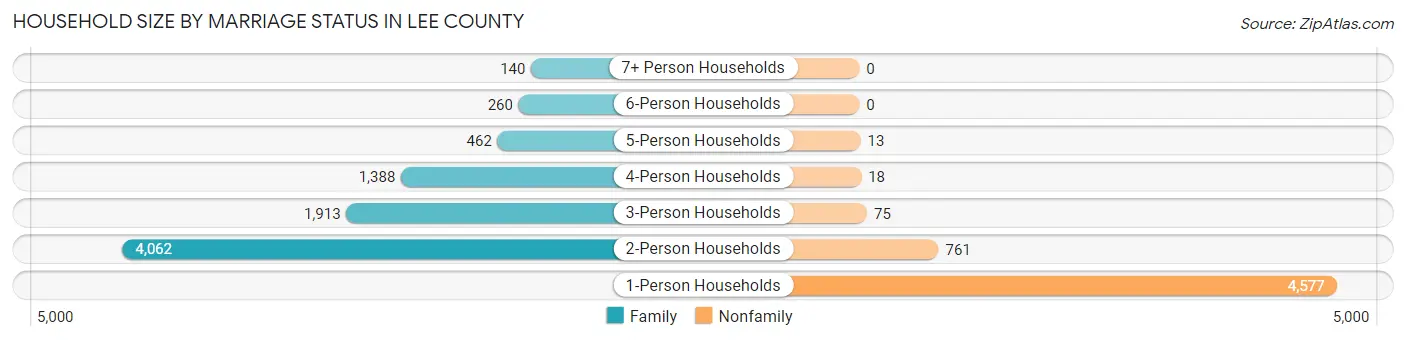
Household Size by Marriage Status in Lee County
Out of a total of 13,669 households in Lee County, 8,225 (60.2%) are family households, while 5,444 (39.8%) are nonfamily households. The most numerous type of family households are 2-person households, comprising 4,062, and the most common type of nonfamily households are 1-person households, comprising 4,577.
| Household Size | Family Households | Nonfamily Households |
| 1-Person Households | - | 4,577 (33.5%) |
| 2-Person Households | 4,062 (29.7%) | 761 (5.6%) |
| 3-Person Households | 1,913 (14.0%) | 75 (0.5%) |
| 4-Person Households | 1,388 (10.2%) | 18 (0.1%) |
| 5-Person Households | 462 (3.4%) | 13 (0.1%) |
| 6-Person Households | 260 (1.9%) | 0 (0.0%) |
| 7+ Person Households | 140 (1.0%) | 0 (0.0%) |
| Total | 8,225 (60.2%) | 5,444 (39.8%) |
Female Fertility in Lee County
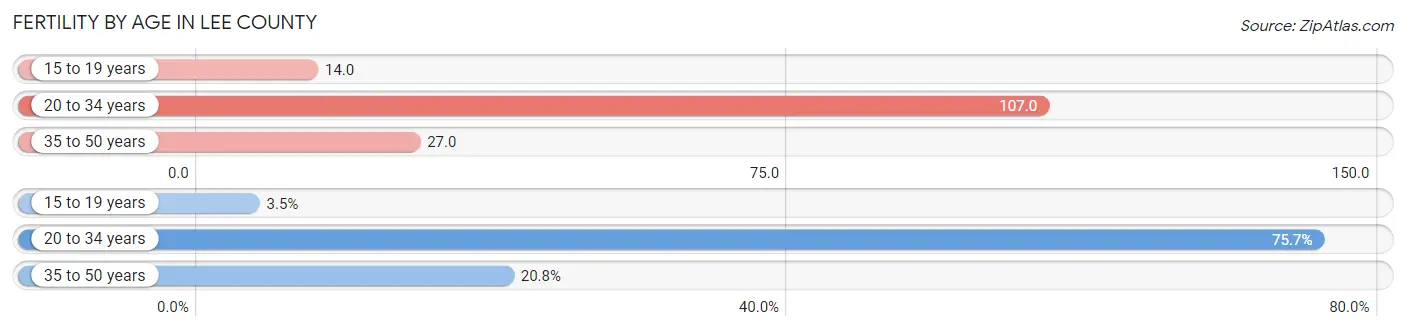
Fertility by Age in Lee County
Average fertility rate in Lee County is 58.0 births per 1,000 women. Women in the age bracket of 20 to 34 years have the highest fertility rate with 107.0 births per 1,000 women. Women in the age bracket of 20 to 34 years acount for 75.7% of all women with births.
| Age Bracket | Women with Births | Births / 1,000 Women |
| 15 to 19 years | 13 (3.5%) | 14.0 |
| 20 to 34 years | 281 (75.7%) | 107.0 |
| 35 to 50 years | 77 (20.7%) | 27.0 |
| Total | 371 (100.0%) | 58.0 |
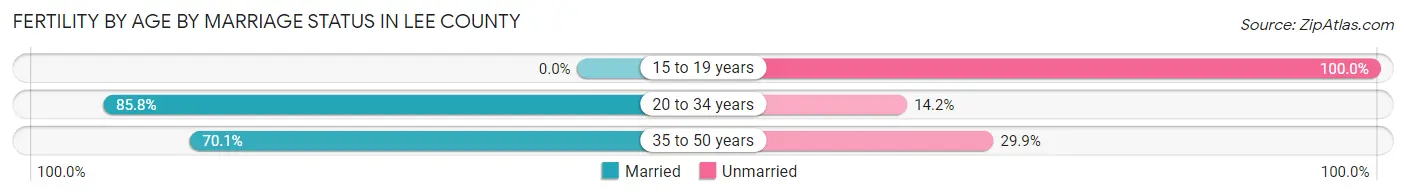
Fertility by Age by Marriage Status in Lee County
79.5% of women with births (371) in Lee County are married. The highest percentage of unmarried women with births falls into 15 to 19 years age bracket with 100.0% of them unmarried at the time of birth, while the lowest percentage of unmarried women with births belong to 20 to 34 years age bracket with 14.2% of them unmarried.
| Age Bracket | Married | Unmarried |
| 15 to 19 years | 0 (0.0%) | 13 (100.0%) |
| 20 to 34 years | 241 (85.8%) | 40 (14.2%) |
| 35 to 50 years | 54 (70.1%) | 23 (29.9%) |
| Total | 295 (79.5%) | 76 (20.5%) |
Fertility by Education in Lee County
Average fertility rate in Lee County is 58.0 births per 1,000 women. Women with the education attainment of bachelor's degree have the highest fertility rate of 103.0 births per 1,000 women, while women with the education attainment of less than high school have the lowest fertility at 28.0 births per 1,000 women. Women with the education attainment of college or associate's degree represent 39.1% of all women with births.

| Educational Attainment | Women with Births | Births / 1,000 Women |
| Less than High School | 26 (7.0%) | 28.0 |
| High School Diploma | 89 (24.0%) | 63.0 |
| College or Associate's Degree | 145 (39.1%) | 54.0 |
| Bachelor's Degree | 90 (24.3%) | 103.0 |
| Graduate Degree | 21 (5.7%) | 43.0 |
| Total | 371 (100.0%) | 58.0 |
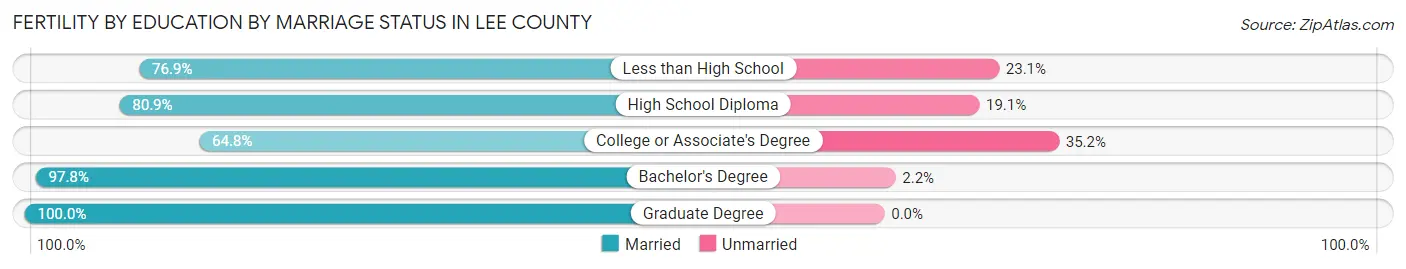
Fertility by Education by Marriage Status in Lee County
20.5% of women with births in Lee County are unmarried. Women with the educational attainment of graduate degree are most likely to be married with 100.0% of them married at childbirth, while women with the educational attainment of college or associate's degree are least likely to be married with 35.2% of them unmarried at childbirth.
| Educational Attainment | Married | Unmarried |
| Less than High School | 20 (76.9%) | 6 (23.1%) |
| High School Diploma | 72 (80.9%) | 17 (19.1%) |
| College or Associate's Degree | 94 (64.8%) | 51 (35.2%) |
| Bachelor's Degree | 88 (97.8%) | 2 (2.2%) |
| Graduate Degree | 21 (100.0%) | 0 (0.0%) |
| Total | 295 (79.5%) | 76 (20.5%) |
Income in Lee County
Income Overview in Lee County
Per Capita Income in Lee County is $33,491, while median incomes of families and households are $84,695 and $64,588 respectively.
| Characteristic | Number | Measure |
| Per Capita Income | 34,221 | $33,491 |
| Median Family Income | 8,225 | $84,695 |
| Mean Family Income | 8,225 | $101,968 |
| Median Household Income | 13,669 | $64,588 |
| Mean Household Income | 13,669 | $82,936 |
| Income Deficit | 8,225 | $10,731 |
| Wage / Income Gap (%) | 34,221 | 36.69% |
| Wage / Income Gap ($) | 34,221 | 63.31¢ per $1 |
| Gini / Inequality Index | 34,221 | 0.44 |
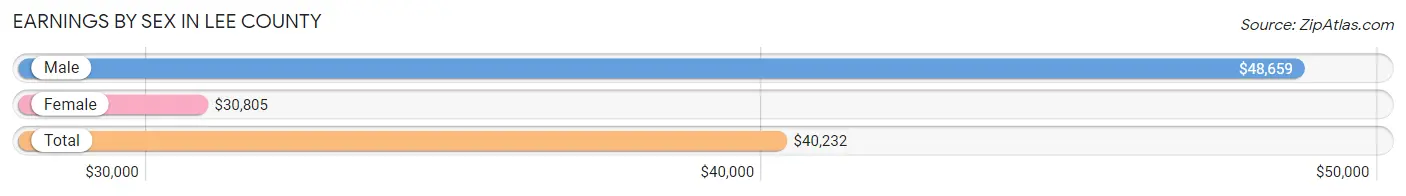
Earnings by Sex in Lee County
Average Earnings in Lee County are $40,232, $48,659 for men and $30,805 for women, a difference of 36.7%.
| Sex | Number | Average Earnings |
| Male | 8,857 (52.8%) | $48,659 |
| Female | 7,928 (47.2%) | $30,805 |
| Total | 16,785 (100.0%) | $40,232 |
Earnings by Sex by Income Bracket in Lee County
The most common earnings brackets in Lee County are $100,000+ for men (1,304 | 14.7%) and $2,499 or less for women (652 | 8.2%).
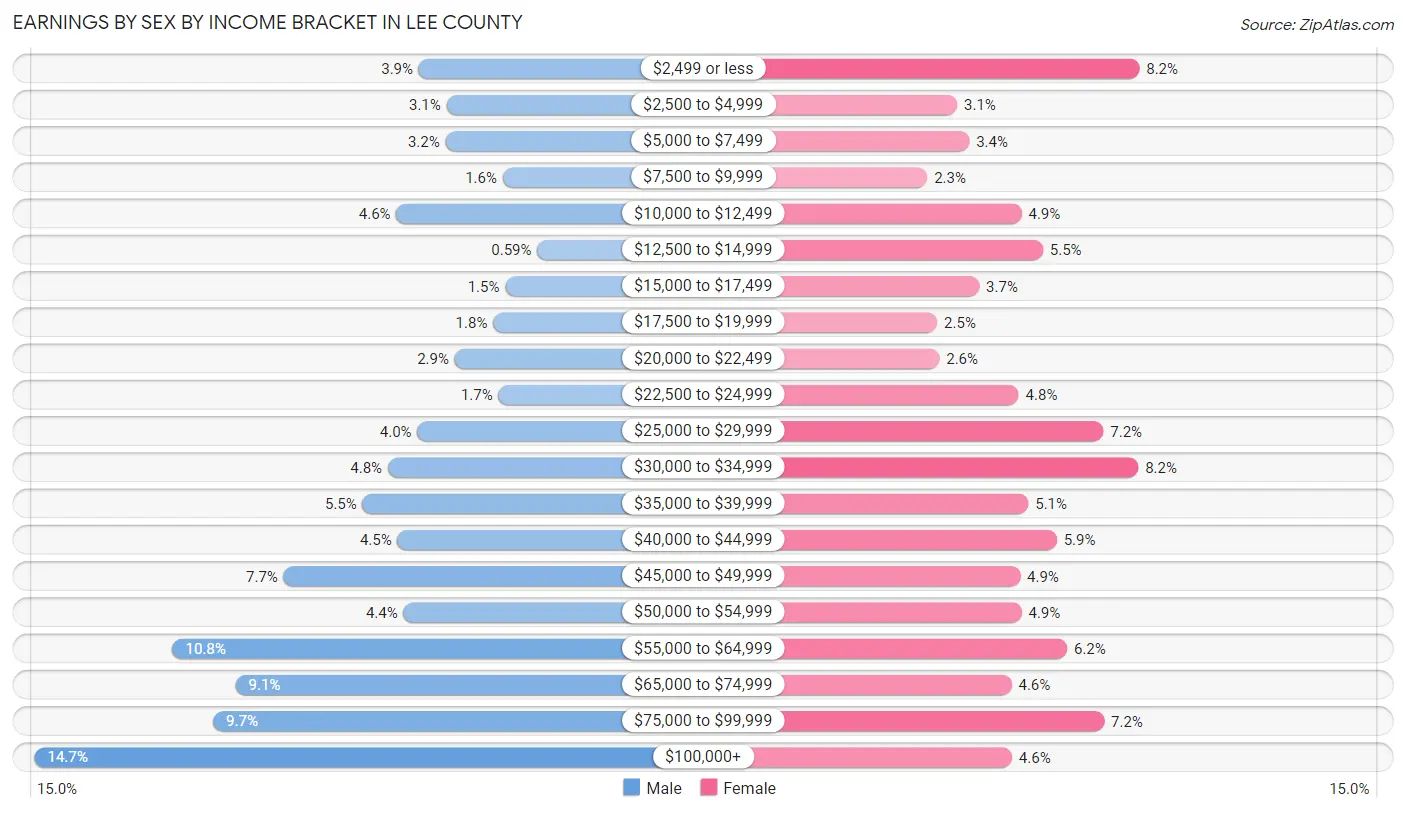
| Income | Male | Female |
| $2,499 or less | 347 (3.9%) | 652 (8.2%) |
| $2,500 to $4,999 | 278 (3.1%) | 246 (3.1%) |
| $5,000 to $7,499 | 281 (3.2%) | 273 (3.4%) |
| $7,500 to $9,999 | 138 (1.6%) | 179 (2.3%) |
| $10,000 to $12,499 | 403 (4.5%) | 389 (4.9%) |
| $12,500 to $14,999 | 52 (0.6%) | 437 (5.5%) |
| $15,000 to $17,499 | 132 (1.5%) | 295 (3.7%) |
| $17,500 to $19,999 | 162 (1.8%) | 201 (2.5%) |
| $20,000 to $22,499 | 258 (2.9%) | 206 (2.6%) |
| $22,500 to $24,999 | 149 (1.7%) | 383 (4.8%) |
| $25,000 to $29,999 | 351 (4.0%) | 572 (7.2%) |
| $30,000 to $34,999 | 424 (4.8%) | 649 (8.2%) |
| $35,000 to $39,999 | 487 (5.5%) | 404 (5.1%) |
| $40,000 to $44,999 | 400 (4.5%) | 468 (5.9%) |
| $45,000 to $49,999 | 684 (7.7%) | 386 (4.9%) |
| $50,000 to $54,999 | 385 (4.3%) | 389 (4.9%) |
| $55,000 to $64,999 | 960 (10.8%) | 491 (6.2%) |
| $65,000 to $74,999 | 803 (9.1%) | 367 (4.6%) |
| $75,000 to $99,999 | 859 (9.7%) | 573 (7.2%) |
| $100,000+ | 1,304 (14.7%) | 368 (4.6%) |
| Total | 8,857 (100.0%) | 7,928 (100.0%) |
Earnings by Sex by Educational Attainment in Lee County
Average earnings in Lee County are $55,321 for men and $35,152 for women, a difference of 36.5%. Men with an educational attainment of graduate degree enjoy the highest average annual earnings of $118,413, while those with less than high school education earn the least with $25,595. Women with an educational attainment of graduate degree earn the most with the average annual earnings of $77,500, while those with less than high school education have the smallest earnings of $7,308.
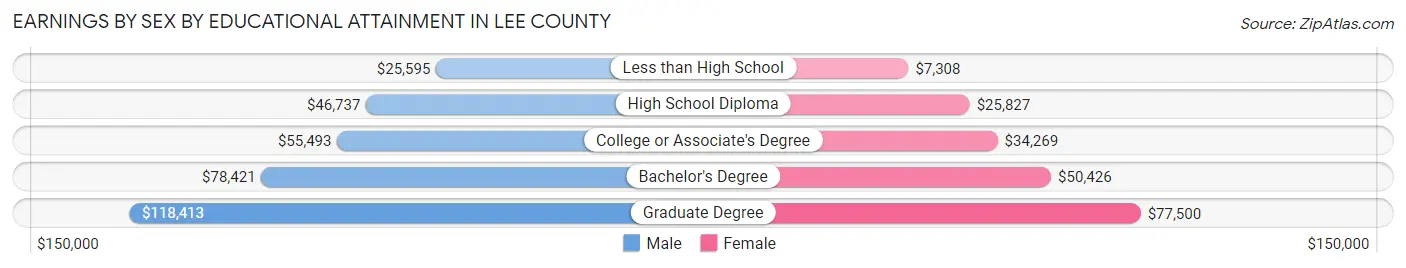
| Educational Attainment | Male Income | Female Income |
| Less than High School | $25,595 | $7,308 |
| High School Diploma | $46,737 | $25,827 |
| College or Associate's Degree | $55,493 | $34,269 |
| Bachelor's Degree | $78,421 | $50,426 |
| Graduate Degree | $118,413 | $77,500 |
| Total | $55,321 | $35,152 |
Family Income in Lee County
Family Income Brackets in Lee County
According to the Lee County family income data, there are 1,834 families falling into the $100,000 to $149,999 income range, which is the most common income bracket and makes up 22.3% of all families. Conversely, the $10,000 to $14,999 income bracket is the least frequent group with only 99 families (1.2%) belonging to this category.
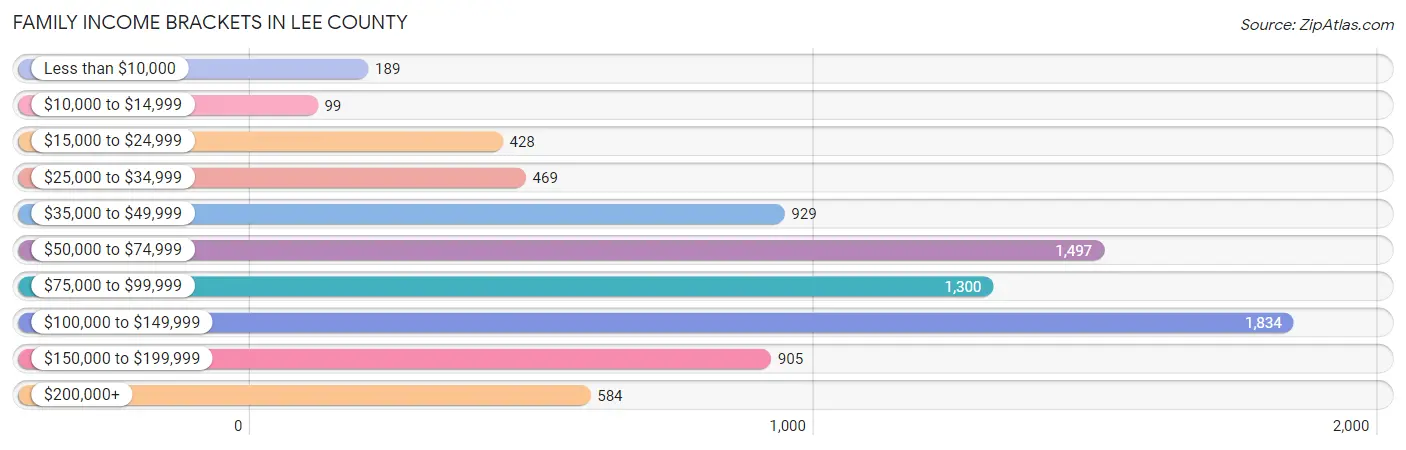
| Income Bracket | # Families | % Families |
| Less than $10,000 | 189 | 2.3% |
| $10,000 to $14,999 | 99 | 1.2% |
| $15,000 to $24,999 | 428 | 5.2% |
| $25,000 to $34,999 | 469 | 5.7% |
| $35,000 to $49,999 | 929 | 11.3% |
| $50,000 to $74,999 | 1,497 | 18.2% |
| $75,000 to $99,999 | 1,300 | 15.8% |
| $100,000 to $149,999 | 1,834 | 22.3% |
| $150,000 to $199,999 | 905 | 11.0% |
| $200,000+ | 584 | 7.1% |
Family Income by Famaliy Size in Lee County
4-person families (1,413 | 17.2%) account for the highest median family income in Lee County with $112,131 per family, while 2-person families (4,258 | 51.8%) have the highest median income of $36,160 per family member.
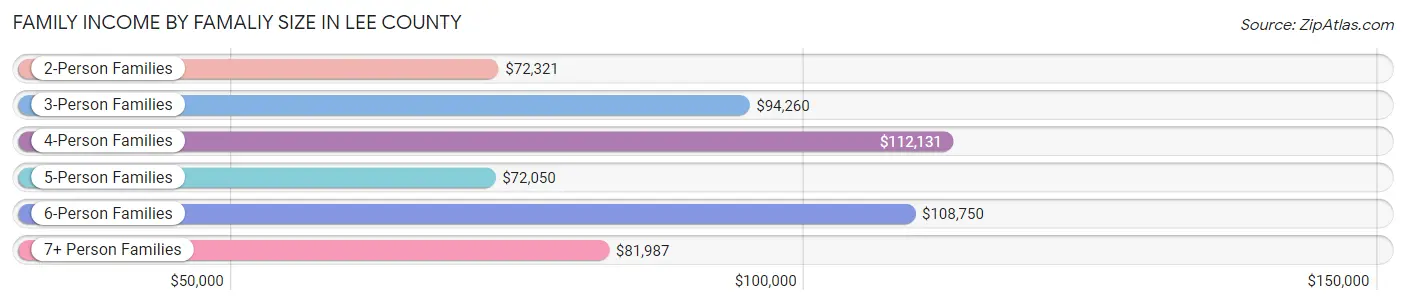
| Income Bracket | # Families | Median Income |
| 2-Person Families | 4,258 (51.8%) | $72,321 |
| 3-Person Families | 1,869 (22.7%) | $94,260 |
| 4-Person Families | 1,413 (17.2%) | $112,131 |
| 5-Person Families | 405 (4.9%) | $72,050 |
| 6-Person Families | 140 (1.7%) | $108,750 |
| 7+ Person Families | 140 (1.7%) | $81,987 |
| Total | 8,225 (100.0%) | $84,695 |
Family Income by Number of Earners in Lee County
The median family income in Lee County is $84,695, with families comprising 3+ earners (969) having the highest median family income of $138,594, while families with no earners (1,511) have the lowest median family income of $52,750, accounting for 11.8% and 18.4% of families, respectively.
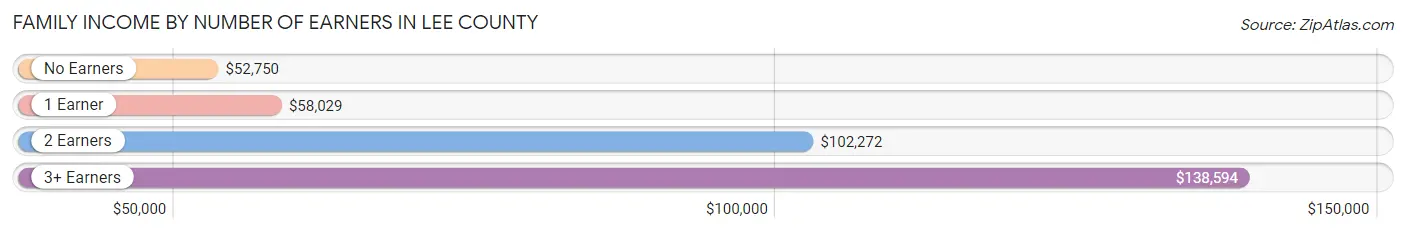
| Number of Earners | # Families | Median Income |
| No Earners | 1,511 (18.4%) | $52,750 |
| 1 Earner | 2,270 (27.6%) | $58,029 |
| 2 Earners | 3,475 (42.2%) | $102,272 |
| 3+ Earners | 969 (11.8%) | $138,594 |
| Total | 8,225 (100.0%) | $84,695 |
Household Income in Lee County
Household Income Brackets in Lee County
With 2,652 households falling in the category, the $50,000 to $74,999 income range is the most frequent in Lee County, accounting for 19.4% of all households. In contrast, only 683 households (5.0%) fall into the less than $10,000 income bracket, making it the least populous group.
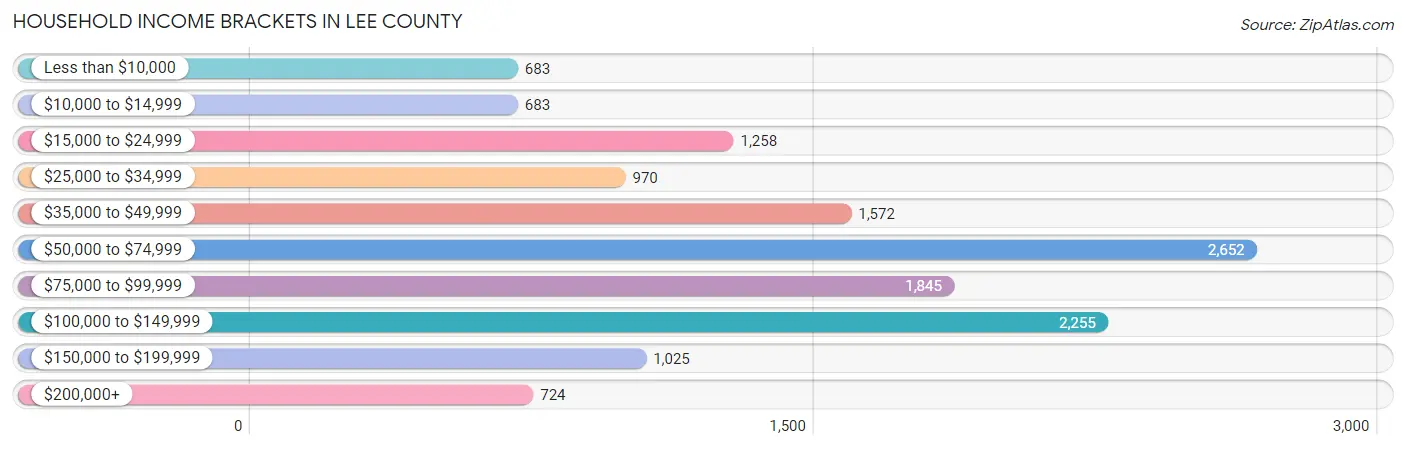
| Income Bracket | # Households | % Households |
| Less than $10,000 | 683 | 5.0% |
| $10,000 to $14,999 | 683 | 5.0% |
| $15,000 to $24,999 | 1,258 | 9.2% |
| $25,000 to $34,999 | 970 | 7.1% |
| $35,000 to $49,999 | 1,572 | 11.5% |
| $50,000 to $74,999 | 2,652 | 19.4% |
| $75,000 to $99,999 | 1,845 | 13.5% |
| $100,000 to $149,999 | 2,255 | 16.5% |
| $150,000 to $199,999 | 1,025 | 7.5% |
| $200,000+ | 724 | 5.3% |
Household Income by Householder Age in Lee County
The median household income in Lee County is $64,588, with the highest median household income of $78,529 found in the 25 to 44 years age bracket for the primary householder. A total of 3,660 households (26.8%) fall into this category. Meanwhile, the 65+ years age bracket for the primary householder has the lowest median household income of $46,776, with 4,433 households (32.4%) in this group.
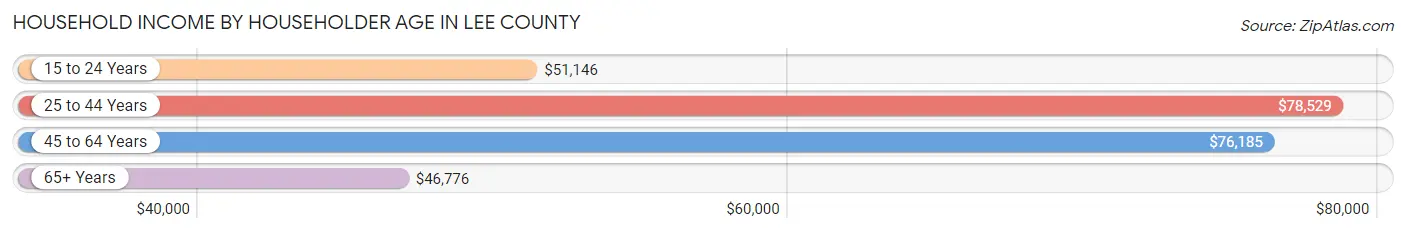
| Income Bracket | # Households | Median Income |
| 15 to 24 Years | 455 (3.3%) | $51,146 |
| 25 to 44 Years | 3,660 (26.8%) | $78,529 |
| 45 to 64 Years | 5,121 (37.5%) | $76,185 |
| 65+ Years | 4,433 (32.4%) | $46,776 |
| Total | 13,669 (100.0%) | $64,588 |
Poverty in Lee County
Income Below Poverty by Sex and Age in Lee County
With 11.4% poverty level for males and 13.6% for females among the residents of Lee County, 5 year old males and 75 year old and over females are the most vulnerable to poverty, with 32 males (32.3%) and 339 females (22.1%) in their respective age groups living below the poverty level.
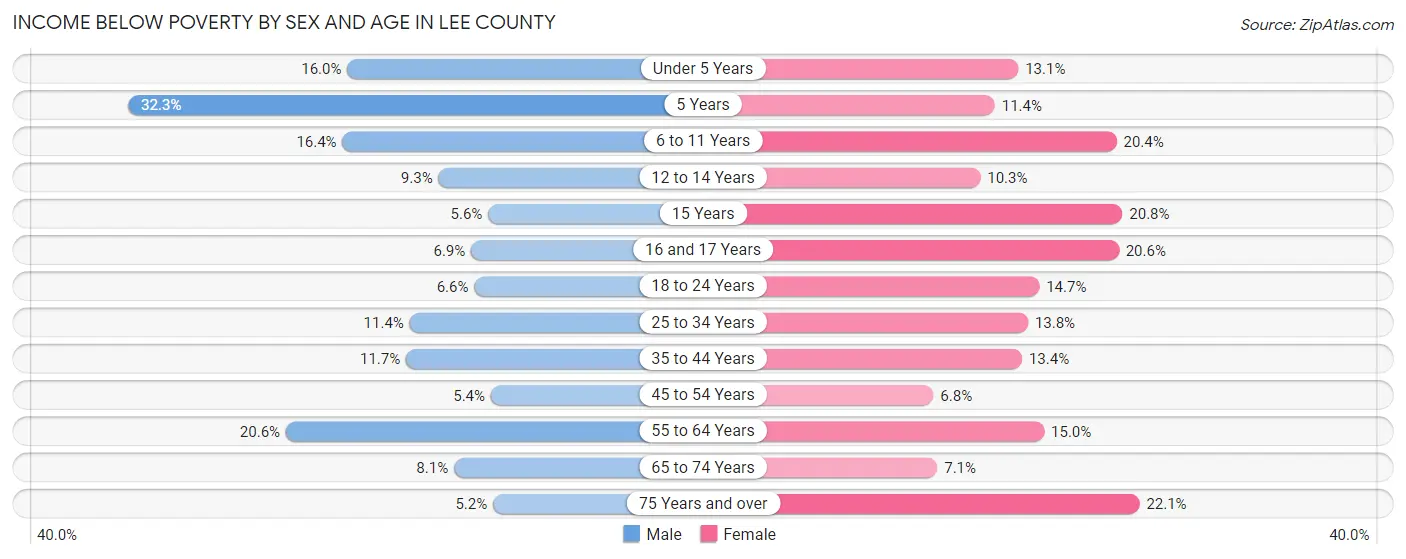
| Age Bracket | Male | Female |
| Under 5 Years | 133 (16.0%) | 112 (13.1%) |
| 5 Years | 32 (32.3%) | 20 (11.4%) |
| 6 to 11 Years | 203 (16.4%) | 202 (20.4%) |
| 12 to 14 Years | 58 (9.3%) | 69 (10.3%) |
| 15 Years | 11 (5.6%) | 35 (20.8%) |
| 16 and 17 Years | 28 (6.9%) | 88 (20.6%) |
| 18 to 24 Years | 76 (6.6%) | 161 (14.7%) |
| 25 to 34 Years | 238 (11.4%) | 248 (13.8%) |
| 35 to 44 Years | 225 (11.7%) | 239 (13.4%) |
| 45 to 54 Years | 104 (5.4%) | 129 (6.8%) |
| 55 to 64 Years | 488 (20.6%) | 352 (15.0%) |
| 65 to 74 Years | 142 (8.1%) | 139 (7.1%) |
| 75 Years and over | 60 (5.2%) | 339 (22.1%) |
| Total | 1,798 (11.4%) | 2,133 (13.6%) |
Income Above Poverty by Sex and Age in Lee County
According to the poverty statistics in Lee County, males aged 75 years and over and females aged 45 to 54 years are the age groups that are most secure financially, with 94.8% of males and 93.2% of females in these age groups living above the poverty line.
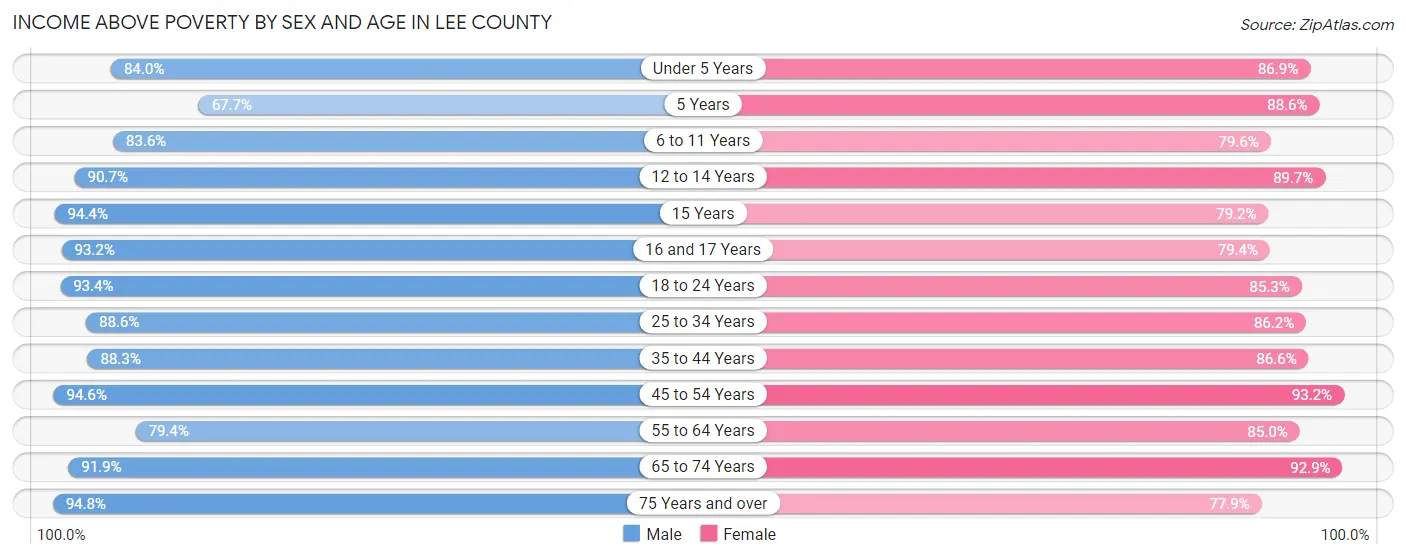
| Age Bracket | Male | Female |
| Under 5 Years | 696 (84.0%) | 743 (86.9%) |
| 5 Years | 67 (67.7%) | 156 (88.6%) |
| 6 to 11 Years | 1,035 (83.6%) | 788 (79.6%) |
| 12 to 14 Years | 568 (90.7%) | 602 (89.7%) |
| 15 Years | 186 (94.4%) | 133 (79.2%) |
| 16 and 17 Years | 381 (93.1%) | 340 (79.4%) |
| 18 to 24 Years | 1,073 (93.4%) | 937 (85.3%) |
| 25 to 34 Years | 1,847 (88.6%) | 1,547 (86.2%) |
| 35 to 44 Years | 1,701 (88.3%) | 1,547 (86.6%) |
| 45 to 54 Years | 1,828 (94.6%) | 1,767 (93.2%) |
| 55 to 64 Years | 1,881 (79.4%) | 1,992 (85.0%) |
| 65 to 74 Years | 1,607 (91.9%) | 1,822 (92.9%) |
| 75 Years and over | 1,089 (94.8%) | 1,195 (77.9%) |
| Total | 13,959 (88.6%) | 13,569 (86.4%) |
Income Below Poverty Among Married-Couple Families in Lee County
The poverty statistics for married-couple families in Lee County show that 2.5% or 152 of the total 6,191 families live below the poverty line. Families with 5 or more children have the highest poverty rate of 63.3%, comprising of 19 families. On the other hand, families with no children have the lowest poverty rate of 1.9%, which includes 79 families.
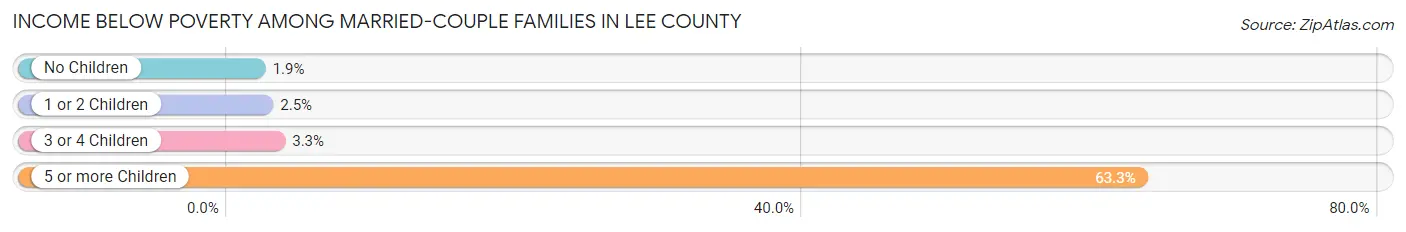
| Children | Above Poverty | Below Poverty |
| No Children | 4,011 (98.1%) | 79 (1.9%) |
| 1 or 2 Children | 1,664 (97.5%) | 42 (2.5%) |
| 3 or 4 Children | 353 (96.7%) | 12 (3.3%) |
| 5 or more Children | 11 (36.7%) | 19 (63.3%) |
| Total | 6,039 (97.5%) | 152 (2.5%) |
Income Below Poverty Among Single-Parent Households in Lee County
According to the poverty data in Lee County, 21.1% or 121 single-father households and 21.8% or 318 single-mother households are living below the poverty line. Among single-father households, those with 1 or 2 children have the highest poverty rate, with 100 households (33.9%) experiencing poverty. Likewise, among single-mother households, those with 3 or 4 children have the highest poverty rate, with 184 households (82.5%) falling below the poverty line.
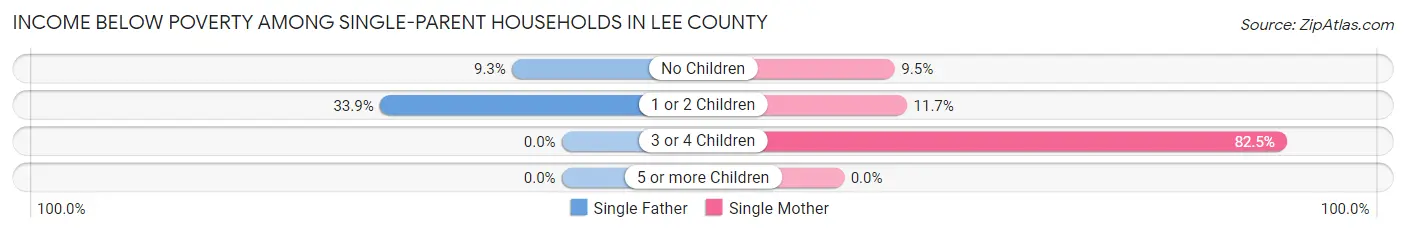
| Children | Single Father | Single Mother |
| No Children | 21 (9.3%) | 46 (9.5%) |
| 1 or 2 Children | 100 (33.9%) | 88 (11.7%) |
| 3 or 4 Children | 0 (0.0%) | 184 (82.5%) |
| 5 or more Children | 0 (0.0%) | 0 (0.0%) |
| Total | 121 (21.1%) | 318 (21.8%) |
Income Below Poverty Among Married-Couple vs Single-Parent Households in Lee County
The poverty data for Lee County shows that 152 of the married-couple family households (2.5%) and 439 of the single-parent households (21.6%) are living below the poverty level. Within the married-couple family households, those with 5 or more children have the highest poverty rate, with 19 households (63.3%) falling below the poverty line. Among the single-parent households, those with 3 or 4 children have the highest poverty rate, with 184 household (66.9%) living below poverty.
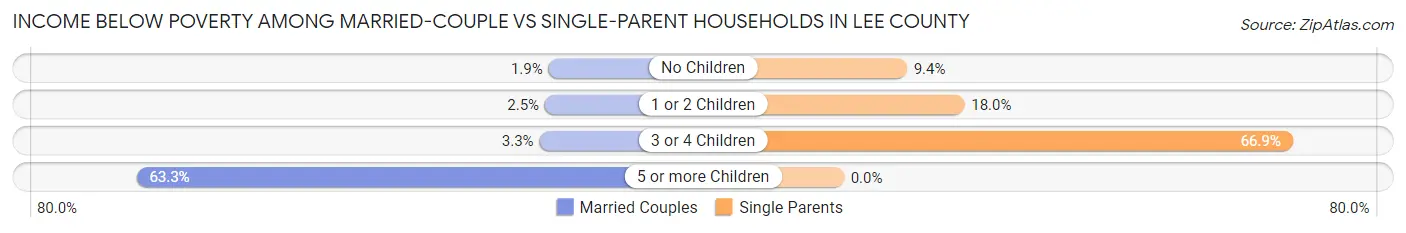
| Children | Married-Couple Families | Single-Parent Households |
| No Children | 79 (1.9%) | 67 (9.4%) |
| 1 or 2 Children | 42 (2.5%) | 188 (18.0%) |
| 3 or 4 Children | 12 (3.3%) | 184 (66.9%) |
| 5 or more Children | 19 (63.3%) | 0 (0.0%) |
| Total | 152 (2.5%) | 439 (21.6%) |
Employment Characteristics in Lee County
Employment by Class of Employer in Lee County
Among the 15,132 employed individuals in Lee County, private company employees (10,048 | 66.4%), local government employees (1,429 | 9.4%), and not-for-profit organizations (1,377 | 9.1%) make up the most common classes of employment.
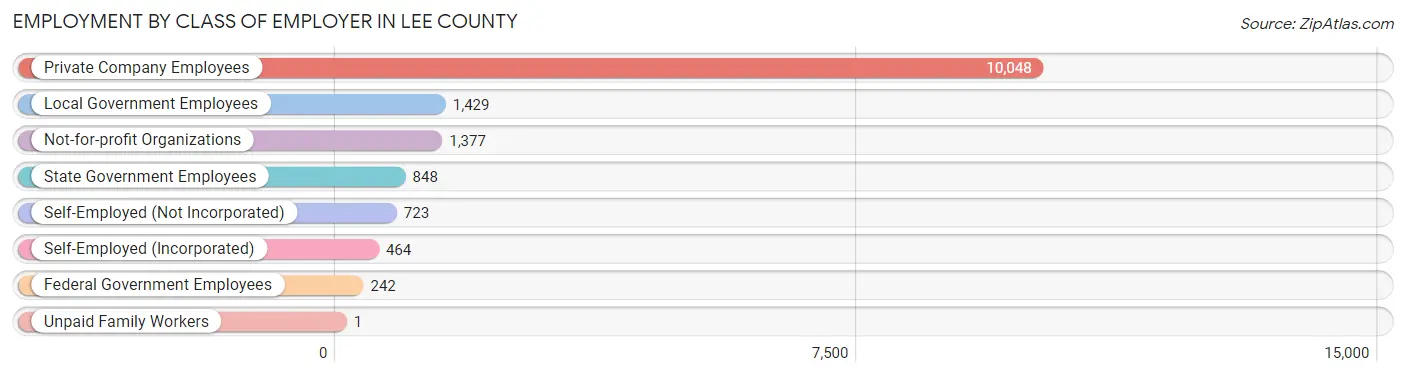
| Employer Class | # Employees | % Employees |
| Private Company Employees | 10,048 | 66.4% |
| Self-Employed (Incorporated) | 464 | 3.1% |
| Self-Employed (Not Incorporated) | 723 | 4.8% |
| Not-for-profit Organizations | 1,377 | 9.1% |
| Local Government Employees | 1,429 | 9.4% |
| State Government Employees | 848 | 5.6% |
| Federal Government Employees | 242 | 1.6% |
| Unpaid Family Workers | 1 | 0.0% |
| Total | 15,132 | 100.0% |
Employment Status by Age in Lee County
According to the labor force statistics for Lee County, out of the total population over 16 years of age (28,296), 56.0% or 15,846 individuals are in the labor force, with 3.5% or 555 of them unemployed. The age group with the highest labor force participation rate is 20 to 24 years, with 81.6% or 1,435 individuals in the labor force. Within the labor force, the 20 to 24 years age range has the highest percentage of unemployed individuals, with 8.1% or 116 of them being unemployed.
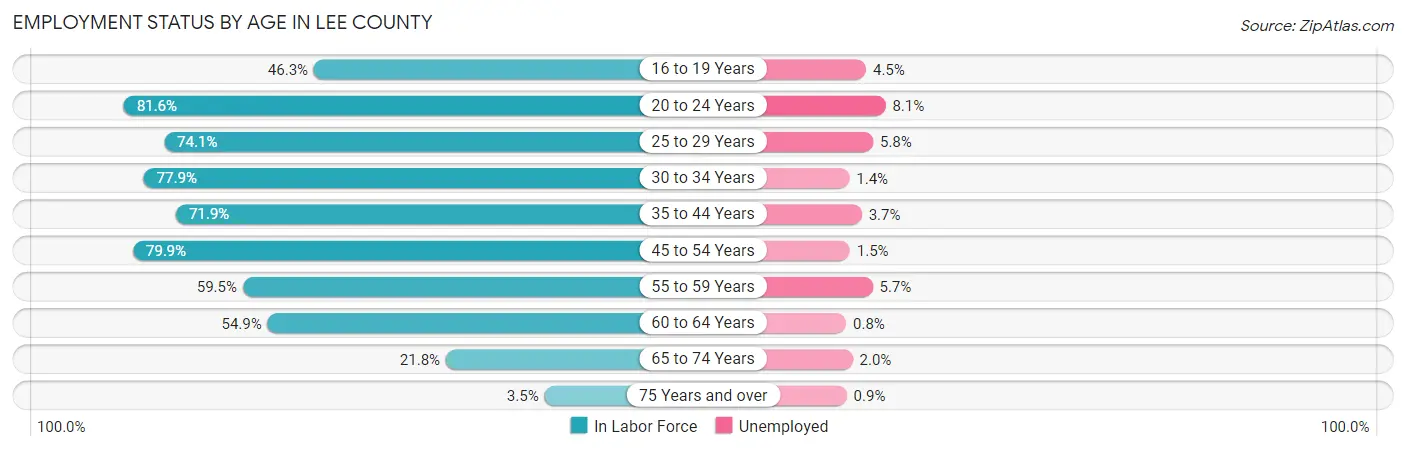
| Age Bracket | In Labor Force | Unemployed |
| 16 to 19 Years | 687 (46.3%) | 31 (4.5%) |
| 20 to 24 Years | 1,435 (81.6%) | 116 (8.1%) |
| 25 to 29 Years | 1,691 (74.1%) | 98 (5.8%) |
| 30 to 34 Years | 1,729 (77.9%) | 24 (1.4%) |
| 35 to 44 Years | 3,090 (71.9%) | 114 (3.7%) |
| 45 to 54 Years | 3,345 (79.9%) | 50 (1.5%) |
| 55 to 59 Years | 1,602 (59.5%) | 91 (5.7%) |
| 60 to 64 Years | 1,307 (54.9%) | 10 (0.8%) |
| 65 to 74 Years | 868 (21.8%) | 17 (2.0%) |
| 75 Years and over | 106 (3.5%) | 1 (0.9%) |
| Total | 15,846 (56.0%) | 555 (3.5%) |
Employment Status by Educational Attainment in Lee County
According to labor force statistics for Lee County, 70.7% of individuals (12,766) out of the total population between 25 and 64 years of age (18,056) are in the labor force, with 3.0% or 383 of them being unemployed. The group with the highest labor force participation rate are those with the educational attainment of bachelor's degree or higher, with 86.6% or 3,109 individuals in the labor force. Within the labor force, individuals with less than high school education have the highest percentage of unemployment, with 13.2% or 92 of them being unemployed.
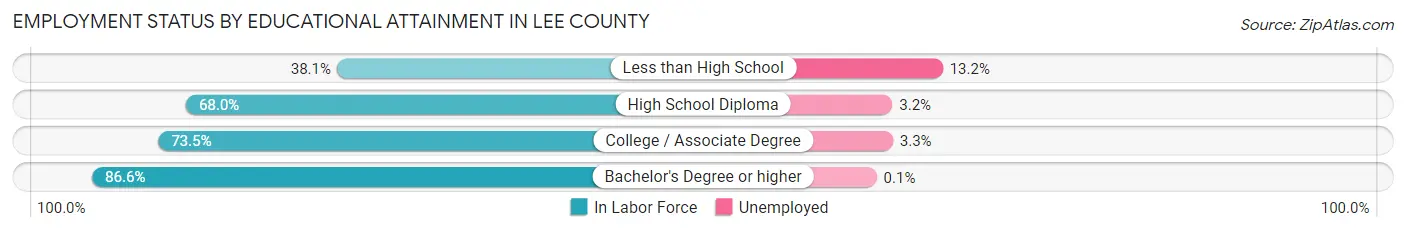
| Educational Attainment | In Labor Force | Unemployed |
| Less than High School | 696 (38.1%) | 241 (13.2%) |
| High School Diploma | 4,126 (68.0%) | 194 (3.2%) |
| College / Associate Degree | 4,830 (73.5%) | 217 (3.3%) |
| Bachelor's Degree or higher | 3,109 (86.6%) | 4 (0.1%) |
| Total | 12,766 (70.7%) | 542 (3.0%) |
Employment Occupations by Sex in Lee County
Management, Business, Science and Arts Occupations
The most common Management, Business, Science and Arts occupations in Lee County are Management (1,514 | 9.9%), Community & Social Service (1,406 | 9.2%), Health Diagnosing & Treating (1,052 | 6.9%), Education Instruction & Library (830 | 5.4%), and Health Technologists (705 | 4.6%).
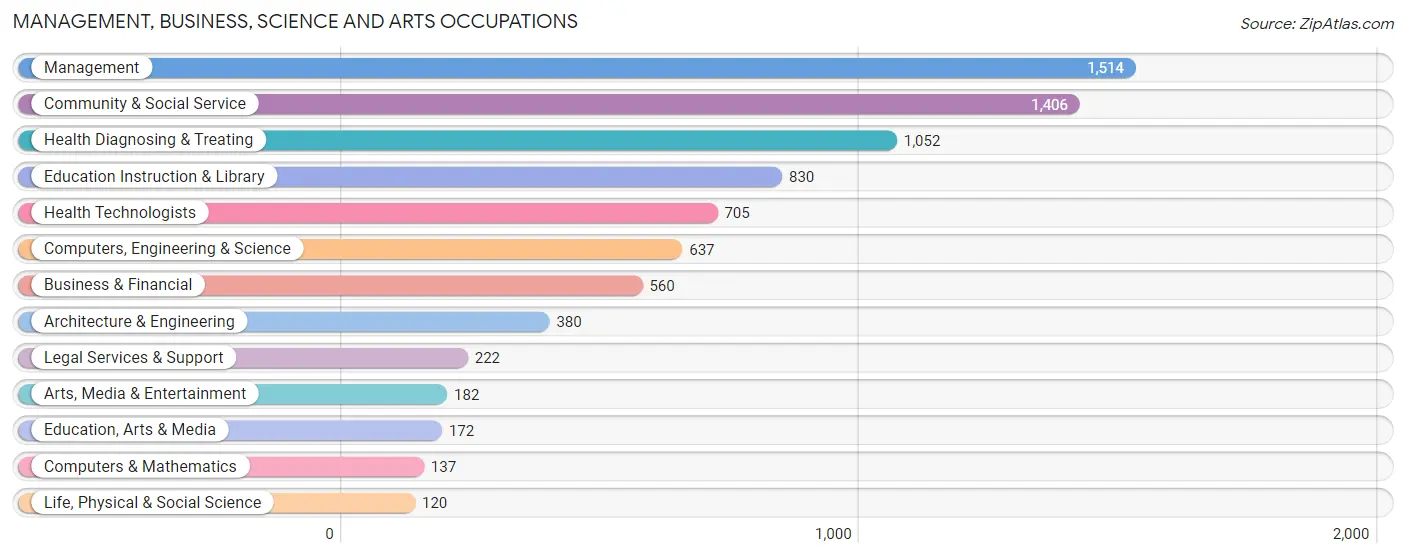
Management, Business, Science and Arts Occupations by Sex
Within the Management, Business, Science and Arts occupations in Lee County, the most male-oriented occupations are Computers & Mathematics (80.3%), Computers, Engineering & Science (69.2%), and Architecture & Engineering (67.1%), while the most female-oriented occupations are Arts, Media & Entertainment (81.3%), Education Instruction & Library (78.3%), and Health Diagnosing & Treating (72.3%).
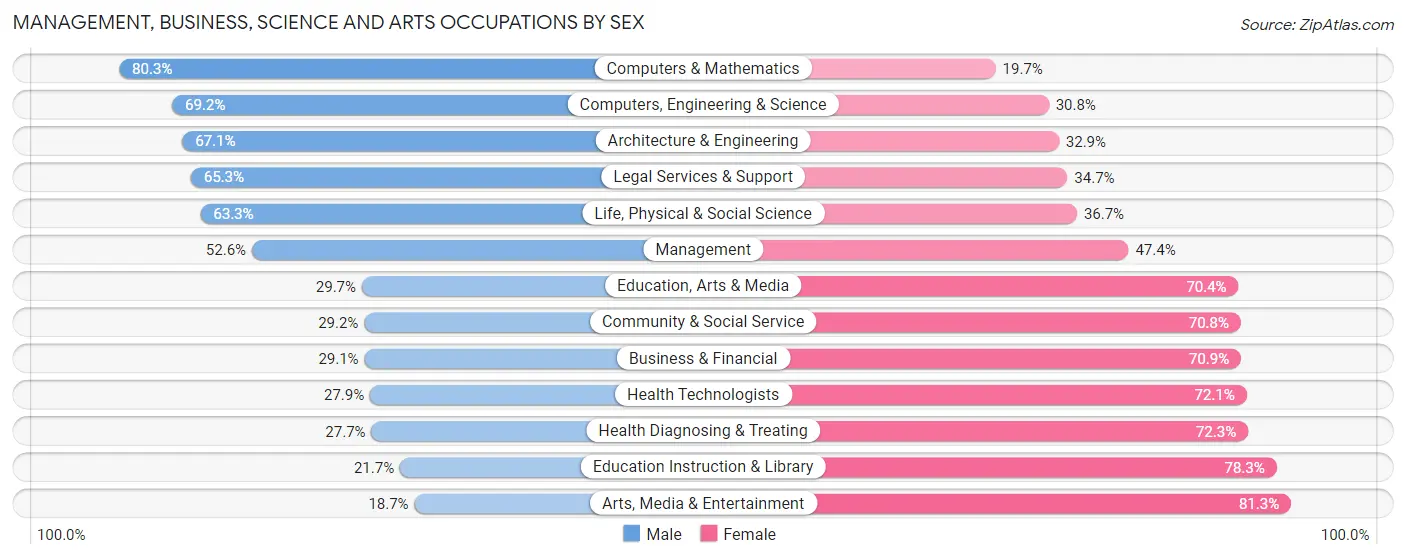
| Occupation | Male | Female |
| Management | 796 (52.6%) | 718 (47.4%) |
| Business & Financial | 163 (29.1%) | 397 (70.9%) |
| Computers, Engineering & Science | 441 (69.2%) | 196 (30.8%) |
| Computers & Mathematics | 110 (80.3%) | 27 (19.7%) |
| Architecture & Engineering | 255 (67.1%) | 125 (32.9%) |
| Life, Physical & Social Science | 76 (63.3%) | 44 (36.7%) |
| Community & Social Service | 410 (29.2%) | 996 (70.8%) |
| Education, Arts & Media | 51 (29.6%) | 121 (70.4%) |
| Legal Services & Support | 145 (65.3%) | 77 (34.7%) |
| Education Instruction & Library | 180 (21.7%) | 650 (78.3%) |
| Arts, Media & Entertainment | 34 (18.7%) | 148 (81.3%) |
| Health Diagnosing & Treating | 291 (27.7%) | 761 (72.3%) |
| Health Technologists | 197 (27.9%) | 508 (72.1%) |
| Total (Category) | 2,101 (40.6%) | 3,068 (59.4%) |
| Total (Overall) | 8,089 (52.9%) | 7,214 (47.1%) |
Services Occupations
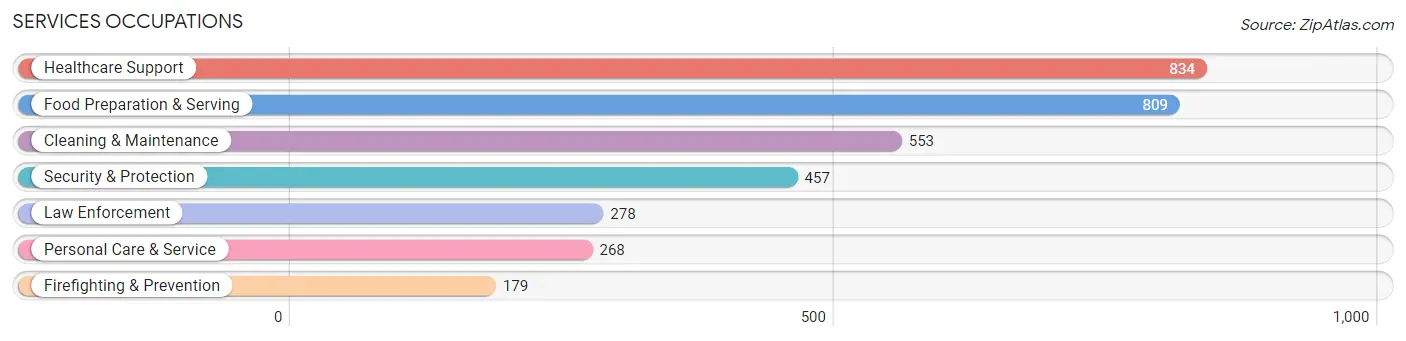
The most common Services occupations in Lee County are Healthcare Support (834 | 5.4%), Food Preparation & Serving (809 | 5.3%), Cleaning & Maintenance (553 | 3.6%), Security & Protection (457 | 3.0%), and Law Enforcement (278 | 1.8%).
Services Occupations by Sex
Within the Services occupations in Lee County, the most male-oriented occupations are Law Enforcement (98.9%), Security & Protection (92.3%), and Firefighting & Prevention (82.1%), while the most female-oriented occupations are Healthcare Support (87.9%), Personal Care & Service (87.7%), and Food Preparation & Serving (70.6%).
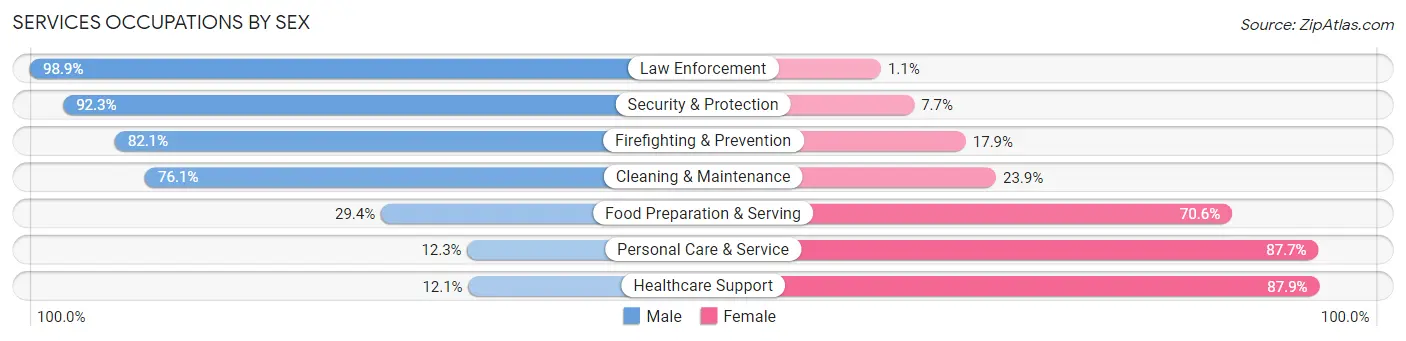
| Occupation | Male | Female |
| Healthcare Support | 101 (12.1%) | 733 (87.9%) |
| Security & Protection | 422 (92.3%) | 35 (7.7%) |
| Firefighting & Prevention | 147 (82.1%) | 32 (17.9%) |
| Law Enforcement | 275 (98.9%) | 3 (1.1%) |
| Food Preparation & Serving | 238 (29.4%) | 571 (70.6%) |
| Cleaning & Maintenance | 421 (76.1%) | 132 (23.9%) |
| Personal Care & Service | 33 (12.3%) | 235 (87.7%) |
| Total (Category) | 1,215 (41.6%) | 1,706 (58.4%) |
| Total (Overall) | 8,089 (52.9%) | 7,214 (47.1%) |
Sales and Office Occupations
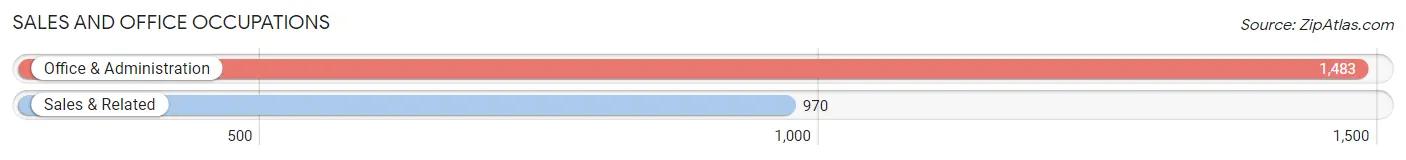
The most common Sales and Office occupations in Lee County are Office & Administration (1,483 | 9.7%), and Sales & Related (970 | 6.3%).
Sales and Office Occupations by Sex
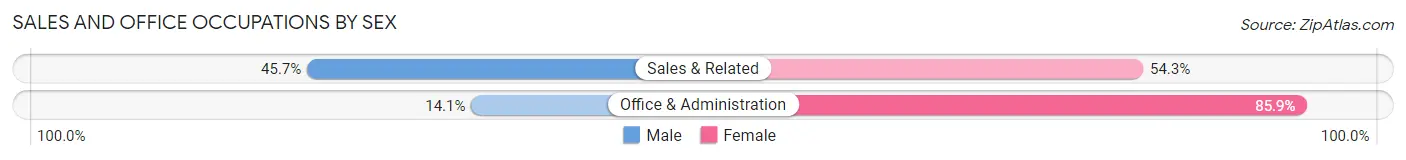
| Occupation | Male | Female |
| Sales & Related | 443 (45.7%) | 527 (54.3%) |
| Office & Administration | 209 (14.1%) | 1,274 (85.9%) |
| Total (Category) | 652 (26.6%) | 1,801 (73.4%) |
| Total (Overall) | 8,089 (52.9%) | 7,214 (47.1%) |
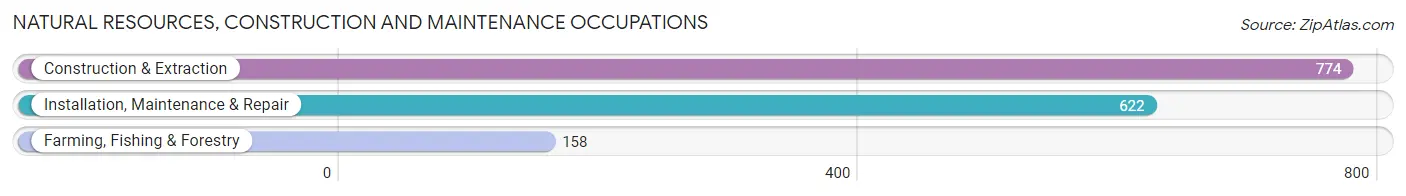
Natural Resources, Construction and Maintenance Occupations
The most common Natural Resources, Construction and Maintenance occupations in Lee County are Construction & Extraction (774 | 5.1%), Installation, Maintenance & Repair (622 | 4.1%), and Farming, Fishing & Forestry (158 | 1.0%).
Natural Resources, Construction and Maintenance Occupations by Sex
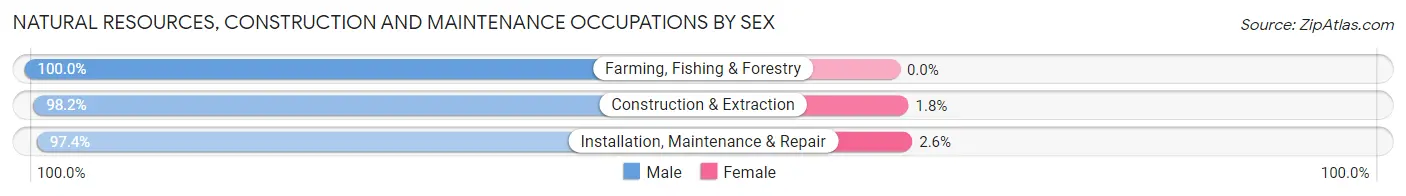
| Occupation | Male | Female |
| Farming, Fishing & Forestry | 158 (100.0%) | 0 (0.0%) |
| Construction & Extraction | 760 (98.2%) | 14 (1.8%) |
| Installation, Maintenance & Repair | 606 (97.4%) | 16 (2.6%) |
| Total (Category) | 1,524 (98.1%) | 30 (1.9%) |
| Total (Overall) | 8,089 (52.9%) | 7,214 (47.1%) |
Production, Transportation and Moving Occupations
The most common Production, Transportation and Moving occupations in Lee County are Production (1,510 | 9.9%), Material Moving (905 | 5.9%), and Transportation (791 | 5.2%).
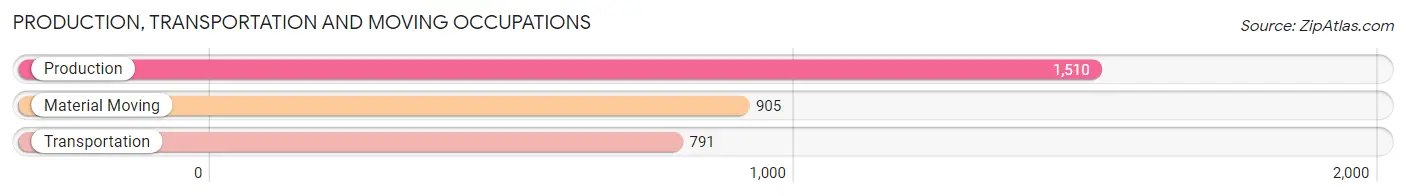
Production, Transportation and Moving Occupations by Sex
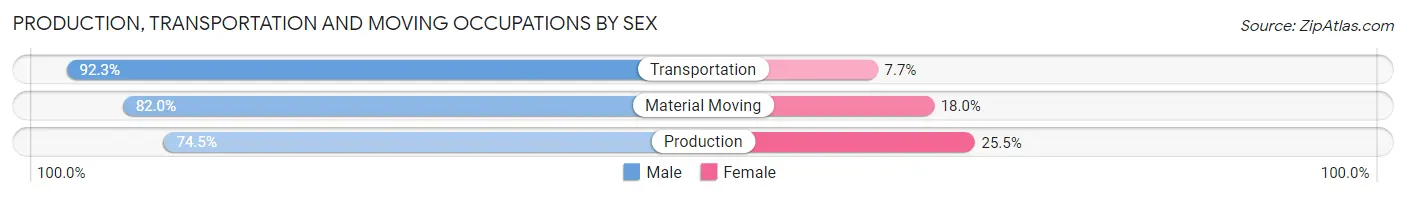
| Occupation | Male | Female |
| Production | 1,125 (74.5%) | 385 (25.5%) |
| Transportation | 730 (92.3%) | 61 (7.7%) |
| Material Moving | 742 (82.0%) | 163 (18.0%) |
| Total (Category) | 2,597 (81.0%) | 609 (19.0%) |
| Total (Overall) | 8,089 (52.9%) | 7,214 (47.1%) |
Employment Industries by Sex in Lee County
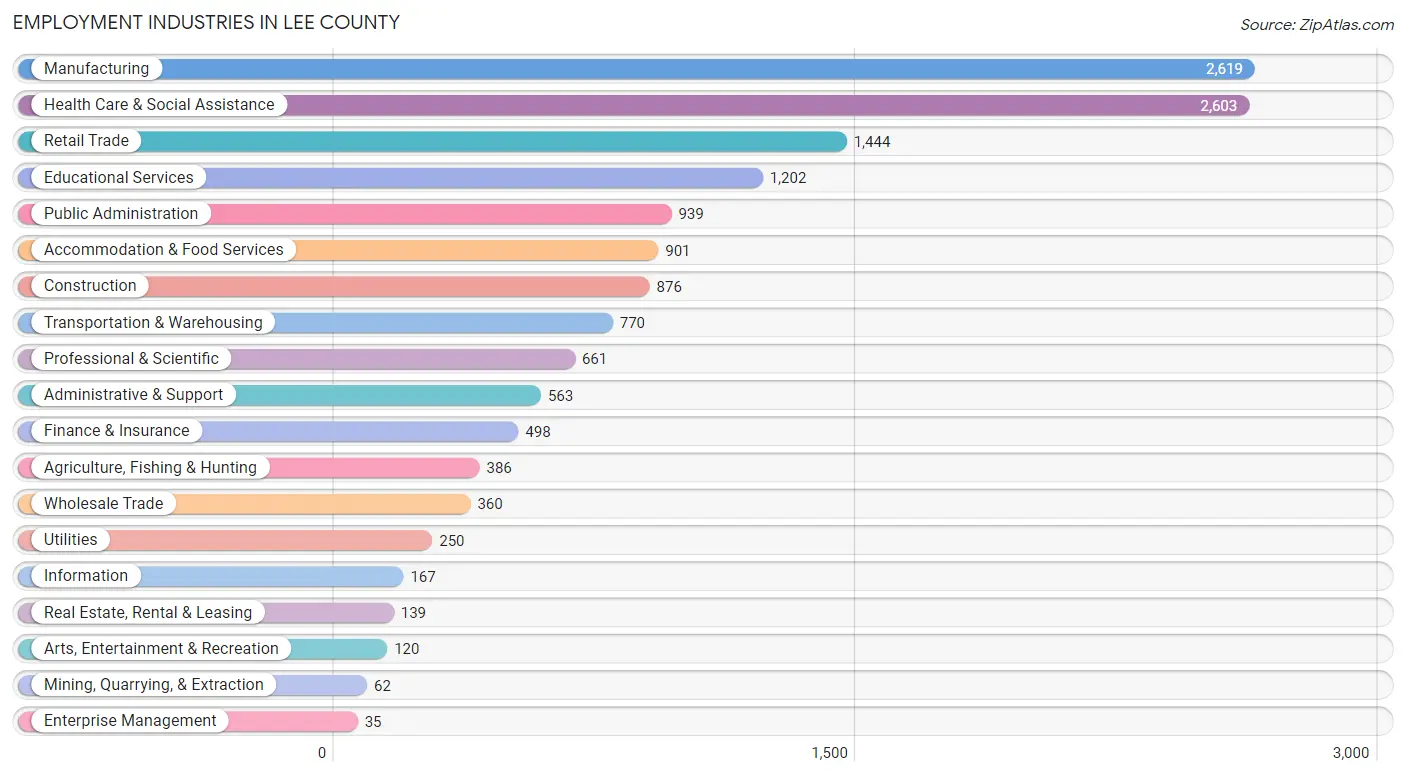
Employment Industries in Lee County
The major employment industries in Lee County include Manufacturing (2,619 | 17.1%), Health Care & Social Assistance (2,603 | 17.0%), Retail Trade (1,444 | 9.4%), Educational Services (1,202 | 7.9%), and Public Administration (939 | 6.1%).
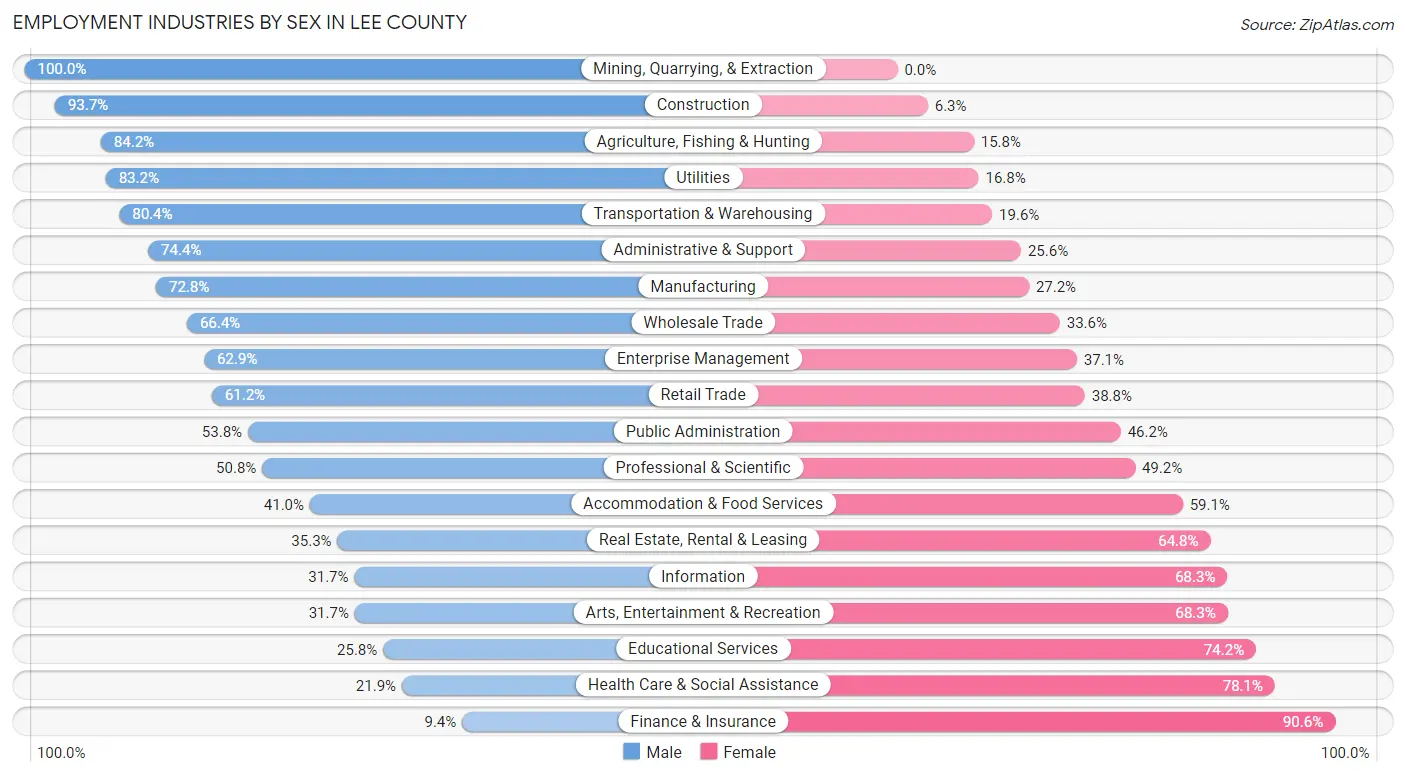
Employment Industries by Sex in Lee County
The Lee County industries that see more men than women are Mining, Quarrying, & Extraction (100.0%), Construction (93.7%), and Agriculture, Fishing & Hunting (84.2%), whereas the industries that tend to have a higher number of women are Finance & Insurance (90.6%), Health Care & Social Assistance (78.1%), and Educational Services (74.2%).
| Industry | Male | Female |
| Agriculture, Fishing & Hunting | 325 (84.2%) | 61 (15.8%) |
| Mining, Quarrying, & Extraction | 62 (100.0%) | 0 (0.0%) |
| Construction | 821 (93.7%) | 55 (6.3%) |
| Manufacturing | 1,906 (72.8%) | 713 (27.2%) |
| Wholesale Trade | 239 (66.4%) | 121 (33.6%) |
| Retail Trade | 884 (61.2%) | 560 (38.8%) |
| Transportation & Warehousing | 619 (80.4%) | 151 (19.6%) |
| Utilities | 208 (83.2%) | 42 (16.8%) |
| Information | 53 (31.7%) | 114 (68.3%) |
| Finance & Insurance | 47 (9.4%) | 451 (90.6%) |
| Real Estate, Rental & Leasing | 49 (35.2%) | 90 (64.7%) |
| Professional & Scientific | 336 (50.8%) | 325 (49.2%) |
| Enterprise Management | 22 (62.9%) | 13 (37.1%) |
| Administrative & Support | 419 (74.4%) | 144 (25.6%) |
| Educational Services | 310 (25.8%) | 892 (74.2%) |
| Health Care & Social Assistance | 570 (21.9%) | 2,033 (78.1%) |
| Arts, Entertainment & Recreation | 38 (31.7%) | 82 (68.3%) |
| Accommodation & Food Services | 369 (40.9%) | 532 (59.1%) |
| Public Administration | 505 (53.8%) | 434 (46.2%) |
| Total | 8,089 (52.9%) | 7,214 (47.1%) |
Education in Lee County
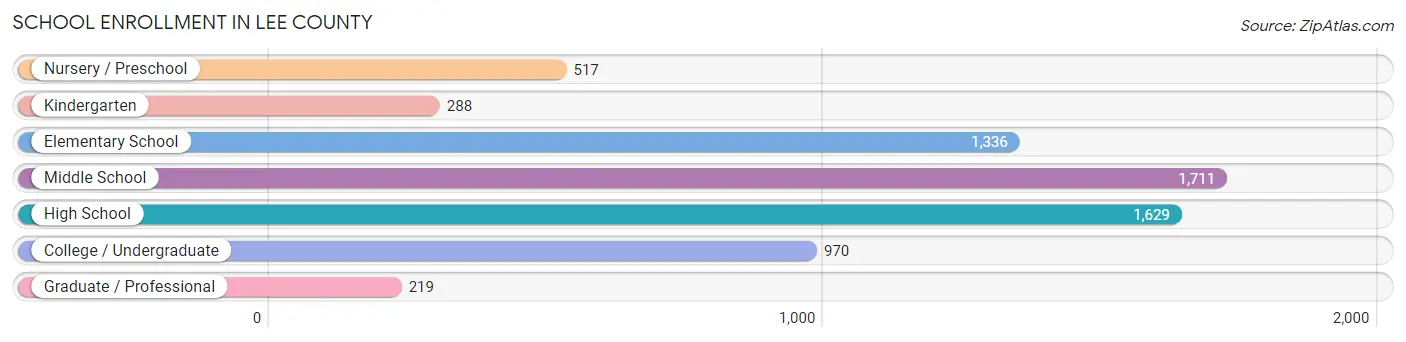
School Enrollment in Lee County
The most common levels of schooling among the 6,670 students in Lee County are middle school (1,711 | 25.7%), high school (1,629 | 24.4%), and elementary school (1,336 | 20.0%).
| School Level | # Students | % Students |
| Nursery / Preschool | 517 | 7.7% |
| Kindergarten | 288 | 4.3% |
| Elementary School | 1,336 | 20.0% |
| Middle School | 1,711 | 25.7% |
| High School | 1,629 | 24.4% |
| College / Undergraduate | 970 | 14.5% |
| Graduate / Professional | 219 | 3.3% |
| Total | 6,670 | 100.0% |
School Enrollment by Age by Funding Source in Lee County
Out of a total of 6,670 students who are enrolled in schools in Lee County, 1,074 (16.1%) attend a private institution, while the remaining 5,596 (83.9%) are enrolled in public schools. The age group of 25 to 34 year olds has the highest likelihood of being enrolled in private schools, with 74 (29.6% in the age bracket) enrolled. Conversely, the age group of 35 years and over has the lowest likelihood of being enrolled in a private school, with 226 (91.9% in the age bracket) attending a public institution.

| Age Bracket | Public School | Private School |
| 3 to 4 Year Olds | 283 (86.5%) | 44 (13.5%) |
| 5 to 9 Year Old | 1,282 (79.6%) | 328 (20.4%) |
| 10 to 14 Year Olds | 1,863 (87.1%) | 277 (12.9%) |
| 15 to 17 Year Olds | 968 (85.6%) | 163 (14.4%) |
| 18 to 19 Year Olds | 418 (81.8%) | 93 (18.2%) |
| 20 to 24 Year Olds | 378 (83.1%) | 77 (16.9%) |
| 25 to 34 Year Olds | 176 (70.4%) | 74 (29.6%) |
| 35 Years and over | 226 (91.9%) | 20 (8.1%) |
| Total | 5,596 (83.9%) | 1,074 (16.1%) |
Educational Attainment by Field of Study in Lee County
Business (953 | 19.0%), education (931 | 18.5%), science & technology (557 | 11.1%), bio, nature & agricultural (422 | 8.4%), and social sciences (391 | 7.8%) are the most common fields of study among 5,022 individuals in Lee County who have obtained a bachelor's degree or higher.
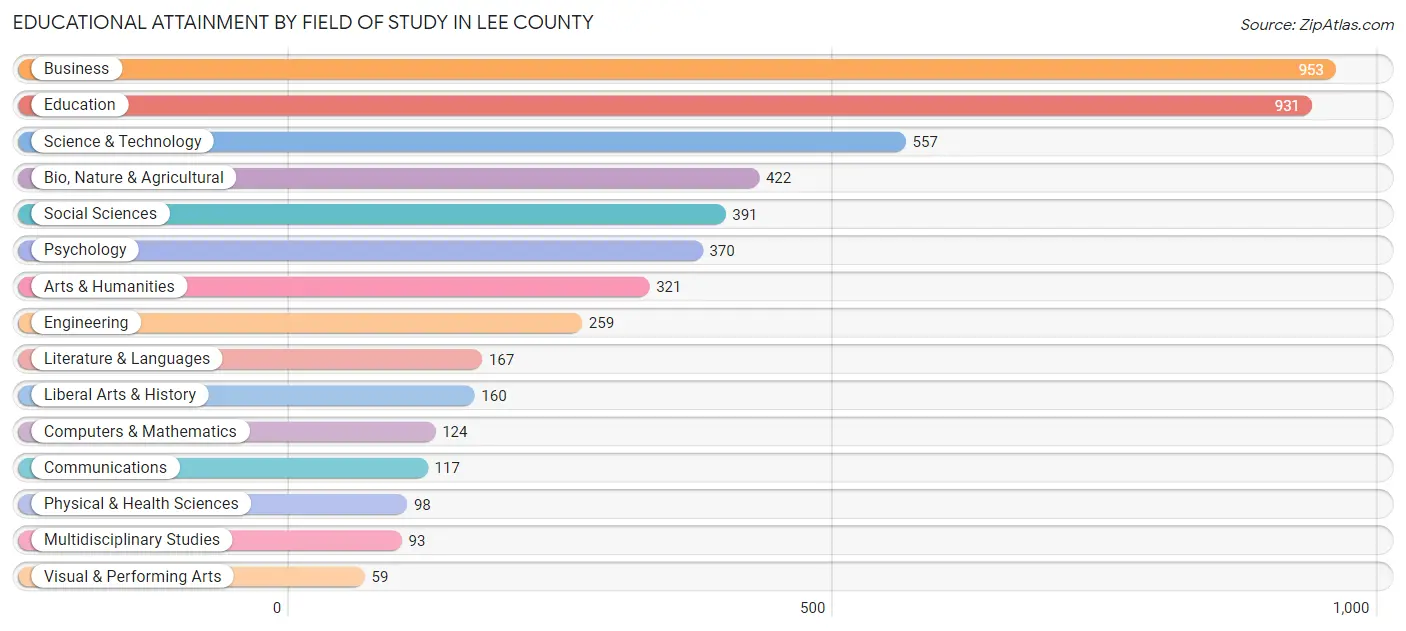
| Field of Study | # Graduates | % Graduates |
| Computers & Mathematics | 124 | 2.5% |
| Bio, Nature & Agricultural | 422 | 8.4% |
| Physical & Health Sciences | 98 | 1.9% |
| Psychology | 370 | 7.4% |
| Social Sciences | 391 | 7.8% |
| Engineering | 259 | 5.2% |
| Multidisciplinary Studies | 93 | 1.8% |
| Science & Technology | 557 | 11.1% |
| Business | 953 | 19.0% |
| Education | 931 | 18.5% |
| Literature & Languages | 167 | 3.3% |
| Liberal Arts & History | 160 | 3.2% |
| Visual & Performing Arts | 59 | 1.2% |
| Communications | 117 | 2.3% |
| Arts & Humanities | 321 | 6.4% |
| Total | 5,022 | 100.0% |
Transportation & Commute in Lee County
Vehicle Availability by Sex in Lee County
The most prevalent vehicle ownership categories in Lee County are males with 2 vehicles (3,204, accounting for 40.1%) and females with 2 vehicles (2,836, making up 45.1%).
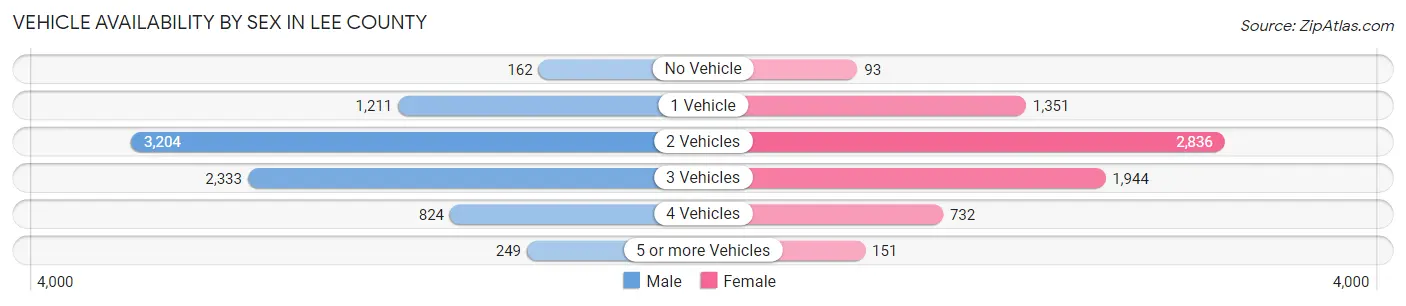
| Vehicles Available | Male | Female |
| No Vehicle | 162 (2.0%) | 93 (1.3%) |
| 1 Vehicle | 1,211 (15.2%) | 1,351 (19.0%) |
| 2 Vehicles | 3,204 (40.1%) | 2,836 (39.9%) |
| 3 Vehicles | 2,333 (29.2%) | 1,944 (27.4%) |
| 4 Vehicles | 824 (10.3%) | 732 (10.3%) |
| 5 or more Vehicles | 249 (3.1%) | 151 (2.1%) |
| Total | 7,983 (100.0%) | 7,107 (100.0%) |
Commute Time in Lee County
The most frequently occuring commute durations in Lee County are 5 to 9 minutes (2,432 commuters, 16.9%), 10 to 14 minutes (1,972 commuters, 13.7%), and 20 to 24 minutes (1,866 commuters, 13.0%).
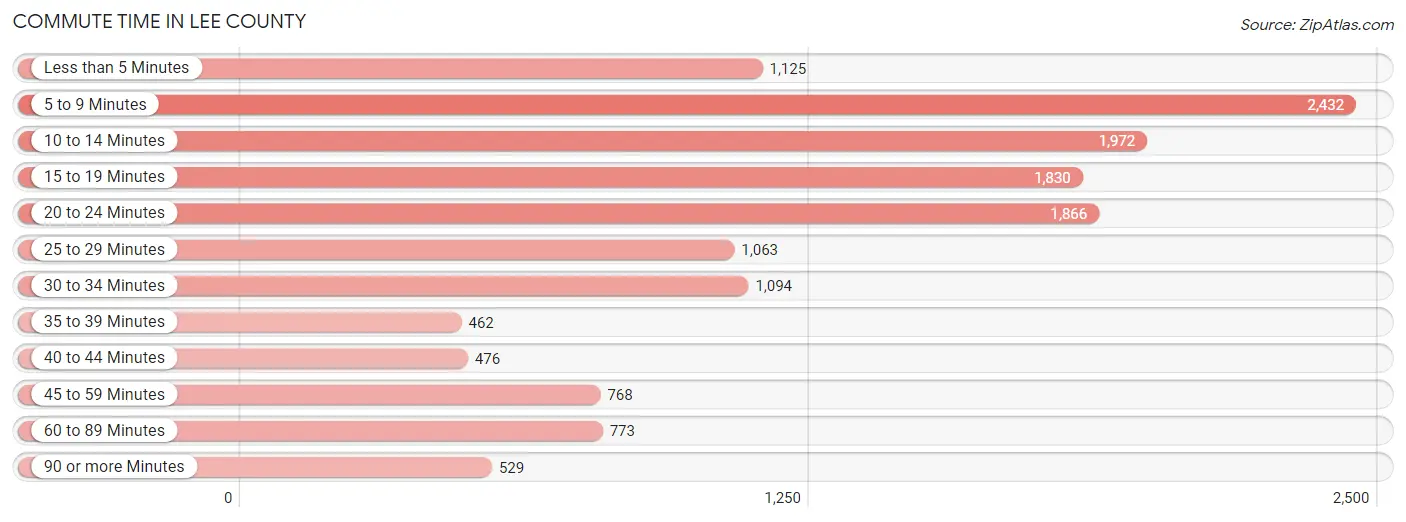
| Commute Time | # Commuters | % Commuters |
| Less than 5 Minutes | 1,125 | 7.8% |
| 5 to 9 Minutes | 2,432 | 16.9% |
| 10 to 14 Minutes | 1,972 | 13.7% |
| 15 to 19 Minutes | 1,830 | 12.7% |
| 20 to 24 Minutes | 1,866 | 13.0% |
| 25 to 29 Minutes | 1,063 | 7.4% |
| 30 to 34 Minutes | 1,094 | 7.6% |
| 35 to 39 Minutes | 462 | 3.2% |
| 40 to 44 Minutes | 476 | 3.3% |
| 45 to 59 Minutes | 768 | 5.3% |
| 60 to 89 Minutes | 773 | 5.4% |
| 90 or more Minutes | 529 | 3.7% |
Commute Time by Sex in Lee County
The most common commute times in Lee County are 5 to 9 minutes (1,231 commuters, 15.9%) for males and 5 to 9 minutes (1,201 commuters, 18.0%) for females.
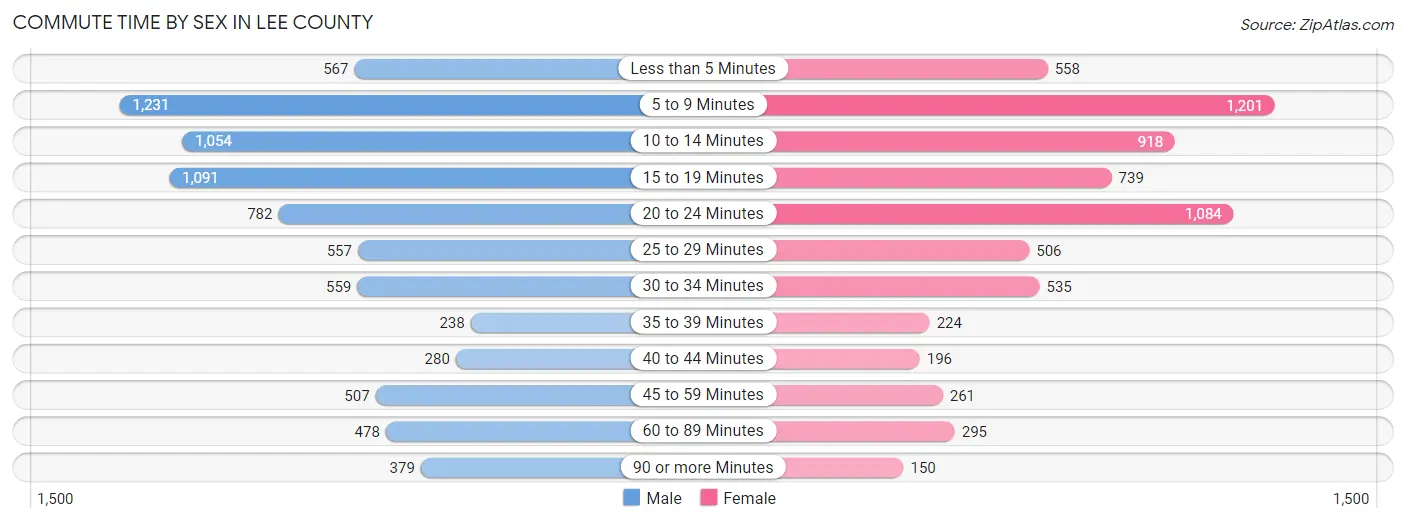
| Commute Time | Male | Female |
| Less than 5 Minutes | 567 (7.3%) | 558 (8.4%) |
| 5 to 9 Minutes | 1,231 (15.9%) | 1,201 (18.0%) |
| 10 to 14 Minutes | 1,054 (13.7%) | 918 (13.8%) |
| 15 to 19 Minutes | 1,091 (14.1%) | 739 (11.1%) |
| 20 to 24 Minutes | 782 (10.1%) | 1,084 (16.3%) |
| 25 to 29 Minutes | 557 (7.2%) | 506 (7.6%) |
| 30 to 34 Minutes | 559 (7.2%) | 535 (8.0%) |
| 35 to 39 Minutes | 238 (3.1%) | 224 (3.4%) |
| 40 to 44 Minutes | 280 (3.6%) | 196 (2.9%) |
| 45 to 59 Minutes | 507 (6.6%) | 261 (3.9%) |
| 60 to 89 Minutes | 478 (6.2%) | 295 (4.4%) |
| 90 or more Minutes | 379 (4.9%) | 150 (2.2%) |
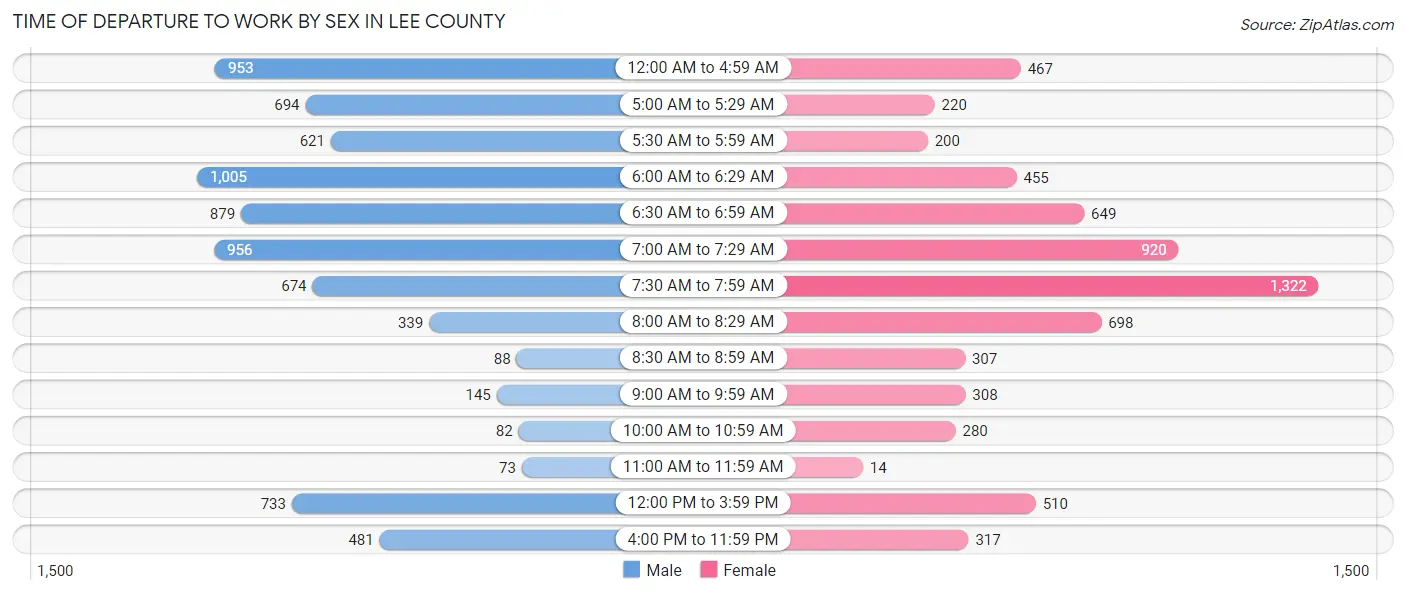
Time of Departure to Work by Sex in Lee County
The most frequent times of departure to work in Lee County are 6:00 AM to 6:29 AM (1,005, 13.0%) for males and 7:30 AM to 7:59 AM (1,322, 19.8%) for females.
| Time of Departure | Male | Female |
| 12:00 AM to 4:59 AM | 953 (12.3%) | 467 (7.0%) |
| 5:00 AM to 5:29 AM | 694 (9.0%) | 220 (3.3%) |
| 5:30 AM to 5:59 AM | 621 (8.0%) | 200 (3.0%) |
| 6:00 AM to 6:29 AM | 1,005 (13.0%) | 455 (6.8%) |
| 6:30 AM to 6:59 AM | 879 (11.4%) | 649 (9.7%) |
| 7:00 AM to 7:29 AM | 956 (12.4%) | 920 (13.8%) |
| 7:30 AM to 7:59 AM | 674 (8.7%) | 1,322 (19.8%) |
| 8:00 AM to 8:29 AM | 339 (4.4%) | 698 (10.5%) |
| 8:30 AM to 8:59 AM | 88 (1.1%) | 307 (4.6%) |
| 9:00 AM to 9:59 AM | 145 (1.9%) | 308 (4.6%) |
| 10:00 AM to 10:59 AM | 82 (1.1%) | 280 (4.2%) |
| 11:00 AM to 11:59 AM | 73 (0.9%) | 14 (0.2%) |
| 12:00 PM to 3:59 PM | 733 (9.5%) | 510 (7.6%) |
| 4:00 PM to 11:59 PM | 481 (6.2%) | 317 (4.8%) |
| Total | 7,723 (100.0%) | 6,667 (100.0%) |
Housing Occupancy in Lee County
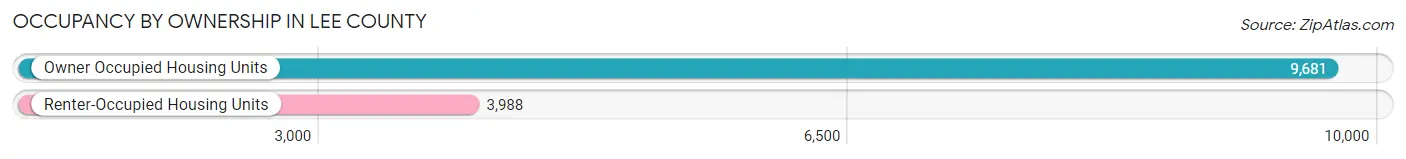
Occupancy by Ownership in Lee County
Of the total 13,669 dwellings in Lee County, owner-occupied units account for 9,681 (70.8%), while renter-occupied units make up 3,988 (29.2%).
| Occupancy | # Housing Units | % Housing Units |
| Owner Occupied Housing Units | 9,681 | 70.8% |
| Renter-Occupied Housing Units | 3,988 | 29.2% |
| Total Occupied Housing Units | 13,669 | 100.0% |
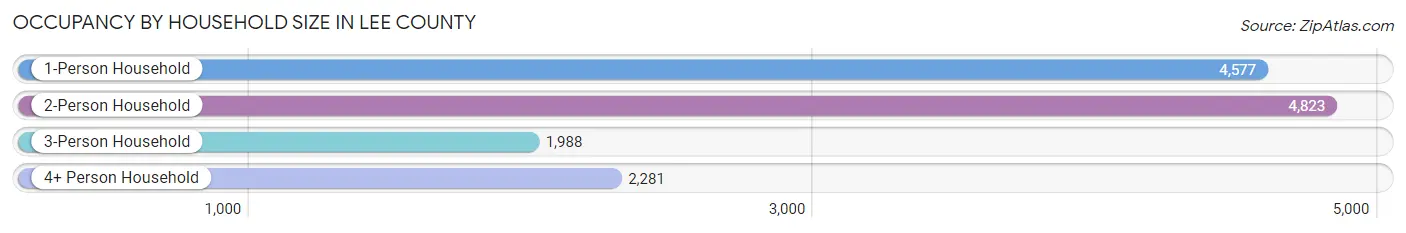
Occupancy by Household Size in Lee County
| Household Size | # Housing Units | % Housing Units |
| 1-Person Household | 4,577 | 33.5% |
| 2-Person Household | 4,823 | 35.3% |
| 3-Person Household | 1,988 | 14.5% |
| 4+ Person Household | 2,281 | 16.7% |
| Total Housing Units | 13,669 | 100.0% |
Occupancy by Ownership by Household Size in Lee County
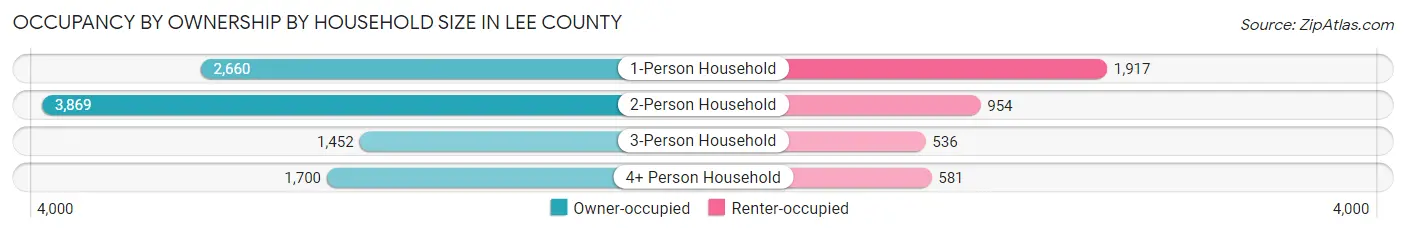
| Household Size | Owner-occupied | Renter-occupied |
| 1-Person Household | 2,660 (58.1%) | 1,917 (41.9%) |
| 2-Person Household | 3,869 (80.2%) | 954 (19.8%) |
| 3-Person Household | 1,452 (73.0%) | 536 (27.0%) |
| 4+ Person Household | 1,700 (74.5%) | 581 (25.5%) |
| Total Housing Units | 9,681 (70.8%) | 3,988 (29.2%) |
Occupancy by Educational Attainment in Lee County
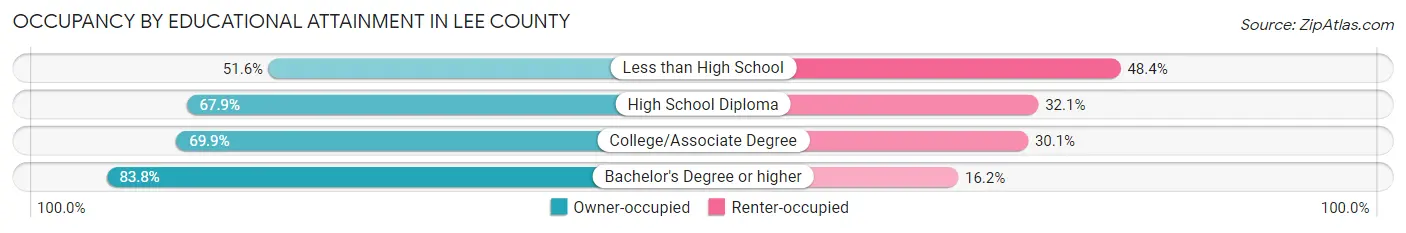
| Household Size | Owner-occupied | Renter-occupied |
| Less than High School | 497 (51.6%) | 467 (48.4%) |
| High School Diploma | 3,198 (67.9%) | 1,514 (32.1%) |
| College/Associate Degree | 3,581 (69.9%) | 1,541 (30.1%) |
| Bachelor's Degree or higher | 2,405 (83.8%) | 466 (16.2%) |
Occupancy by Age of Householder in Lee County
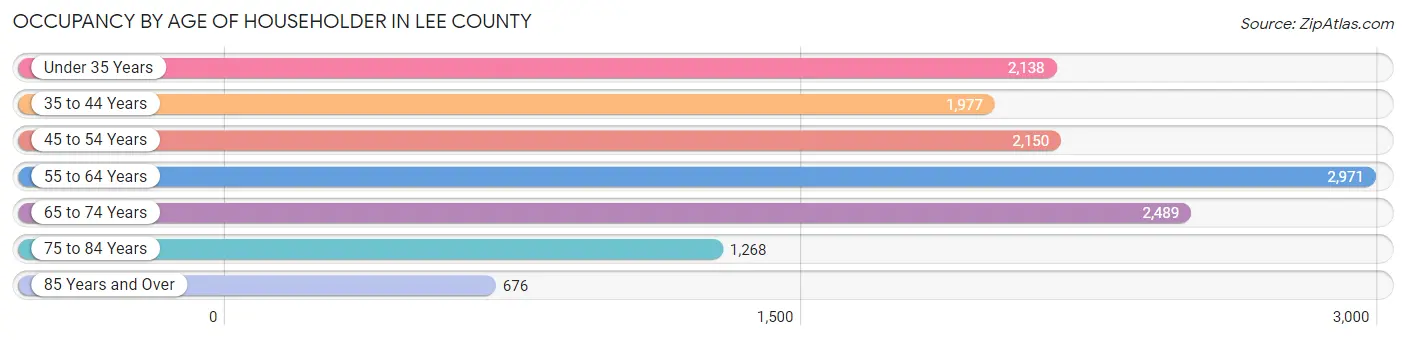
| Age Bracket | # Households | % Households |
| Under 35 Years | 2,138 | 15.6% |
| 35 to 44 Years | 1,977 | 14.5% |
| 45 to 54 Years | 2,150 | 15.7% |
| 55 to 64 Years | 2,971 | 21.7% |
| 65 to 74 Years | 2,489 | 18.2% |
| 75 to 84 Years | 1,268 | 9.3% |
| 85 Years and Over | 676 | 5.0% |
| Total | 13,669 | 100.0% |
Housing Finances in Lee County
Median Income by Occupancy in Lee County
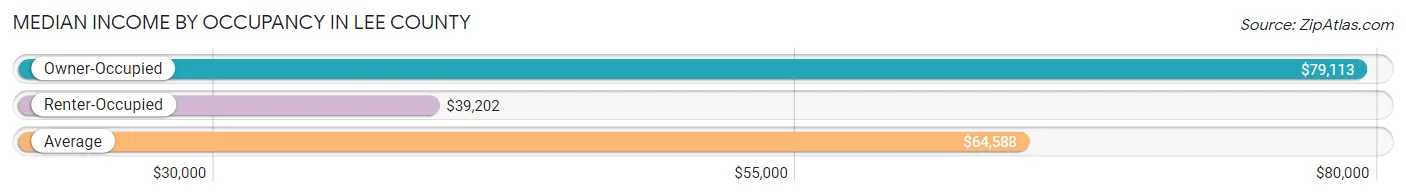
| Occupancy Type | # Households | Median Income |
| Owner-Occupied | 9,681 (70.8%) | $79,113 |
| Renter-Occupied | 3,988 (29.2%) | $39,202 |
| Average | 13,669 (100.0%) | $64,588 |
Occupancy by Householder Income Bracket in Lee County
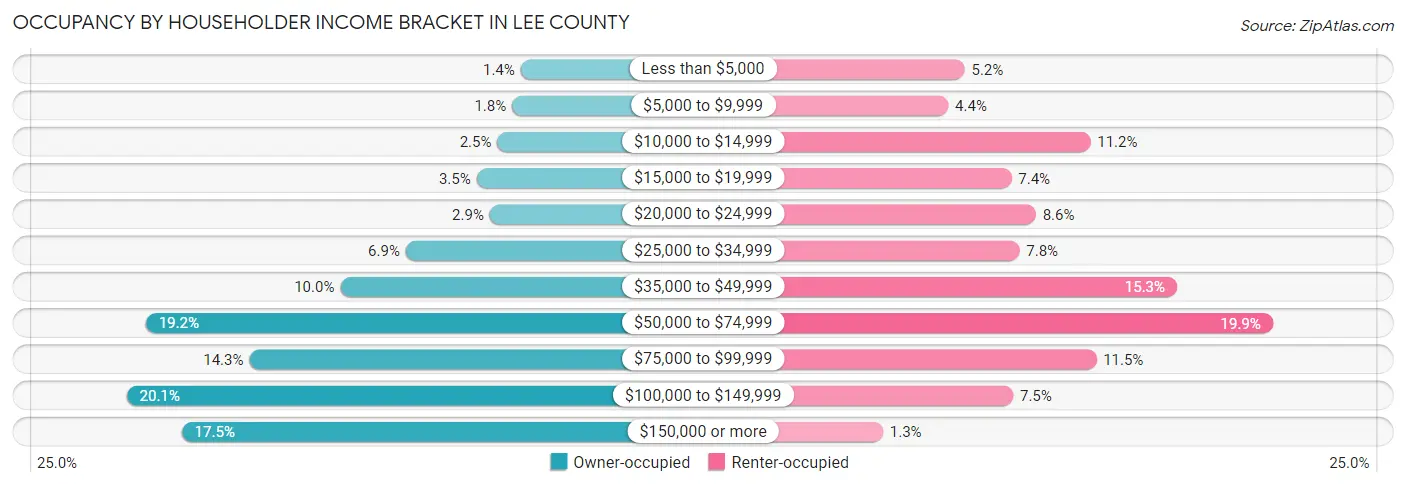
| Income Bracket | Owner-occupied | Renter-occupied |
| Less than $5,000 | 134 (1.4%) | 207 (5.2%) |
| $5,000 to $9,999 | 173 (1.8%) | 176 (4.4%) |
| $10,000 to $14,999 | 241 (2.5%) | 446 (11.2%) |
| $15,000 to $19,999 | 337 (3.5%) | 296 (7.4%) |
| $20,000 to $24,999 | 276 (2.9%) | 342 (8.6%) |
| $25,000 to $34,999 | 663 (6.9%) | 311 (7.8%) |
| $35,000 to $49,999 | 965 (10.0%) | 610 (15.3%) |
| $50,000 to $74,999 | 1,862 (19.2%) | 792 (19.9%) |
| $75,000 to $99,999 | 1,384 (14.3%) | 457 (11.5%) |
| $100,000 to $149,999 | 1,950 (20.1%) | 299 (7.5%) |
| $150,000 or more | 1,696 (17.5%) | 52 (1.3%) |
| Total | 9,681 (100.0%) | 3,988 (100.0%) |
Monthly Housing Cost Tiers in Lee County
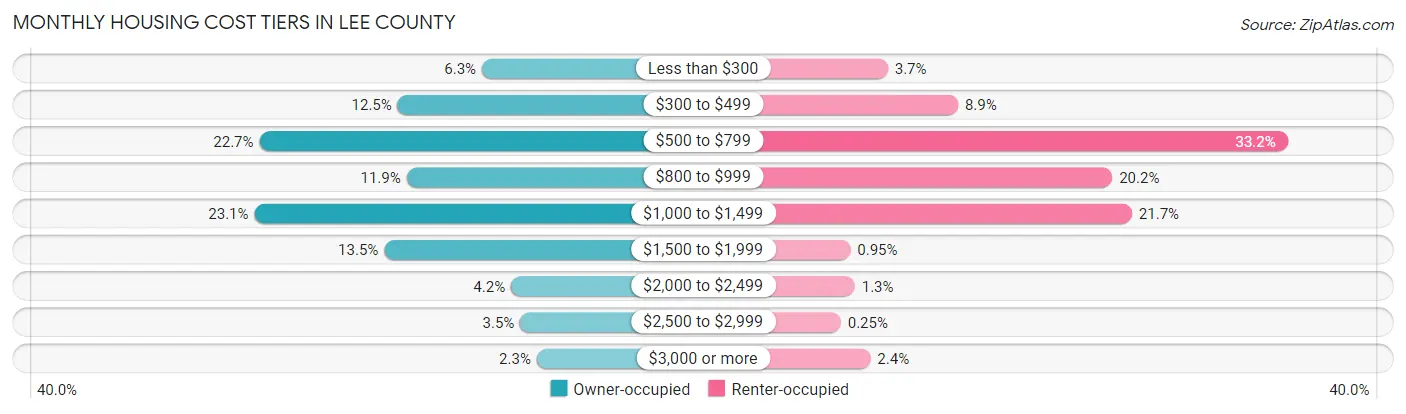
| Monthly Cost | Owner-occupied | Renter-occupied |
| Less than $300 | 612 (6.3%) | 148 (3.7%) |
| $300 to $499 | 1,213 (12.5%) | 354 (8.9%) |
| $500 to $799 | 2,199 (22.7%) | 1,322 (33.2%) |
| $800 to $999 | 1,149 (11.9%) | 807 (20.2%) |
| $1,000 to $1,499 | 2,234 (23.1%) | 865 (21.7%) |
| $1,500 to $1,999 | 1,309 (13.5%) | 38 (0.9%) |
| $2,000 to $2,499 | 405 (4.2%) | 51 (1.3%) |
| $2,500 to $2,999 | 339 (3.5%) | 10 (0.3%) |
| $3,000 or more | 221 (2.3%) | 97 (2.4%) |
| Total | 9,681 (100.0%) | 3,988 (100.0%) |
Physical Housing Characteristics in Lee County
Housing Structures in Lee County
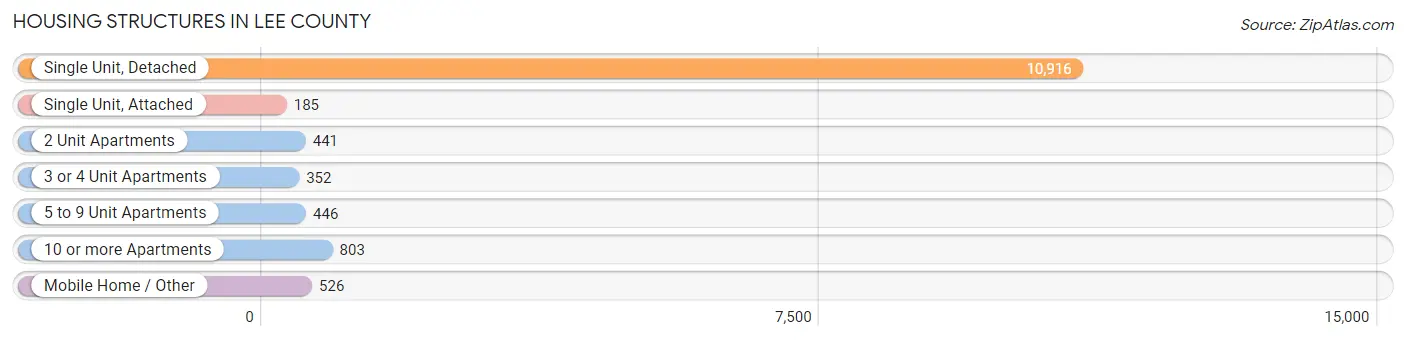
| Structure Type | # Housing Units | % Housing Units |
| Single Unit, Detached | 10,916 | 79.9% |
| Single Unit, Attached | 185 | 1.3% |
| 2 Unit Apartments | 441 | 3.2% |
| 3 or 4 Unit Apartments | 352 | 2.6% |
| 5 to 9 Unit Apartments | 446 | 3.3% |
| 10 or more Apartments | 803 | 5.9% |
| Mobile Home / Other | 526 | 3.8% |
| Total | 13,669 | 100.0% |
Housing Structures by Occupancy in Lee County
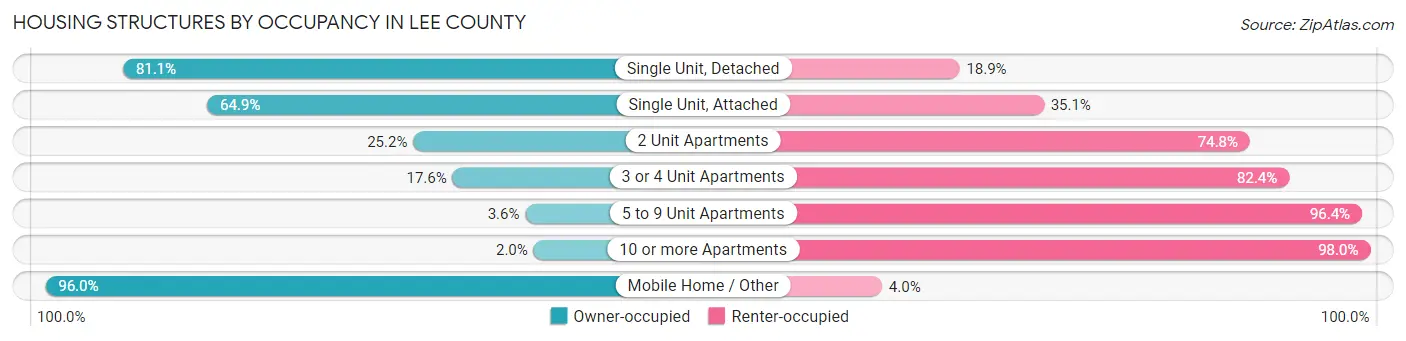
| Structure Type | Owner-occupied | Renter-occupied |
| Single Unit, Detached | 8,851 (81.1%) | 2,065 (18.9%) |
| Single Unit, Attached | 120 (64.9%) | 65 (35.1%) |
| 2 Unit Apartments | 111 (25.2%) | 330 (74.8%) |
| 3 or 4 Unit Apartments | 62 (17.6%) | 290 (82.4%) |
| 5 to 9 Unit Apartments | 16 (3.6%) | 430 (96.4%) |
| 10 or more Apartments | 16 (2.0%) | 787 (98.0%) |
| Mobile Home / Other | 505 (96.0%) | 21 (4.0%) |
| Total | 9,681 (70.8%) | 3,988 (29.2%) |
Housing Structures by Number of Rooms in Lee County
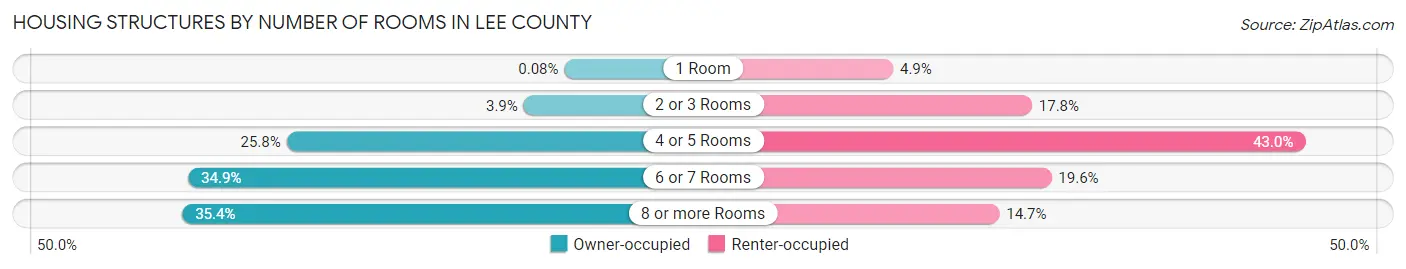
| Number of Rooms | Owner-occupied | Renter-occupied |
| 1 Room | 8 (0.1%) | 196 (4.9%) |
| 2 or 3 Rooms | 373 (3.8%) | 708 (17.7%) |
| 4 or 5 Rooms | 2,495 (25.8%) | 1,716 (43.0%) |
| 6 or 7 Rooms | 3,376 (34.9%) | 780 (19.6%) |
| 8 or more Rooms | 3,429 (35.4%) | 588 (14.7%) |
| Total | 9,681 (100.0%) | 3,988 (100.0%) |
Housing Structure by Heating Type in Lee County
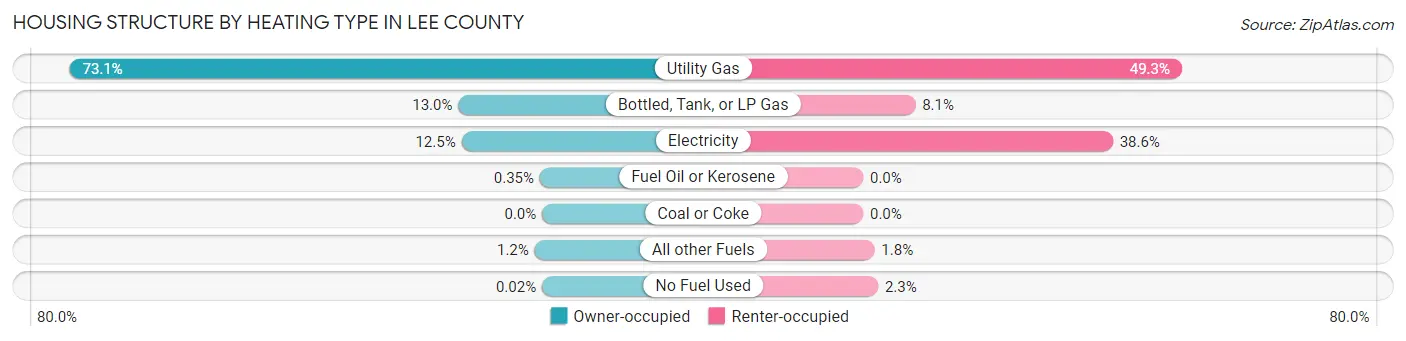
| Heating Type | Owner-occupied | Renter-occupied |
| Utility Gas | 7,073 (73.1%) | 1,965 (49.3%) |
| Bottled, Tank, or LP Gas | 1,254 (13.0%) | 322 (8.1%) |
| Electricity | 1,206 (12.5%) | 1,539 (38.6%) |
| Fuel Oil or Kerosene | 34 (0.4%) | 0 (0.0%) |
| Coal or Coke | 0 (0.0%) | 0 (0.0%) |
| All other Fuels | 112 (1.2%) | 70 (1.8%) |
| No Fuel Used | 2 (0.0%) | 92 (2.3%) |
| Total | 9,681 (100.0%) | 3,988 (100.0%) |
Household Vehicle Usage in Lee County
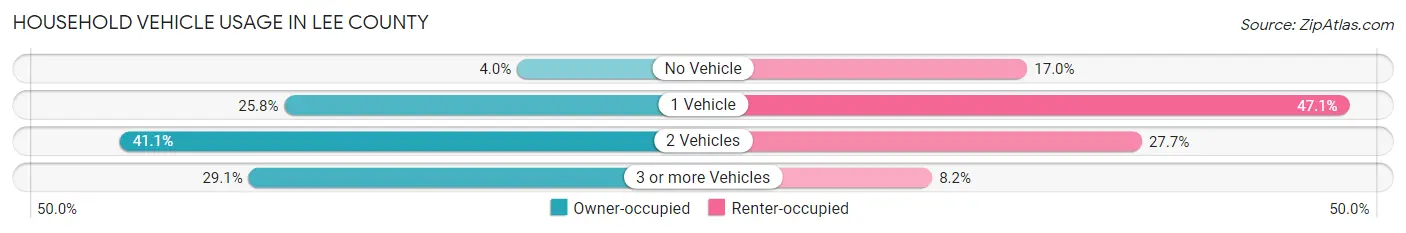
| Vehicles per Household | Owner-occupied | Renter-occupied |
| No Vehicle | 390 (4.0%) | 679 (17.0%) |
| 1 Vehicle | 2,494 (25.8%) | 1,878 (47.1%) |
| 2 Vehicles | 3,980 (41.1%) | 1,106 (27.7%) |
| 3 or more Vehicles | 2,817 (29.1%) | 325 (8.2%) |
| Total | 9,681 (100.0%) | 3,988 (100.0%) |
Real Estate & Mortgages in Lee County
Real Estate and Mortgage Overview in Lee County
| Characteristic | Without Mortgage | With Mortgage |
| Housing Units | 4,141 | 5,540 |
| Median Property Value | $137,600 | $151,000 |
| Median Household Income | $62,628 | $1,094 |
| Monthly Housing Costs | $551 | $164 |
| Real Estate Taxes | $2,681 | $75 |
Property Value by Mortgage Status in Lee County
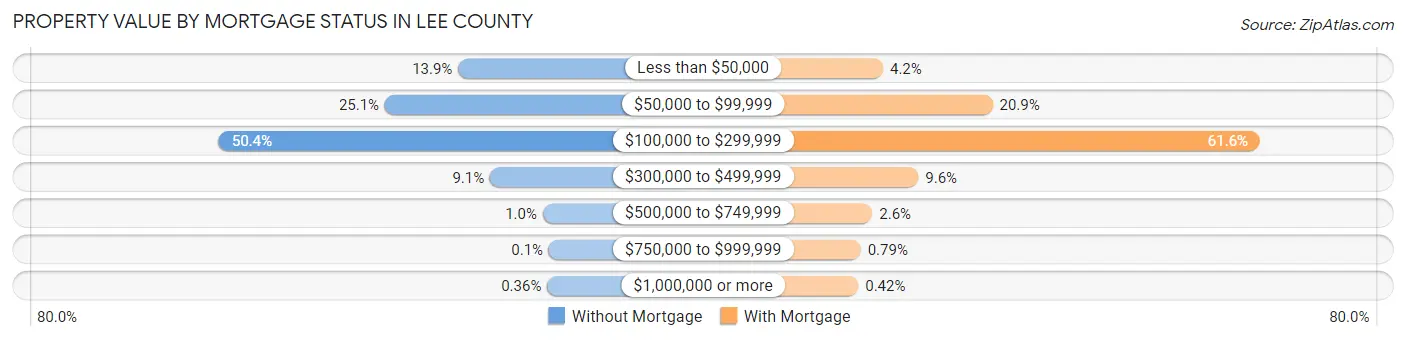
| Property Value | Without Mortgage | With Mortgage |
| Less than $50,000 | 577 (13.9%) | 232 (4.2%) |
| $50,000 to $99,999 | 1,039 (25.1%) | 1,156 (20.9%) |
| $100,000 to $299,999 | 2,087 (50.4%) | 3,413 (61.6%) |
| $300,000 to $499,999 | 376 (9.1%) | 530 (9.6%) |
| $500,000 to $749,999 | 43 (1.0%) | 142 (2.6%) |
| $750,000 to $999,999 | 4 (0.1%) | 44 (0.8%) |
| $1,000,000 or more | 15 (0.4%) | 23 (0.4%) |
| Total | 4,141 (100.0%) | 5,540 (100.0%) |
Household Income by Mortgage Status in Lee County

| Household Income | Without Mortgage | With Mortgage |
| Less than $10,000 | 196 (4.7%) | 49 (0.9%) |
| $10,000 to $24,999 | 503 (12.1%) | 111 (2.0%) |
| $25,000 to $34,999 | 434 (10.5%) | 351 (6.3%) |
| $35,000 to $49,999 | 486 (11.7%) | 229 (4.1%) |
| $50,000 to $74,999 | 844 (20.4%) | 479 (8.6%) |
| $75,000 to $99,999 | 607 (14.7%) | 1,018 (18.4%) |
| $100,000 to $149,999 | 469 (11.3%) | 777 (14.0%) |
| $150,000 or more | 602 (14.5%) | 1,481 (26.7%) |
| Total | 4,141 (100.0%) | 5,540 (100.0%) |
Property Value to Household Income Ratio in Lee County
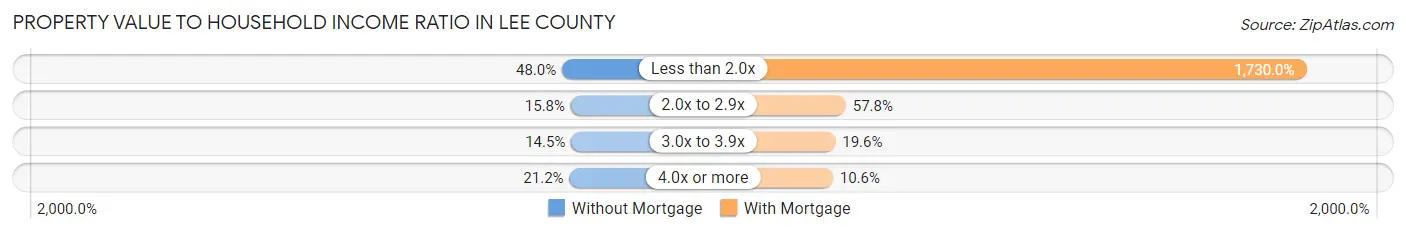
| Value-to-Income Ratio | Without Mortgage | With Mortgage |
| Less than 2.0x | 1,987 (48.0%) | 95,843 (1,730.0%) |
| 2.0x to 2.9x | 656 (15.8%) | 3,202 (57.8%) |
| 3.0x to 3.9x | 602 (14.5%) | 1,083 (19.6%) |
| 4.0x or more | 878 (21.2%) | 585 (10.6%) |
| Total | 4,141 (100.0%) | 5,540 (100.0%) |
Real Estate Taxes by Mortgage Status in Lee County
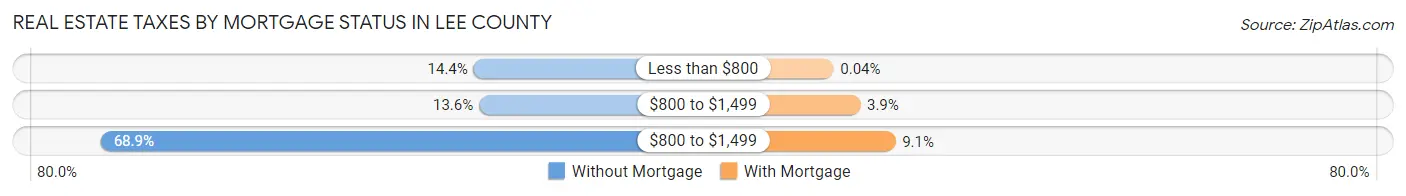
| Property Taxes | Without Mortgage | With Mortgage |
| Less than $800 | 596 (14.4%) | 2 (0.0%) |
| $800 to $1,499 | 563 (13.6%) | 218 (3.9%) |
| $800 to $1,499 | 2,852 (68.9%) | 503 (9.1%) |
| Total | 4,141 (100.0%) | 5,540 (100.0%) |
Health & Disability in Lee County
Health Insurance Coverage by Age in Lee County
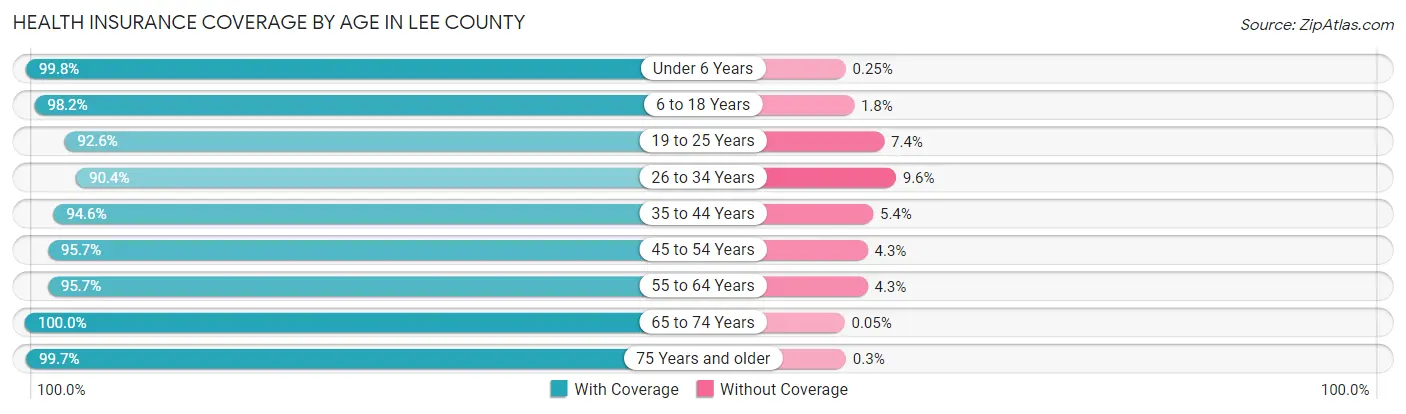
| Age Bracket | With Coverage | Without Coverage |
| Under 6 Years | 1,964 (99.8%) | 5 (0.3%) |
| 6 to 18 Years | 5,094 (98.2%) | 94 (1.8%) |
| 19 to 25 Years | 2,081 (92.6%) | 167 (7.4%) |
| 26 to 34 Years | 3,192 (90.4%) | 339 (9.6%) |
| 35 to 44 Years | 3,513 (94.6%) | 199 (5.4%) |
| 45 to 54 Years | 3,662 (95.7%) | 166 (4.3%) |
| 55 to 64 Years | 4,509 (95.7%) | 204 (4.3%) |
| 65 to 74 Years | 3,708 (100.0%) | 2 (0.1%) |
| 75 Years and older | 2,675 (99.7%) | 8 (0.3%) |
| Total | 30,398 (96.3%) | 1,184 (3.7%) |
Health Insurance Coverage by Citizenship Status in Lee County
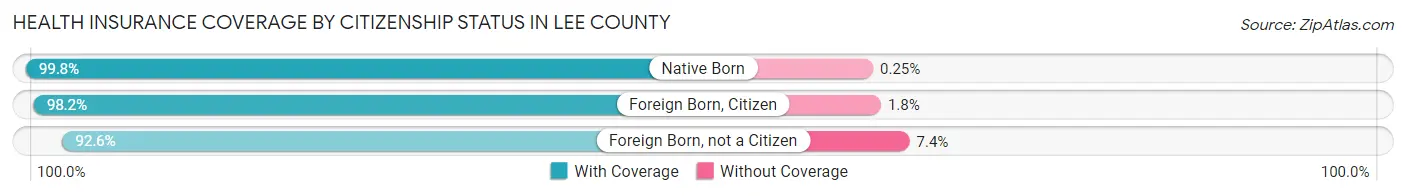
| Citizenship Status | With Coverage | Without Coverage |
| Native Born | 1,964 (99.8%) | 5 (0.3%) |
| Foreign Born, Citizen | 5,094 (98.2%) | 94 (1.8%) |
| Foreign Born, not a Citizen | 2,081 (92.6%) | 167 (7.4%) |
Health Insurance Coverage by Household Income in Lee County
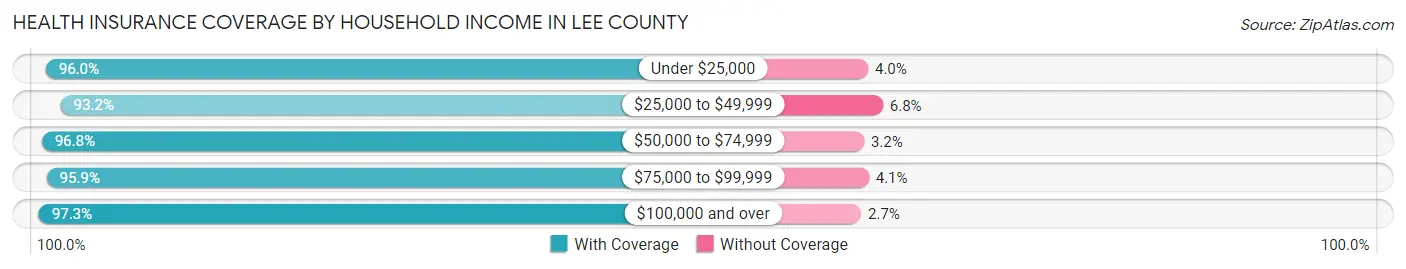
| Household Income | With Coverage | Without Coverage |
| Under $25,000 | 3,501 (96.0%) | 145 (4.0%) |
| $25,000 to $49,999 | 4,511 (93.2%) | 327 (6.8%) |
| $50,000 to $74,999 | 5,930 (96.8%) | 197 (3.2%) |
| $75,000 to $99,999 | 4,490 (95.9%) | 193 (4.1%) |
| $100,000 and over | 11,710 (97.3%) | 322 (2.7%) |
Public vs Private Health Insurance Coverage by Age in Lee County
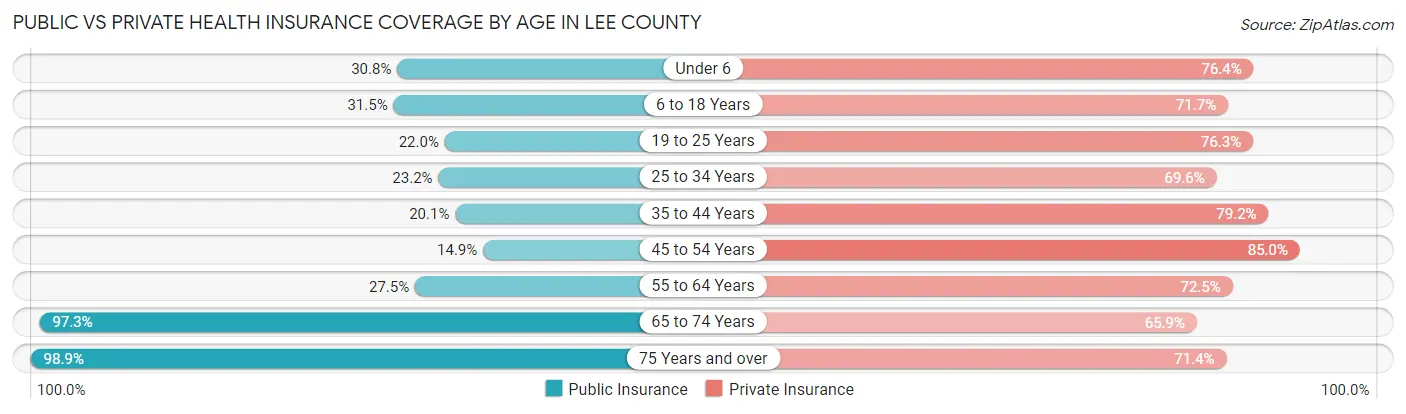
| Age Bracket | Public Insurance | Private Insurance |
| Under 6 | 607 (30.8%) | 1,505 (76.4%) |
| 6 to 18 Years | 1,636 (31.5%) | 3,720 (71.7%) |
| 19 to 25 Years | 495 (22.0%) | 1,716 (76.3%) |
| 25 to 34 Years | 819 (23.2%) | 2,456 (69.6%) |
| 35 to 44 Years | 745 (20.1%) | 2,939 (79.2%) |
| 45 to 54 Years | 570 (14.9%) | 3,254 (85.0%) |
| 55 to 64 Years | 1,297 (27.5%) | 3,418 (72.5%) |
| 65 to 74 Years | 3,608 (97.3%) | 2,444 (65.9%) |
| 75 Years and over | 2,653 (98.9%) | 1,915 (71.4%) |
| Total | 12,430 (39.4%) | 23,367 (74.0%) |
Disability Status by Sex by Age in Lee County
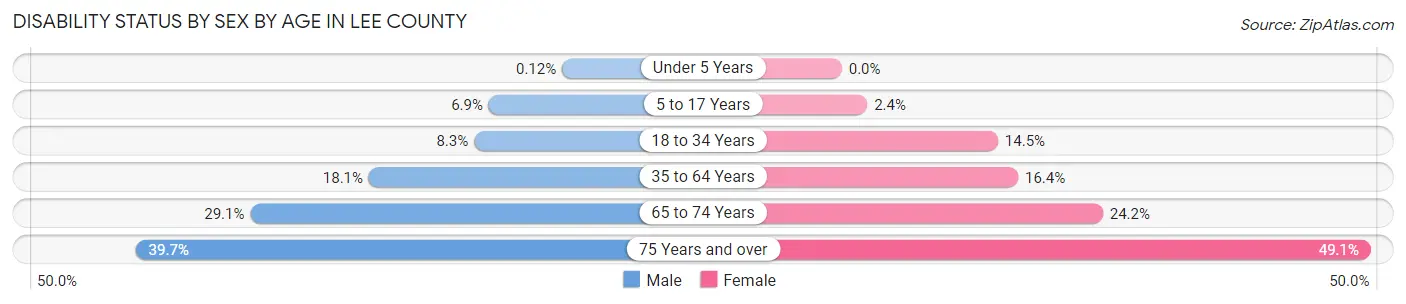
| Age Bracket | Male | Female |
| Under 5 Years | 1 (0.1%) | 0 (0.0%) |
| 5 to 17 Years | 180 (6.9%) | 58 (2.4%) |
| 18 to 34 Years | 270 (8.3%) | 424 (14.5%) |
| 35 to 64 Years | 1,124 (18.0%) | 986 (16.4%) |
| 65 to 74 Years | 508 (29.0%) | 475 (24.2%) |
| 75 Years and over | 456 (39.7%) | 753 (49.1%) |
Disability Class by Sex by Age in Lee County
Disability Class: Hearing Difficulty
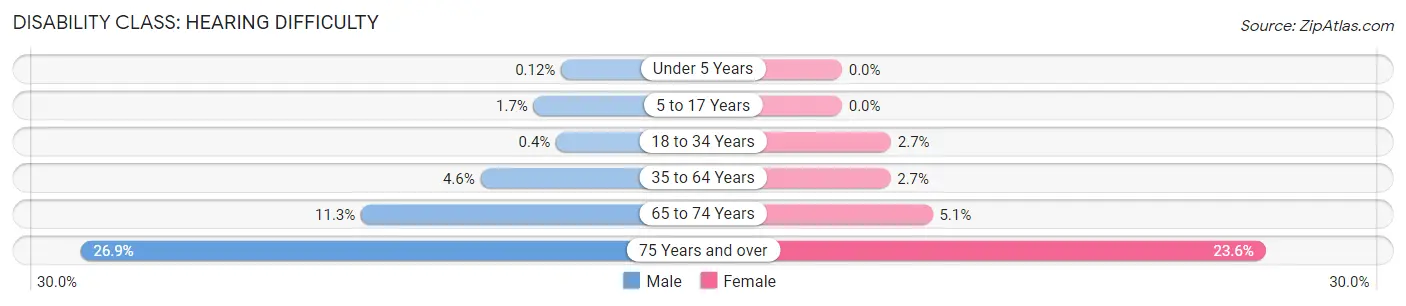
| Age Bracket | Male | Female |
| Under 5 Years | 1 (0.1%) | 0 (0.0%) |
| 5 to 17 Years | 43 (1.7%) | 0 (0.0%) |
| 18 to 34 Years | 13 (0.4%) | 80 (2.7%) |
| 35 to 64 Years | 287 (4.6%) | 163 (2.7%) |
| 65 to 74 Years | 197 (11.3%) | 99 (5.1%) |
| 75 Years and over | 309 (26.9%) | 362 (23.6%) |
Disability Class: Vision Difficulty
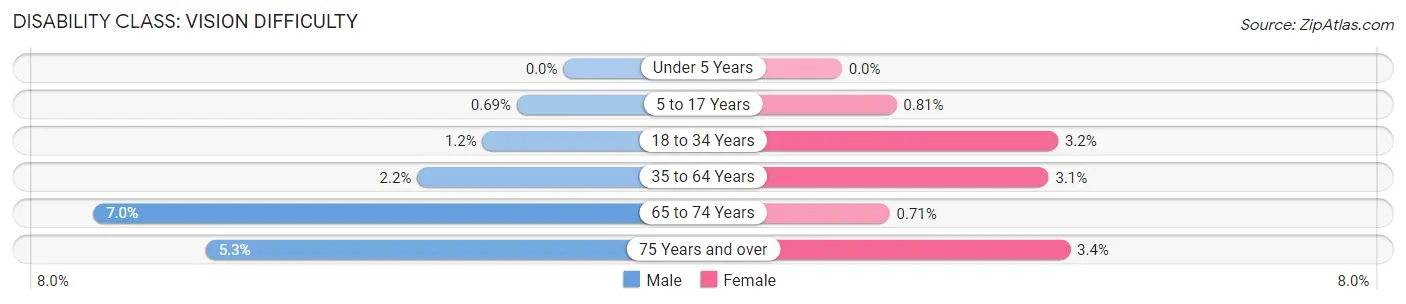
| Age Bracket | Male | Female |
| Under 5 Years | 0 (0.0%) | 0 (0.0%) |
| 5 to 17 Years | 18 (0.7%) | 20 (0.8%) |
| 18 to 34 Years | 39 (1.2%) | 94 (3.2%) |
| 35 to 64 Years | 135 (2.2%) | 185 (3.1%) |
| 65 to 74 Years | 122 (7.0%) | 14 (0.7%) |
| 75 Years and over | 61 (5.3%) | 52 (3.4%) |
Disability Class: Cognitive Difficulty
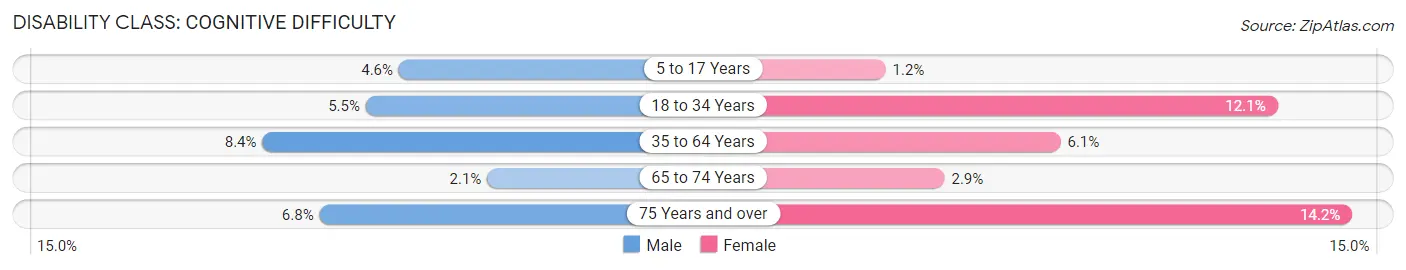
| Age Bracket | Male | Female |
| 5 to 17 Years | 119 (4.6%) | 30 (1.2%) |
| 18 to 34 Years | 179 (5.5%) | 355 (12.1%) |
| 35 to 64 Years | 522 (8.4%) | 367 (6.1%) |
| 65 to 74 Years | 37 (2.1%) | 56 (2.9%) |
| 75 Years and over | 78 (6.8%) | 218 (14.2%) |
Disability Class: Ambulatory Difficulty
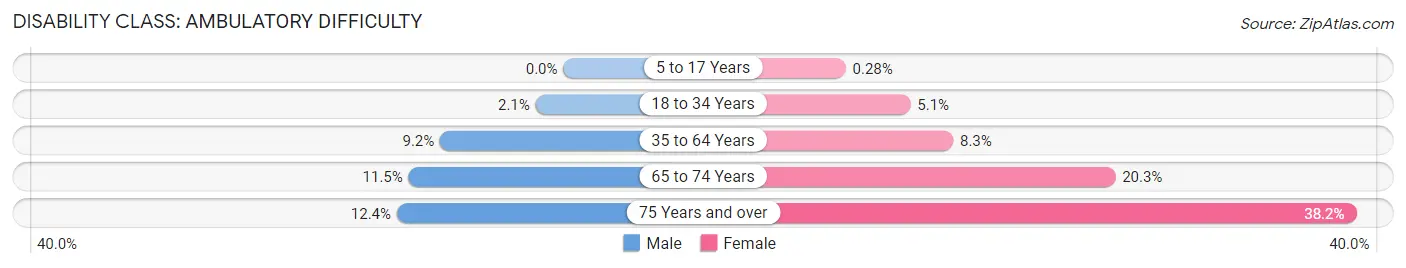
| Age Bracket | Male | Female |
| 5 to 17 Years | 0 (0.0%) | 7 (0.3%) |
| 18 to 34 Years | 67 (2.1%) | 149 (5.1%) |
| 35 to 64 Years | 570 (9.1%) | 498 (8.3%) |
| 65 to 74 Years | 201 (11.5%) | 398 (20.3%) |
| 75 Years and over | 142 (12.4%) | 586 (38.2%) |
Disability Class: Self-Care Difficulty
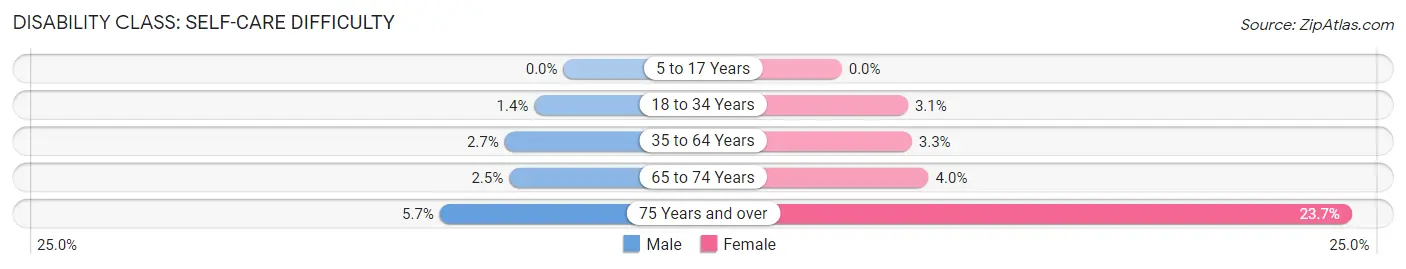
| Age Bracket | Male | Female |
| 5 to 17 Years | 0 (0.0%) | 0 (0.0%) |
| 18 to 34 Years | 44 (1.3%) | 90 (3.1%) |
| 35 to 64 Years | 170 (2.7%) | 196 (3.3%) |
| 65 to 74 Years | 44 (2.5%) | 79 (4.0%) |
| 75 Years and over | 66 (5.7%) | 363 (23.7%) |
Technology Access in Lee County
Computing Device Access in Lee County
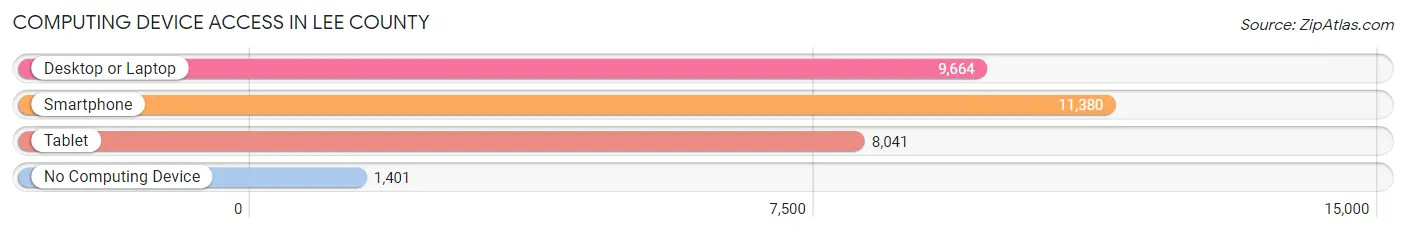
| Device Type | # Households | % Households |
| Desktop or Laptop | 9,664 | 70.7% |
| Smartphone | 11,380 | 83.3% |
| Tablet | 8,041 | 58.8% |
| No Computing Device | 1,401 | 10.2% |
| Total | 13,669 | 100.0% |
Internet Access in Lee County
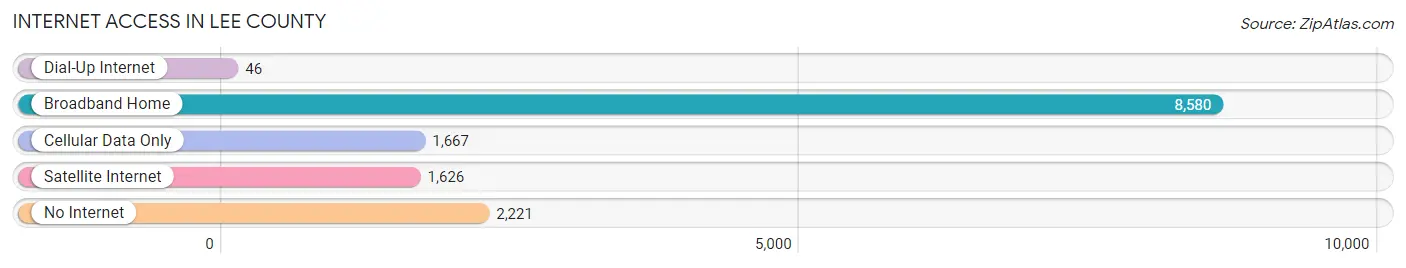
| Internet Type | # Households | % Households |
| Dial-Up Internet | 46 | 0.3% |
| Broadband Home | 8,580 | 62.8% |
| Cellular Data Only | 1,667 | 12.2% |
| Satellite Internet | 1,626 | 11.9% |
| No Internet | 2,221 | 16.3% |
| Total | 13,669 | 100.0% |
Lee County Summary
Lee County is located in the northwestern corner of Illinois, and is part of the Quad Cities metropolitan area. It is bordered by Whiteside County to the north, Ogle County to the east, DeKalb County to the south, and the Mississippi River to the west. The county seat is Dixon, and the largest city is Sterling.
History
Lee County was formed in 1839 from Ogle County. It was named after General Robert E. Lee, who was the commander of the Confederate Army during the Civil War. The first settlers in the area were mostly of English and German descent. The first county seat was located in Dixon, which was named after John Dixon, a local landowner.
In the late 19th century, the county experienced a period of rapid growth due to the construction of the Chicago, Milwaukee, St. Paul and Pacific Railroad. This railroad connected the county to the rest of the country, and allowed for the transportation of goods and people.
The county also experienced a period of industrial growth in the early 20th century. This was due to the construction of the Sterling-Rock Falls Bridge, which connected the two cities and allowed for the transportation of goods and people.
Geography
Lee County is located in the northwestern corner of Illinois, and is part of the Quad Cities metropolitan area. It is bordered by Whiteside County to the north, Ogle County to the east, DeKalb County to the south, and the Mississippi River to the west. The county has a total area of 545 square miles, of which 543 square miles is land and 2 square miles is water.
The county is mostly flat, with some rolling hills in the northern and western parts. The highest point in the county is located in the northern part, at an elevation of 890 feet. The county is drained by the Rock River, which flows through the western part of the county.
Economy
Lee County has a diverse economy, with a mix of manufacturing, agriculture, and services. The largest employers in the county are the manufacturing sector, which employs about 25% of the workforce, and the health care sector, which employs about 15%.
The manufacturing sector is dominated by the production of automotive parts, food products, and plastics. The health care sector is dominated by the presence of two major hospitals, KSB Hospital in Dixon and CGH Medical Center in Sterling.
Agriculture is also an important part of the economy, with the county being home to a number of farms. The most common crops grown in the county are corn, soybeans, and hay.
Demographics
As of the 2010 census, Lee County had a population of 36,031. The racial makeup of the county was 92.3% White, 3.2% Black or African American, 0.3% Native American, 0.7% Asian, 0.1% Pacific Islander, 1.7% from other races, and 1.9% from two or more races. Hispanic or Latino of any race were 4.3% of the population.
The median income for a household in the county was $50,945, and the median income for a family was $60,945. The per capita income for the county was $24,845. About 8.3% of families and 11.2% of the population were below the poverty line, including 15.2% of those under age 18 and 6.2% of those age 65 or over.
Common Questions
What is the Total Population of Lee County?
Total Population of Lee County is 34,221.
What is the Total Male Population of Lee County?
Total Male Population of Lee County is 18,205.
What is the Total Female Population of Lee County?
Total Female Population of Lee County is 16,016.
What is the Ratio of Males per 100 Females in Lee County?
There are 113.67 Males per 100 Females in Lee County.
What is the Ratio of Females per 100 Males in Lee County?
There are 87.98 Females per 100 Males in Lee County.
What is the Median Population Age in Lee County?
Median Population Age in Lee County is 42.8 Years.
What is the Average Family Size in Lee County
Average Family Size in Lee County is 2.9 People.
What is the Average Household Size in Lee County
Average Household Size in Lee County is 2.3 People.
What is Per Capita Income in Lee County?
Per Capita income in Lee County is $33,491.
What is the Median Family Income in Lee County?
Median Family Income in Lee County is $84,695.
What is the Median Household income in Lee County?
Median Household Income in Lee County is $64,588.
What is Income or Wage Gap in Lee County?
Income or Wage Gap in Lee County is 36.7%.
Women in Lee County earn 63.3 cents for every dollar earned by a man.
What is Family Income Deficit in Lee County?
Family Income Deficit in Lee County is $10,731.
Families that are below poverty line in Lee County earn $10,731 less on average than the poverty threshold level.
What is Inequality or Gini Index in Lee County?
Inequality or Gini Index in Lee County is 0.44.
How Large is the Labor Force in Lee County?
There are 15,846 People in the Labor Forcein in Lee County.
What is the Percentage of People in the Labor Force in Lee County?
56.0% of People are in the Labor Force in Lee County.
What is the Unemployment Rate in Lee County?
Unemployment Rate in Lee County is 3.5%.