LaSalle County, IL
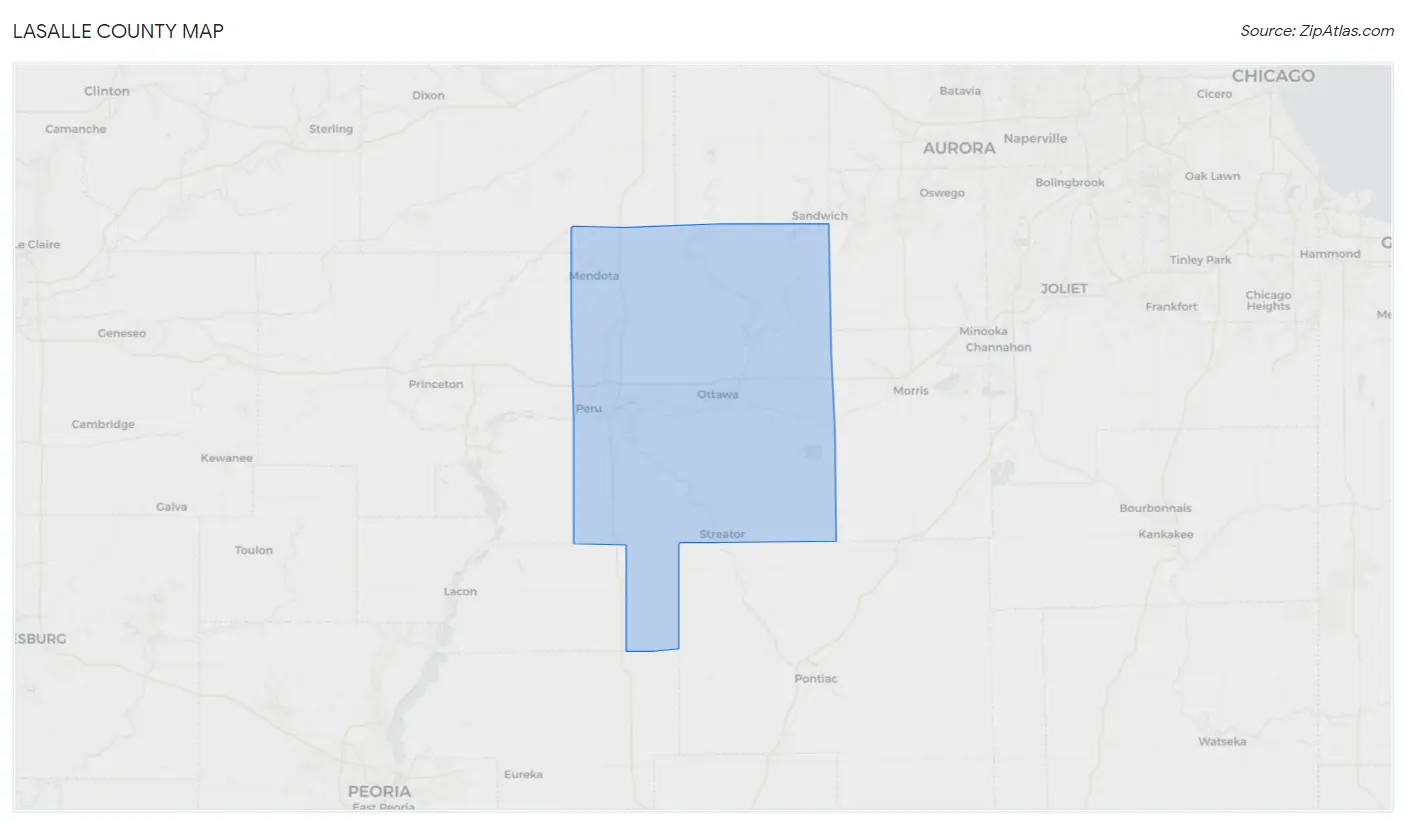
LaSalle County Map
LaSalle County Overview
109,495
TOTAL POPULATION
55,761
MALE POPULATION
53,734
FEMALE POPULATION
103.77
MALES / 100 FEMALES
96.36
FEMALES / 100 MALES
41.9
MEDIAN AGE
2.9
AVG FAMILY SIZE
2.4
AVG HOUSEHOLD SIZE
$36,060
PER CAPITA INCOME
$83,830
AVG FAMILY INCOME
$67,942
AVG HOUSEHOLD INCOME
42.7%
WAGE / INCOME GAP [ % ]
57.3¢/ $1
WAGE / INCOME GAP [ $ ]
$10,456
FAMILY INCOME DEFICIT
0.43
INEQUALITY / GINI INDEX
56,119
LABOR FORCE [ PEOPLE ]
62.8%
PERCENT IN LABOR FORCE
5.4%
UNEMPLOYMENT RATE
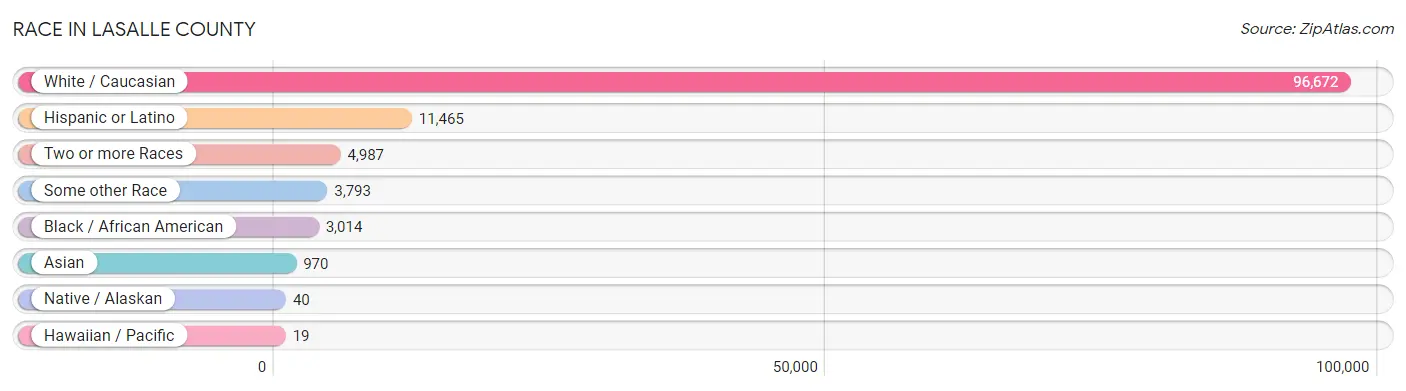
Race in LaSalle County
The most populous races in LaSalle County are White / Caucasian (96,672 | 88.3%), Hispanic or Latino (11,465 | 10.5%), and Two or more Races (4,987 | 4.5%).
| Race | # Population | % Population |
| Asian | 970 | 0.9% |
| Black / African American | 3,014 | 2.8% |
| Hawaiian / Pacific | 19 | 0.0% |
| Hispanic or Latino | 11,465 | 10.5% |
| Native / Alaskan | 40 | 0.0% |
| White / Caucasian | 96,672 | 88.3% |
| Two or more Races | 4,987 | 4.5% |
| Some other Race | 3,793 | 3.5% |
| Total | 109,495 | 100.0% |
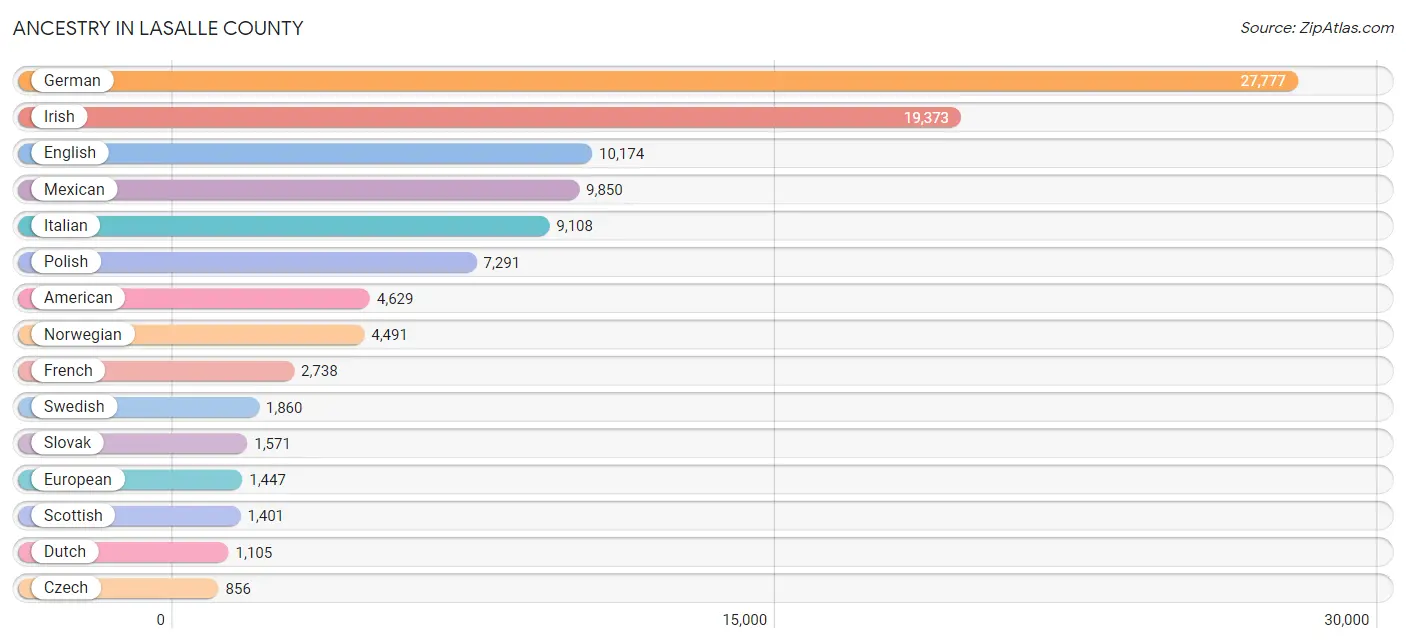
Ancestry in LaSalle County
The most populous ancestries reported in LaSalle County are German (27,777 | 25.4%), Irish (19,373 | 17.7%), English (10,174 | 9.3%), Mexican (9,850 | 9.0%), and Italian (9,108 | 8.3%), together accounting for 69.7% of all LaSalle County residents.
| Ancestry | # Population | % Population |
| African | 335 | 0.3% |
| Albanian | 50 | 0.1% |
| Aleut | 9 | 0.0% |
| Alsatian | 3 | 0.0% |
| American | 4,629 | 4.2% |
| Apache | 27 | 0.0% |
| Arab | 181 | 0.2% |
| Argentinean | 6 | 0.0% |
| Assyrian / Chaldean / Syriac | 11 | 0.0% |
| Australian | 38 | 0.0% |
| Austrian | 440 | 0.4% |
| Basque | 11 | 0.0% |
| Belgian | 205 | 0.2% |
| Bhutanese | 307 | 0.3% |
| Blackfeet | 16 | 0.0% |
| Bolivian | 16 | 0.0% |
| Brazilian | 30 | 0.0% |
| British | 218 | 0.2% |
| Bulgarian | 7 | 0.0% |
| Burmese | 26 | 0.0% |
| Canadian | 114 | 0.1% |
| Central American | 146 | 0.1% |
| Central American Indian | 48 | 0.0% |
| Cherokee | 132 | 0.1% |
| Cheyenne | 3 | 0.0% |
| Chilean | 43 | 0.0% |
| Chinese | 2 | 0.0% |
| Chippewa | 4 | 0.0% |
| Choctaw | 7 | 0.0% |
| Colombian | 18 | 0.0% |
| Costa Rican | 29 | 0.0% |
| Creek | 1 | 0.0% |
| Croatian | 189 | 0.2% |
| Crow | 7 | 0.0% |
| Cuban | 114 | 0.1% |
| Czech | 856 | 0.8% |
| Czechoslovakian | 162 | 0.2% |
| Danish | 468 | 0.4% |
| Dominican | 31 | 0.0% |
| Dutch | 1,105 | 1.0% |
| Eastern European | 111 | 0.1% |
| Ecuadorian | 2 | 0.0% |
| Egyptian | 165 | 0.2% |
| English | 10,174 | 9.3% |
| European | 1,447 | 1.3% |
| Filipino | 88 | 0.1% |
| Finnish | 101 | 0.1% |
| French | 2,738 | 2.5% |
| French Canadian | 265 | 0.2% |
| German | 27,777 | 25.4% |
| Ghanaian | 44 | 0.0% |
| Greek | 426 | 0.4% |
| Guatemalan | 45 | 0.0% |
| Haitian | 18 | 0.0% |
| Hungarian | 452 | 0.4% |
| Indian (Asian) | 80 | 0.1% |
| Iranian | 8 | 0.0% |
| Irish | 19,373 | 17.7% |
| Iroquois | 15 | 0.0% |
| Israeli | 12 | 0.0% |
| Italian | 9,108 | 8.3% |
| Jamaican | 31 | 0.0% |
| Japanese | 7 | 0.0% |
| Korean | 498 | 0.4% |
| Latvian | 43 | 0.0% |
| Lebanese | 164 | 0.2% |
| Lithuanian | 614 | 0.6% |
| Luxembourger | 83 | 0.1% |
| Macedonian | 11 | 0.0% |
| Menominee | 6 | 0.0% |
| Mexican | 9,850 | 9.0% |
| Mexican American Indian | 53 | 0.1% |
| Native Hawaiian | 68 | 0.1% |
| Navajo | 3 | 0.0% |
| New Zealander | 16 | 0.0% |
| Nicaraguan | 8 | 0.0% |
| Nigerian | 8 | 0.0% |
| Northern European | 59 | 0.1% |
| Norwegian | 4,491 | 4.1% |
| Osage | 1 | 0.0% |
| Pakistani | 23 | 0.0% |
| Pennsylvania German | 43 | 0.0% |
| Polish | 7,291 | 6.7% |
| Portuguese | 157 | 0.1% |
| Potawatomi | 15 | 0.0% |
| Puerto Rican | 618 | 0.6% |
| Romanian | 179 | 0.2% |
| Russian | 352 | 0.3% |
| Salvadoran | 64 | 0.1% |
| Samoan | 3 | 0.0% |
| Scandinavian | 241 | 0.2% |
| Scotch-Irish | 838 | 0.8% |
| Scottish | 1,401 | 1.3% |
| Serbian | 30 | 0.0% |
| Sioux | 36 | 0.0% |
| Slavic | 231 | 0.2% |
| Slovak | 1,571 | 1.4% |
| Slovene | 680 | 0.6% |
| Somali | 56 | 0.1% |
| South American | 94 | 0.1% |
| Soviet Union | 2 | 0.0% |
| Spaniard | 67 | 0.1% |
| Spanish | 73 | 0.1% |
| Subsaharan African | 443 | 0.4% |
| Swedish | 1,860 | 1.7% |
| Swiss | 72 | 0.1% |
| Syrian | 3 | 0.0% |
| Thai | 408 | 0.4% |
| Tohono O'Odham | 4 | 0.0% |
| Turkish | 63 | 0.1% |
| Ukrainian | 92 | 0.1% |
| Venezuelan | 9 | 0.0% |
| Welsh | 628 | 0.6% |
| Yugoslavian | 75 | 0.1% | View All 114 Rows |
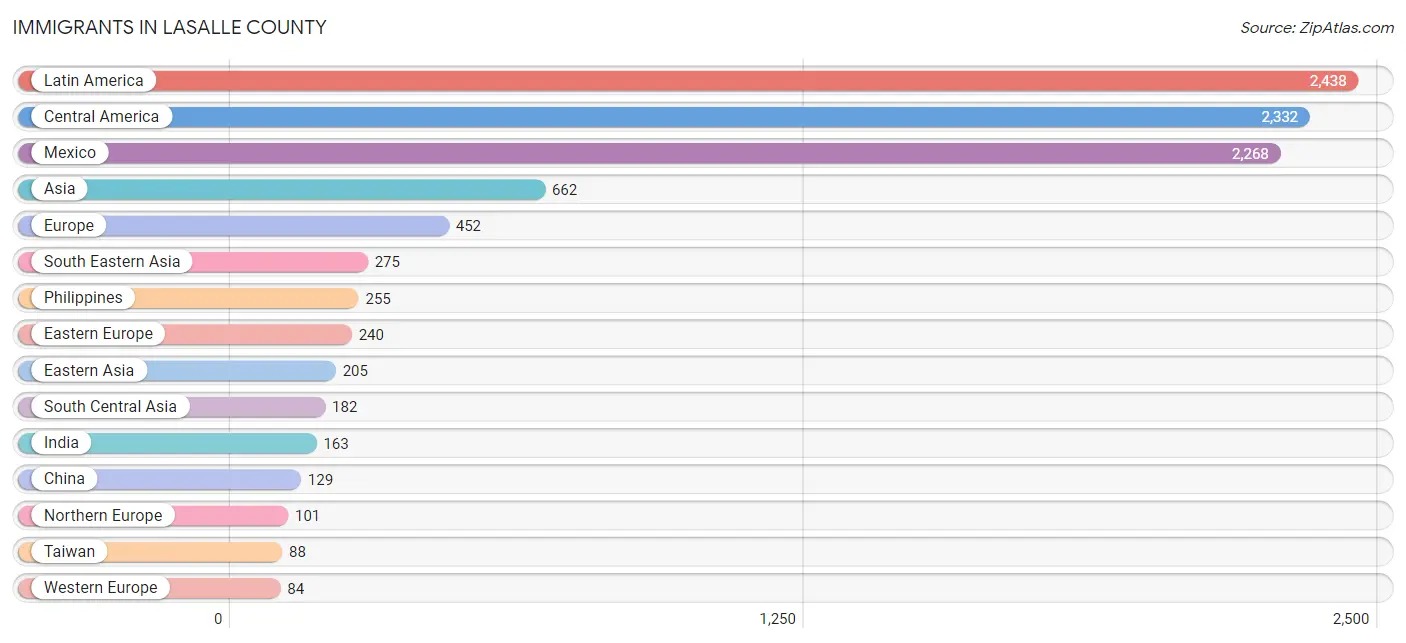
Immigrants in LaSalle County
The most numerous immigrant groups reported in LaSalle County came from Latin America (2,438 | 2.2%), Central America (2,332 | 2.1%), Mexico (2,268 | 2.1%), Asia (662 | 0.6%), and Europe (452 | 0.4%), together accounting for 7.4% of all LaSalle County residents.
| Immigration Origin | # Population | % Population |
| Africa | 82 | 0.1% |
| Argentina | 28 | 0.0% |
| Asia | 662 | 0.6% |
| Australia | 4 | 0.0% |
| Bolivia | 3 | 0.0% |
| Bosnia and Herzegovina | 23 | 0.0% |
| Brazil | 1 | 0.0% |
| Canada | 37 | 0.0% |
| Caribbean | 25 | 0.0% |
| Central America | 2,332 | 2.1% |
| Chile | 16 | 0.0% |
| China | 129 | 0.1% |
| Colombia | 18 | 0.0% |
| Croatia | 11 | 0.0% |
| Cuba | 6 | 0.0% |
| Eastern Africa | 29 | 0.0% |
| Eastern Asia | 205 | 0.2% |
| Eastern Europe | 240 | 0.2% |
| Ecuador | 6 | 0.0% |
| Egypt | 1 | 0.0% |
| El Salvador | 31 | 0.0% |
| England | 48 | 0.0% |
| Europe | 452 | 0.4% |
| Germany | 59 | 0.1% |
| Ghana | 46 | 0.0% |
| Greece | 3 | 0.0% |
| Guatemala | 33 | 0.0% |
| Haiti | 19 | 0.0% |
| Hong Kong | 26 | 0.0% |
| Hungary | 15 | 0.0% |
| India | 163 | 0.2% |
| Japan | 53 | 0.1% |
| Kenya | 29 | 0.0% |
| Korea | 23 | 0.0% |
| Latin America | 2,438 | 2.2% |
| Mexico | 2,268 | 2.1% |
| Moldova | 2 | 0.0% |
| Netherlands | 22 | 0.0% |
| North Macedonia | 3 | 0.0% |
| Northern Africa | 4 | 0.0% |
| Northern Europe | 101 | 0.1% |
| Oceania | 12 | 0.0% |
| Pakistan | 19 | 0.0% |
| Philippines | 255 | 0.2% |
| Poland | 64 | 0.1% |
| Portugal | 24 | 0.0% |
| Russia | 57 | 0.1% |
| South America | 81 | 0.1% |
| South Central Asia | 182 | 0.2% |
| South Eastern Asia | 275 | 0.3% |
| Southern Europe | 27 | 0.0% |
| Switzerland | 3 | 0.0% |
| Taiwan | 88 | 0.1% |
| Thailand | 20 | 0.0% |
| Ukraine | 40 | 0.0% |
| Venezuela | 9 | 0.0% |
| Western Africa | 46 | 0.0% |
| Western Europe | 84 | 0.1% | View All 58 Rows |
Sex and Age in LaSalle County
Sex and Age in LaSalle County
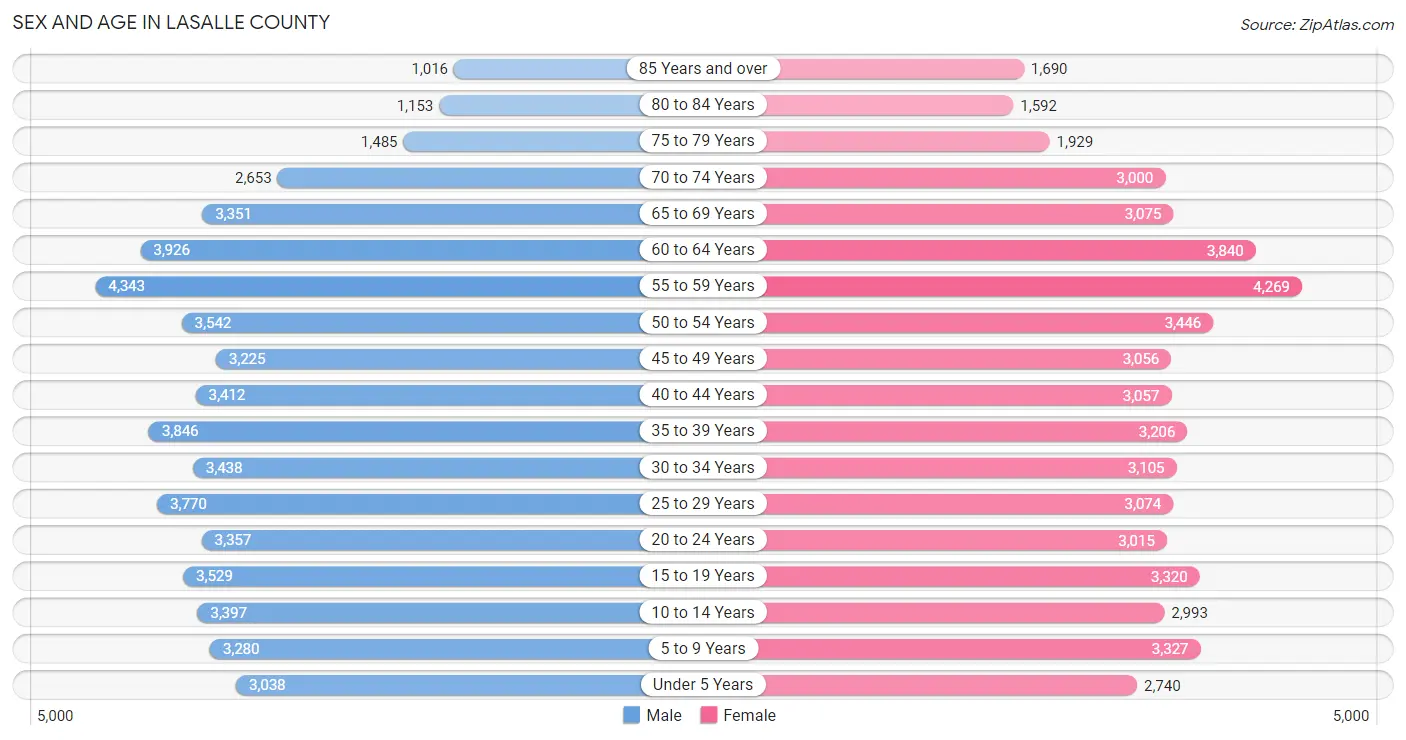
The most populous age groups in LaSalle County are 55 to 59 Years (4,343 | 7.8%) for men and 55 to 59 Years (4,269 | 7.9%) for women.
| Age Bracket | Male | Female |
| Under 5 Years | 3,038 (5.4%) | 2,740 (5.1%) |
| 5 to 9 Years | 3,280 (5.9%) | 3,327 (6.2%) |
| 10 to 14 Years | 3,397 (6.1%) | 2,993 (5.6%) |
| 15 to 19 Years | 3,529 (6.3%) | 3,320 (6.2%) |
| 20 to 24 Years | 3,357 (6.0%) | 3,015 (5.6%) |
| 25 to 29 Years | 3,770 (6.8%) | 3,074 (5.7%) |
| 30 to 34 Years | 3,438 (6.2%) | 3,105 (5.8%) |
| 35 to 39 Years | 3,846 (6.9%) | 3,206 (6.0%) |
| 40 to 44 Years | 3,412 (6.1%) | 3,057 (5.7%) |
| 45 to 49 Years | 3,225 (5.8%) | 3,056 (5.7%) |
| 50 to 54 Years | 3,542 (6.4%) | 3,446 (6.4%) |
| 55 to 59 Years | 4,343 (7.8%) | 4,269 (7.9%) |
| 60 to 64 Years | 3,926 (7.0%) | 3,840 (7.1%) |
| 65 to 69 Years | 3,351 (6.0%) | 3,075 (5.7%) |
| 70 to 74 Years | 2,653 (4.8%) | 3,000 (5.6%) |
| 75 to 79 Years | 1,485 (2.7%) | 1,929 (3.6%) |
| 80 to 84 Years | 1,153 (2.1%) | 1,592 (3.0%) |
| 85 Years and over | 1,016 (1.8%) | 1,690 (3.2%) |
| Total | 55,761 (100.0%) | 53,734 (100.0%) |
Families and Households in LaSalle County
Median Family Size in LaSalle County
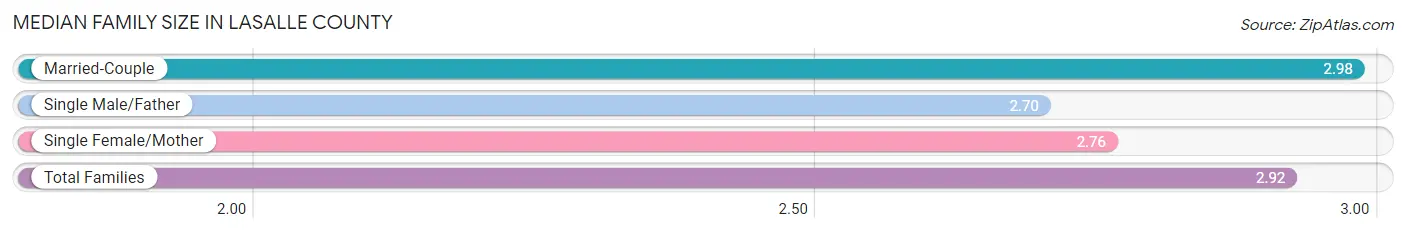
The median family size in LaSalle County is 2.92 persons per family, with married-couple families (21,555 | 74.5%) accounting for the largest median family size of 2.98 persons per family. On the other hand, single male/father families (1,899 | 6.6%) represent the smallest median family size with 2.70 persons per family.
| Family Type | # Families | Family Size |
| Married-Couple | 21,555 (74.5%) | 2.98 |
| Single Male/Father | 1,899 (6.6%) | 2.70 |
| Single Female/Mother | 5,468 (18.9%) | 2.76 |
| Total Families | 28,922 (100.0%) | 2.92 |
Median Household Size in LaSalle County
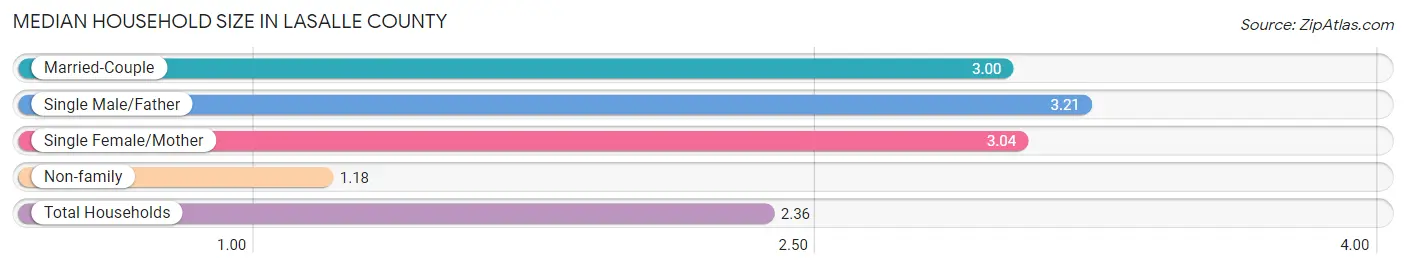
The median household size in LaSalle County is 2.36 persons per household, with single male/father households (1,899 | 4.2%) accounting for the largest median household size of 3.21 persons per household. non-family households (16,208 | 35.9%) represent the smallest median household size with 1.18 persons per household.
| Household Type | # Households | Household Size |
| Married-Couple | 21,555 (47.8%) | 3.00 |
| Single Male/Father | 1,899 (4.2%) | 3.21 |
| Single Female/Mother | 5,468 (12.1%) | 3.04 |
| Non-family | 16,208 (35.9%) | 1.18 |
| Total Households | 45,130 (100.0%) | 2.36 |
Household Size by Marriage Status in LaSalle County
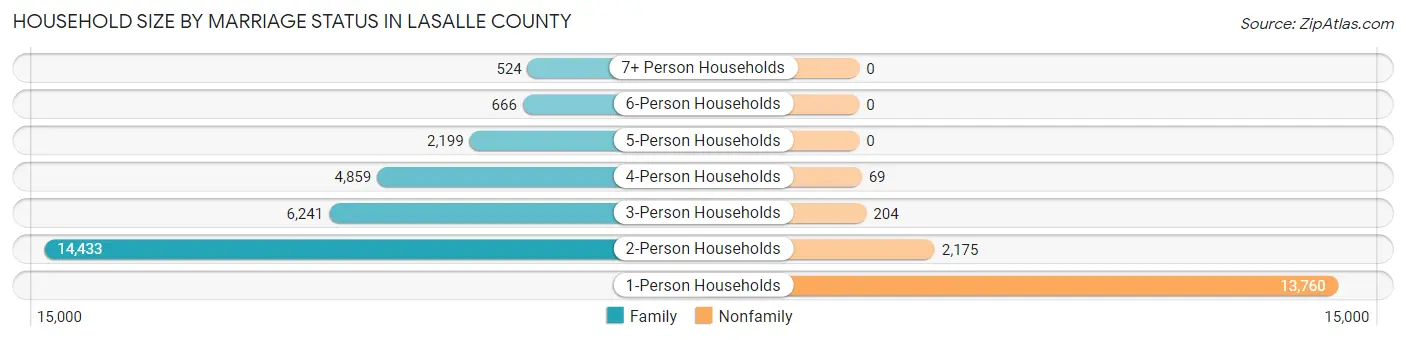
Out of a total of 45,130 households in LaSalle County, 28,922 (64.1%) are family households, while 16,208 (35.9%) are nonfamily households. The most numerous type of family households are 2-person households, comprising 14,433, and the most common type of nonfamily households are 1-person households, comprising 13,760.
| Household Size | Family Households | Nonfamily Households |
| 1-Person Households | - | 13,760 (30.5%) |
| 2-Person Households | 14,433 (32.0%) | 2,175 (4.8%) |
| 3-Person Households | 6,241 (13.8%) | 204 (0.4%) |
| 4-Person Households | 4,859 (10.8%) | 69 (0.2%) |
| 5-Person Households | 2,199 (4.9%) | 0 (0.0%) |
| 6-Person Households | 666 (1.5%) | 0 (0.0%) |
| 7+ Person Households | 524 (1.2%) | 0 (0.0%) |
| Total | 28,922 (64.1%) | 16,208 (35.9%) |
Female Fertility in LaSalle County
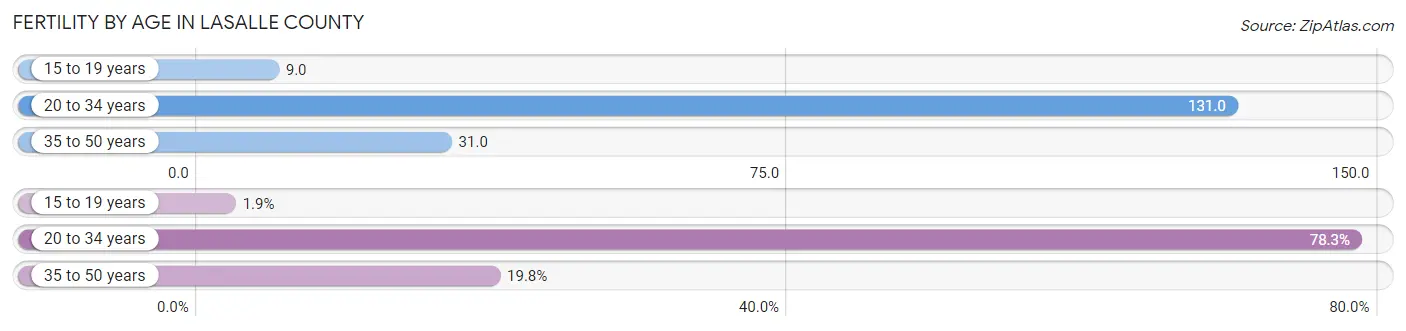
Fertility by Age in LaSalle County
Average fertility rate in LaSalle County is 69.0 births per 1,000 women. Women in the age bracket of 20 to 34 years have the highest fertility rate with 131.0 births per 1,000 women. Women in the age bracket of 20 to 34 years acount for 78.3% of all women with births.
| Age Bracket | Women with Births | Births / 1,000 Women |
| 15 to 19 years | 29 (1.9%) | 9.0 |
| 20 to 34 years | 1,209 (78.3%) | 131.0 |
| 35 to 50 years | 306 (19.8%) | 31.0 |
| Total | 1,544 (100.0%) | 69.0 |
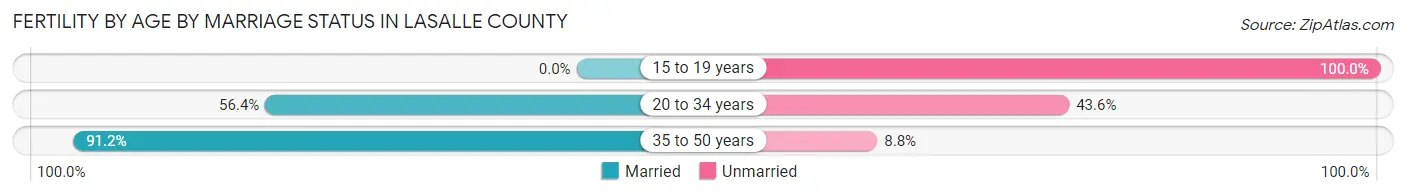
Fertility by Age by Marriage Status in LaSalle County
62.2% of women with births (1,544) in LaSalle County are married. The highest percentage of unmarried women with births falls into 15 to 19 years age bracket with 100.0% of them unmarried at the time of birth, while the lowest percentage of unmarried women with births belong to 35 to 50 years age bracket with 8.8% of them unmarried.
| Age Bracket | Married | Unmarried |
| 15 to 19 years | 0 (0.0%) | 29 (100.0%) |
| 20 to 34 years | 682 (56.4%) | 527 (43.6%) |
| 35 to 50 years | 279 (91.2%) | 27 (8.8%) |
| Total | 960 (62.2%) | 584 (37.8%) |
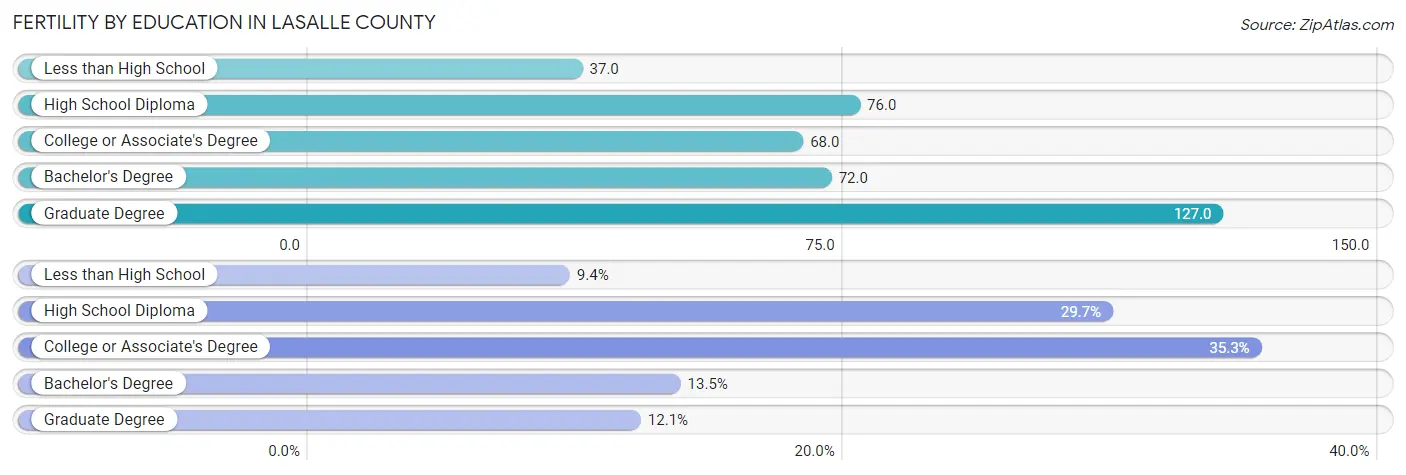
Fertility by Education in LaSalle County
Average fertility rate in LaSalle County is 69.0 births per 1,000 women. Women with the education attainment of graduate degree have the highest fertility rate of 127.0 births per 1,000 women, while women with the education attainment of less than high school have the lowest fertility at 37.0 births per 1,000 women. Women with the education attainment of college or associate's degree represent 35.3% of all women with births.
| Educational Attainment | Women with Births | Births / 1,000 Women |
| Less than High School | 145 (9.4%) | 37.0 |
| High School Diploma | 459 (29.7%) | 76.0 |
| College or Associate's Degree | 545 (35.3%) | 68.0 |
| Bachelor's Degree | 209 (13.5%) | 72.0 |
| Graduate Degree | 186 (12.0%) | 127.0 |
| Total | 1,544 (100.0%) | 69.0 |
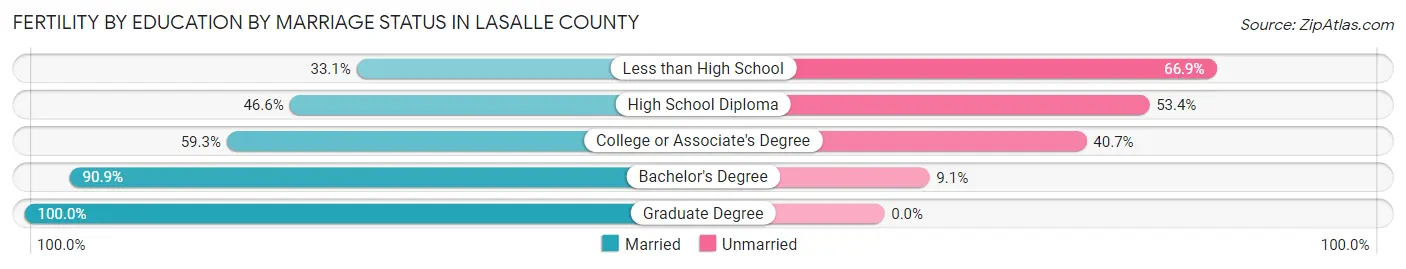
Fertility by Education by Marriage Status in LaSalle County
37.8% of women with births in LaSalle County are unmarried. Women with the educational attainment of graduate degree are most likely to be married with 100.0% of them married at childbirth, while women with the educational attainment of less than high school are least likely to be married with 66.9% of them unmarried at childbirth.
| Educational Attainment | Married | Unmarried |
| Less than High School | 48 (33.1%) | 97 (66.9%) |
| High School Diploma | 214 (46.6%) | 245 (53.4%) |
| College or Associate's Degree | 323 (59.3%) | 222 (40.7%) |
| Bachelor's Degree | 190 (90.9%) | 19 (9.1%) |
| Graduate Degree | 186 (100.0%) | 0 (0.0%) |
| Total | 960 (62.2%) | 584 (37.8%) |
Income in LaSalle County
Income Overview in LaSalle County
Per Capita Income in LaSalle County is $36,060, while median incomes of families and households are $83,830 and $67,942 respectively.
| Characteristic | Number | Measure |
| Per Capita Income | 109,495 | $36,060 |
| Median Family Income | 28,922 | $83,830 |
| Mean Family Income | 28,922 | $101,583 |
| Median Household Income | 45,130 | $67,942 |
| Mean Household Income | 45,130 | $85,086 |
| Income Deficit | 28,922 | $10,456 |
| Wage / Income Gap (%) | 109,495 | 42.69% |
| Wage / Income Gap ($) | 109,495 | 57.31¢ per $1 |
| Gini / Inequality Index | 109,495 | 0.43 |
Earnings by Sex in LaSalle County
Average Earnings in LaSalle County are $39,007, $51,523 for men and $29,526 for women, a difference of 42.7%.
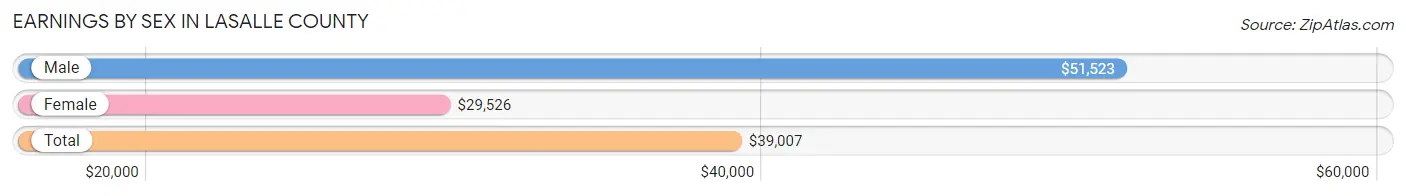
| Sex | Number | Average Earnings |
| Male | 31,254 (53.8%) | $51,523 |
| Female | 26,785 (46.2%) | $29,526 |
| Total | 58,039 (100.0%) | $39,007 |
Earnings by Sex by Income Bracket in LaSalle County
The most common earnings brackets in LaSalle County are $100,000+ for men (4,859 | 15.5%) and $30,000 to $34,999 for women (2,267 | 8.5%).
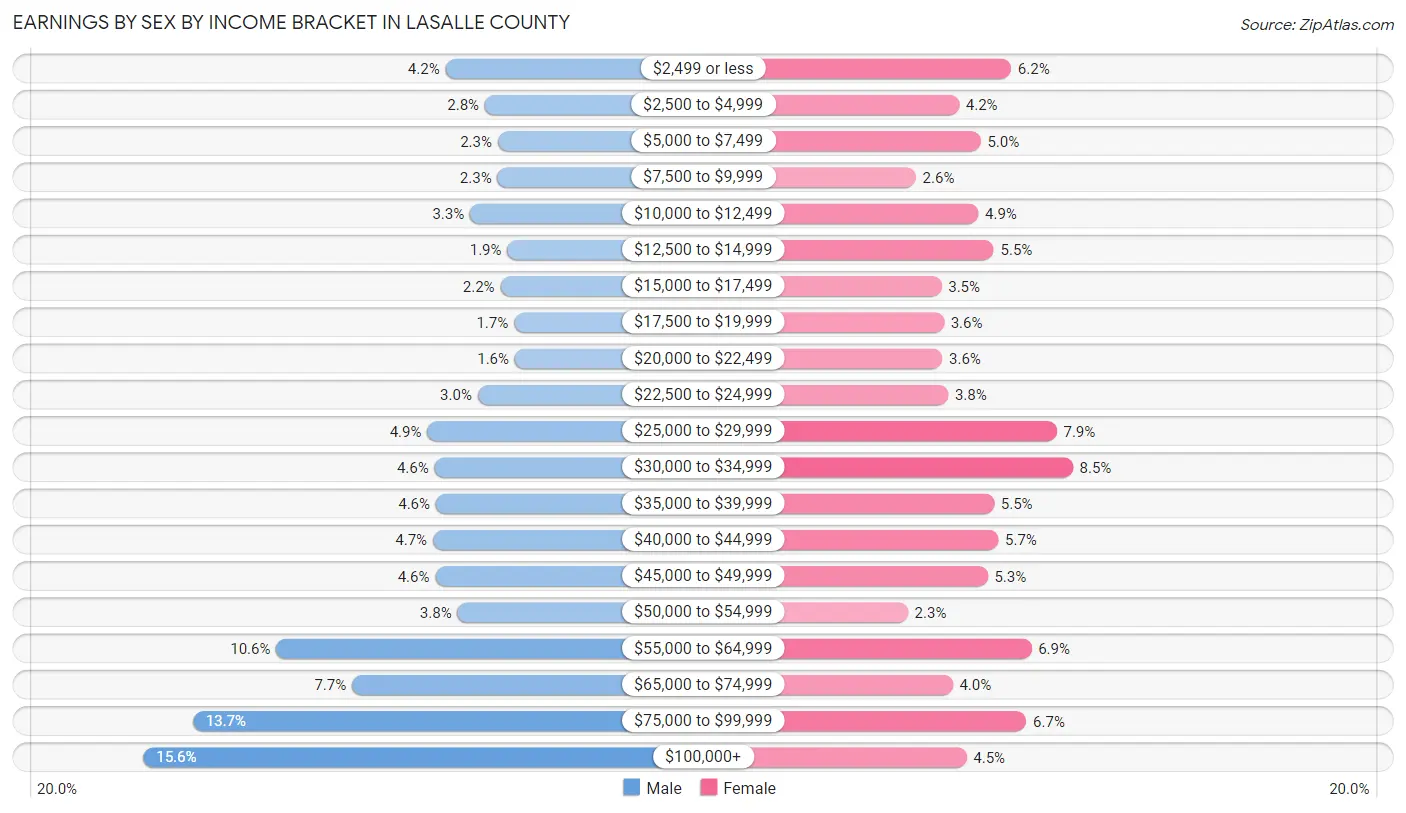
| Income | Male | Female |
| $2,499 or less | 1,321 (4.2%) | 1,646 (6.1%) |
| $2,500 to $4,999 | 860 (2.8%) | 1,126 (4.2%) |
| $5,000 to $7,499 | 711 (2.3%) | 1,341 (5.0%) |
| $7,500 to $9,999 | 712 (2.3%) | 690 (2.6%) |
| $10,000 to $12,499 | 1,033 (3.3%) | 1,317 (4.9%) |
| $12,500 to $14,999 | 598 (1.9%) | 1,473 (5.5%) |
| $15,000 to $17,499 | 677 (2.2%) | 948 (3.5%) |
| $17,500 to $19,999 | 518 (1.7%) | 972 (3.6%) |
| $20,000 to $22,499 | 509 (1.6%) | 957 (3.6%) |
| $22,500 to $24,999 | 943 (3.0%) | 1,015 (3.8%) |
| $25,000 to $29,999 | 1,536 (4.9%) | 2,104 (7.9%) |
| $30,000 to $34,999 | 1,450 (4.6%) | 2,267 (8.5%) |
| $35,000 to $39,999 | 1,434 (4.6%) | 1,475 (5.5%) |
| $40,000 to $44,999 | 1,470 (4.7%) | 1,520 (5.7%) |
| $45,000 to $49,999 | 1,440 (4.6%) | 1,411 (5.3%) |
| $50,000 to $54,999 | 1,180 (3.8%) | 611 (2.3%) |
| $55,000 to $64,999 | 3,303 (10.6%) | 1,852 (6.9%) |
| $65,000 to $74,999 | 2,417 (7.7%) | 1,061 (4.0%) |
| $75,000 to $99,999 | 4,283 (13.7%) | 1,799 (6.7%) |
| $100,000+ | 4,859 (15.5%) | 1,200 (4.5%) |
| Total | 31,254 (100.0%) | 26,785 (100.0%) |
Earnings by Sex by Educational Attainment in LaSalle County
Average earnings in LaSalle County are $58,426 for men and $33,185 for women, a difference of 43.2%. Men with an educational attainment of graduate degree enjoy the highest average annual earnings of $89,279, while those with less than high school education earn the least with $35,709. Women with an educational attainment of graduate degree earn the most with the average annual earnings of $64,233, while those with less than high school education have the smallest earnings of $23,724.
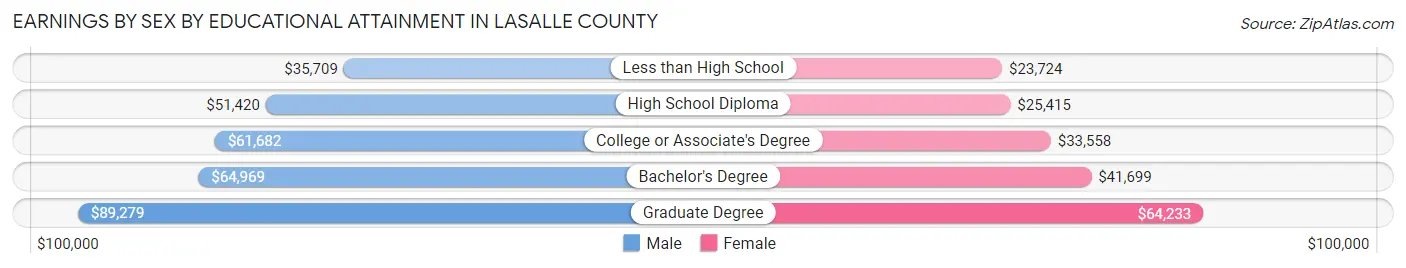
| Educational Attainment | Male Income | Female Income |
| Less than High School | $35,709 | $23,724 |
| High School Diploma | $51,420 | $25,415 |
| College or Associate's Degree | $61,682 | $33,558 |
| Bachelor's Degree | $64,969 | $41,699 |
| Graduate Degree | $89,279 | $64,233 |
| Total | $58,426 | $33,185 |
Family Income in LaSalle County
Family Income Brackets in LaSalle County
According to the LaSalle County family income data, there are 6,103 families falling into the $100,000 to $149,999 income range, which is the most common income bracket and makes up 21.1% of all families. Conversely, the $10,000 to $14,999 income bracket is the least frequent group with only 810 families (2.8%) belonging to this category.
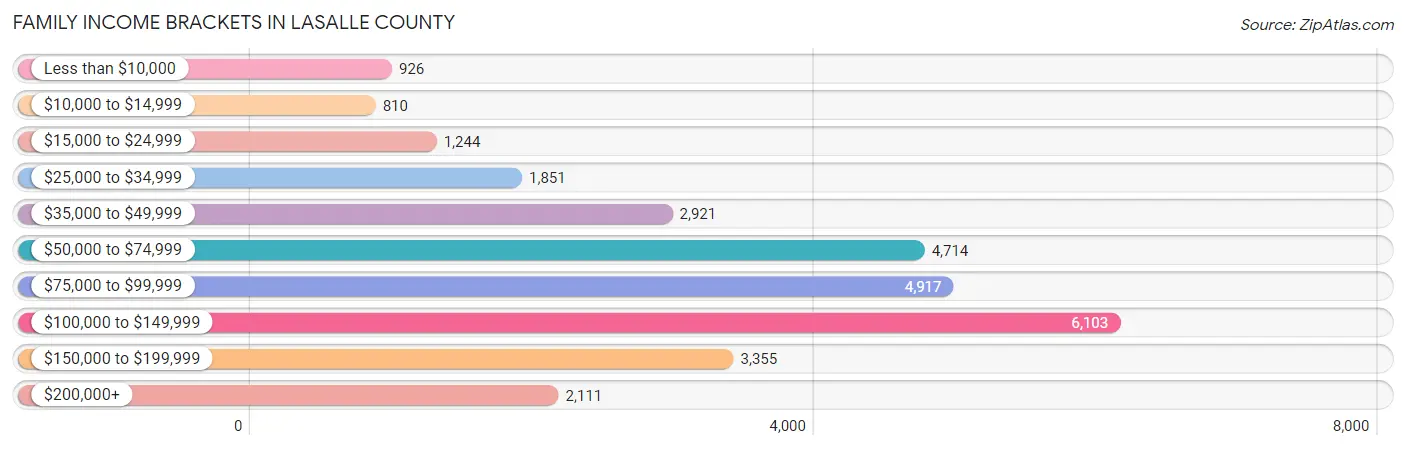
| Income Bracket | # Families | % Families |
| Less than $10,000 | 926 | 3.2% |
| $10,000 to $14,999 | 810 | 2.8% |
| $15,000 to $24,999 | 1,244 | 4.3% |
| $25,000 to $34,999 | 1,851 | 6.4% |
| $35,000 to $49,999 | 2,921 | 10.1% |
| $50,000 to $74,999 | 4,714 | 16.3% |
| $75,000 to $99,999 | 4,917 | 17.0% |
| $100,000 to $149,999 | 6,103 | 21.1% |
| $150,000 to $199,999 | 3,355 | 11.6% |
| $200,000+ | 2,111 | 7.3% |
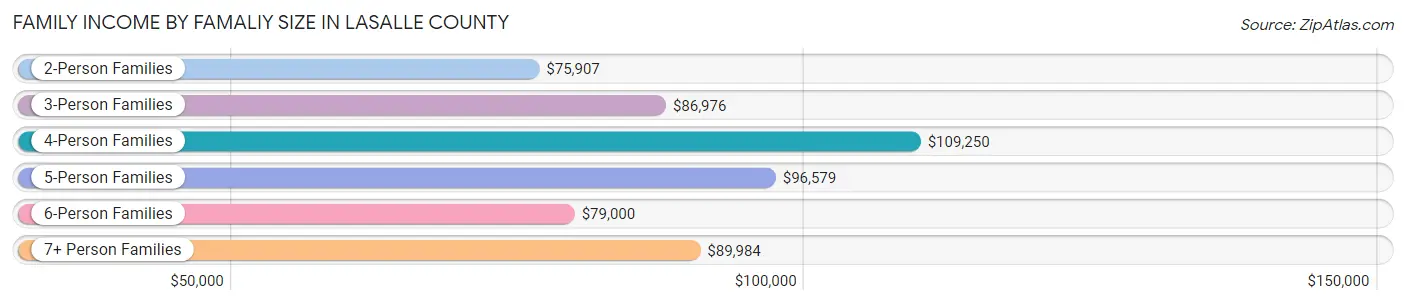
Family Income by Famaliy Size in LaSalle County
4-person families (4,345 | 15.0%) account for the highest median family income in LaSalle County with $109,250 per family, while 2-person families (15,287 | 52.9%) have the highest median income of $37,954 per family member.
| Income Bracket | # Families | Median Income |
| 2-Person Families | 15,287 (52.9%) | $75,907 |
| 3-Person Families | 6,310 (21.8%) | $86,976 |
| 4-Person Families | 4,345 (15.0%) | $109,250 |
| 5-Person Families | 2,039 (7.0%) | $96,579 |
| 6-Person Families | 618 (2.1%) | $79,000 |
| 7+ Person Families | 323 (1.1%) | $89,984 |
| Total | 28,922 (100.0%) | $83,830 |
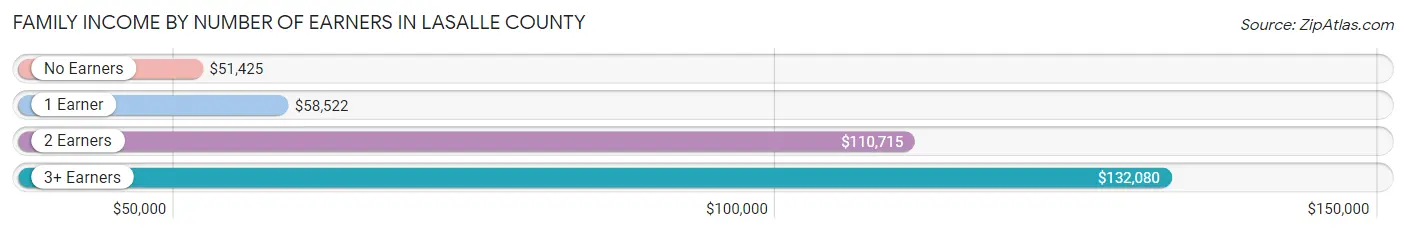
Family Income by Number of Earners in LaSalle County
The median family income in LaSalle County is $83,830, with families comprising 3+ earners (3,360) having the highest median family income of $132,080, while families with no earners (4,718) have the lowest median family income of $51,425, accounting for 11.6% and 16.3% of families, respectively.
| Number of Earners | # Families | Median Income |
| No Earners | 4,718 (16.3%) | $51,425 |
| 1 Earner | 9,683 (33.5%) | $58,522 |
| 2 Earners | 11,161 (38.6%) | $110,715 |
| 3+ Earners | 3,360 (11.6%) | $132,080 |
| Total | 28,922 (100.0%) | $83,830 |
Household Income in LaSalle County
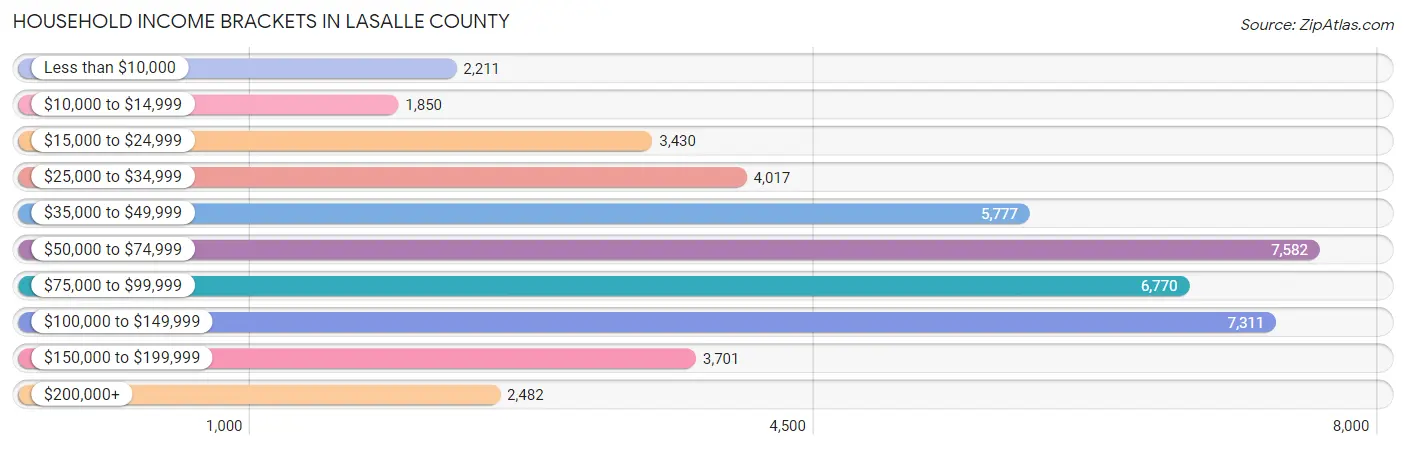
Household Income Brackets in LaSalle County
With 7,582 households falling in the category, the $50,000 to $74,999 income range is the most frequent in LaSalle County, accounting for 16.8% of all households. In contrast, only 1,850 households (4.1%) fall into the $10,000 to $14,999 income bracket, making it the least populous group.
| Income Bracket | # Households | % Households |
| Less than $10,000 | 2,211 | 4.9% |
| $10,000 to $14,999 | 1,850 | 4.1% |
| $15,000 to $24,999 | 3,430 | 7.6% |
| $25,000 to $34,999 | 4,017 | 8.9% |
| $35,000 to $49,999 | 5,777 | 12.8% |
| $50,000 to $74,999 | 7,582 | 16.8% |
| $75,000 to $99,999 | 6,770 | 15.0% |
| $100,000 to $149,999 | 7,311 | 16.2% |
| $150,000 to $199,999 | 3,701 | 8.2% |
| $200,000+ | 2,482 | 5.5% |
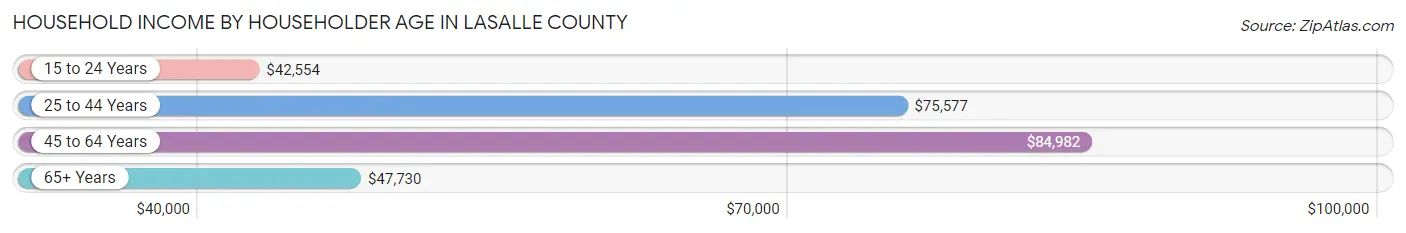
Household Income by Householder Age in LaSalle County
The median household income in LaSalle County is $67,942, with the highest median household income of $84,982 found in the 45 to 64 years age bracket for the primary householder. A total of 16,725 households (37.1%) fall into this category. Meanwhile, the 15 to 24 years age bracket for the primary householder has the lowest median household income of $42,554, with 1,717 households (3.8%) in this group.
| Income Bracket | # Households | Median Income |
| 15 to 24 Years | 1,717 (3.8%) | $42,554 |
| 25 to 44 Years | 13,098 (29.0%) | $75,577 |
| 45 to 64 Years | 16,725 (37.1%) | $84,982 |
| 65+ Years | 13,590 (30.1%) | $47,730 |
| Total | 45,130 (100.0%) | $67,942 |
Poverty in LaSalle County
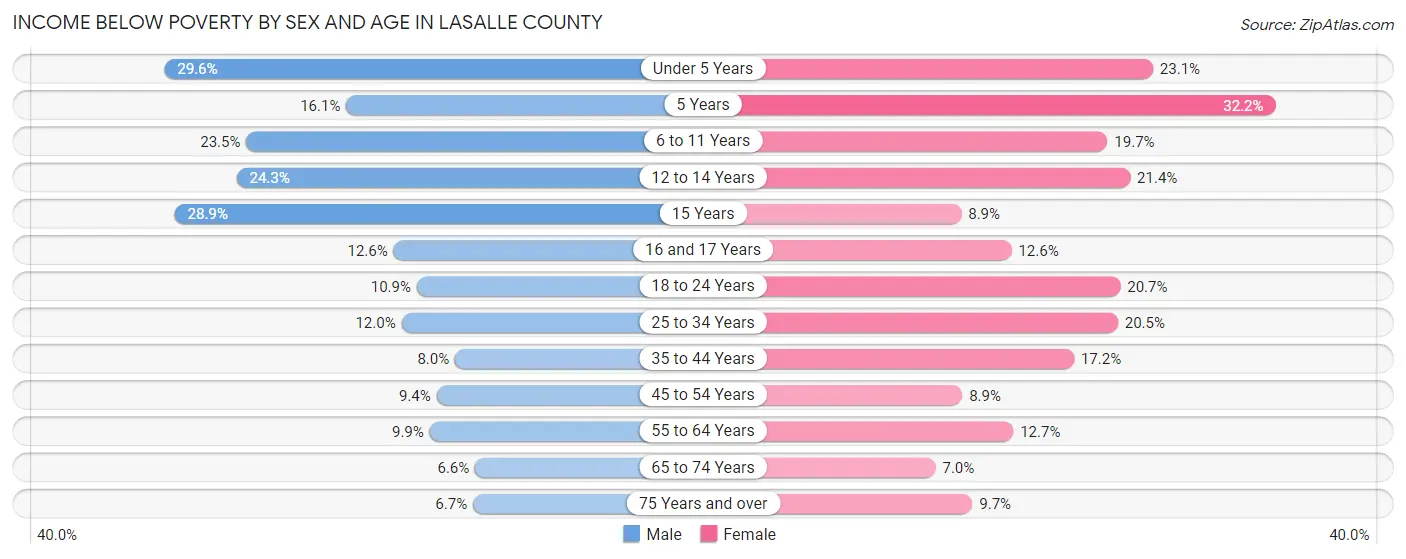
Income Below Poverty by Sex and Age in LaSalle County
With 12.4% poverty level for males and 14.9% for females among the residents of LaSalle County, under 5 year old males and 5 year old females are the most vulnerable to poverty, with 900 males (29.6%) and 279 females (32.2%) in their respective age groups living below the poverty level.
| Age Bracket | Male | Female |
| Under 5 Years | 900 (29.6%) | 619 (23.1%) |
| 5 Years | 94 (16.1%) | 279 (32.2%) |
| 6 to 11 Years | 965 (23.5%) | 671 (19.7%) |
| 12 to 14 Years | 432 (24.3%) | 386 (21.4%) |
| 15 Years | 157 (28.9%) | 72 (8.9%) |
| 16 and 17 Years | 218 (12.6%) | 172 (12.6%) |
| 18 to 24 Years | 476 (10.9%) | 860 (20.7%) |
| 25 to 34 Years | 775 (12.0%) | 1,266 (20.5%) |
| 35 to 44 Years | 545 (8.0%) | 1,080 (17.2%) |
| 45 to 54 Years | 622 (9.4%) | 577 (8.9%) |
| 55 to 64 Years | 813 (9.9%) | 1,030 (12.7%) |
| 65 to 74 Years | 386 (6.6%) | 421 (7.0%) |
| 75 Years and over | 217 (6.7%) | 462 (9.7%) |
| Total | 6,600 (12.4%) | 7,895 (14.9%) |
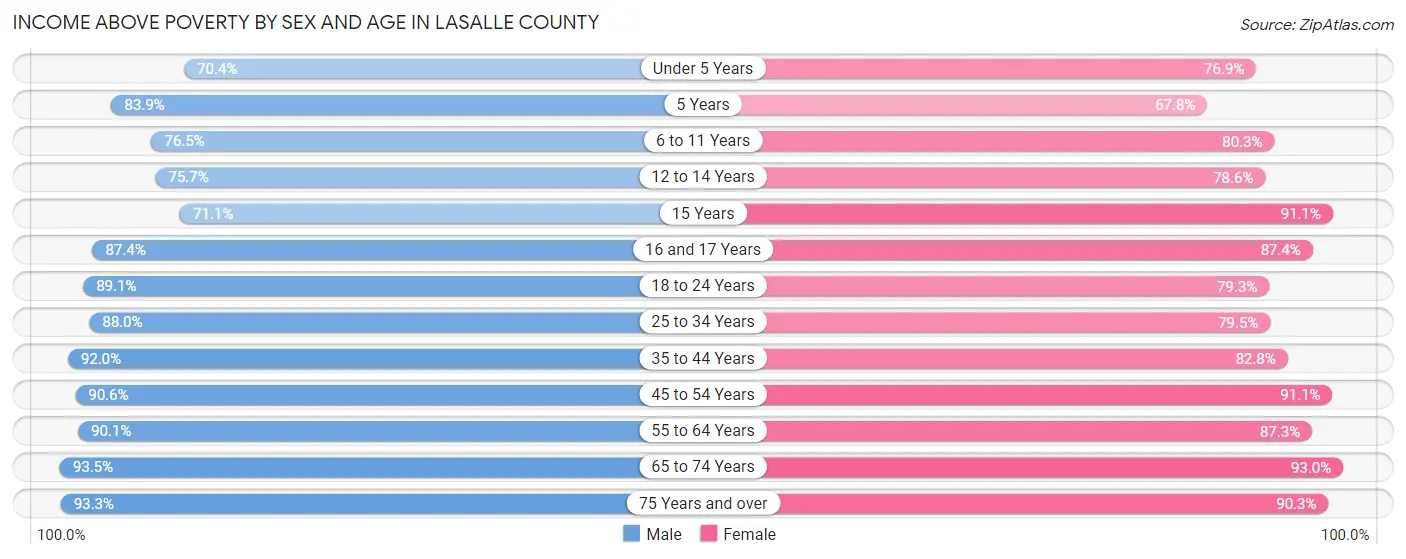
Income Above Poverty by Sex and Age in LaSalle County
According to the poverty statistics in LaSalle County, males aged 65 to 74 years and females aged 65 to 74 years are the age groups that are most secure financially, with 93.4% of males and 93.0% of females in these age groups living above the poverty line.
| Age Bracket | Male | Female |
| Under 5 Years | 2,138 (70.4%) | 2,061 (76.9%) |
| 5 Years | 489 (83.9%) | 588 (67.8%) |
| 6 to 11 Years | 3,135 (76.5%) | 2,732 (80.3%) |
| 12 to 14 Years | 1,349 (75.7%) | 1,417 (78.6%) |
| 15 Years | 387 (71.1%) | 740 (91.1%) |
| 16 and 17 Years | 1,511 (87.4%) | 1,193 (87.4%) |
| 18 to 24 Years | 3,901 (89.1%) | 3,298 (79.3%) |
| 25 to 34 Years | 5,674 (88.0%) | 4,913 (79.5%) |
| 35 to 44 Years | 6,232 (92.0%) | 5,183 (82.8%) |
| 45 to 54 Years | 5,985 (90.6%) | 5,879 (91.1%) |
| 55 to 64 Years | 7,371 (90.1%) | 7,060 (87.3%) |
| 65 to 74 Years | 5,508 (93.4%) | 5,626 (93.0%) |
| 75 Years and over | 3,018 (93.3%) | 4,306 (90.3%) |
| Total | 46,698 (87.6%) | 44,996 (85.1%) |
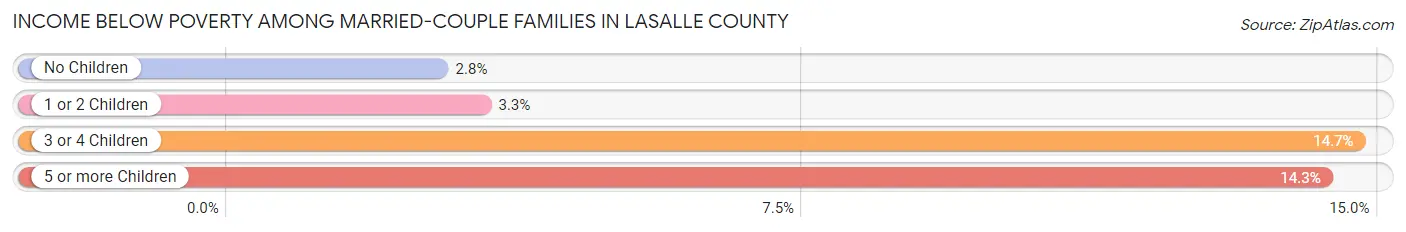
Income Below Poverty Among Married-Couple Families in LaSalle County
The poverty statistics for married-couple families in LaSalle County show that 3.9% or 839 of the total 21,555 families live below the poverty line. Families with 3 or 4 children have the highest poverty rate of 14.7%, comprising of 252 families. On the other hand, families with no children have the lowest poverty rate of 2.8%, which includes 388 families.
| Children | Above Poverty | Below Poverty |
| No Children | 13,722 (97.3%) | 388 (2.8%) |
| 1 or 2 Children | 5,462 (96.7%) | 187 (3.3%) |
| 3 or 4 Children | 1,460 (85.3%) | 252 (14.7%) |
| 5 or more Children | 72 (85.7%) | 12 (14.3%) |
| Total | 20,716 (96.1%) | 839 (3.9%) |
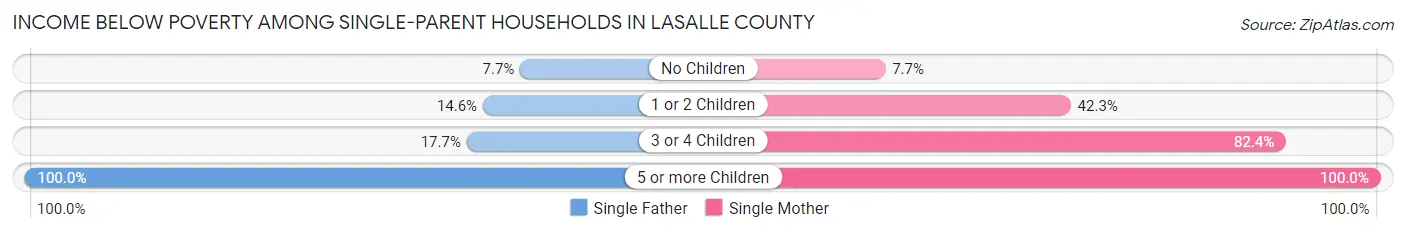
Income Below Poverty Among Single-Parent Households in LaSalle County
According to the poverty data in LaSalle County, 12.7% or 242 single-father households and 36.0% or 1,970 single-mother households are living below the poverty line. Among single-father households, those with 5 or more children have the highest poverty rate, with 11 households (100.0%) experiencing poverty. Likewise, among single-mother households, those with 5 or more children have the highest poverty rate, with 56 households (100.0%) falling below the poverty line.
| Children | Single Father | Single Mother |
| No Children | 57 (7.7%) | 140 (7.7%) |
| 1 or 2 Children | 138 (14.6%) | 1,259 (42.3%) |
| 3 or 4 Children | 36 (17.6%) | 515 (82.4%) |
| 5 or more Children | 11 (100.0%) | 56 (100.0%) |
| Total | 242 (12.7%) | 1,970 (36.0%) |
Income Below Poverty Among Married-Couple vs Single-Parent Households in LaSalle County
The poverty data for LaSalle County shows that 839 of the married-couple family households (3.9%) and 2,212 of the single-parent households (30.0%) are living below the poverty level. Within the married-couple family households, those with 3 or 4 children have the highest poverty rate, with 252 households (14.7%) falling below the poverty line. Among the single-parent households, those with 5 or more children have the highest poverty rate, with 67 household (100.0%) living below poverty.
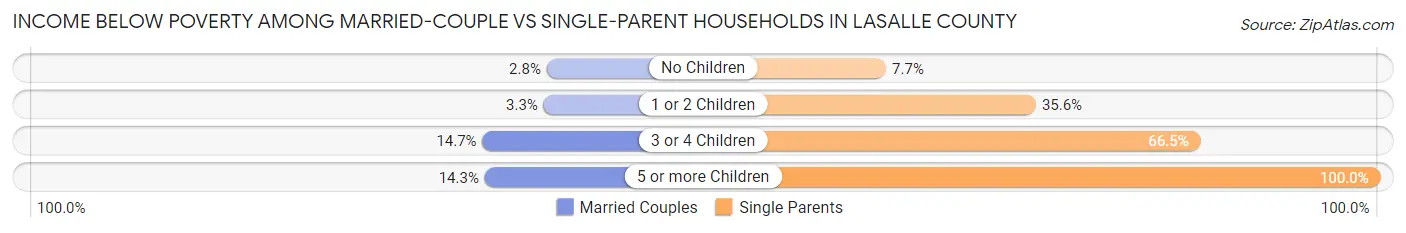
| Children | Married-Couple Families | Single-Parent Households |
| No Children | 388 (2.8%) | 197 (7.7%) |
| 1 or 2 Children | 187 (3.3%) | 1,397 (35.6%) |
| 3 or 4 Children | 252 (14.7%) | 551 (66.5%) |
| 5 or more Children | 12 (14.3%) | 67 (100.0%) |
| Total | 839 (3.9%) | 2,212 (30.0%) |
Employment Characteristics in LaSalle County
Employment by Class of Employer in LaSalle County
Among the 51,386 employed individuals in LaSalle County, private company employees (36,371 | 70.8%), not-for-profit organizations (4,144 | 8.1%), and local government employees (4,129 | 8.0%) make up the most common classes of employment.
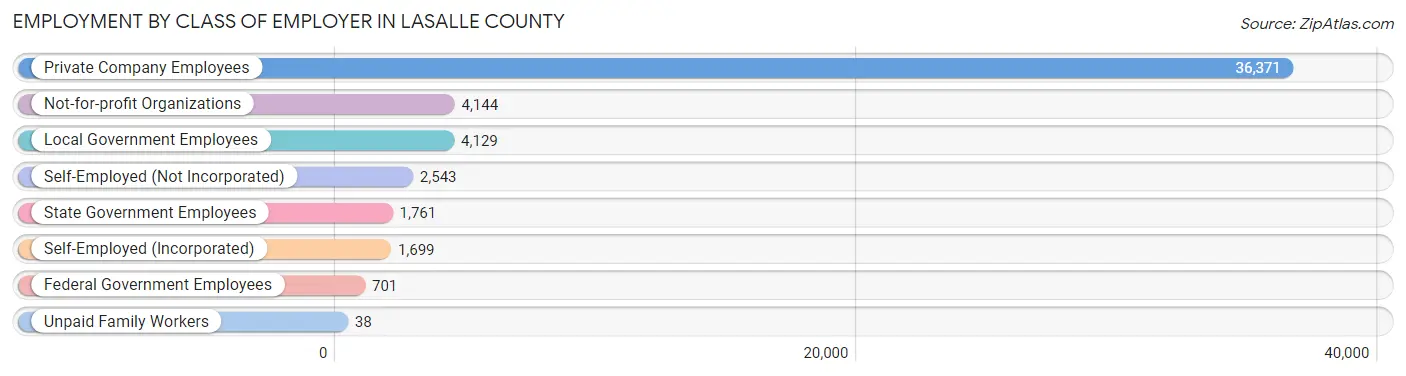
| Employer Class | # Employees | % Employees |
| Private Company Employees | 36,371 | 70.8% |
| Self-Employed (Incorporated) | 1,699 | 3.3% |
| Self-Employed (Not Incorporated) | 2,543 | 5.0% |
| Not-for-profit Organizations | 4,144 | 8.1% |
| Local Government Employees | 4,129 | 8.0% |
| State Government Employees | 1,761 | 3.4% |
| Federal Government Employees | 701 | 1.4% |
| Unpaid Family Workers | 38 | 0.1% |
| Total | 51,386 | 100.0% |
Employment Status by Age in LaSalle County
According to the labor force statistics for LaSalle County, out of the total population over 16 years of age (89,362), 62.8% or 56,119 individuals are in the labor force, with 5.4% or 3,030 of them unemployed. The age group with the highest labor force participation rate is 35 to 44 years, with 84.2% or 11,385 individuals in the labor force. Within the labor force, the 16 to 19 years age range has the highest percentage of unemployed individuals, with 16.0% or 467 of them being unemployed.
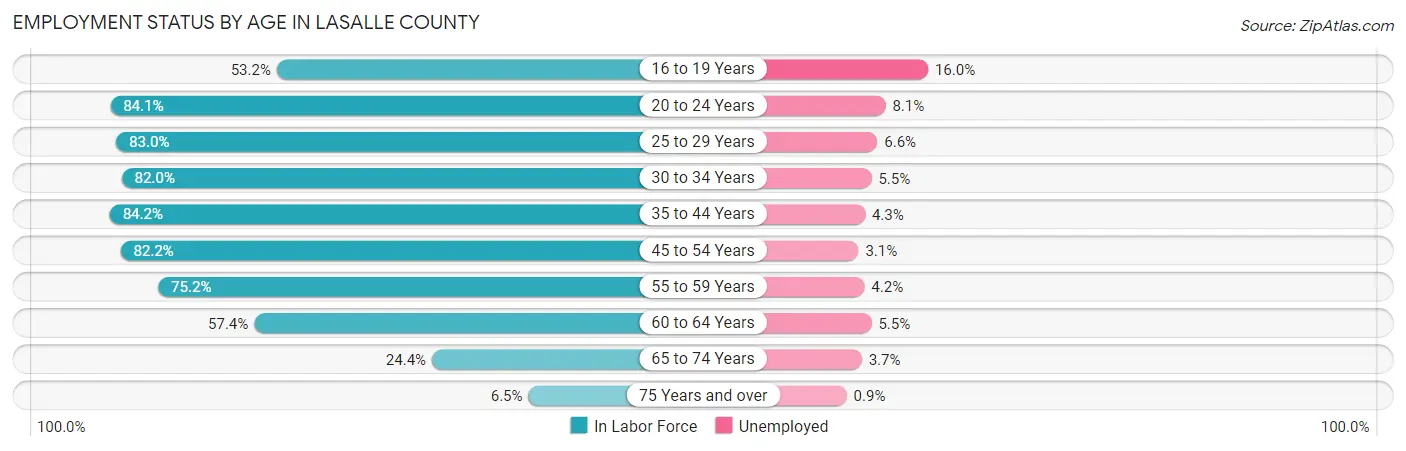
| Age Bracket | In Labor Force | Unemployed |
| 16 to 19 Years | 2,921 (53.2%) | 467 (16.0%) |
| 20 to 24 Years | 5,359 (84.1%) | 434 (8.1%) |
| 25 to 29 Years | 5,681 (83.0%) | 375 (6.6%) |
| 30 to 34 Years | 5,365 (82.0%) | 295 (5.5%) |
| 35 to 44 Years | 11,385 (84.2%) | 490 (4.3%) |
| 45 to 54 Years | 10,907 (82.2%) | 338 (3.1%) |
| 55 to 59 Years | 6,476 (75.2%) | 272 (4.2%) |
| 60 to 64 Years | 4,458 (57.4%) | 245 (5.5%) |
| 65 to 74 Years | 2,947 (24.4%) | 109 (3.7%) |
| 75 Years and over | 576 (6.5%) | 5 (0.9%) |
| Total | 56,119 (62.8%) | 3,030 (5.4%) |
Employment Status by Educational Attainment in LaSalle County
According to labor force statistics for LaSalle County, 78.3% of individuals (44,283) out of the total population between 25 and 64 years of age (56,555) are in the labor force, with 4.6% or 2,037 of them being unemployed. The group with the highest labor force participation rate are those with the educational attainment of bachelor's degree or higher, with 87.5% or 9,669 individuals in the labor force. Within the labor force, individuals with less than high school education have the highest percentage of unemployment, with 10.6% or 297 of them being unemployed.
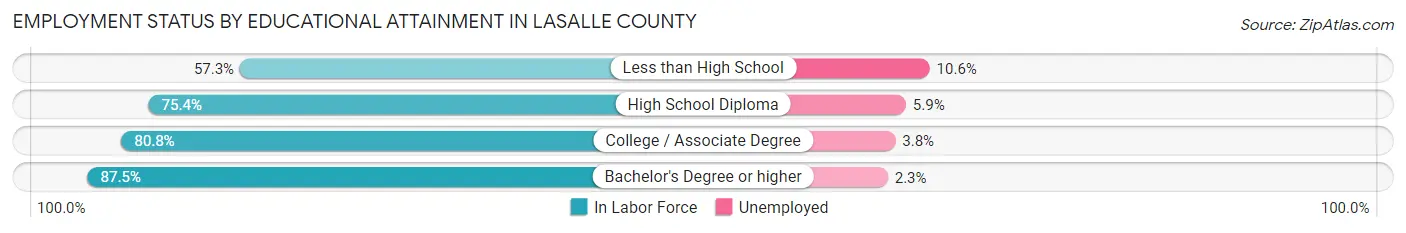
| Educational Attainment | In Labor Force | Unemployed |
| Less than High School | 2,804 (57.3%) | 519 (10.6%) |
| High School Diploma | 14,108 (75.4%) | 1,104 (5.9%) |
| College / Associate Degree | 17,696 (80.8%) | 832 (3.8%) |
| Bachelor's Degree or higher | 9,669 (87.5%) | 254 (2.3%) |
| Total | 44,283 (78.3%) | 2,602 (4.6%) |
Employment Occupations by Sex in LaSalle County
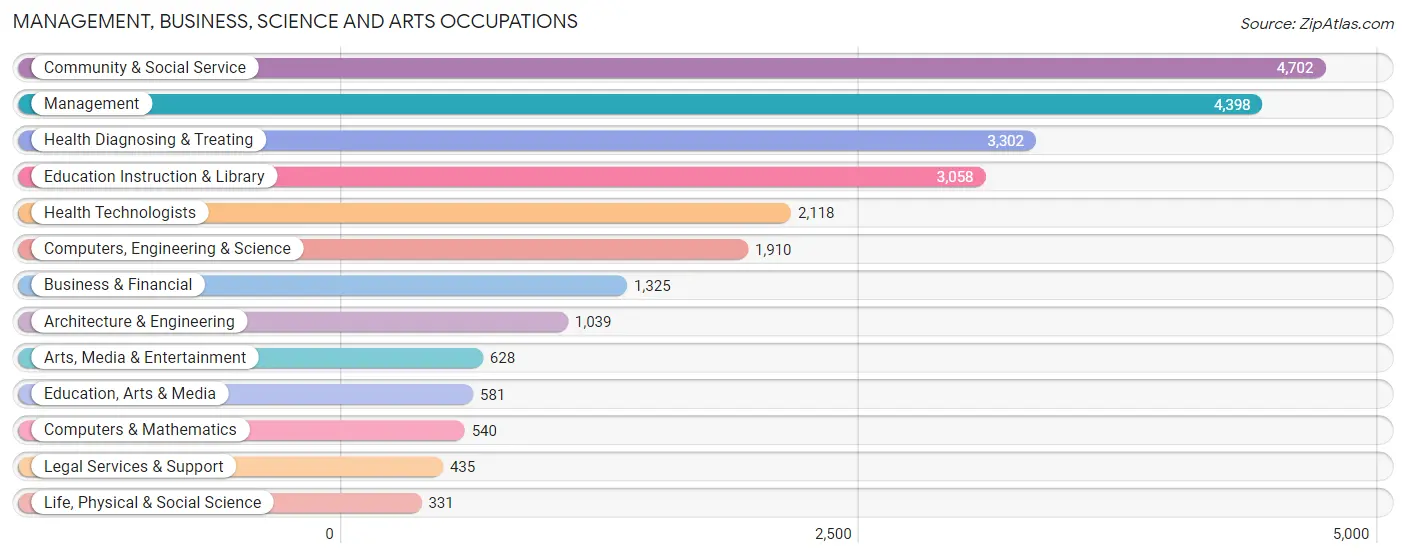
Management, Business, Science and Arts Occupations
The most common Management, Business, Science and Arts occupations in LaSalle County are Community & Social Service (4,702 | 8.9%), Management (4,398 | 8.3%), Health Diagnosing & Treating (3,302 | 6.2%), Education Instruction & Library (3,058 | 5.8%), and Health Technologists (2,118 | 4.0%).
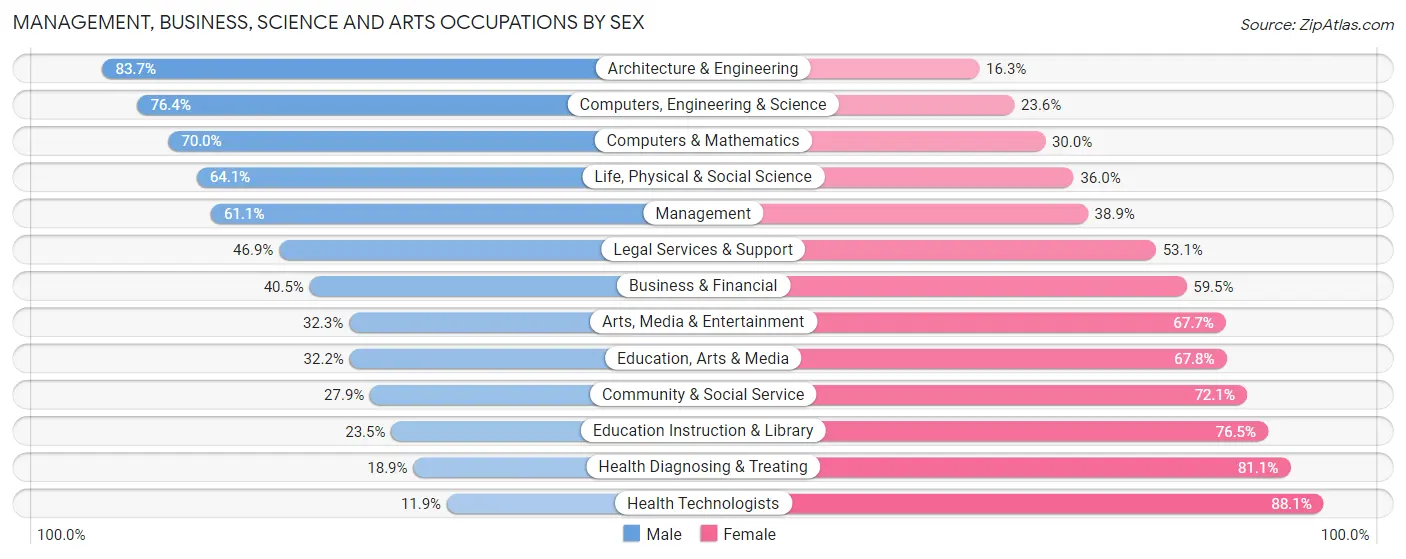
Management, Business, Science and Arts Occupations by Sex
Within the Management, Business, Science and Arts occupations in LaSalle County, the most male-oriented occupations are Architecture & Engineering (83.7%), Computers, Engineering & Science (76.4%), and Computers & Mathematics (70.0%), while the most female-oriented occupations are Health Technologists (88.1%), Health Diagnosing & Treating (81.1%), and Education Instruction & Library (76.5%).
| Occupation | Male | Female |
| Management | 2,687 (61.1%) | 1,711 (38.9%) |
| Business & Financial | 537 (40.5%) | 788 (59.5%) |
| Computers, Engineering & Science | 1,460 (76.4%) | 450 (23.6%) |
| Computers & Mathematics | 378 (70.0%) | 162 (30.0%) |
| Architecture & Engineering | 870 (83.7%) | 169 (16.3%) |
| Life, Physical & Social Science | 212 (64.0%) | 119 (35.9%) |
| Community & Social Service | 1,313 (27.9%) | 3,389 (72.1%) |
| Education, Arts & Media | 187 (32.2%) | 394 (67.8%) |
| Legal Services & Support | 204 (46.9%) | 231 (53.1%) |
| Education Instruction & Library | 719 (23.5%) | 2,339 (76.5%) |
| Arts, Media & Entertainment | 203 (32.3%) | 425 (67.7%) |
| Health Diagnosing & Treating | 624 (18.9%) | 2,678 (81.1%) |
| Health Technologists | 252 (11.9%) | 1,866 (88.1%) |
| Total (Category) | 6,621 (42.3%) | 9,016 (57.7%) |
| Total (Overall) | 28,560 (53.9%) | 24,465 (46.1%) |
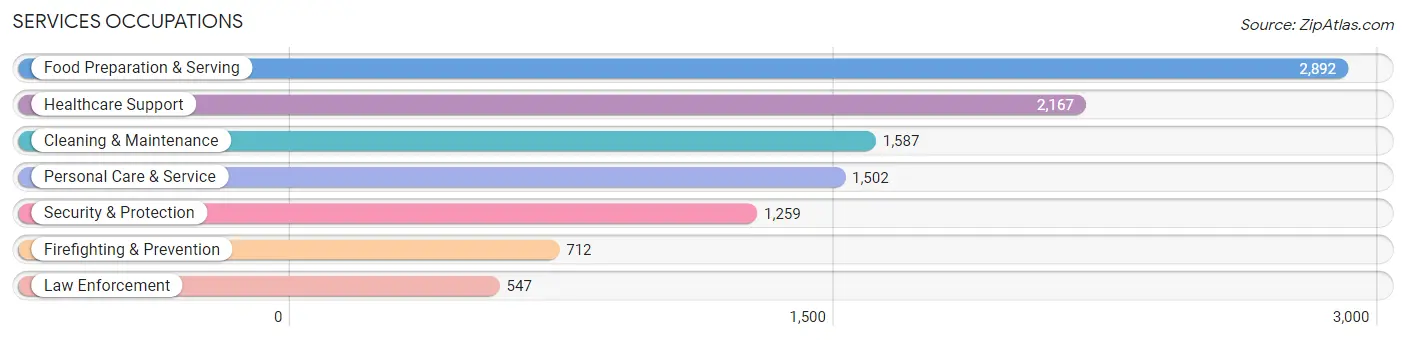
Services Occupations
The most common Services occupations in LaSalle County are Food Preparation & Serving (2,892 | 5.4%), Healthcare Support (2,167 | 4.1%), Cleaning & Maintenance (1,587 | 3.0%), Personal Care & Service (1,502 | 2.8%), and Security & Protection (1,259 | 2.4%).
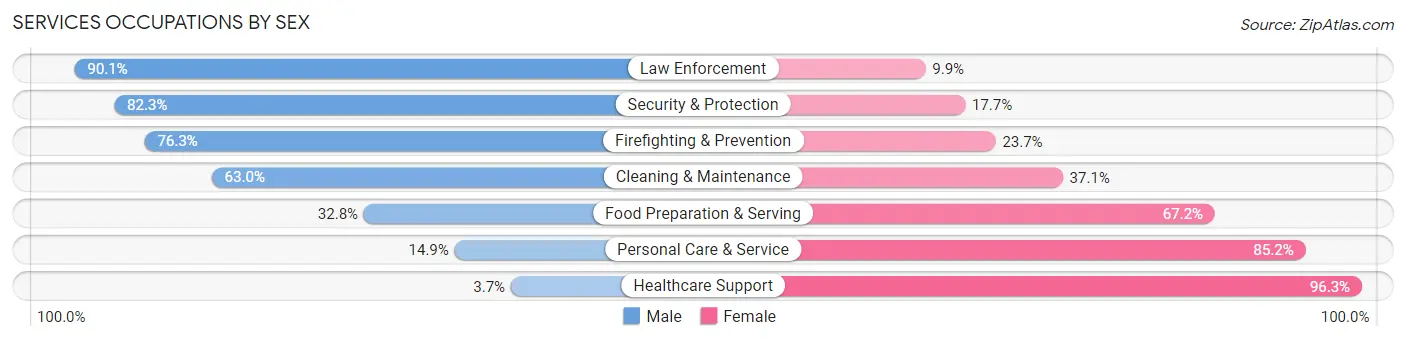
Services Occupations by Sex
Within the Services occupations in LaSalle County, the most male-oriented occupations are Law Enforcement (90.1%), Security & Protection (82.3%), and Firefighting & Prevention (76.3%), while the most female-oriented occupations are Healthcare Support (96.3%), Personal Care & Service (85.2%), and Food Preparation & Serving (67.2%).
| Occupation | Male | Female |
| Healthcare Support | 80 (3.7%) | 2,087 (96.3%) |
| Security & Protection | 1,036 (82.3%) | 223 (17.7%) |
| Firefighting & Prevention | 543 (76.3%) | 169 (23.7%) |
| Law Enforcement | 493 (90.1%) | 54 (9.9%) |
| Food Preparation & Serving | 949 (32.8%) | 1,943 (67.2%) |
| Cleaning & Maintenance | 999 (62.9%) | 588 (37.0%) |
| Personal Care & Service | 223 (14.8%) | 1,279 (85.2%) |
| Total (Category) | 3,287 (34.9%) | 6,120 (65.1%) |
| Total (Overall) | 28,560 (53.9%) | 24,465 (46.1%) |
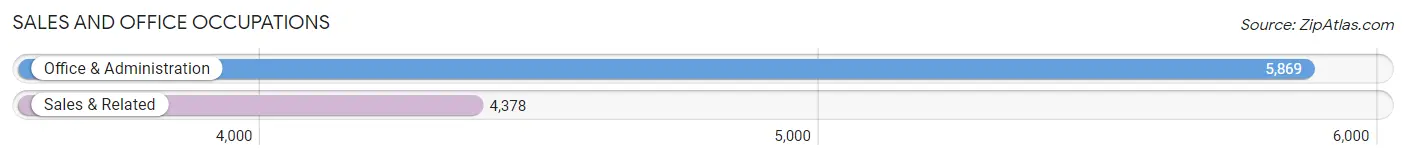
Sales and Office Occupations
The most common Sales and Office occupations in LaSalle County are Office & Administration (5,869 | 11.1%), and Sales & Related (4,378 | 8.3%).
Sales and Office Occupations by Sex
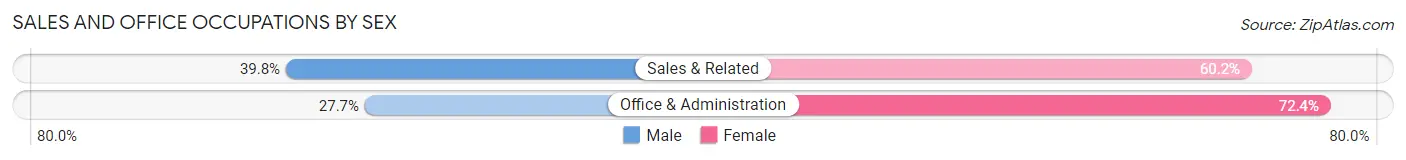
| Occupation | Male | Female |
| Sales & Related | 1,742 (39.8%) | 2,636 (60.2%) |
| Office & Administration | 1,623 (27.7%) | 4,246 (72.4%) |
| Total (Category) | 3,365 (32.8%) | 6,882 (67.2%) |
| Total (Overall) | 28,560 (53.9%) | 24,465 (46.1%) |
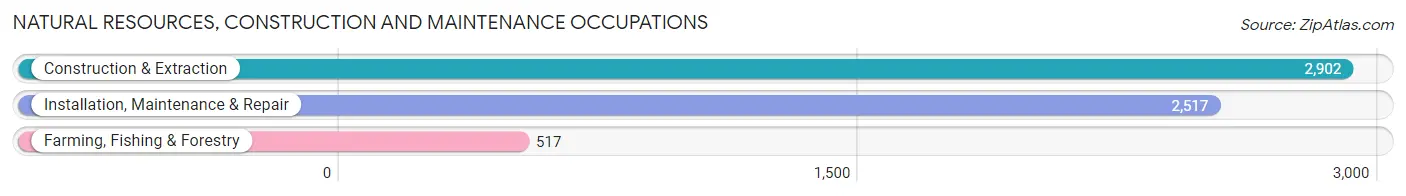
Natural Resources, Construction and Maintenance Occupations
The most common Natural Resources, Construction and Maintenance occupations in LaSalle County are Construction & Extraction (2,902 | 5.5%), Installation, Maintenance & Repair (2,517 | 4.8%), and Farming, Fishing & Forestry (517 | 1.0%).
Natural Resources, Construction and Maintenance Occupations by Sex
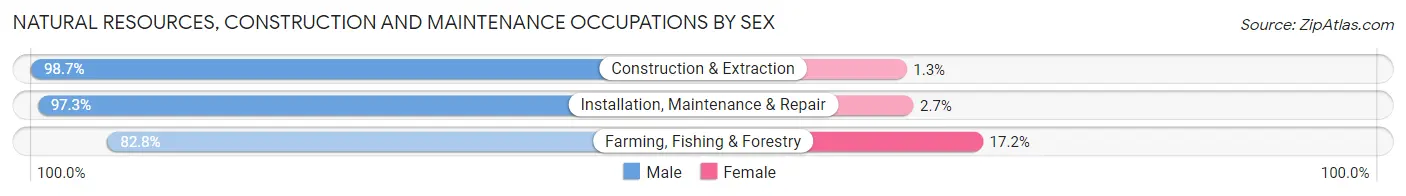
| Occupation | Male | Female |
| Farming, Fishing & Forestry | 428 (82.8%) | 89 (17.2%) |
| Construction & Extraction | 2,863 (98.7%) | 39 (1.3%) |
| Installation, Maintenance & Repair | 2,448 (97.3%) | 69 (2.7%) |
| Total (Category) | 5,739 (96.7%) | 197 (3.3%) |
| Total (Overall) | 28,560 (53.9%) | 24,465 (46.1%) |
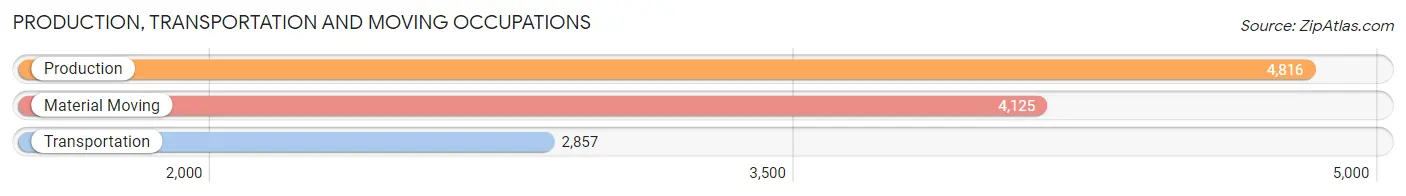
Production, Transportation and Moving Occupations
The most common Production, Transportation and Moving occupations in LaSalle County are Production (4,816 | 9.1%), Material Moving (4,125 | 7.8%), and Transportation (2,857 | 5.4%).
Production, Transportation and Moving Occupations by Sex
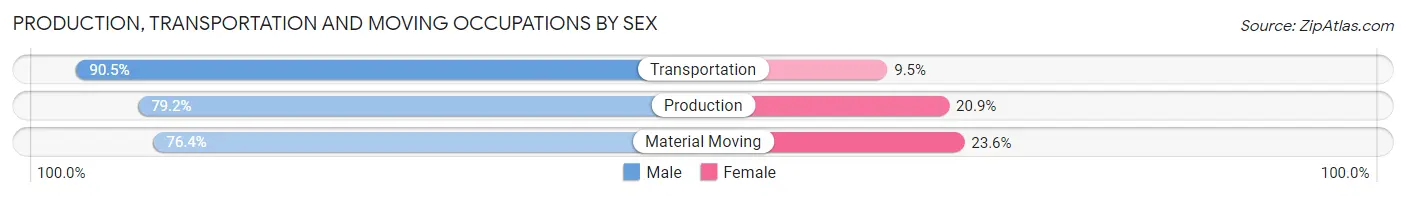
| Occupation | Male | Female |
| Production | 3,812 (79.1%) | 1,004 (20.8%) |
| Transportation | 2,586 (90.5%) | 271 (9.5%) |
| Material Moving | 3,150 (76.4%) | 975 (23.6%) |
| Total (Category) | 9,548 (80.9%) | 2,250 (19.1%) |
| Total (Overall) | 28,560 (53.9%) | 24,465 (46.1%) |
Employment Industries by Sex in LaSalle County
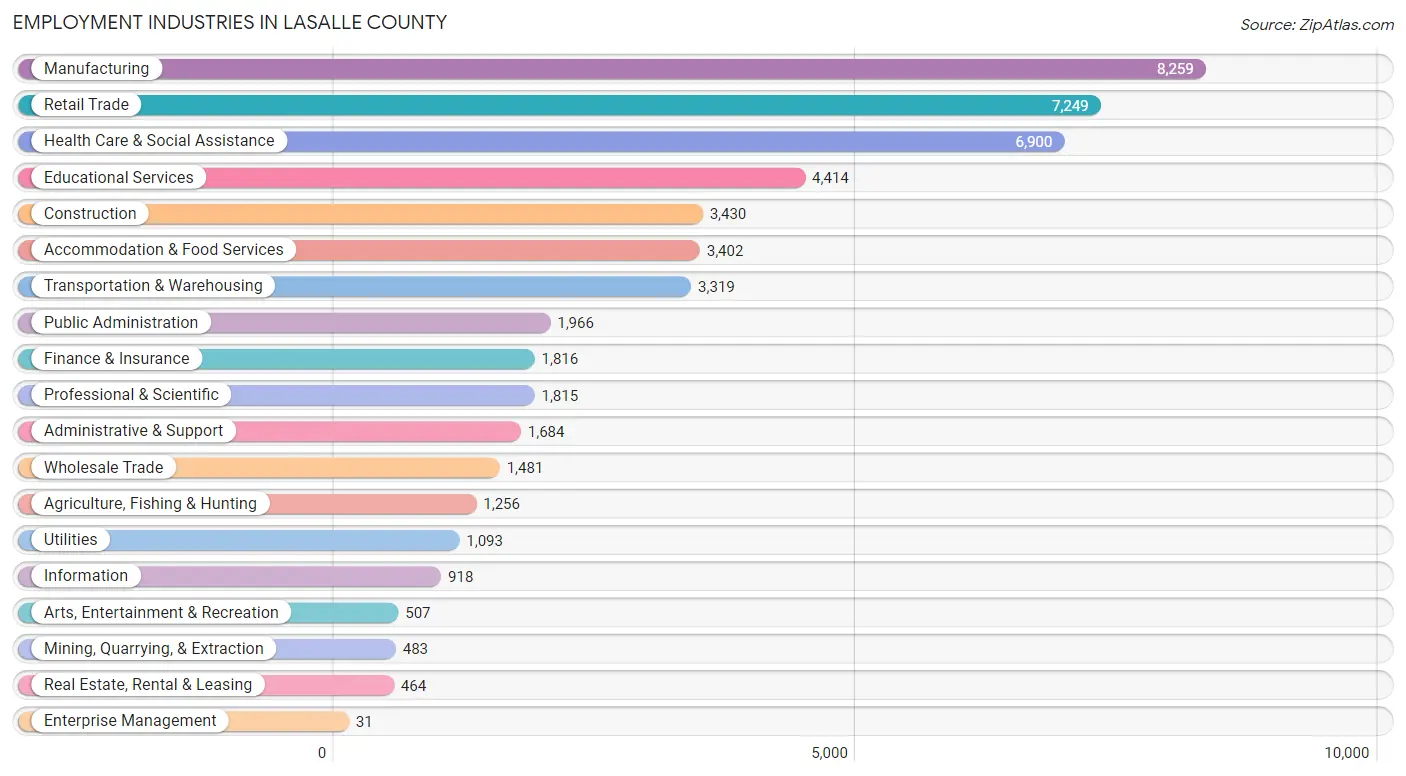
Employment Industries in LaSalle County
The major employment industries in LaSalle County include Manufacturing (8,259 | 15.6%), Retail Trade (7,249 | 13.7%), Health Care & Social Assistance (6,900 | 13.0%), Educational Services (4,414 | 8.3%), and Construction (3,430 | 6.5%).
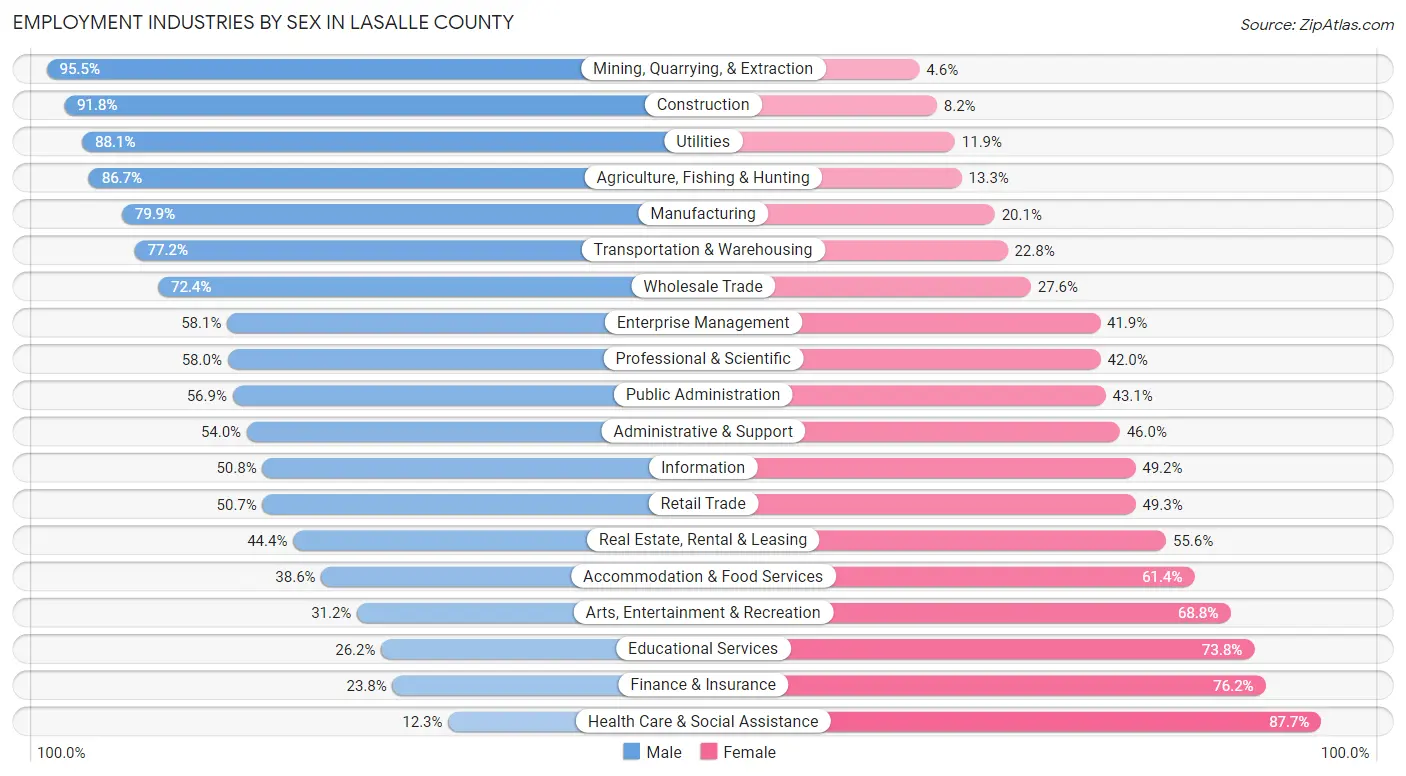
Employment Industries by Sex in LaSalle County
The LaSalle County industries that see more men than women are Mining, Quarrying, & Extraction (95.5%), Construction (91.8%), and Utilities (88.1%), whereas the industries that tend to have a higher number of women are Health Care & Social Assistance (87.7%), Finance & Insurance (76.2%), and Educational Services (73.8%).
| Industry | Male | Female |
| Agriculture, Fishing & Hunting | 1,089 (86.7%) | 167 (13.3%) |
| Mining, Quarrying, & Extraction | 461 (95.5%) | 22 (4.5%) |
| Construction | 3,150 (91.8%) | 280 (8.2%) |
| Manufacturing | 6,596 (79.9%) | 1,663 (20.1%) |
| Wholesale Trade | 1,072 (72.4%) | 409 (27.6%) |
| Retail Trade | 3,677 (50.7%) | 3,572 (49.3%) |
| Transportation & Warehousing | 2,563 (77.2%) | 756 (22.8%) |
| Utilities | 963 (88.1%) | 130 (11.9%) |
| Information | 466 (50.8%) | 452 (49.2%) |
| Finance & Insurance | 433 (23.8%) | 1,383 (76.2%) |
| Real Estate, Rental & Leasing | 206 (44.4%) | 258 (55.6%) |
| Professional & Scientific | 1,052 (58.0%) | 763 (42.0%) |
| Enterprise Management | 18 (58.1%) | 13 (41.9%) |
| Administrative & Support | 909 (54.0%) | 775 (46.0%) |
| Educational Services | 1,155 (26.2%) | 3,259 (73.8%) |
| Health Care & Social Assistance | 848 (12.3%) | 6,052 (87.7%) |
| Arts, Entertainment & Recreation | 158 (31.2%) | 349 (68.8%) |
| Accommodation & Food Services | 1,312 (38.6%) | 2,090 (61.4%) |
| Public Administration | 1,119 (56.9%) | 847 (43.1%) |
| Total | 28,560 (53.9%) | 24,465 (46.1%) |
Education in LaSalle County
School Enrollment in LaSalle County
The most common levels of schooling among the 23,065 students in LaSalle County are high school (5,870 | 25.5%), middle school (5,098 | 22.1%), and elementary school (5,061 | 21.9%).
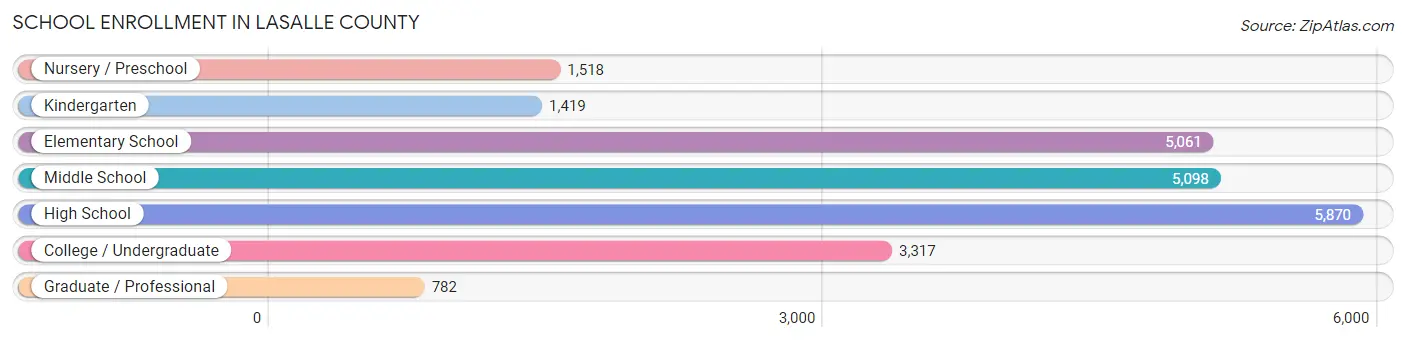
| School Level | # Students | % Students |
| Nursery / Preschool | 1,518 | 6.6% |
| Kindergarten | 1,419 | 6.1% |
| Elementary School | 5,061 | 21.9% |
| Middle School | 5,098 | 22.1% |
| High School | 5,870 | 25.5% |
| College / Undergraduate | 3,317 | 14.4% |
| Graduate / Professional | 782 | 3.4% |
| Total | 23,065 | 100.0% |
School Enrollment by Age by Funding Source in LaSalle County
Out of a total of 23,065 students who are enrolled in schools in LaSalle County, 3,783 (16.4%) attend a private institution, while the remaining 19,282 (83.6%) are enrolled in public schools. The age group of 35 years and over has the highest likelihood of being enrolled in private schools, with 392 (35.0% in the age bracket) enrolled. Conversely, the age group of 18 to 19 year olds has the lowest likelihood of being enrolled in a private school, with 1,501 (88.9% in the age bracket) attending a public institution.
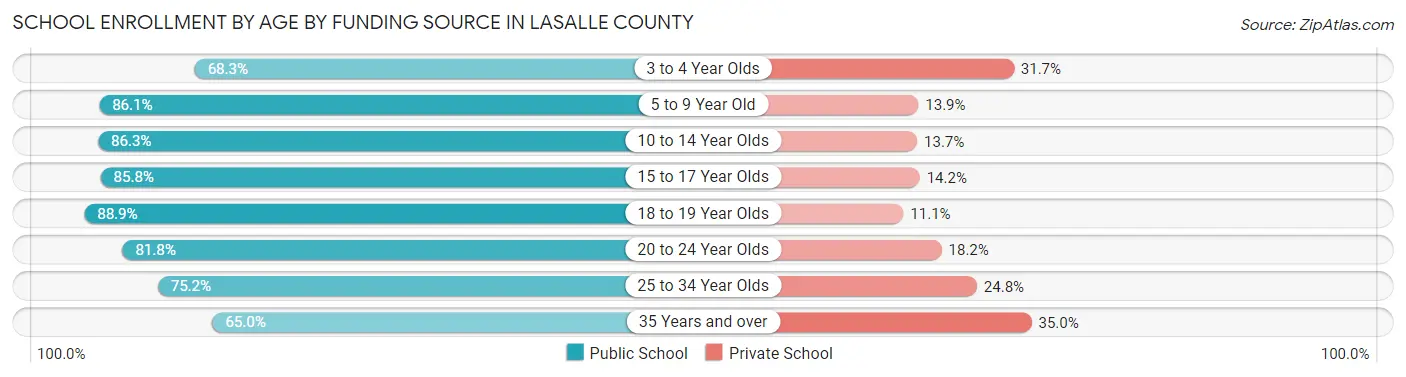
| Age Bracket | Public School | Private School |
| 3 to 4 Year Olds | 834 (68.3%) | 387 (31.7%) |
| 5 to 9 Year Old | 5,327 (86.1%) | 861 (13.9%) |
| 10 to 14 Year Olds | 5,381 (86.3%) | 853 (13.7%) |
| 15 to 17 Year Olds | 3,696 (85.8%) | 610 (14.2%) |
| 18 to 19 Year Olds | 1,501 (88.9%) | 188 (11.1%) |
| 20 to 24 Year Olds | 1,076 (81.8%) | 240 (18.2%) |
| 25 to 34 Year Olds | 745 (75.2%) | 246 (24.8%) |
| 35 Years and over | 728 (65.0%) | 392 (35.0%) |
| Total | 19,282 (83.6%) | 3,783 (16.4%) |
Educational Attainment by Field of Study in LaSalle County
Education (3,139 | 20.6%), business (2,570 | 16.9%), science & technology (1,947 | 12.8%), arts & humanities (1,217 | 8.0%), and bio, nature & agricultural (1,167 | 7.6%) are the most common fields of study among 15,246 individuals in LaSalle County who have obtained a bachelor's degree or higher.
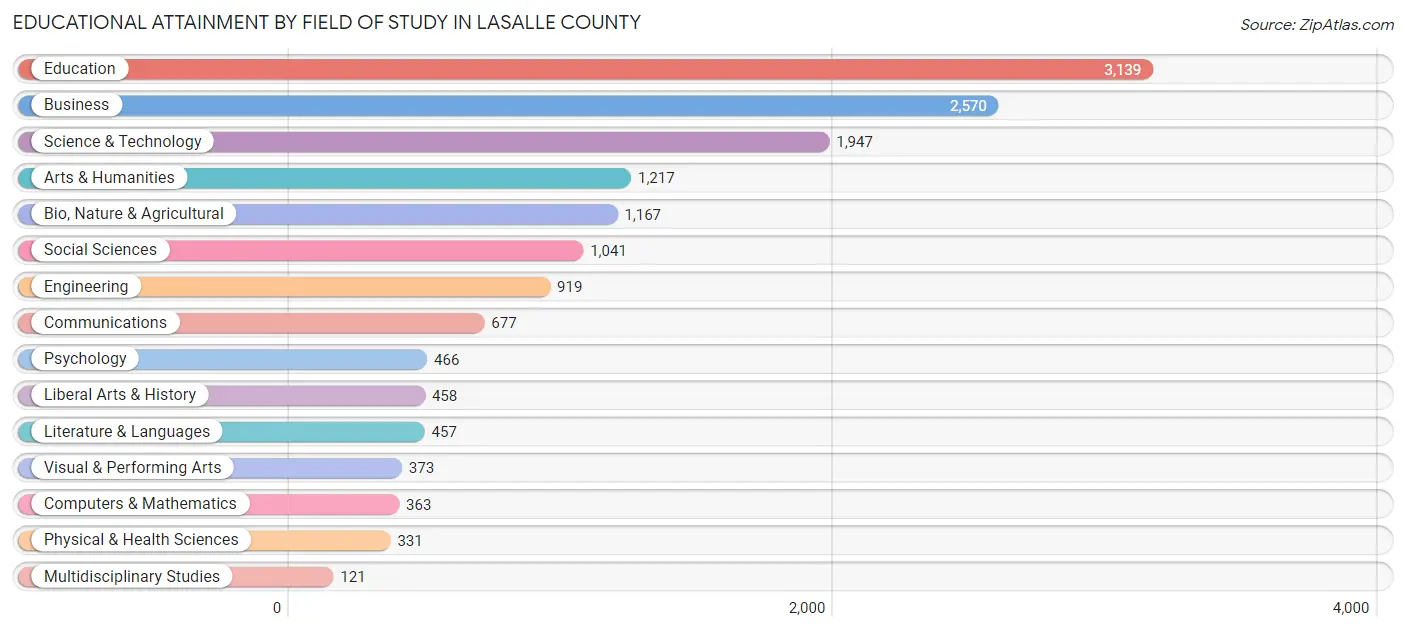
| Field of Study | # Graduates | % Graduates |
| Computers & Mathematics | 363 | 2.4% |
| Bio, Nature & Agricultural | 1,167 | 7.6% |
| Physical & Health Sciences | 331 | 2.2% |
| Psychology | 466 | 3.1% |
| Social Sciences | 1,041 | 6.8% |
| Engineering | 919 | 6.0% |
| Multidisciplinary Studies | 121 | 0.8% |
| Science & Technology | 1,947 | 12.8% |
| Business | 2,570 | 16.9% |
| Education | 3,139 | 20.6% |
| Literature & Languages | 457 | 3.0% |
| Liberal Arts & History | 458 | 3.0% |
| Visual & Performing Arts | 373 | 2.5% |
| Communications | 677 | 4.4% |
| Arts & Humanities | 1,217 | 8.0% |
| Total | 15,246 | 100.0% |
Transportation & Commute in LaSalle County
Vehicle Availability by Sex in LaSalle County
The most prevalent vehicle ownership categories in LaSalle County are males with 2 vehicles (12,025, accounting for 43.5%) and females with 2 vehicles (9,453, making up 50.7%).
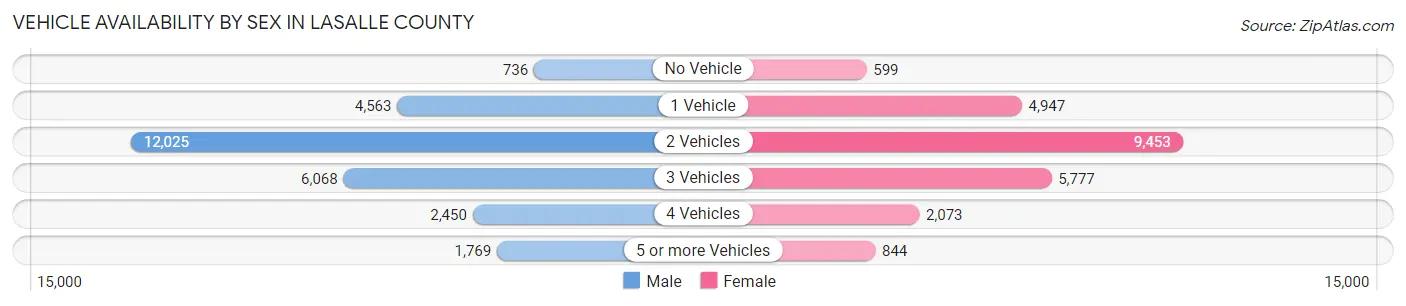
| Vehicles Available | Male | Female |
| No Vehicle | 736 (2.7%) | 599 (2.5%) |
| 1 Vehicle | 4,563 (16.5%) | 4,947 (20.9%) |
| 2 Vehicles | 12,025 (43.5%) | 9,453 (39.9%) |
| 3 Vehicles | 6,068 (22.0%) | 5,777 (24.4%) |
| 4 Vehicles | 2,450 (8.9%) | 2,073 (8.7%) |
| 5 or more Vehicles | 1,769 (6.4%) | 844 (3.6%) |
| Total | 27,611 (100.0%) | 23,693 (100.0%) |
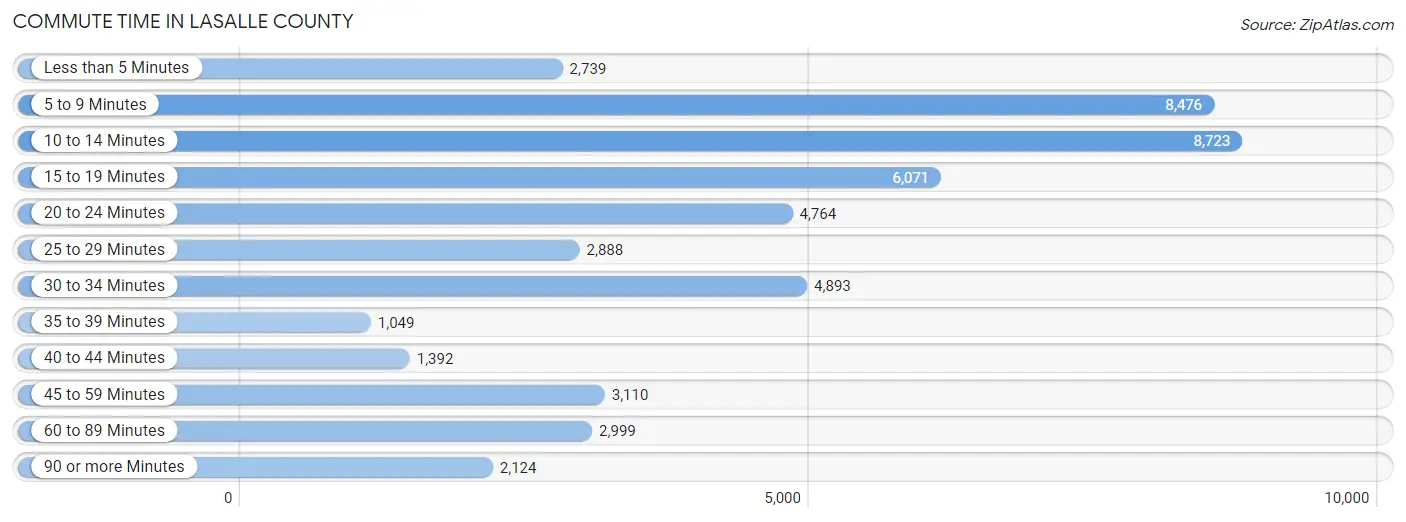
Commute Time in LaSalle County
The most frequently occuring commute durations in LaSalle County are 10 to 14 minutes (8,723 commuters, 17.7%), 5 to 9 minutes (8,476 commuters, 17.2%), and 15 to 19 minutes (6,071 commuters, 12.3%).
| Commute Time | # Commuters | % Commuters |
| Less than 5 Minutes | 2,739 | 5.6% |
| 5 to 9 Minutes | 8,476 | 17.2% |
| 10 to 14 Minutes | 8,723 | 17.7% |
| 15 to 19 Minutes | 6,071 | 12.3% |
| 20 to 24 Minutes | 4,764 | 9.7% |
| 25 to 29 Minutes | 2,888 | 5.9% |
| 30 to 34 Minutes | 4,893 | 9.9% |
| 35 to 39 Minutes | 1,049 | 2.1% |
| 40 to 44 Minutes | 1,392 | 2.8% |
| 45 to 59 Minutes | 3,110 | 6.3% |
| 60 to 89 Minutes | 2,999 | 6.1% |
| 90 or more Minutes | 2,124 | 4.3% |
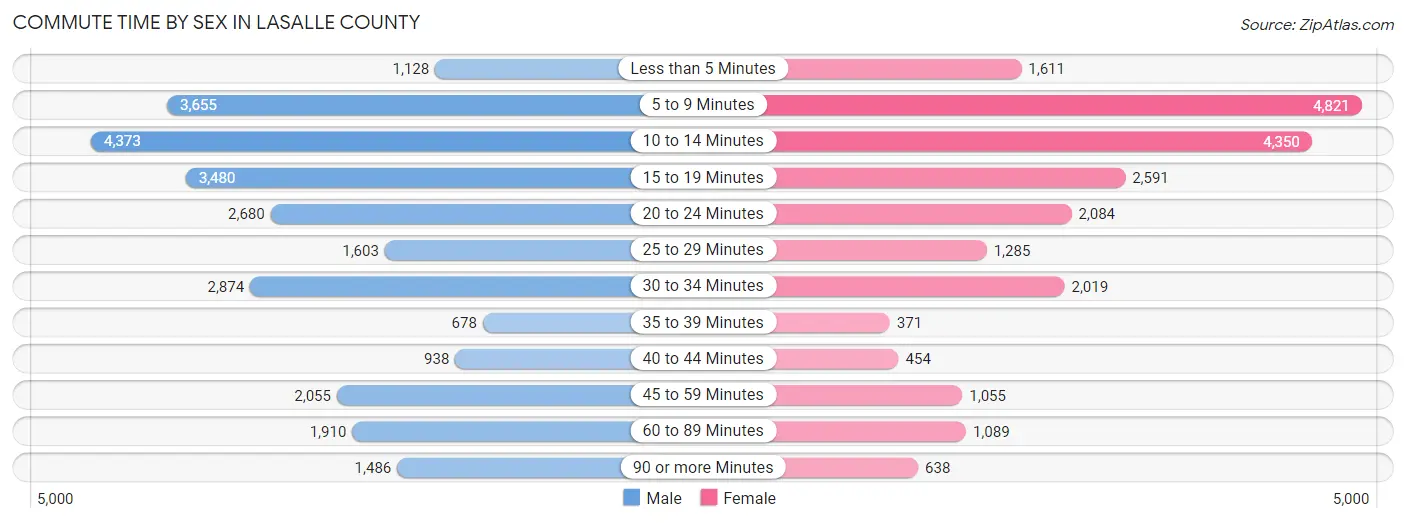
Commute Time by Sex in LaSalle County
The most common commute times in LaSalle County are 10 to 14 minutes (4,373 commuters, 16.3%) for males and 5 to 9 minutes (4,821 commuters, 21.5%) for females.
| Commute Time | Male | Female |
| Less than 5 Minutes | 1,128 (4.2%) | 1,611 (7.2%) |
| 5 to 9 Minutes | 3,655 (13.6%) | 4,821 (21.5%) |
| 10 to 14 Minutes | 4,373 (16.3%) | 4,350 (19.5%) |
| 15 to 19 Minutes | 3,480 (13.0%) | 2,591 (11.6%) |
| 20 to 24 Minutes | 2,680 (10.0%) | 2,084 (9.3%) |
| 25 to 29 Minutes | 1,603 (6.0%) | 1,285 (5.7%) |
| 30 to 34 Minutes | 2,874 (10.7%) | 2,019 (9.0%) |
| 35 to 39 Minutes | 678 (2.5%) | 371 (1.7%) |
| 40 to 44 Minutes | 938 (3.5%) | 454 (2.0%) |
| 45 to 59 Minutes | 2,055 (7.6%) | 1,055 (4.7%) |
| 60 to 89 Minutes | 1,910 (7.1%) | 1,089 (4.9%) |
| 90 or more Minutes | 1,486 (5.5%) | 638 (2.9%) |
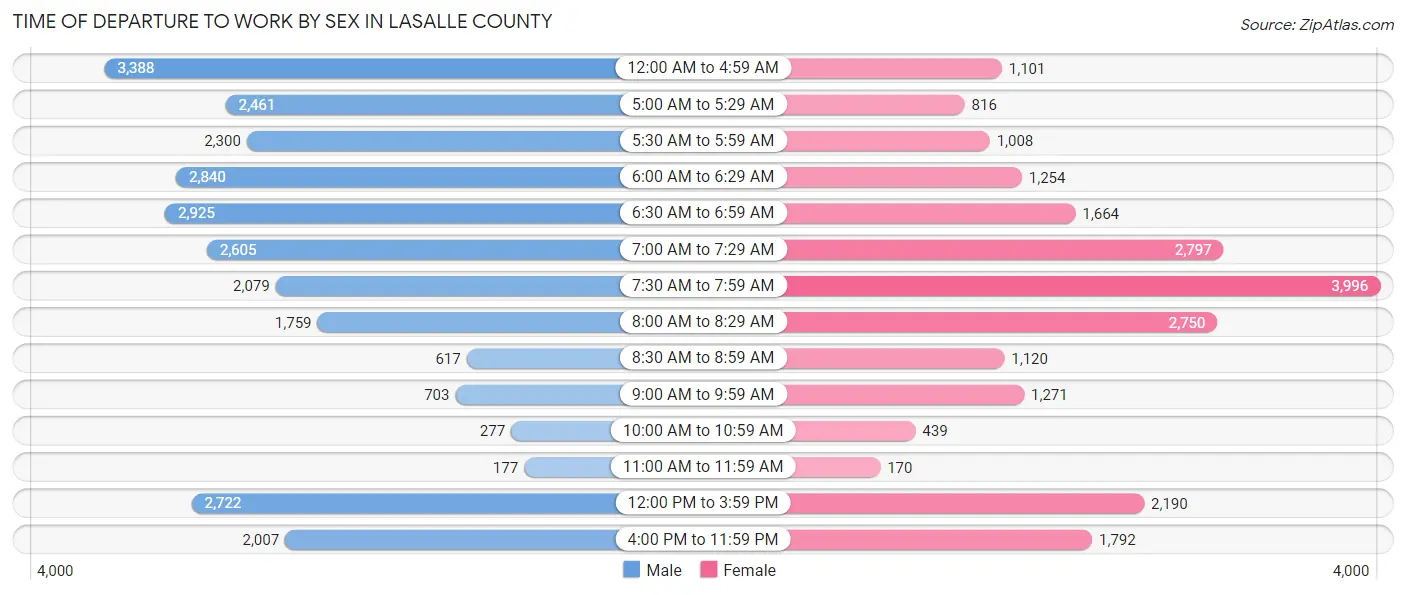
Time of Departure to Work by Sex in LaSalle County
The most frequent times of departure to work in LaSalle County are 12:00 AM to 4:59 AM (3,388, 12.6%) for males and 7:30 AM to 7:59 AM (3,996, 17.9%) for females.
| Time of Departure | Male | Female |
| 12:00 AM to 4:59 AM | 3,388 (12.6%) | 1,101 (4.9%) |
| 5:00 AM to 5:29 AM | 2,461 (9.2%) | 816 (3.6%) |
| 5:30 AM to 5:59 AM | 2,300 (8.6%) | 1,008 (4.5%) |
| 6:00 AM to 6:29 AM | 2,840 (10.6%) | 1,254 (5.6%) |
| 6:30 AM to 6:59 AM | 2,925 (10.9%) | 1,664 (7.4%) |
| 7:00 AM to 7:29 AM | 2,605 (9.7%) | 2,797 (12.5%) |
| 7:30 AM to 7:59 AM | 2,079 (7.7%) | 3,996 (17.9%) |
| 8:00 AM to 8:29 AM | 1,759 (6.6%) | 2,750 (12.3%) |
| 8:30 AM to 8:59 AM | 617 (2.3%) | 1,120 (5.0%) |
| 9:00 AM to 9:59 AM | 703 (2.6%) | 1,271 (5.7%) |
| 10:00 AM to 10:59 AM | 277 (1.0%) | 439 (2.0%) |
| 11:00 AM to 11:59 AM | 177 (0.7%) | 170 (0.8%) |
| 12:00 PM to 3:59 PM | 2,722 (10.1%) | 2,190 (9.8%) |
| 4:00 PM to 11:59 PM | 2,007 (7.5%) | 1,792 (8.0%) |
| Total | 26,860 (100.0%) | 22,368 (100.0%) |
Housing Occupancy in LaSalle County
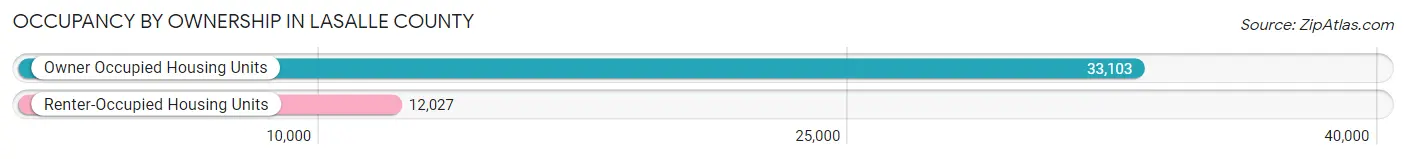
Occupancy by Ownership in LaSalle County
Of the total 45,130 dwellings in LaSalle County, owner-occupied units account for 33,103 (73.4%), while renter-occupied units make up 12,027 (26.7%).
| Occupancy | # Housing Units | % Housing Units |
| Owner Occupied Housing Units | 33,103 | 73.4% |
| Renter-Occupied Housing Units | 12,027 | 26.7% |
| Total Occupied Housing Units | 45,130 | 100.0% |
Occupancy by Household Size in LaSalle County
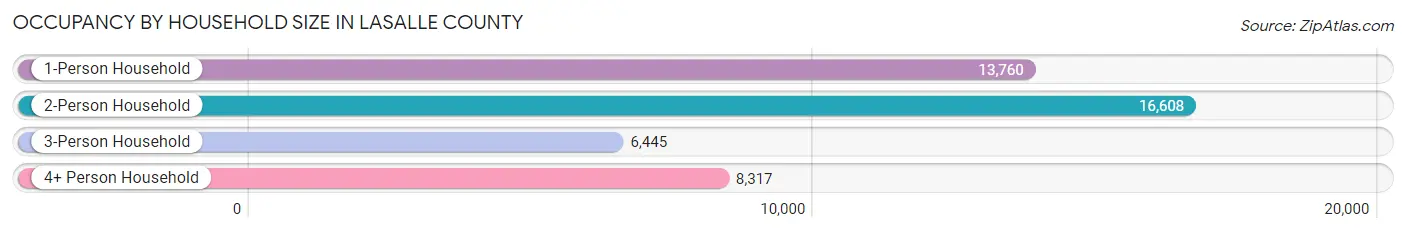
| Household Size | # Housing Units | % Housing Units |
| 1-Person Household | 13,760 | 30.5% |
| 2-Person Household | 16,608 | 36.8% |
| 3-Person Household | 6,445 | 14.3% |
| 4+ Person Household | 8,317 | 18.4% |
| Total Housing Units | 45,130 | 100.0% |
Occupancy by Ownership by Household Size in LaSalle County
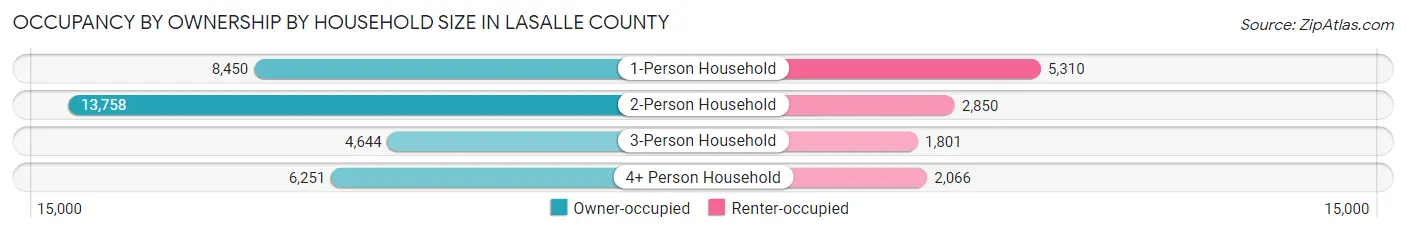
| Household Size | Owner-occupied | Renter-occupied |
| 1-Person Household | 8,450 (61.4%) | 5,310 (38.6%) |
| 2-Person Household | 13,758 (82.8%) | 2,850 (17.2%) |
| 3-Person Household | 4,644 (72.1%) | 1,801 (27.9%) |
| 4+ Person Household | 6,251 (75.2%) | 2,066 (24.8%) |
| Total Housing Units | 33,103 (73.4%) | 12,027 (26.7%) |
Occupancy by Educational Attainment in LaSalle County
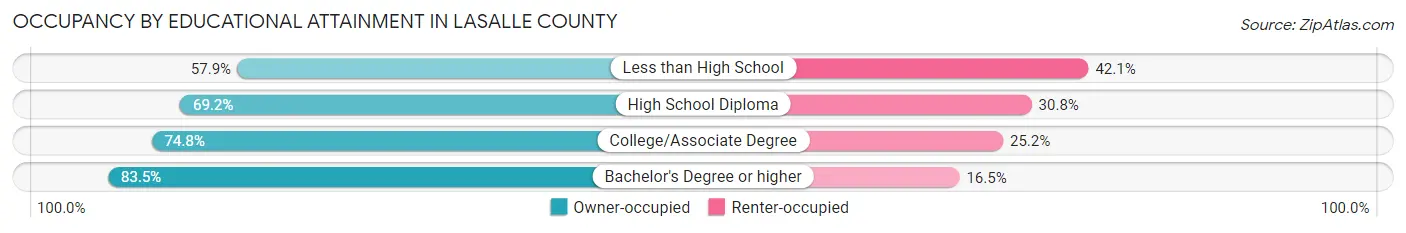
| Household Size | Owner-occupied | Renter-occupied |
| Less than High School | 2,029 (57.9%) | 1,475 (42.1%) |
| High School Diploma | 10,377 (69.2%) | 4,626 (30.8%) |
| College/Associate Degree | 13,243 (74.8%) | 4,451 (25.2%) |
| Bachelor's Degree or higher | 7,454 (83.5%) | 1,475 (16.5%) |
Occupancy by Age of Householder in LaSalle County
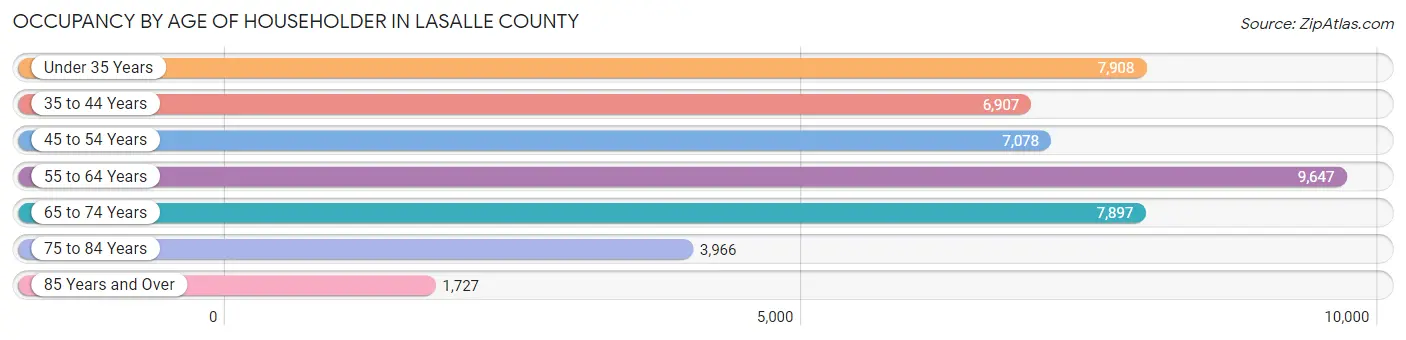
| Age Bracket | # Households | % Households |
| Under 35 Years | 7,908 | 17.5% |
| 35 to 44 Years | 6,907 | 15.3% |
| 45 to 54 Years | 7,078 | 15.7% |
| 55 to 64 Years | 9,647 | 21.4% |
| 65 to 74 Years | 7,897 | 17.5% |
| 75 to 84 Years | 3,966 | 8.8% |
| 85 Years and Over | 1,727 | 3.8% |
| Total | 45,130 | 100.0% |
Housing Finances in LaSalle County
Median Income by Occupancy in LaSalle County
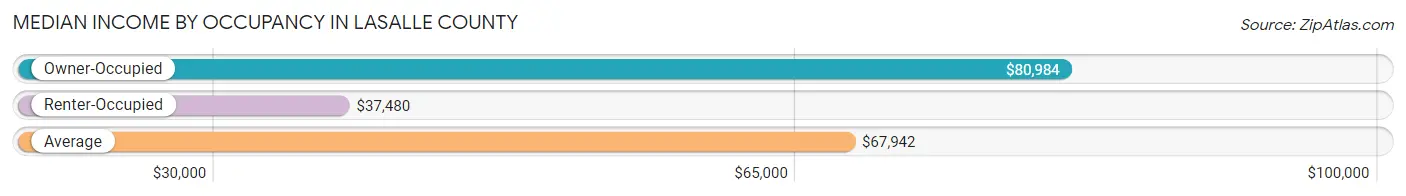
| Occupancy Type | # Households | Median Income |
| Owner-Occupied | 33,103 (73.4%) | $80,984 |
| Renter-Occupied | 12,027 (26.7%) | $37,480 |
| Average | 45,130 (100.0%) | $67,942 |
Occupancy by Householder Income Bracket in LaSalle County
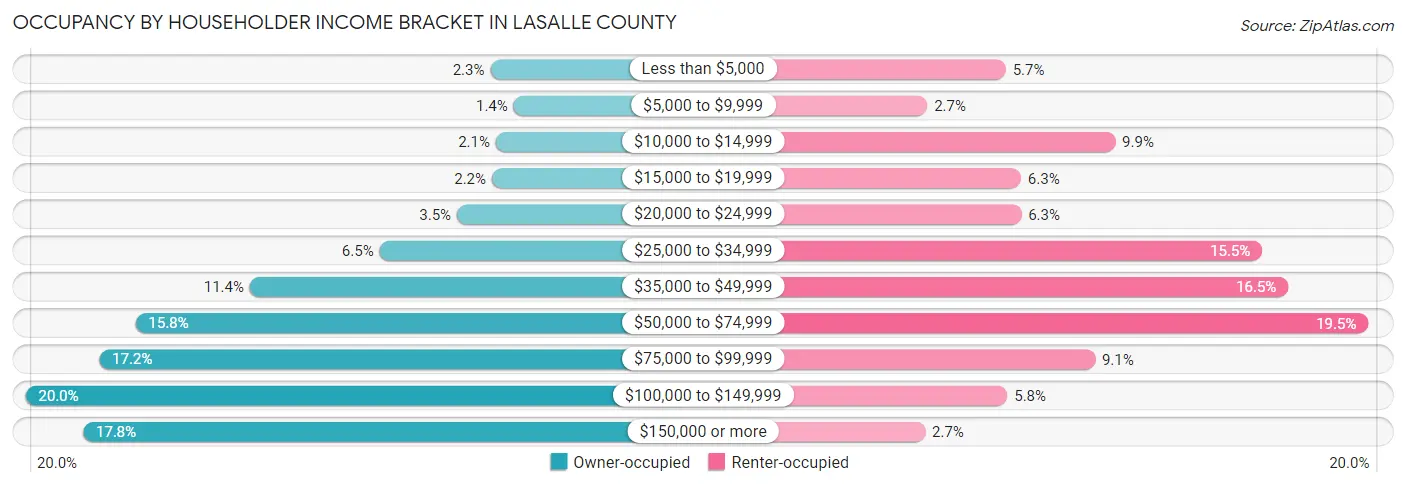
| Income Bracket | Owner-occupied | Renter-occupied |
| Less than $5,000 | 749 (2.3%) | 688 (5.7%) |
| $5,000 to $9,999 | 452 (1.4%) | 328 (2.7%) |
| $10,000 to $14,999 | 678 (2.1%) | 1,189 (9.9%) |
| $15,000 to $19,999 | 727 (2.2%) | 758 (6.3%) |
| $20,000 to $24,999 | 1,170 (3.5%) | 759 (6.3%) |
| $25,000 to $34,999 | 2,146 (6.5%) | 1,863 (15.5%) |
| $35,000 to $49,999 | 3,782 (11.4%) | 1,982 (16.5%) |
| $50,000 to $74,999 | 5,222 (15.8%) | 2,349 (19.5%) |
| $75,000 to $99,999 | 5,679 (17.2%) | 1,097 (9.1%) |
| $100,000 to $149,999 | 6,611 (20.0%) | 695 (5.8%) |
| $150,000 or more | 5,887 (17.8%) | 319 (2.6%) |
| Total | 33,103 (100.0%) | 12,027 (100.0%) |
Monthly Housing Cost Tiers in LaSalle County
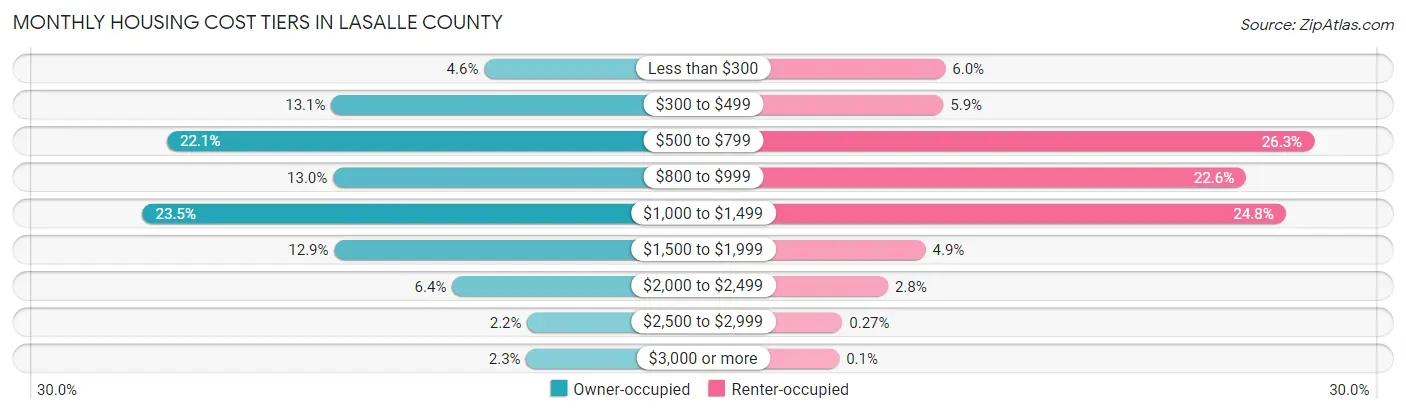
| Monthly Cost | Owner-occupied | Renter-occupied |
| Less than $300 | 1,525 (4.6%) | 717 (6.0%) |
| $300 to $499 | 4,323 (13.1%) | 704 (5.9%) |
| $500 to $799 | 7,325 (22.1%) | 3,165 (26.3%) |
| $800 to $999 | 4,290 (13.0%) | 2,714 (22.6%) |
| $1,000 to $1,499 | 7,771 (23.5%) | 2,977 (24.7%) |
| $1,500 to $1,999 | 4,267 (12.9%) | 586 (4.9%) |
| $2,000 to $2,499 | 2,111 (6.4%) | 335 (2.8%) |
| $2,500 to $2,999 | 737 (2.2%) | 32 (0.3%) |
| $3,000 or more | 754 (2.3%) | 12 (0.1%) |
| Total | 33,103 (100.0%) | 12,027 (100.0%) |
Physical Housing Characteristics in LaSalle County
Housing Structures in LaSalle County
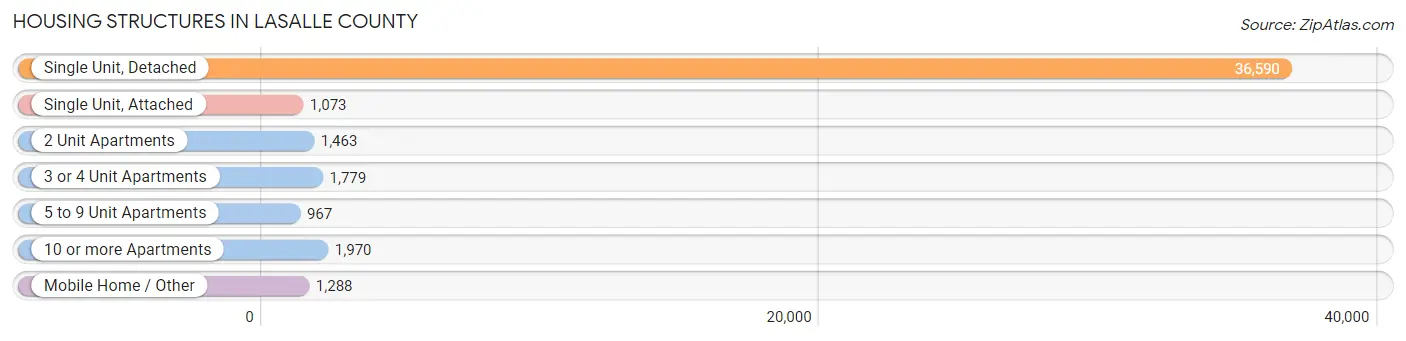
| Structure Type | # Housing Units | % Housing Units |
| Single Unit, Detached | 36,590 | 81.1% |
| Single Unit, Attached | 1,073 | 2.4% |
| 2 Unit Apartments | 1,463 | 3.2% |
| 3 or 4 Unit Apartments | 1,779 | 3.9% |
| 5 to 9 Unit Apartments | 967 | 2.1% |
| 10 or more Apartments | 1,970 | 4.4% |
| Mobile Home / Other | 1,288 | 2.9% |
| Total | 45,130 | 100.0% |
Housing Structures by Occupancy in LaSalle County
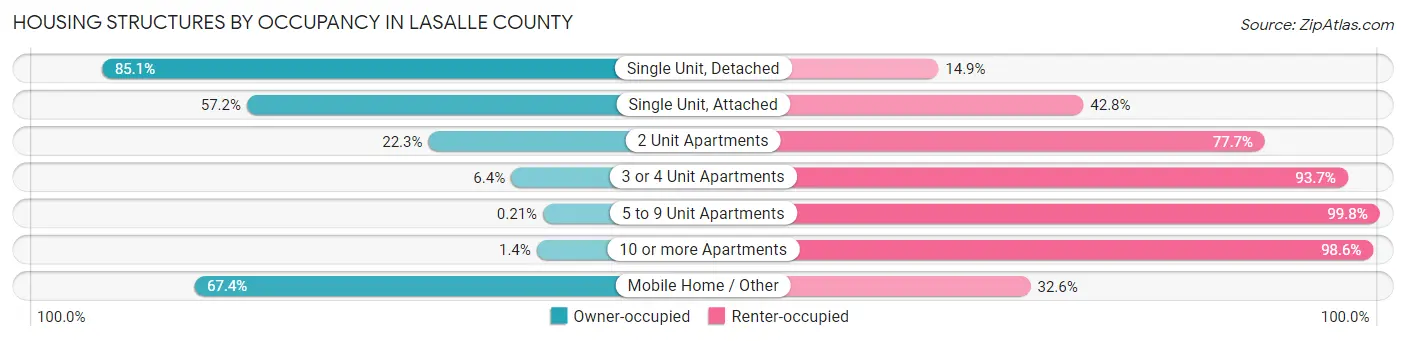
| Structure Type | Owner-occupied | Renter-occupied |
| Single Unit, Detached | 31,152 (85.1%) | 5,438 (14.9%) |
| Single Unit, Attached | 614 (57.2%) | 459 (42.8%) |
| 2 Unit Apartments | 326 (22.3%) | 1,137 (77.7%) |
| 3 or 4 Unit Apartments | 113 (6.4%) | 1,666 (93.6%) |
| 5 to 9 Unit Apartments | 2 (0.2%) | 965 (99.8%) |
| 10 or more Apartments | 28 (1.4%) | 1,942 (98.6%) |
| Mobile Home / Other | 868 (67.4%) | 420 (32.6%) |
| Total | 33,103 (73.4%) | 12,027 (26.7%) |
Housing Structures by Number of Rooms in LaSalle County
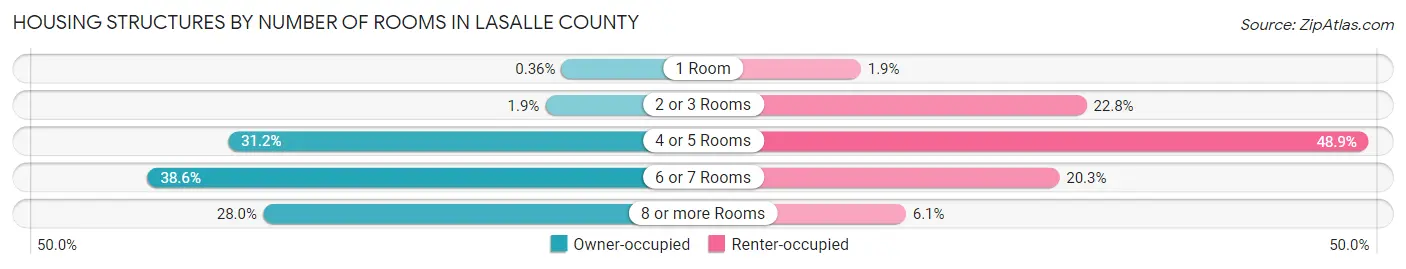
| Number of Rooms | Owner-occupied | Renter-occupied |
| 1 Room | 118 (0.4%) | 232 (1.9%) |
| 2 or 3 Rooms | 614 (1.8%) | 2,742 (22.8%) |
| 4 or 5 Rooms | 10,322 (31.2%) | 5,881 (48.9%) |
| 6 or 7 Rooms | 12,789 (38.6%) | 2,440 (20.3%) |
| 8 or more Rooms | 9,260 (28.0%) | 732 (6.1%) |
| Total | 33,103 (100.0%) | 12,027 (100.0%) |
Housing Structure by Heating Type in LaSalle County
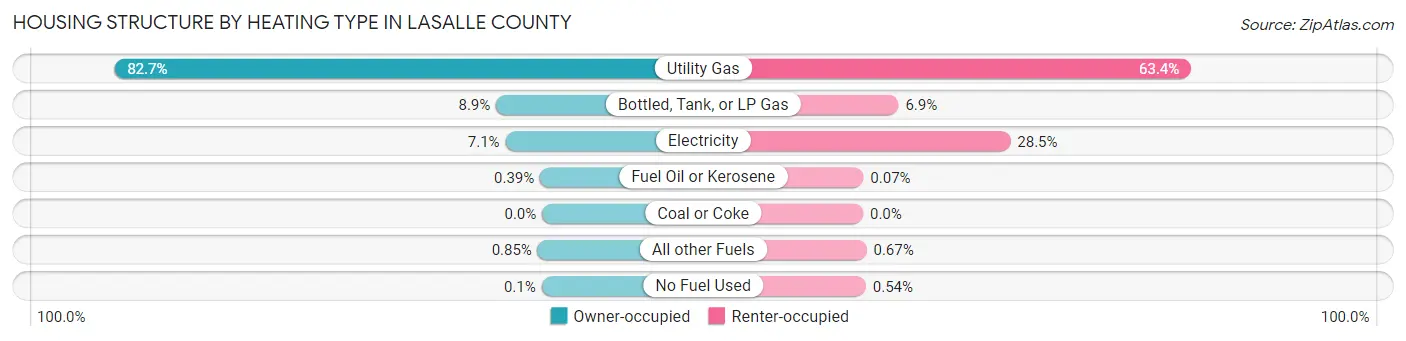
| Heating Type | Owner-occupied | Renter-occupied |
| Utility Gas | 27,368 (82.7%) | 7,624 (63.4%) |
| Bottled, Tank, or LP Gas | 2,943 (8.9%) | 824 (6.9%) |
| Electricity | 2,348 (7.1%) | 3,424 (28.5%) |
| Fuel Oil or Kerosene | 129 (0.4%) | 9 (0.1%) |
| Coal or Coke | 0 (0.0%) | 0 (0.0%) |
| All other Fuels | 281 (0.9%) | 81 (0.7%) |
| No Fuel Used | 34 (0.1%) | 65 (0.5%) |
| Total | 33,103 (100.0%) | 12,027 (100.0%) |
Household Vehicle Usage in LaSalle County
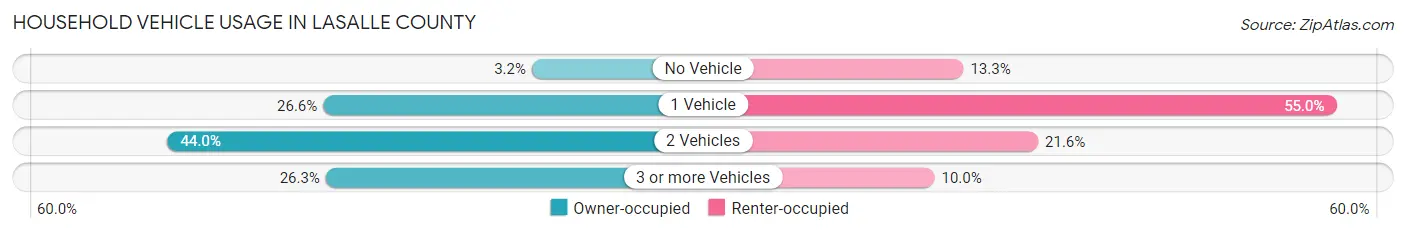
| Vehicles per Household | Owner-occupied | Renter-occupied |
| No Vehicle | 1,052 (3.2%) | 1,597 (13.3%) |
| 1 Vehicle | 8,791 (26.6%) | 6,619 (55.0%) |
| 2 Vehicles | 14,563 (44.0%) | 2,603 (21.6%) |
| 3 or more Vehicles | 8,697 (26.3%) | 1,208 (10.0%) |
| Total | 33,103 (100.0%) | 12,027 (100.0%) |
Real Estate & Mortgages in LaSalle County
Real Estate and Mortgage Overview in LaSalle County
| Characteristic | Without Mortgage | With Mortgage |
| Housing Units | 14,995 | 18,108 |
| Median Property Value | $131,600 | $159,000 |
| Median Household Income | $64,070 | $3,877 |
| Monthly Housing Costs | $572 | $734 |
| Real Estate Taxes | $2,842 | $279 |
Property Value by Mortgage Status in LaSalle County
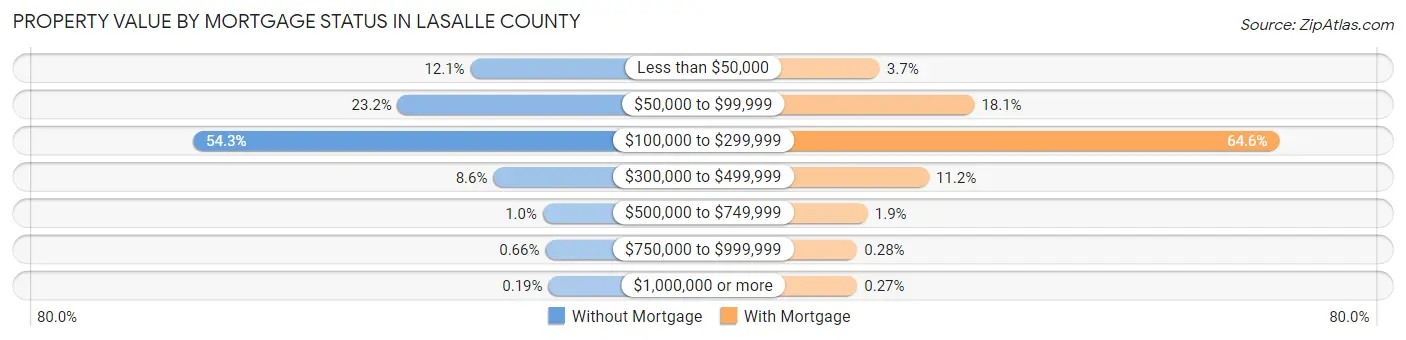
| Property Value | Without Mortgage | With Mortgage |
| Less than $50,000 | 1,809 (12.1%) | 671 (3.7%) |
| $50,000 to $99,999 | 3,472 (23.2%) | 3,282 (18.1%) |
| $100,000 to $299,999 | 8,144 (54.3%) | 11,691 (64.6%) |
| $300,000 to $499,999 | 1,287 (8.6%) | 2,027 (11.2%) |
| $500,000 to $749,999 | 156 (1.0%) | 338 (1.9%) |
| $750,000 to $999,999 | 99 (0.7%) | 51 (0.3%) |
| $1,000,000 or more | 28 (0.2%) | 48 (0.3%) |
| Total | 14,995 (100.0%) | 18,108 (100.0%) |
Household Income by Mortgage Status in LaSalle County
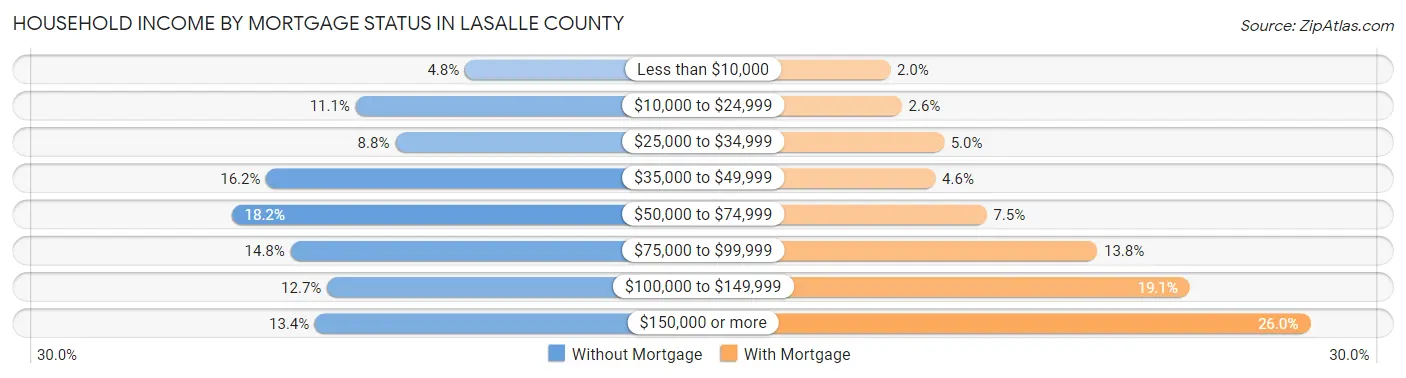
| Household Income | Without Mortgage | With Mortgage |
| Less than $10,000 | 724 (4.8%) | 356 (2.0%) |
| $10,000 to $24,999 | 1,662 (11.1%) | 477 (2.6%) |
| $25,000 to $34,999 | 1,322 (8.8%) | 913 (5.0%) |
| $35,000 to $49,999 | 2,427 (16.2%) | 824 (4.5%) |
| $50,000 to $74,999 | 2,724 (18.2%) | 1,355 (7.5%) |
| $75,000 to $99,999 | 2,220 (14.8%) | 2,498 (13.8%) |
| $100,000 to $149,999 | 1,906 (12.7%) | 3,459 (19.1%) |
| $150,000 or more | 2,010 (13.4%) | 4,705 (26.0%) |
| Total | 14,995 (100.0%) | 18,108 (100.0%) |
Property Value to Household Income Ratio in LaSalle County
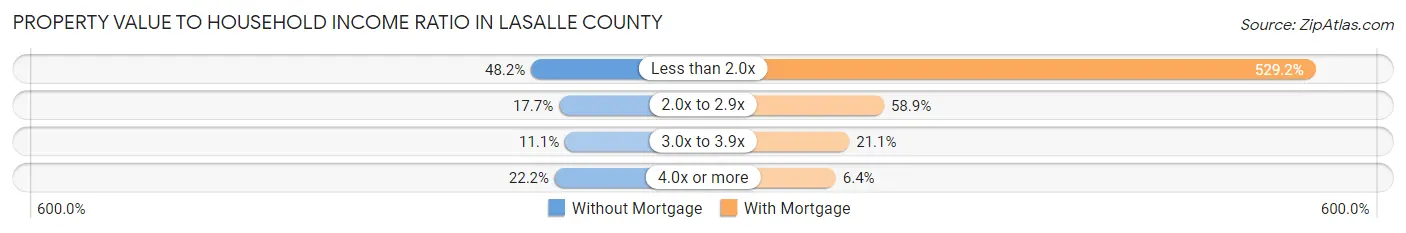
| Value-to-Income Ratio | Without Mortgage | With Mortgage |
| Less than 2.0x | 7,221 (48.2%) | 95,822 (529.2%) |
| 2.0x to 2.9x | 2,651 (17.7%) | 10,664 (58.9%) |
| 3.0x to 3.9x | 1,661 (11.1%) | 3,822 (21.1%) |
| 4.0x or more | 3,331 (22.2%) | 1,165 (6.4%) |
| Total | 14,995 (100.0%) | 18,108 (100.0%) |
Real Estate Taxes by Mortgage Status in LaSalle County
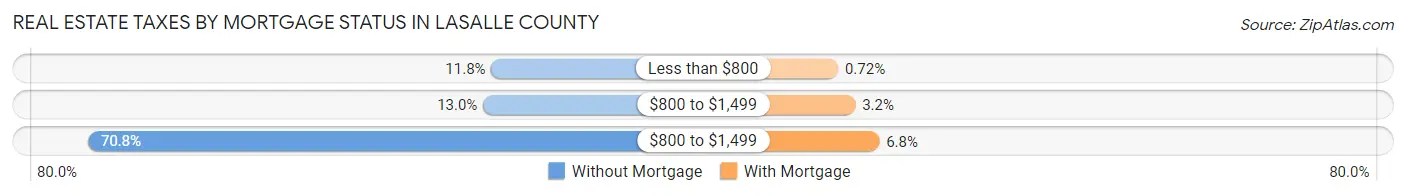
| Property Taxes | Without Mortgage | With Mortgage |
| Less than $800 | 1,768 (11.8%) | 130 (0.7%) |
| $800 to $1,499 | 1,948 (13.0%) | 586 (3.2%) |
| $800 to $1,499 | 10,611 (70.8%) | 1,223 (6.8%) |
| Total | 14,995 (100.0%) | 18,108 (100.0%) |
Health & Disability in LaSalle County
Health Insurance Coverage by Age in LaSalle County
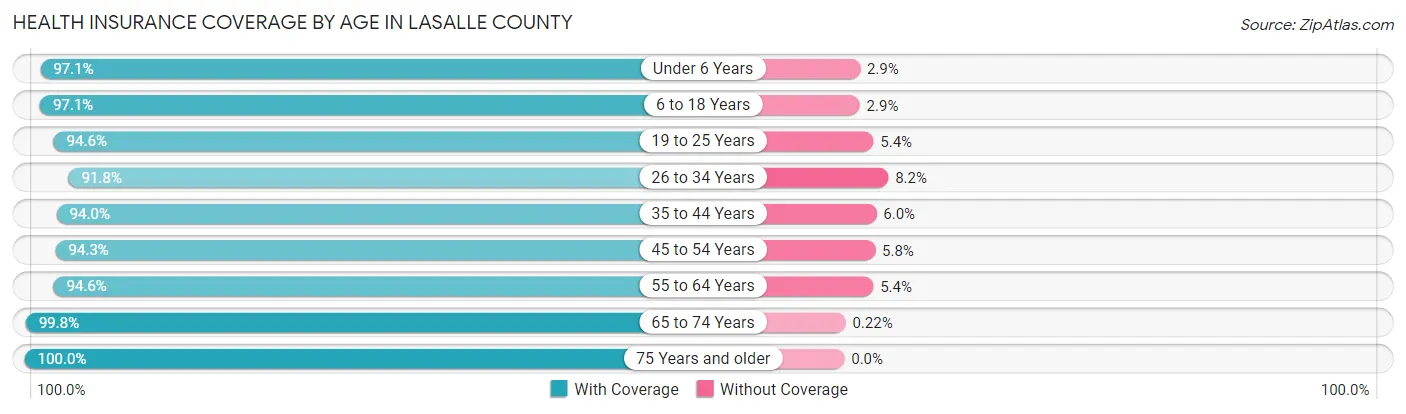
| Age Bracket | With Coverage | Without Coverage |
| Under 6 Years | 7,041 (97.1%) | 212 (2.9%) |
| 6 to 18 Years | 16,678 (97.1%) | 492 (2.9%) |
| 19 to 25 Years | 7,912 (94.6%) | 453 (5.4%) |
| 26 to 34 Years | 10,640 (91.8%) | 949 (8.2%) |
| 35 to 44 Years | 12,261 (94.0%) | 779 (6.0%) |
| 45 to 54 Years | 12,310 (94.3%) | 751 (5.8%) |
| 55 to 64 Years | 15,397 (94.6%) | 877 (5.4%) |
| 65 to 74 Years | 11,915 (99.8%) | 26 (0.2%) |
| 75 Years and older | 8,003 (100.0%) | 0 (0.0%) |
| Total | 102,157 (95.8%) | 4,539 (4.3%) |
Health Insurance Coverage by Citizenship Status in LaSalle County
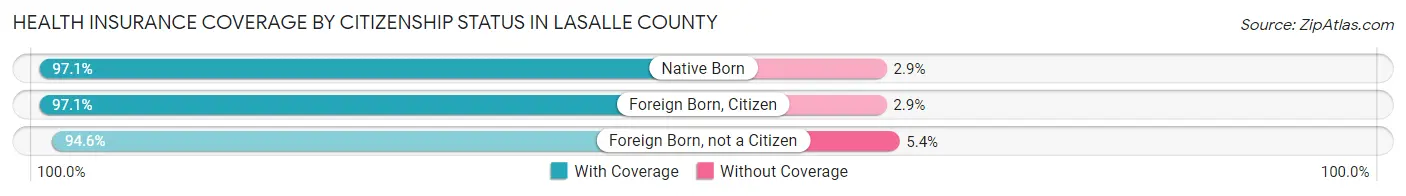
| Citizenship Status | With Coverage | Without Coverage |
| Native Born | 7,041 (97.1%) | 212 (2.9%) |
| Foreign Born, Citizen | 16,678 (97.1%) | 492 (2.9%) |
| Foreign Born, not a Citizen | 7,912 (94.6%) | 453 (5.4%) |
Health Insurance Coverage by Household Income in LaSalle County
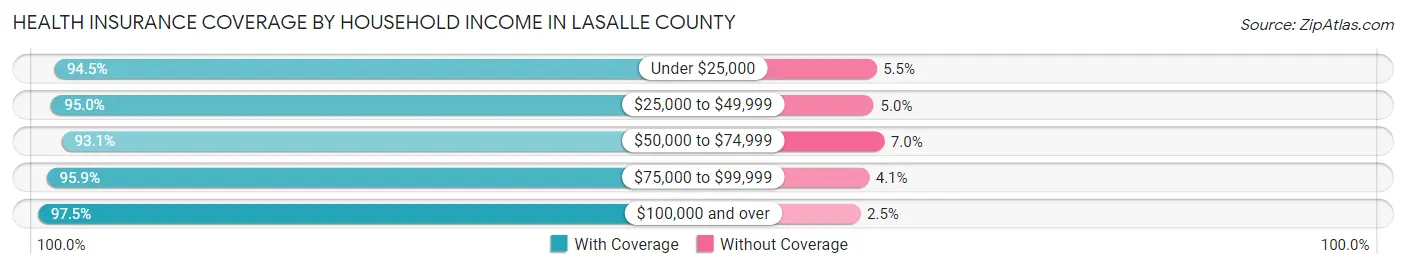
| Household Income | With Coverage | Without Coverage |
| Under $25,000 | 11,687 (94.5%) | 681 (5.5%) |
| $25,000 to $49,999 | 17,472 (95.0%) | 925 (5.0%) |
| $50,000 to $74,999 | 15,539 (93.0%) | 1,160 (7.0%) |
| $75,000 to $99,999 | 17,921 (95.9%) | 770 (4.1%) |
| $100,000 and over | 39,263 (97.5%) | 1,002 (2.5%) |
Public vs Private Health Insurance Coverage by Age in LaSalle County
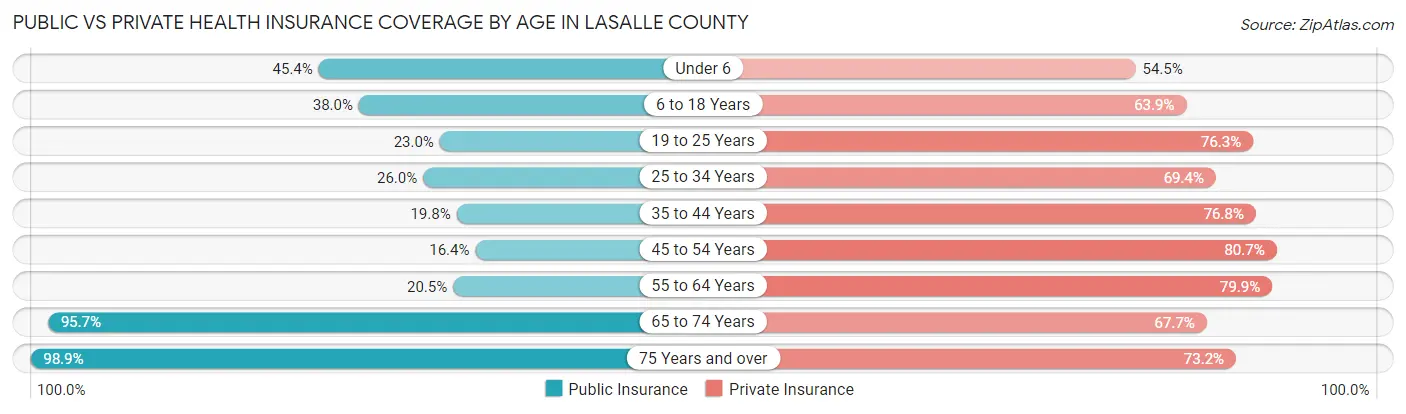
| Age Bracket | Public Insurance | Private Insurance |
| Under 6 | 3,295 (45.4%) | 3,955 (54.5%) |
| 6 to 18 Years | 6,519 (38.0%) | 10,977 (63.9%) |
| 19 to 25 Years | 1,920 (23.0%) | 6,385 (76.3%) |
| 25 to 34 Years | 3,018 (26.0%) | 8,043 (69.4%) |
| 35 to 44 Years | 2,587 (19.8%) | 10,018 (76.8%) |
| 45 to 54 Years | 2,135 (16.4%) | 10,537 (80.7%) |
| 55 to 64 Years | 3,331 (20.5%) | 12,996 (79.9%) |
| 65 to 74 Years | 11,428 (95.7%) | 8,086 (67.7%) |
| 75 Years and over | 7,918 (98.9%) | 5,854 (73.2%) |
| Total | 42,151 (39.5%) | 76,851 (72.0%) |
Disability Status by Sex by Age in LaSalle County
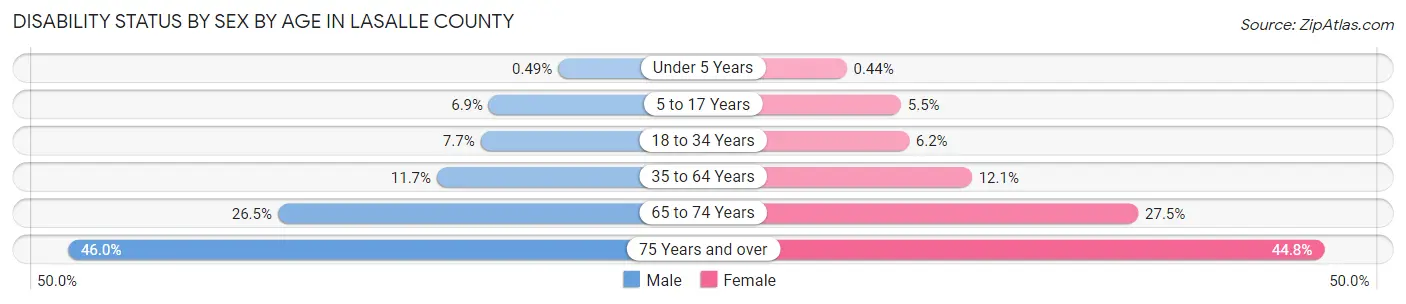
| Age Bracket | Male | Female |
| Under 5 Years | 15 (0.5%) | 12 (0.4%) |
| 5 to 17 Years | 618 (6.9%) | 466 (5.5%) |
| 18 to 34 Years | 833 (7.7%) | 642 (6.2%) |
| 35 to 64 Years | 2,531 (11.7%) | 2,510 (12.1%) |
| 65 to 74 Years | 1,562 (26.5%) | 1,663 (27.5%) |
| 75 Years and over | 1,487 (46.0%) | 2,134 (44.8%) |
Disability Class by Sex by Age in LaSalle County
Disability Class: Hearing Difficulty
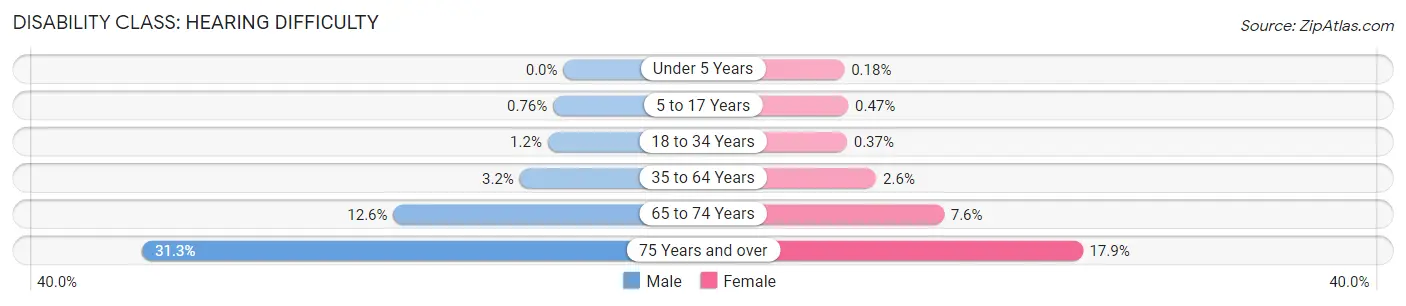
| Age Bracket | Male | Female |
| Under 5 Years | 0 (0.0%) | 5 (0.2%) |
| 5 to 17 Years | 68 (0.8%) | 40 (0.5%) |
| 18 to 34 Years | 126 (1.2%) | 38 (0.4%) |
| 35 to 64 Years | 698 (3.2%) | 531 (2.5%) |
| 65 to 74 Years | 744 (12.6%) | 458 (7.6%) |
| 75 Years and over | 1,012 (31.3%) | 852 (17.9%) |
Disability Class: Vision Difficulty
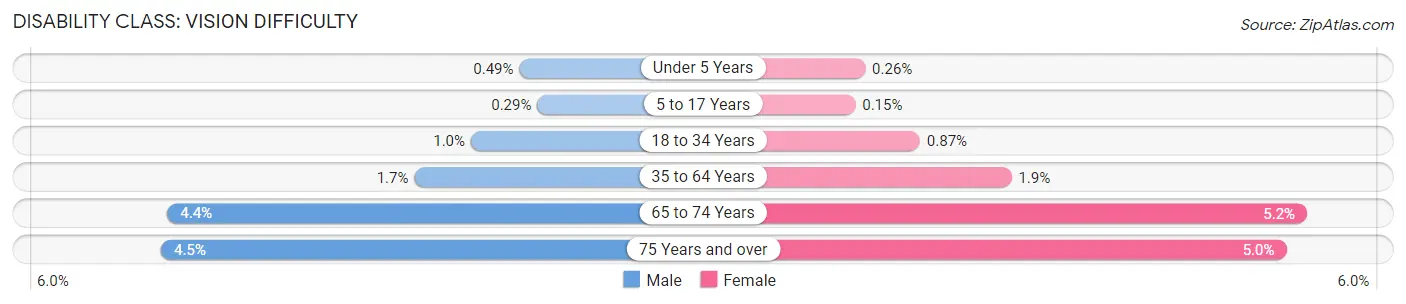
| Age Bracket | Male | Female |
| Under 5 Years | 15 (0.5%) | 7 (0.3%) |
| 5 to 17 Years | 26 (0.3%) | 13 (0.2%) |
| 18 to 34 Years | 112 (1.0%) | 90 (0.9%) |
| 35 to 64 Years | 359 (1.7%) | 394 (1.9%) |
| 65 to 74 Years | 260 (4.4%) | 313 (5.2%) |
| 75 Years and over | 145 (4.5%) | 236 (5.0%) |
Disability Class: Cognitive Difficulty
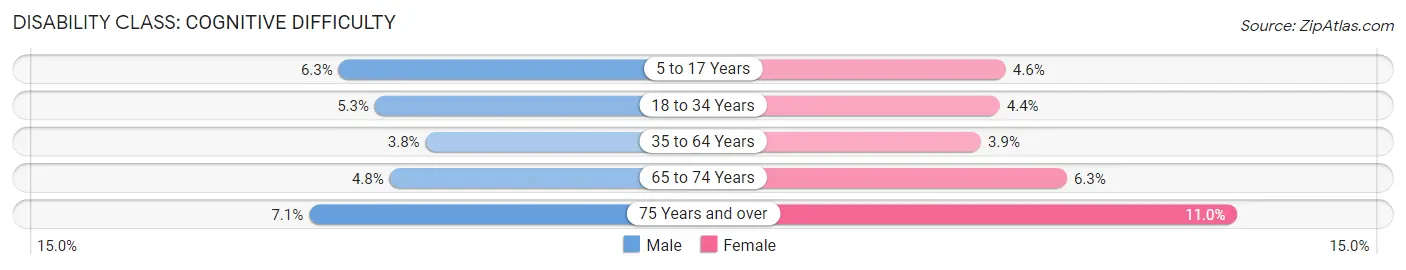
| Age Bracket | Male | Female |
| 5 to 17 Years | 560 (6.3%) | 388 (4.6%) |
| 18 to 34 Years | 568 (5.2%) | 454 (4.4%) |
| 35 to 64 Years | 829 (3.8%) | 808 (3.9%) |
| 65 to 74 Years | 285 (4.8%) | 379 (6.3%) |
| 75 Years and over | 229 (7.1%) | 525 (11.0%) |
Disability Class: Ambulatory Difficulty
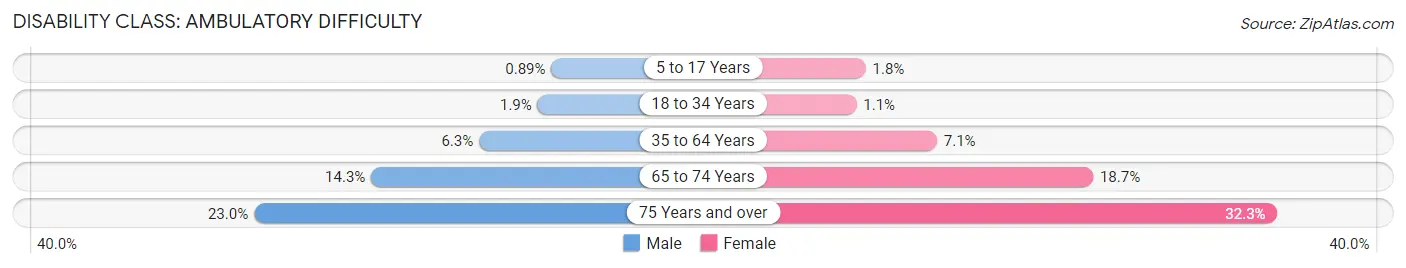
| Age Bracket | Male | Female |
| 5 to 17 Years | 80 (0.9%) | 150 (1.8%) |
| 18 to 34 Years | 207 (1.9%) | 112 (1.1%) |
| 35 to 64 Years | 1,351 (6.3%) | 1,469 (7.1%) |
| 65 to 74 Years | 841 (14.3%) | 1,128 (18.6%) |
| 75 Years and over | 743 (23.0%) | 1,542 (32.3%) |
Disability Class: Self-Care Difficulty
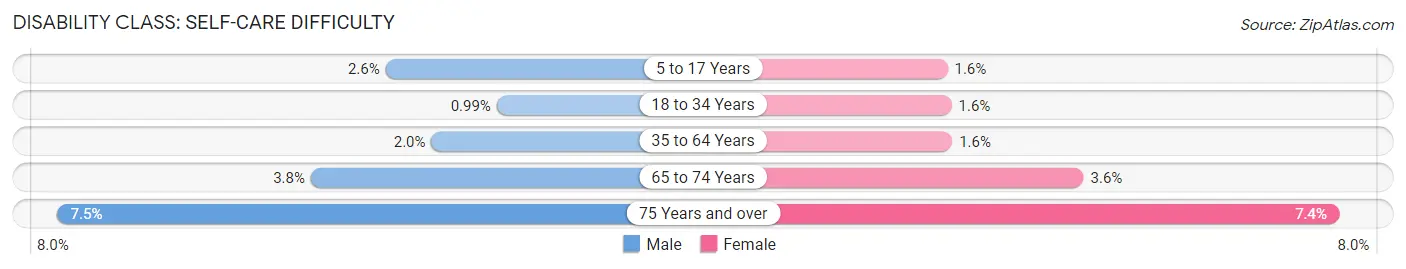
| Age Bracket | Male | Female |
| 5 to 17 Years | 236 (2.6%) | 133 (1.6%) |
| 18 to 34 Years | 107 (1.0%) | 168 (1.6%) |
| 35 to 64 Years | 423 (2.0%) | 342 (1.6%) |
| 65 to 74 Years | 221 (3.7%) | 217 (3.6%) |
| 75 Years and over | 243 (7.5%) | 352 (7.4%) |
Technology Access in LaSalle County
Computing Device Access in LaSalle County
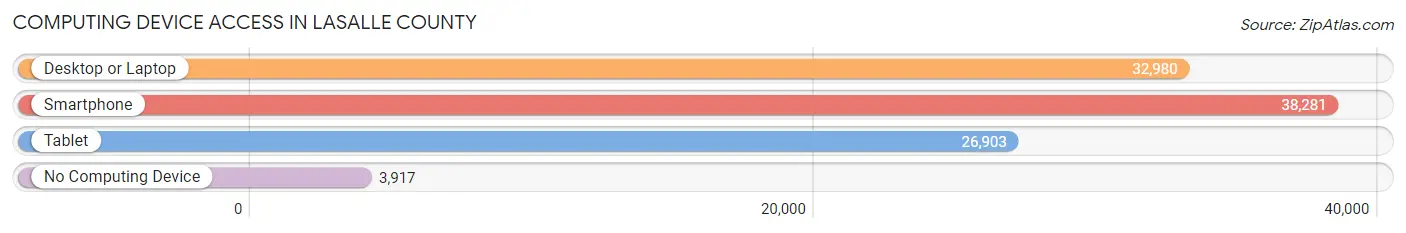
| Device Type | # Households | % Households |
| Desktop or Laptop | 32,980 | 73.1% |
| Smartphone | 38,281 | 84.8% |
| Tablet | 26,903 | 59.6% |
| No Computing Device | 3,917 | 8.7% |
| Total | 45,130 | 100.0% |
Internet Access in LaSalle County
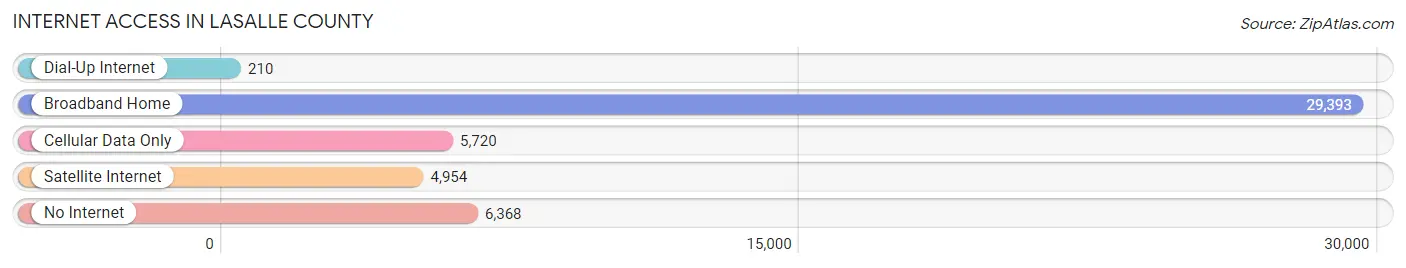
| Internet Type | # Households | % Households |
| Dial-Up Internet | 210 | 0.5% |
| Broadband Home | 29,393 | 65.1% |
| Cellular Data Only | 5,720 | 12.7% |
| Satellite Internet | 4,954 | 11.0% |
| No Internet | 6,368 | 14.1% |
| Total | 45,130 | 100.0% |
LaSalle County Summary
LaSalle County is located in the north-central region of Illinois, and is part of the Illinois Valley. It is bordered by Bureau, Putnam, Marshall, and Livingston counties to the north, Woodford and Tazewell counties to the east, McLean County to the south, and Lee and Ogle counties to the west. The county seat is Ottawa, and the largest city is Peru.
History
LaSalle County was established in 1831, and was named after the French explorer, Robert de La Salle. The county was originally part of the Northwest Territory, and was part of the Illinois Territory when it was created in 1809. The first settlers arrived in the area in the early 1800s, and the county was officially organized in 1831.
The county was initially divided into two townships, Ottawa and LaSalle. The county seat was established in Ottawa in 1831, and the county courthouse was built in 1834. The first railroad line was built in 1853, connecting Ottawa to Chicago.
Geography
LaSalle County covers an area of 1,092 square miles, and is located in the north-central region of Illinois. The county is mostly flat, with some rolling hills in the northern and western parts. The Illinois River runs through the county, and there are several small lakes and ponds scattered throughout the area.
The climate of LaSalle County is humid continental, with hot, humid summers and cold, snowy winters. The average annual temperature is around 50°F, and the average annual precipitation is around 36 inches.
Economy
The economy of LaSalle County is largely based on agriculture and manufacturing. The county is home to several large farms, and the main crops grown in the area are corn, soybeans, and wheat. The county is also home to several manufacturing companies, including Caterpillar, Inc., which has a large plant in the city of LaSalle.
The county is also home to several educational institutions, including Illinois Valley Community College, which is located in Oglesby. The county is also home to several state parks, including Starved Rock State Park, which is located in the city of Utica.
Demographics
As of the 2010 census, LaSalle County had a population of 111,449. The racial makeup of the county was 90.3% White, 4.3% African American, 0.5% Native American, 1.2% Asian, 0.1% Pacific Islander, 1.7% from other races, and 1.9% from two or more races. Hispanic or Latino of any race were 5.3% of the population.
The median income for a household in the county was $50,945, and the median income for a family was $60,945. The per capita income for the county was $24,845. About 8.3% of families and 11.2% of the population were below the poverty line, including 15.2% of those under age 18 and 6.2% of those age 65 or over.
Common Questions
What is the Total Population of LaSalle County?
Total Population of LaSalle County is 109,495.
What is the Total Male Population of LaSalle County?
Total Male Population of LaSalle County is 55,761.
What is the Total Female Population of LaSalle County?
Total Female Population of LaSalle County is 53,734.
What is the Ratio of Males per 100 Females in LaSalle County?
There are 103.77 Males per 100 Females in LaSalle County.
What is the Ratio of Females per 100 Males in LaSalle County?
There are 96.36 Females per 100 Males in LaSalle County.
What is the Median Population Age in LaSalle County?
Median Population Age in LaSalle County is 41.9 Years.
What is the Average Family Size in LaSalle County
Average Family Size in LaSalle County is 2.9 People.
What is the Average Household Size in LaSalle County
Average Household Size in LaSalle County is 2.4 People.
What is Per Capita Income in LaSalle County?
Per Capita income in LaSalle County is $36,060.
What is the Median Family Income in LaSalle County?
Median Family Income in LaSalle County is $83,830.
What is the Median Household income in LaSalle County?
Median Household Income in LaSalle County is $67,942.
What is Income or Wage Gap in LaSalle County?
Income or Wage Gap in LaSalle County is 42.7%.
Women in LaSalle County earn 57.3 cents for every dollar earned by a man.
What is Family Income Deficit in LaSalle County?
Family Income Deficit in LaSalle County is $10,456.
Families that are below poverty line in LaSalle County earn $10,456 less on average than the poverty threshold level.
What is Inequality or Gini Index in LaSalle County?
Inequality or Gini Index in LaSalle County is 0.43.
How Large is the Labor Force in LaSalle County?
There are 56,119 People in the Labor Forcein in LaSalle County.
What is the Percentage of People in the Labor Force in LaSalle County?
62.8% of People are in the Labor Force in LaSalle County.
What is the Unemployment Rate in LaSalle County?
Unemployment Rate in LaSalle County is 5.4%.