Lake County, IL
Lake County Map
Lake County Overview
713,159
TOTAL POPULATION
359,281
MALE POPULATION
353,878
FEMALE POPULATION
101.53
MALES / 100 FEMALES
98.50
FEMALES / 100 MALES
38.7
MEDIAN AGE
3.2
AVG FAMILY SIZE
2.7
AVG HOUSEHOLD SIZE
$53,677
PER CAPITA INCOME
$126,685
AVG FAMILY INCOME
$104,553
AVG HOUSEHOLD INCOME
30.0%
WAGE / INCOME GAP [ % ]
70.0¢/ $1
WAGE / INCOME GAP [ $ ]
$10,883
FAMILY INCOME DEFICIT
0.48
INEQUALITY / GINI INDEX
387,239
LABOR FORCE [ PEOPLE ]
68.3%
PERCENT IN LABOR FORCE
5.0%
UNEMPLOYMENT RATE
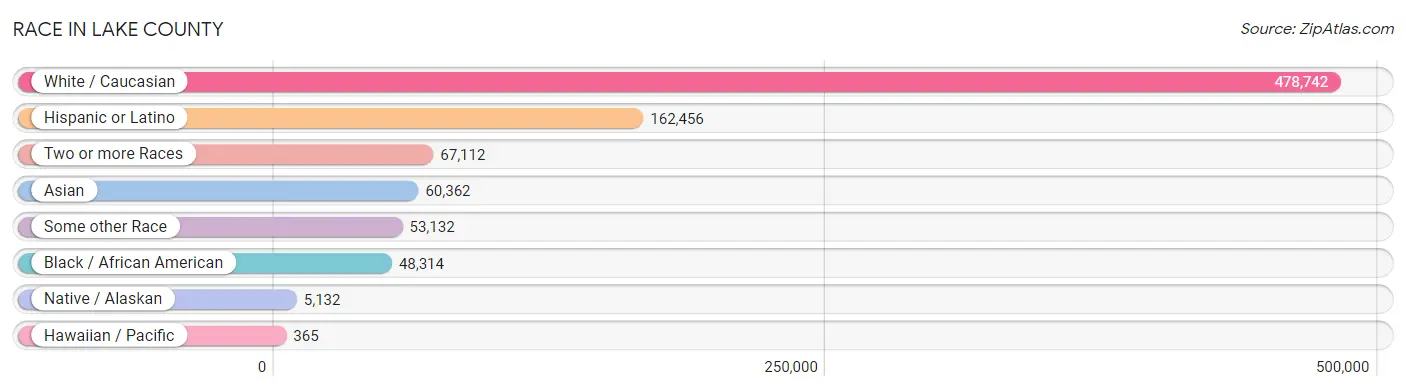
Race in Lake County
The most populous races in Lake County are White / Caucasian (478,742 | 67.1%), Hispanic or Latino (162,456 | 22.8%), and Two or more Races (67,112 | 9.4%).
| Race | # Population | % Population |
| Asian | 60,362 | 8.5% |
| Black / African American | 48,314 | 6.8% |
| Hawaiian / Pacific | 365 | 0.1% |
| Hispanic or Latino | 162,456 | 22.8% |
| Native / Alaskan | 5,132 | 0.7% |
| White / Caucasian | 478,742 | 67.1% |
| Two or more Races | 67,112 | 9.4% |
| Some other Race | 53,132 | 7.4% |
| Total | 713,159 | 100.0% |
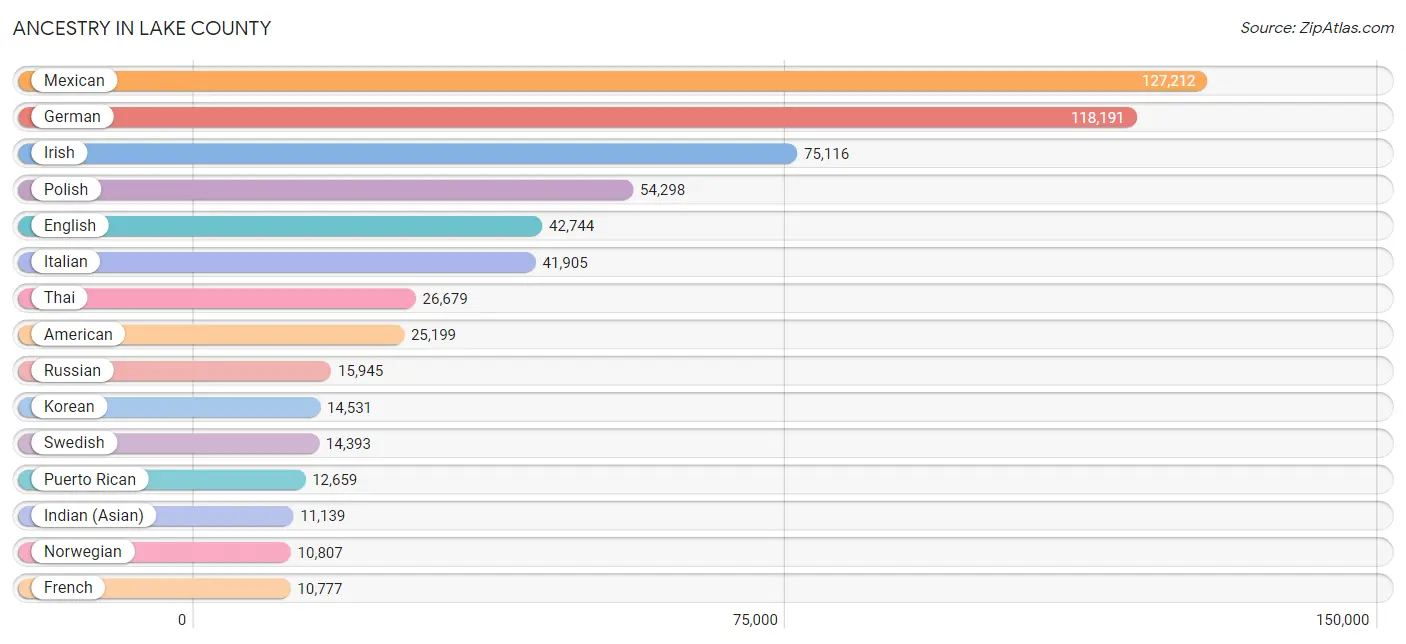
Ancestry in Lake County
The most populous ancestries reported in Lake County are Mexican (127,212 | 17.8%), German (118,191 | 16.6%), Irish (75,116 | 10.5%), Polish (54,298 | 7.6%), and English (42,744 | 6.0%), together accounting for 58.5% of all Lake County residents.
| Ancestry | # Population | % Population |
| Afghan | 15 | 0.0% |
| African | 2,257 | 0.3% |
| Alaska Native | 23 | 0.0% |
| Albanian | 155 | 0.0% |
| Aleut | 14 | 0.0% |
| American | 25,199 | 3.5% |
| Apache | 62 | 0.0% |
| Arab | 2,606 | 0.4% |
| Argentinean | 453 | 0.1% |
| Armenian | 922 | 0.1% |
| Assyrian / Chaldean / Syriac | 448 | 0.1% |
| Australian | 290 | 0.0% |
| Austrian | 2,786 | 0.4% |
| Bahamian | 54 | 0.0% |
| Bangladeshi | 114 | 0.0% |
| Barbadian | 51 | 0.0% |
| Belgian | 984 | 0.1% |
| Belizean | 1,614 | 0.2% |
| Bermudan | 6 | 0.0% |
| Bhutanese | 2,614 | 0.4% |
| Blackfeet | 239 | 0.0% |
| Bolivian | 182 | 0.0% |
| Brazilian | 522 | 0.1% |
| British | 3,147 | 0.4% |
| British West Indian | 299 | 0.0% |
| Bulgarian | 1,038 | 0.2% |
| Burmese | 7,181 | 1.0% |
| Cajun | 14 | 0.0% |
| Cambodian | 287 | 0.0% |
| Canadian | 1,105 | 0.2% |
| Cape Verdean | 25 | 0.0% |
| Carpatho Rusyn | 24 | 0.0% |
| Celtic | 22 | 0.0% |
| Central American | 9,394 | 1.3% |
| Central American Indian | 893 | 0.1% |
| Cherokee | 1,593 | 0.2% |
| Chickasaw | 74 | 0.0% |
| Chilean | 208 | 0.0% |
| Chippewa | 106 | 0.0% |
| Choctaw | 192 | 0.0% |
| Colombian | 1,812 | 0.3% |
| Comanche | 148 | 0.0% |
| Costa Rican | 68 | 0.0% |
| Cree | 24 | 0.0% |
| Creek | 33 | 0.0% |
| Croatian | 1,589 | 0.2% |
| Crow | 58 | 0.0% |
| Cuban | 1,738 | 0.2% |
| Cypriot | 10 | 0.0% |
| Czech | 4,543 | 0.6% |
| Czechoslovakian | 867 | 0.1% |
| Danish | 3,383 | 0.5% |
| Delaware | 1 | 0.0% |
| Dominican | 1,319 | 0.2% |
| Dutch | 6,263 | 0.9% |
| Eastern European | 7,080 | 1.0% |
| Ecuadorian | 1,311 | 0.2% |
| Egyptian | 378 | 0.1% |
| English | 42,744 | 6.0% |
| Estonian | 114 | 0.0% |
| Ethiopian | 68 | 0.0% |
| European | 10,120 | 1.4% |
| Filipino | 529 | 0.1% |
| Finnish | 2,455 | 0.3% |
| French | 10,777 | 1.5% |
| French American Indian | 32 | 0.0% |
| French Canadian | 2,336 | 0.3% |
| German | 118,191 | 16.6% |
| German Russian | 58 | 0.0% |
| Ghanaian | 343 | 0.1% |
| Greek | 6,211 | 0.9% |
| Guamanian / Chamorro | 66 | 0.0% |
| Guatemalan | 1,909 | 0.3% |
| Guyanese | 52 | 0.0% |
| Haitian | 611 | 0.1% |
| Honduran | 4,482 | 0.6% |
| Hungarian | 4,093 | 0.6% |
| Icelander | 87 | 0.0% |
| Indian (Asian) | 11,139 | 1.6% |
| Indonesian | 54 | 0.0% |
| Iranian | 1,049 | 0.2% |
| Iraqi | 256 | 0.0% |
| Irish | 75,116 | 10.5% |
| Iroquois | 48 | 0.0% |
| Israeli | 351 | 0.1% |
| Italian | 41,905 | 5.9% |
| Jamaican | 1,032 | 0.1% |
| Japanese | 867 | 0.1% |
| Jordanian | 171 | 0.0% |
| Kenyan | 236 | 0.0% |
| Korean | 14,531 | 2.0% |
| Laotian | 116 | 0.0% |
| Latvian | 686 | 0.1% |
| Lebanese | 540 | 0.1% |
| Liberian | 23 | 0.0% |
| Lithuanian | 4,297 | 0.6% |
| Lumbee | 5 | 0.0% |
| Luxembourger | 576 | 0.1% |
| Macedonian | 92 | 0.0% |
| Malaysian | 75 | 0.0% |
| Maltese | 67 | 0.0% |
| Menominee | 10 | 0.0% |
| Mexican | 127,212 | 17.8% |
| Mexican American Indian | 3,452 | 0.5% |
| Mongolian | 229 | 0.0% |
| Moroccan | 56 | 0.0% |
| Native Hawaiian | 591 | 0.1% |
| Navajo | 32 | 0.0% |
| Nicaraguan | 297 | 0.0% |
| Nigerian | 744 | 0.1% |
| Northern European | 745 | 0.1% |
| Norwegian | 10,807 | 1.5% |
| Okinawan | 18 | 0.0% |
| Osage | 28 | 0.0% |
| Pakistani | 401 | 0.1% |
| Palestinian | 333 | 0.1% |
| Panamanian | 232 | 0.0% |
| Pennsylvania German | 75 | 0.0% |
| Peruvian | 792 | 0.1% |
| Polish | 54,298 | 7.6% |
| Portuguese | 684 | 0.1% |
| Potawatomi | 61 | 0.0% |
| Pueblo | 11 | 0.0% |
| Puerto Rican | 12,659 | 1.8% |
| Romanian | 2,758 | 0.4% |
| Russian | 15,945 | 2.2% |
| Salvadoran | 2,347 | 0.3% |
| Samoan | 139 | 0.0% |
| Scandinavian | 2,208 | 0.3% |
| Scotch-Irish | 3,472 | 0.5% |
| Scottish | 9,099 | 1.3% |
| Seminole | 3 | 0.0% |
| Senegalese | 13 | 0.0% |
| Serbian | 897 | 0.1% |
| Sierra Leonean | 9 | 0.0% |
| Sioux | 138 | 0.0% |
| Slavic | 509 | 0.1% |
| Slovak | 1,533 | 0.2% |
| Slovene | 966 | 0.1% |
| South African | 268 | 0.0% |
| South American | 5,216 | 0.7% |
| South American Indian | 87 | 0.0% |
| Soviet Union | 75 | 0.0% |
| Spaniard | 983 | 0.1% |
| Spanish | 800 | 0.1% |
| Spanish American | 125 | 0.0% |
| Spanish American Indian | 8 | 0.0% |
| Sri Lankan | 1,594 | 0.2% |
| Subsaharan African | 4,418 | 0.6% |
| Swedish | 14,393 | 2.0% |
| Swiss | 1,494 | 0.2% |
| Syrian | 173 | 0.0% |
| Thai | 26,679 | 3.7% |
| Tlingit-Haida | 28 | 0.0% |
| Tongan | 70 | 0.0% |
| Trinidadian and Tobagonian | 93 | 0.0% |
| Turkish | 430 | 0.1% |
| U.S. Virgin Islander | 17 | 0.0% |
| Ugandan | 18 | 0.0% |
| Ukrainian | 5,446 | 0.8% |
| Uruguayan | 9 | 0.0% |
| Ute | 14 | 0.0% |
| Venezuelan | 449 | 0.1% |
| Vietnamese | 86 | 0.0% |
| Welsh | 1,771 | 0.3% |
| West Indian | 120 | 0.0% |
| Yugoslavian | 857 | 0.1% |
| Zimbabwean | 58 | 0.0% | View All 168 Rows |
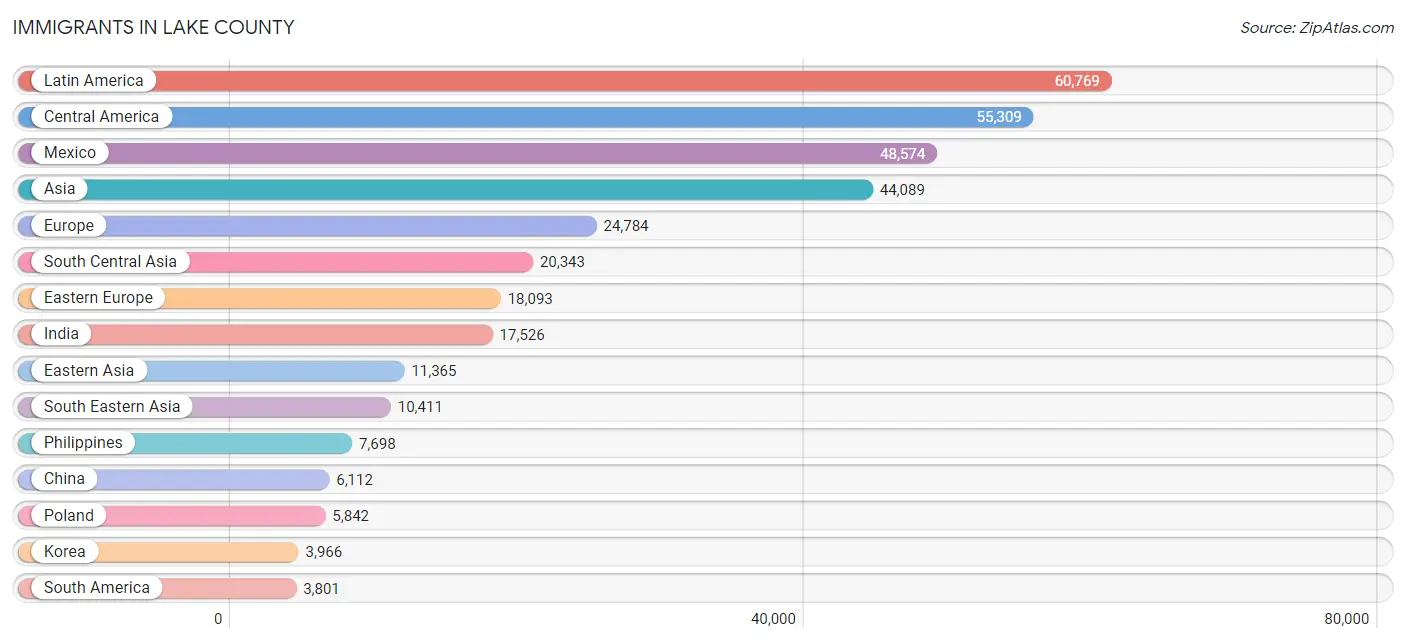
Immigrants in Lake County
The most numerous immigrant groups reported in Lake County came from Latin America (60,769 | 8.5%), Central America (55,309 | 7.8%), Mexico (48,574 | 6.8%), Asia (44,089 | 6.2%), and Europe (24,784 | 3.5%), together accounting for 32.8% of all Lake County residents.
| Immigration Origin | # Population | % Population |
| Afghanistan | 4 | 0.0% |
| Africa | 3,211 | 0.4% |
| Argentina | 225 | 0.0% |
| Armenia | 23 | 0.0% |
| Asia | 44,089 | 6.2% |
| Australia | 281 | 0.0% |
| Austria | 172 | 0.0% |
| Bangladesh | 221 | 0.0% |
| Barbados | 26 | 0.0% |
| Belarus | 1,034 | 0.1% |
| Belgium | 141 | 0.0% |
| Belize | 1,379 | 0.2% |
| Bolivia | 96 | 0.0% |
| Bosnia and Herzegovina | 178 | 0.0% |
| Brazil | 841 | 0.1% |
| Bulgaria | 915 | 0.1% |
| Cambodia | 509 | 0.1% |
| Cameroon | 78 | 0.0% |
| Canada | 1,442 | 0.2% |
| Caribbean | 1,659 | 0.2% |
| Central America | 55,309 | 7.8% |
| Chile | 73 | 0.0% |
| China | 6,112 | 0.9% |
| Colombia | 988 | 0.1% |
| Congo | 58 | 0.0% |
| Costa Rica | 23 | 0.0% |
| Croatia | 116 | 0.0% |
| Cuba | 504 | 0.1% |
| Czechoslovakia | 443 | 0.1% |
| Denmark | 78 | 0.0% |
| Dominican Republic | 376 | 0.1% |
| Eastern Africa | 558 | 0.1% |
| Eastern Asia | 11,365 | 1.6% |
| Eastern Europe | 18,093 | 2.5% |
| Ecuador | 497 | 0.1% |
| Egypt | 207 | 0.0% |
| El Salvador | 1,296 | 0.2% |
| England | 647 | 0.1% |
| Eritrea | 1 | 0.0% |
| Ethiopia | 149 | 0.0% |
| Europe | 24,784 | 3.5% |
| Fiji | 19 | 0.0% |
| France | 394 | 0.1% |
| Germany | 2,109 | 0.3% |
| Ghana | 209 | 0.0% |
| Greece | 450 | 0.1% |
| Guatemala | 1,053 | 0.2% |
| Guyana | 106 | 0.0% |
| Haiti | 277 | 0.0% |
| Honduras | 2,714 | 0.4% |
| Hong Kong | 248 | 0.0% |
| Hungary | 160 | 0.0% |
| India | 17,526 | 2.5% |
| Indonesia | 114 | 0.0% |
| Iran | 529 | 0.1% |
| Iraq | 397 | 0.1% |
| Ireland | 262 | 0.0% |
| Israel | 324 | 0.1% |
| Italy | 798 | 0.1% |
| Jamaica | 426 | 0.1% |
| Japan | 1,046 | 0.2% |
| Jordan | 46 | 0.0% |
| Kazakhstan | 198 | 0.0% |
| Kenya | 193 | 0.0% |
| Korea | 3,966 | 0.6% |
| Kuwait | 41 | 0.0% |
| Laos | 52 | 0.0% |
| Latin America | 60,769 | 8.5% |
| Latvia | 333 | 0.1% |
| Lebanon | 134 | 0.0% |
| Liberia | 11 | 0.0% |
| Lithuania | 449 | 0.1% |
| Malaysia | 139 | 0.0% |
| Mexico | 48,574 | 6.8% |
| Middle Africa | 600 | 0.1% |
| Moldova | 501 | 0.1% |
| Morocco | 151 | 0.0% |
| Nepal | 125 | 0.0% |
| Netherlands | 146 | 0.0% |
| Nicaragua | 161 | 0.0% |
| Nigeria | 468 | 0.1% |
| North Macedonia | 63 | 0.0% |
| Northern Africa | 430 | 0.1% |
| Northern Europe | 2,194 | 0.3% |
| Norway | 90 | 0.0% |
| Oceania | 519 | 0.1% |
| Pakistan | 1,285 | 0.2% |
| Panama | 109 | 0.0% |
| Peru | 500 | 0.1% |
| Philippines | 7,698 | 1.1% |
| Poland | 5,842 | 0.8% |
| Portugal | 7 | 0.0% |
| Romania | 1,131 | 0.2% |
| Russia | 2,230 | 0.3% |
| Saudi Arabia | 103 | 0.0% |
| Scotland | 56 | 0.0% |
| Senegal | 48 | 0.0% |
| Serbia | 239 | 0.0% |
| Singapore | 188 | 0.0% |
| Somalia | 10 | 0.0% |
| South Africa | 437 | 0.1% |
| South America | 3,801 | 0.5% |
| South Central Asia | 20,343 | 2.9% |
| South Eastern Asia | 10,411 | 1.5% |
| Southern Europe | 1,420 | 0.2% |
| Spain | 165 | 0.0% |
| Sri Lanka | 102 | 0.0% |
| St. Vincent and the Grenadines | 26 | 0.0% |
| Sweden | 54 | 0.0% |
| Switzerland | 47 | 0.0% |
| Syria | 205 | 0.0% |
| Taiwan | 594 | 0.1% |
| Thailand | 505 | 0.1% |
| Trinidad and Tobago | 24 | 0.0% |
| Turkey | 227 | 0.0% |
| Uganda | 38 | 0.0% |
| Ukraine | 3,532 | 0.5% |
| Uruguay | 15 | 0.0% |
| Uzbekistan | 177 | 0.0% |
| Venezuela | 453 | 0.1% |
| Vietnam | 1,206 | 0.2% |
| Western Africa | 1,085 | 0.2% |
| Western Asia | 1,805 | 0.3% |
| Western Europe | 3,009 | 0.4% |
| Zaire | 406 | 0.1% |
| Zimbabwe | 58 | 0.0% | View All 126 Rows |
Sex and Age in Lake County
Sex and Age in Lake County
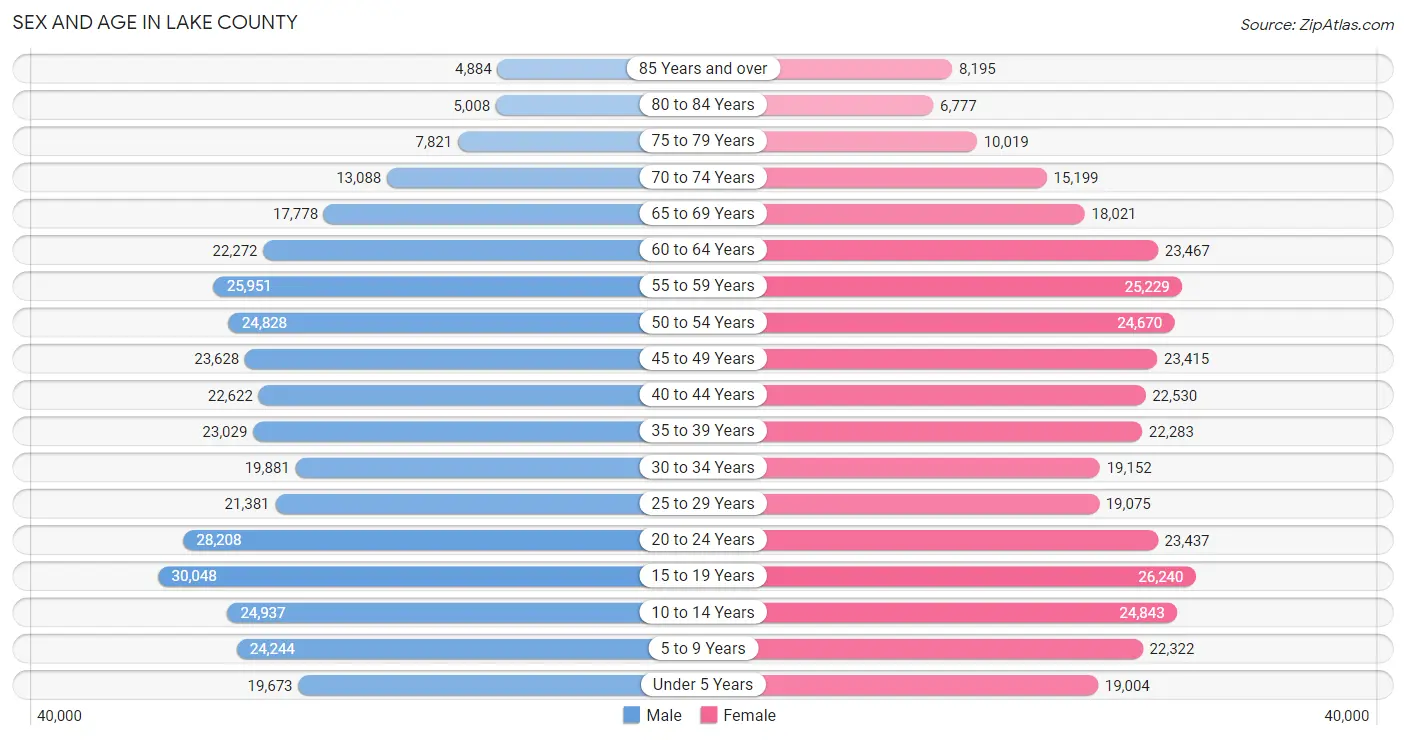
The most populous age groups in Lake County are 15 to 19 Years (30,048 | 8.4%) for men and 15 to 19 Years (26,240 | 7.4%) for women.
| Age Bracket | Male | Female |
| Under 5 Years | 19,673 (5.5%) | 19,004 (5.4%) |
| 5 to 9 Years | 24,244 (6.8%) | 22,322 (6.3%) |
| 10 to 14 Years | 24,937 (6.9%) | 24,843 (7.0%) |
| 15 to 19 Years | 30,048 (8.4%) | 26,240 (7.4%) |
| 20 to 24 Years | 28,208 (7.9%) | 23,437 (6.6%) |
| 25 to 29 Years | 21,381 (5.9%) | 19,075 (5.4%) |
| 30 to 34 Years | 19,881 (5.5%) | 19,152 (5.4%) |
| 35 to 39 Years | 23,029 (6.4%) | 22,283 (6.3%) |
| 40 to 44 Years | 22,622 (6.3%) | 22,530 (6.4%) |
| 45 to 49 Years | 23,628 (6.6%) | 23,415 (6.6%) |
| 50 to 54 Years | 24,828 (6.9%) | 24,670 (7.0%) |
| 55 to 59 Years | 25,951 (7.2%) | 25,229 (7.1%) |
| 60 to 64 Years | 22,272 (6.2%) | 23,467 (6.6%) |
| 65 to 69 Years | 17,778 (5.0%) | 18,021 (5.1%) |
| 70 to 74 Years | 13,088 (3.6%) | 15,199 (4.3%) |
| 75 to 79 Years | 7,821 (2.2%) | 10,019 (2.8%) |
| 80 to 84 Years | 5,008 (1.4%) | 6,777 (1.9%) |
| 85 Years and over | 4,884 (1.4%) | 8,195 (2.3%) |
| Total | 359,281 (100.0%) | 353,878 (100.0%) |
Families and Households in Lake County
Median Family Size in Lake County
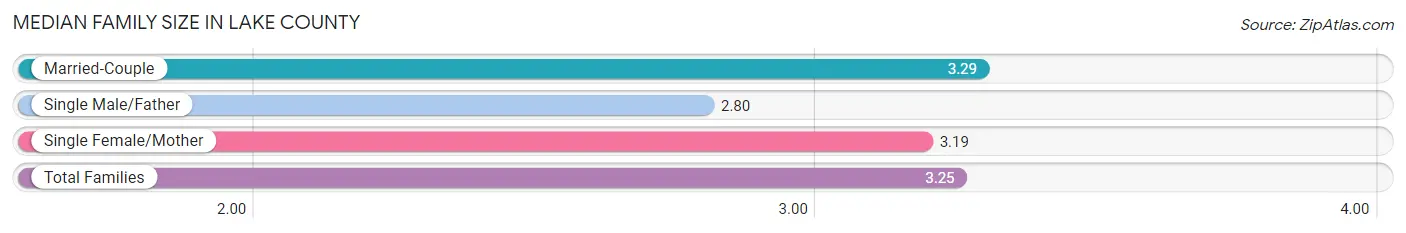
The median family size in Lake County is 3.25 persons per family, with married-couple families (147,034 | 80.1%) accounting for the largest median family size of 3.29 persons per family. On the other hand, single male/father families (11,039 | 6.0%) represent the smallest median family size with 2.80 persons per family.
| Family Type | # Families | Family Size |
| Married-Couple | 147,034 (80.1%) | 3.29 |
| Single Male/Father | 11,039 (6.0%) | 2.80 |
| Single Female/Mother | 25,532 (13.9%) | 3.19 |
| Total Families | 183,605 (100.0%) | 3.25 |
Median Household Size in Lake County
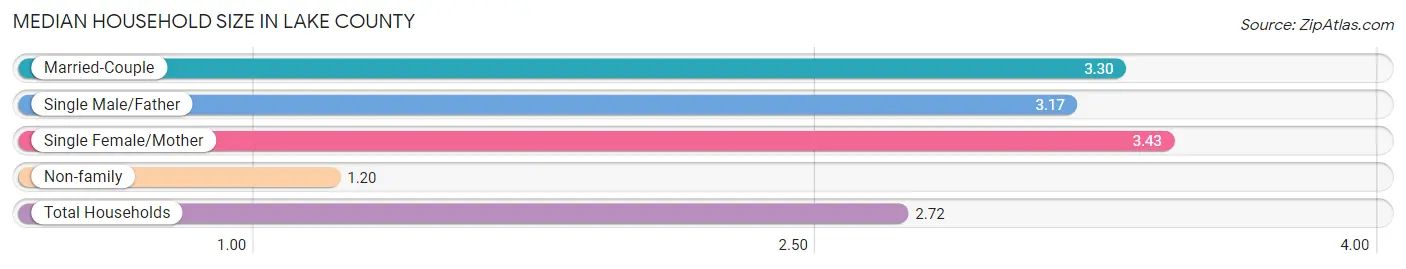
The median household size in Lake County is 2.72 persons per household, with single female/mother households (25,532 | 10.0%) accounting for the largest median household size of 3.43 persons per household. non-family households (71,189 | 27.9%) represent the smallest median household size with 1.20 persons per household.
| Household Type | # Households | Household Size |
| Married-Couple | 147,034 (57.7%) | 3.30 |
| Single Male/Father | 11,039 (4.3%) | 3.17 |
| Single Female/Mother | 25,532 (10.0%) | 3.43 |
| Non-family | 71,189 (27.9%) | 1.20 |
| Total Households | 254,794 (100.0%) | 2.72 |
Household Size by Marriage Status in Lake County
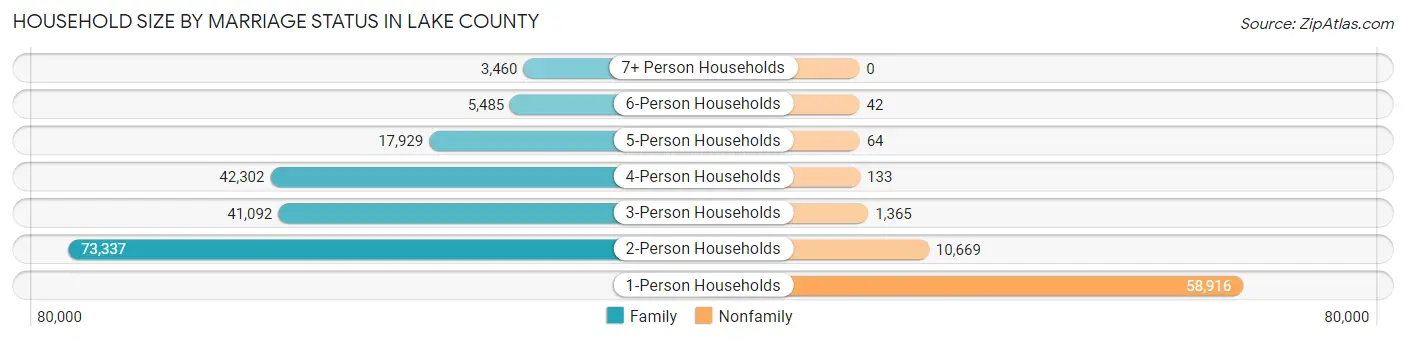
Out of a total of 254,794 households in Lake County, 183,605 (72.1%) are family households, while 71,189 (27.9%) are nonfamily households. The most numerous type of family households are 2-person households, comprising 73,337, and the most common type of nonfamily households are 1-person households, comprising 58,916.
| Household Size | Family Households | Nonfamily Households |
| 1-Person Households | - | 58,916 (23.1%) |
| 2-Person Households | 73,337 (28.8%) | 10,669 (4.2%) |
| 3-Person Households | 41,092 (16.1%) | 1,365 (0.5%) |
| 4-Person Households | 42,302 (16.6%) | 133 (0.1%) |
| 5-Person Households | 17,929 (7.0%) | 64 (0.0%) |
| 6-Person Households | 5,485 (2.1%) | 42 (0.0%) |
| 7+ Person Households | 3,460 (1.4%) | 0 (0.0%) |
| Total | 183,605 (72.1%) | 71,189 (27.9%) |
Female Fertility in Lake County
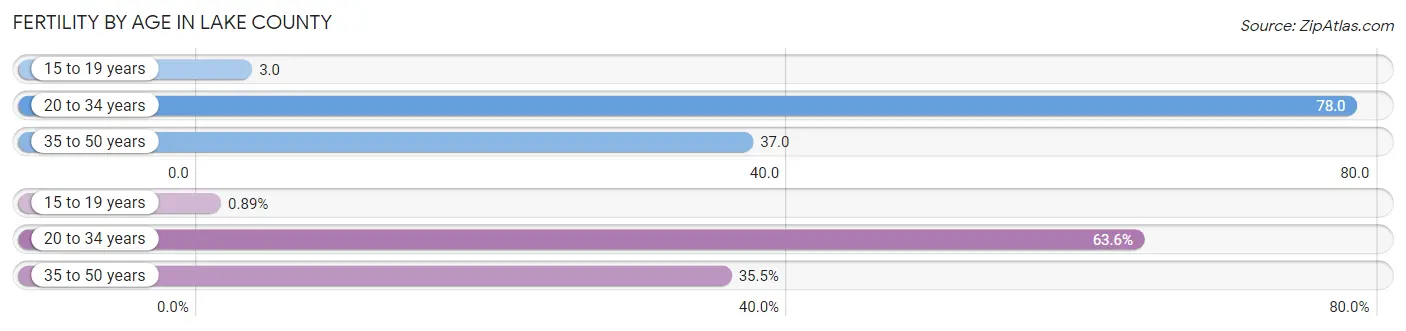
Fertility by Age in Lake County
Average fertility rate in Lake County is 47.0 births per 1,000 women. Women in the age bracket of 20 to 34 years have the highest fertility rate with 78.0 births per 1,000 women. Women in the age bracket of 20 to 34 years acount for 63.6% of all women with births.
| Age Bracket | Women with Births | Births / 1,000 Women |
| 15 to 19 years | 67 (0.9%) | 3.0 |
| 20 to 34 years | 4,787 (63.6%) | 78.0 |
| 35 to 50 years | 2,676 (35.5%) | 37.0 |
| Total | 7,530 (100.0%) | 47.0 |
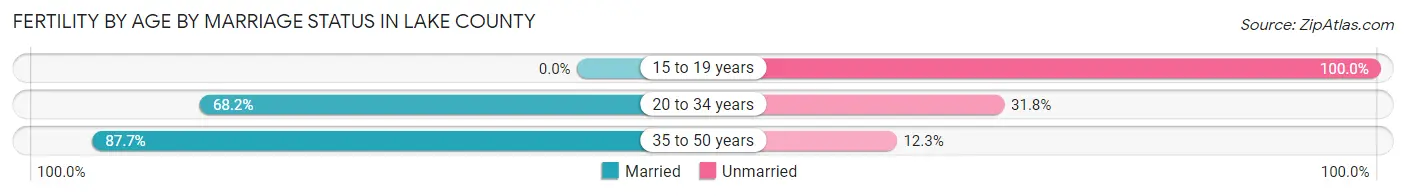
Fertility by Age by Marriage Status in Lake County
74.5% of women with births (7,530) in Lake County are married. The highest percentage of unmarried women with births falls into 15 to 19 years age bracket with 100.0% of them unmarried at the time of birth, while the lowest percentage of unmarried women with births belong to 35 to 50 years age bracket with 12.3% of them unmarried.
| Age Bracket | Married | Unmarried |
| 15 to 19 years | 0 (0.0%) | 67 (100.0%) |
| 20 to 34 years | 3,265 (68.2%) | 1,522 (31.8%) |
| 35 to 50 years | 2,347 (87.7%) | 329 (12.3%) |
| Total | 5,610 (74.5%) | 1,920 (25.5%) |
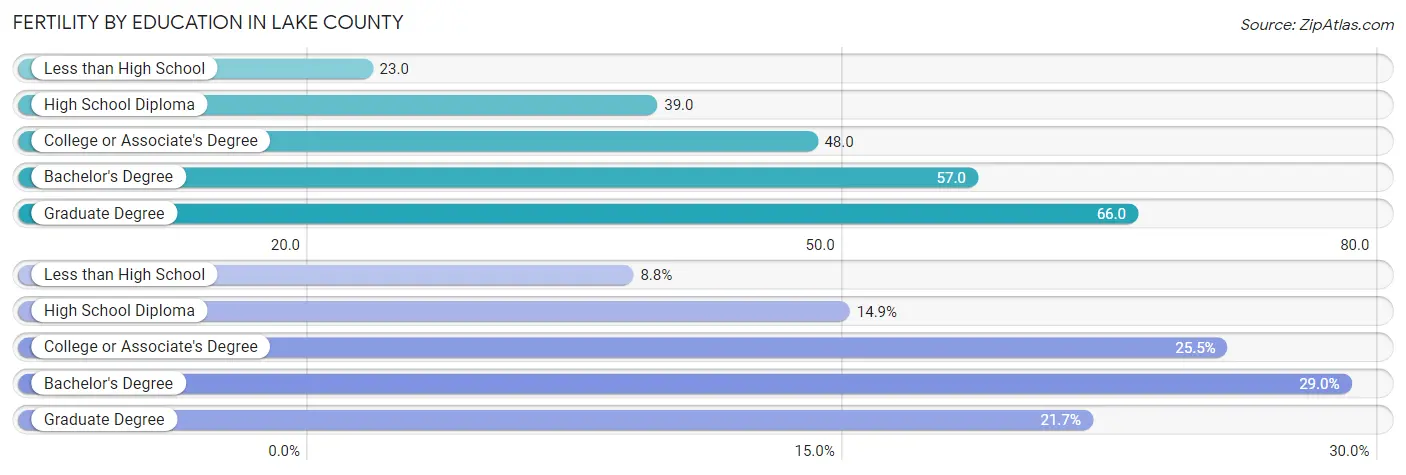
Fertility by Education in Lake County
Average fertility rate in Lake County is 47.0 births per 1,000 women. Women with the education attainment of graduate degree have the highest fertility rate of 66.0 births per 1,000 women, while women with the education attainment of less than high school have the lowest fertility at 23.0 births per 1,000 women. Women with the education attainment of bachelor's degree represent 29.0% of all women with births.
| Educational Attainment | Women with Births | Births / 1,000 Women |
| Less than High School | 665 (8.8%) | 23.0 |
| High School Diploma | 1,123 (14.9%) | 39.0 |
| College or Associate's Degree | 1,922 (25.5%) | 48.0 |
| Bachelor's Degree | 2,184 (29.0%) | 57.0 |
| Graduate Degree | 1,636 (21.7%) | 66.0 |
| Total | 7,530 (100.0%) | 47.0 |
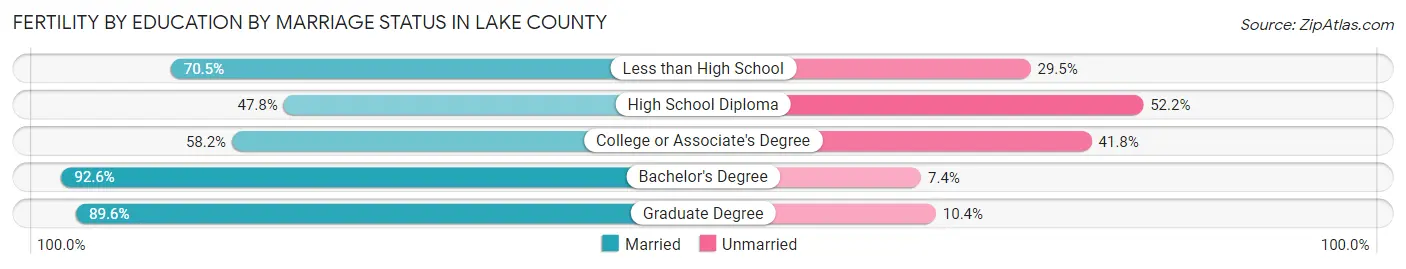
Fertility by Education by Marriage Status in Lake County
25.5% of women with births in Lake County are unmarried. Women with the educational attainment of bachelor's degree are most likely to be married with 92.6% of them married at childbirth, while women with the educational attainment of high school diploma are least likely to be married with 52.2% of them unmarried at childbirth.
| Educational Attainment | Married | Unmarried |
| Less than High School | 469 (70.5%) | 196 (29.5%) |
| High School Diploma | 537 (47.8%) | 586 (52.2%) |
| College or Associate's Degree | 1,119 (58.2%) | 803 (41.8%) |
| Bachelor's Degree | 2,022 (92.6%) | 162 (7.4%) |
| Graduate Degree | 1,466 (89.6%) | 170 (10.4%) |
| Total | 5,610 (74.5%) | 1,920 (25.5%) |
Income in Lake County
Income Overview in Lake County
Per Capita Income in Lake County is $53,677, while median incomes of families and households are $126,685 and $104,553 respectively.
| Characteristic | Number | Measure |
| Per Capita Income | 713,159 | $53,677 |
| Median Family Income | 183,605 | $126,685 |
| Mean Family Income | 183,605 | $171,390 |
| Median Household Income | 254,794 | $104,553 |
| Mean Household Income | 254,794 | $147,075 |
| Income Deficit | 183,605 | $10,883 |
| Wage / Income Gap (%) | 713,159 | 30.04% |
| Wage / Income Gap ($) | 713,159 | 69.96¢ per $1 |
| Gini / Inequality Index | 713,159 | 0.48 |
Earnings by Sex in Lake County
Average Earnings in Lake County are $47,450, $56,527 for men and $39,544 for women, a difference of 30.0%.
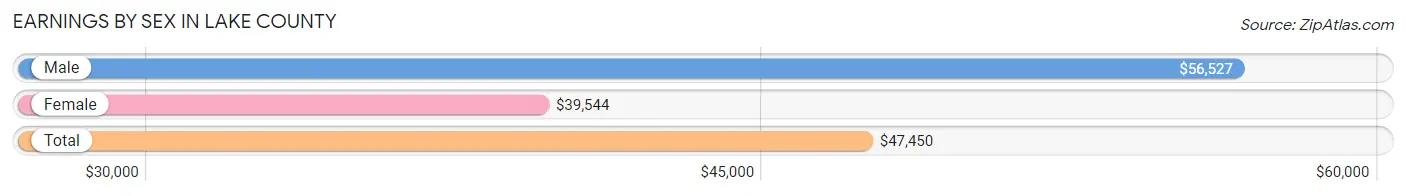
| Sex | Number | Average Earnings |
| Male | 220,428 (54.7%) | $56,527 |
| Female | 182,589 (45.3%) | $39,544 |
| Total | 403,017 (100.0%) | $47,450 |
Earnings by Sex by Income Bracket in Lake County
The most common earnings brackets in Lake County are $100,000+ for men (64,773 | 29.4%) and $100,000+ for women (29,101 | 15.9%).
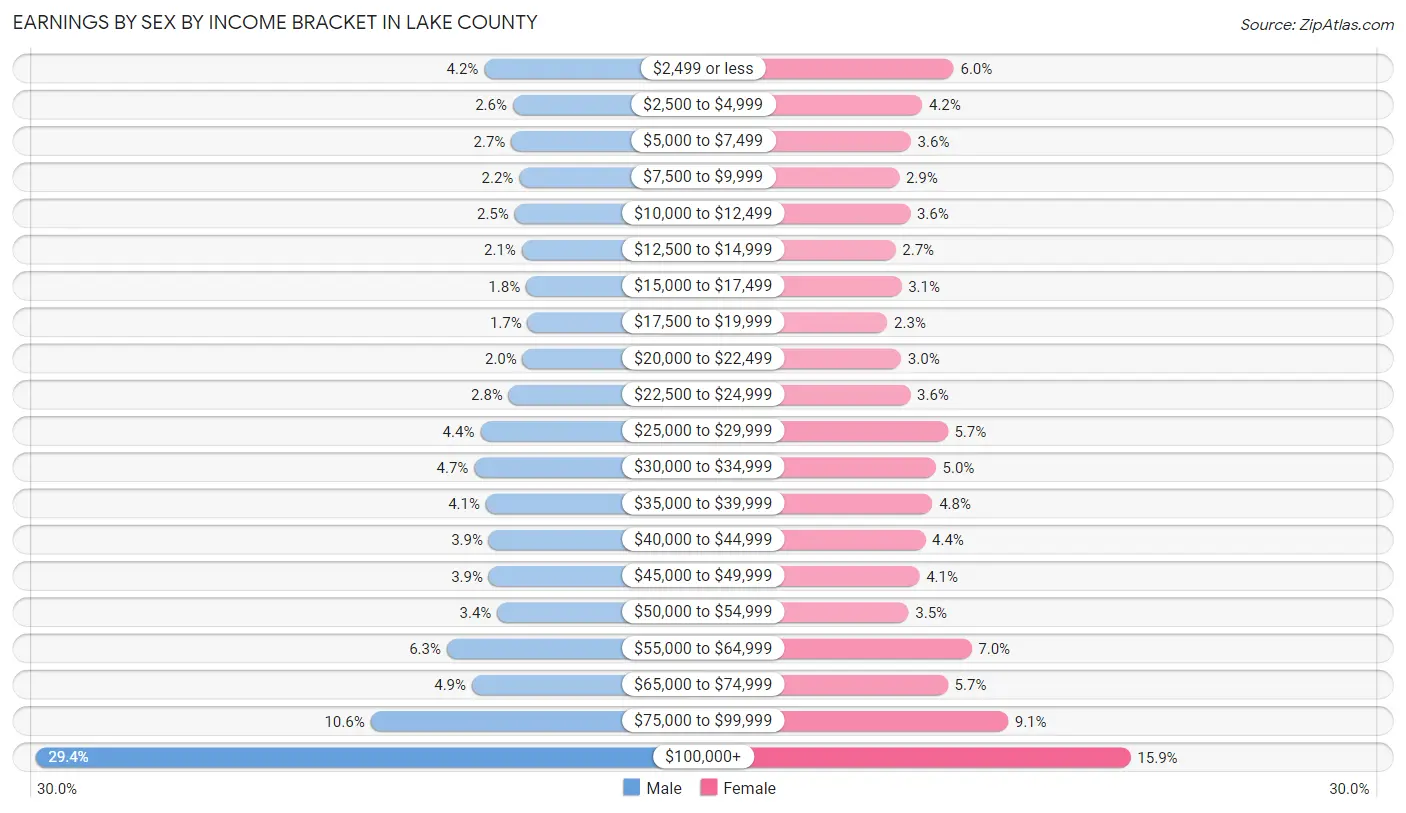
| Income | Male | Female |
| $2,499 or less | 9,197 (4.2%) | 10,952 (6.0%) |
| $2,500 to $4,999 | 5,637 (2.6%) | 7,730 (4.2%) |
| $5,000 to $7,499 | 5,852 (2.6%) | 6,552 (3.6%) |
| $7,500 to $9,999 | 4,844 (2.2%) | 5,345 (2.9%) |
| $10,000 to $12,499 | 5,413 (2.5%) | 6,481 (3.5%) |
| $12,500 to $14,999 | 4,547 (2.1%) | 4,977 (2.7%) |
| $15,000 to $17,499 | 4,019 (1.8%) | 5,595 (3.1%) |
| $17,500 to $19,999 | 3,818 (1.7%) | 4,144 (2.3%) |
| $20,000 to $22,499 | 4,424 (2.0%) | 5,555 (3.0%) |
| $22,500 to $24,999 | 6,157 (2.8%) | 6,509 (3.6%) |
| $25,000 to $29,999 | 9,683 (4.4%) | 10,341 (5.7%) |
| $30,000 to $34,999 | 10,433 (4.7%) | 9,113 (5.0%) |
| $35,000 to $39,999 | 8,985 (4.1%) | 8,764 (4.8%) |
| $40,000 to $44,999 | 8,620 (3.9%) | 8,035 (4.4%) |
| $45,000 to $49,999 | 8,618 (3.9%) | 7,425 (4.1%) |
| $50,000 to $54,999 | 7,576 (3.4%) | 6,323 (3.5%) |
| $55,000 to $64,999 | 13,824 (6.3%) | 12,778 (7.0%) |
| $65,000 to $74,999 | 10,723 (4.9%) | 10,344 (5.7%) |
| $75,000 to $99,999 | 23,285 (10.6%) | 16,525 (9.0%) |
| $100,000+ | 64,773 (29.4%) | 29,101 (15.9%) |
| Total | 220,428 (100.0%) | 182,589 (100.0%) |
Earnings by Sex by Educational Attainment in Lake County
Average earnings in Lake County are $71,339 for men and $47,609 for women, a difference of 33.3%. Men with an educational attainment of graduate degree enjoy the highest average annual earnings of $137,104, while those with less than high school education earn the least with $35,829. Women with an educational attainment of graduate degree earn the most with the average annual earnings of $81,089, while those with less than high school education have the smallest earnings of $23,620.
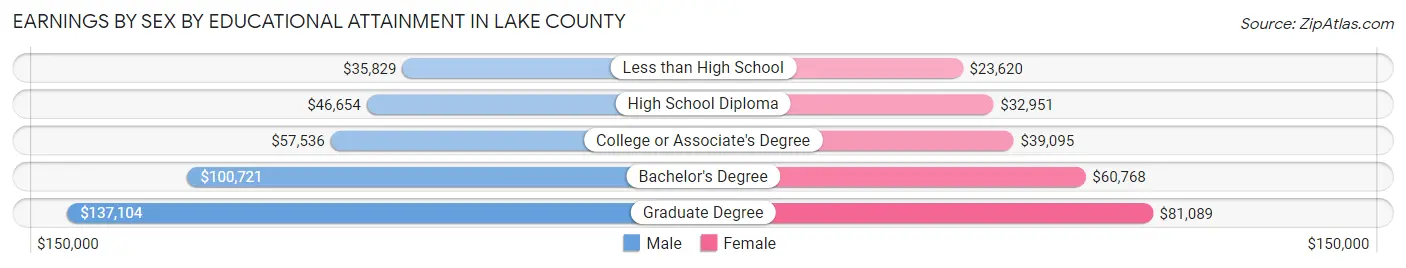
| Educational Attainment | Male Income | Female Income |
| Less than High School | $35,829 | $23,620 |
| High School Diploma | $46,654 | $32,951 |
| College or Associate's Degree | $57,536 | $39,095 |
| Bachelor's Degree | $100,721 | $60,768 |
| Graduate Degree | $137,104 | $81,089 |
| Total | $71,339 | $47,609 |
Family Income in Lake County
Family Income Brackets in Lake County
According to the Lake County family income data, there are 49,573 families falling into the $200,000+ income range, which is the most common income bracket and makes up 27.0% of all families. Conversely, the $10,000 to $14,999 income bracket is the least frequent group with only 1,836 families (1.0%) belonging to this category.
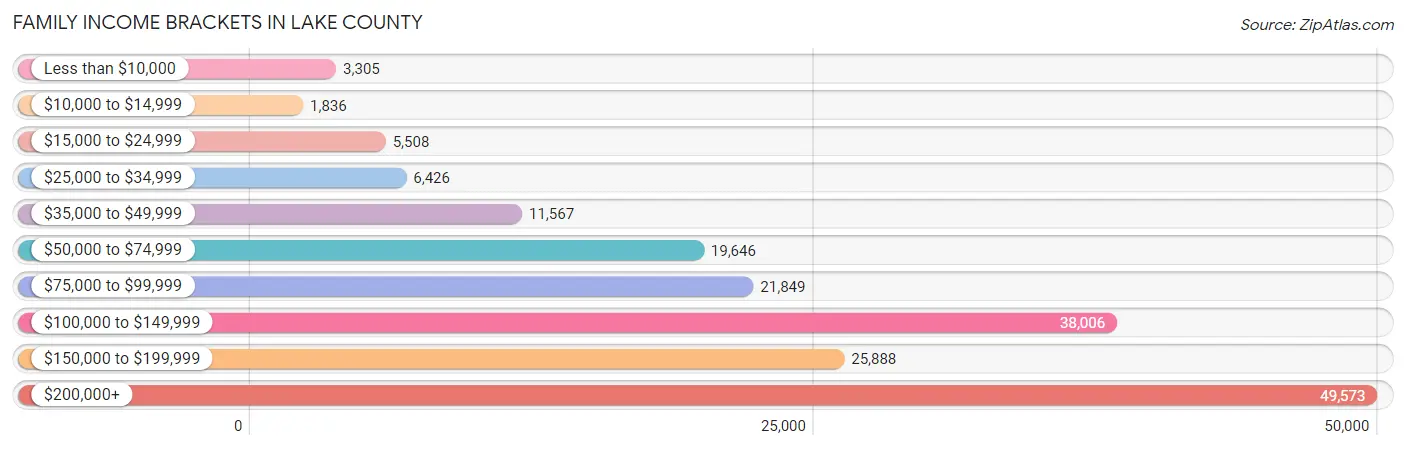
| Income Bracket | # Families | % Families |
| Less than $10,000 | 3,305 | 1.8% |
| $10,000 to $14,999 | 1,836 | 1.0% |
| $15,000 to $24,999 | 5,508 | 3.0% |
| $25,000 to $34,999 | 6,426 | 3.5% |
| $35,000 to $49,999 | 11,567 | 6.3% |
| $50,000 to $74,999 | 19,646 | 10.7% |
| $75,000 to $99,999 | 21,849 | 11.9% |
| $100,000 to $149,999 | 38,006 | 20.7% |
| $150,000 to $199,999 | 25,888 | 14.1% |
| $200,000+ | 49,573 | 27.0% |
Family Income by Famaliy Size in Lake County
4-person families (40,808 | 22.2%) account for the highest median family income in Lake County with $150,673 per family, while 2-person families (76,762 | 41.8%) have the highest median income of $57,202 per family member.
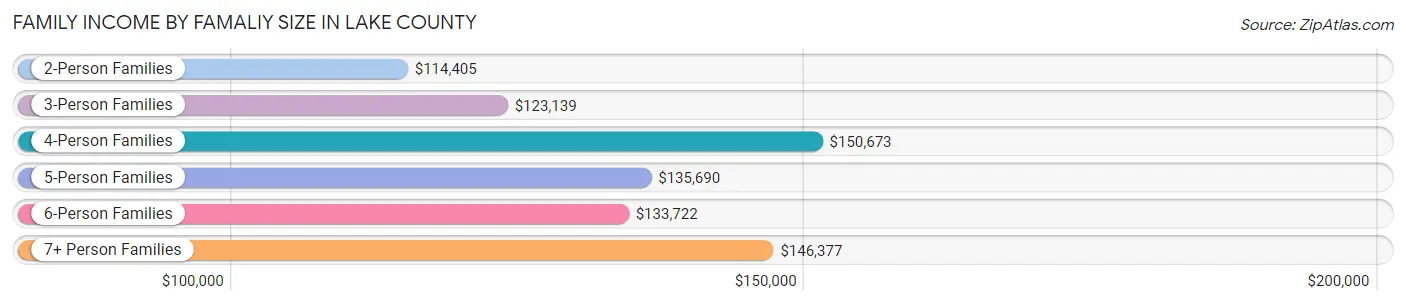
| Income Bracket | # Families | Median Income |
| 2-Person Families | 76,762 (41.8%) | $114,405 |
| 3-Person Families | 41,486 (22.6%) | $123,139 |
| 4-Person Families | 40,808 (22.2%) | $150,673 |
| 5-Person Families | 16,702 (9.1%) | $135,690 |
| 6-Person Families | 4,926 (2.7%) | $133,722 |
| 7+ Person Families | 2,921 (1.6%) | $146,377 |
| Total | 183,605 (100.0%) | $126,685 |
Family Income by Number of Earners in Lake County
The median family income in Lake County is $126,685, with families comprising 3+ earners (28,672) having the highest median family income of $162,580, while families with no earners (19,333) have the lowest median family income of $69,746, accounting for 15.6% and 10.5% of families, respectively.
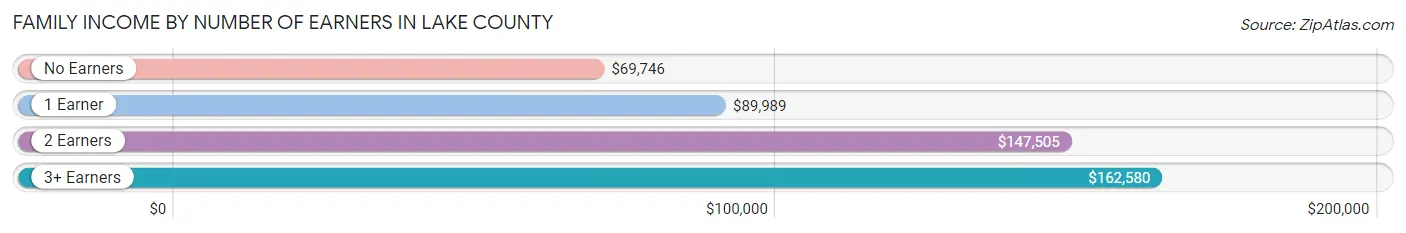
| Number of Earners | # Families | Median Income |
| No Earners | 19,333 (10.5%) | $69,746 |
| 1 Earner | 51,361 (28.0%) | $89,989 |
| 2 Earners | 84,239 (45.9%) | $147,505 |
| 3+ Earners | 28,672 (15.6%) | $162,580 |
| Total | 183,605 (100.0%) | $126,685 |
Household Income in Lake County
Household Income Brackets in Lake County
With 55,036 households falling in the category, the $200,000+ income range is the most frequent in Lake County, accounting for 21.6% of all households. In contrast, only 5,351 households (2.1%) fall into the $10,000 to $14,999 income bracket, making it the least populous group.
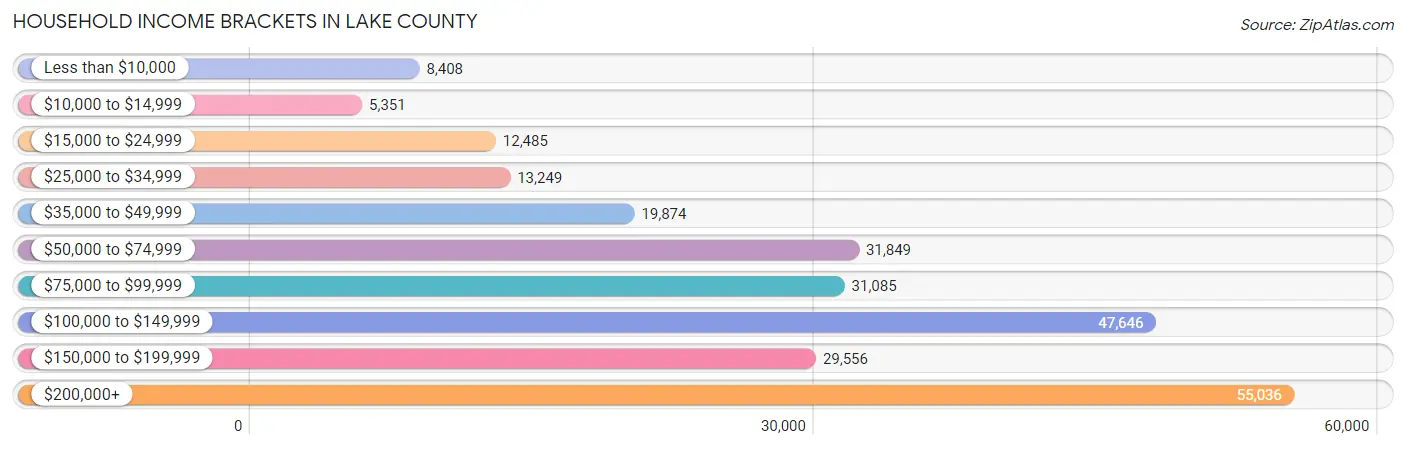
| Income Bracket | # Households | % Households |
| Less than $10,000 | 8,408 | 3.3% |
| $10,000 to $14,999 | 5,351 | 2.1% |
| $15,000 to $24,999 | 12,485 | 4.9% |
| $25,000 to $34,999 | 13,249 | 5.2% |
| $35,000 to $49,999 | 19,874 | 7.8% |
| $50,000 to $74,999 | 31,849 | 12.5% |
| $75,000 to $99,999 | 31,085 | 12.2% |
| $100,000 to $149,999 | 47,646 | 18.7% |
| $150,000 to $199,999 | 29,556 | 11.6% |
| $200,000+ | 55,036 | 21.6% |
Household Income by Householder Age in Lake County
The median household income in Lake County is $104,553, with the highest median household income of $131,006 found in the 45 to 64 years age bracket for the primary householder. A total of 106,688 households (41.9%) fall into this category. Meanwhile, the 15 to 24 years age bracket for the primary householder has the lowest median household income of $46,951, with 5,658 households (2.2%) in this group.

| Income Bracket | # Households | Median Income |
| 15 to 24 Years | 5,658 (2.2%) | $46,951 |
| 25 to 44 Years | 78,098 (30.6%) | $105,352 |
| 45 to 64 Years | 106,688 (41.9%) | $131,006 |
| 65+ Years | 64,350 (25.3%) | $74,109 |
| Total | 254,794 (100.0%) | $104,553 |
Poverty in Lake County
Income Below Poverty by Sex and Age in Lake County
With 6.8% poverty level for males and 8.9% for females among the residents of Lake County, 12 to 14 year old males and 5 year old females are the most vulnerable to poverty, with 1,827 males (11.9%) and 705 females (16.1%) in their respective age groups living below the poverty level.
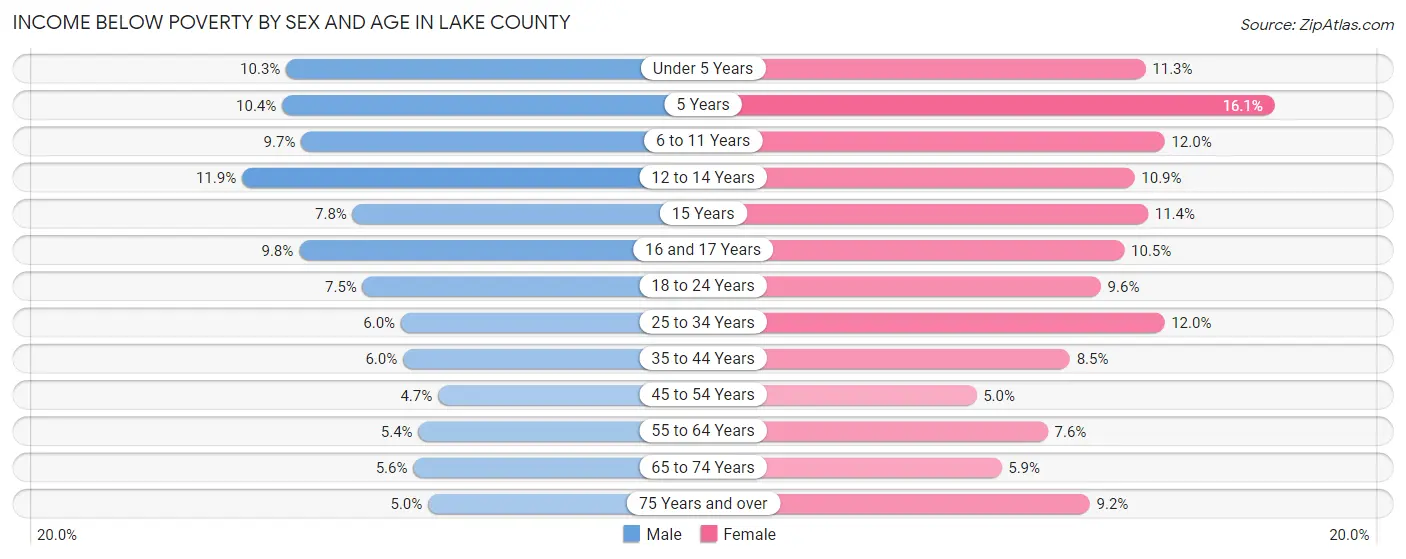
| Age Bracket | Male | Female |
| Under 5 Years | 2,004 (10.3%) | 2,109 (11.3%) |
| 5 Years | 476 (10.4%) | 705 (16.1%) |
| 6 to 11 Years | 2,801 (9.7%) | 3,275 (12.0%) |
| 12 to 14 Years | 1,827 (11.9%) | 1,646 (10.9%) |
| 15 Years | 445 (7.8%) | 621 (11.4%) |
| 16 and 17 Years | 1,093 (9.8%) | 1,106 (10.5%) |
| 18 to 24 Years | 2,471 (7.4%) | 2,986 (9.6%) |
| 25 to 34 Years | 2,383 (6.0%) | 4,507 (12.0%) |
| 35 to 44 Years | 2,690 (5.9%) | 3,789 (8.5%) |
| 45 to 54 Years | 2,240 (4.6%) | 2,399 (5.0%) |
| 55 to 64 Years | 2,582 (5.4%) | 3,708 (7.6%) |
| 65 to 74 Years | 1,691 (5.6%) | 1,946 (5.9%) |
| 75 Years and over | 860 (5.0%) | 2,159 (9.2%) |
| Total | 23,563 (6.8%) | 30,956 (8.9%) |
Income Above Poverty by Sex and Age in Lake County
According to the poverty statistics in Lake County, males aged 45 to 54 years and females aged 45 to 54 years are the age groups that are most secure financially, with 95.4% of males and 95.0% of females in these age groups living above the poverty line.
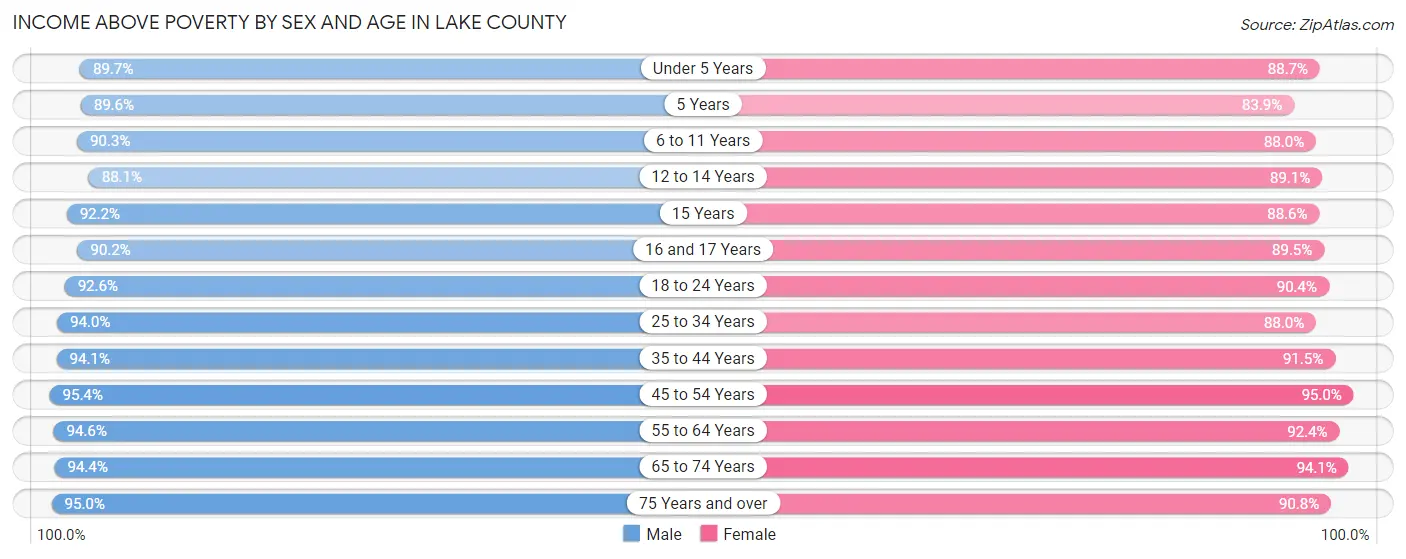
| Age Bracket | Male | Female |
| Under 5 Years | 17,463 (89.7%) | 16,601 (88.7%) |
| 5 Years | 4,085 (89.6%) | 3,682 (83.9%) |
| 6 to 11 Years | 25,976 (90.3%) | 24,063 (88.0%) |
| 12 to 14 Years | 13,487 (88.1%) | 13,507 (89.1%) |
| 15 Years | 5,245 (92.2%) | 4,847 (88.6%) |
| 16 and 17 Years | 10,054 (90.2%) | 9,451 (89.5%) |
| 18 to 24 Years | 30,698 (92.5%) | 28,093 (90.4%) |
| 25 to 34 Years | 37,125 (94.0%) | 33,153 (88.0%) |
| 35 to 44 Years | 42,498 (94.1%) | 41,012 (91.5%) |
| 45 to 54 Years | 45,934 (95.4%) | 45,649 (95.0%) |
| 55 to 64 Years | 45,380 (94.6%) | 44,821 (92.4%) |
| 65 to 74 Years | 28,675 (94.4%) | 30,932 (94.1%) |
| 75 Years and over | 16,278 (95.0%) | 21,297 (90.8%) |
| Total | 322,898 (93.2%) | 317,108 (91.1%) |
Income Below Poverty Among Married-Couple Families in Lake County
The poverty statistics for married-couple families in Lake County show that 2.6% or 3,874 of the total 147,034 families live below the poverty line. Families with 5 or more children have the highest poverty rate of 13.7%, comprising of 68 families. On the other hand, families with no children have the lowest poverty rate of 1.8%, which includes 1,492 families.

| Children | Above Poverty | Below Poverty |
| No Children | 79,140 (98.2%) | 1,492 (1.8%) |
| 1 or 2 Children | 52,571 (97.3%) | 1,479 (2.7%) |
| 3 or 4 Children | 11,020 (93.0%) | 835 (7.0%) |
| 5 or more Children | 429 (86.3%) | 68 (13.7%) |
| Total | 143,160 (97.4%) | 3,874 (2.6%) |
Income Below Poverty Among Single-Parent Households in Lake County
According to the poverty data in Lake County, 9.0% or 999 single-father households and 19.4% or 4,940 single-mother households are living below the poverty line. Among single-father households, those with 5 or more children have the highest poverty rate, with 15 households (68.2%) experiencing poverty. Likewise, among single-mother households, those with 3 or 4 children have the highest poverty rate, with 1,756 households (58.1%) falling below the poverty line.
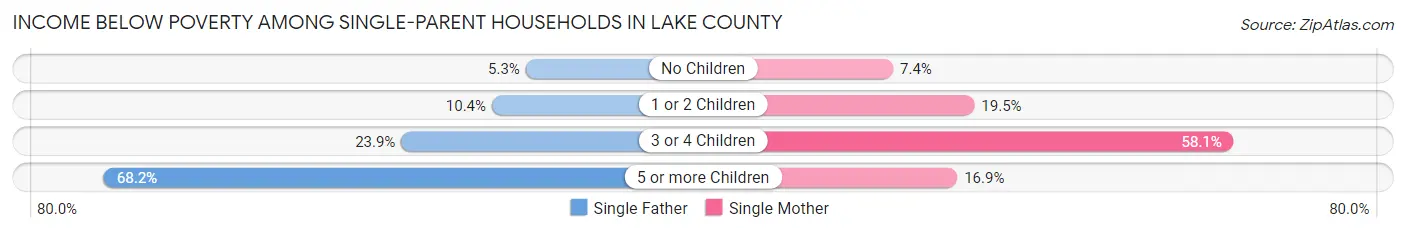
| Children | Single Father | Single Mother |
| No Children | 282 (5.3%) | 729 (7.4%) |
| 1 or 2 Children | 510 (10.4%) | 2,433 (19.5%) |
| 3 or 4 Children | 192 (23.9%) | 1,756 (58.1%) |
| 5 or more Children | 15 (68.2%) | 22 (16.9%) |
| Total | 999 (9.0%) | 4,940 (19.4%) |
Income Below Poverty Among Married-Couple vs Single-Parent Households in Lake County
The poverty data for Lake County shows that 3,874 of the married-couple family households (2.6%) and 5,939 of the single-parent households (16.2%) are living below the poverty level. Within the married-couple family households, those with 5 or more children have the highest poverty rate, with 68 households (13.7%) falling below the poverty line. Among the single-parent households, those with 3 or 4 children have the highest poverty rate, with 1,948 household (50.9%) living below poverty.
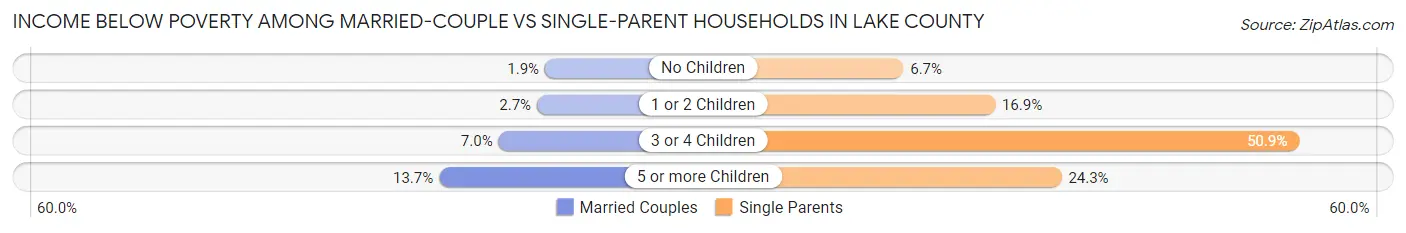
| Children | Married-Couple Families | Single-Parent Households |
| No Children | 1,492 (1.8%) | 1,011 (6.7%) |
| 1 or 2 Children | 1,479 (2.7%) | 2,943 (16.9%) |
| 3 or 4 Children | 835 (7.0%) | 1,948 (50.9%) |
| 5 or more Children | 68 (13.7%) | 37 (24.3%) |
| Total | 3,874 (2.6%) | 5,939 (16.2%) |
Employment Characteristics in Lake County
Employment by Class of Employer in Lake County
Among the 360,255 employed individuals in Lake County, private company employees (254,362 | 70.6%), not-for-profit organizations (24,915 | 6.9%), and local government employees (24,617 | 6.8%) make up the most common classes of employment.
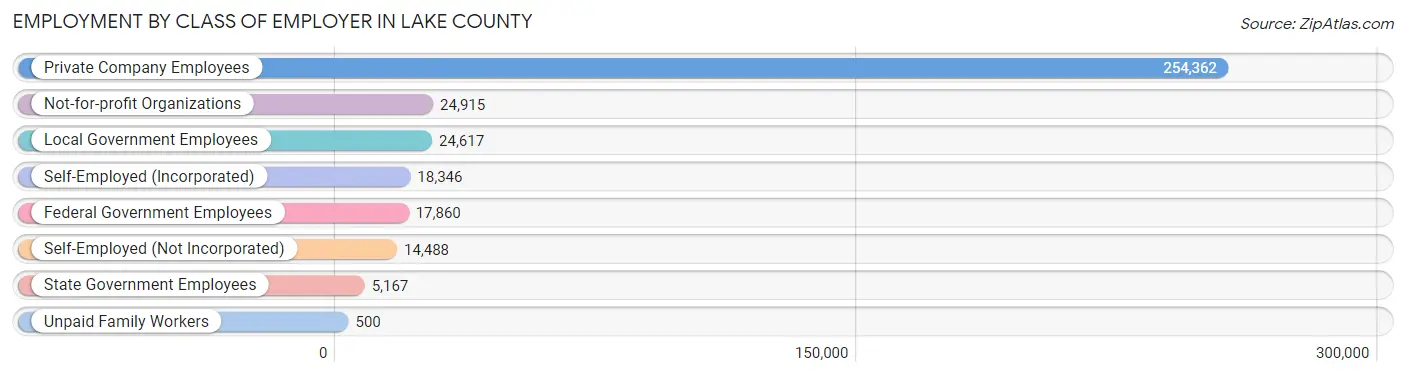
| Employer Class | # Employees | % Employees |
| Private Company Employees | 254,362 | 70.6% |
| Self-Employed (Incorporated) | 18,346 | 5.1% |
| Self-Employed (Not Incorporated) | 14,488 | 4.0% |
| Not-for-profit Organizations | 24,915 | 6.9% |
| Local Government Employees | 24,617 | 6.8% |
| State Government Employees | 5,167 | 1.4% |
| Federal Government Employees | 17,860 | 5.0% |
| Unpaid Family Workers | 500 | 0.1% |
| Total | 360,255 | 100.0% |
Employment Status by Age in Lake County
According to the labor force statistics for Lake County, out of the total population over 16 years of age (566,968), 68.3% or 387,239 individuals are in the labor force, with 5.0% or 19,362 of them unemployed. The age group with the highest labor force participation rate is 35 to 44 years, with 87.1% or 78,794 individuals in the labor force. Within the labor force, the 20 to 24 years age range has the highest percentage of unemployed individuals, with 12.0% or 4,908 of them being unemployed.
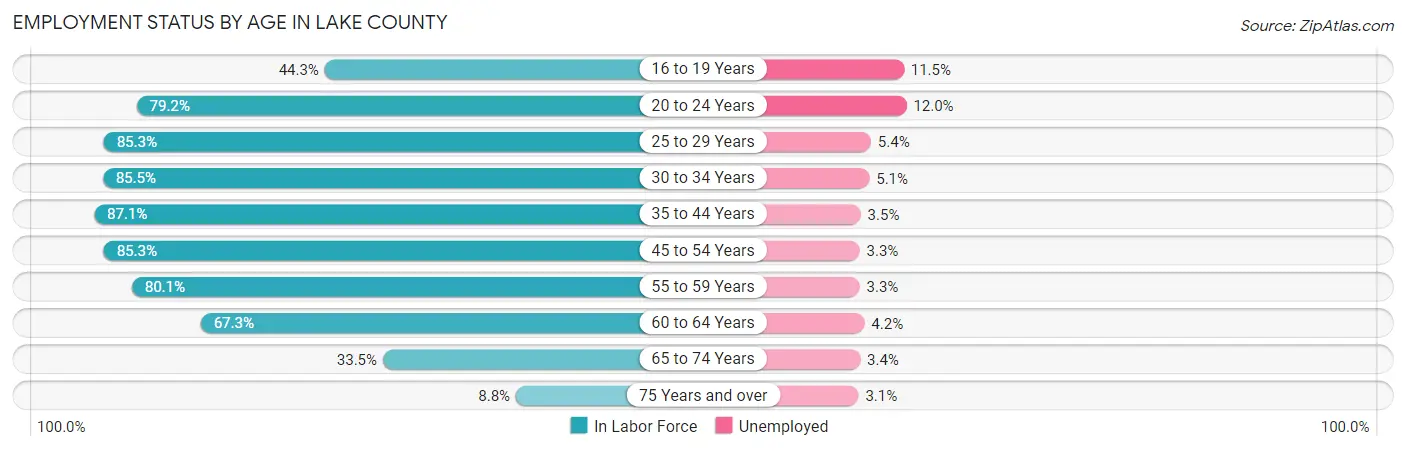
| Age Bracket | In Labor Force | Unemployed |
| 16 to 19 Years | 19,988 (44.3%) | 2,299 (11.5%) |
| 20 to 24 Years | 40,903 (79.2%) | 4,908 (12.0%) |
| 25 to 29 Years | 34,509 (85.3%) | 1,863 (5.4%) |
| 30 to 34 Years | 33,373 (85.5%) | 1,702 (5.1%) |
| 35 to 44 Years | 78,794 (87.1%) | 2,758 (3.5%) |
| 45 to 54 Years | 82,349 (85.3%) | 2,718 (3.3%) |
| 55 to 59 Years | 40,995 (80.1%) | 1,353 (3.3%) |
| 60 to 64 Years | 30,782 (67.3%) | 1,293 (4.2%) |
| 65 to 74 Years | 21,469 (33.5%) | 730 (3.4%) |
| 75 Years and over | 3,758 (8.8%) | 116 (3.1%) |
| Total | 387,239 (68.3%) | 19,362 (5.0%) |
Employment Status by Educational Attainment in Lake County
According to labor force statistics for Lake County, 82.8% of individuals (300,906) out of the total population between 25 and 64 years of age (363,413) are in the labor force, with 3.9% or 11,735 of them being unemployed. The group with the highest labor force participation rate are those with the educational attainment of bachelor's degree or higher, with 86.6% or 151,476 individuals in the labor force. Within the labor force, individuals with less than high school education have the highest percentage of unemployment, with 5.7% or 1,355 of them being unemployed.
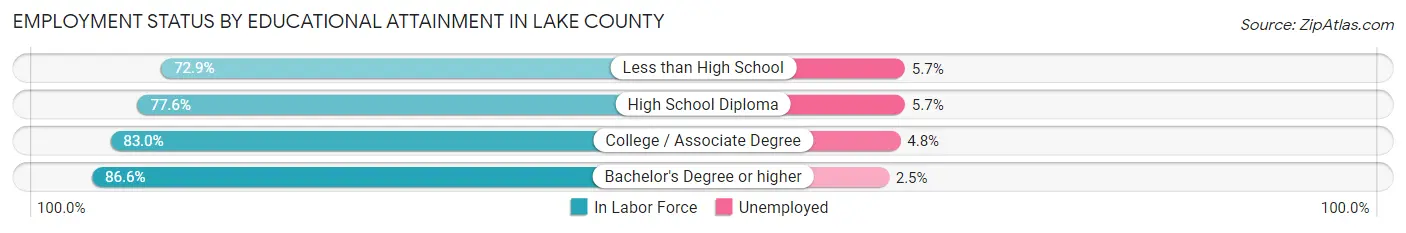
| Educational Attainment | In Labor Force | Unemployed |
| Less than High School | 23,780 (72.9%) | 1,859 (5.7%) |
| High School Diploma | 53,335 (77.6%) | 3,918 (5.7%) |
| College / Associate Degree | 72,333 (83.0%) | 4,183 (4.8%) |
| Bachelor's Degree or higher | 151,476 (86.6%) | 4,373 (2.5%) |
| Total | 300,906 (82.8%) | 14,173 (3.9%) |
Employment Occupations by Sex in Lake County
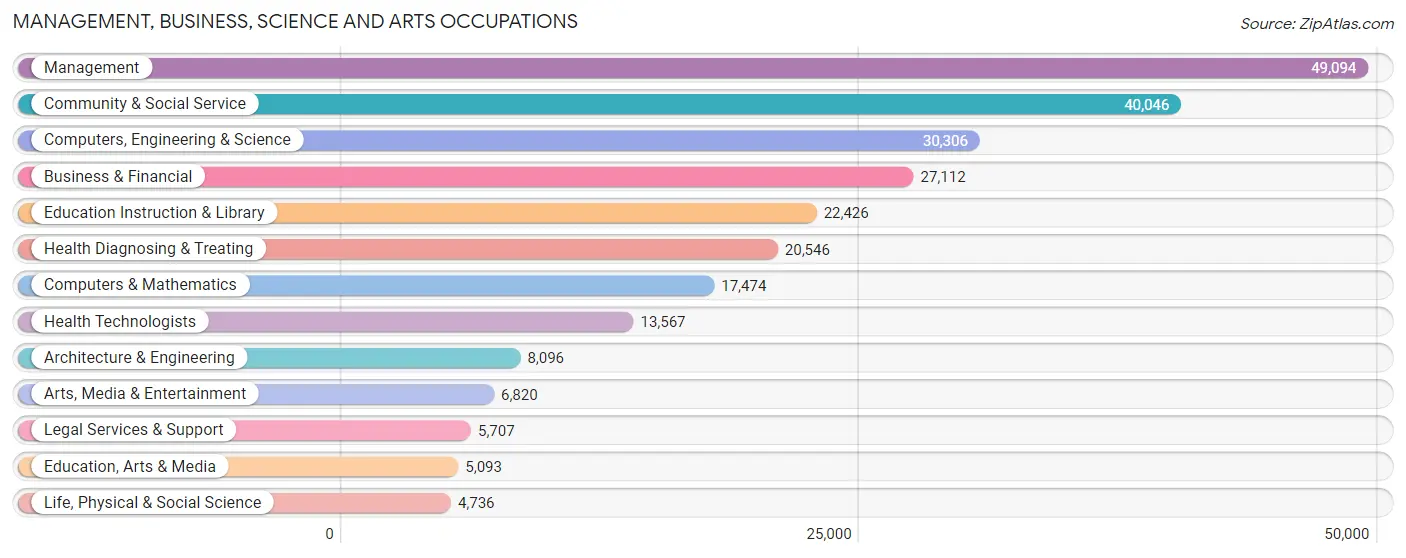
Management, Business, Science and Arts Occupations
The most common Management, Business, Science and Arts occupations in Lake County are Management (49,094 | 13.7%), Community & Social Service (40,046 | 11.2%), Computers, Engineering & Science (30,306 | 8.5%), Business & Financial (27,112 | 7.6%), and Education Instruction & Library (22,426 | 6.3%).
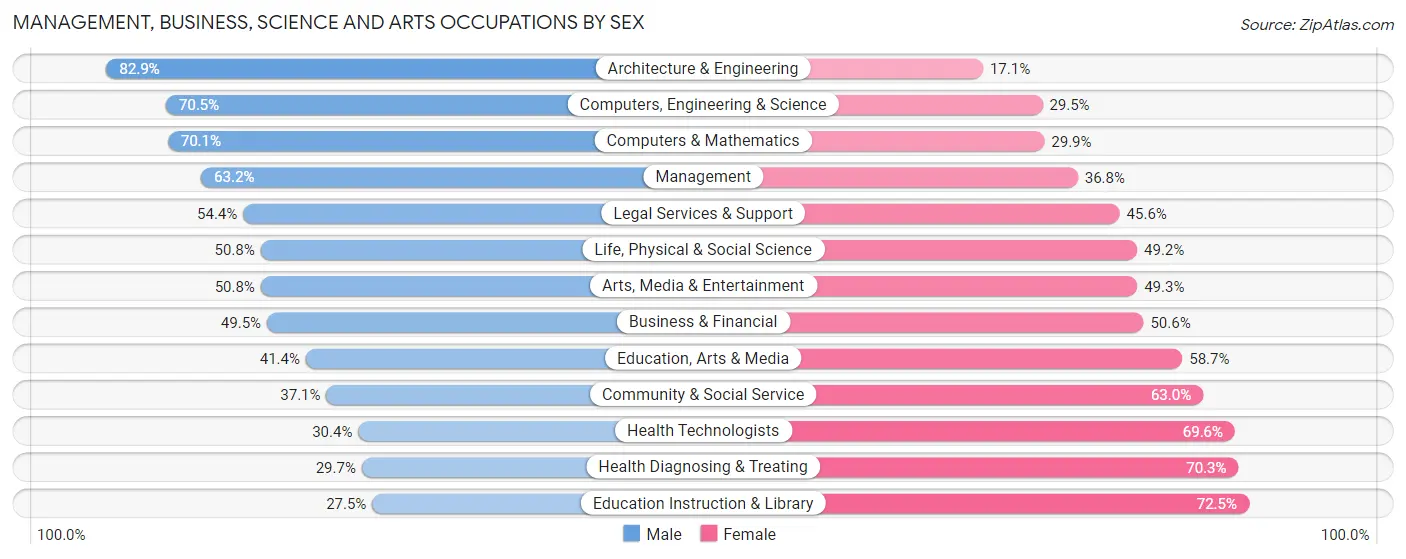
Management, Business, Science and Arts Occupations by Sex
Within the Management, Business, Science and Arts occupations in Lake County, the most male-oriented occupations are Architecture & Engineering (82.9%), Computers, Engineering & Science (70.5%), and Computers & Mathematics (70.1%), while the most female-oriented occupations are Education Instruction & Library (72.5%), Health Diagnosing & Treating (70.3%), and Health Technologists (69.6%).
| Occupation | Male | Female |
| Management | 31,009 (63.2%) | 18,085 (36.8%) |
| Business & Financial | 13,406 (49.4%) | 13,706 (50.5%) |
| Computers, Engineering & Science | 21,374 (70.5%) | 8,932 (29.5%) |
| Computers & Mathematics | 12,255 (70.1%) | 5,219 (29.9%) |
| Architecture & Engineering | 6,714 (82.9%) | 1,382 (17.1%) |
| Life, Physical & Social Science | 2,405 (50.8%) | 2,331 (49.2%) |
| Community & Social Service | 14,837 (37.0%) | 25,209 (62.9%) |
| Education, Arts & Media | 2,106 (41.3%) | 2,987 (58.7%) |
| Legal Services & Support | 3,106 (54.4%) | 2,601 (45.6%) |
| Education Instruction & Library | 6,164 (27.5%) | 16,262 (72.5%) |
| Arts, Media & Entertainment | 3,461 (50.7%) | 3,359 (49.2%) |
| Health Diagnosing & Treating | 6,097 (29.7%) | 14,449 (70.3%) |
| Health Technologists | 4,125 (30.4%) | 9,442 (69.6%) |
| Total (Category) | 86,723 (51.9%) | 80,381 (48.1%) |
| Total (Overall) | 194,030 (54.3%) | 163,486 (45.7%) |
Services Occupations
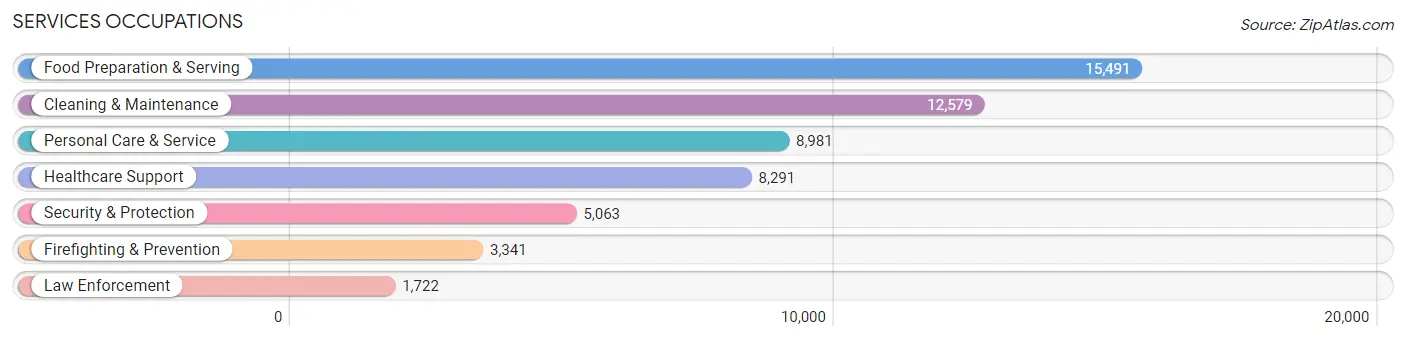
The most common Services occupations in Lake County are Food Preparation & Serving (15,491 | 4.3%), Cleaning & Maintenance (12,579 | 3.5%), Personal Care & Service (8,981 | 2.5%), Healthcare Support (8,291 | 2.3%), and Security & Protection (5,063 | 1.4%).
Services Occupations by Sex
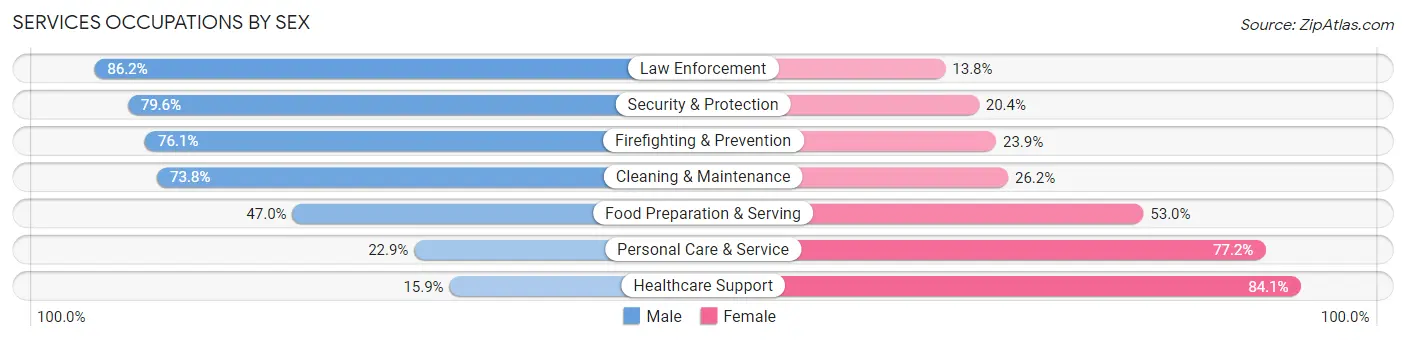
Within the Services occupations in Lake County, the most male-oriented occupations are Law Enforcement (86.2%), Security & Protection (79.6%), and Firefighting & Prevention (76.1%), while the most female-oriented occupations are Healthcare Support (84.1%), Personal Care & Service (77.1%), and Food Preparation & Serving (53.0%).
| Occupation | Male | Female |
| Healthcare Support | 1,316 (15.9%) | 6,975 (84.1%) |
| Security & Protection | 4,028 (79.6%) | 1,035 (20.4%) |
| Firefighting & Prevention | 2,544 (76.1%) | 797 (23.9%) |
| Law Enforcement | 1,484 (86.2%) | 238 (13.8%) |
| Food Preparation & Serving | 7,276 (47.0%) | 8,215 (53.0%) |
| Cleaning & Maintenance | 9,278 (73.8%) | 3,301 (26.2%) |
| Personal Care & Service | 2,052 (22.9%) | 6,929 (77.1%) |
| Total (Category) | 23,950 (47.5%) | 26,455 (52.5%) |
| Total (Overall) | 194,030 (54.3%) | 163,486 (45.7%) |
Sales and Office Occupations
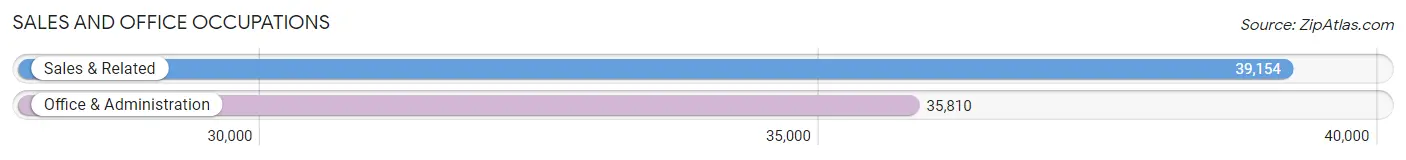
The most common Sales and Office occupations in Lake County are Sales & Related (39,154 | 11.0%), and Office & Administration (35,810 | 10.0%).
Sales and Office Occupations by Sex
| Occupation | Male | Female |
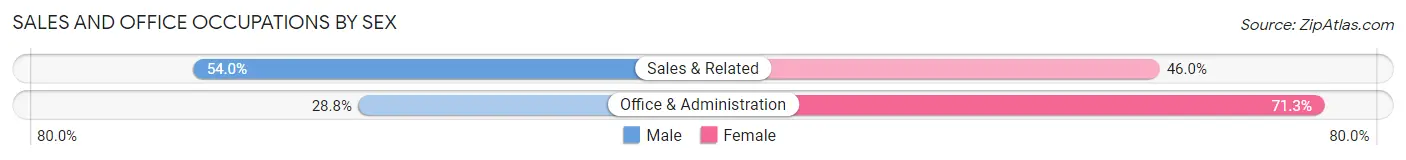
| Sales & Related | 21,133 (54.0%) | 18,021 (46.0%) |
| Office & Administration | 10,294 (28.7%) | 25,516 (71.3%) |
| Total (Category) | 31,427 (41.9%) | 43,537 (58.1%) |
| Total (Overall) | 194,030 (54.3%) | 163,486 (45.7%) |
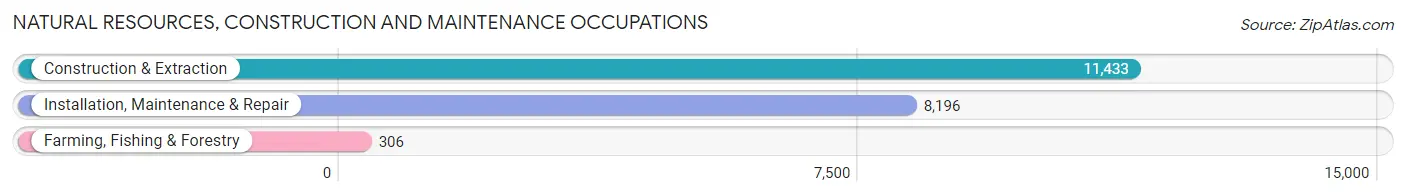
Natural Resources, Construction and Maintenance Occupations
The most common Natural Resources, Construction and Maintenance occupations in Lake County are Construction & Extraction (11,433 | 3.2%), Installation, Maintenance & Repair (8,196 | 2.3%), and Farming, Fishing & Forestry (306 | 0.1%).
Natural Resources, Construction and Maintenance Occupations by Sex
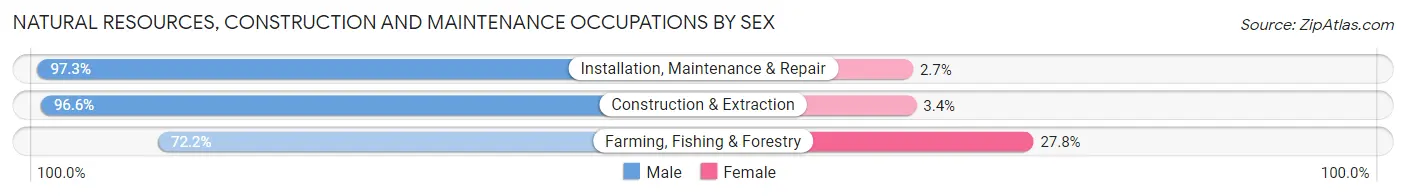
| Occupation | Male | Female |
| Farming, Fishing & Forestry | 221 (72.2%) | 85 (27.8%) |
| Construction & Extraction | 11,043 (96.6%) | 390 (3.4%) |
| Installation, Maintenance & Repair | 7,974 (97.3%) | 222 (2.7%) |
| Total (Category) | 19,238 (96.5%) | 697 (3.5%) |
| Total (Overall) | 194,030 (54.3%) | 163,486 (45.7%) |
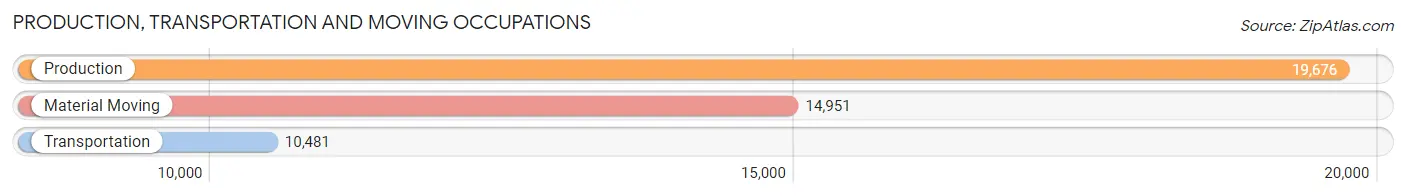
Production, Transportation and Moving Occupations
The most common Production, Transportation and Moving occupations in Lake County are Production (19,676 | 5.5%), Material Moving (14,951 | 4.2%), and Transportation (10,481 | 2.9%).
Production, Transportation and Moving Occupations by Sex
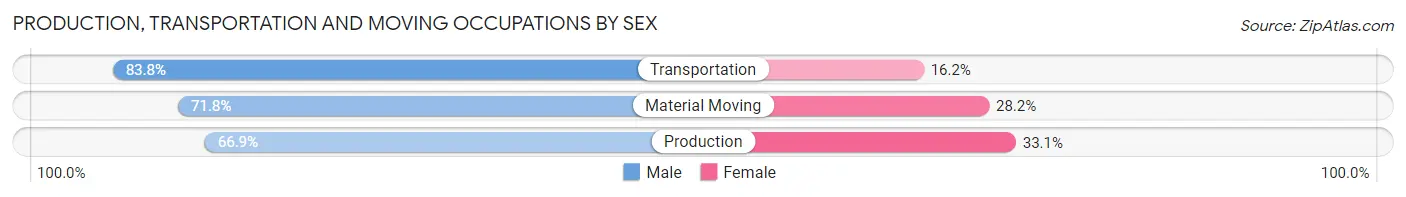
| Occupation | Male | Female |
| Production | 13,167 (66.9%) | 6,509 (33.1%) |
| Transportation | 8,786 (83.8%) | 1,695 (16.2%) |
| Material Moving | 10,739 (71.8%) | 4,212 (28.2%) |
| Total (Category) | 32,692 (72.5%) | 12,416 (27.5%) |
| Total (Overall) | 194,030 (54.3%) | 163,486 (45.7%) |
Employment Industries by Sex in Lake County
Employment Industries in Lake County
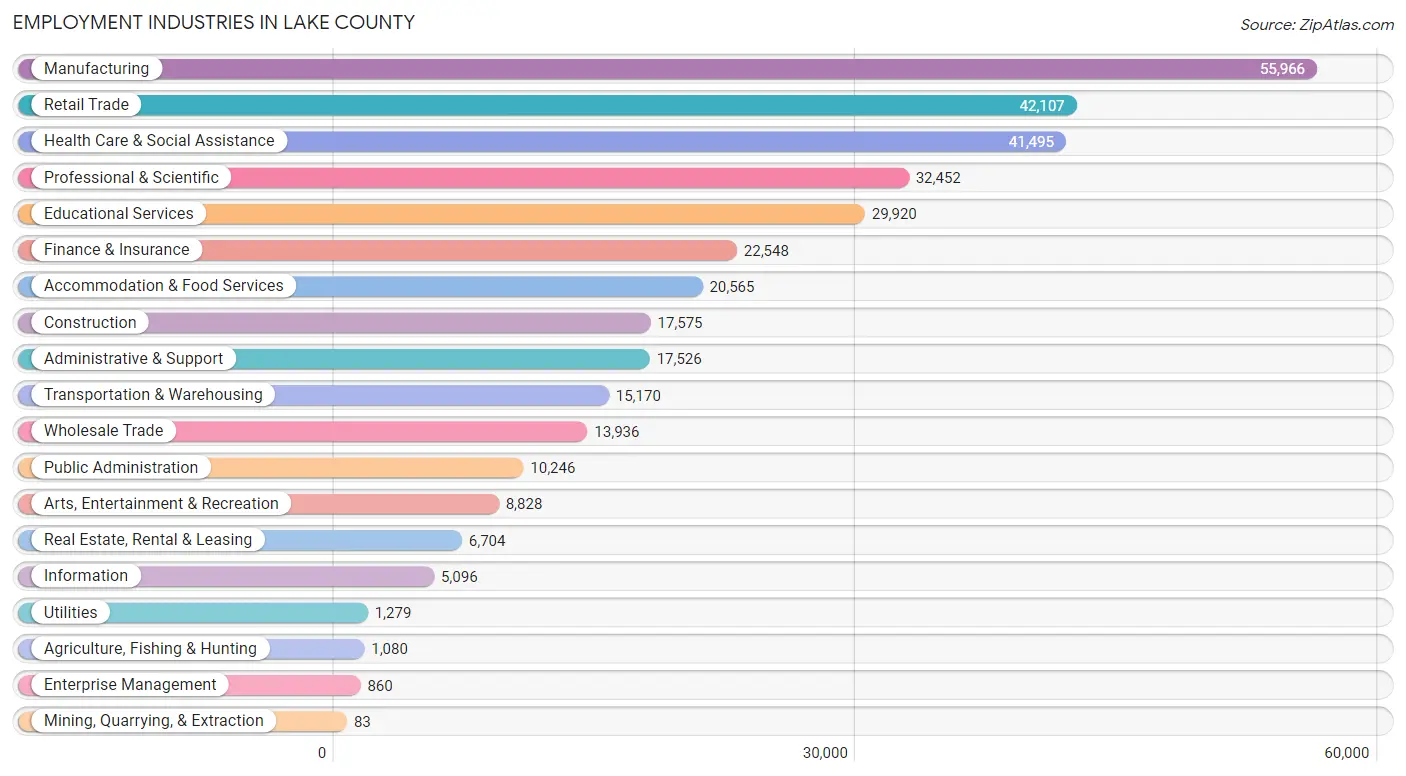
The major employment industries in Lake County include Manufacturing (55,966 | 15.7%), Retail Trade (42,107 | 11.8%), Health Care & Social Assistance (41,495 | 11.6%), Professional & Scientific (32,452 | 9.1%), and Educational Services (29,920 | 8.4%).
Employment Industries by Sex in Lake County
The Lake County industries that see more men than women are Mining, Quarrying, & Extraction (95.2%), Construction (88.5%), and Transportation & Warehousing (74.6%), whereas the industries that tend to have a higher number of women are Health Care & Social Assistance (74.9%), Educational Services (67.6%), and Accommodation & Food Services (50.1%).
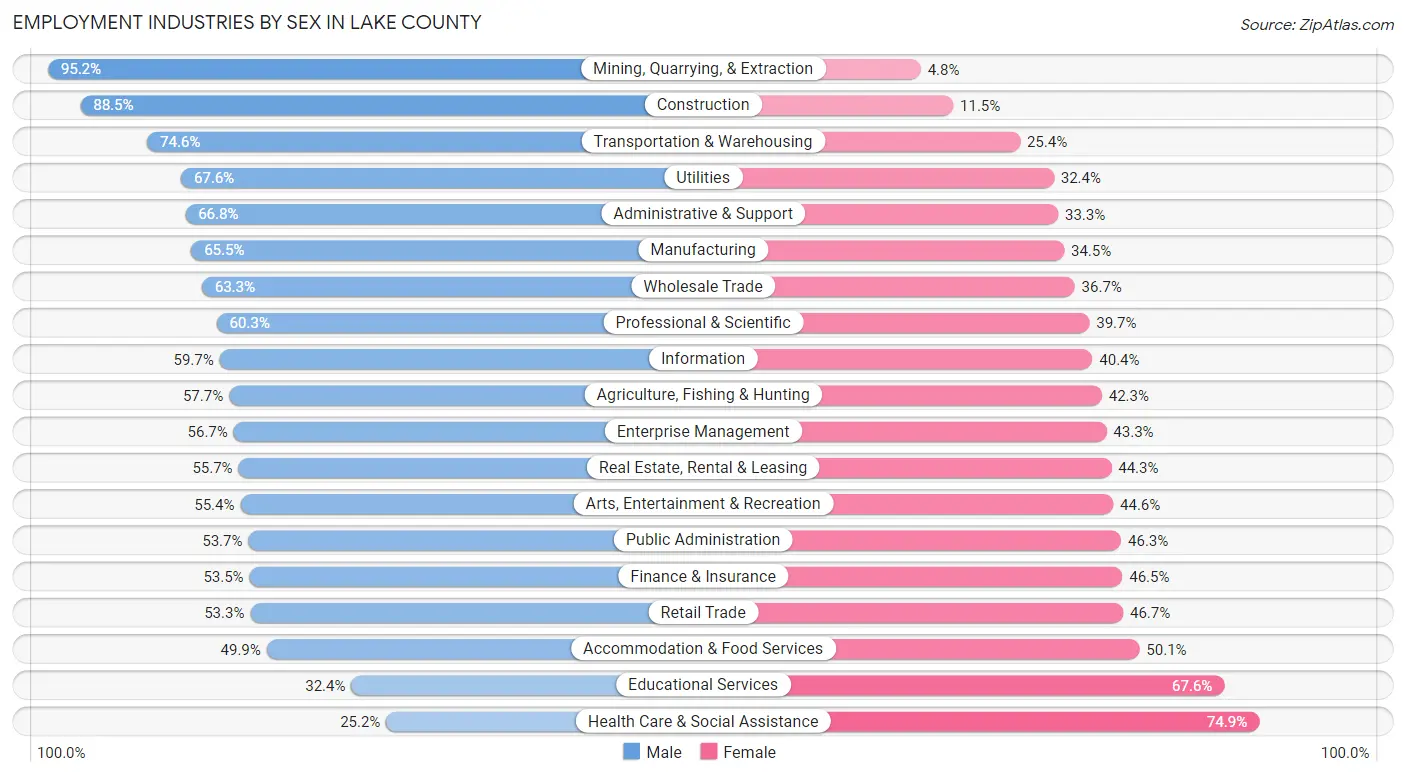
| Industry | Male | Female |
| Agriculture, Fishing & Hunting | 623 (57.7%) | 457 (42.3%) |
| Mining, Quarrying, & Extraction | 79 (95.2%) | 4 (4.8%) |
| Construction | 15,549 (88.5%) | 2,026 (11.5%) |
| Manufacturing | 36,666 (65.5%) | 19,300 (34.5%) |
| Wholesale Trade | 8,824 (63.3%) | 5,112 (36.7%) |
| Retail Trade | 22,442 (53.3%) | 19,665 (46.7%) |
| Transportation & Warehousing | 11,321 (74.6%) | 3,849 (25.4%) |
| Utilities | 865 (67.6%) | 414 (32.4%) |
| Information | 3,040 (59.7%) | 2,056 (40.4%) |
| Finance & Insurance | 12,055 (53.5%) | 10,493 (46.5%) |
| Real Estate, Rental & Leasing | 3,737 (55.7%) | 2,967 (44.3%) |
| Professional & Scientific | 19,561 (60.3%) | 12,891 (39.7%) |
| Enterprise Management | 488 (56.7%) | 372 (43.3%) |
| Administrative & Support | 11,699 (66.7%) | 5,827 (33.3%) |
| Educational Services | 9,687 (32.4%) | 20,233 (67.6%) |
| Health Care & Social Assistance | 10,438 (25.2%) | 31,057 (74.9%) |
| Arts, Entertainment & Recreation | 4,887 (55.4%) | 3,941 (44.6%) |
| Accommodation & Food Services | 10,265 (49.9%) | 10,300 (50.1%) |
| Public Administration | 5,502 (53.7%) | 4,744 (46.3%) |
| Total | 194,030 (54.3%) | 163,486 (45.7%) |
Education in Lake County
School Enrollment in Lake County
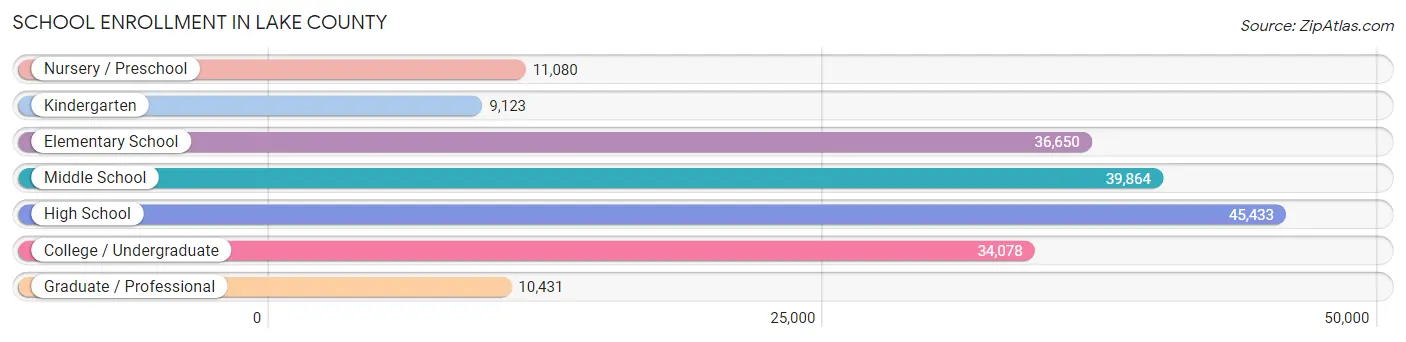
The most common levels of schooling among the 186,659 students in Lake County are high school (45,433 | 24.3%), middle school (39,864 | 21.4%), and elementary school (36,650 | 19.6%).
| School Level | # Students | % Students |
| Nursery / Preschool | 11,080 | 5.9% |
| Kindergarten | 9,123 | 4.9% |
| Elementary School | 36,650 | 19.6% |
| Middle School | 39,864 | 21.4% |
| High School | 45,433 | 24.3% |
| College / Undergraduate | 34,078 | 18.3% |
| Graduate / Professional | 10,431 | 5.6% |
| Total | 186,659 | 100.0% |
School Enrollment by Age by Funding Source in Lake County
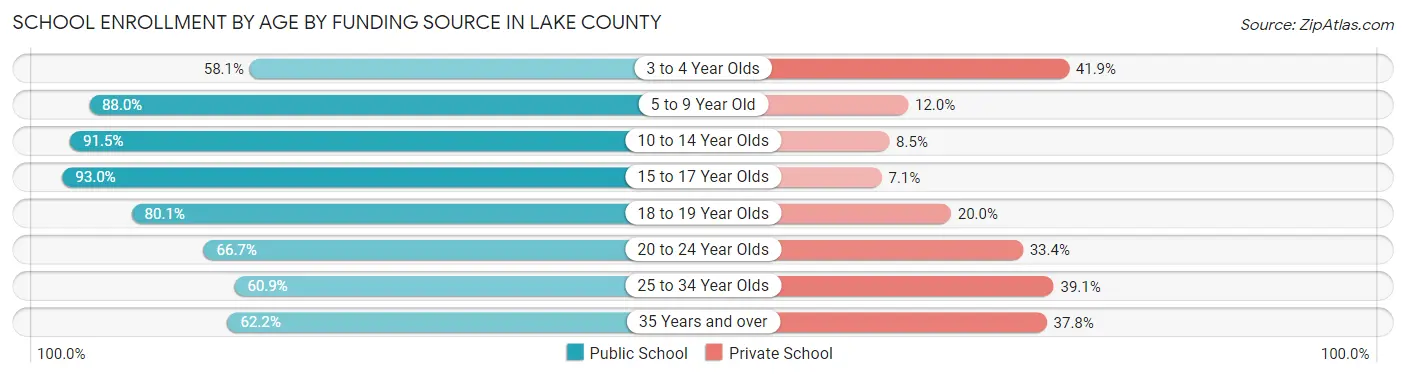
Out of a total of 186,659 students who are enrolled in schools in Lake County, 31,732 (17.0%) attend a private institution, while the remaining 154,927 (83.0%) are enrolled in public schools. The age group of 3 to 4 year olds has the highest likelihood of being enrolled in private schools, with 3,640 (41.9% in the age bracket) enrolled. Conversely, the age group of 15 to 17 year olds has the lowest likelihood of being enrolled in a private school, with 30,004 (92.9% in the age bracket) attending a public institution.
| Age Bracket | Public School | Private School |
| 3 to 4 Year Olds | 5,040 (58.1%) | 3,640 (41.9%) |
| 5 to 9 Year Old | 38,946 (88.0%) | 5,308 (12.0%) |
| 10 to 14 Year Olds | 44,737 (91.5%) | 4,138 (8.5%) |
| 15 to 17 Year Olds | 30,004 (92.9%) | 2,274 (7.0%) |
| 18 to 19 Year Olds | 12,015 (80.0%) | 2,994 (20.0%) |
| 20 to 24 Year Olds | 12,978 (66.6%) | 6,495 (33.4%) |
| 25 to 34 Year Olds | 5,599 (60.9%) | 3,594 (39.1%) |
| 35 Years and over | 5,534 (62.2%) | 3,363 (37.8%) |
| Total | 154,927 (83.0%) | 31,732 (17.0%) |
Educational Attainment by Field of Study in Lake County
Business (52,112 | 21.8%), education (23,910 | 10.0%), engineering (22,130 | 9.2%), science & technology (20,696 | 8.6%), and social sciences (18,429 | 7.7%) are the most common fields of study among 239,122 individuals in Lake County who have obtained a bachelor's degree or higher.
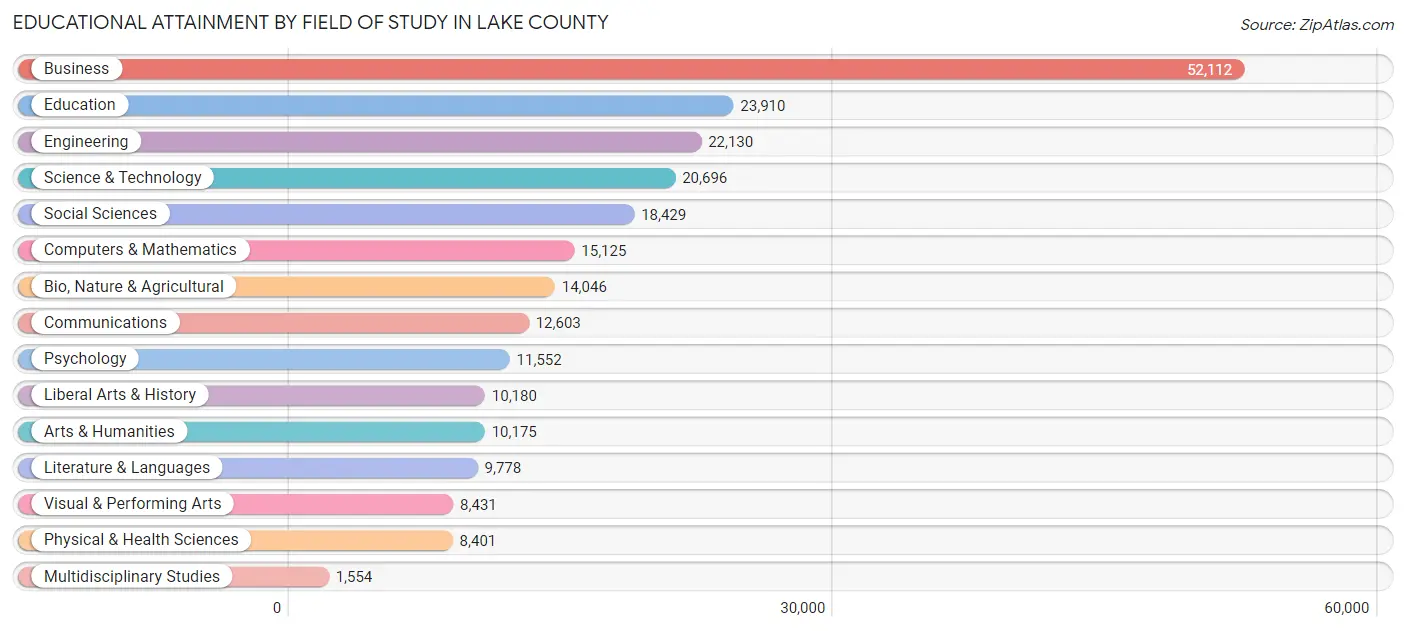
| Field of Study | # Graduates | % Graduates |
| Computers & Mathematics | 15,125 | 6.3% |
| Bio, Nature & Agricultural | 14,046 | 5.9% |
| Physical & Health Sciences | 8,401 | 3.5% |
| Psychology | 11,552 | 4.8% |
| Social Sciences | 18,429 | 7.7% |
| Engineering | 22,130 | 9.2% |
| Multidisciplinary Studies | 1,554 | 0.6% |
| Science & Technology | 20,696 | 8.6% |
| Business | 52,112 | 21.8% |
| Education | 23,910 | 10.0% |
| Literature & Languages | 9,778 | 4.1% |
| Liberal Arts & History | 10,180 | 4.3% |
| Visual & Performing Arts | 8,431 | 3.5% |
| Communications | 12,603 | 5.3% |
| Arts & Humanities | 10,175 | 4.3% |
| Total | 239,122 | 100.0% |
Transportation & Commute in Lake County
Vehicle Availability by Sex in Lake County
The most prevalent vehicle ownership categories in Lake County are males with 2 vehicles (89,373, accounting for 46.7%) and females with 2 vehicles (72,365, making up 56.2%).
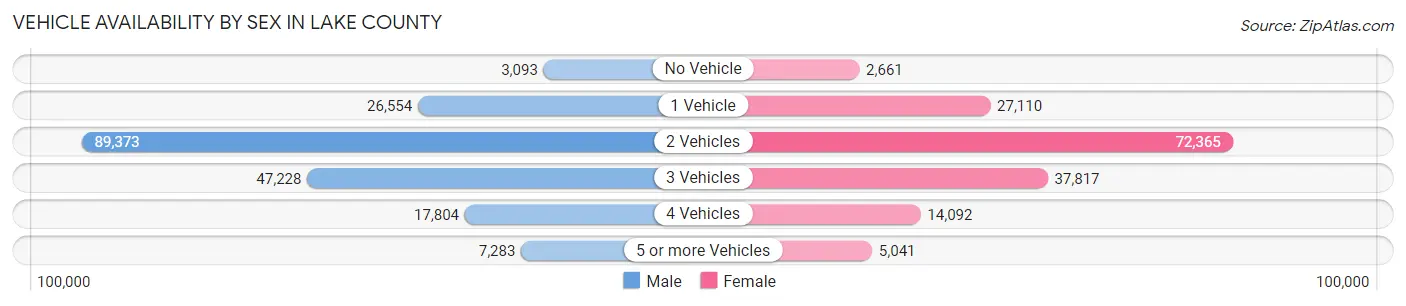
| Vehicles Available | Male | Female |
| No Vehicle | 3,093 (1.6%) | 2,661 (1.7%) |
| 1 Vehicle | 26,554 (13.9%) | 27,110 (17.0%) |
| 2 Vehicles | 89,373 (46.7%) | 72,365 (45.5%) |
| 3 Vehicles | 47,228 (24.7%) | 37,817 (23.8%) |
| 4 Vehicles | 17,804 (9.3%) | 14,092 (8.9%) |
| 5 or more Vehicles | 7,283 (3.8%) | 5,041 (3.2%) |
| Total | 191,335 (100.0%) | 159,086 (100.0%) |
Commute Time in Lake County
The most frequently occuring commute durations in Lake County are 30 to 34 minutes (44,932 commuters, 14.6%), 20 to 24 minutes (41,637 commuters, 13.6%), and 15 to 19 minutes (38,234 commuters, 12.4%).
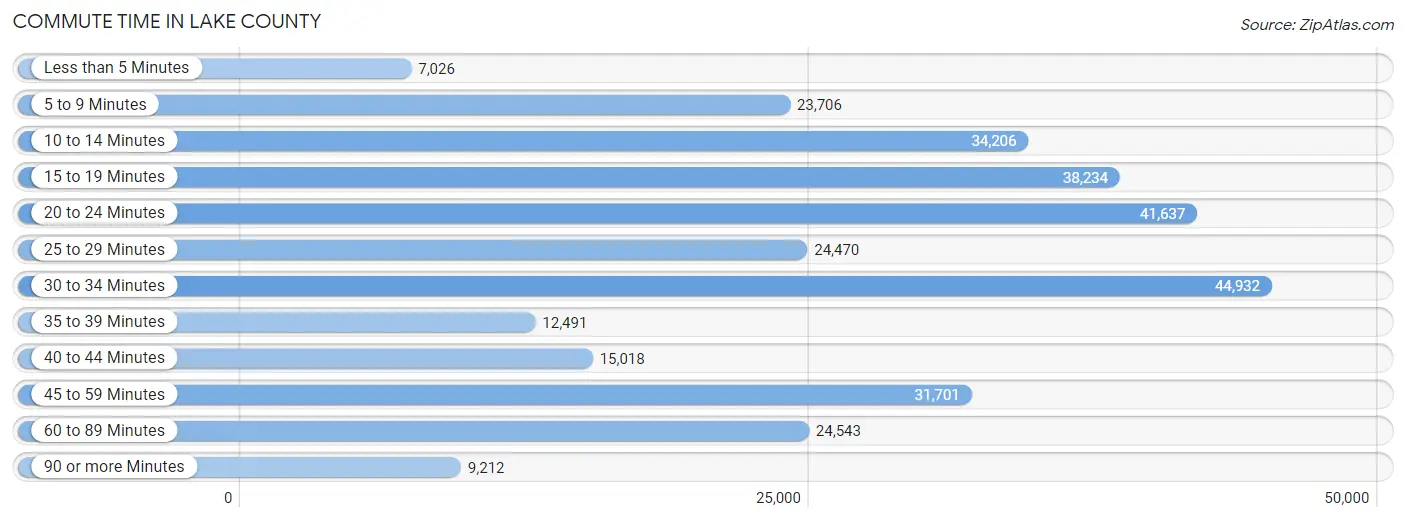
| Commute Time | # Commuters | % Commuters |
| Less than 5 Minutes | 7,026 | 2.3% |
| 5 to 9 Minutes | 23,706 | 7.7% |
| 10 to 14 Minutes | 34,206 | 11.1% |
| 15 to 19 Minutes | 38,234 | 12.4% |
| 20 to 24 Minutes | 41,637 | 13.6% |
| 25 to 29 Minutes | 24,470 | 8.0% |
| 30 to 34 Minutes | 44,932 | 14.6% |
| 35 to 39 Minutes | 12,491 | 4.1% |
| 40 to 44 Minutes | 15,018 | 4.9% |
| 45 to 59 Minutes | 31,701 | 10.3% |
| 60 to 89 Minutes | 24,543 | 8.0% |
| 90 or more Minutes | 9,212 | 3.0% |
Commute Time by Sex in Lake County
The most common commute times in Lake County are 30 to 34 minutes (25,520 commuters, 15.0%) for males and 20 to 24 minutes (19,731 commuters, 14.4%) for females.
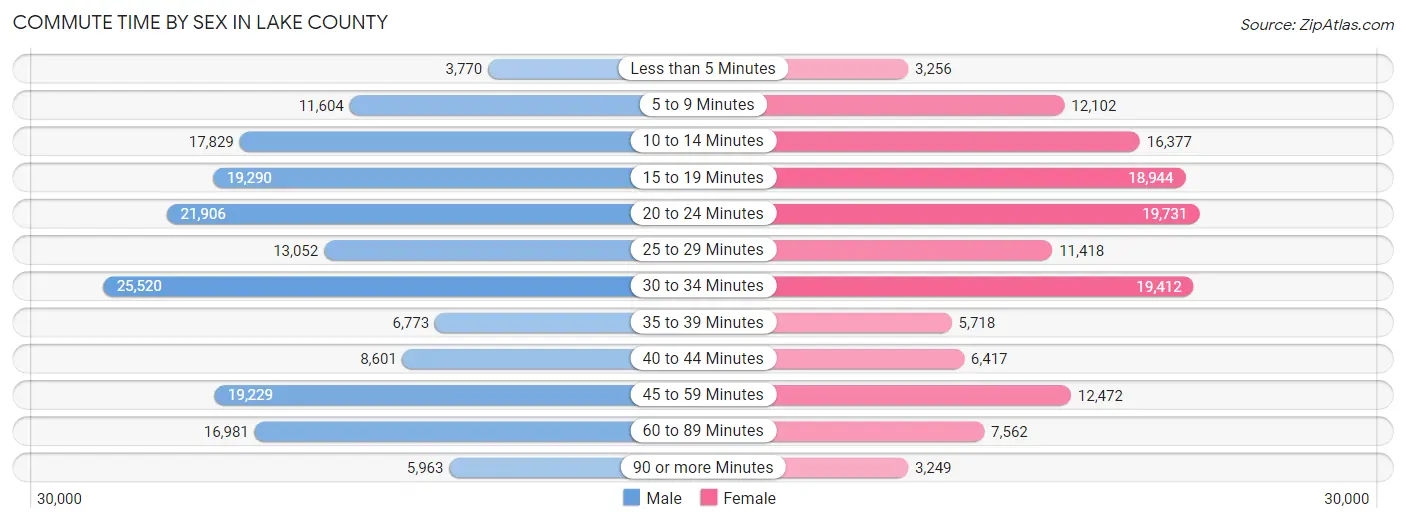
| Commute Time | Male | Female |
| Less than 5 Minutes | 3,770 (2.2%) | 3,256 (2.4%) |
| 5 to 9 Minutes | 11,604 (6.8%) | 12,102 (8.9%) |
| 10 to 14 Minutes | 17,829 (10.5%) | 16,377 (12.0%) |
| 15 to 19 Minutes | 19,290 (11.3%) | 18,944 (13.9%) |
| 20 to 24 Minutes | 21,906 (12.9%) | 19,731 (14.4%) |
| 25 to 29 Minutes | 13,052 (7.6%) | 11,418 (8.4%) |
| 30 to 34 Minutes | 25,520 (15.0%) | 19,412 (14.2%) |
| 35 to 39 Minutes | 6,773 (4.0%) | 5,718 (4.2%) |
| 40 to 44 Minutes | 8,601 (5.0%) | 6,417 (4.7%) |
| 45 to 59 Minutes | 19,229 (11.3%) | 12,472 (9.1%) |
| 60 to 89 Minutes | 16,981 (10.0%) | 7,562 (5.5%) |
| 90 or more Minutes | 5,963 (3.5%) | 3,249 (2.4%) |
Time of Departure to Work by Sex in Lake County
The most frequent times of departure to work in Lake County are 7:00 AM to 7:29 AM (22,474, 13.2%) for males and 7:00 AM to 7:29 AM (21,046, 15.4%) for females.
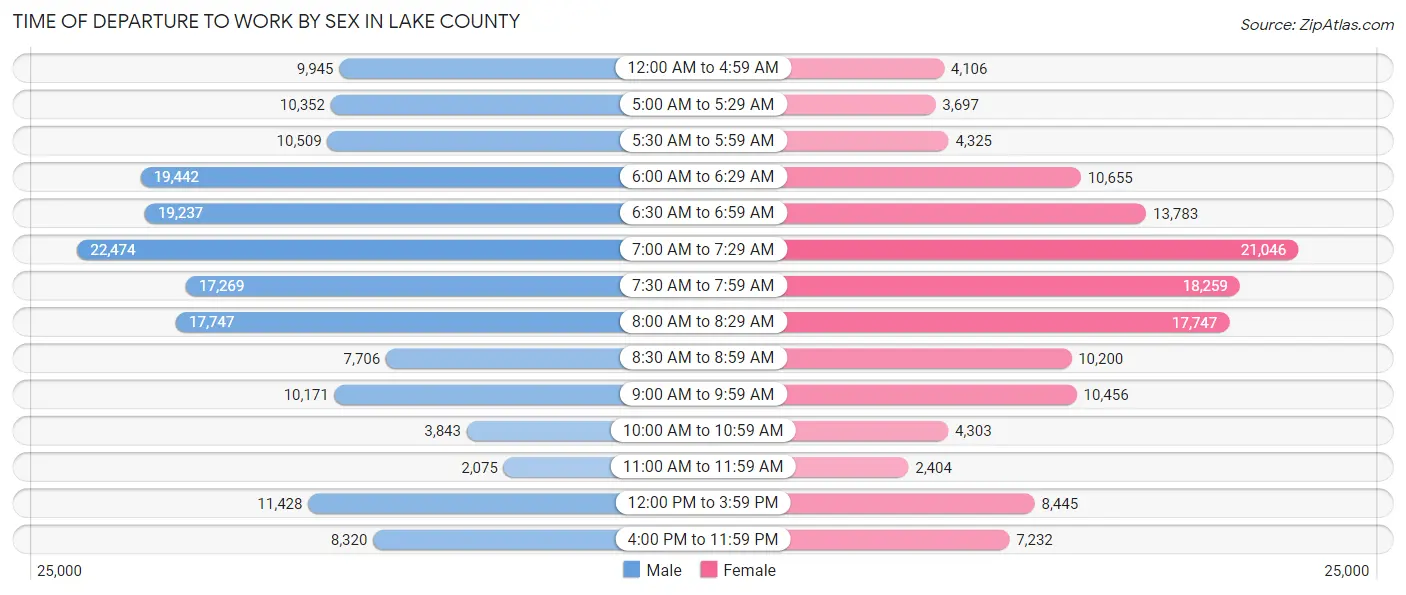
| Time of Departure | Male | Female |
| 12:00 AM to 4:59 AM | 9,945 (5.8%) | 4,106 (3.0%) |
| 5:00 AM to 5:29 AM | 10,352 (6.1%) | 3,697 (2.7%) |
| 5:30 AM to 5:59 AM | 10,509 (6.2%) | 4,325 (3.2%) |
| 6:00 AM to 6:29 AM | 19,442 (11.4%) | 10,655 (7.8%) |
| 6:30 AM to 6:59 AM | 19,237 (11.3%) | 13,783 (10.1%) |
| 7:00 AM to 7:29 AM | 22,474 (13.2%) | 21,046 (15.4%) |
| 7:30 AM to 7:59 AM | 17,269 (10.1%) | 18,259 (13.4%) |
| 8:00 AM to 8:29 AM | 17,747 (10.4%) | 17,747 (13.0%) |
| 8:30 AM to 8:59 AM | 7,706 (4.5%) | 10,200 (7.5%) |
| 9:00 AM to 9:59 AM | 10,171 (6.0%) | 10,456 (7.6%) |
| 10:00 AM to 10:59 AM | 3,843 (2.2%) | 4,303 (3.2%) |
| 11:00 AM to 11:59 AM | 2,075 (1.2%) | 2,404 (1.8%) |
| 12:00 PM to 3:59 PM | 11,428 (6.7%) | 8,445 (6.2%) |
| 4:00 PM to 11:59 PM | 8,320 (4.9%) | 7,232 (5.3%) |
| Total | 170,518 (100.0%) | 136,658 (100.0%) |
Housing Occupancy in Lake County
Occupancy by Ownership in Lake County
Of the total 254,794 dwellings in Lake County, owner-occupied units account for 188,048 (73.8%), while renter-occupied units make up 66,746 (26.2%).
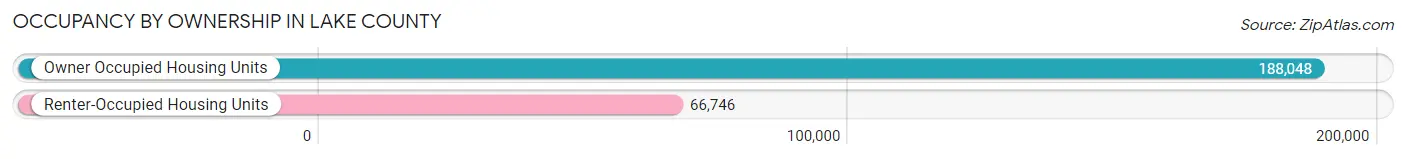
| Occupancy | # Housing Units | % Housing Units |
| Owner Occupied Housing Units | 188,048 | 73.8% |
| Renter-Occupied Housing Units | 66,746 | 26.2% |
| Total Occupied Housing Units | 254,794 | 100.0% |
Occupancy by Household Size in Lake County
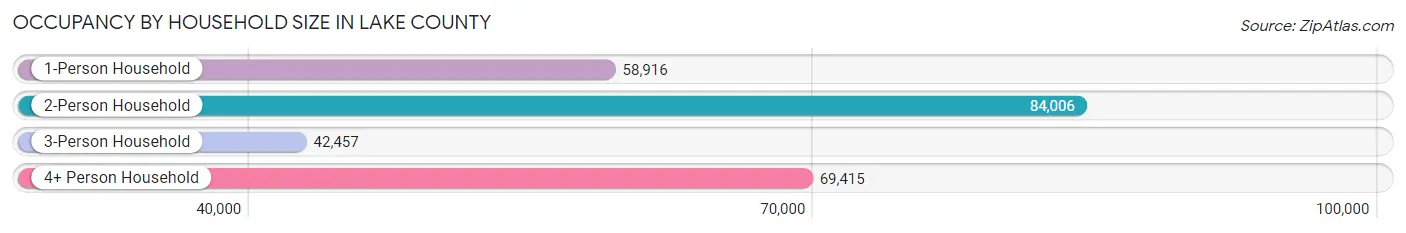
| Household Size | # Housing Units | % Housing Units |
| 1-Person Household | 58,916 | 23.1% |
| 2-Person Household | 84,006 | 33.0% |
| 3-Person Household | 42,457 | 16.7% |
| 4+ Person Household | 69,415 | 27.2% |
| Total Housing Units | 254,794 | 100.0% |
Occupancy by Ownership by Household Size in Lake County
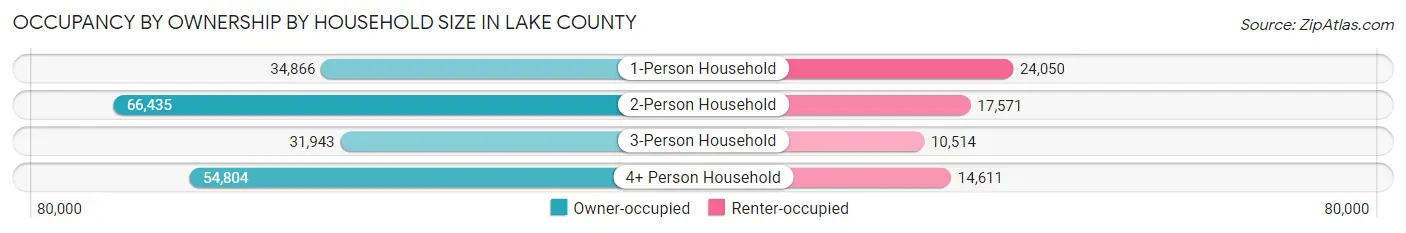
| Household Size | Owner-occupied | Renter-occupied |
| 1-Person Household | 34,866 (59.2%) | 24,050 (40.8%) |
| 2-Person Household | 66,435 (79.1%) | 17,571 (20.9%) |
| 3-Person Household | 31,943 (75.2%) | 10,514 (24.8%) |
| 4+ Person Household | 54,804 (78.9%) | 14,611 (21.0%) |
| Total Housing Units | 188,048 (73.8%) | 66,746 (26.2%) |
Occupancy by Educational Attainment in Lake County
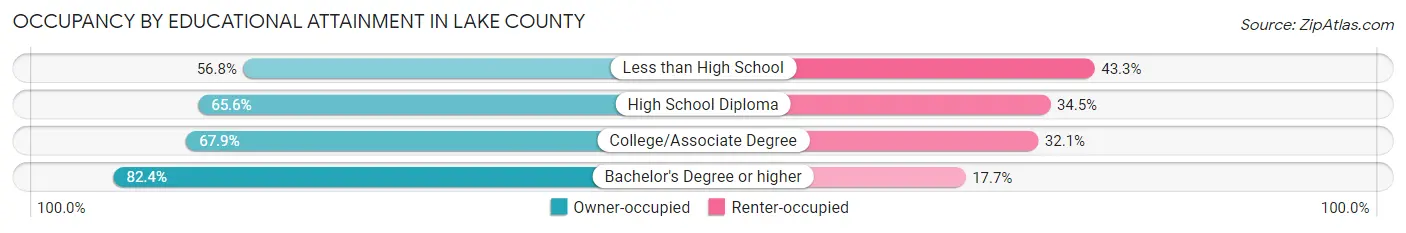
| Household Size | Owner-occupied | Renter-occupied |
| Less than High School | 10,826 (56.8%) | 8,252 (43.2%) |
| High School Diploma | 29,867 (65.5%) | 15,695 (34.4%) |
| College/Associate Degree | 43,538 (67.9%) | 20,555 (32.1%) |
| Bachelor's Degree or higher | 103,817 (82.4%) | 22,244 (17.6%) |
Occupancy by Age of Householder in Lake County
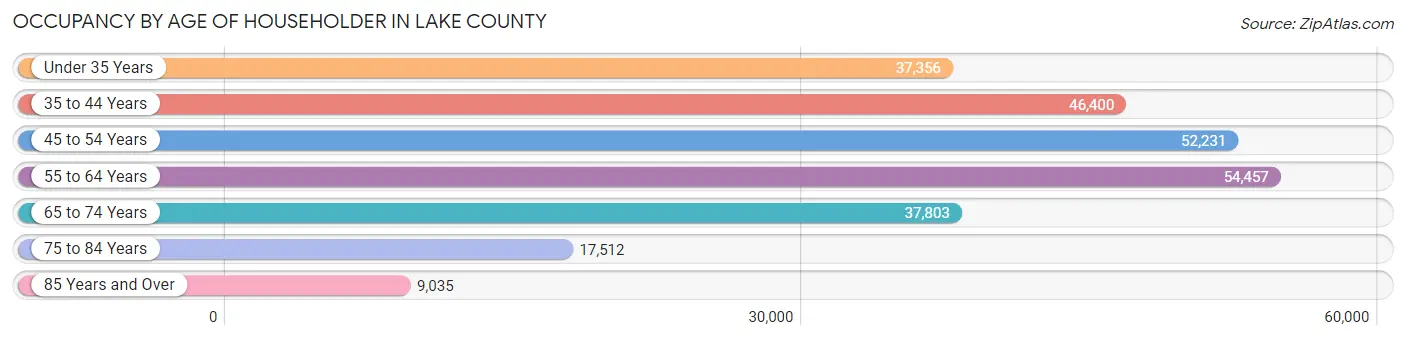
| Age Bracket | # Households | % Households |
| Under 35 Years | 37,356 | 14.7% |
| 35 to 44 Years | 46,400 | 18.2% |
| 45 to 54 Years | 52,231 | 20.5% |
| 55 to 64 Years | 54,457 | 21.4% |
| 65 to 74 Years | 37,803 | 14.8% |
| 75 to 84 Years | 17,512 | 6.9% |
| 85 Years and Over | 9,035 | 3.5% |
| Total | 254,794 | 100.0% |
Housing Finances in Lake County
Median Income by Occupancy in Lake County
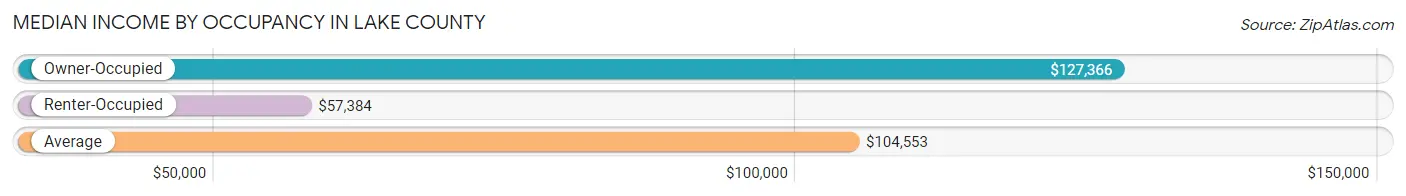
| Occupancy Type | # Households | Median Income |
| Owner-Occupied | 188,048 (73.8%) | $127,366 |
| Renter-Occupied | 66,746 (26.2%) | $57,384 |
| Average | 254,794 (100.0%) | $104,553 |
Occupancy by Householder Income Bracket in Lake County
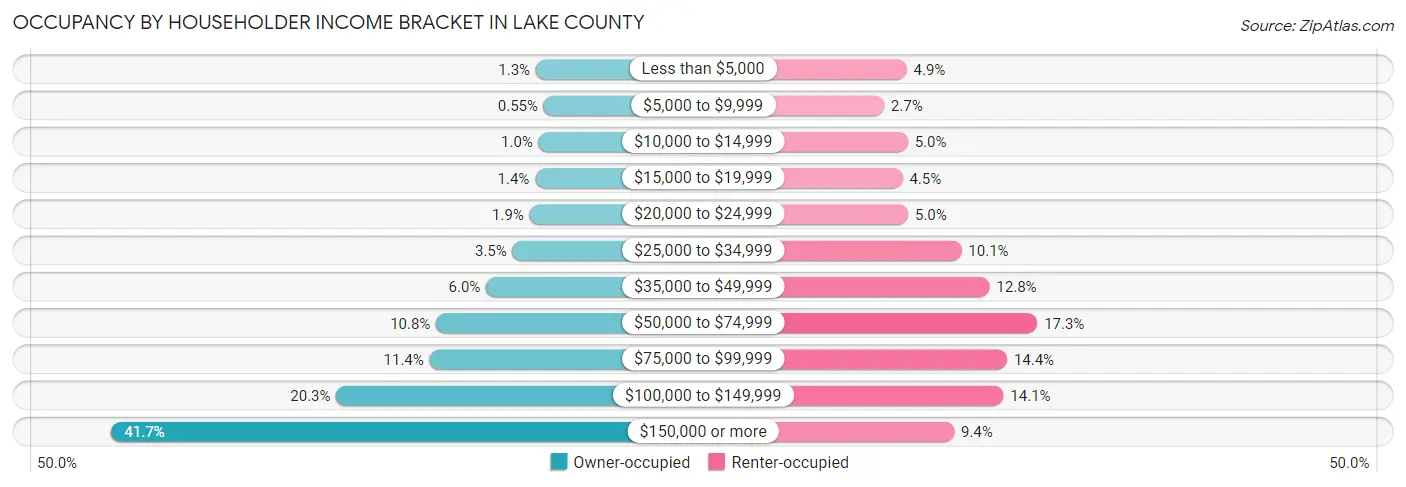
| Income Bracket | Owner-occupied | Renter-occupied |
| Less than $5,000 | 2,444 (1.3%) | 3,241 (4.9%) |
| $5,000 to $9,999 | 1,039 (0.5%) | 1,804 (2.7%) |
| $10,000 to $14,999 | 1,950 (1.0%) | 3,319 (5.0%) |
| $15,000 to $19,999 | 2,575 (1.4%) | 2,982 (4.5%) |
| $20,000 to $24,999 | 3,573 (1.9%) | 3,335 (5.0%) |
| $25,000 to $34,999 | 6,620 (3.5%) | 6,726 (10.1%) |
| $35,000 to $49,999 | 11,364 (6.0%) | 8,508 (12.8%) |
| $50,000 to $74,999 | 20,314 (10.8%) | 11,547 (17.3%) |
| $75,000 to $99,999 | 21,495 (11.4%) | 9,622 (14.4%) |
| $100,000 to $149,999 | 38,200 (20.3%) | 9,400 (14.1%) |
| $150,000 or more | 78,474 (41.7%) | 6,262 (9.4%) |
| Total | 188,048 (100.0%) | 66,746 (100.0%) |
Monthly Housing Cost Tiers in Lake County
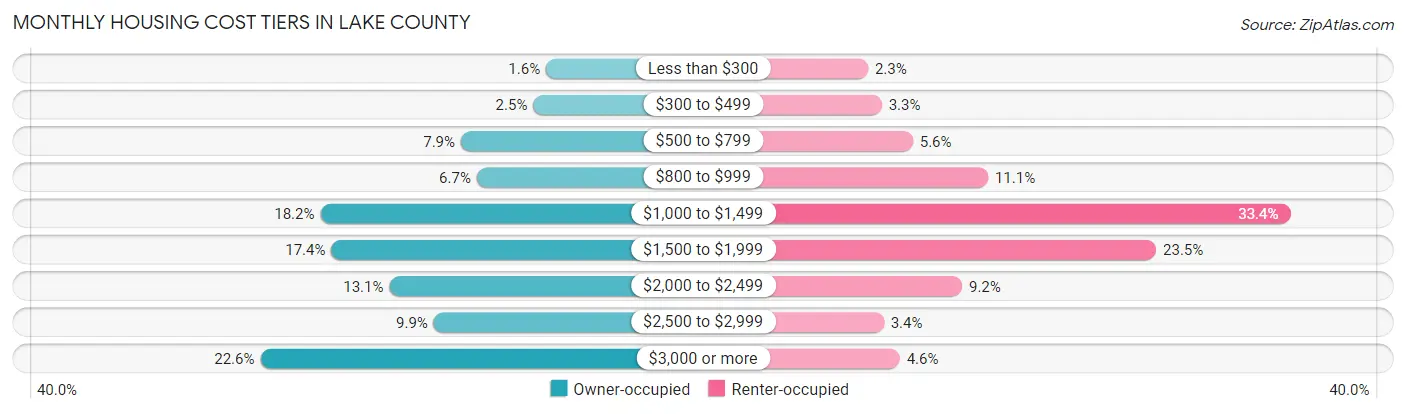
| Monthly Cost | Owner-occupied | Renter-occupied |
| Less than $300 | 3,015 (1.6%) | 1,502 (2.2%) |
| $300 to $499 | 4,783 (2.5%) | 2,173 (3.3%) |
| $500 to $799 | 14,791 (7.9%) | 3,702 (5.6%) |
| $800 to $999 | 12,605 (6.7%) | 7,403 (11.1%) |
| $1,000 to $1,499 | 34,264 (18.2%) | 22,263 (33.4%) |
| $1,500 to $1,999 | 32,736 (17.4%) | 15,662 (23.5%) |
| $2,000 to $2,499 | 24,703 (13.1%) | 6,130 (9.2%) |
| $2,500 to $2,999 | 18,568 (9.9%) | 2,277 (3.4%) |
| $3,000 or more | 42,583 (22.6%) | 3,065 (4.6%) |
| Total | 188,048 (100.0%) | 66,746 (100.0%) |
Physical Housing Characteristics in Lake County
Housing Structures in Lake County
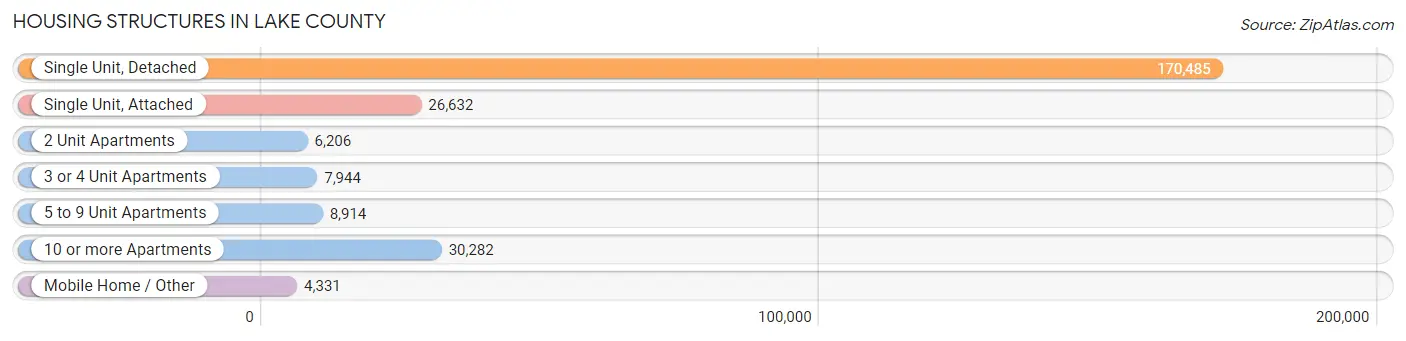
| Structure Type | # Housing Units | % Housing Units |
| Single Unit, Detached | 170,485 | 66.9% |
| Single Unit, Attached | 26,632 | 10.4% |
| 2 Unit Apartments | 6,206 | 2.4% |
| 3 or 4 Unit Apartments | 7,944 | 3.1% |
| 5 to 9 Unit Apartments | 8,914 | 3.5% |
| 10 or more Apartments | 30,282 | 11.9% |
| Mobile Home / Other | 4,331 | 1.7% |
| Total | 254,794 | 100.0% |
Housing Structures by Occupancy in Lake County
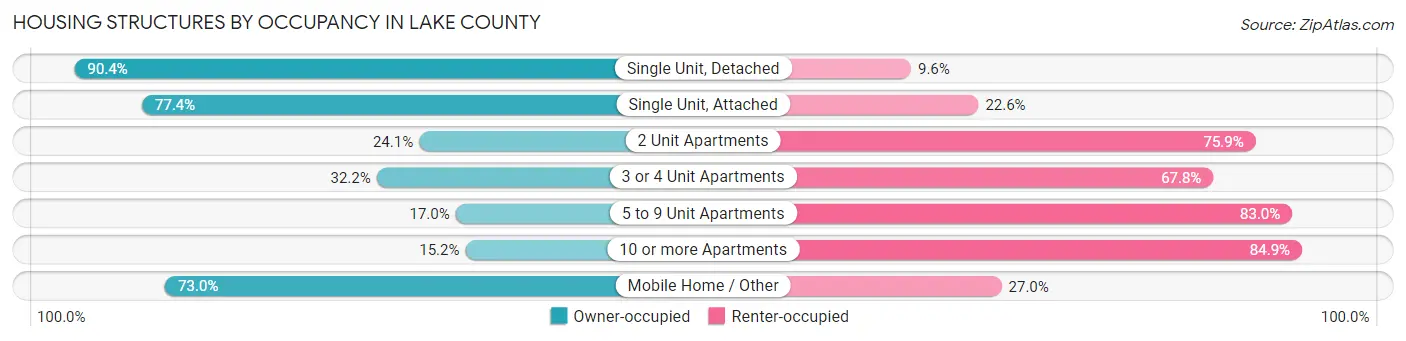
| Structure Type | Owner-occupied | Renter-occupied |
| Single Unit, Detached | 154,110 (90.4%) | 16,375 (9.6%) |
| Single Unit, Attached | 20,618 (77.4%) | 6,014 (22.6%) |
| 2 Unit Apartments | 1,494 (24.1%) | 4,712 (75.9%) |
| 3 or 4 Unit Apartments | 2,560 (32.2%) | 5,384 (67.8%) |
| 5 to 9 Unit Apartments | 1,518 (17.0%) | 7,396 (83.0%) |
| 10 or more Apartments | 4,588 (15.1%) | 25,694 (84.9%) |
| Mobile Home / Other | 3,160 (73.0%) | 1,171 (27.0%) |
| Total | 188,048 (73.8%) | 66,746 (26.2%) |
Housing Structures by Number of Rooms in Lake County
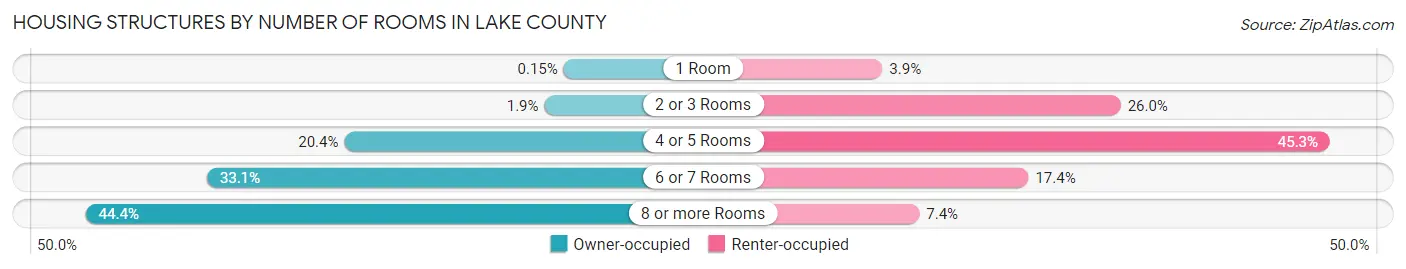
| Number of Rooms | Owner-occupied | Renter-occupied |
| 1 Room | 281 (0.2%) | 2,621 (3.9%) |
| 2 or 3 Rooms | 3,630 (1.9%) | 17,334 (26.0%) |
| 4 or 5 Rooms | 38,422 (20.4%) | 30,245 (45.3%) |
| 6 or 7 Rooms | 62,312 (33.1%) | 11,638 (17.4%) |
| 8 or more Rooms | 83,403 (44.4%) | 4,908 (7.3%) |
| Total | 188,048 (100.0%) | 66,746 (100.0%) |
Housing Structure by Heating Type in Lake County
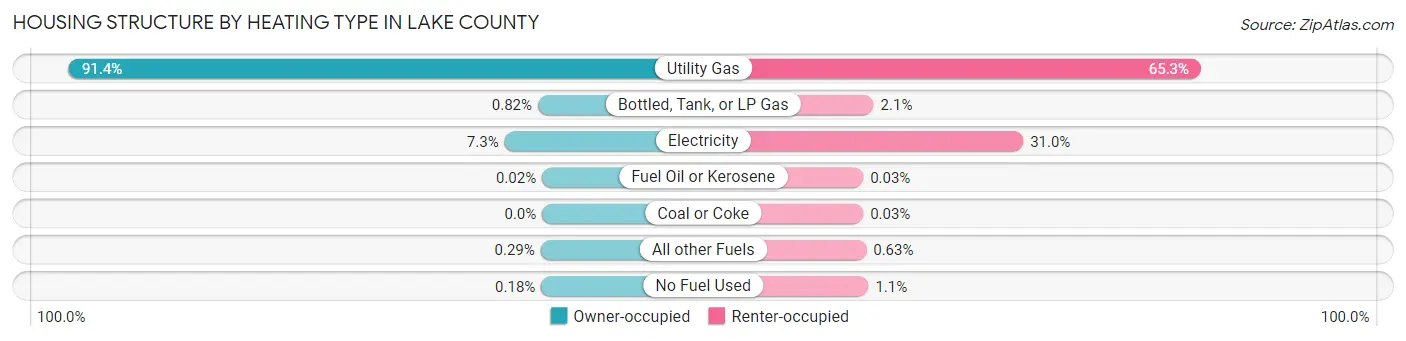
| Heating Type | Owner-occupied | Renter-occupied |
| Utility Gas | 171,928 (91.4%) | 43,564 (65.3%) |
| Bottled, Tank, or LP Gas | 1,537 (0.8%) | 1,366 (2.1%) |
| Electricity | 13,665 (7.3%) | 20,659 (30.9%) |
| Fuel Oil or Kerosene | 41 (0.0%) | 19 (0.0%) |
| Coal or Coke | 0 (0.0%) | 17 (0.0%) |
| All other Fuels | 538 (0.3%) | 420 (0.6%) |
| No Fuel Used | 339 (0.2%) | 701 (1.1%) |
| Total | 188,048 (100.0%) | 66,746 (100.0%) |
Household Vehicle Usage in Lake County
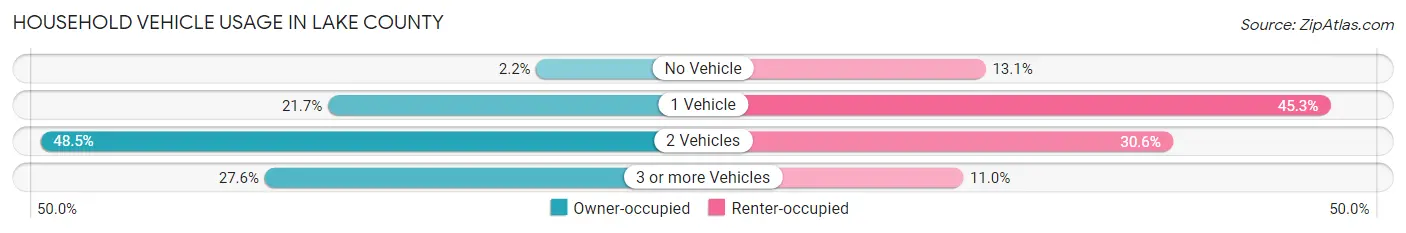
| Vehicles per Household | Owner-occupied | Renter-occupied |
| No Vehicle | 4,184 (2.2%) | 8,759 (13.1%) |
| 1 Vehicle | 40,773 (21.7%) | 30,223 (45.3%) |
| 2 Vehicles | 91,234 (48.5%) | 20,408 (30.6%) |
| 3 or more Vehicles | 51,857 (27.6%) | 7,356 (11.0%) |
| Total | 188,048 (100.0%) | 66,746 (100.0%) |
Real Estate & Mortgages in Lake County
Real Estate and Mortgage Overview in Lake County
| Characteristic | Without Mortgage | With Mortgage |
| Housing Units | 64,393 | 123,655 |
| Median Property Value | $287,600 | $326,900 |
| Median Household Income | $96,248 | $58,589 |
| Monthly Housing Costs | $1,033 | $40,934 |
| Real Estate Taxes | $7,704 | $1,561 |
Property Value by Mortgage Status in Lake County
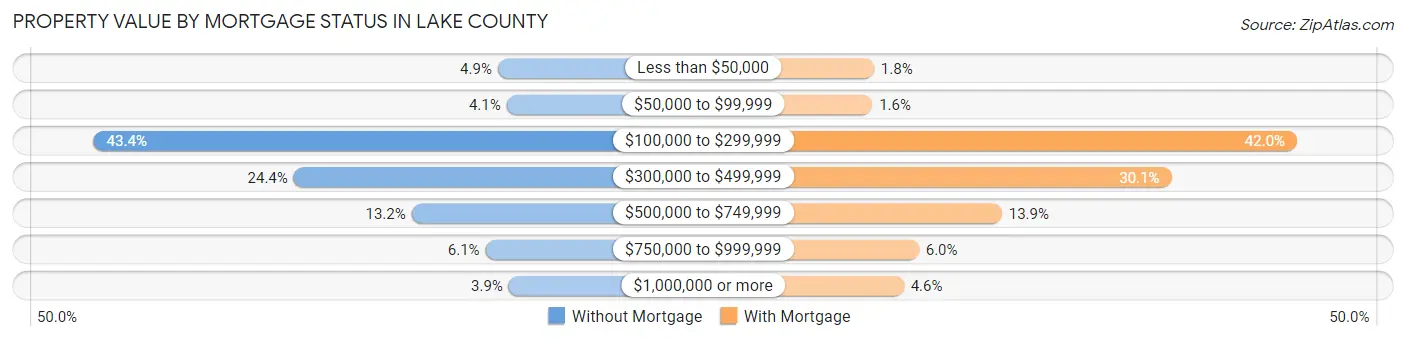
| Property Value | Without Mortgage | With Mortgage |
| Less than $50,000 | 3,178 (4.9%) | 2,169 (1.8%) |
| $50,000 to $99,999 | 2,639 (4.1%) | 1,968 (1.6%) |
| $100,000 to $299,999 | 27,958 (43.4%) | 51,974 (42.0%) |
| $300,000 to $499,999 | 15,701 (24.4%) | 37,191 (30.1%) |
| $500,000 to $749,999 | 8,468 (13.2%) | 17,227 (13.9%) |
| $750,000 to $999,999 | 3,935 (6.1%) | 7,445 (6.0%) |
| $1,000,000 or more | 2,514 (3.9%) | 5,681 (4.6%) |
| Total | 64,393 (100.0%) | 123,655 (100.0%) |
Household Income by Mortgage Status in Lake County
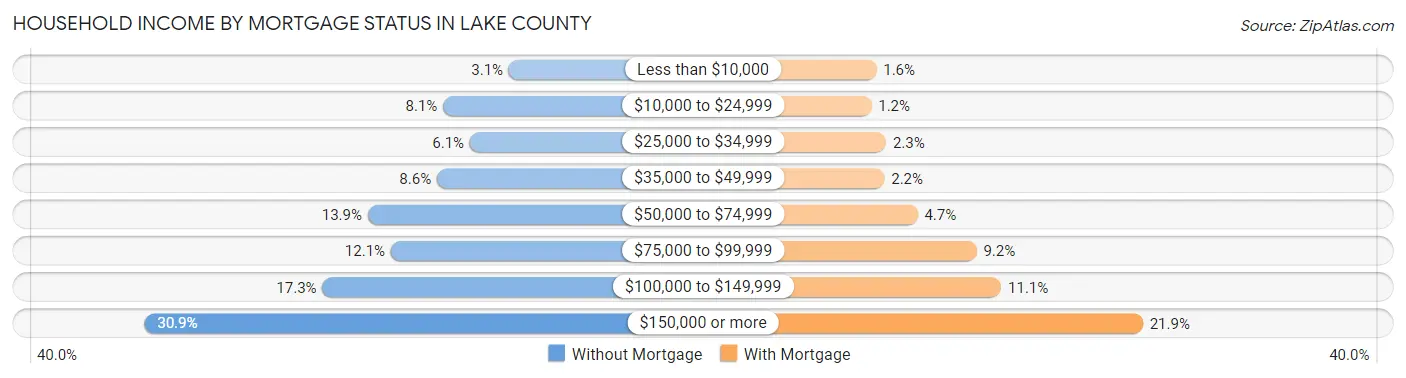
| Household Income | Without Mortgage | With Mortgage |
| Less than $10,000 | 1,996 (3.1%) | 1,953 (1.6%) |
| $10,000 to $24,999 | 5,225 (8.1%) | 1,487 (1.2%) |
| $25,000 to $34,999 | 3,907 (6.1%) | 2,873 (2.3%) |
| $35,000 to $49,999 | 5,526 (8.6%) | 2,713 (2.2%) |
| $50,000 to $74,999 | 8,921 (13.9%) | 5,838 (4.7%) |
| $75,000 to $99,999 | 7,784 (12.1%) | 11,393 (9.2%) |
| $100,000 to $149,999 | 11,149 (17.3%) | 13,711 (11.1%) |
| $150,000 or more | 19,885 (30.9%) | 27,051 (21.9%) |
| Total | 64,393 (100.0%) | 123,655 (100.0%) |
Property Value to Household Income Ratio in Lake County
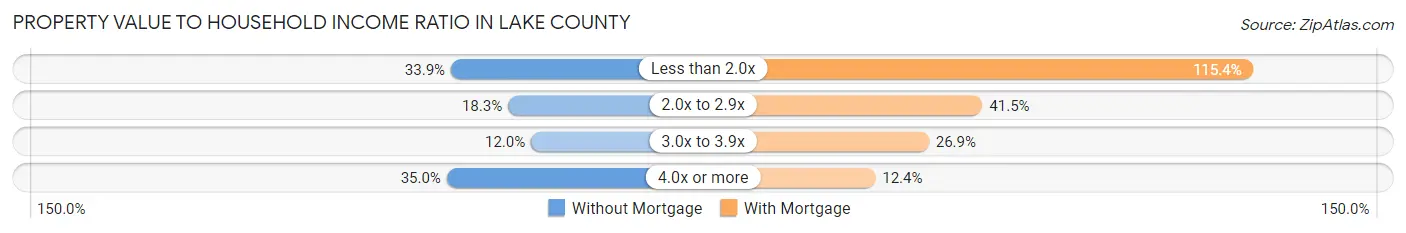
| Value-to-Income Ratio | Without Mortgage | With Mortgage |
| Less than 2.0x | 21,808 (33.9%) | 142,710 (115.4%) |
| 2.0x to 2.9x | 11,795 (18.3%) | 51,365 (41.5%) |
| 3.0x to 3.9x | 7,755 (12.0%) | 33,300 (26.9%) |
| 4.0x or more | 22,550 (35.0%) | 15,301 (12.4%) |
| Total | 64,393 (100.0%) | 123,655 (100.0%) |
Real Estate Taxes by Mortgage Status in Lake County
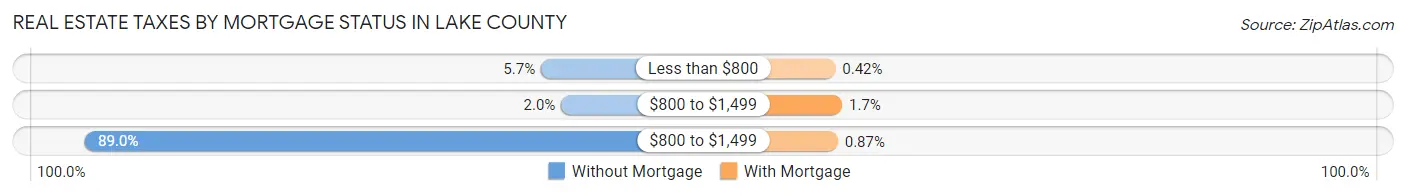
| Property Taxes | Without Mortgage | With Mortgage |
| Less than $800 | 3,659 (5.7%) | 524 (0.4%) |
| $800 to $1,499 | 1,288 (2.0%) | 2,044 (1.7%) |
| $800 to $1,499 | 57,279 (88.9%) | 1,076 (0.9%) |
| Total | 64,393 (100.0%) | 123,655 (100.0%) |
Health & Disability in Lake County
Health Insurance Coverage by Age in Lake County

| Age Bracket | With Coverage | Without Coverage |
| Under 6 Years | 46,165 (96.7%) | 1,556 (3.3%) |
| 6 to 18 Years | 127,490 (96.5%) | 4,572 (3.5%) |
| 19 to 25 Years | 53,894 (88.5%) | 7,033 (11.5%) |
| 26 to 34 Years | 59,803 (87.1%) | 8,896 (13.0%) |
| 35 to 44 Years | 78,811 (88.5%) | 10,260 (11.5%) |
| 45 to 54 Years | 87,923 (91.6%) | 8,096 (8.4%) |
| 55 to 64 Years | 90,615 (93.9%) | 5,851 (6.1%) |
| 65 to 74 Years | 62,513 (98.8%) | 731 (1.2%) |
| 75 Years and older | 40,434 (99.6%) | 160 (0.4%) |
| Total | 647,648 (93.2%) | 47,155 (6.8%) |
Health Insurance Coverage by Citizenship Status in Lake County
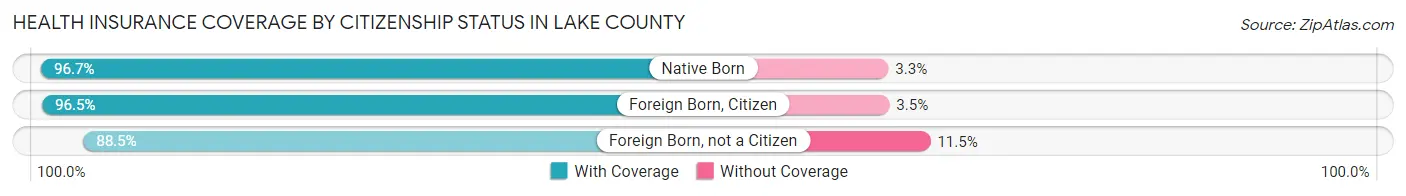
| Citizenship Status | With Coverage | Without Coverage |
| Native Born | 46,165 (96.7%) | 1,556 (3.3%) |
| Foreign Born, Citizen | 127,490 (96.5%) | 4,572 (3.5%) |
| Foreign Born, not a Citizen | 53,894 (88.5%) | 7,033 (11.5%) |
Health Insurance Coverage by Household Income in Lake County
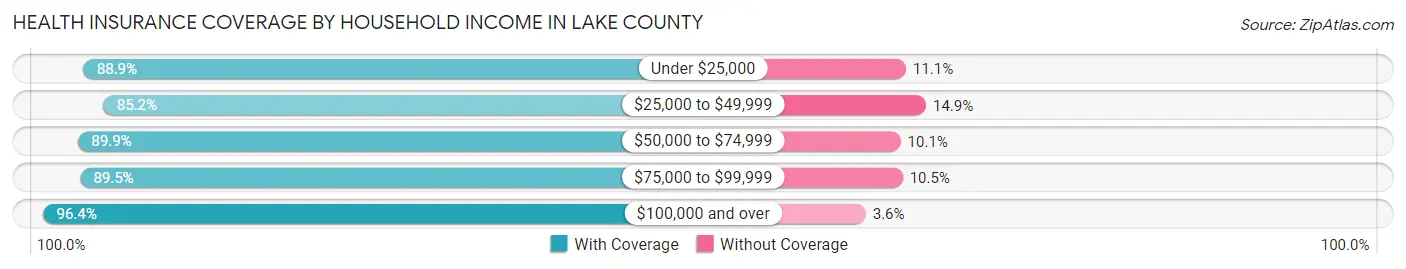
| Household Income | With Coverage | Without Coverage |
| Under $25,000 | 41,563 (88.9%) | 5,189 (11.1%) |
| $25,000 to $49,999 | 61,593 (85.2%) | 10,745 (14.8%) |
| $50,000 to $74,999 | 69,040 (89.9%) | 7,751 (10.1%) |
| $75,000 to $99,999 | 72,868 (89.5%) | 8,518 (10.5%) |
| $100,000 and over | 398,603 (96.4%) | 14,701 (3.6%) |
Public vs Private Health Insurance Coverage by Age in Lake County
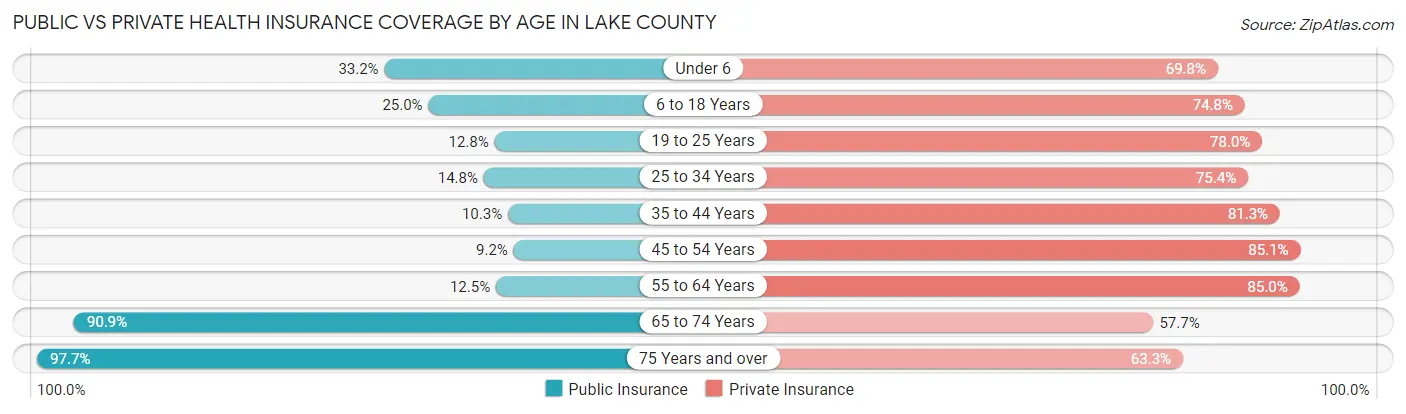
| Age Bracket | Public Insurance | Private Insurance |
| Under 6 | 15,848 (33.2%) | 33,299 (69.8%) |
| 6 to 18 Years | 33,074 (25.0%) | 98,783 (74.8%) |
| 19 to 25 Years | 7,781 (12.8%) | 47,535 (78.0%) |
| 25 to 34 Years | 10,145 (14.8%) | 51,789 (75.4%) |
| 35 to 44 Years | 9,155 (10.3%) | 72,432 (81.3%) |
| 45 to 54 Years | 8,857 (9.2%) | 81,731 (85.1%) |
| 55 to 64 Years | 12,054 (12.5%) | 81,970 (85.0%) |
| 65 to 74 Years | 57,456 (90.8%) | 36,472 (57.7%) |
| 75 Years and over | 39,643 (97.7%) | 25,700 (63.3%) |
| Total | 194,013 (27.9%) | 529,711 (76.2%) |
Disability Status by Sex by Age in Lake County
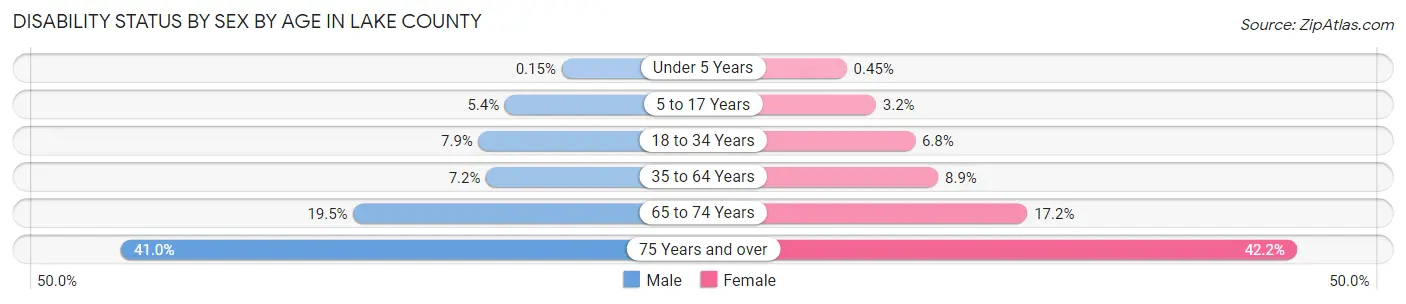
| Age Bracket | Male | Female |
| Under 5 Years | 30 (0.2%) | 86 (0.4%) |
| 5 to 17 Years | 3,570 (5.4%) | 1,998 (3.2%) |
| 18 to 34 Years | 5,700 (7.9%) | 4,687 (6.8%) |
| 35 to 64 Years | 10,044 (7.1%) | 12,625 (8.9%) |
| 65 to 74 Years | 5,916 (19.5%) | 5,658 (17.2%) |
| 75 Years and over | 7,034 (41.0%) | 9,902 (42.2%) |
Disability Class by Sex by Age in Lake County
Disability Class: Hearing Difficulty
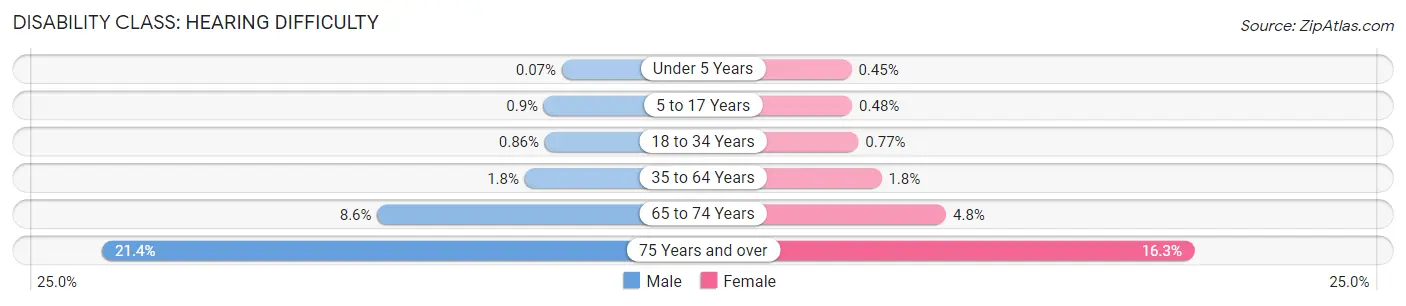
| Age Bracket | Male | Female |
| Under 5 Years | 14 (0.1%) | 86 (0.4%) |
| 5 to 17 Years | 597 (0.9%) | 303 (0.5%) |
| 18 to 34 Years | 622 (0.9%) | 535 (0.8%) |
| 35 to 64 Years | 2,517 (1.8%) | 2,598 (1.8%) |
| 65 to 74 Years | 2,621 (8.6%) | 1,591 (4.8%) |
| 75 Years and over | 3,668 (21.4%) | 3,831 (16.3%) |
Disability Class: Vision Difficulty
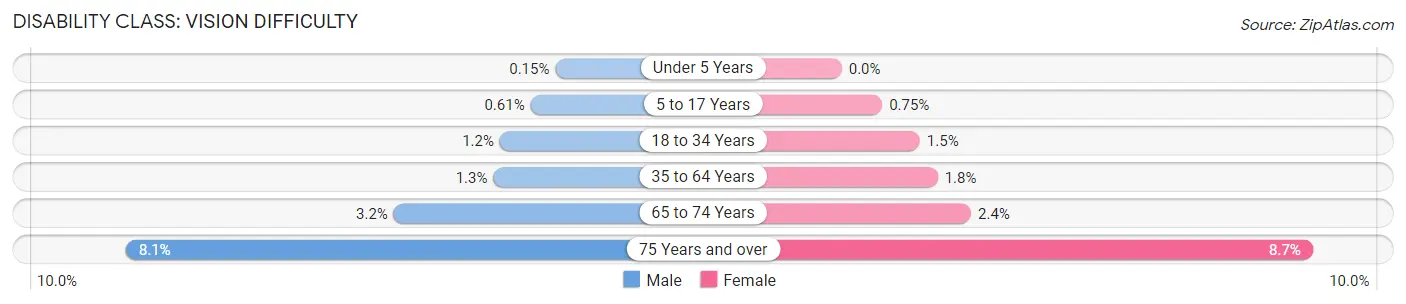
| Age Bracket | Male | Female |
| Under 5 Years | 30 (0.2%) | 0 (0.0%) |
| 5 to 17 Years | 404 (0.6%) | 473 (0.7%) |
| 18 to 34 Years | 853 (1.2%) | 1,004 (1.5%) |
| 35 to 64 Years | 1,826 (1.3%) | 2,512 (1.8%) |
| 65 to 74 Years | 956 (3.2%) | 788 (2.4%) |
| 75 Years and over | 1,391 (8.1%) | 2,049 (8.7%) |
Disability Class: Cognitive Difficulty
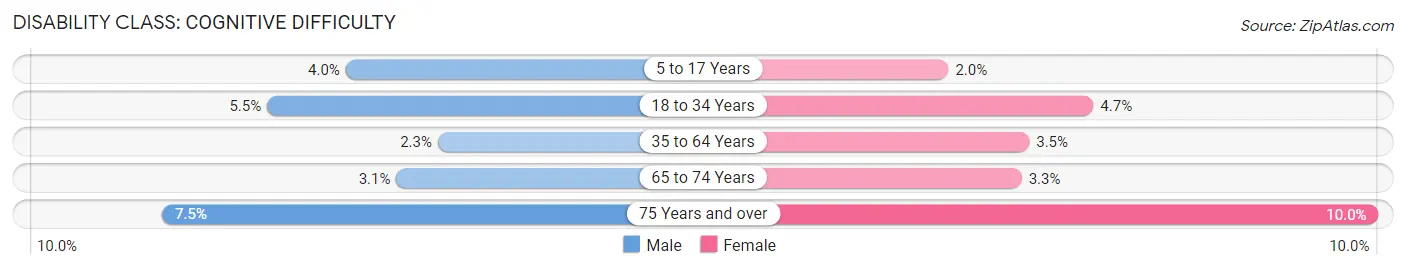
| Age Bracket | Male | Female |
| 5 to 17 Years | 2,665 (4.0%) | 1,253 (2.0%) |
| 18 to 34 Years | 3,986 (5.5%) | 3,226 (4.7%) |
| 35 to 64 Years | 3,273 (2.3%) | 4,909 (3.5%) |
| 65 to 74 Years | 940 (3.1%) | 1,099 (3.3%) |
| 75 Years and over | 1,276 (7.4%) | 2,336 (10.0%) |
Disability Class: Ambulatory Difficulty
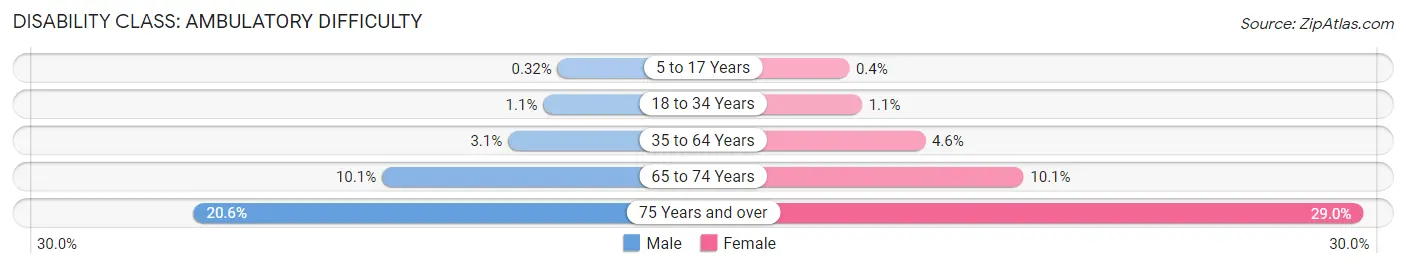
| Age Bracket | Male | Female |
| 5 to 17 Years | 211 (0.3%) | 255 (0.4%) |
| 18 to 34 Years | 813 (1.1%) | 768 (1.1%) |
| 35 to 64 Years | 4,319 (3.1%) | 6,531 (4.6%) |
| 65 to 74 Years | 3,067 (10.1%) | 3,324 (10.1%) |
| 75 Years and over | 3,529 (20.6%) | 6,809 (29.0%) |
Disability Class: Self-Care Difficulty
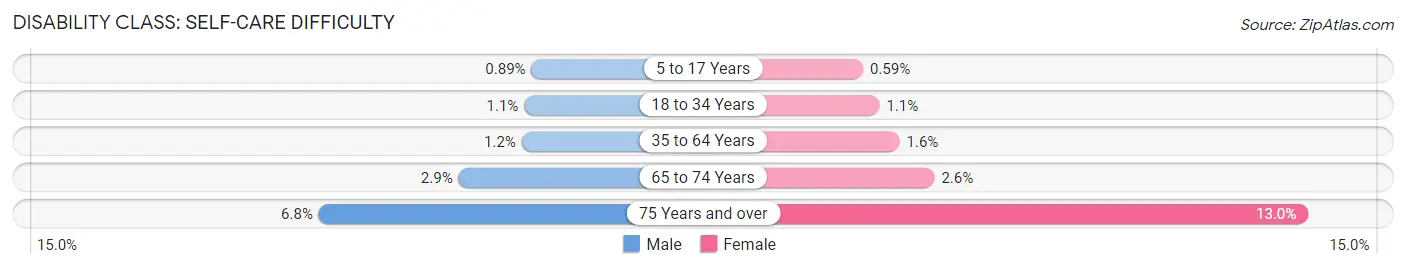
| Age Bracket | Male | Female |
| 5 to 17 Years | 584 (0.9%) | 374 (0.6%) |
| 18 to 34 Years | 788 (1.1%) | 722 (1.1%) |
| 35 to 64 Years | 1,635 (1.2%) | 2,271 (1.6%) |
| 65 to 74 Years | 887 (2.9%) | 847 (2.6%) |
| 75 Years and over | 1,167 (6.8%) | 3,044 (13.0%) |
Technology Access in Lake County
Computing Device Access in Lake County
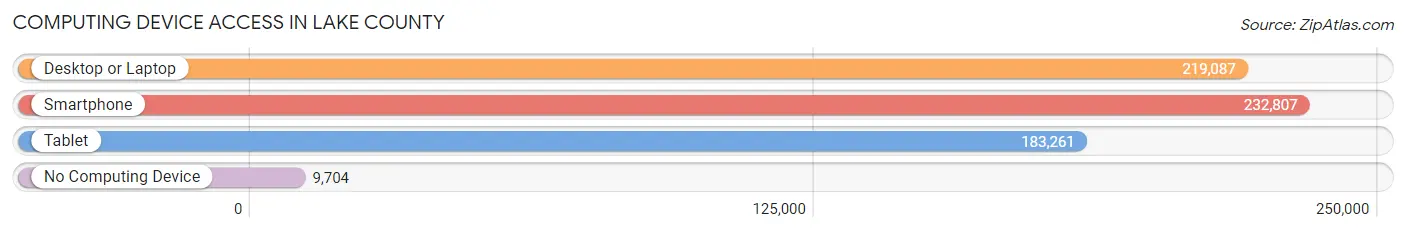
| Device Type | # Households | % Households |
| Desktop or Laptop | 219,087 | 86.0% |
| Smartphone | 232,807 | 91.4% |
| Tablet | 183,261 | 71.9% |
| No Computing Device | 9,704 | 3.8% |
| Total | 254,794 | 100.0% |
Internet Access in Lake County
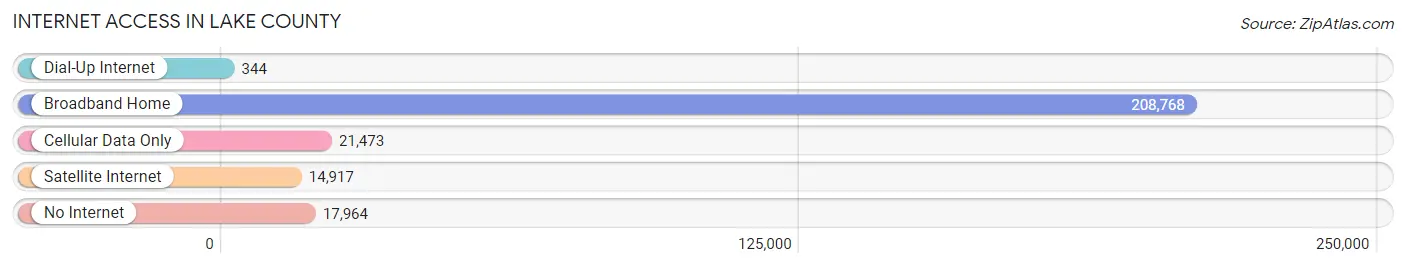
| Internet Type | # Households | % Households |
| Dial-Up Internet | 344 | 0.1% |
| Broadband Home | 208,768 | 81.9% |
| Cellular Data Only | 21,473 | 8.4% |
| Satellite Internet | 14,917 | 5.9% |
| No Internet | 17,964 | 7.0% |
| Total | 254,794 | 100.0% |
Lake County Summary
Lake County, Illinois is located in the northeastern corner of the state, just south of the Wisconsin border. It is part of the Chicago metropolitan area and is the third most populous county in Illinois. The county seat is Waukegan, and the largest city is North Chicago. Lake County is home to a diverse population of over 700,000 people, with a median household income of $71,000.
History
The area that is now Lake County was first inhabited by the Potawatomi and Ottawa Native American tribes. The first European settlers arrived in the area in the early 1800s, and the county was officially established in 1839. The county was named after Lake Michigan, which forms its eastern border.
In the late 1800s, the county experienced a period of rapid growth and development. The city of Waukegan was established in 1849, and the county seat was moved there in 1855. The city of North Chicago was founded in 1889, and the Great Lakes Naval Training Station was established in 1911.
The county experienced a period of economic growth in the early 20th century, with the development of the steel industry and the growth of the automobile industry. The Great Depression had a significant impact on the county, and the population declined significantly.
In the 1950s, the county experienced a period of suburbanization, as many people moved from the city of Chicago to the suburbs of Lake County. This trend continued into the 1960s and 1970s, and the population of the county grew significantly.
Geography
Lake County is located in the northeastern corner of Illinois, just south of the Wisconsin border. It is bordered by Cook County to the south, McHenry County to the west, and Kenosha County, Wisconsin to the north. The county is part of the Chicago metropolitan area, and is located approximately 40 miles north of downtown Chicago.
The county is mostly flat, with some rolling hills in the northern and western parts of the county. The Des Plaines River forms the western border of the county, and the Fox River forms the northern border. The county is home to several lakes, including Lake Michigan, which forms the eastern border of the county.
Economy
Lake County has a diverse economy, with a mix of manufacturing, retail, and service industries. The largest employers in the county are the Great Lakes Naval Training Station, Abbott Laboratories, and the University of Illinois at Chicago.
The county is also home to several major retail centers, including Gurnee Mills, Hawthorn Mall, and Westfield Hawthorn. The county is also home to several corporate headquarters, including Baxter International, W.W. Grainger, and Tenneco.
Demographics
As of the 2010 census, the population of Lake County was 703,462. The racial makeup of the county was 73.3% White, 14.3% African American, 0.4% Native American, 5.2% Asian, and 6.8% from other races. The median household income was $71,000, and the median family income was $83,000.
The largest cities in the county are Waukegan, North Chicago, Zion, Gurnee, and Round Lake Beach. The county is home to several colleges and universities, including the University of Illinois at Chicago, Lake Forest College, and the College of Lake County.
Conclusion
Lake County, Illinois is a diverse and vibrant county located in the northeastern corner of the state. It is part of the Chicago metropolitan area and is home to a population of over 700,000 people. The county has a diverse economy, with a mix of manufacturing, retail, and service industries. The county is also home to several major retail centers, corporate headquarters, and colleges and universities.
Common Questions
What is the Total Population of Lake County?
Total Population of Lake County is 713,159.
What is the Total Male Population of Lake County?
Total Male Population of Lake County is 359,281.
What is the Total Female Population of Lake County?
Total Female Population of Lake County is 353,878.
What is the Ratio of Males per 100 Females in Lake County?
There are 101.53 Males per 100 Females in Lake County.
What is the Ratio of Females per 100 Males in Lake County?
There are 98.50 Females per 100 Males in Lake County.
What is the Median Population Age in Lake County?
Median Population Age in Lake County is 38.7 Years.
What is the Average Family Size in Lake County
Average Family Size in Lake County is 3.2 People.
What is the Average Household Size in Lake County
Average Household Size in Lake County is 2.7 People.
What is Per Capita Income in Lake County?
Per Capita income in Lake County is $53,677.
What is the Median Family Income in Lake County?
Median Family Income in Lake County is $126,685.
What is the Median Household income in Lake County?
Median Household Income in Lake County is $104,553.
What is Income or Wage Gap in Lake County?
Income or Wage Gap in Lake County is 30.0%.
Women in Lake County earn 70.0 cents for every dollar earned by a man.
What is Family Income Deficit in Lake County?
Family Income Deficit in Lake County is $10,883.
Families that are below poverty line in Lake County earn $10,883 less on average than the poverty threshold level.
What is Inequality or Gini Index in Lake County?
Inequality or Gini Index in Lake County is 0.48.
How Large is the Labor Force in Lake County?
There are 387,239 People in the Labor Forcein in Lake County.
What is the Percentage of People in the Labor Force in Lake County?
68.3% of People are in the Labor Force in Lake County.
What is the Unemployment Rate in Lake County?
Unemployment Rate in Lake County is 5.0%.