Kankakee County, IL
Kankakee County Map
Kankakee County Overview
107,421
TOTAL POPULATION
53,263
MALE POPULATION
54,158
FEMALE POPULATION
98.35
MALES / 100 FEMALES
101.68
FEMALES / 100 MALES
38.9
MEDIAN AGE
3.1
AVG FAMILY SIZE
2.5
AVG HOUSEHOLD SIZE
$32,941
PER CAPITA INCOME
$83,359
AVG FAMILY INCOME
$65,489
AVG HOUSEHOLD INCOME
32.6%
WAGE / INCOME GAP [ % ]
67.4¢/ $1
WAGE / INCOME GAP [ $ ]
$11,844
FAMILY INCOME DEFICIT
0.44
INEQUALITY / GINI INDEX
52,818
LABOR FORCE [ PEOPLE ]
61.4%
PERCENT IN LABOR FORCE
5.2%
UNEMPLOYMENT RATE
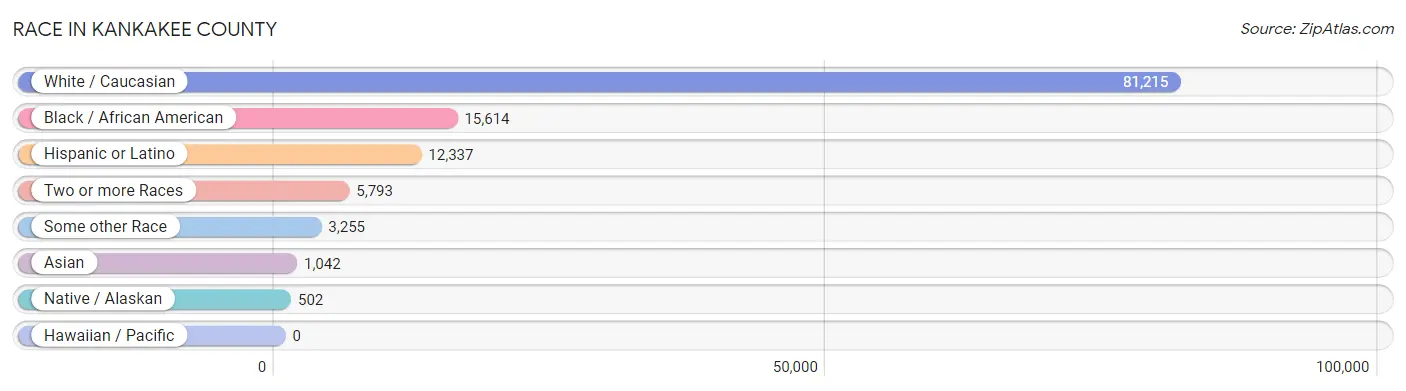
Race in Kankakee County
The most populous races in Kankakee County are White / Caucasian (81,215 | 75.6%), Black / African American (15,614 | 14.5%), and Hispanic or Latino (12,337 | 11.5%).
| Race | # Population | % Population |
| Asian | 1,042 | 1.0% |
| Black / African American | 15,614 | 14.5% |
| Hawaiian / Pacific | 0 | 0.0% |
| Hispanic or Latino | 12,337 | 11.5% |
| Native / Alaskan | 502 | 0.5% |
| White / Caucasian | 81,215 | 75.6% |
| Two or more Races | 5,793 | 5.4% |
| Some other Race | 3,255 | 3.0% |
| Total | 107,421 | 100.0% |
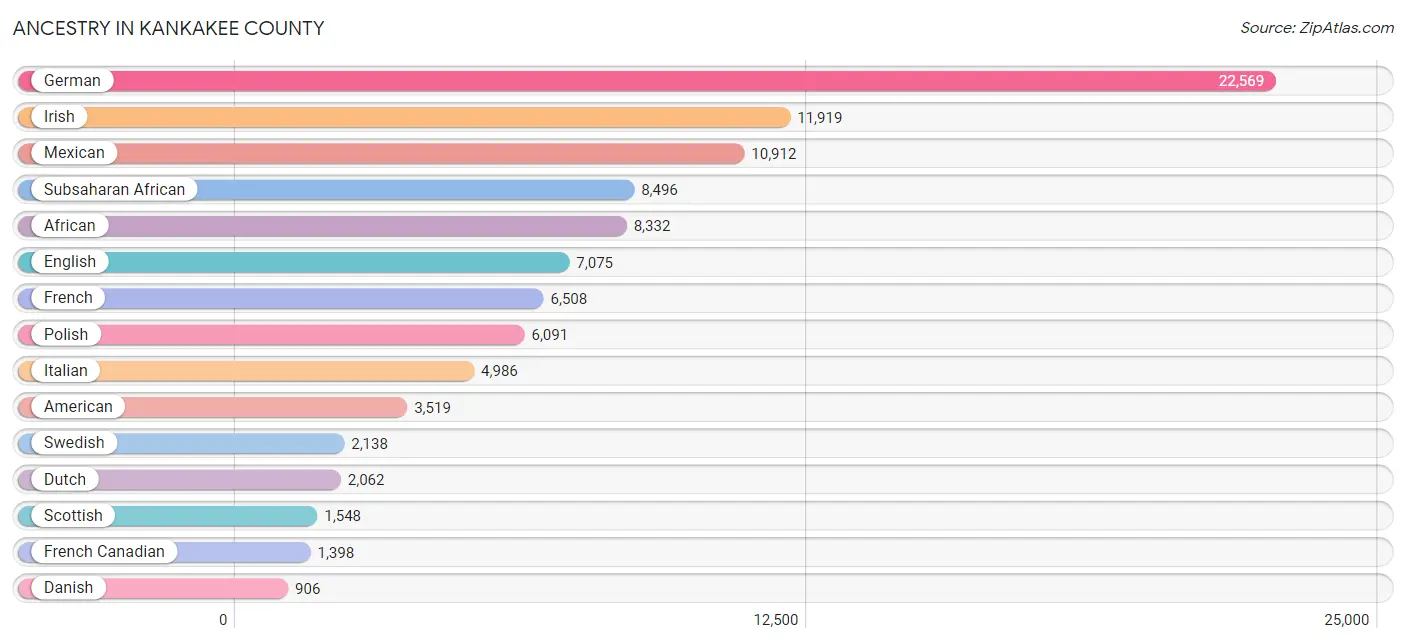
Ancestry in Kankakee County
The most populous ancestries reported in Kankakee County are German (22,569 | 21.0%), Irish (11,919 | 11.1%), Mexican (10,912 | 10.2%), Subsaharan African (8,496 | 7.9%), and African (8,332 | 7.8%), together accounting for 57.9% of all Kankakee County residents.
| Ancestry | # Population | % Population |
| African | 8,332 | 7.8% |
| Albanian | 6 | 0.0% |
| American | 3,519 | 3.3% |
| Apache | 57 | 0.1% |
| Arab | 95 | 0.1% |
| Armenian | 10 | 0.0% |
| Australian | 5 | 0.0% |
| Austrian | 224 | 0.2% |
| Bahamian | 19 | 0.0% |
| Belgian | 73 | 0.1% |
| Bhutanese | 47 | 0.0% |
| Blackfeet | 3 | 0.0% |
| Brazilian | 6 | 0.0% |
| British | 209 | 0.2% |
| Bulgarian | 72 | 0.1% |
| Burmese | 195 | 0.2% |
| Cambodian | 4 | 0.0% |
| Canadian | 96 | 0.1% |
| Celtic | 14 | 0.0% |
| Central American | 450 | 0.4% |
| Central American Indian | 66 | 0.1% |
| Cherokee | 116 | 0.1% |
| Chippewa | 28 | 0.0% |
| Choctaw | 20 | 0.0% |
| Colombian | 1 | 0.0% |
| Croatian | 186 | 0.2% |
| Cuban | 28 | 0.0% |
| Czech | 558 | 0.5% |
| Czechoslovakian | 74 | 0.1% |
| Danish | 906 | 0.8% |
| Delaware | 10 | 0.0% |
| Dominican | 38 | 0.0% |
| Dutch | 2,062 | 1.9% |
| Eastern European | 205 | 0.2% |
| Ecuadorian | 18 | 0.0% |
| English | 7,075 | 6.6% |
| European | 556 | 0.5% |
| Finnish | 60 | 0.1% |
| French | 6,508 | 6.1% |
| French American Indian | 32 | 0.0% |
| French Canadian | 1,398 | 1.3% |
| German | 22,569 | 21.0% |
| Ghanaian | 5 | 0.0% |
| Greek | 220 | 0.2% |
| Guatemalan | 39 | 0.0% |
| Haitian | 57 | 0.1% |
| Honduran | 94 | 0.1% |
| Hungarian | 234 | 0.2% |
| Indian (Asian) | 165 | 0.2% |
| Irish | 11,919 | 11.1% |
| Iroquois | 32 | 0.0% |
| Israeli | 45 | 0.0% |
| Italian | 4,986 | 4.6% |
| Jamaican | 79 | 0.1% |
| Japanese | 46 | 0.0% |
| Jordanian | 3 | 0.0% |
| Kenyan | 54 | 0.1% |
| Korean | 528 | 0.5% |
| Laotian | 35 | 0.0% |
| Lebanese | 16 | 0.0% |
| Lithuanian | 442 | 0.4% |
| Luxembourger | 6 | 0.0% |
| Mexican | 10,912 | 10.2% |
| Mexican American Indian | 427 | 0.4% |
| Native Hawaiian | 44 | 0.0% |
| Navajo | 4 | 0.0% |
| Nigerian | 38 | 0.0% |
| Northern European | 53 | 0.1% |
| Norwegian | 764 | 0.7% |
| Ottawa | 4 | 0.0% |
| Palestinian | 4 | 0.0% |
| Panamanian | 78 | 0.1% |
| Pennsylvania German | 1 | 0.0% |
| Polish | 6,091 | 5.7% |
| Portuguese | 77 | 0.1% |
| Puerto Rican | 514 | 0.5% |
| Romanian | 37 | 0.0% |
| Russian | 133 | 0.1% |
| Salvadoran | 239 | 0.2% |
| Scandinavian | 437 | 0.4% |
| Scotch-Irish | 572 | 0.5% |
| Scottish | 1,548 | 1.4% |
| Serbian | 38 | 0.0% |
| Slavic | 15 | 0.0% |
| Slovak | 143 | 0.1% |
| Slovene | 54 | 0.1% |
| South American | 177 | 0.2% |
| Spaniard | 48 | 0.0% |
| Spanish | 50 | 0.1% |
| Sri Lankan | 42 | 0.0% |
| Subsaharan African | 8,496 | 7.9% |
| Swedish | 2,138 | 2.0% |
| Swiss | 328 | 0.3% |
| Thai | 435 | 0.4% |
| Ukrainian | 46 | 0.0% |
| Venezuelan | 158 | 0.2% |
| Welsh | 434 | 0.4% |
| Yugoslavian | 17 | 0.0% | View All 98 Rows |
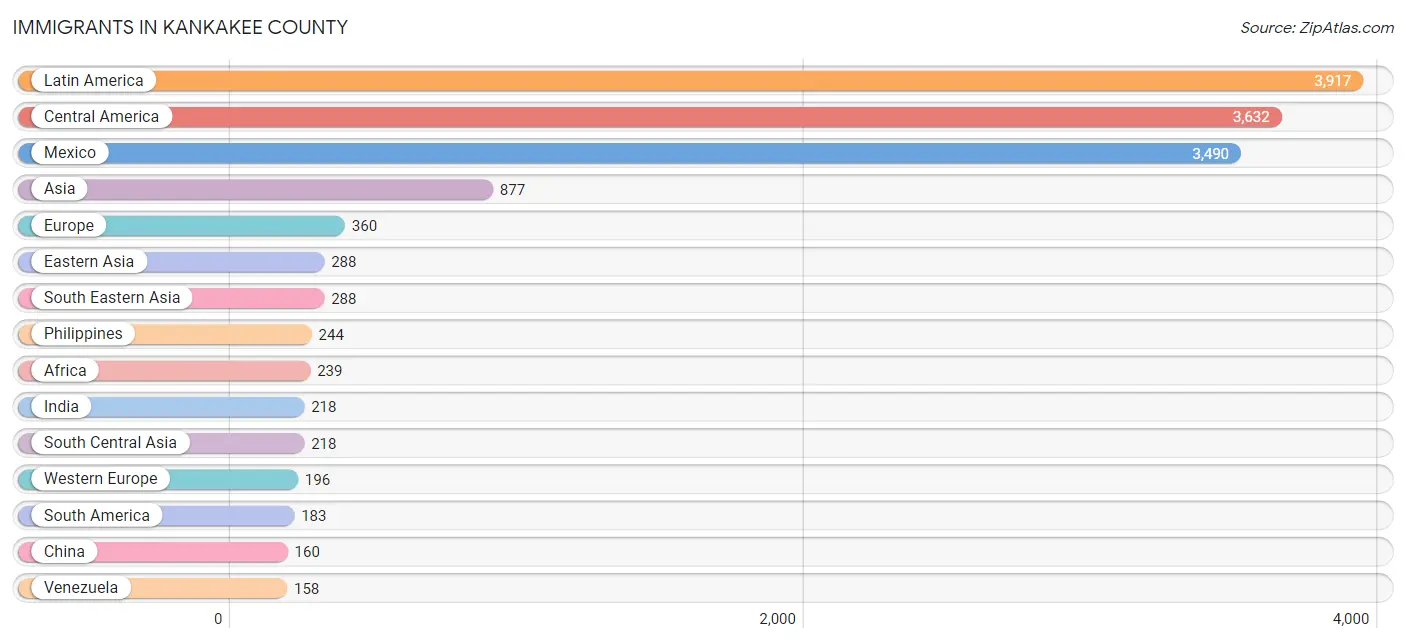
Immigrants in Kankakee County
The most numerous immigrant groups reported in Kankakee County came from Latin America (3,917 | 3.6%), Central America (3,632 | 3.4%), Mexico (3,490 | 3.3%), Asia (877 | 0.8%), and Europe (360 | 0.3%), together accounting for 11.4% of all Kankakee County residents.
| Immigration Origin | # Population | % Population |
| Africa | 239 | 0.2% |
| Asia | 877 | 0.8% |
| Australia | 5 | 0.0% |
| Austria | 31 | 0.0% |
| Bahamas | 12 | 0.0% |
| Bosnia and Herzegovina | 2 | 0.0% |
| Brazil | 11 | 0.0% |
| Bulgaria | 17 | 0.0% |
| Cambodia | 6 | 0.0% |
| Cameroon | 62 | 0.1% |
| Canada | 80 | 0.1% |
| Caribbean | 102 | 0.1% |
| Central America | 3,632 | 3.4% |
| China | 160 | 0.2% |
| Colombia | 1 | 0.0% |
| Cuba | 8 | 0.0% |
| Dominican Republic | 35 | 0.0% |
| Eastern Africa | 39 | 0.0% |
| Eastern Asia | 288 | 0.3% |
| Eastern Europe | 88 | 0.1% |
| Ecuador | 13 | 0.0% |
| El Salvador | 16 | 0.0% |
| England | 61 | 0.1% |
| Europe | 360 | 0.3% |
| France | 6 | 0.0% |
| Germany | 134 | 0.1% |
| Ghana | 13 | 0.0% |
| Guatemala | 18 | 0.0% |
| Haiti | 11 | 0.0% |
| Honduras | 30 | 0.0% |
| India | 218 | 0.2% |
| Indonesia | 22 | 0.0% |
| Italy | 4 | 0.0% |
| Jamaica | 36 | 0.0% |
| Jordan | 1 | 0.0% |
| Kenya | 38 | 0.0% |
| Korea | 128 | 0.1% |
| Latin America | 3,917 | 3.6% |
| Lebanon | 10 | 0.0% |
| Lithuania | 9 | 0.0% |
| Mexico | 3,490 | 3.3% |
| Middle Africa | 77 | 0.1% |
| Netherlands | 20 | 0.0% |
| Nigeria | 110 | 0.1% |
| Northern Europe | 69 | 0.1% |
| Oceania | 5 | 0.0% |
| Panama | 78 | 0.1% |
| Philippines | 244 | 0.2% |
| Poland | 22 | 0.0% |
| Russia | 38 | 0.0% |
| South America | 183 | 0.2% |
| South Central Asia | 218 | 0.2% |
| South Eastern Asia | 288 | 0.3% |
| Southern Europe | 7 | 0.0% |
| Spain | 3 | 0.0% |
| Sweden | 8 | 0.0% |
| Switzerland | 5 | 0.0% |
| Syria | 54 | 0.1% |
| Taiwan | 13 | 0.0% |
| Turkey | 18 | 0.0% |
| Venezuela | 158 | 0.2% |
| Vietnam | 16 | 0.0% |
| Western Africa | 123 | 0.1% |
| Western Asia | 83 | 0.1% |
| Western Europe | 196 | 0.2% |
| Zaire | 15 | 0.0% | View All 66 Rows |
Sex and Age in Kankakee County
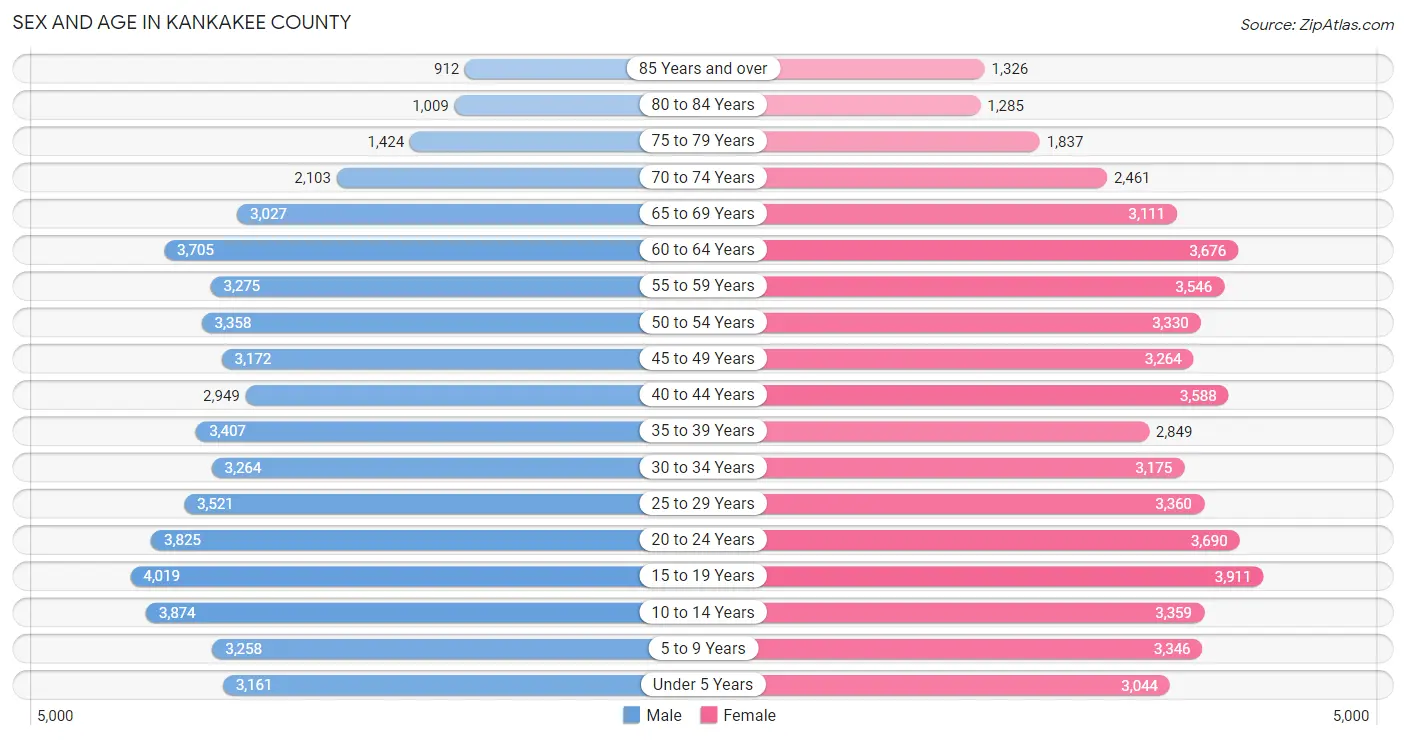
Sex and Age in Kankakee County
The most populous age groups in Kankakee County are 15 to 19 Years (4,019 | 7.5%) for men and 15 to 19 Years (3,911 | 7.2%) for women.
| Age Bracket | Male | Female |
| Under 5 Years | 3,161 (5.9%) | 3,044 (5.6%) |
| 5 to 9 Years | 3,258 (6.1%) | 3,346 (6.2%) |
| 10 to 14 Years | 3,874 (7.3%) | 3,359 (6.2%) |
| 15 to 19 Years | 4,019 (7.5%) | 3,911 (7.2%) |
| 20 to 24 Years | 3,825 (7.2%) | 3,690 (6.8%) |
| 25 to 29 Years | 3,521 (6.6%) | 3,360 (6.2%) |
| 30 to 34 Years | 3,264 (6.1%) | 3,175 (5.9%) |
| 35 to 39 Years | 3,407 (6.4%) | 2,849 (5.3%) |
| 40 to 44 Years | 2,949 (5.5%) | 3,588 (6.6%) |
| 45 to 49 Years | 3,172 (6.0%) | 3,264 (6.0%) |
| 50 to 54 Years | 3,358 (6.3%) | 3,330 (6.1%) |
| 55 to 59 Years | 3,275 (6.1%) | 3,546 (6.6%) |
| 60 to 64 Years | 3,705 (7.0%) | 3,676 (6.8%) |
| 65 to 69 Years | 3,027 (5.7%) | 3,111 (5.7%) |
| 70 to 74 Years | 2,103 (4.0%) | 2,461 (4.5%) |
| 75 to 79 Years | 1,424 (2.7%) | 1,837 (3.4%) |
| 80 to 84 Years | 1,009 (1.9%) | 1,285 (2.4%) |
| 85 Years and over | 912 (1.7%) | 1,326 (2.5%) |
| Total | 53,263 (100.0%) | 54,158 (100.0%) |
Families and Households in Kankakee County
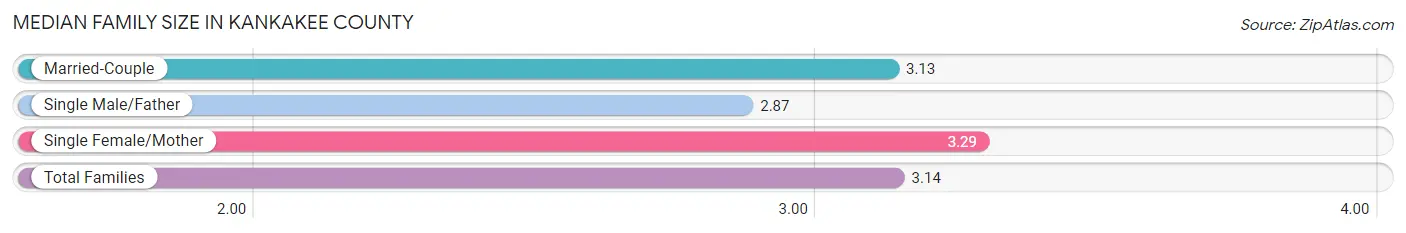
Median Family Size in Kankakee County
The median family size in Kankakee County is 3.14 persons per family, with single female/mother families (5,158 | 19.7%) accounting for the largest median family size of 3.29 persons per family. On the other hand, single male/father families (2,300 | 8.8%) represent the smallest median family size with 2.87 persons per family.
| Family Type | # Families | Family Size |
| Married-Couple | 18,706 (71.5%) | 3.13 |
| Single Male/Father | 2,300 (8.8%) | 2.87 |
| Single Female/Mother | 5,158 (19.7%) | 3.29 |
| Total Families | 26,164 (100.0%) | 3.14 |
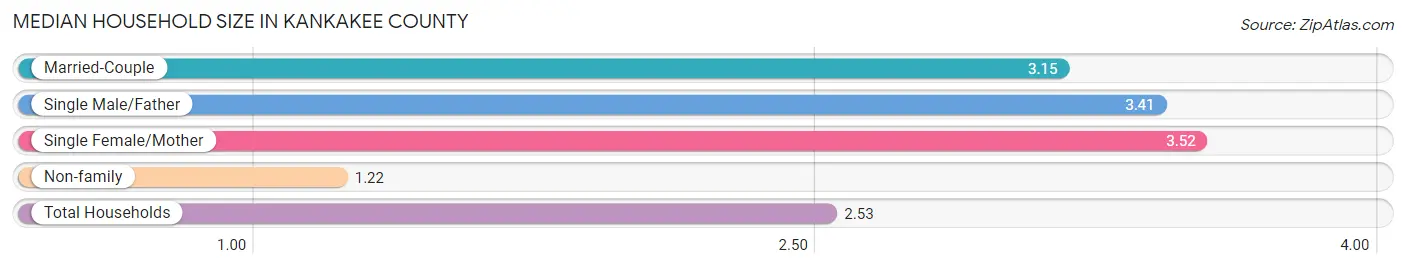
Median Household Size in Kankakee County
The median household size in Kankakee County is 2.53 persons per household, with single female/mother households (5,158 | 12.7%) accounting for the largest median household size of 3.52 persons per household. non-family households (14,427 | 35.5%) represent the smallest median household size with 1.22 persons per household.
| Household Type | # Households | Household Size |
| Married-Couple | 18,706 (46.1%) | 3.15 |
| Single Male/Father | 2,300 (5.7%) | 3.41 |
| Single Female/Mother | 5,158 (12.7%) | 3.52 |
| Non-family | 14,427 (35.5%) | 1.22 |
| Total Households | 40,591 (100.0%) | 2.53 |
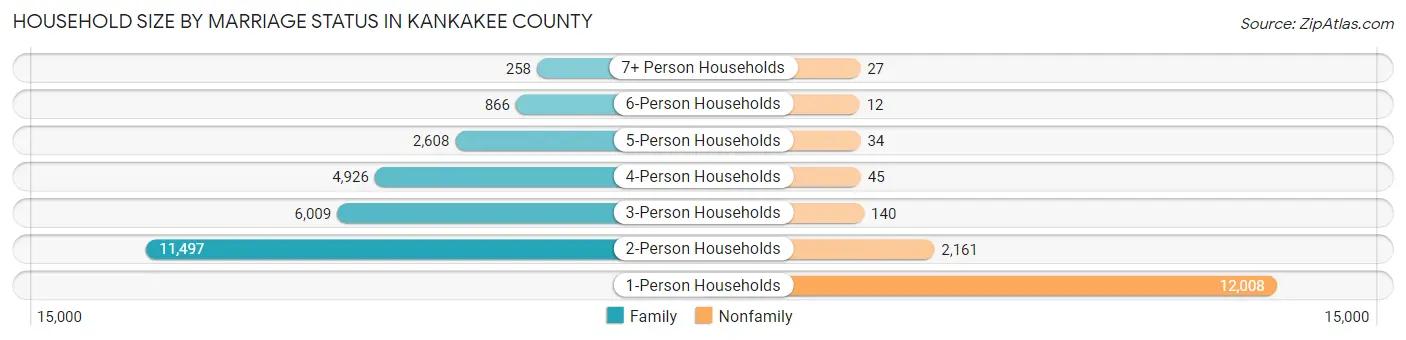
Household Size by Marriage Status in Kankakee County
Out of a total of 40,591 households in Kankakee County, 26,164 (64.5%) are family households, while 14,427 (35.5%) are nonfamily households. The most numerous type of family households are 2-person households, comprising 11,497, and the most common type of nonfamily households are 1-person households, comprising 12,008.
| Household Size | Family Households | Nonfamily Households |
| 1-Person Households | - | 12,008 (29.6%) |
| 2-Person Households | 11,497 (28.3%) | 2,161 (5.3%) |
| 3-Person Households | 6,009 (14.8%) | 140 (0.3%) |
| 4-Person Households | 4,926 (12.1%) | 45 (0.1%) |
| 5-Person Households | 2,608 (6.4%) | 34 (0.1%) |
| 6-Person Households | 866 (2.1%) | 12 (0.0%) |
| 7+ Person Households | 258 (0.6%) | 27 (0.1%) |
| Total | 26,164 (64.5%) | 14,427 (35.5%) |
Female Fertility in Kankakee County
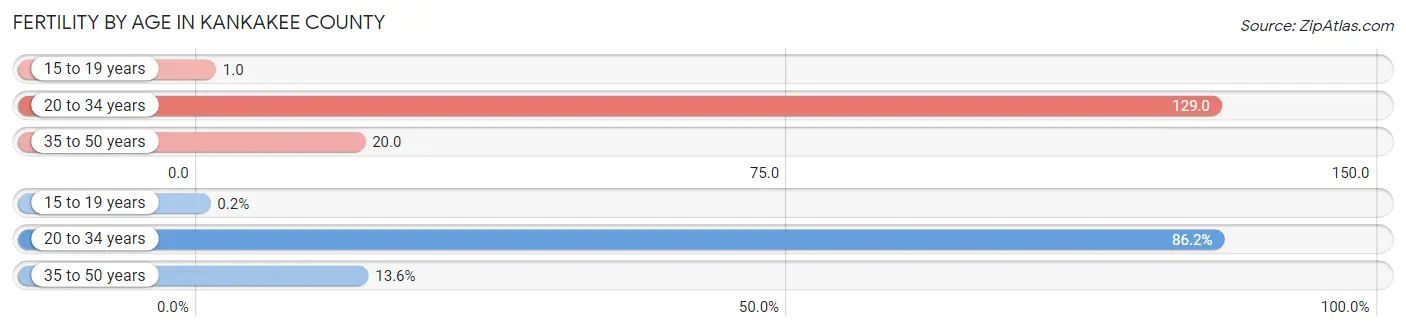
Fertility by Age in Kankakee County
Average fertility rate in Kankakee County is 62.0 births per 1,000 women. Women in the age bracket of 20 to 34 years have the highest fertility rate with 129.0 births per 1,000 women. Women in the age bracket of 20 to 34 years acount for 86.2% of all women with births.
| Age Bracket | Women with Births | Births / 1,000 Women |
| 15 to 19 years | 3 (0.2%) | 1.0 |
| 20 to 34 years | 1,318 (86.2%) | 129.0 |
| 35 to 50 years | 208 (13.6%) | 20.0 |
| Total | 1,529 (100.0%) | 62.0 |
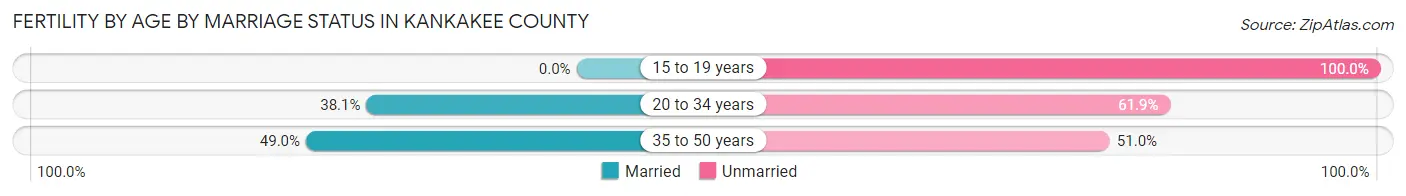
Fertility by Age by Marriage Status in Kankakee County
39.5% of women with births (1,529) in Kankakee County are married. The highest percentage of unmarried women with births falls into 15 to 19 years age bracket with 100.0% of them unmarried at the time of birth, while the lowest percentage of unmarried women with births belong to 35 to 50 years age bracket with 51.0% of them unmarried.
| Age Bracket | Married | Unmarried |
| 15 to 19 years | 0 (0.0%) | 3 (100.0%) |
| 20 to 34 years | 502 (38.1%) | 816 (61.9%) |
| 35 to 50 years | 102 (49.0%) | 106 (51.0%) |
| Total | 604 (39.5%) | 925 (60.5%) |
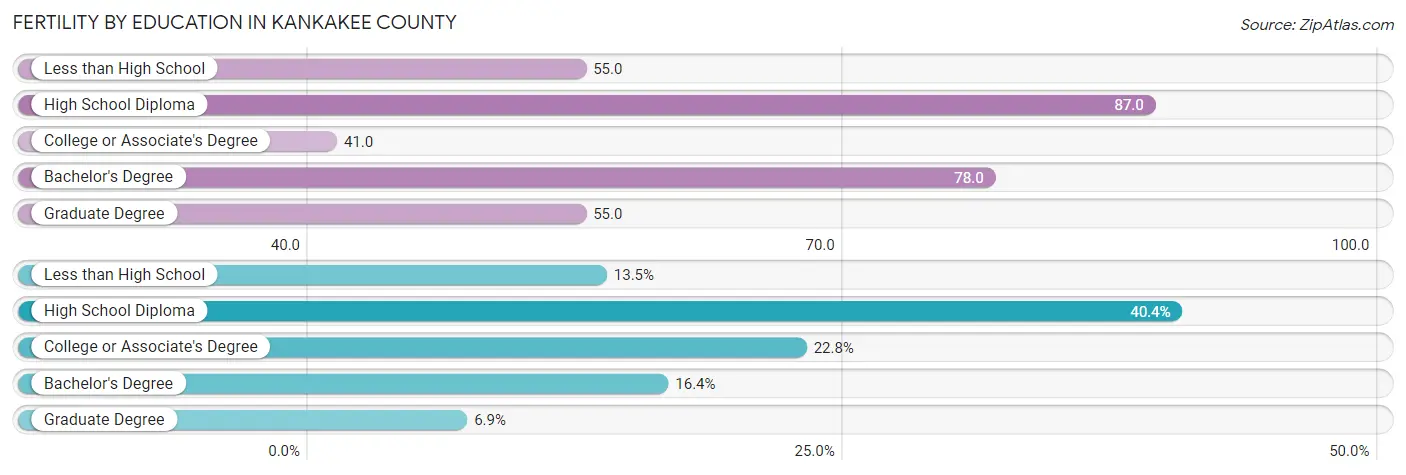
Fertility by Education in Kankakee County
Average fertility rate in Kankakee County is 62.0 births per 1,000 women. Women with the education attainment of high school diploma have the highest fertility rate of 87.0 births per 1,000 women, while women with the education attainment of college or associate's degree have the lowest fertility at 41.0 births per 1,000 women. Women with the education attainment of high school diploma represent 40.4% of all women with births.
| Educational Attainment | Women with Births | Births / 1,000 Women |
| Less than High School | 206 (13.5%) | 55.0 |
| High School Diploma | 618 (40.4%) | 87.0 |
| College or Associate's Degree | 349 (22.8%) | 41.0 |
| Bachelor's Degree | 250 (16.4%) | 78.0 |
| Graduate Degree | 106 (6.9%) | 55.0 |
| Total | 1,529 (100.0%) | 62.0 |
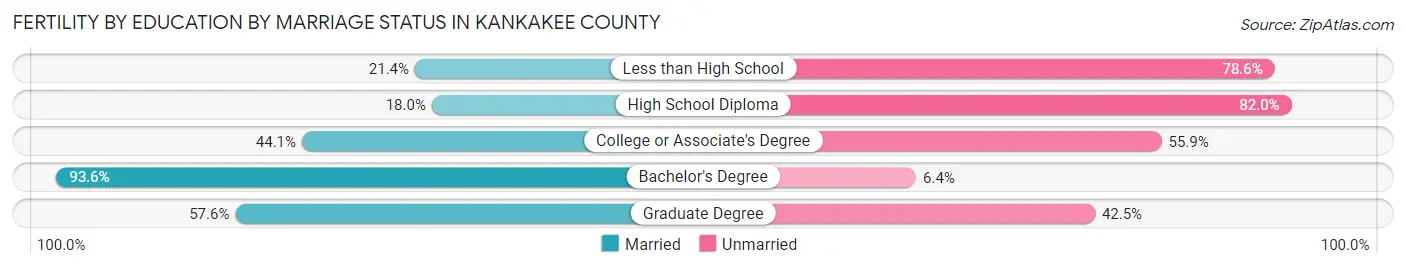
Fertility by Education by Marriage Status in Kankakee County
60.5% of women with births in Kankakee County are unmarried. Women with the educational attainment of bachelor's degree are most likely to be married with 93.6% of them married at childbirth, while women with the educational attainment of high school diploma are least likely to be married with 82.0% of them unmarried at childbirth.
| Educational Attainment | Married | Unmarried |
| Less than High School | 44 (21.4%) | 162 (78.6%) |
| High School Diploma | 111 (18.0%) | 507 (82.0%) |
| College or Associate's Degree | 154 (44.1%) | 195 (55.9%) |
| Bachelor's Degree | 234 (93.6%) | 16 (6.4%) |
| Graduate Degree | 61 (57.6%) | 45 (42.4%) |
| Total | 604 (39.5%) | 925 (60.5%) |
Income in Kankakee County
Income Overview in Kankakee County
Per Capita Income in Kankakee County is $32,941, while median incomes of families and households are $83,359 and $65,489 respectively.
| Characteristic | Number | Measure |
| Per Capita Income | 107,421 | $32,941 |
| Median Family Income | 26,164 | $83,359 |
| Mean Family Income | 26,164 | $101,060 |
| Median Household Income | 40,591 | $65,489 |
| Mean Household Income | 40,591 | $85,018 |
| Income Deficit | 26,164 | $11,844 |
| Wage / Income Gap (%) | 107,421 | 32.56% |
| Wage / Income Gap ($) | 107,421 | 67.44¢ per $1 |
| Gini / Inequality Index | 107,421 | 0.44 |
Earnings by Sex in Kankakee County
Average Earnings in Kankakee County are $37,969, $46,997 for men and $31,697 for women, a difference of 32.6%.
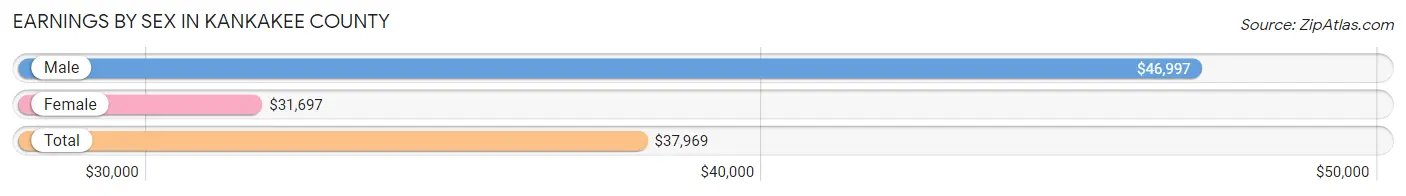
| Sex | Number | Average Earnings |
| Male | 28,218 (51.3%) | $46,997 |
| Female | 26,810 (48.7%) | $31,697 |
| Total | 55,028 (100.0%) | $37,969 |
Earnings by Sex by Income Bracket in Kankakee County
The most common earnings brackets in Kankakee County are $100,000+ for men (4,521 | 16.0%) and $75,000 to $99,999 for women (2,303 | 8.6%).
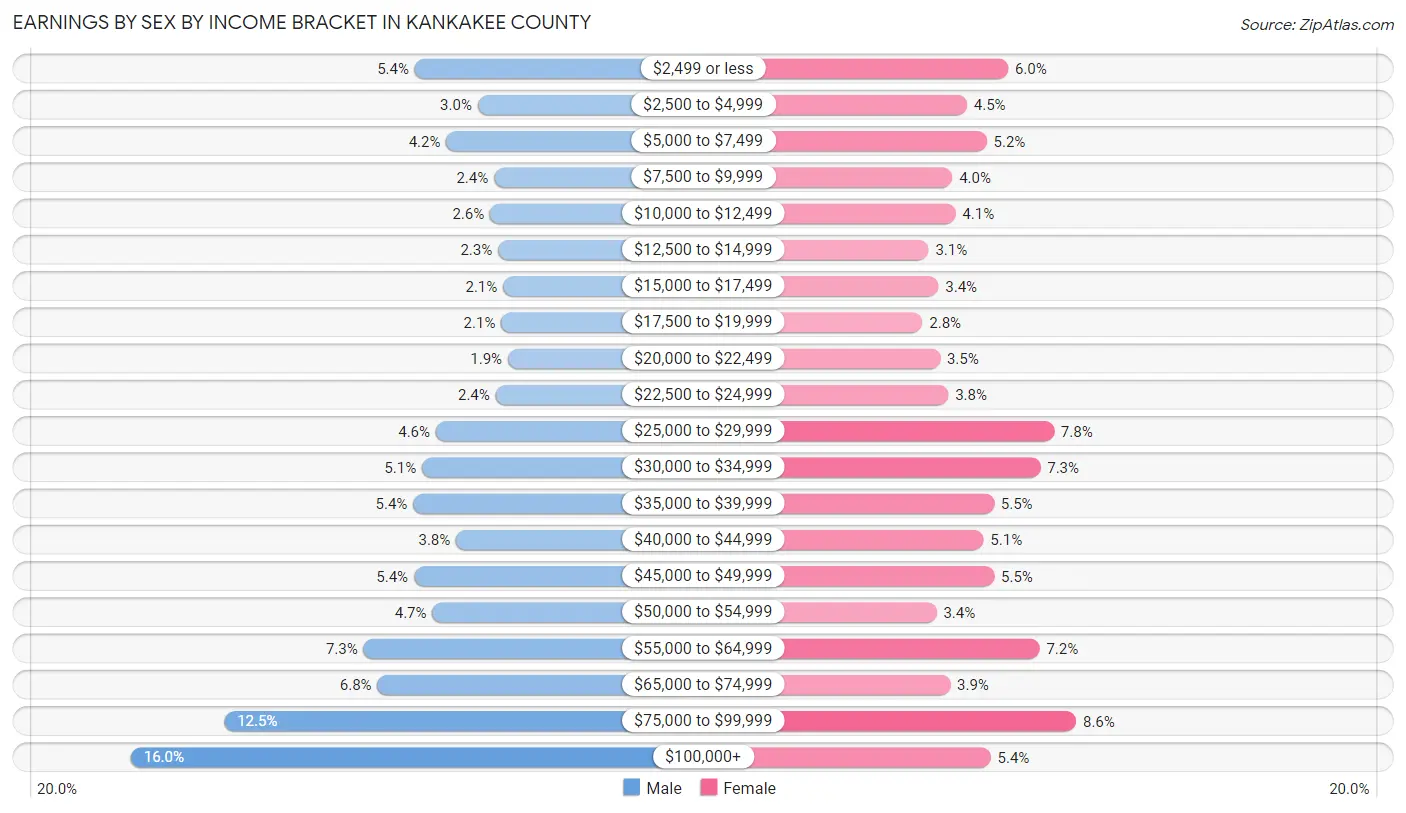
| Income | Male | Female |
| $2,499 or less | 1,519 (5.4%) | 1,620 (6.0%) |
| $2,500 to $4,999 | 851 (3.0%) | 1,207 (4.5%) |
| $5,000 to $7,499 | 1,184 (4.2%) | 1,405 (5.2%) |
| $7,500 to $9,999 | 680 (2.4%) | 1,059 (4.0%) |
| $10,000 to $12,499 | 721 (2.6%) | 1,090 (4.1%) |
| $12,500 to $14,999 | 639 (2.3%) | 820 (3.1%) |
| $15,000 to $17,499 | 583 (2.1%) | 919 (3.4%) |
| $17,500 to $19,999 | 605 (2.1%) | 758 (2.8%) |
| $20,000 to $22,499 | 534 (1.9%) | 935 (3.5%) |
| $22,500 to $24,999 | 662 (2.4%) | 1,019 (3.8%) |
| $25,000 to $29,999 | 1,296 (4.6%) | 2,081 (7.8%) |
| $30,000 to $34,999 | 1,441 (5.1%) | 1,945 (7.2%) |
| $35,000 to $39,999 | 1,534 (5.4%) | 1,476 (5.5%) |
| $40,000 to $44,999 | 1,081 (3.8%) | 1,374 (5.1%) |
| $45,000 to $49,999 | 1,528 (5.4%) | 1,479 (5.5%) |
| $50,000 to $54,999 | 1,332 (4.7%) | 901 (3.4%) |
| $55,000 to $64,999 | 2,061 (7.3%) | 1,936 (7.2%) |
| $65,000 to $74,999 | 1,913 (6.8%) | 1,038 (3.9%) |
| $75,000 to $99,999 | 3,533 (12.5%) | 2,303 (8.6%) |
| $100,000+ | 4,521 (16.0%) | 1,445 (5.4%) |
| Total | 28,218 (100.0%) | 26,810 (100.0%) |
Earnings by Sex by Educational Attainment in Kankakee County
Average earnings in Kankakee County are $55,730 for men and $37,516 for women, a difference of 32.7%. Men with an educational attainment of graduate degree enjoy the highest average annual earnings of $93,721, while those with less than high school education earn the least with $31,860. Women with an educational attainment of graduate degree earn the most with the average annual earnings of $72,398, while those with less than high school education have the smallest earnings of $20,268.
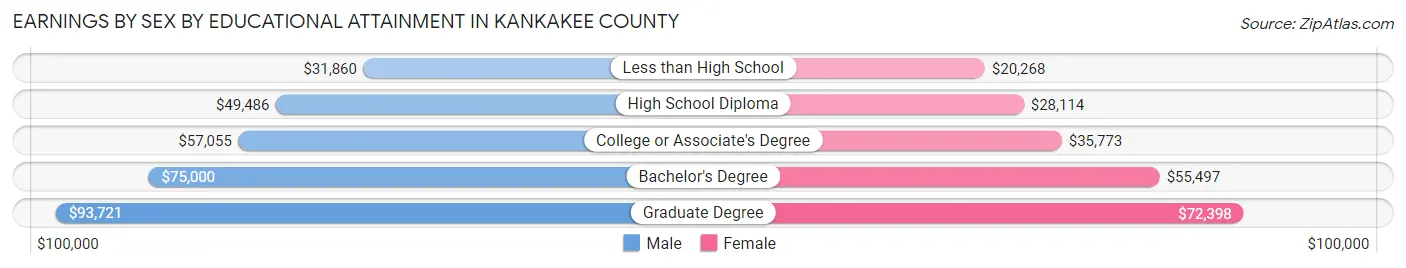
| Educational Attainment | Male Income | Female Income |
| Less than High School | $31,860 | $20,268 |
| High School Diploma | $49,486 | $28,114 |
| College or Associate's Degree | $57,055 | $35,773 |
| Bachelor's Degree | $75,000 | $55,497 |
| Graduate Degree | $93,721 | $72,398 |
| Total | $55,730 | $37,516 |
Family Income in Kankakee County
Family Income Brackets in Kankakee County
According to the Kankakee County family income data, there are 5,599 families falling into the $100,000 to $149,999 income range, which is the most common income bracket and makes up 21.4% of all families. Conversely, the $10,000 to $14,999 income bracket is the least frequent group with only 445 families (1.7%) belonging to this category.
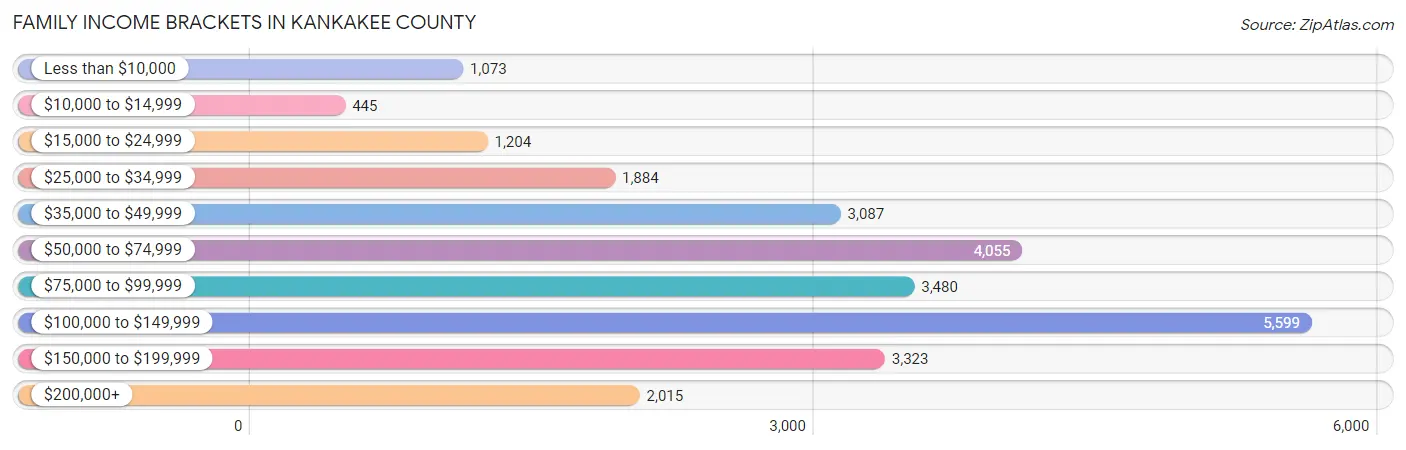
| Income Bracket | # Families | % Families |
| Less than $10,000 | 1,073 | 4.1% |
| $10,000 to $14,999 | 445 | 1.7% |
| $15,000 to $24,999 | 1,204 | 4.6% |
| $25,000 to $34,999 | 1,884 | 7.2% |
| $35,000 to $49,999 | 3,087 | 11.8% |
| $50,000 to $74,999 | 4,055 | 15.5% |
| $75,000 to $99,999 | 3,480 | 13.3% |
| $100,000 to $149,999 | 5,599 | 21.4% |
| $150,000 to $199,999 | 3,323 | 12.7% |
| $200,000+ | 2,015 | 7.7% |
Family Income by Famaliy Size in Kankakee County
5-person families (2,284 | 8.7%) account for the highest median family income in Kankakee County with $127,128 per family, while 2-person families (12,541 | 47.9%) have the highest median income of $36,144 per family member.
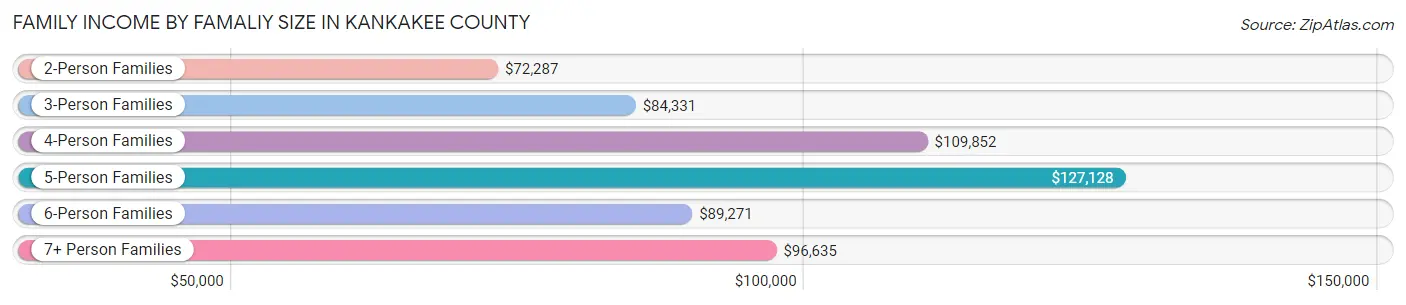
| Income Bracket | # Families | Median Income |
| 2-Person Families | 12,541 (47.9%) | $72,287 |
| 3-Person Families | 5,688 (21.7%) | $84,331 |
| 4-Person Families | 4,691 (17.9%) | $109,852 |
| 5-Person Families | 2,284 (8.7%) | $127,128 |
| 6-Person Families | 781 (3.0%) | $89,271 |
| 7+ Person Families | 179 (0.7%) | $96,635 |
| Total | 26,164 (100.0%) | $83,359 |
Family Income by Number of Earners in Kankakee County
The median family income in Kankakee County is $83,359, with families comprising 3+ earners (3,462) having the highest median family income of $140,881, while families with 1 earner (8,370) have the lowest median family income of $49,245, accounting for 13.2% and 32.0% of families, respectively.
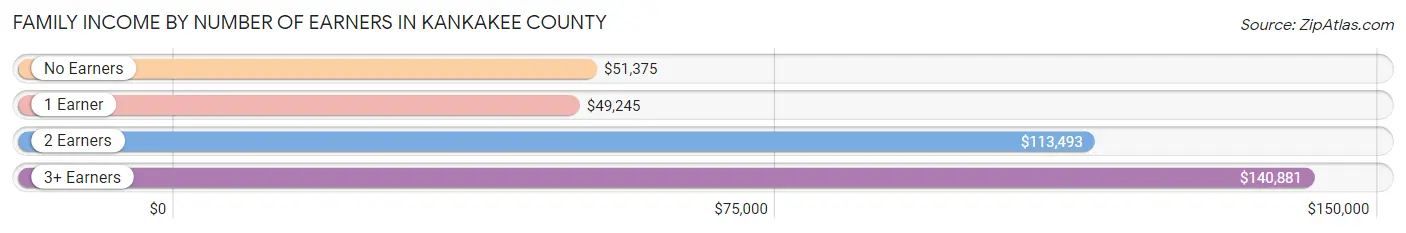
| Number of Earners | # Families | Median Income |
| No Earners | 4,264 (16.3%) | $51,375 |
| 1 Earner | 8,370 (32.0%) | $49,245 |
| 2 Earners | 10,068 (38.5%) | $113,493 |
| 3+ Earners | 3,462 (13.2%) | $140,881 |
| Total | 26,164 (100.0%) | $83,359 |
Household Income in Kankakee County
Household Income Brackets in Kankakee County
With 7,225 households falling in the category, the $100,000 to $149,999 income range is the most frequent in Kankakee County, accounting for 17.8% of all households. In contrast, only 1,542 households (3.8%) fall into the $10,000 to $14,999 income bracket, making it the least populous group.
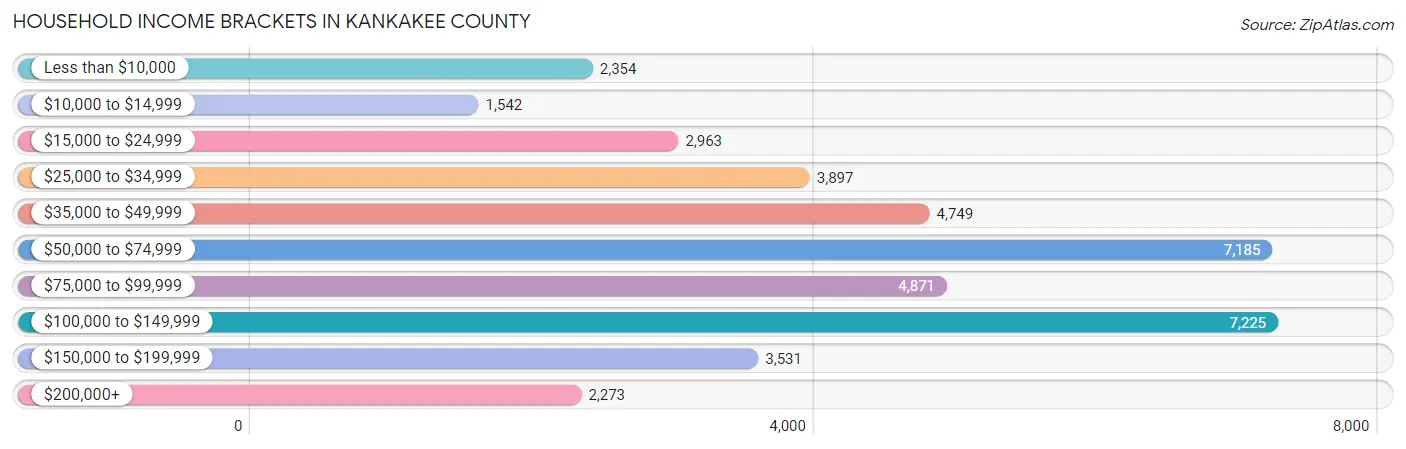
| Income Bracket | # Households | % Households |
| Less than $10,000 | 2,354 | 5.8% |
| $10,000 to $14,999 | 1,542 | 3.8% |
| $15,000 to $24,999 | 2,963 | 7.3% |
| $25,000 to $34,999 | 3,897 | 9.6% |
| $35,000 to $49,999 | 4,749 | 11.7% |
| $50,000 to $74,999 | 7,185 | 17.7% |
| $75,000 to $99,999 | 4,871 | 12.0% |
| $100,000 to $149,999 | 7,225 | 17.8% |
| $150,000 to $199,999 | 3,531 | 8.7% |
| $200,000+ | 2,273 | 5.6% |
Household Income by Householder Age in Kankakee County
The median household income in Kankakee County is $65,489, with the highest median household income of $78,972 found in the 45 to 64 years age bracket for the primary householder. A total of 15,583 households (38.4%) fall into this category. Meanwhile, the 65+ years age bracket for the primary householder has the lowest median household income of $46,846, with 11,267 households (27.8%) in this group.
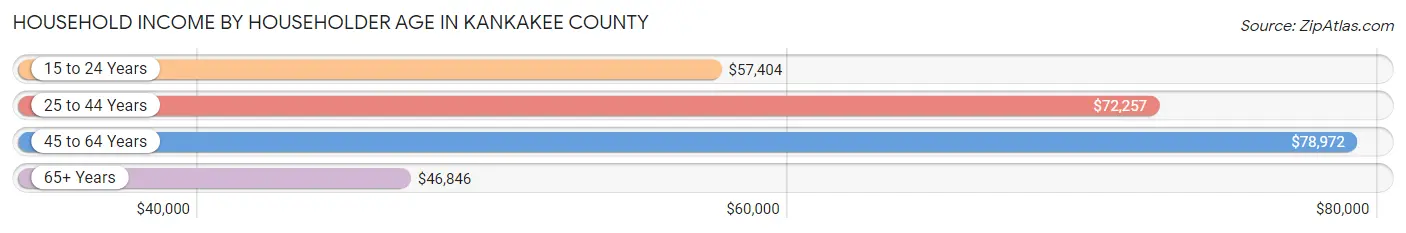
| Income Bracket | # Households | Median Income |
| 15 to 24 Years | 1,081 (2.7%) | $57,404 |
| 25 to 44 Years | 12,660 (31.2%) | $72,257 |
| 45 to 64 Years | 15,583 (38.4%) | $78,972 |
| 65+ Years | 11,267 (27.8%) | $46,846 |
| Total | 40,591 (100.0%) | $65,489 |
Poverty in Kankakee County
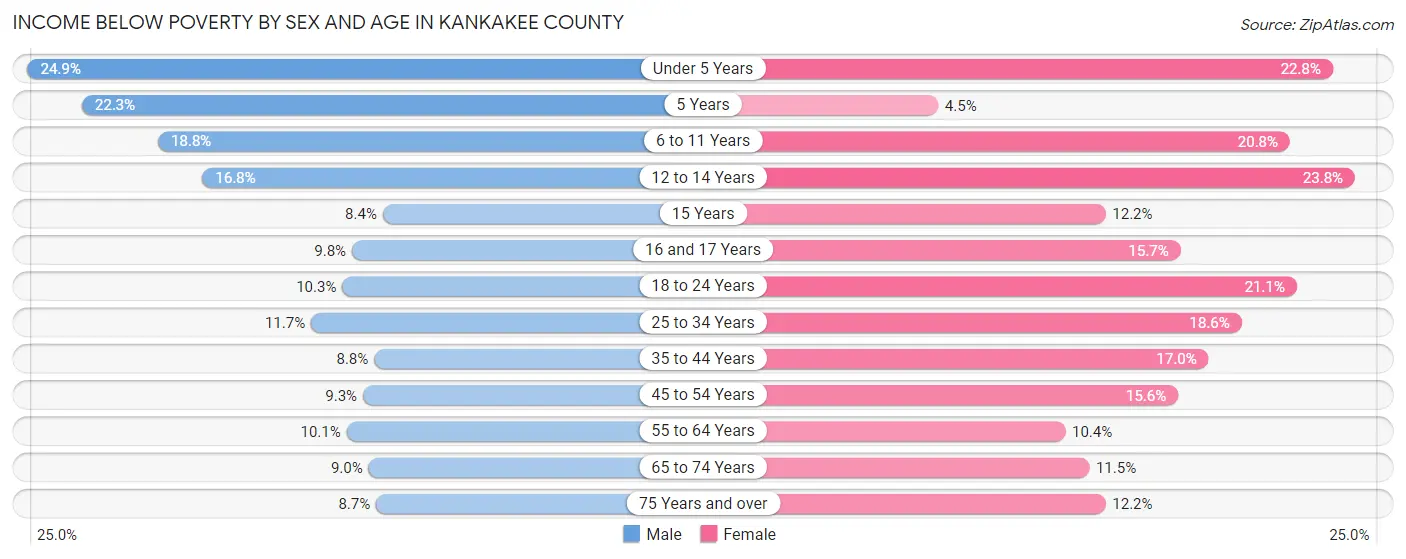
Income Below Poverty by Sex and Age in Kankakee County
With 11.8% poverty level for males and 16.2% for females among the residents of Kankakee County, under 5 year old males and 12 to 14 year old females are the most vulnerable to poverty, with 740 males (24.9%) and 539 females (23.8%) in their respective age groups living below the poverty level.
| Age Bracket | Male | Female |
| Under 5 Years | 740 (24.9%) | 689 (22.8%) |
| 5 Years | 151 (22.3%) | 17 (4.5%) |
| 6 to 11 Years | 742 (18.8%) | 803 (20.8%) |
| 12 to 14 Years | 398 (16.8%) | 539 (23.8%) |
| 15 Years | 60 (8.4%) | 73 (12.2%) |
| 16 and 17 Years | 151 (9.8%) | 260 (15.7%) |
| 18 to 24 Years | 473 (10.3%) | 875 (21.1%) |
| 25 to 34 Years | 769 (11.7%) | 1,208 (18.5%) |
| 35 to 44 Years | 548 (8.8%) | 1,091 (17.0%) |
| 45 to 54 Years | 596 (9.3%) | 1,026 (15.6%) |
| 55 to 64 Years | 692 (10.1%) | 736 (10.4%) |
| 65 to 74 Years | 458 (9.0%) | 626 (11.5%) |
| 75 Years and over | 266 (8.7%) | 533 (12.2%) |
| Total | 6,044 (11.8%) | 8,476 (16.2%) |
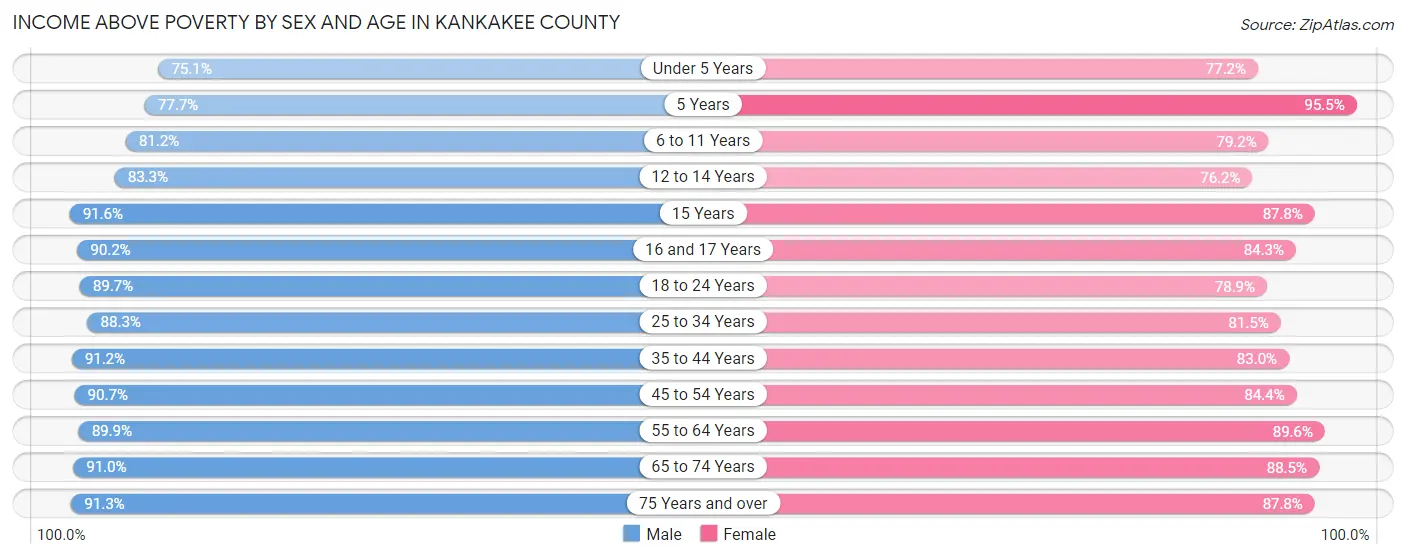
Income Above Poverty by Sex and Age in Kankakee County
According to the poverty statistics in Kankakee County, males aged 15 years and females aged 5 years are the age groups that are most secure financially, with 91.6% of males and 95.5% of females in these age groups living above the poverty line.
| Age Bracket | Male | Female |
| Under 5 Years | 2,237 (75.1%) | 2,335 (77.2%) |
| 5 Years | 525 (77.7%) | 364 (95.5%) |
| 6 to 11 Years | 3,203 (81.2%) | 3,059 (79.2%) |
| 12 to 14 Years | 1,978 (83.3%) | 1,725 (76.2%) |
| 15 Years | 656 (91.6%) | 524 (87.8%) |
| 16 and 17 Years | 1,389 (90.2%) | 1,394 (84.3%) |
| 18 to 24 Years | 4,135 (89.7%) | 3,270 (78.9%) |
| 25 to 34 Years | 5,800 (88.3%) | 5,305 (81.5%) |
| 35 to 44 Years | 5,693 (91.2%) | 5,320 (83.0%) |
| 45 to 54 Years | 5,812 (90.7%) | 5,553 (84.4%) |
| 55 to 64 Years | 6,186 (89.9%) | 6,366 (89.6%) |
| 65 to 74 Years | 4,606 (91.0%) | 4,834 (88.5%) |
| 75 Years and over | 2,795 (91.3%) | 3,824 (87.8%) |
| Total | 45,015 (88.2%) | 43,873 (83.8%) |
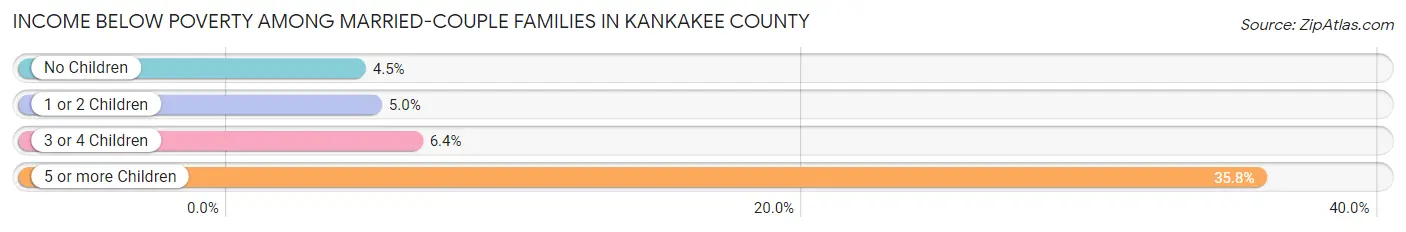
Income Below Poverty Among Married-Couple Families in Kankakee County
The poverty statistics for married-couple families in Kankakee County show that 4.9% or 918 of the total 18,706 families live below the poverty line. Families with 5 or more children have the highest poverty rate of 35.8%, comprising of 29 families. On the other hand, families with no children have the lowest poverty rate of 4.4%, which includes 529 families.
| Children | Above Poverty | Below Poverty |
| No Children | 11,364 (95.6%) | 529 (4.4%) |
| 1 or 2 Children | 4,873 (95.0%) | 257 (5.0%) |
| 3 or 4 Children | 1,499 (93.6%) | 103 (6.4%) |
| 5 or more Children | 52 (64.2%) | 29 (35.8%) |
| Total | 17,788 (95.1%) | 918 (4.9%) |
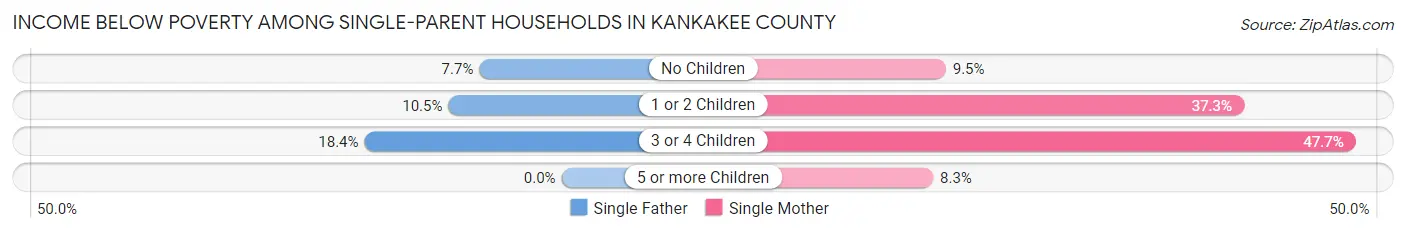
Income Below Poverty Among Single-Parent Households in Kankakee County
According to the poverty data in Kankakee County, 10.3% or 236 single-father households and 28.3% or 1,462 single-mother households are living below the poverty line. Among single-father households, those with 3 or 4 children have the highest poverty rate, with 47 households (18.4%) experiencing poverty. Likewise, among single-mother households, those with 3 or 4 children have the highest poverty rate, with 358 households (47.7%) falling below the poverty line.
| Children | Single Father | Single Mother |
| No Children | 69 (7.7%) | 182 (9.5%) |
| 1 or 2 Children | 120 (10.5%) | 920 (37.3%) |
| 3 or 4 Children | 47 (18.4%) | 358 (47.7%) |
| 5 or more Children | 0 (0.0%) | 2 (8.3%) |
| Total | 236 (10.3%) | 1,462 (28.3%) |
Income Below Poverty Among Married-Couple vs Single-Parent Households in Kankakee County
The poverty data for Kankakee County shows that 918 of the married-couple family households (4.9%) and 1,698 of the single-parent households (22.8%) are living below the poverty level. Within the married-couple family households, those with 5 or more children have the highest poverty rate, with 29 households (35.8%) falling below the poverty line. Among the single-parent households, those with 3 or 4 children have the highest poverty rate, with 405 household (40.2%) living below poverty.
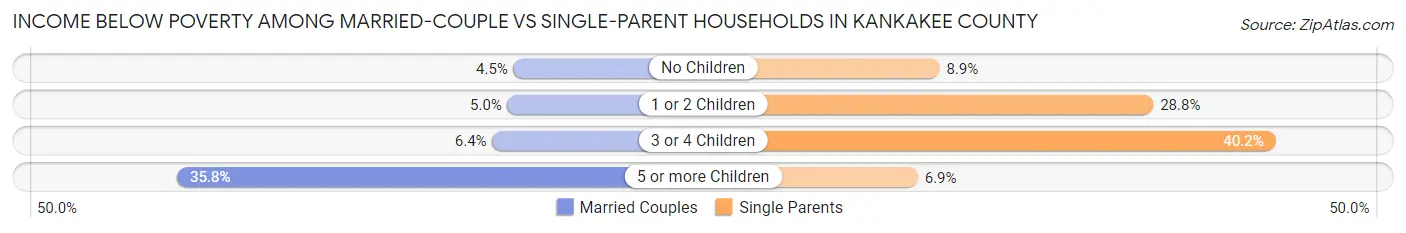
| Children | Married-Couple Families | Single-Parent Households |
| No Children | 529 (4.4%) | 251 (8.9%) |
| 1 or 2 Children | 257 (5.0%) | 1,040 (28.8%) |
| 3 or 4 Children | 103 (6.4%) | 405 (40.2%) |
| 5 or more Children | 29 (35.8%) | 2 (6.9%) |
| Total | 918 (4.9%) | 1,698 (22.8%) |
Employment Characteristics in Kankakee County
Employment by Class of Employer in Kankakee County
Among the 49,040 employed individuals in Kankakee County, private company employees (34,383 | 70.1%), not-for-profit organizations (4,815 | 9.8%), and local government employees (3,828 | 7.8%) make up the most common classes of employment.
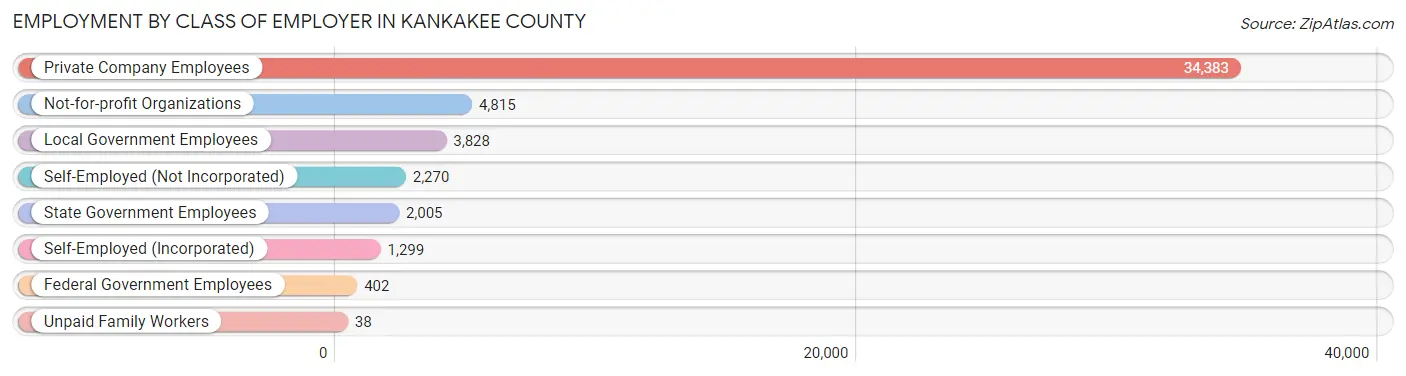
| Employer Class | # Employees | % Employees |
| Private Company Employees | 34,383 | 70.1% |
| Self-Employed (Incorporated) | 1,299 | 2.6% |
| Self-Employed (Not Incorporated) | 2,270 | 4.6% |
| Not-for-profit Organizations | 4,815 | 9.8% |
| Local Government Employees | 3,828 | 7.8% |
| State Government Employees | 2,005 | 4.1% |
| Federal Government Employees | 402 | 0.8% |
| Unpaid Family Workers | 38 | 0.1% |
| Total | 49,040 | 100.0% |
Employment Status by Age in Kankakee County
According to the labor force statistics for Kankakee County, out of the total population over 16 years of age (86,023), 61.4% or 52,818 individuals are in the labor force, with 5.2% or 2,747 of them unemployed. The age group with the highest labor force participation rate is 35 to 44 years, with 84.1% or 10,759 individuals in the labor force. Within the labor force, the 16 to 19 years age range has the highest percentage of unemployed individuals, with 18.1% or 537 of them being unemployed.
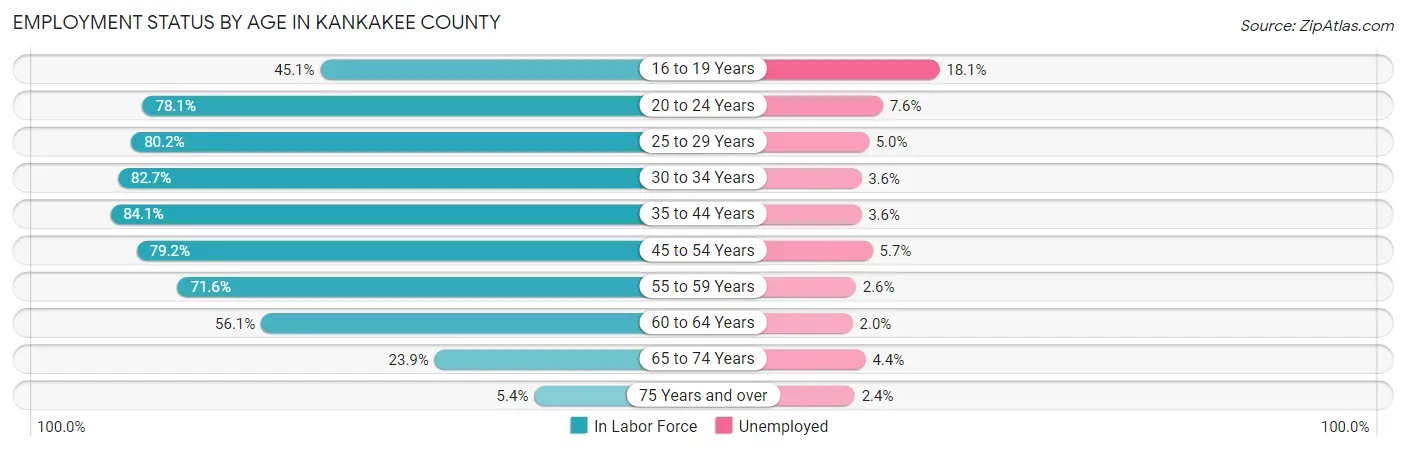
| Age Bracket | In Labor Force | Unemployed |
| 16 to 19 Years | 2,965 (45.1%) | 537 (18.1%) |
| 20 to 24 Years | 5,869 (78.1%) | 446 (7.6%) |
| 25 to 29 Years | 5,519 (80.2%) | 276 (5.0%) |
| 30 to 34 Years | 5,325 (82.7%) | 192 (3.6%) |
| 35 to 44 Years | 10,759 (84.1%) | 387 (3.6%) |
| 45 to 54 Years | 10,394 (79.2%) | 592 (5.7%) |
| 55 to 59 Years | 4,884 (71.6%) | 127 (2.6%) |
| 60 to 64 Years | 4,141 (56.1%) | 83 (2.0%) |
| 65 to 74 Years | 2,558 (23.9%) | 113 (4.4%) |
| 75 Years and over | 421 (5.4%) | 10 (2.4%) |
| Total | 52,818 (61.4%) | 2,747 (5.2%) |
Employment Status by Educational Attainment in Kankakee County
According to labor force statistics for Kankakee County, 76.8% of individuals (41,041) out of the total population between 25 and 64 years of age (53,439) are in the labor force, with 4.1% or 1,683 of them being unemployed. The group with the highest labor force participation rate are those with the educational attainment of bachelor's degree or higher, with 89.3% or 10,190 individuals in the labor force. Within the labor force, individuals with less than high school education have the highest percentage of unemployment, with 7.3% or 182 of them being unemployed.
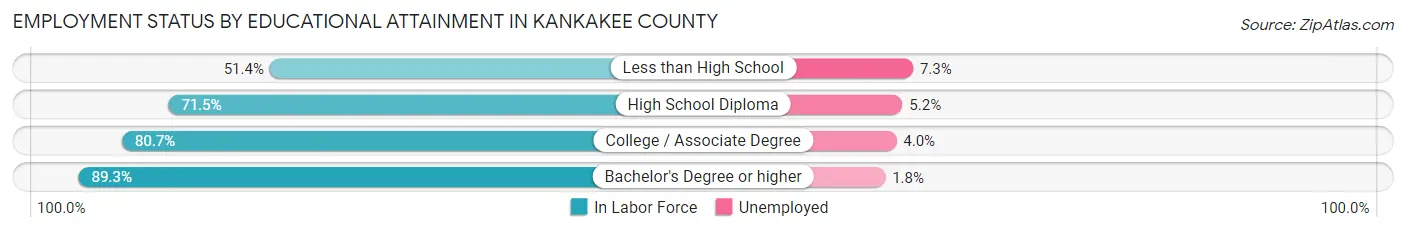
| Educational Attainment | In Labor Force | Unemployed |
| Less than High School | 2,489 (51.4%) | 354 (7.3%) |
| High School Diploma | 12,975 (71.5%) | 944 (5.2%) |
| College / Associate Degree | 15,364 (80.7%) | 762 (4.0%) |
| Bachelor's Degree or higher | 10,190 (89.3%) | 205 (1.8%) |
| Total | 41,041 (76.8%) | 2,191 (4.1%) |
Employment Occupations by Sex in Kankakee County
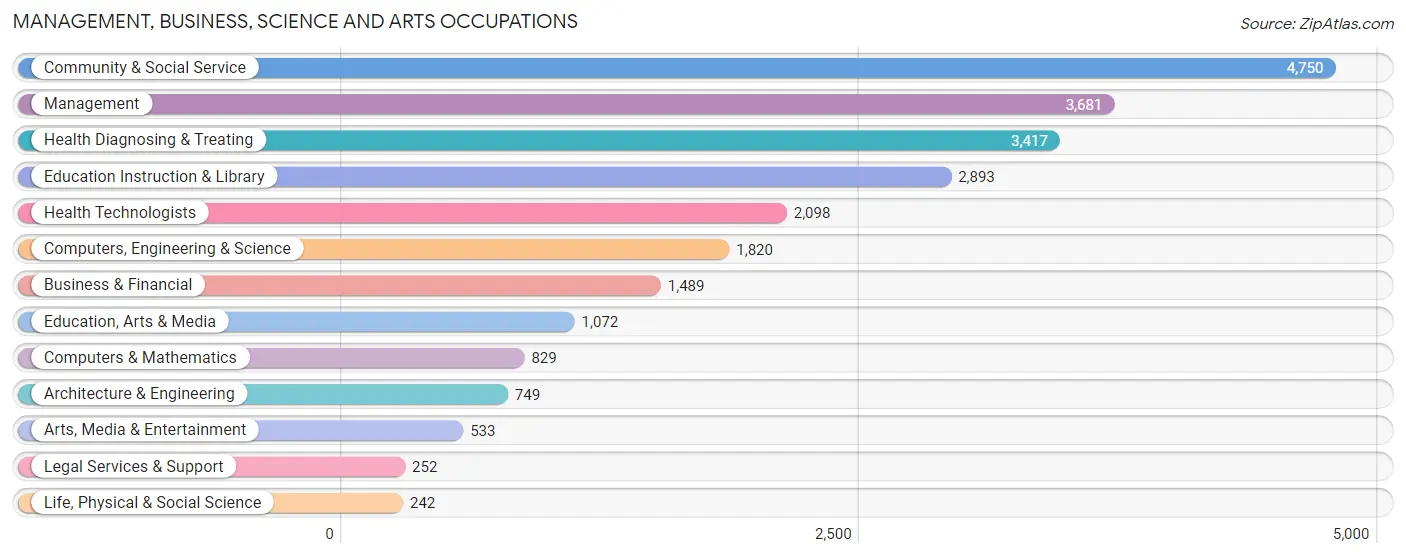
Management, Business, Science and Arts Occupations
The most common Management, Business, Science and Arts occupations in Kankakee County are Community & Social Service (4,750 | 9.5%), Management (3,681 | 7.3%), Health Diagnosing & Treating (3,417 | 6.8%), Education Instruction & Library (2,893 | 5.8%), and Health Technologists (2,098 | 4.2%).
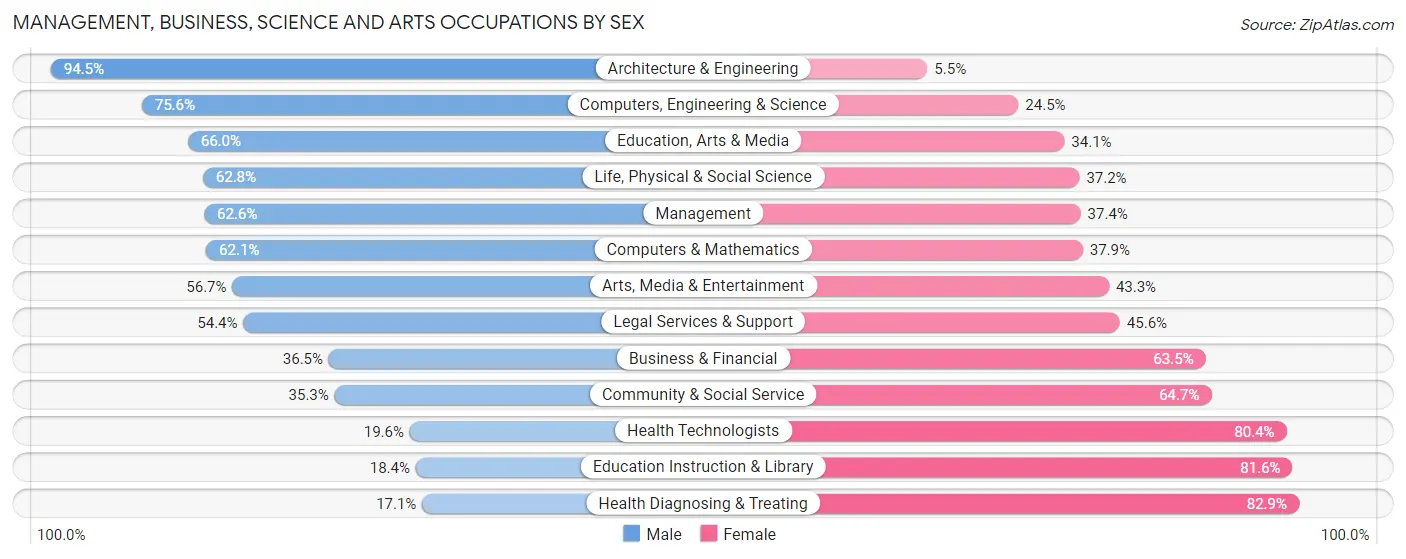
Management, Business, Science and Arts Occupations by Sex
Within the Management, Business, Science and Arts occupations in Kankakee County, the most male-oriented occupations are Architecture & Engineering (94.5%), Computers, Engineering & Science (75.5%), and Education, Arts & Media (65.9%), while the most female-oriented occupations are Health Diagnosing & Treating (82.9%), Education Instruction & Library (81.6%), and Health Technologists (80.4%).
| Occupation | Male | Female |
| Management | 2,303 (62.6%) | 1,378 (37.4%) |
| Business & Financial | 544 (36.5%) | 945 (63.5%) |
| Computers, Engineering & Science | 1,375 (75.5%) | 445 (24.4%) |
| Computers & Mathematics | 515 (62.1%) | 314 (37.9%) |
| Architecture & Engineering | 708 (94.5%) | 41 (5.5%) |
| Life, Physical & Social Science | 152 (62.8%) | 90 (37.2%) |
| Community & Social Service | 1,678 (35.3%) | 3,072 (64.7%) |
| Education, Arts & Media | 707 (65.9%) | 365 (34.1%) |
| Legal Services & Support | 137 (54.4%) | 115 (45.6%) |
| Education Instruction & Library | 532 (18.4%) | 2,361 (81.6%) |
| Arts, Media & Entertainment | 302 (56.7%) | 231 (43.3%) |
| Health Diagnosing & Treating | 583 (17.1%) | 2,834 (82.9%) |
| Health Technologists | 412 (19.6%) | 1,686 (80.4%) |
| Total (Category) | 6,483 (42.8%) | 8,674 (57.2%) |
| Total (Overall) | 25,482 (50.9%) | 24,577 (49.1%) |
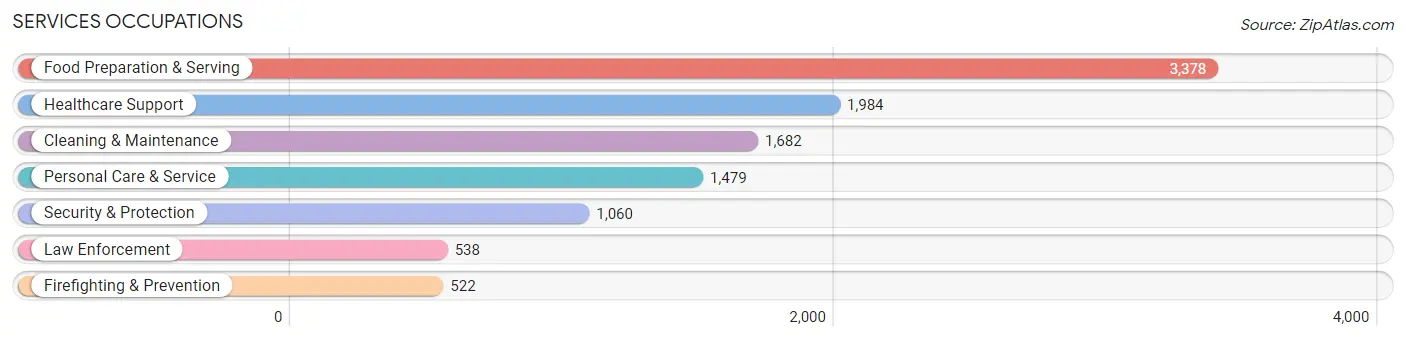
Services Occupations
The most common Services occupations in Kankakee County are Food Preparation & Serving (3,378 | 6.8%), Healthcare Support (1,984 | 4.0%), Cleaning & Maintenance (1,682 | 3.4%), Personal Care & Service (1,479 | 2.9%), and Security & Protection (1,060 | 2.1%).
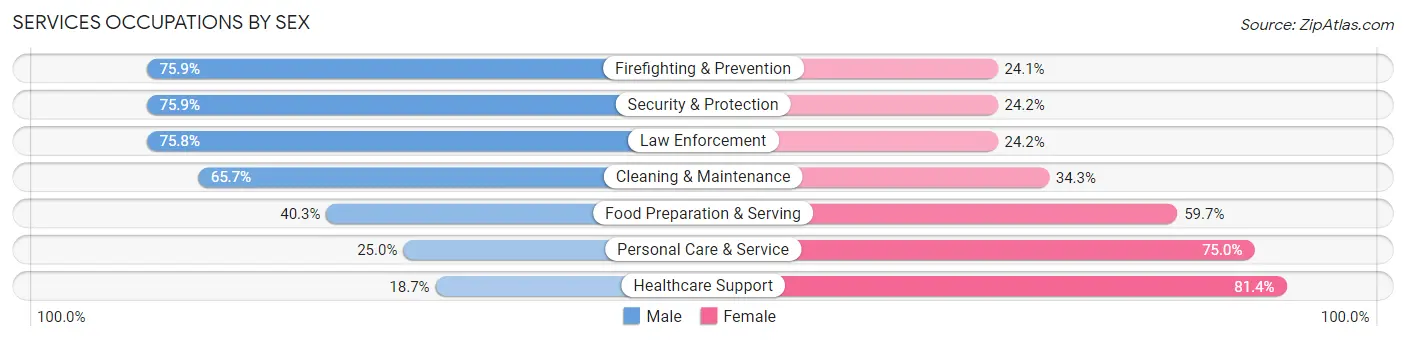
Services Occupations by Sex
Within the Services occupations in Kankakee County, the most male-oriented occupations are Firefighting & Prevention (75.9%), Security & Protection (75.8%), and Law Enforcement (75.8%), while the most female-oriented occupations are Healthcare Support (81.4%), Personal Care & Service (75.0%), and Food Preparation & Serving (59.7%).
| Occupation | Male | Female |
| Healthcare Support | 370 (18.6%) | 1,614 (81.4%) |
| Security & Protection | 804 (75.8%) | 256 (24.1%) |
| Firefighting & Prevention | 396 (75.9%) | 126 (24.1%) |
| Law Enforcement | 408 (75.8%) | 130 (24.2%) |
| Food Preparation & Serving | 1,360 (40.3%) | 2,018 (59.7%) |
| Cleaning & Maintenance | 1,105 (65.7%) | 577 (34.3%) |
| Personal Care & Service | 370 (25.0%) | 1,109 (75.0%) |
| Total (Category) | 4,009 (41.8%) | 5,574 (58.2%) |
| Total (Overall) | 25,482 (50.9%) | 24,577 (49.1%) |
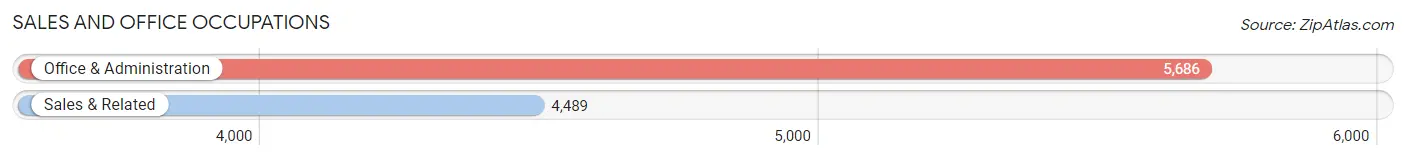
Sales and Office Occupations
The most common Sales and Office occupations in Kankakee County are Office & Administration (5,686 | 11.4%), and Sales & Related (4,489 | 9.0%).
Sales and Office Occupations by Sex
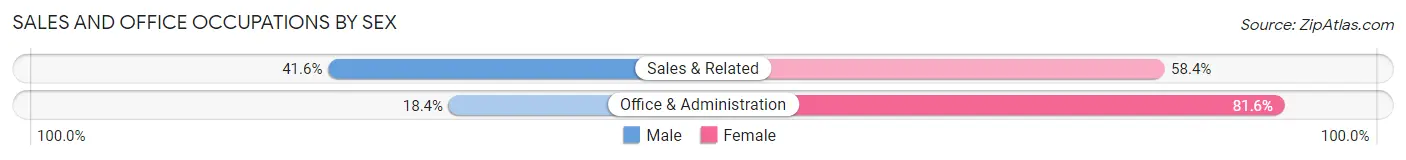
| Occupation | Male | Female |
| Sales & Related | 1,868 (41.6%) | 2,621 (58.4%) |
| Office & Administration | 1,047 (18.4%) | 4,639 (81.6%) |
| Total (Category) | 2,915 (28.6%) | 7,260 (71.4%) |
| Total (Overall) | 25,482 (50.9%) | 24,577 (49.1%) |
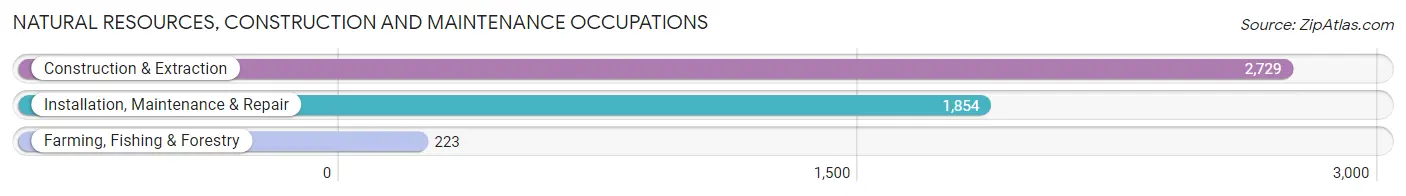
Natural Resources, Construction and Maintenance Occupations
The most common Natural Resources, Construction and Maintenance occupations in Kankakee County are Construction & Extraction (2,729 | 5.4%), Installation, Maintenance & Repair (1,854 | 3.7%), and Farming, Fishing & Forestry (223 | 0.4%).
Natural Resources, Construction and Maintenance Occupations by Sex
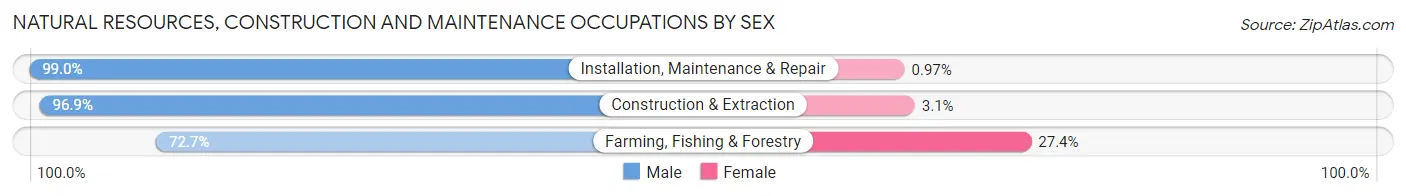
| Occupation | Male | Female |
| Farming, Fishing & Forestry | 162 (72.7%) | 61 (27.4%) |
| Construction & Extraction | 2,644 (96.9%) | 85 (3.1%) |
| Installation, Maintenance & Repair | 1,836 (99.0%) | 18 (1.0%) |
| Total (Category) | 4,642 (96.6%) | 164 (3.4%) |
| Total (Overall) | 25,482 (50.9%) | 24,577 (49.1%) |
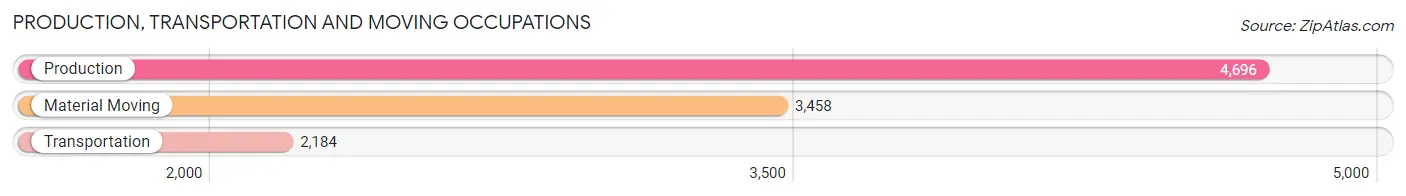
Production, Transportation and Moving Occupations
The most common Production, Transportation and Moving occupations in Kankakee County are Production (4,696 | 9.4%), Material Moving (3,458 | 6.9%), and Transportation (2,184 | 4.4%).
Production, Transportation and Moving Occupations by Sex
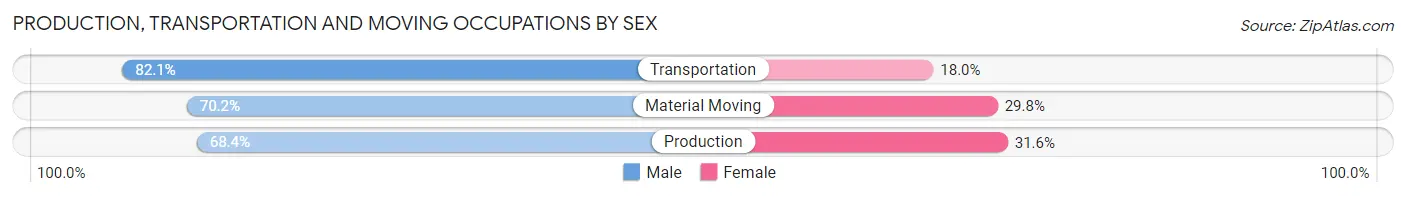
| Occupation | Male | Female |
| Production | 3,212 (68.4%) | 1,484 (31.6%) |
| Transportation | 1,792 (82.1%) | 392 (17.9%) |
| Material Moving | 2,429 (70.2%) | 1,029 (29.8%) |
| Total (Category) | 7,433 (71.9%) | 2,905 (28.1%) |
| Total (Overall) | 25,482 (50.9%) | 24,577 (49.1%) |
Employment Industries by Sex in Kankakee County
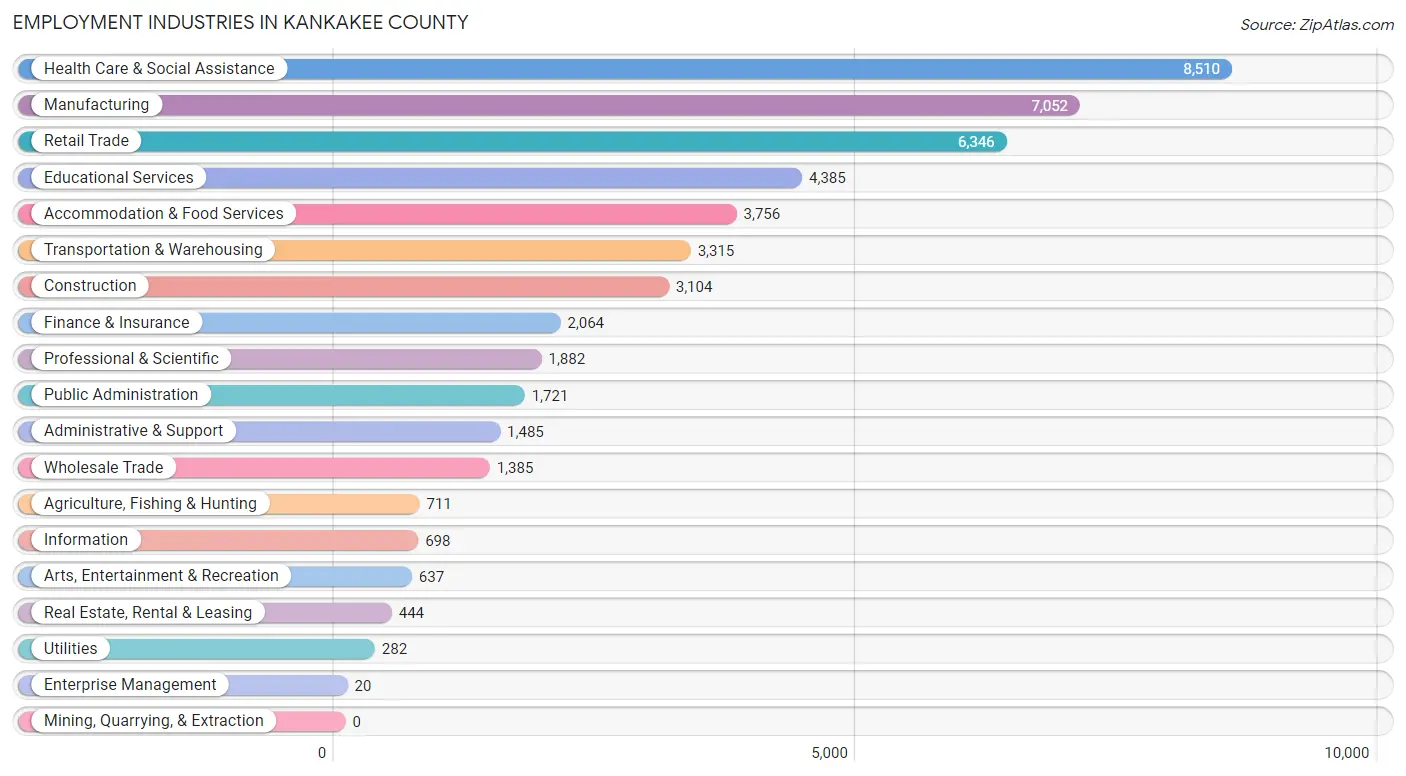
Employment Industries in Kankakee County
The major employment industries in Kankakee County include Health Care & Social Assistance (8,510 | 17.0%), Manufacturing (7,052 | 14.1%), Retail Trade (6,346 | 12.7%), Educational Services (4,385 | 8.8%), and Accommodation & Food Services (3,756 | 7.5%).
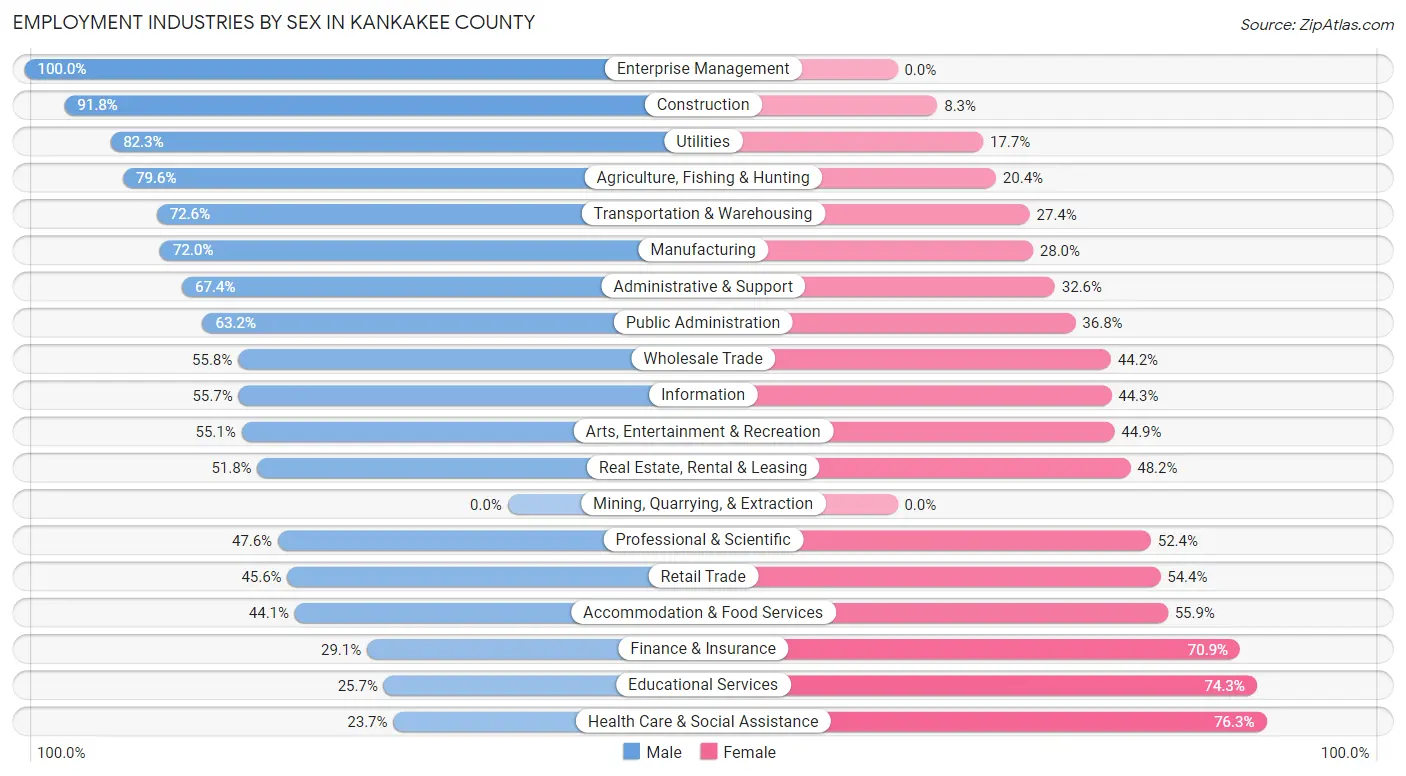
Employment Industries by Sex in Kankakee County
The Kankakee County industries that see more men than women are Enterprise Management (100.0%), Construction (91.7%), and Utilities (82.3%), whereas the industries that tend to have a higher number of women are Health Care & Social Assistance (76.3%), Educational Services (74.3%), and Finance & Insurance (70.9%).
| Industry | Male | Female |
| Agriculture, Fishing & Hunting | 566 (79.6%) | 145 (20.4%) |
| Mining, Quarrying, & Extraction | 0 (0.0%) | 0 (0.0%) |
| Construction | 2,848 (91.7%) | 256 (8.3%) |
| Manufacturing | 5,075 (72.0%) | 1,977 (28.0%) |
| Wholesale Trade | 773 (55.8%) | 612 (44.2%) |
| Retail Trade | 2,893 (45.6%) | 3,453 (54.4%) |
| Transportation & Warehousing | 2,408 (72.6%) | 907 (27.4%) |
| Utilities | 232 (82.3%) | 50 (17.7%) |
| Information | 389 (55.7%) | 309 (44.3%) |
| Finance & Insurance | 601 (29.1%) | 1,463 (70.9%) |
| Real Estate, Rental & Leasing | 230 (51.8%) | 214 (48.2%) |
| Professional & Scientific | 895 (47.6%) | 987 (52.4%) |
| Enterprise Management | 20 (100.0%) | 0 (0.0%) |
| Administrative & Support | 1,001 (67.4%) | 484 (32.6%) |
| Educational Services | 1,125 (25.7%) | 3,260 (74.3%) |
| Health Care & Social Assistance | 2,014 (23.7%) | 6,496 (76.3%) |
| Arts, Entertainment & Recreation | 351 (55.1%) | 286 (44.9%) |
| Accommodation & Food Services | 1,655 (44.1%) | 2,101 (55.9%) |
| Public Administration | 1,087 (63.2%) | 634 (36.8%) |
| Total | 25,482 (50.9%) | 24,577 (49.1%) |
Education in Kankakee County
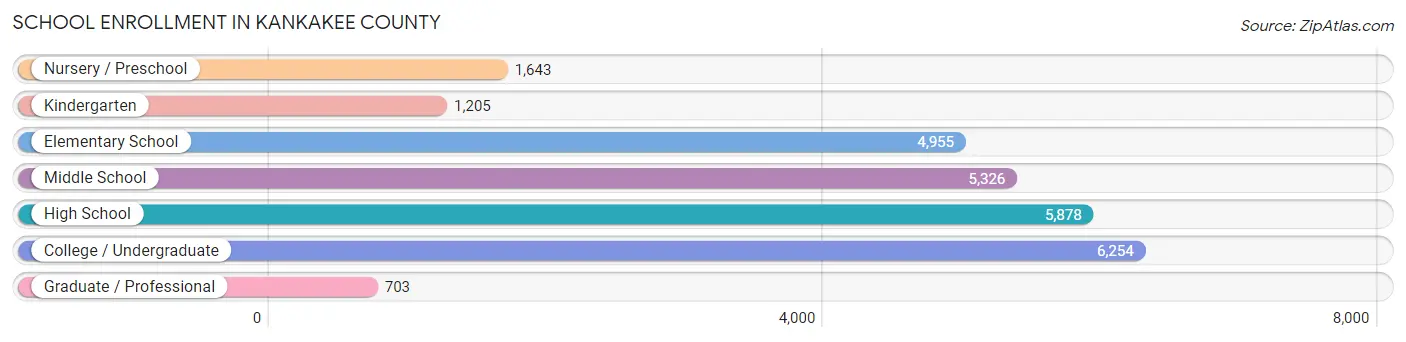
School Enrollment in Kankakee County
The most common levels of schooling among the 25,964 students in Kankakee County are college / undergraduate (6,254 | 24.1%), high school (5,878 | 22.6%), and middle school (5,326 | 20.5%).
| School Level | # Students | % Students |
| Nursery / Preschool | 1,643 | 6.3% |
| Kindergarten | 1,205 | 4.6% |
| Elementary School | 4,955 | 19.1% |
| Middle School | 5,326 | 20.5% |
| High School | 5,878 | 22.6% |
| College / Undergraduate | 6,254 | 24.1% |
| Graduate / Professional | 703 | 2.7% |
| Total | 25,964 | 100.0% |
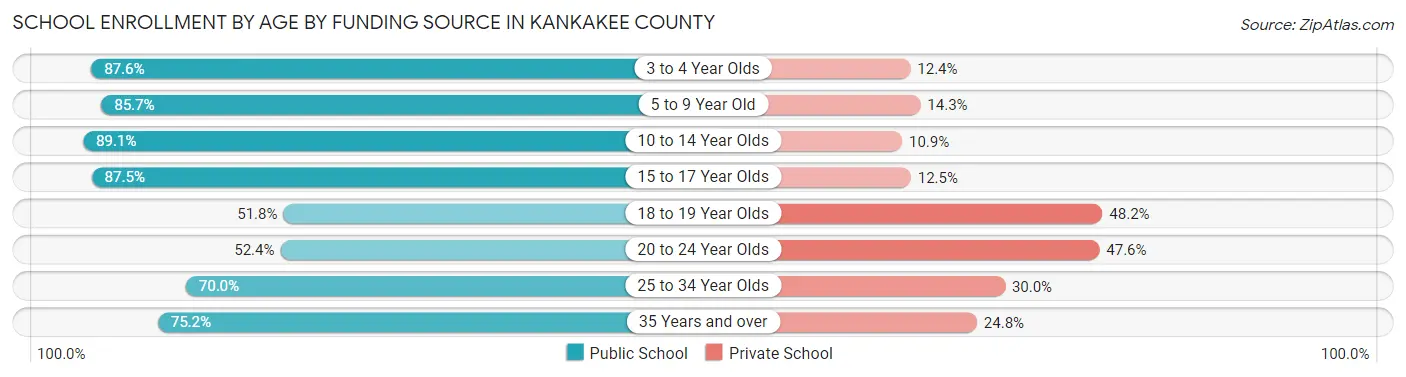
School Enrollment by Age by Funding Source in Kankakee County
Out of a total of 25,964 students who are enrolled in schools in Kankakee County, 5,530 (21.3%) attend a private institution, while the remaining 20,434 (78.7%) are enrolled in public schools. The age group of 18 to 19 year olds has the highest likelihood of being enrolled in private schools, with 1,197 (48.2% in the age bracket) enrolled. Conversely, the age group of 10 to 14 year olds has the lowest likelihood of being enrolled in a private school, with 5,897 (89.1% in the age bracket) attending a public institution.
| Age Bracket | Public School | Private School |
| 3 to 4 Year Olds | 1,178 (87.6%) | 167 (12.4%) |
| 5 to 9 Year Old | 5,075 (85.7%) | 846 (14.3%) |
| 10 to 14 Year Olds | 5,897 (89.1%) | 720 (10.9%) |
| 15 to 17 Year Olds | 3,723 (87.5%) | 532 (12.5%) |
| 18 to 19 Year Olds | 1,287 (51.8%) | 1,197 (48.2%) |
| 20 to 24 Year Olds | 1,579 (52.4%) | 1,436 (47.6%) |
| 25 to 34 Year Olds | 850 (70.0%) | 365 (30.0%) |
| 35 Years and over | 836 (75.2%) | 276 (24.8%) |
| Total | 20,434 (78.7%) | 5,530 (21.3%) |
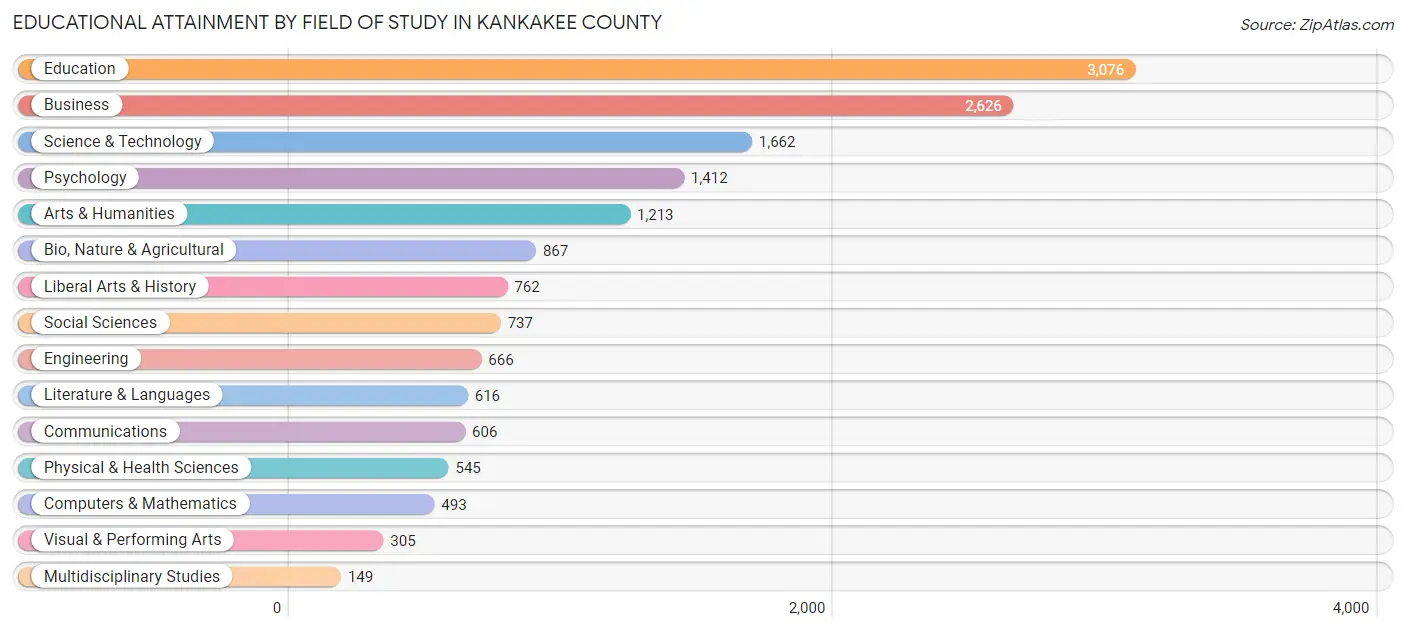
Educational Attainment by Field of Study in Kankakee County
Education (3,076 | 19.6%), business (2,626 | 16.7%), science & technology (1,662 | 10.6%), psychology (1,412 | 9.0%), and arts & humanities (1,213 | 7.7%) are the most common fields of study among 15,735 individuals in Kankakee County who have obtained a bachelor's degree or higher.
| Field of Study | # Graduates | % Graduates |
| Computers & Mathematics | 493 | 3.1% |
| Bio, Nature & Agricultural | 867 | 5.5% |
| Physical & Health Sciences | 545 | 3.5% |
| Psychology | 1,412 | 9.0% |
| Social Sciences | 737 | 4.7% |
| Engineering | 666 | 4.2% |
| Multidisciplinary Studies | 149 | 0.9% |
| Science & Technology | 1,662 | 10.6% |
| Business | 2,626 | 16.7% |
| Education | 3,076 | 19.6% |
| Literature & Languages | 616 | 3.9% |
| Liberal Arts & History | 762 | 4.8% |
| Visual & Performing Arts | 305 | 1.9% |
| Communications | 606 | 3.8% |
| Arts & Humanities | 1,213 | 7.7% |
| Total | 15,735 | 100.0% |
Transportation & Commute in Kankakee County
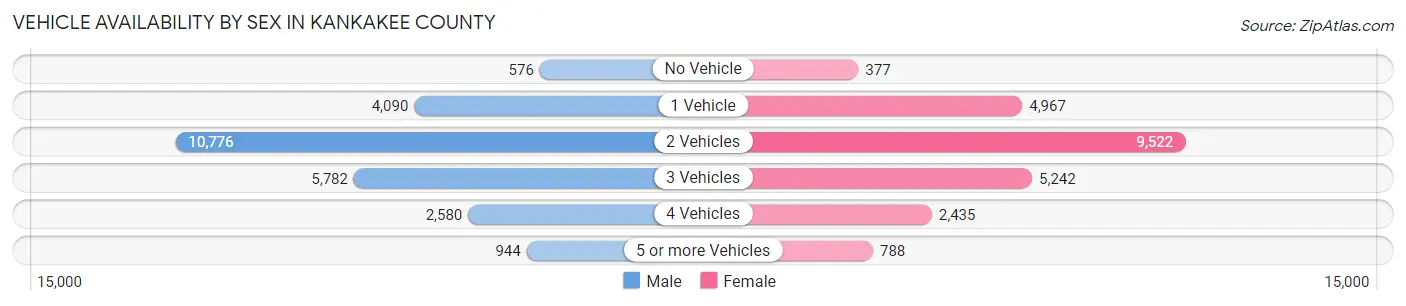
Vehicle Availability by Sex in Kankakee County
The most prevalent vehicle ownership categories in Kankakee County are males with 2 vehicles (10,776, accounting for 43.5%) and females with 2 vehicles (9,522, making up 46.2%).
| Vehicles Available | Male | Female |
| No Vehicle | 576 (2.3%) | 377 (1.6%) |
| 1 Vehicle | 4,090 (16.5%) | 4,967 (21.3%) |
| 2 Vehicles | 10,776 (43.5%) | 9,522 (40.8%) |
| 3 Vehicles | 5,782 (23.4%) | 5,242 (22.5%) |
| 4 Vehicles | 2,580 (10.4%) | 2,435 (10.4%) |
| 5 or more Vehicles | 944 (3.8%) | 788 (3.4%) |
| Total | 24,748 (100.0%) | 23,331 (100.0%) |
Commute Time in Kankakee County
The most frequently occuring commute durations in Kankakee County are 10 to 14 minutes (8,321 commuters, 18.0%), 15 to 19 minutes (7,583 commuters, 16.4%), and 5 to 9 minutes (6,432 commuters, 13.9%).
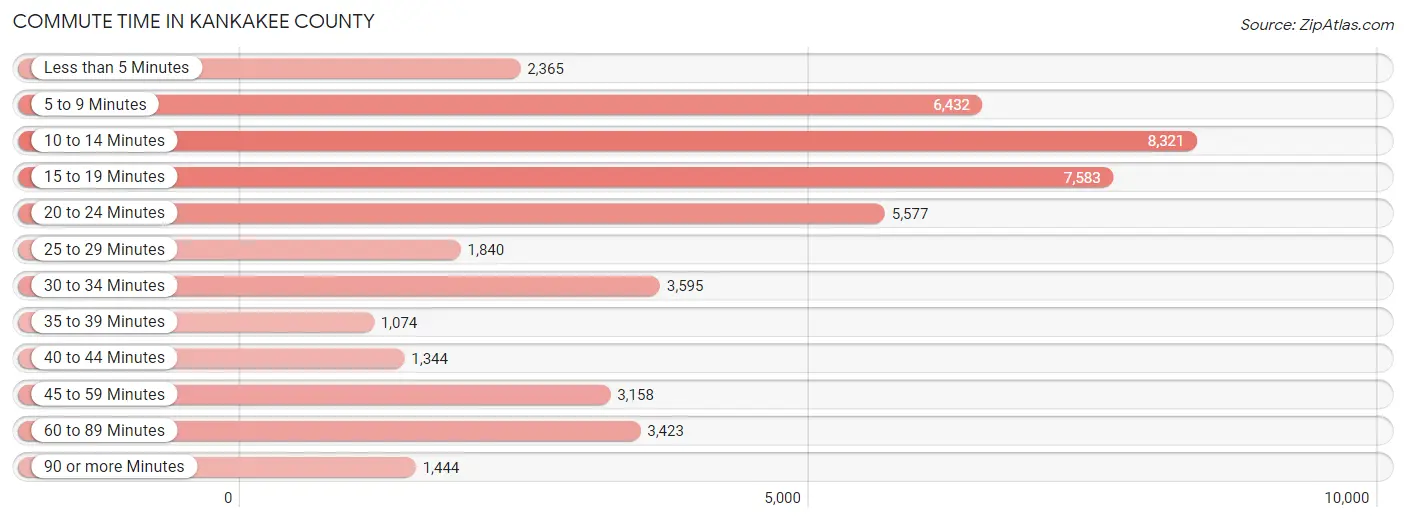
| Commute Time | # Commuters | % Commuters |
| Less than 5 Minutes | 2,365 | 5.1% |
| 5 to 9 Minutes | 6,432 | 13.9% |
| 10 to 14 Minutes | 8,321 | 18.0% |
| 15 to 19 Minutes | 7,583 | 16.4% |
| 20 to 24 Minutes | 5,577 | 12.1% |
| 25 to 29 Minutes | 1,840 | 4.0% |
| 30 to 34 Minutes | 3,595 | 7.8% |
| 35 to 39 Minutes | 1,074 | 2.3% |
| 40 to 44 Minutes | 1,344 | 2.9% |
| 45 to 59 Minutes | 3,158 | 6.8% |
| 60 to 89 Minutes | 3,423 | 7.4% |
| 90 or more Minutes | 1,444 | 3.1% |
Commute Time by Sex in Kankakee County
The most common commute times in Kankakee County are 10 to 14 minutes (3,805 commuters, 15.8%) for males and 10 to 14 minutes (4,516 commuters, 20.5%) for females.
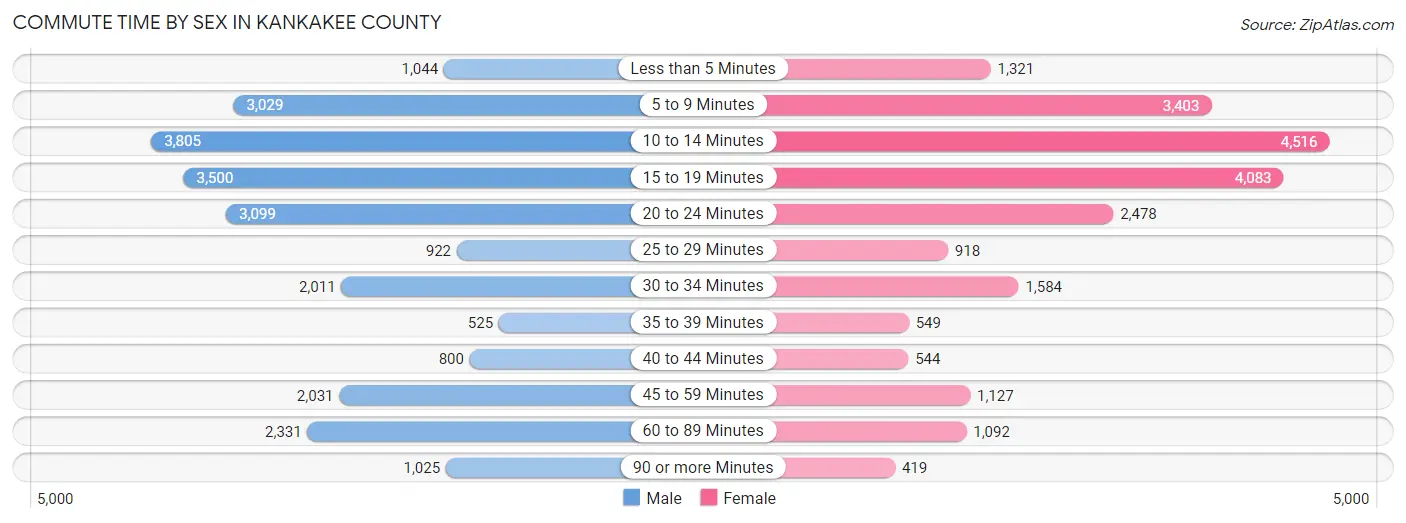
| Commute Time | Male | Female |
| Less than 5 Minutes | 1,044 (4.3%) | 1,321 (6.0%) |
| 5 to 9 Minutes | 3,029 (12.6%) | 3,403 (15.4%) |
| 10 to 14 Minutes | 3,805 (15.8%) | 4,516 (20.5%) |
| 15 to 19 Minutes | 3,500 (14.5%) | 4,083 (18.5%) |
| 20 to 24 Minutes | 3,099 (12.9%) | 2,478 (11.3%) |
| 25 to 29 Minutes | 922 (3.8%) | 918 (4.2%) |
| 30 to 34 Minutes | 2,011 (8.3%) | 1,584 (7.2%) |
| 35 to 39 Minutes | 525 (2.2%) | 549 (2.5%) |
| 40 to 44 Minutes | 800 (3.3%) | 544 (2.5%) |
| 45 to 59 Minutes | 2,031 (8.4%) | 1,127 (5.1%) |
| 60 to 89 Minutes | 2,331 (9.7%) | 1,092 (5.0%) |
| 90 or more Minutes | 1,025 (4.3%) | 419 (1.9%) |
Time of Departure to Work by Sex in Kankakee County
The most frequent times of departure to work in Kankakee County are 6:00 AM to 6:29 AM (2,661, 11.0%) for males and 7:00 AM to 7:29 AM (3,188, 14.5%) for females.
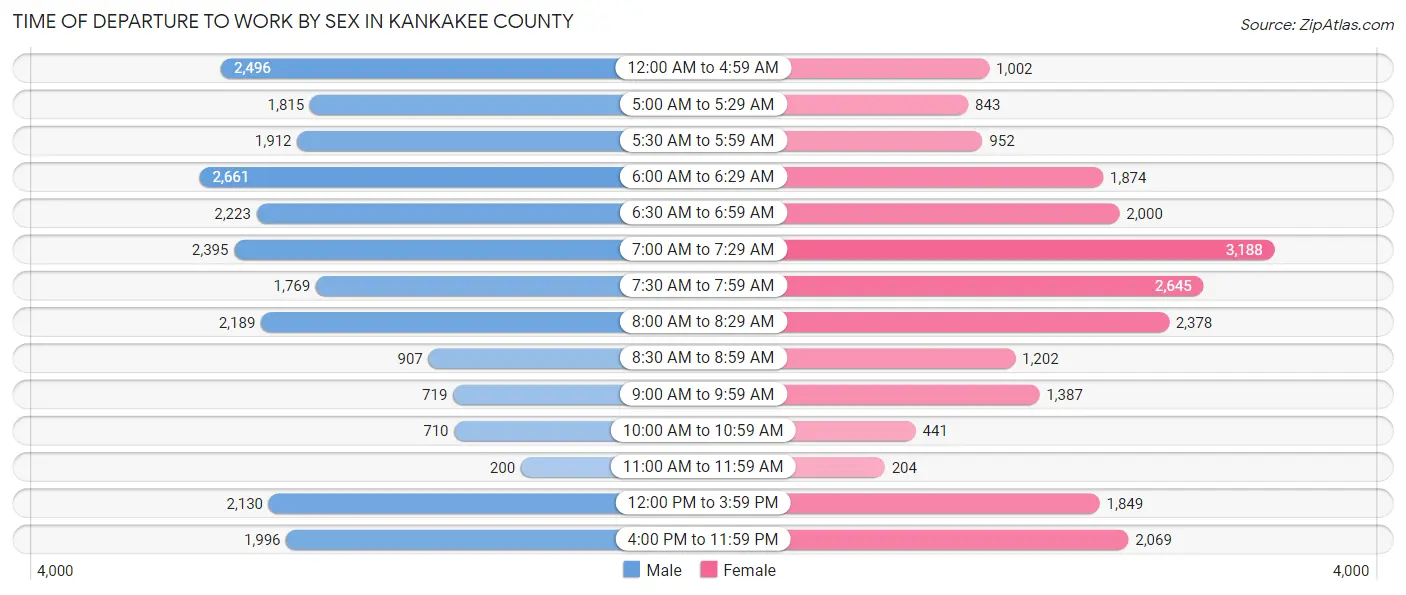
| Time of Departure | Male | Female |
| 12:00 AM to 4:59 AM | 2,496 (10.3%) | 1,002 (4.5%) |
| 5:00 AM to 5:29 AM | 1,815 (7.5%) | 843 (3.8%) |
| 5:30 AM to 5:59 AM | 1,912 (7.9%) | 952 (4.3%) |
| 6:00 AM to 6:29 AM | 2,661 (11.0%) | 1,874 (8.5%) |
| 6:30 AM to 6:59 AM | 2,223 (9.2%) | 2,000 (9.1%) |
| 7:00 AM to 7:29 AM | 2,395 (9.9%) | 3,188 (14.5%) |
| 7:30 AM to 7:59 AM | 1,769 (7.3%) | 2,645 (12.0%) |
| 8:00 AM to 8:29 AM | 2,189 (9.1%) | 2,378 (10.8%) |
| 8:30 AM to 8:59 AM | 907 (3.8%) | 1,202 (5.5%) |
| 9:00 AM to 9:59 AM | 719 (3.0%) | 1,387 (6.3%) |
| 10:00 AM to 10:59 AM | 710 (2.9%) | 441 (2.0%) |
| 11:00 AM to 11:59 AM | 200 (0.8%) | 204 (0.9%) |
| 12:00 PM to 3:59 PM | 2,130 (8.8%) | 1,849 (8.4%) |
| 4:00 PM to 11:59 PM | 1,996 (8.3%) | 2,069 (9.4%) |
| Total | 24,122 (100.0%) | 22,034 (100.0%) |
Housing Occupancy in Kankakee County
Occupancy by Ownership in Kankakee County
Of the total 40,591 dwellings in Kankakee County, owner-occupied units account for 27,634 (68.1%), while renter-occupied units make up 12,957 (31.9%).
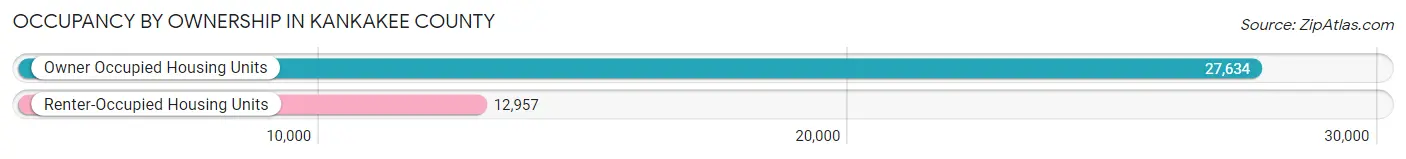
| Occupancy | # Housing Units | % Housing Units |
| Owner Occupied Housing Units | 27,634 | 68.1% |
| Renter-Occupied Housing Units | 12,957 | 31.9% |
| Total Occupied Housing Units | 40,591 | 100.0% |
Occupancy by Household Size in Kankakee County
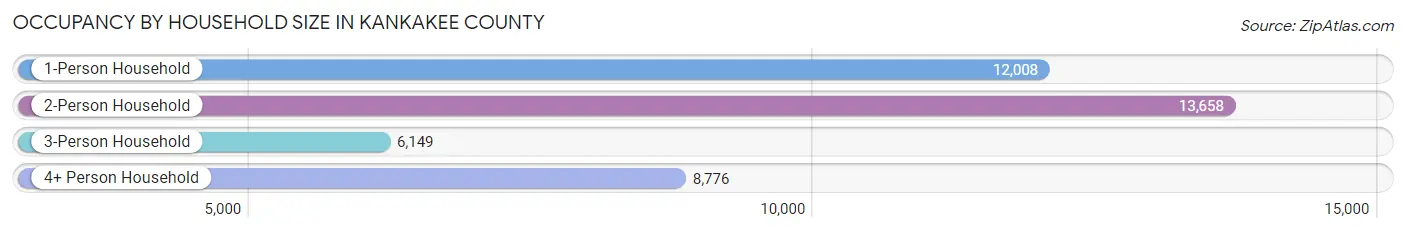
| Household Size | # Housing Units | % Housing Units |
| 1-Person Household | 12,008 | 29.6% |
| 2-Person Household | 13,658 | 33.7% |
| 3-Person Household | 6,149 | 15.1% |
| 4+ Person Household | 8,776 | 21.6% |
| Total Housing Units | 40,591 | 100.0% |
Occupancy by Ownership by Household Size in Kankakee County
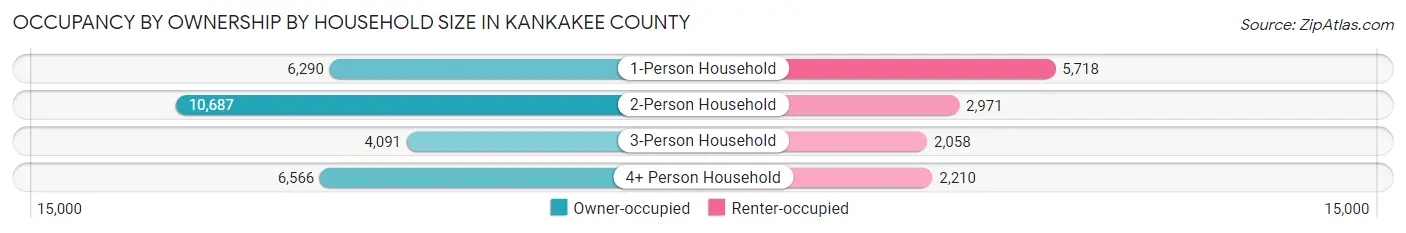
| Household Size | Owner-occupied | Renter-occupied |
| 1-Person Household | 6,290 (52.4%) | 5,718 (47.6%) |
| 2-Person Household | 10,687 (78.2%) | 2,971 (21.7%) |
| 3-Person Household | 4,091 (66.5%) | 2,058 (33.5%) |
| 4+ Person Household | 6,566 (74.8%) | 2,210 (25.2%) |
| Total Housing Units | 27,634 (68.1%) | 12,957 (31.9%) |
Occupancy by Educational Attainment in Kankakee County

| Household Size | Owner-occupied | Renter-occupied |
| Less than High School | 1,615 (52.3%) | 1,473 (47.7%) |
| High School Diploma | 8,428 (62.7%) | 5,014 (37.3%) |
| College/Associate Degree | 10,587 (68.0%) | 4,981 (32.0%) |
| Bachelor's Degree or higher | 7,004 (82.5%) | 1,489 (17.5%) |
Occupancy by Age of Householder in Kankakee County
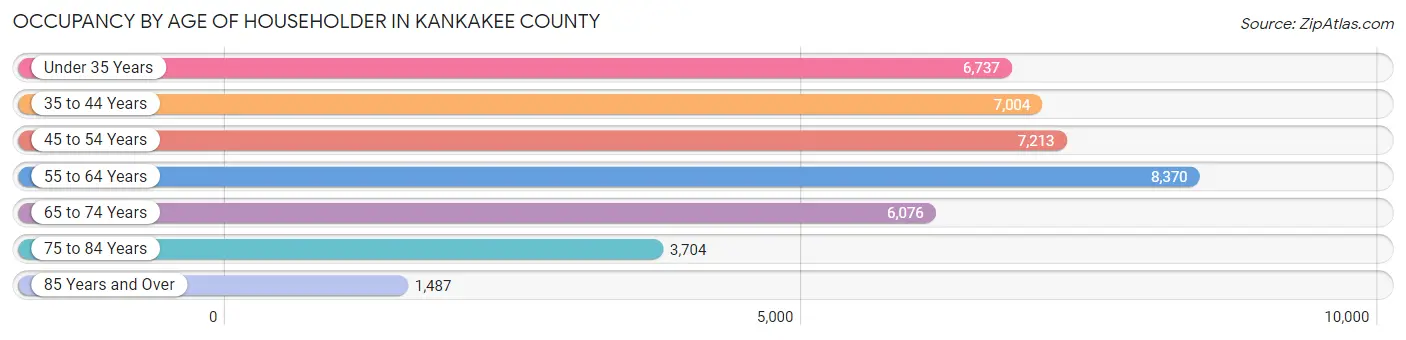
| Age Bracket | # Households | % Households |
| Under 35 Years | 6,737 | 16.6% |
| 35 to 44 Years | 7,004 | 17.3% |
| 45 to 54 Years | 7,213 | 17.8% |
| 55 to 64 Years | 8,370 | 20.6% |
| 65 to 74 Years | 6,076 | 15.0% |
| 75 to 84 Years | 3,704 | 9.1% |
| 85 Years and Over | 1,487 | 3.7% |
| Total | 40,591 | 100.0% |
Housing Finances in Kankakee County
Median Income by Occupancy in Kankakee County
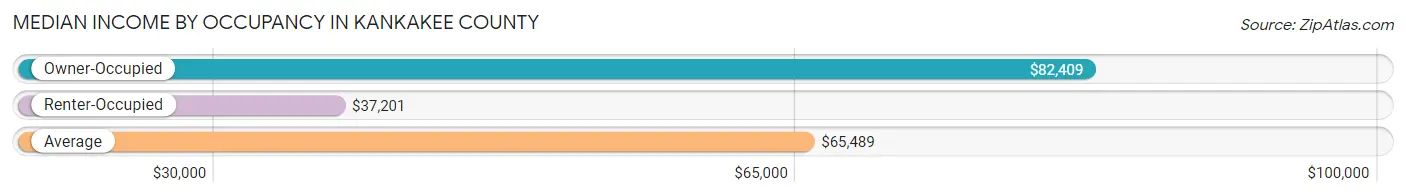
| Occupancy Type | # Households | Median Income |
| Owner-Occupied | 27,634 (68.1%) | $82,409 |
| Renter-Occupied | 12,957 (31.9%) | $37,201 |
| Average | 40,591 (100.0%) | $65,489 |
Occupancy by Householder Income Bracket in Kankakee County
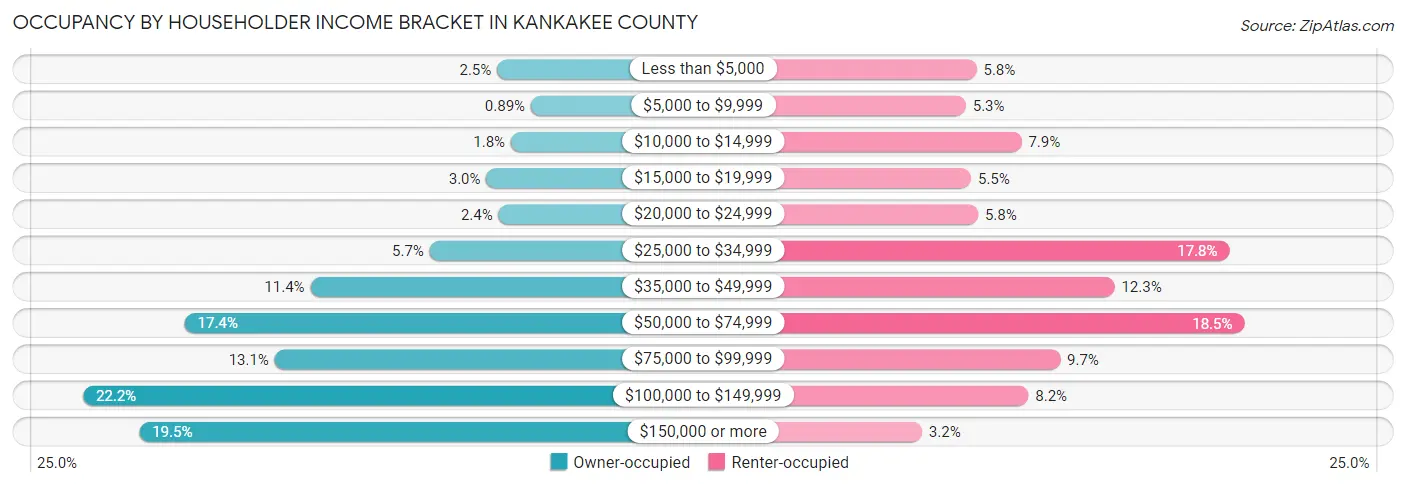
| Income Bracket | Owner-occupied | Renter-occupied |
| Less than $5,000 | 692 (2.5%) | 746 (5.8%) |
| $5,000 to $9,999 | 247 (0.9%) | 680 (5.2%) |
| $10,000 to $14,999 | 509 (1.8%) | 1,024 (7.9%) |
| $15,000 to $19,999 | 831 (3.0%) | 713 (5.5%) |
| $20,000 to $24,999 | 671 (2.4%) | 756 (5.8%) |
| $25,000 to $34,999 | 1,577 (5.7%) | 2,306 (17.8%) |
| $35,000 to $49,999 | 3,147 (11.4%) | 1,597 (12.3%) |
| $50,000 to $74,999 | 4,804 (17.4%) | 2,398 (18.5%) |
| $75,000 to $99,999 | 3,617 (13.1%) | 1,262 (9.7%) |
| $100,000 to $149,999 | 6,140 (22.2%) | 1,066 (8.2%) |
| $150,000 or more | 5,399 (19.5%) | 409 (3.2%) |
| Total | 27,634 (100.0%) | 12,957 (100.0%) |
Monthly Housing Cost Tiers in Kankakee County
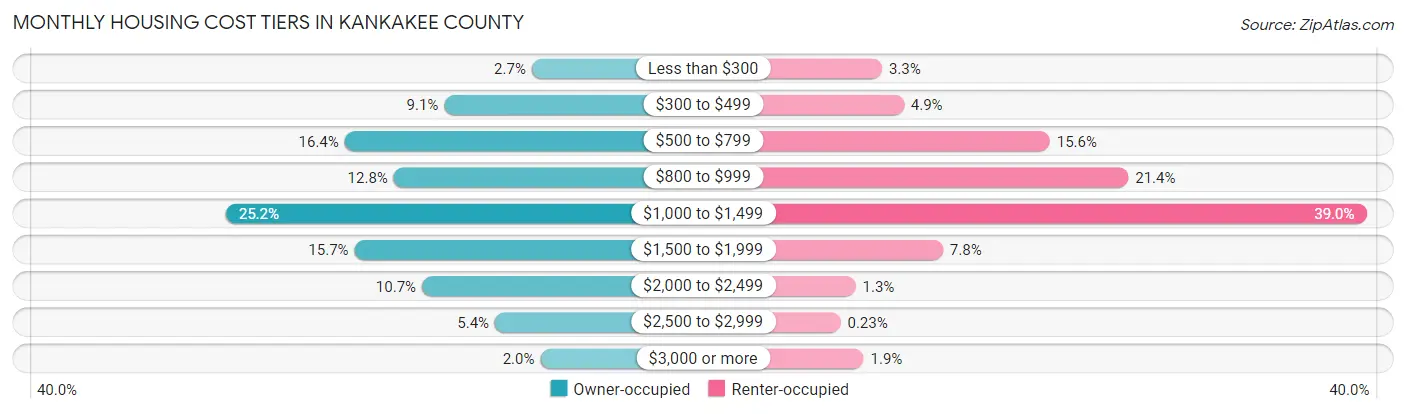
| Monthly Cost | Owner-occupied | Renter-occupied |
| Less than $300 | 732 (2.6%) | 425 (3.3%) |
| $300 to $499 | 2,514 (9.1%) | 634 (4.9%) |
| $500 to $799 | 4,540 (16.4%) | 2,026 (15.6%) |
| $800 to $999 | 3,543 (12.8%) | 2,776 (21.4%) |
| $1,000 to $1,499 | 6,959 (25.2%) | 5,047 (39.0%) |
| $1,500 to $1,999 | 4,340 (15.7%) | 1,007 (7.8%) |
| $2,000 to $2,499 | 2,967 (10.7%) | 174 (1.3%) |
| $2,500 to $2,999 | 1,480 (5.4%) | 30 (0.2%) |
| $3,000 or more | 559 (2.0%) | 250 (1.9%) |
| Total | 27,634 (100.0%) | 12,957 (100.0%) |
Physical Housing Characteristics in Kankakee County
Housing Structures in Kankakee County
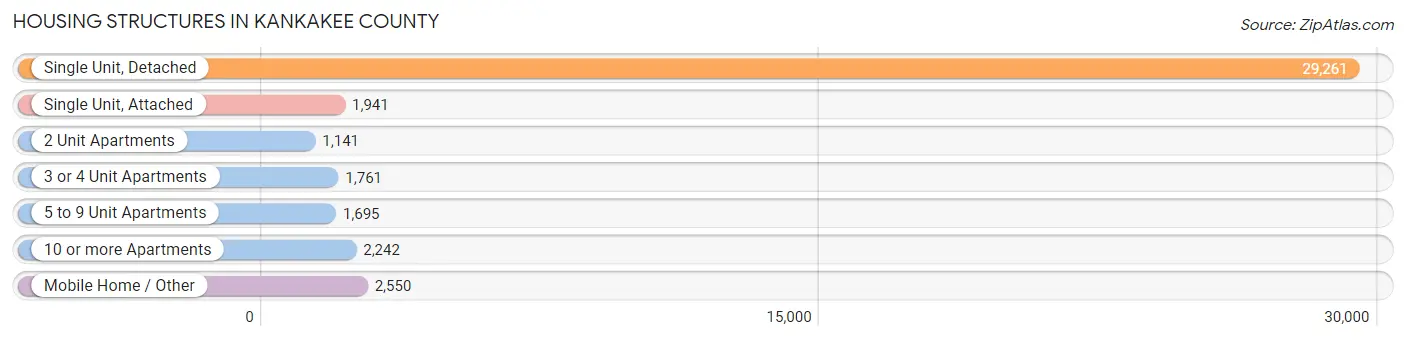
| Structure Type | # Housing Units | % Housing Units |
| Single Unit, Detached | 29,261 | 72.1% |
| Single Unit, Attached | 1,941 | 4.8% |
| 2 Unit Apartments | 1,141 | 2.8% |
| 3 or 4 Unit Apartments | 1,761 | 4.3% |
| 5 to 9 Unit Apartments | 1,695 | 4.2% |
| 10 or more Apartments | 2,242 | 5.5% |
| Mobile Home / Other | 2,550 | 6.3% |
| Total | 40,591 | 100.0% |
Housing Structures by Occupancy in Kankakee County
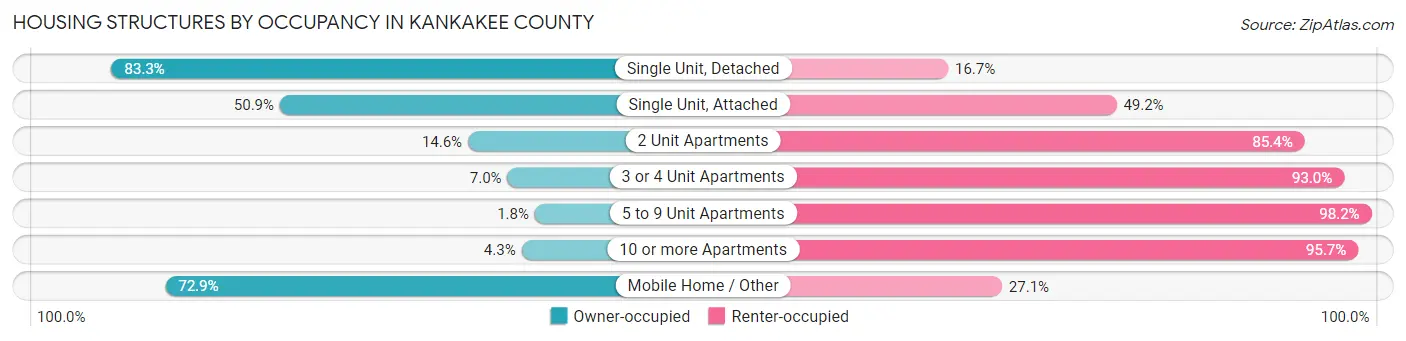
| Structure Type | Owner-occupied | Renter-occupied |
| Single Unit, Detached | 24,370 (83.3%) | 4,891 (16.7%) |
| Single Unit, Attached | 987 (50.8%) | 954 (49.1%) |
| 2 Unit Apartments | 167 (14.6%) | 974 (85.4%) |
| 3 or 4 Unit Apartments | 124 (7.0%) | 1,637 (93.0%) |
| 5 to 9 Unit Apartments | 30 (1.8%) | 1,665 (98.2%) |
| 10 or more Apartments | 97 (4.3%) | 2,145 (95.7%) |
| Mobile Home / Other | 1,859 (72.9%) | 691 (27.1%) |
| Total | 27,634 (68.1%) | 12,957 (31.9%) |
Housing Structures by Number of Rooms in Kankakee County
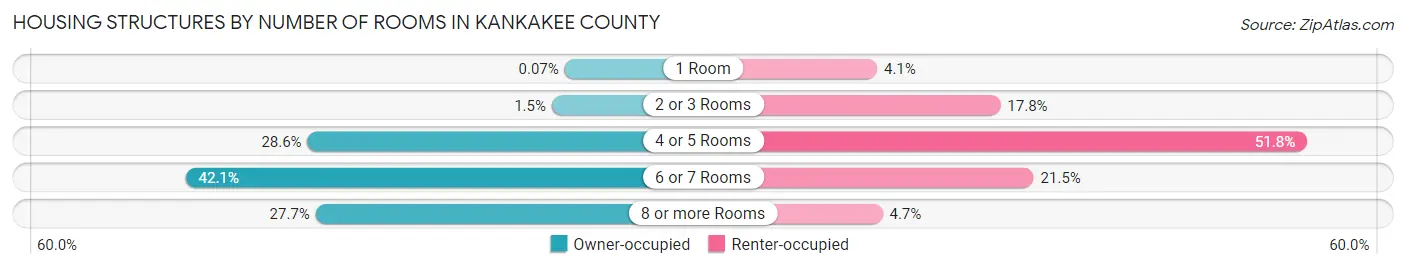
| Number of Rooms | Owner-occupied | Renter-occupied |
| 1 Room | 19 (0.1%) | 534 (4.1%) |
| 2 or 3 Rooms | 412 (1.5%) | 2,307 (17.8%) |
| 4 or 5 Rooms | 7,907 (28.6%) | 6,717 (51.8%) |
| 6 or 7 Rooms | 11,642 (42.1%) | 2,786 (21.5%) |
| 8 or more Rooms | 7,654 (27.7%) | 613 (4.7%) |
| Total | 27,634 (100.0%) | 12,957 (100.0%) |
Housing Structure by Heating Type in Kankakee County
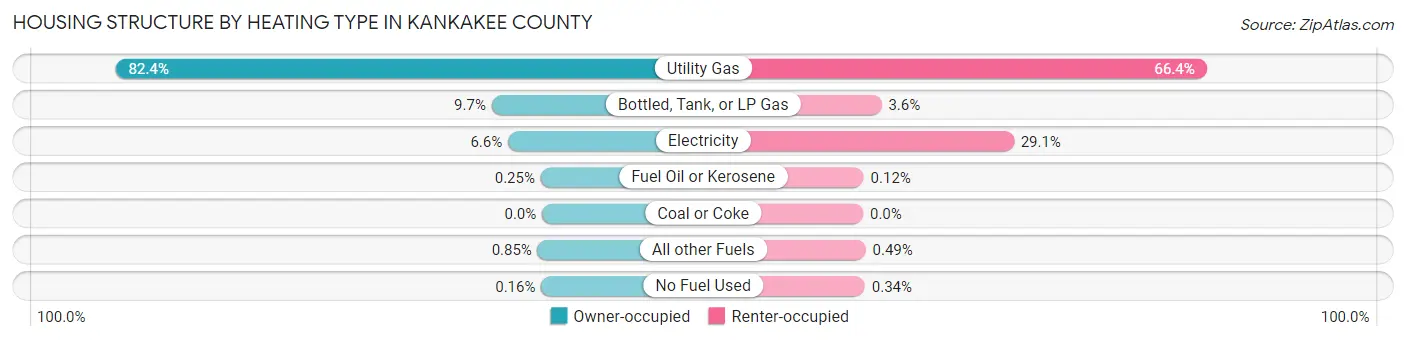
| Heating Type | Owner-occupied | Renter-occupied |
| Utility Gas | 22,778 (82.4%) | 8,601 (66.4%) |
| Bottled, Tank, or LP Gas | 2,690 (9.7%) | 461 (3.6%) |
| Electricity | 1,817 (6.6%) | 3,772 (29.1%) |
| Fuel Oil or Kerosene | 70 (0.3%) | 16 (0.1%) |
| Coal or Coke | 0 (0.0%) | 0 (0.0%) |
| All other Fuels | 234 (0.9%) | 63 (0.5%) |
| No Fuel Used | 45 (0.2%) | 44 (0.3%) |
| Total | 27,634 (100.0%) | 12,957 (100.0%) |
Household Vehicle Usage in Kankakee County
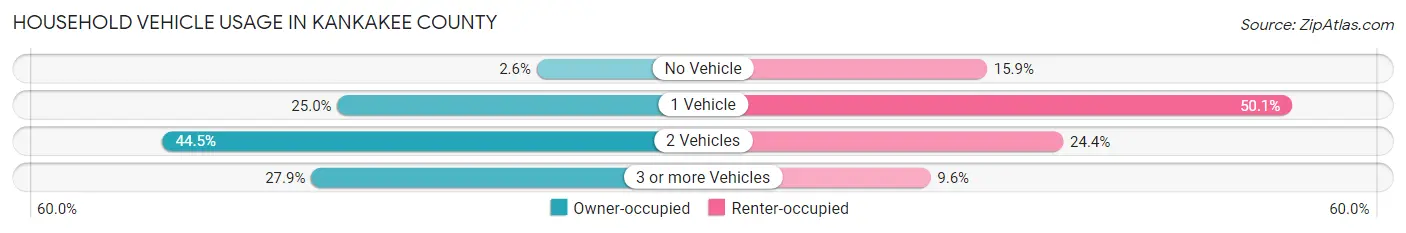
| Vehicles per Household | Owner-occupied | Renter-occupied |
| No Vehicle | 725 (2.6%) | 2,059 (15.9%) |
| 1 Vehicle | 6,898 (25.0%) | 6,491 (50.1%) |
| 2 Vehicles | 12,305 (44.5%) | 3,167 (24.4%) |
| 3 or more Vehicles | 7,706 (27.9%) | 1,240 (9.6%) |
| Total | 27,634 (100.0%) | 12,957 (100.0%) |
Real Estate & Mortgages in Kankakee County
Real Estate and Mortgage Overview in Kankakee County
| Characteristic | Without Mortgage | With Mortgage |
| Housing Units | 11,013 | 16,621 |
| Median Property Value | $153,200 | $193,300 |
| Median Household Income | $60,117 | $3,937 |
| Monthly Housing Costs | $655 | $526 |
| Real Estate Taxes | $3,179 | $260 |
Property Value by Mortgage Status in Kankakee County
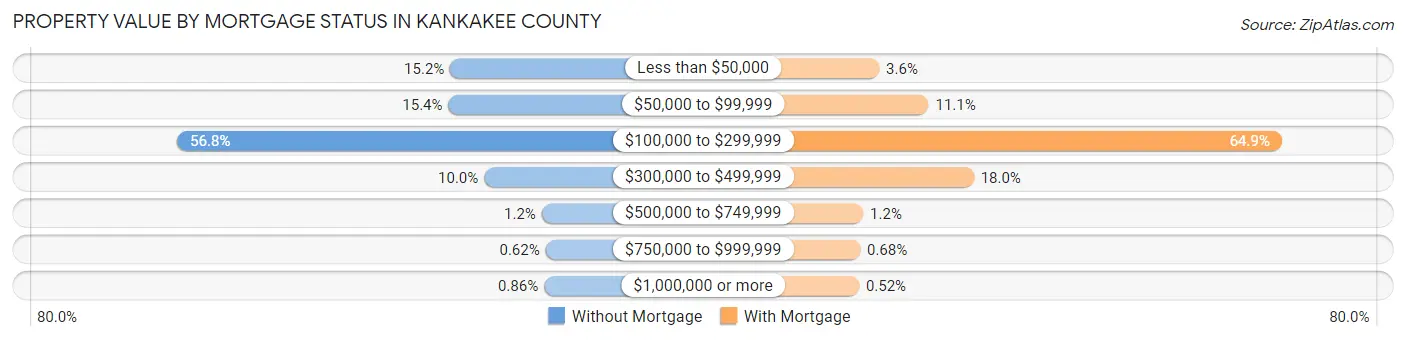
| Property Value | Without Mortgage | With Mortgage |
| Less than $50,000 | 1,669 (15.1%) | 598 (3.6%) |
| $50,000 to $99,999 | 1,699 (15.4%) | 1,848 (11.1%) |
| $100,000 to $299,999 | 6,250 (56.8%) | 10,793 (64.9%) |
| $300,000 to $499,999 | 1,099 (10.0%) | 2,991 (18.0%) |
| $500,000 to $749,999 | 133 (1.2%) | 192 (1.2%) |
| $750,000 to $999,999 | 68 (0.6%) | 113 (0.7%) |
| $1,000,000 or more | 95 (0.9%) | 86 (0.5%) |
| Total | 11,013 (100.0%) | 16,621 (100.0%) |
Household Income by Mortgage Status in Kankakee County
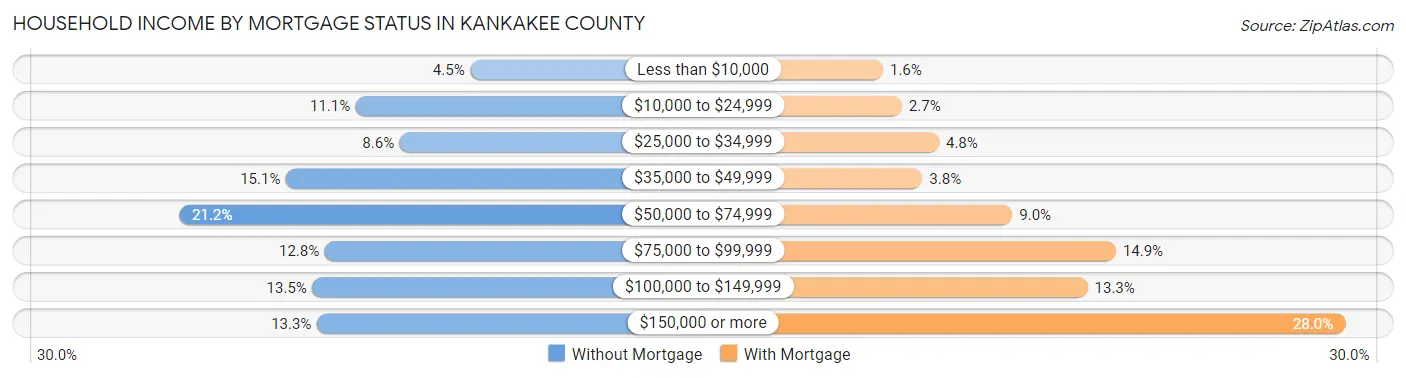
| Household Income | Without Mortgage | With Mortgage |
| Less than $10,000 | 498 (4.5%) | 261 (1.6%) |
| $10,000 to $24,999 | 1,218 (11.1%) | 441 (2.6%) |
| $25,000 to $34,999 | 942 (8.6%) | 793 (4.8%) |
| $35,000 to $49,999 | 1,658 (15.0%) | 635 (3.8%) |
| $50,000 to $74,999 | 2,331 (21.2%) | 1,489 (9.0%) |
| $75,000 to $99,999 | 1,413 (12.8%) | 2,473 (14.9%) |
| $100,000 to $149,999 | 1,491 (13.5%) | 2,204 (13.3%) |
| $150,000 or more | 1,462 (13.3%) | 4,649 (28.0%) |
| Total | 11,013 (100.0%) | 16,621 (100.0%) |
Property Value to Household Income Ratio in Kankakee County
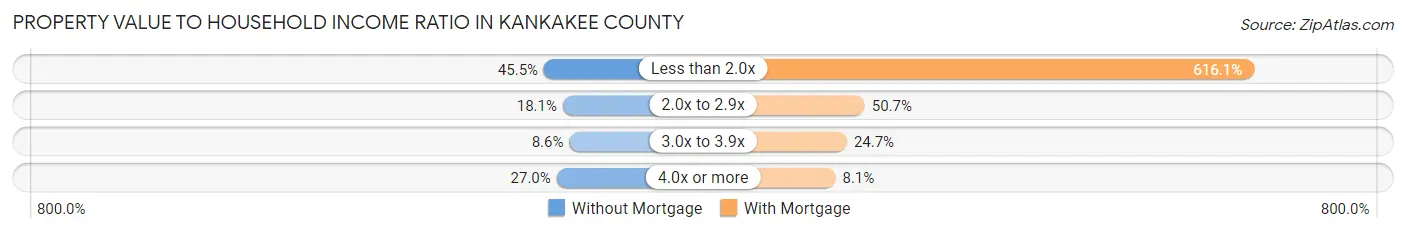
| Value-to-Income Ratio | Without Mortgage | With Mortgage |
| Less than 2.0x | 5,015 (45.5%) | 102,400 (616.1%) |
| 2.0x to 2.9x | 1,991 (18.1%) | 8,426 (50.7%) |
| 3.0x to 3.9x | 945 (8.6%) | 4,110 (24.7%) |
| 4.0x or more | 2,978 (27.0%) | 1,352 (8.1%) |
| Total | 11,013 (100.0%) | 16,621 (100.0%) |
Real Estate Taxes by Mortgage Status in Kankakee County
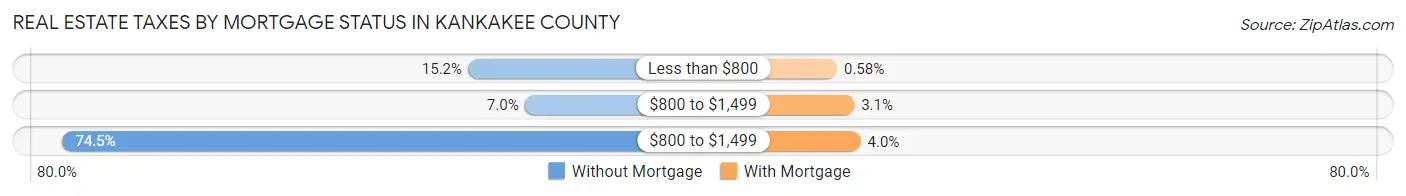
| Property Taxes | Without Mortgage | With Mortgage |
| Less than $800 | 1,677 (15.2%) | 96 (0.6%) |
| $800 to $1,499 | 767 (7.0%) | 514 (3.1%) |
| $800 to $1,499 | 8,202 (74.5%) | 669 (4.0%) |
| Total | 11,013 (100.0%) | 16,621 (100.0%) |
Health & Disability in Kankakee County
Health Insurance Coverage by Age in Kankakee County
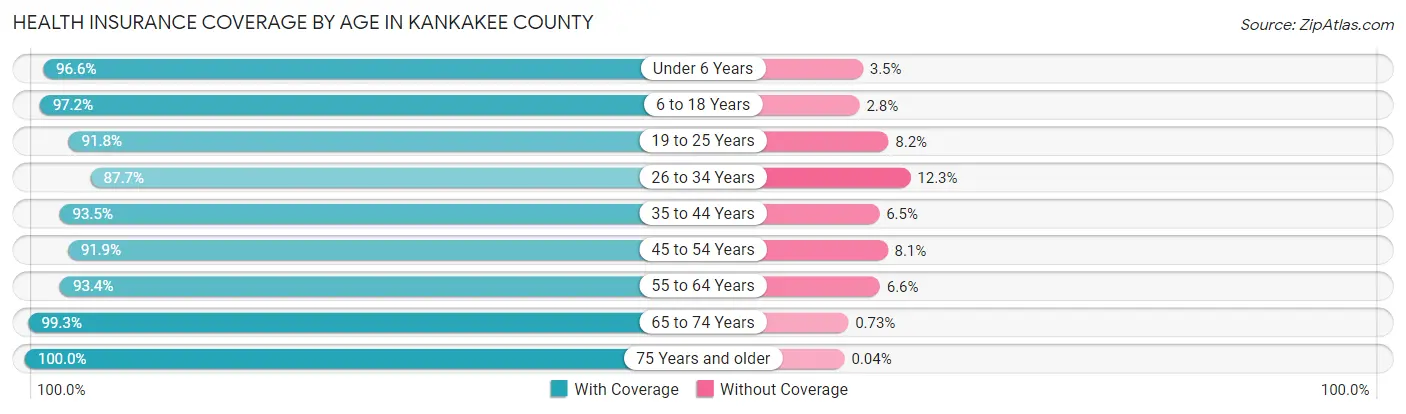
| Age Bracket | With Coverage | Without Coverage |
| Under 6 Years | 7,023 (96.6%) | 251 (3.5%) |
| 6 to 18 Years | 18,339 (97.2%) | 534 (2.8%) |
| 19 to 25 Years | 9,267 (91.8%) | 830 (8.2%) |
| 26 to 34 Years | 10,609 (87.7%) | 1,490 (12.3%) |
| 35 to 44 Years | 11,828 (93.5%) | 824 (6.5%) |
| 45 to 54 Years | 11,940 (91.9%) | 1,047 (8.1%) |
| 55 to 64 Years | 13,055 (93.4%) | 925 (6.6%) |
| 65 to 74 Years | 10,447 (99.3%) | 77 (0.7%) |
| 75 Years and older | 7,415 (100.0%) | 3 (0.0%) |
| Total | 99,923 (94.4%) | 5,981 (5.7%) |
Health Insurance Coverage by Citizenship Status in Kankakee County
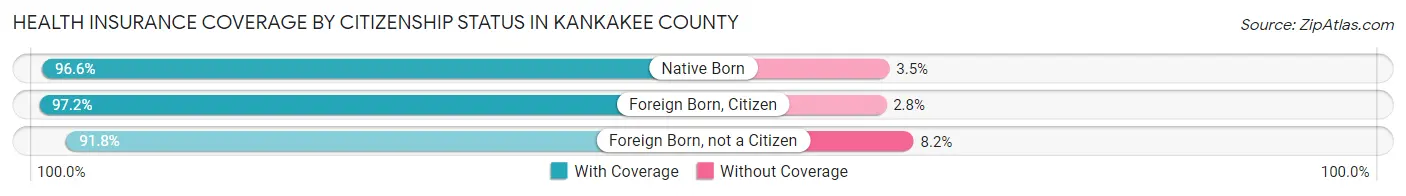
| Citizenship Status | With Coverage | Without Coverage |
| Native Born | 7,023 (96.6%) | 251 (3.5%) |
| Foreign Born, Citizen | 18,339 (97.2%) | 534 (2.8%) |
| Foreign Born, not a Citizen | 9,267 (91.8%) | 830 (8.2%) |
Health Insurance Coverage by Household Income in Kankakee County
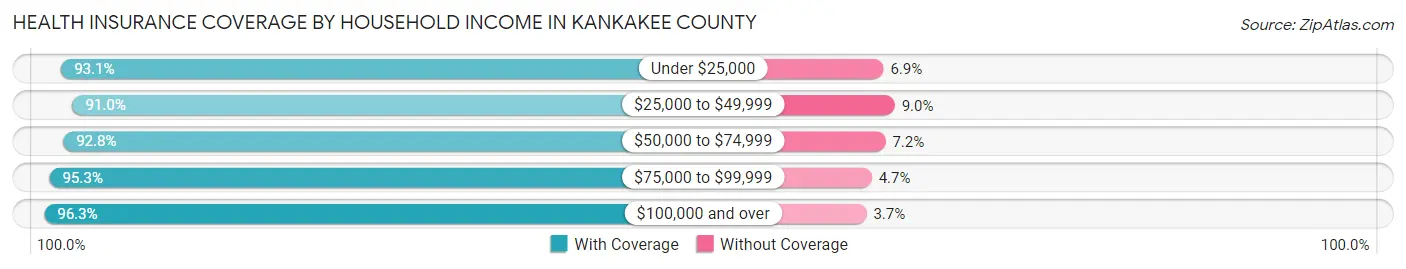
| Household Income | With Coverage | Without Coverage |
| Under $25,000 | 11,921 (93.1%) | 879 (6.9%) |
| $25,000 to $49,999 | 16,073 (91.0%) | 1,586 (9.0%) |
| $50,000 to $74,999 | 15,985 (92.8%) | 1,248 (7.2%) |
| $75,000 to $99,999 | 12,567 (95.3%) | 616 (4.7%) |
| $100,000 and over | 40,165 (96.3%) | 1,538 (3.7%) |
Public vs Private Health Insurance Coverage by Age in Kankakee County
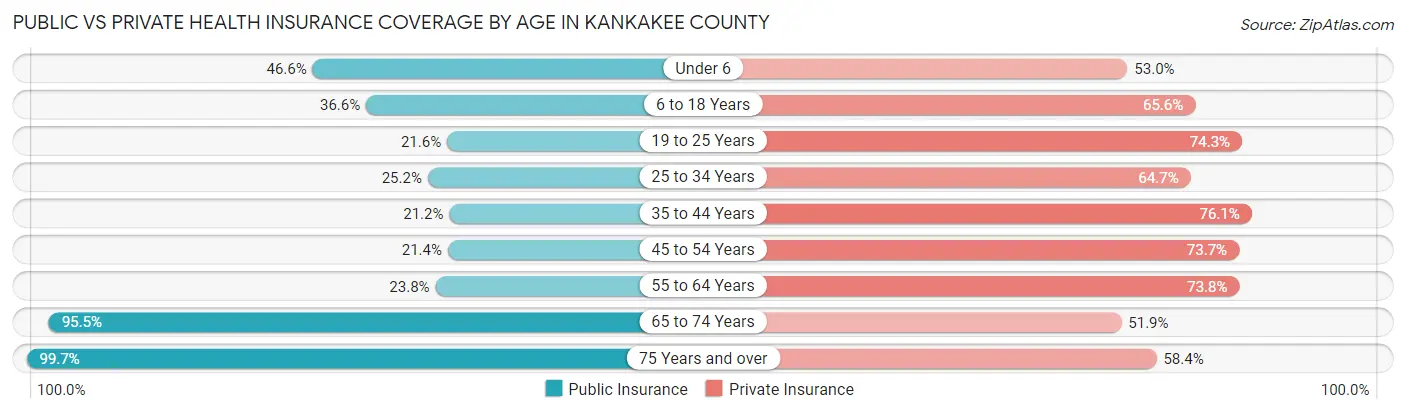
| Age Bracket | Public Insurance | Private Insurance |
| Under 6 | 3,386 (46.6%) | 3,856 (53.0%) |
| 6 to 18 Years | 6,912 (36.6%) | 12,373 (65.6%) |
| 19 to 25 Years | 2,181 (21.6%) | 7,498 (74.3%) |
| 25 to 34 Years | 3,045 (25.2%) | 7,830 (64.7%) |
| 35 to 44 Years | 2,679 (21.2%) | 9,624 (76.1%) |
| 45 to 54 Years | 2,785 (21.4%) | 9,571 (73.7%) |
| 55 to 64 Years | 3,320 (23.7%) | 10,313 (73.8%) |
| 65 to 74 Years | 10,053 (95.5%) | 5,461 (51.9%) |
| 75 Years and over | 7,392 (99.7%) | 4,333 (58.4%) |
| Total | 41,753 (39.4%) | 70,859 (66.9%) |
Disability Status by Sex by Age in Kankakee County
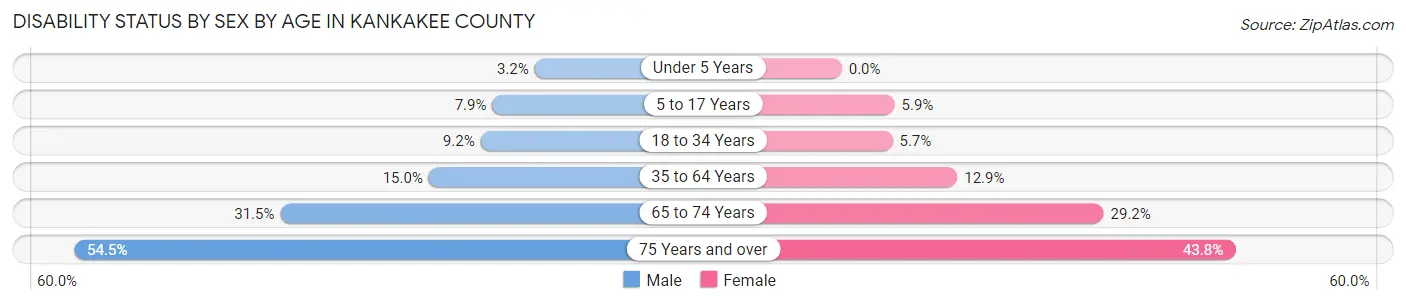
| Age Bracket | Male | Female |
| Under 5 Years | 101 (3.2%) | 0 (0.0%) |
| 5 to 17 Years | 742 (7.9%) | 526 (5.9%) |
| 18 to 34 Years | 1,103 (9.2%) | 670 (5.7%) |
| 35 to 64 Years | 2,928 (15.0%) | 2,584 (12.9%) |
| 65 to 74 Years | 1,596 (31.5%) | 1,592 (29.2%) |
| 75 Years and over | 1,668 (54.5%) | 1,908 (43.8%) |
Disability Class by Sex by Age in Kankakee County
Disability Class: Hearing Difficulty
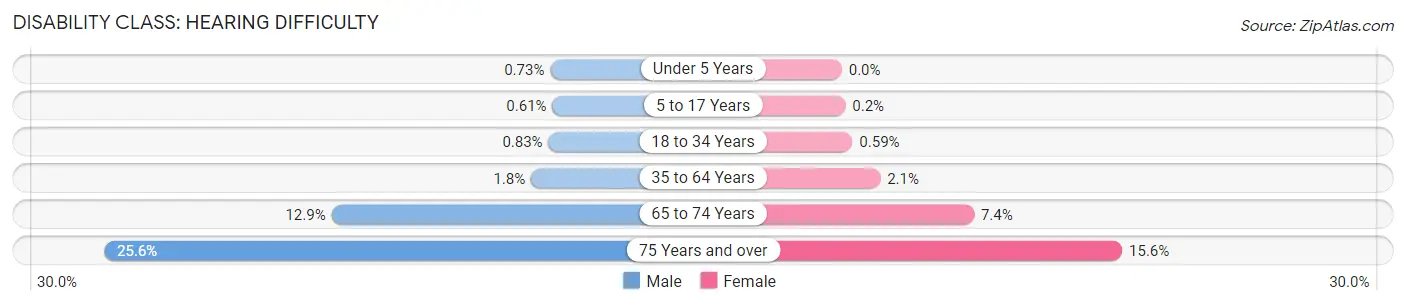
| Age Bracket | Male | Female |
| Under 5 Years | 23 (0.7%) | 0 (0.0%) |
| 5 to 17 Years | 57 (0.6%) | 18 (0.2%) |
| 18 to 34 Years | 99 (0.8%) | 70 (0.6%) |
| 35 to 64 Years | 351 (1.8%) | 429 (2.1%) |
| 65 to 74 Years | 654 (12.9%) | 402 (7.4%) |
| 75 Years and over | 783 (25.6%) | 680 (15.6%) |
Disability Class: Vision Difficulty
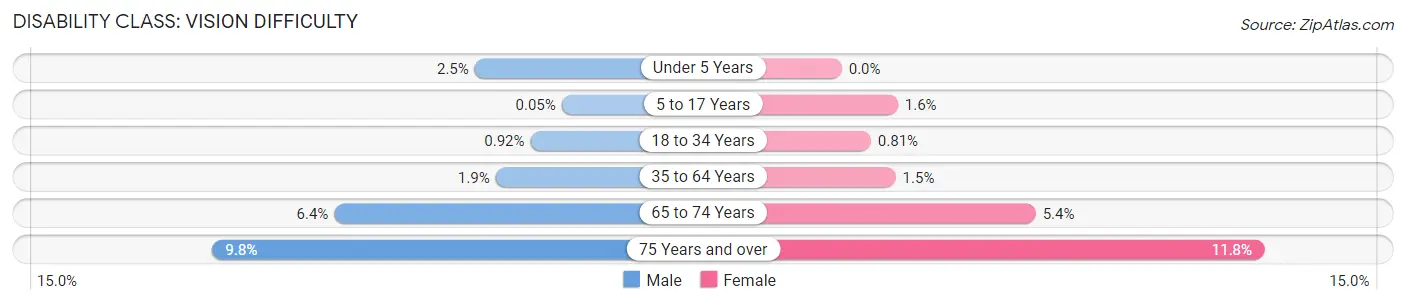
| Age Bracket | Male | Female |
| Under 5 Years | 78 (2.5%) | 0 (0.0%) |
| 5 to 17 Years | 5 (0.1%) | 140 (1.6%) |
| 18 to 34 Years | 110 (0.9%) | 96 (0.8%) |
| 35 to 64 Years | 369 (1.9%) | 301 (1.5%) |
| 65 to 74 Years | 323 (6.4%) | 295 (5.4%) |
| 75 Years and over | 299 (9.8%) | 512 (11.7%) |
Disability Class: Cognitive Difficulty
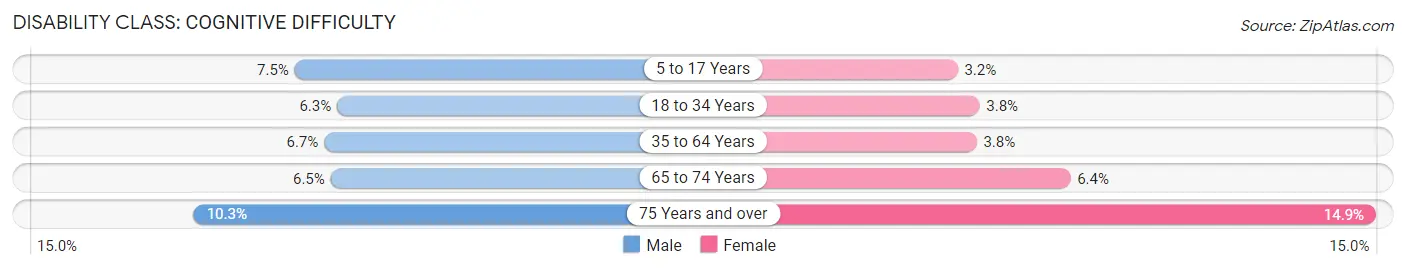
| Age Bracket | Male | Female |
| 5 to 17 Years | 702 (7.5%) | 288 (3.2%) |
| 18 to 34 Years | 753 (6.3%) | 454 (3.8%) |
| 35 to 64 Years | 1,300 (6.7%) | 753 (3.7%) |
| 65 to 74 Years | 328 (6.5%) | 347 (6.4%) |
| 75 Years and over | 315 (10.3%) | 648 (14.9%) |
Disability Class: Ambulatory Difficulty
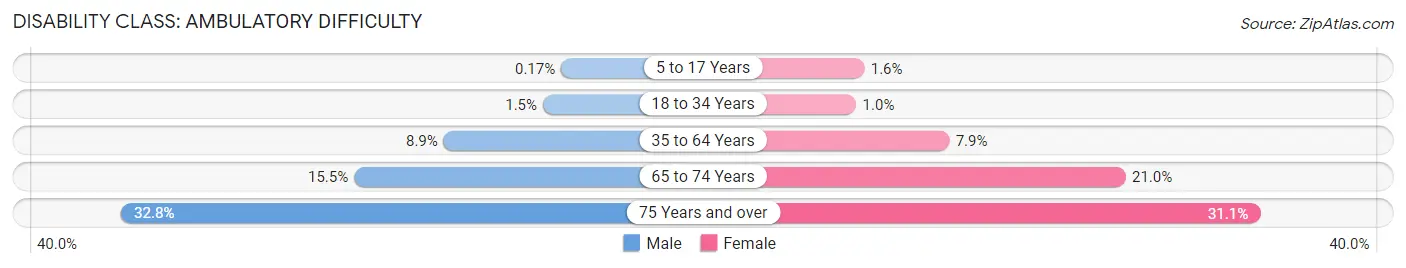
| Age Bracket | Male | Female |
| 5 to 17 Years | 16 (0.2%) | 146 (1.6%) |
| 18 to 34 Years | 182 (1.5%) | 122 (1.0%) |
| 35 to 64 Years | 1,735 (8.9%) | 1,596 (7.9%) |
| 65 to 74 Years | 787 (15.5%) | 1,148 (21.0%) |
| 75 Years and over | 1,005 (32.8%) | 1,353 (31.0%) |
Disability Class: Self-Care Difficulty
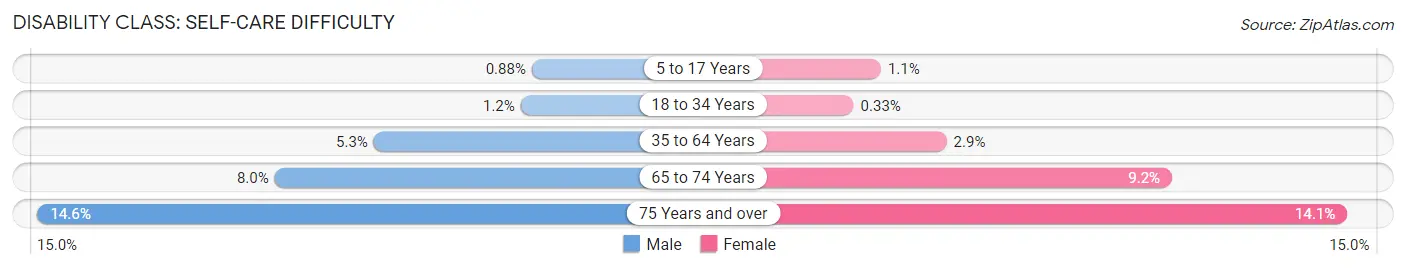
| Age Bracket | Male | Female |
| 5 to 17 Years | 83 (0.9%) | 98 (1.1%) |
| 18 to 34 Years | 142 (1.2%) | 39 (0.3%) |
| 35 to 64 Years | 1,031 (5.3%) | 587 (2.9%) |
| 65 to 74 Years | 407 (8.0%) | 502 (9.2%) |
| 75 Years and over | 448 (14.6%) | 613 (14.1%) |
Technology Access in Kankakee County
Computing Device Access in Kankakee County
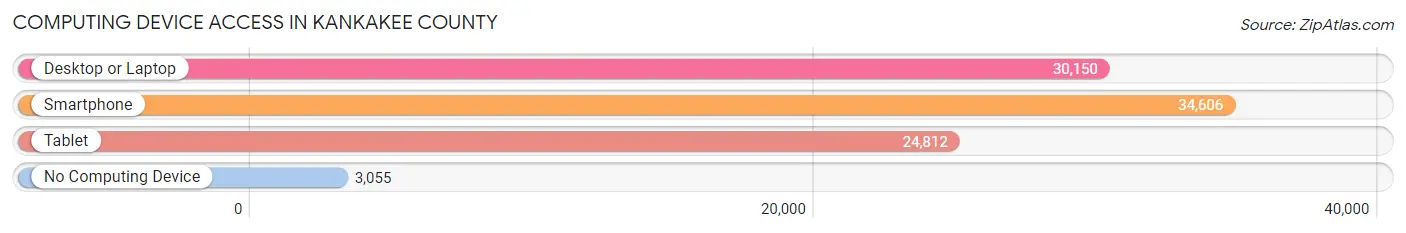
| Device Type | # Households | % Households |
| Desktop or Laptop | 30,150 | 74.3% |
| Smartphone | 34,606 | 85.3% |
| Tablet | 24,812 | 61.1% |
| No Computing Device | 3,055 | 7.5% |
| Total | 40,591 | 100.0% |
Internet Access in Kankakee County
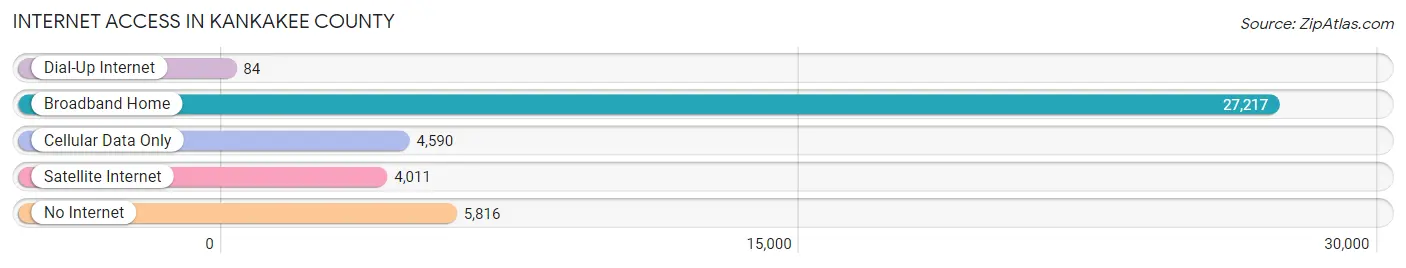
| Internet Type | # Households | % Households |
| Dial-Up Internet | 84 | 0.2% |
| Broadband Home | 27,217 | 67.0% |
| Cellular Data Only | 4,590 | 11.3% |
| Satellite Internet | 4,011 | 9.9% |
| No Internet | 5,816 | 14.3% |
| Total | 40,591 | 100.0% |
Kankakee County Summary
Kankakee County, Illinois is located in the northeastern part of the state, about 60 miles south of Chicago. It is bordered by Will County to the north, Iroquois County to the east, Ford County to the south, and Grundy County to the west. The county seat is Kankakee, and the county has a population of 113,449 as of the 2010 census.
History
Kankakee County was formed in 1853 from parts of Iroquois and Will counties. The county was named after the Kankakee River, which runs through the county. The river was named by the Potawatomi Indians, who lived in the area before the arrival of European settlers.
The first settlers in the area were French fur traders, who arrived in the late 1700s. The first permanent settlers were German immigrants, who arrived in the early 1800s. The county was largely agricultural, and the main crops were corn, wheat, and oats.
In the late 1800s, the county began to industrialize, with the construction of the Kankakee and Seneca Railroad in 1871. This allowed for the transportation of goods and people to and from the county. The railroad also helped to spur the growth of the city of Kankakee, which became the county seat in 1853.
Geography
Kankakee County is located in the northeastern part of Illinois, about 60 miles south of Chicago. It is bordered by Will County to the north, Iroquois County to the east, Ford County to the south, and Grundy County to the west. The county has a total area of 576 square miles, of which 574 square miles is land and 2 square miles is water.
The Kankakee River runs through the county, and is the main source of water for the area. The river is fed by several tributaries, including the Iroquois River, the Vermilion River, and the Kankakee Creek. The county also contains several small lakes, including Lake Chautauqua, Lake Iroquois, and Lake Seneca.
Economy
Kankakee County has a diverse economy, with a mix of manufacturing, agriculture, and services. The county’s largest employers are Kankakee Community College, Riverside Medical Center, and Kankakee Valley Park District.
Agriculture is an important part of the county’s economy, with corn, soybeans, and wheat being the main crops. Livestock production is also important, with cattle, hogs, and poultry being the main animals raised.
Manufacturing is also an important part of the county’s economy, with companies such as Kankakee Manufacturing, Kankakee Machine Works, and Kankakee Steel Fabricators located in the county.
Demographics
As of the 2010 census, Kankakee County had a population of 113,449. The racial makeup of the county was 79.2% White, 15.3% African American, 0.5% Native American, 0.7% Asian, 0.1% Pacific Islander, 2.2% from other races, and 2.1% from two or more races. Hispanic or Latino of any race were 5.3% of the population.
The median income for a household in the county was $45,945, and the median income for a family was $54,945. The per capita income for the county was $21,945. About 11.2% of families and 14.3% of the population were below the poverty line, including 19.2% of those under age 18 and 8.2% of those age 65 or over.
Common Questions
What is the Total Population of Kankakee County?
Total Population of Kankakee County is 107,421.
What is the Total Male Population of Kankakee County?
Total Male Population of Kankakee County is 53,263.
What is the Total Female Population of Kankakee County?
Total Female Population of Kankakee County is 54,158.
What is the Ratio of Males per 100 Females in Kankakee County?
There are 98.35 Males per 100 Females in Kankakee County.
What is the Ratio of Females per 100 Males in Kankakee County?
There are 101.68 Females per 100 Males in Kankakee County.
What is the Median Population Age in Kankakee County?
Median Population Age in Kankakee County is 38.9 Years.
What is the Average Family Size in Kankakee County
Average Family Size in Kankakee County is 3.1 People.
What is the Average Household Size in Kankakee County
Average Household Size in Kankakee County is 2.5 People.
What is Per Capita Income in Kankakee County?
Per Capita income in Kankakee County is $32,941.
What is the Median Family Income in Kankakee County?
Median Family Income in Kankakee County is $83,359.
What is the Median Household income in Kankakee County?
Median Household Income in Kankakee County is $65,489.
What is Income or Wage Gap in Kankakee County?
Income or Wage Gap in Kankakee County is 32.6%.
Women in Kankakee County earn 67.4 cents for every dollar earned by a man.
What is Family Income Deficit in Kankakee County?
Family Income Deficit in Kankakee County is $11,844.
Families that are below poverty line in Kankakee County earn $11,844 less on average than the poverty threshold level.
What is Inequality or Gini Index in Kankakee County?
Inequality or Gini Index in Kankakee County is 0.44.
How Large is the Labor Force in Kankakee County?
There are 52,818 People in the Labor Forcein in Kankakee County.
What is the Percentage of People in the Labor Force in Kankakee County?
61.4% of People are in the Labor Force in Kankakee County.
What is the Unemployment Rate in Kankakee County?
Unemployment Rate in Kankakee County is 5.2%.