Henry County, IL
Henry County Map
Henry County Overview
49,157
TOTAL POPULATION
24,530
MALE POPULATION
24,627
FEMALE POPULATION
99.61
MALES / 100 FEMALES
100.40
FEMALES / 100 MALES
43.5
MEDIAN AGE
3.0
AVG FAMILY SIZE
2.4
AVG HOUSEHOLD SIZE
$37,212
PER CAPITA INCOME
$86,547
AVG FAMILY INCOME
$66,313
AVG HOUSEHOLD INCOME
33.2%
WAGE / INCOME GAP [ % ]
66.8¢/ $1
WAGE / INCOME GAP [ $ ]
$11,031
FAMILY INCOME DEFICIT
0.44
INEQUALITY / GINI INDEX
24,490
LABOR FORCE [ PEOPLE ]
61.6%
PERCENT IN LABOR FORCE
4.5%
UNEMPLOYMENT RATE
Race in Henry County
The most populous races in Henry County are White / Caucasian (44,291 | 90.1%), Hispanic or Latino (3,067 | 6.2%), and Two or more Races (2,225 | 4.5%).
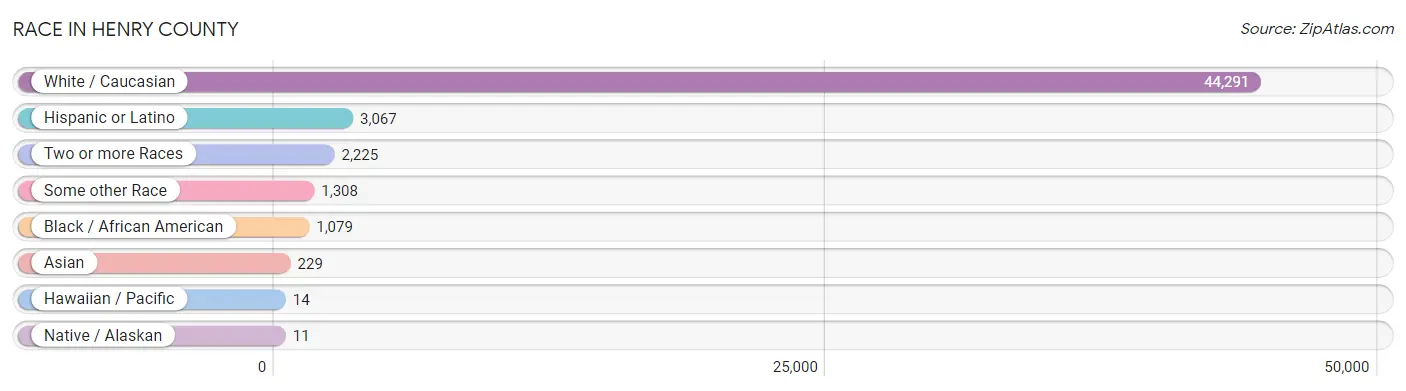
| Race | # Population | % Population |
| Asian | 229 | 0.5% |
| Black / African American | 1,079 | 2.2% |
| Hawaiian / Pacific | 14 | 0.0% |
| Hispanic or Latino | 3,067 | 6.2% |
| Native / Alaskan | 11 | 0.0% |
| White / Caucasian | 44,291 | 90.1% |
| Two or more Races | 2,225 | 4.5% |
| Some other Race | 1,308 | 2.7% |
| Total | 49,157 | 100.0% |
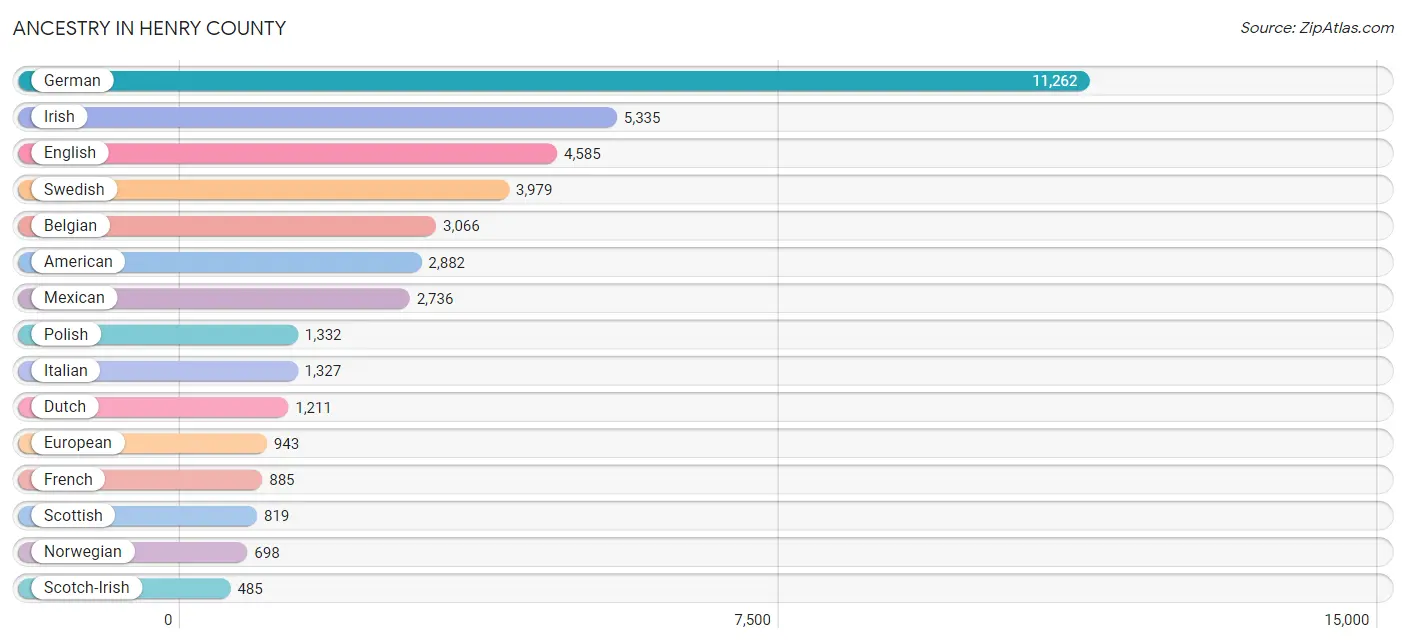
Ancestry in Henry County
The most populous ancestries reported in Henry County are German (11,262 | 22.9%), Irish (5,335 | 10.8%), English (4,585 | 9.3%), Swedish (3,979 | 8.1%), and Belgian (3,066 | 6.2%), together accounting for 57.4% of all Henry County residents.
| Ancestry | # Population | % Population |
| African | 5 | 0.0% |
| Alsatian | 6 | 0.0% |
| American | 2,882 | 5.9% |
| Apache | 6 | 0.0% |
| Arab | 5 | 0.0% |
| Armenian | 1 | 0.0% |
| Australian | 4 | 0.0% |
| Austrian | 61 | 0.1% |
| Belgian | 3,066 | 6.2% |
| Belizean | 27 | 0.1% |
| Bhutanese | 11 | 0.0% |
| Blackfeet | 21 | 0.0% |
| British | 261 | 0.5% |
| Burmese | 42 | 0.1% |
| Canadian | 51 | 0.1% |
| Celtic | 5 | 0.0% |
| Central American | 20 | 0.0% |
| Cherokee | 167 | 0.3% |
| Chippewa | 9 | 0.0% |
| Colombian | 22 | 0.0% |
| Croatian | 76 | 0.2% |
| Czech | 274 | 0.6% |
| Czechoslovakian | 124 | 0.3% |
| Danish | 316 | 0.6% |
| Dutch | 1,211 | 2.5% |
| Eastern European | 70 | 0.1% |
| English | 4,585 | 9.3% |
| Estonian | 12 | 0.0% |
| European | 943 | 1.9% |
| Finnish | 18 | 0.0% |
| French | 885 | 1.8% |
| French Canadian | 125 | 0.3% |
| German | 11,262 | 22.9% |
| Greek | 101 | 0.2% |
| Haitian | 9 | 0.0% |
| Honduran | 15 | 0.0% |
| Hungarian | 127 | 0.3% |
| Indian (Asian) | 95 | 0.2% |
| Iranian | 15 | 0.0% |
| Irish | 5,335 | 10.8% |
| Italian | 1,327 | 2.7% |
| Jamaican | 4 | 0.0% |
| Japanese | 31 | 0.1% |
| Korean | 154 | 0.3% |
| Lebanese | 5 | 0.0% |
| Lithuanian | 224 | 0.5% |
| Lumbee | 3 | 0.0% |
| Luxembourger | 15 | 0.0% |
| Mexican | 2,736 | 5.6% |
| Mongolian | 12 | 0.0% |
| Native Hawaiian | 15 | 0.0% |
| Navajo | 171 | 0.4% |
| Northern European | 24 | 0.1% |
| Norwegian | 698 | 1.4% |
| Pennsylvania German | 29 | 0.1% |
| Polish | 1,332 | 2.7% |
| Portuguese | 32 | 0.1% |
| Puerto Rican | 191 | 0.4% |
| Romanian | 21 | 0.0% |
| Russian | 36 | 0.1% |
| Salvadoran | 5 | 0.0% |
| Scandinavian | 328 | 0.7% |
| Scotch-Irish | 485 | 1.0% |
| Scottish | 819 | 1.7% |
| Sioux | 2 | 0.0% |
| Slovak | 136 | 0.3% |
| Slovene | 6 | 0.0% |
| South American | 22 | 0.0% |
| Spaniard | 36 | 0.1% |
| Spanish | 5 | 0.0% |
| Spanish American | 22 | 0.0% |
| Sri Lankan | 68 | 0.1% |
| Subsaharan African | 8 | 0.0% |
| Swedish | 3,979 | 8.1% |
| Swiss | 117 | 0.2% |
| Thai | 25 | 0.1% |
| Tongan | 14 | 0.0% |
| Ukrainian | 16 | 0.0% |
| Welsh | 372 | 0.8% |
| West Indian | 9 | 0.0% |
| Yugoslavian | 4 | 0.0% | View All 81 Rows |
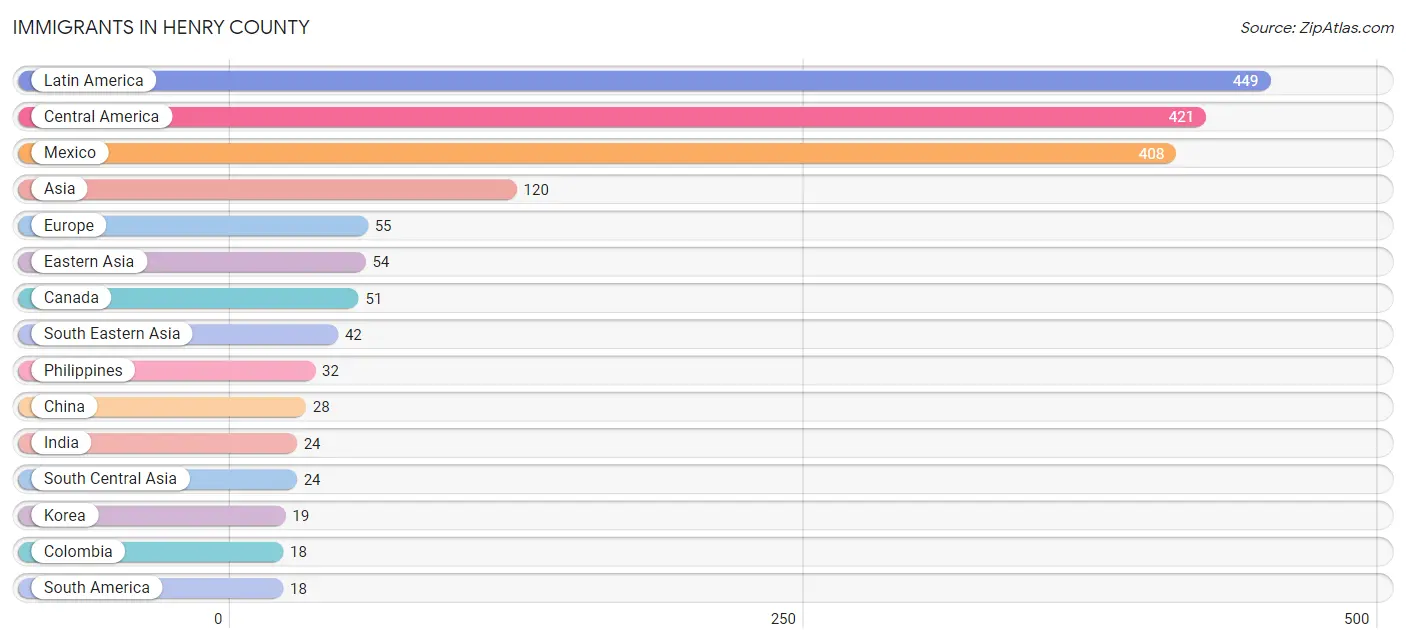
Immigrants in Henry County
The most numerous immigrant groups reported in Henry County came from Latin America (449 | 0.9%), Central America (421 | 0.9%), Mexico (408 | 0.8%), Asia (120 | 0.2%), and Europe (55 | 0.1%), together accounting for 3.0% of all Henry County residents.
| Immigration Origin | # Population | % Population |
| Africa | 12 | 0.0% |
| Asia | 120 | 0.2% |
| Austria | 12 | 0.0% |
| Belize | 8 | 0.0% |
| Canada | 51 | 0.1% |
| Caribbean | 10 | 0.0% |
| Central America | 421 | 0.9% |
| China | 28 | 0.1% |
| Colombia | 18 | 0.0% |
| Denmark | 2 | 0.0% |
| Eastern Africa | 3 | 0.0% |
| Eastern Asia | 54 | 0.1% |
| Eastern Europe | 11 | 0.0% |
| El Salvador | 5 | 0.0% |
| England | 8 | 0.0% |
| Europe | 55 | 0.1% |
| Germany | 2 | 0.0% |
| Haiti | 6 | 0.0% |
| Hungary | 5 | 0.0% |
| India | 24 | 0.1% |
| Jamaica | 4 | 0.0% |
| Japan | 7 | 0.0% |
| Korea | 19 | 0.0% |
| Latin America | 449 | 0.9% |
| Mexico | 408 | 0.8% |
| Northern Europe | 12 | 0.0% |
| Philippines | 32 | 0.1% |
| Poland | 6 | 0.0% |
| Portugal | 12 | 0.0% |
| South Africa | 9 | 0.0% |
| South America | 18 | 0.0% |
| South Central Asia | 24 | 0.1% |
| South Eastern Asia | 42 | 0.1% |
| Southern Europe | 18 | 0.0% |
| Spain | 6 | 0.0% |
| Vietnam | 10 | 0.0% |
| Western Europe | 14 | 0.0% | View All 37 Rows |
Sex and Age in Henry County
Sex and Age in Henry County
The most populous age groups in Henry County are 55 to 59 Years (1,873 | 7.6%) for men and 60 to 64 Years (1,831 | 7.4%) for women.
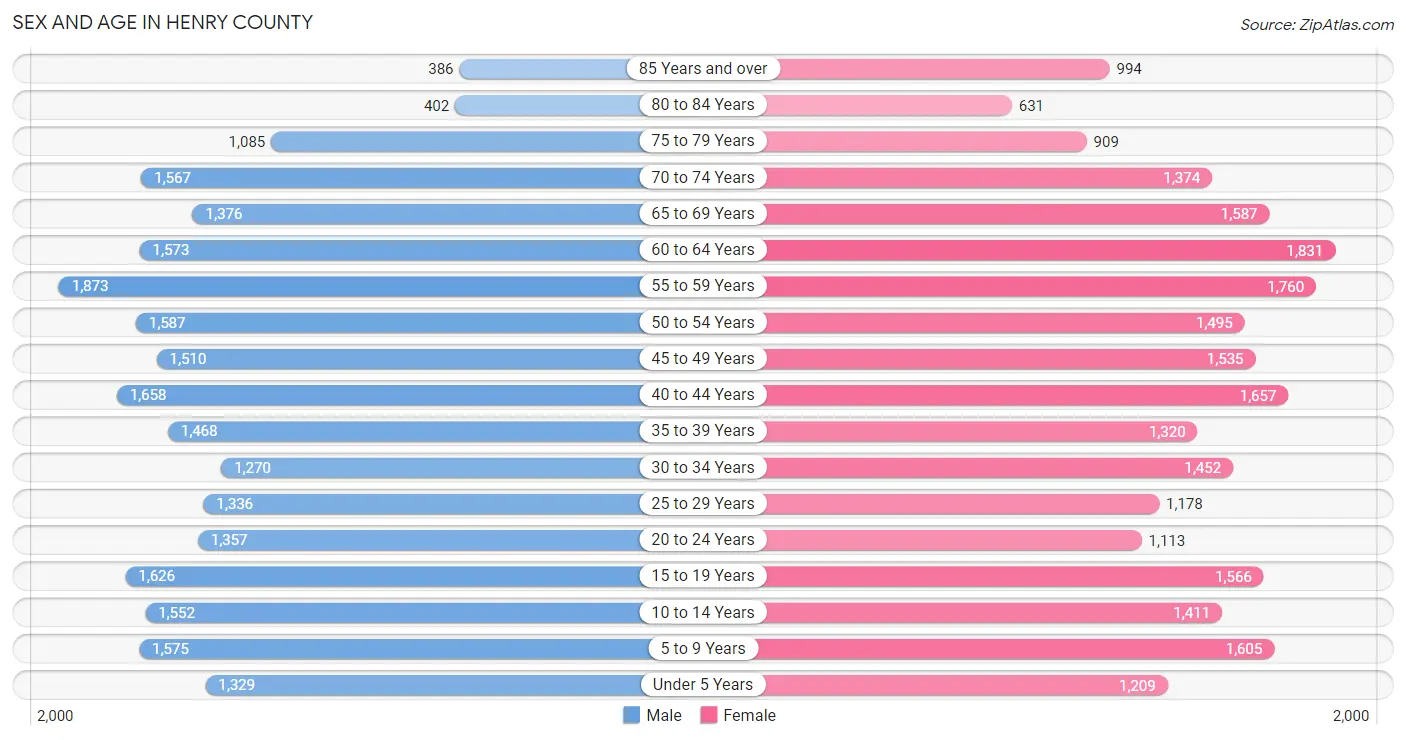
| Age Bracket | Male | Female |
| Under 5 Years | 1,329 (5.4%) | 1,209 (4.9%) |
| 5 to 9 Years | 1,575 (6.4%) | 1,605 (6.5%) |
| 10 to 14 Years | 1,552 (6.3%) | 1,411 (5.7%) |
| 15 to 19 Years | 1,626 (6.6%) | 1,566 (6.4%) |
| 20 to 24 Years | 1,357 (5.5%) | 1,113 (4.5%) |
| 25 to 29 Years | 1,336 (5.4%) | 1,178 (4.8%) |
| 30 to 34 Years | 1,270 (5.2%) | 1,452 (5.9%) |
| 35 to 39 Years | 1,468 (6.0%) | 1,320 (5.4%) |
| 40 to 44 Years | 1,658 (6.8%) | 1,657 (6.7%) |
| 45 to 49 Years | 1,510 (6.2%) | 1,535 (6.2%) |
| 50 to 54 Years | 1,587 (6.5%) | 1,495 (6.1%) |
| 55 to 59 Years | 1,873 (7.6%) | 1,760 (7.1%) |
| 60 to 64 Years | 1,573 (6.4%) | 1,831 (7.4%) |
| 65 to 69 Years | 1,376 (5.6%) | 1,587 (6.4%) |
| 70 to 74 Years | 1,567 (6.4%) | 1,374 (5.6%) |
| 75 to 79 Years | 1,085 (4.4%) | 909 (3.7%) |
| 80 to 84 Years | 402 (1.6%) | 631 (2.6%) |
| 85 Years and over | 386 (1.6%) | 994 (4.0%) |
| Total | 24,530 (100.0%) | 24,627 (100.0%) |
Families and Households in Henry County
Median Family Size in Henry County
The median family size in Henry County is 2.96 persons per family, with single female/mother families (1,963 | 14.8%) accounting for the largest median family size of 3.17 persons per family. On the other hand, single male/father families (989 | 7.4%) represent the smallest median family size with 2.87 persons per family.
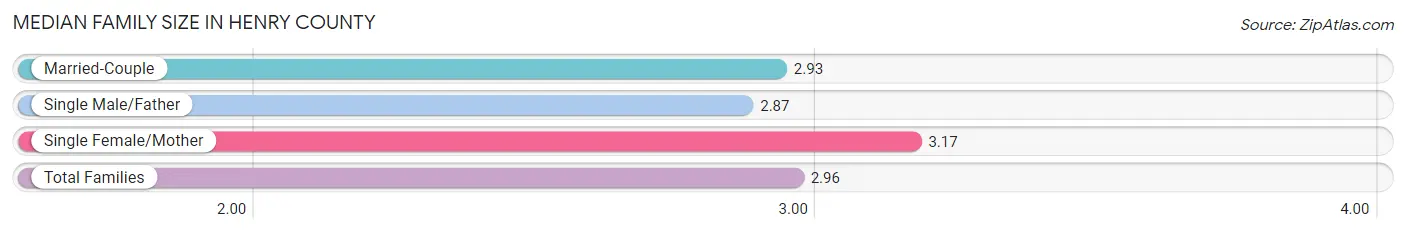
| Family Type | # Families | Family Size |
| Married-Couple | 10,322 (77.8%) | 2.93 |
| Single Male/Father | 989 (7.4%) | 2.87 |
| Single Female/Mother | 1,963 (14.8%) | 3.17 |
| Total Families | 13,274 (100.0%) | 2.96 |
Median Household Size in Henry County
The median household size in Henry County is 2.40 persons per household, with single female/mother households (1,963 | 9.7%) accounting for the largest median household size of 3.47 persons per household. non-family households (6,913 | 34.2%) represent the smallest median household size with 1.15 persons per household.
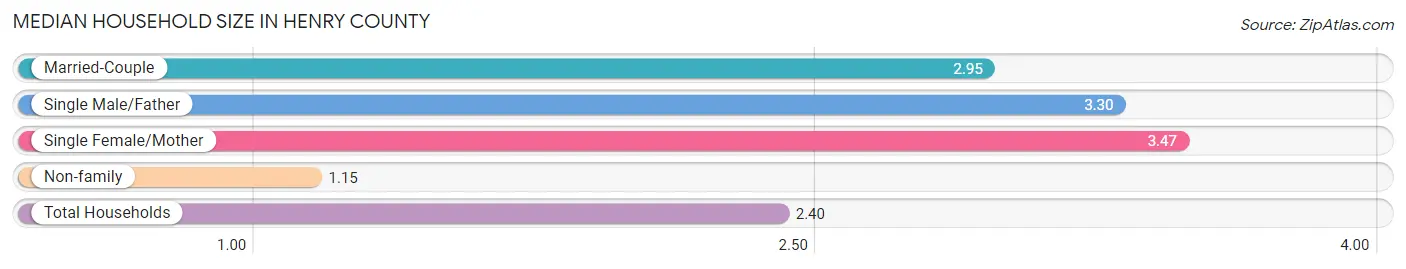
| Household Type | # Households | Household Size |
| Married-Couple | 10,322 (51.1%) | 2.95 |
| Single Male/Father | 989 (4.9%) | 3.30 |
| Single Female/Mother | 1,963 (9.7%) | 3.47 |
| Non-family | 6,913 (34.2%) | 1.15 |
| Total Households | 20,187 (100.0%) | 2.40 |
Household Size by Marriage Status in Henry County
Out of a total of 20,187 households in Henry County, 13,274 (65.8%) are family households, while 6,913 (34.2%) are nonfamily households. The most numerous type of family households are 2-person households, comprising 6,389, and the most common type of nonfamily households are 1-person households, comprising 5,977.
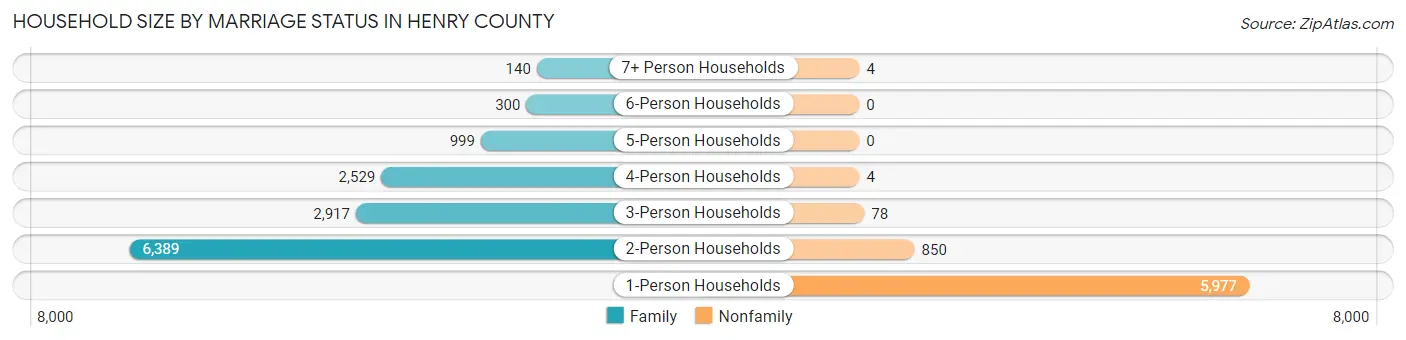
| Household Size | Family Households | Nonfamily Households |
| 1-Person Households | - | 5,977 (29.6%) |
| 2-Person Households | 6,389 (31.7%) | 850 (4.2%) |
| 3-Person Households | 2,917 (14.4%) | 78 (0.4%) |
| 4-Person Households | 2,529 (12.5%) | 4 (0.0%) |
| 5-Person Households | 999 (5.0%) | 0 (0.0%) |
| 6-Person Households | 300 (1.5%) | 0 (0.0%) |
| 7+ Person Households | 140 (0.7%) | 4 (0.0%) |
| Total | 13,274 (65.8%) | 6,913 (34.2%) |
Female Fertility in Henry County
Fertility by Age in Henry County
Average fertility rate in Henry County is 40.0 births per 1,000 women. Women in the age bracket of 20 to 34 years have the highest fertility rate with 82.0 births per 1,000 women. Women in the age bracket of 20 to 34 years acount for 76.6% of all women with births.

| Age Bracket | Women with Births | Births / 1,000 Women |
| 15 to 19 years | 12 (3.0%) | 8.0 |
| 20 to 34 years | 308 (76.6%) | 82.0 |
| 35 to 50 years | 82 (20.4%) | 17.0 |
| Total | 402 (100.0%) | 40.0 |
Fertility by Age by Marriage Status in Henry County
60.9% of women with births (402) in Henry County are married. The highest percentage of unmarried women with births falls into 15 to 19 years age bracket with 100.0% of them unmarried at the time of birth, while the lowest percentage of unmarried women with births belong to 35 to 50 years age bracket with 23.2% of them unmarried.
| Age Bracket | Married | Unmarried |
| 15 to 19 years | 0 (0.0%) | 12 (100.0%) |
| 20 to 34 years | 182 (59.1%) | 126 (40.9%) |
| 35 to 50 years | 63 (76.8%) | 19 (23.2%) |
| Total | 245 (61.0%) | 157 (39.1%) |
Fertility by Education in Henry County
Average fertility rate in Henry County is 40.0 births per 1,000 women. Women with the education attainment of graduate degree have the highest fertility rate of 84.0 births per 1,000 women, while women with the education attainment of bachelor's degree have the lowest fertility at 15.0 births per 1,000 women. Women with the education attainment of college or associate's degree represent 32.3% of all women with births.
| Educational Attainment | Women with Births | Births / 1,000 Women |
| Less than High School | 87 (21.6%) | 48.0 |
| High School Diploma | 76 (18.9%) | 34.0 |
| College or Associate's Degree | 130 (32.3%) | 40.0 |
| Bachelor's Degree | 30 (7.5%) | 15.0 |
| Graduate Degree | 79 (19.7%) | 84.0 |
| Total | 402 (100.0%) | 40.0 |
Fertility by Education by Marriage Status in Henry County
39.1% of women with births in Henry County are unmarried. Women with the educational attainment of graduate degree are most likely to be married with 100.0% of them married at childbirth, while women with the educational attainment of high school diploma are least likely to be married with 93.4% of them unmarried at childbirth.
| Educational Attainment | Married | Unmarried |
| Less than High School | 40 (46.0%) | 47 (54.0%) |
| High School Diploma | 5 (6.6%) | 71 (93.4%) |
| College or Associate's Degree | 93 (71.5%) | 37 (28.5%) |
| Bachelor's Degree | 28 (93.3%) | 2 (6.7%) |
| Graduate Degree | 79 (100.0%) | 0 (0.0%) |
| Total | 245 (61.0%) | 157 (39.1%) |
Income in Henry County
Income Overview in Henry County
Per Capita Income in Henry County is $37,212, while median incomes of families and households are $86,547 and $66,313 respectively.
| Characteristic | Number | Measure |
| Per Capita Income | 49,157 | $37,212 |
| Median Family Income | 13,274 | $86,547 |
| Mean Family Income | 13,274 | $106,921 |
| Median Household Income | 20,187 | $66,313 |
| Mean Household Income | 20,187 | $88,220 |
| Income Deficit | 13,274 | $11,031 |
| Wage / Income Gap (%) | 49,157 | 33.19% |
| Wage / Income Gap ($) | 49,157 | 66.81¢ per $1 |
| Gini / Inequality Index | 49,157 | 0.44 |
Earnings by Sex in Henry County
Average Earnings in Henry County are $42,640, $50,937 for men and $34,031 for women, a difference of 33.2%.
| Sex | Number | Average Earnings |
| Male | 13,362 (52.5%) | $50,937 |
| Female | 12,082 (47.5%) | $34,031 |
| Total | 25,444 (100.0%) | $42,640 |
Earnings by Sex by Income Bracket in Henry County
The most common earnings brackets in Henry County are $100,000+ for men (2,238 | 16.8%) and $45,000 to $49,999 for women (1,004 | 8.3%).
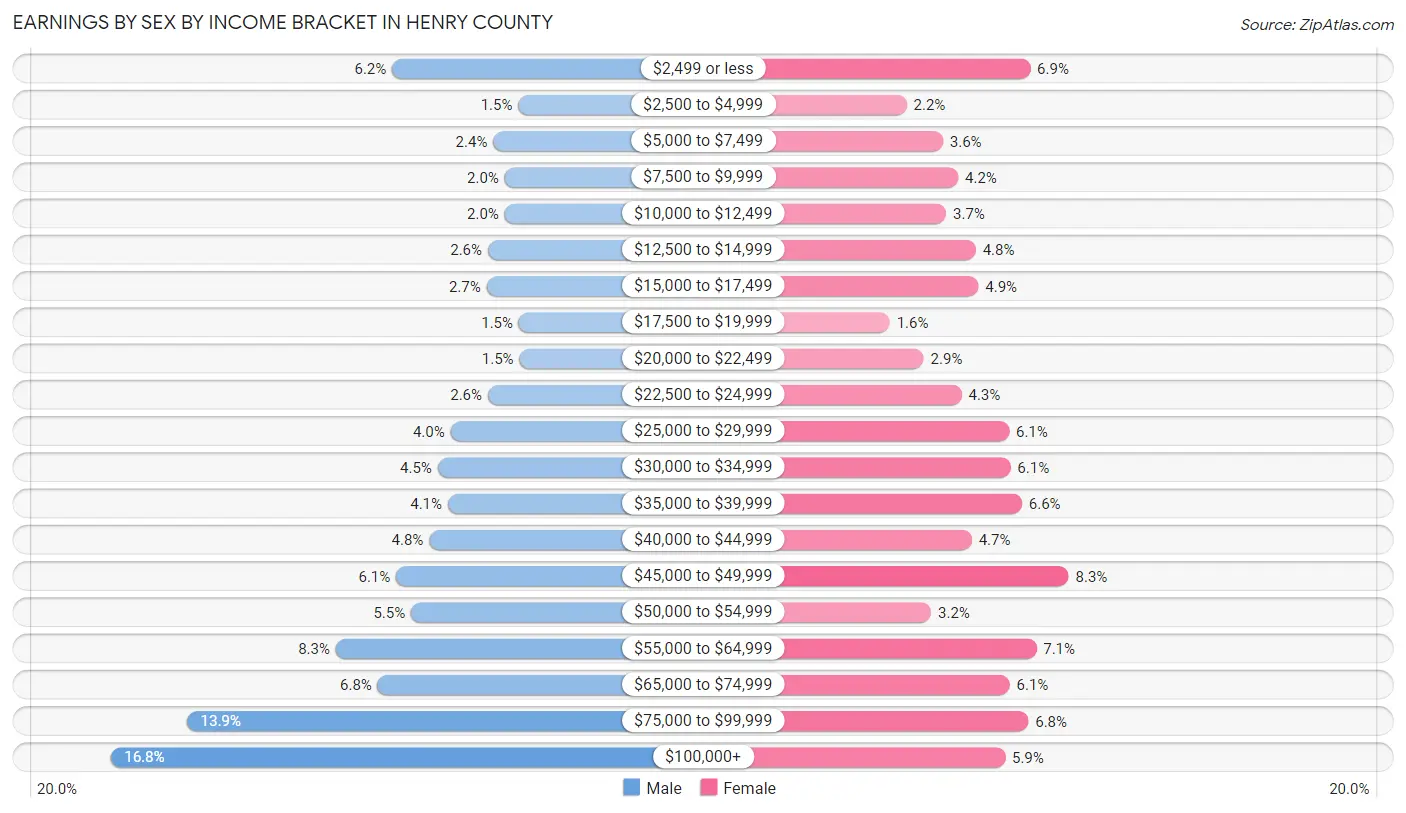
| Income | Male | Female |
| $2,499 or less | 832 (6.2%) | 830 (6.9%) |
| $2,500 to $4,999 | 201 (1.5%) | 271 (2.2%) |
| $5,000 to $7,499 | 326 (2.4%) | 435 (3.6%) |
| $7,500 to $9,999 | 268 (2.0%) | 504 (4.2%) |
| $10,000 to $12,499 | 269 (2.0%) | 449 (3.7%) |
| $12,500 to $14,999 | 353 (2.6%) | 583 (4.8%) |
| $15,000 to $17,499 | 360 (2.7%) | 596 (4.9%) |
| $17,500 to $19,999 | 198 (1.5%) | 194 (1.6%) |
| $20,000 to $22,499 | 195 (1.5%) | 348 (2.9%) |
| $22,500 to $24,999 | 353 (2.6%) | 519 (4.3%) |
| $25,000 to $29,999 | 540 (4.0%) | 735 (6.1%) |
| $30,000 to $34,999 | 604 (4.5%) | 741 (6.1%) |
| $35,000 to $39,999 | 553 (4.1%) | 792 (6.6%) |
| $40,000 to $44,999 | 647 (4.8%) | 566 (4.7%) |
| $45,000 to $49,999 | 813 (6.1%) | 1,004 (8.3%) |
| $50,000 to $54,999 | 737 (5.5%) | 382 (3.2%) |
| $55,000 to $64,999 | 1,114 (8.3%) | 858 (7.1%) |
| $65,000 to $74,999 | 905 (6.8%) | 737 (6.1%) |
| $75,000 to $99,999 | 1,856 (13.9%) | 822 (6.8%) |
| $100,000+ | 2,238 (16.8%) | 716 (5.9%) |
| Total | 13,362 (100.0%) | 12,082 (100.0%) |
Earnings by Sex by Educational Attainment in Henry County
Average earnings in Henry County are $57,456 for men and $38,544 for women, a difference of 32.9%. Men with an educational attainment of graduate degree enjoy the highest average annual earnings of $94,837, while those with less than high school education earn the least with $34,375. Women with an educational attainment of graduate degree earn the most with the average annual earnings of $75,709, while those with less than high school education have the smallest earnings of $25,735.
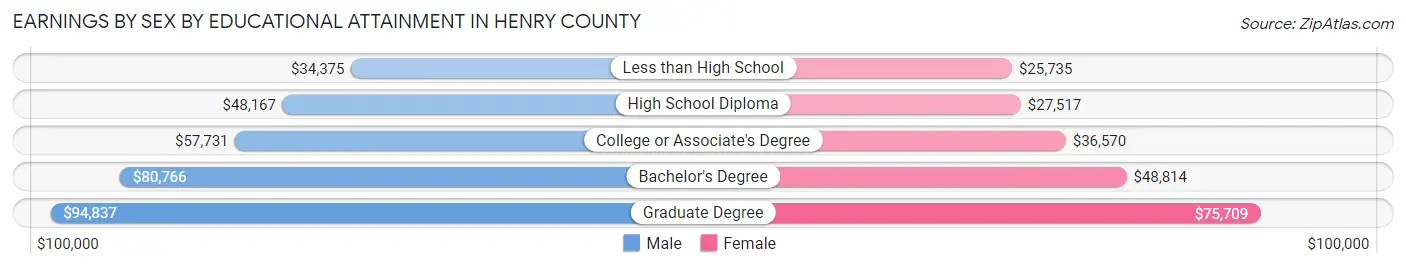
| Educational Attainment | Male Income | Female Income |
| Less than High School | $34,375 | $25,735 |
| High School Diploma | $48,167 | $27,517 |
| College or Associate's Degree | $57,731 | $36,570 |
| Bachelor's Degree | $80,766 | $48,814 |
| Graduate Degree | $94,837 | $75,709 |
| Total | $57,456 | $38,544 |
Family Income in Henry County
Family Income Brackets in Henry County
According to the Henry County family income data, there are 2,973 families falling into the $100,000 to $149,999 income range, which is the most common income bracket and makes up 22.4% of all families. Conversely, the $10,000 to $14,999 income bracket is the least frequent group with only 226 families (1.7%) belonging to this category.
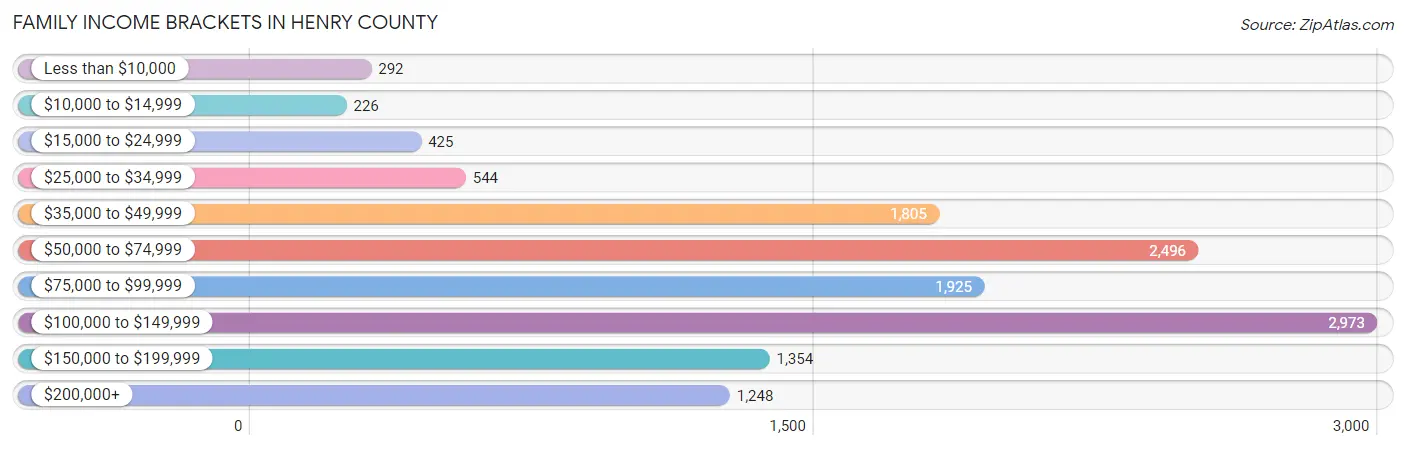
| Income Bracket | # Families | % Families |
| Less than $10,000 | 292 | 2.2% |
| $10,000 to $14,999 | 226 | 1.7% |
| $15,000 to $24,999 | 425 | 3.2% |
| $25,000 to $34,999 | 544 | 4.1% |
| $35,000 to $49,999 | 1,805 | 13.6% |
| $50,000 to $74,999 | 2,496 | 18.8% |
| $75,000 to $99,999 | 1,925 | 14.5% |
| $100,000 to $149,999 | 2,973 | 22.4% |
| $150,000 to $199,999 | 1,354 | 10.2% |
| $200,000+ | 1,248 | 9.4% |
Family Income by Famaliy Size in Henry County
6-person families (274 | 2.1%) account for the highest median family income in Henry County with $125,192 per family, while 2-person families (6,631 | 49.9%) have the highest median income of $36,192 per family member.
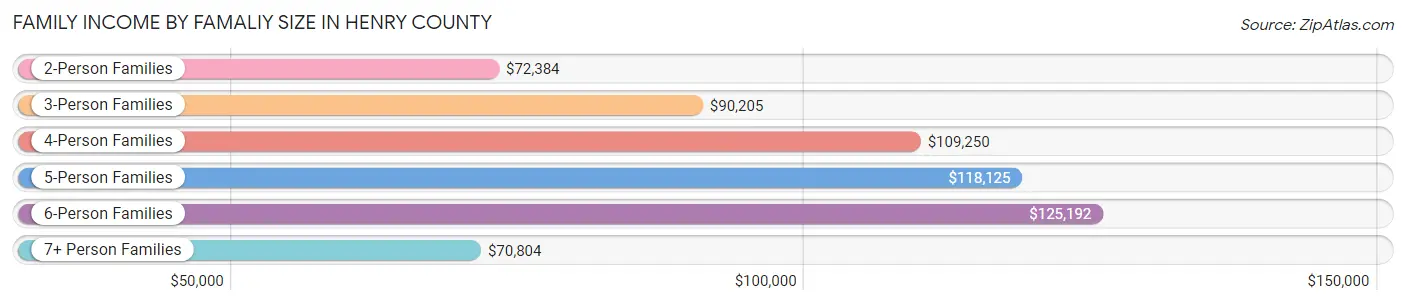
| Income Bracket | # Families | Median Income |
| 2-Person Families | 6,631 (49.9%) | $72,384 |
| 3-Person Families | 3,214 (24.2%) | $90,205 |
| 4-Person Families | 2,258 (17.0%) | $109,250 |
| 5-Person Families | 789 (5.9%) | $118,125 |
| 6-Person Families | 274 (2.1%) | $125,192 |
| 7+ Person Families | 108 (0.8%) | $70,804 |
| Total | 13,274 (100.0%) | $86,547 |
Family Income by Number of Earners in Henry County
The median family income in Henry County is $86,547, with families comprising 3+ earners (1,381) having the highest median family income of $138,160, while families with no earners (2,565) have the lowest median family income of $47,926, accounting for 10.4% and 19.3% of families, respectively.
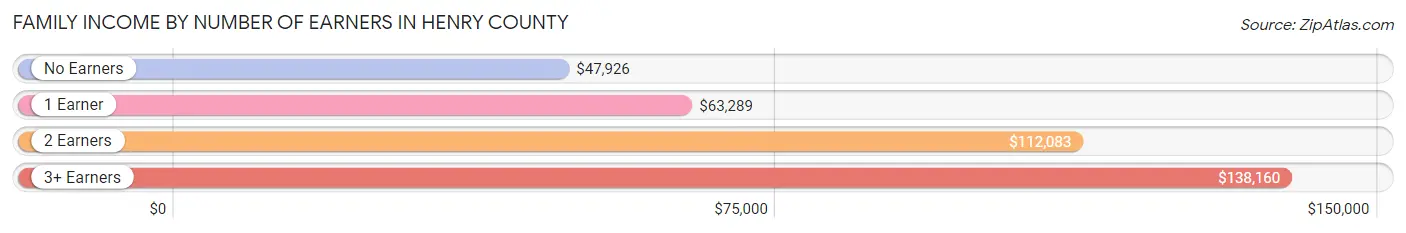
| Number of Earners | # Families | Median Income |
| No Earners | 2,565 (19.3%) | $47,926 |
| 1 Earner | 3,860 (29.1%) | $63,289 |
| 2 Earners | 5,468 (41.2%) | $112,083 |
| 3+ Earners | 1,381 (10.4%) | $138,160 |
| Total | 13,274 (100.0%) | $86,547 |
Household Income in Henry County
Household Income Brackets in Henry County
With 3,694 households falling in the category, the $100,000 to $149,999 income range is the most frequent in Henry County, accounting for 18.3% of all households. In contrast, only 767 households (3.8%) fall into the $10,000 to $14,999 income bracket, making it the least populous group.
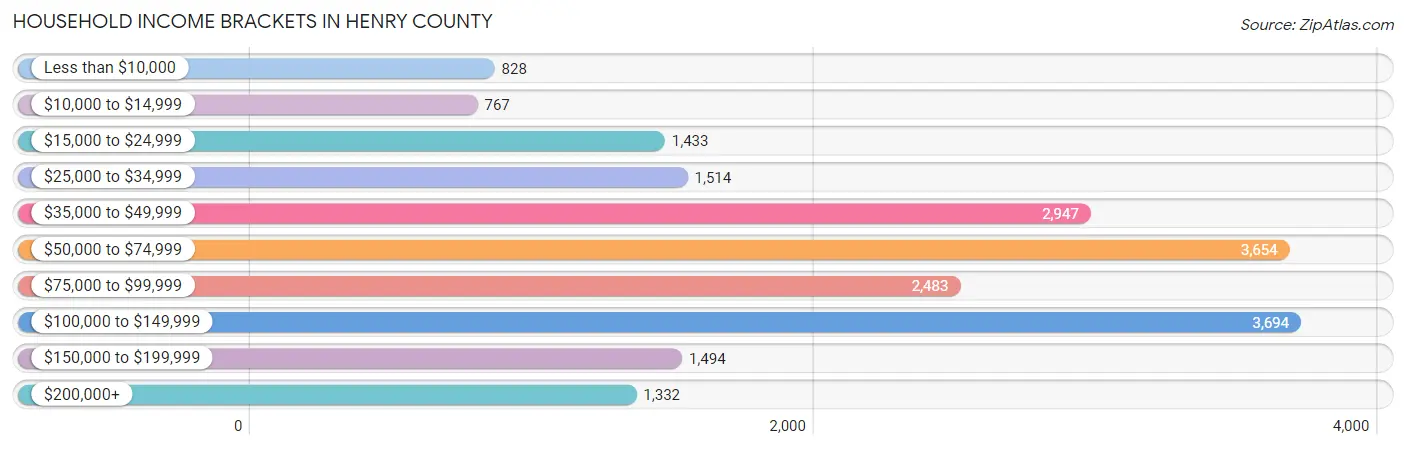
| Income Bracket | # Households | % Households |
| Less than $10,000 | 828 | 4.1% |
| $10,000 to $14,999 | 767 | 3.8% |
| $15,000 to $24,999 | 1,433 | 7.1% |
| $25,000 to $34,999 | 1,514 | 7.5% |
| $35,000 to $49,999 | 2,947 | 14.6% |
| $50,000 to $74,999 | 3,654 | 18.1% |
| $75,000 to $99,999 | 2,483 | 12.3% |
| $100,000 to $149,999 | 3,694 | 18.3% |
| $150,000 to $199,999 | 1,494 | 7.4% |
| $200,000+ | 1,332 | 6.6% |
Household Income by Householder Age in Henry County
The median household income in Henry County is $66,313, with the highest median household income of $87,829 found in the 25 to 44 years age bracket for the primary householder. A total of 5,727 households (28.4%) fall into this category. Meanwhile, the 15 to 24 years age bracket for the primary householder has the lowest median household income of $39,213, with 496 households (2.5%) in this group.
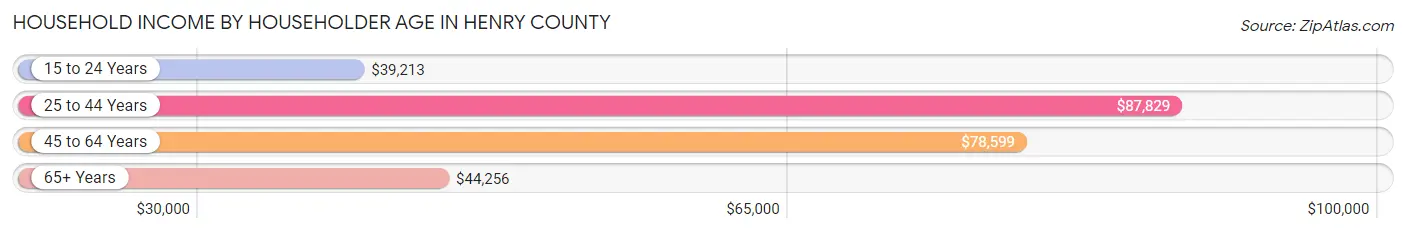
| Income Bracket | # Households | Median Income |
| 15 to 24 Years | 496 (2.5%) | $39,213 |
| 25 to 44 Years | 5,727 (28.4%) | $87,829 |
| 45 to 64 Years | 7,409 (36.7%) | $78,599 |
| 65+ Years | 6,555 (32.5%) | $44,256 |
| Total | 20,187 (100.0%) | $66,313 |
Poverty in Henry County
Income Below Poverty by Sex and Age in Henry County
With 8.3% poverty level for males and 10.2% for females among the residents of Henry County, 5 year old males and under 5 year old females are the most vulnerable to poverty, with 72 males (22.7%) and 266 females (23.0%) in their respective age groups living below the poverty level.
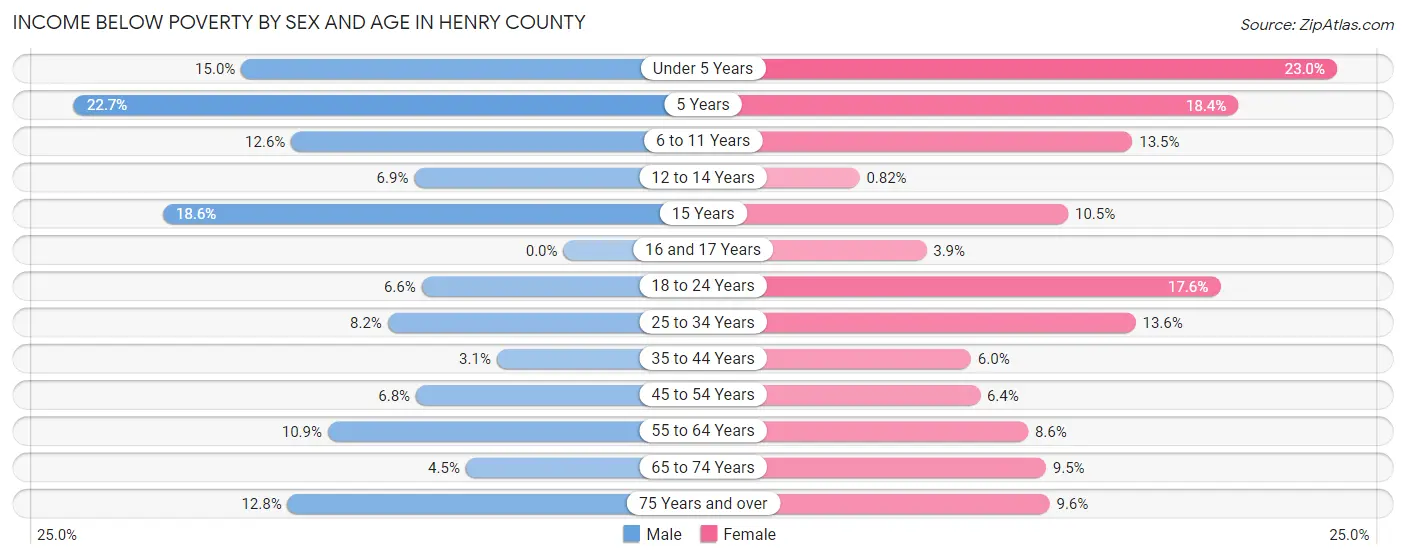
| Age Bracket | Male | Female |
| Under 5 Years | 189 (14.9%) | 266 (23.0%) |
| 5 Years | 72 (22.7%) | 41 (18.4%) |
| 6 to 11 Years | 227 (12.6%) | 268 (13.5%) |
| 12 to 14 Years | 69 (6.9%) | 6 (0.8%) |
| 15 Years | 63 (18.6%) | 40 (10.5%) |
| 16 and 17 Years | 0 (0.0%) | 27 (3.9%) |
| 18 to 24 Years | 127 (6.6%) | 282 (17.5%) |
| 25 to 34 Years | 204 (8.2%) | 358 (13.6%) |
| 35 to 44 Years | 95 (3.1%) | 178 (6.0%) |
| 45 to 54 Years | 210 (6.8%) | 194 (6.4%) |
| 55 to 64 Years | 367 (10.9%) | 307 (8.6%) |
| 65 to 74 Years | 131 (4.5%) | 279 (9.5%) |
| 75 Years and over | 234 (12.8%) | 227 (9.6%) |
| Total | 1,988 (8.3%) | 2,473 (10.2%) |
Income Above Poverty by Sex and Age in Henry County
According to the poverty statistics in Henry County, males aged 16 and 17 years and females aged 12 to 14 years are the age groups that are most secure financially, with 100.0% of males and 99.2% of females in these age groups living above the poverty line.
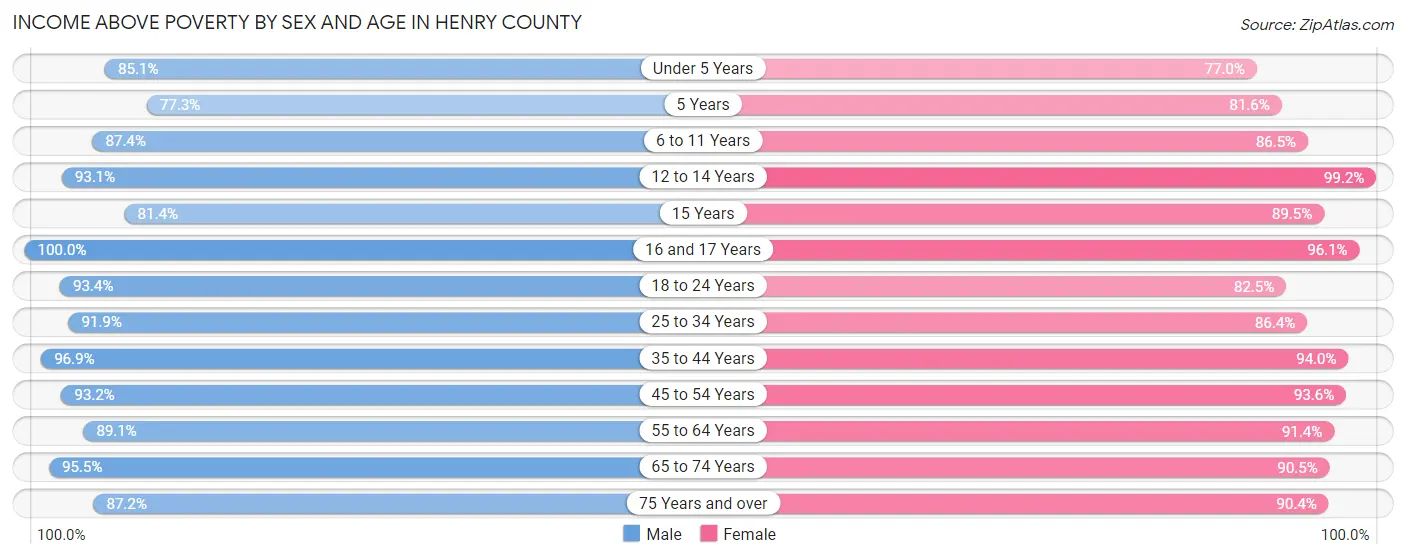
| Age Bracket | Male | Female |
| Under 5 Years | 1,075 (85.1%) | 892 (77.0%) |
| 5 Years | 245 (77.3%) | 182 (81.6%) |
| 6 to 11 Years | 1,570 (87.4%) | 1,720 (86.5%) |
| 12 to 14 Years | 928 (93.1%) | 725 (99.2%) |
| 15 Years | 276 (81.4%) | 341 (89.5%) |
| 16 and 17 Years | 681 (100.0%) | 662 (96.1%) |
| 18 to 24 Years | 1,804 (93.4%) | 1,325 (82.5%) |
| 25 to 34 Years | 2,299 (91.8%) | 2,268 (86.4%) |
| 35 to 44 Years | 2,980 (96.9%) | 2,794 (94.0%) |
| 45 to 54 Years | 2,859 (93.2%) | 2,831 (93.6%) |
| 55 to 64 Years | 2,991 (89.1%) | 3,246 (91.4%) |
| 65 to 74 Years | 2,761 (95.5%) | 2,666 (90.5%) |
| 75 Years and over | 1,594 (87.2%) | 2,127 (90.4%) |
| Total | 22,063 (91.7%) | 21,779 (89.8%) |
Income Below Poverty Among Married-Couple Families in Henry County
The poverty statistics for married-couple families in Henry County show that 2.6% or 271 of the total 10,322 families live below the poverty line. Families with no children have the highest poverty rate of 3.4%, comprising of 222 families. On the other hand, families with 5 or more children have the lowest poverty rate of 0.0%, which includes 0 families.
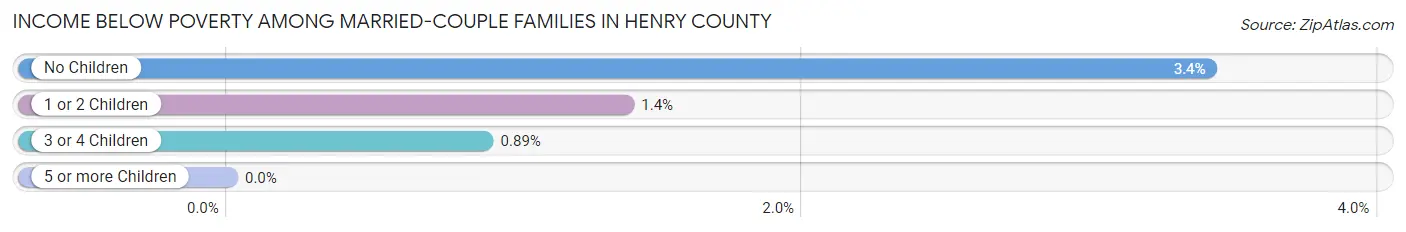
| Children | Above Poverty | Below Poverty |
| No Children | 6,290 (96.6%) | 222 (3.4%) |
| 1 or 2 Children | 3,072 (98.6%) | 43 (1.4%) |
| 3 or 4 Children | 671 (99.1%) | 6 (0.9%) |
| 5 or more Children | 18 (100.0%) | 0 (0.0%) |
| Total | 10,051 (97.4%) | 271 (2.6%) |
Income Below Poverty Among Single-Parent Households in Henry County
According to the poverty data in Henry County, 8.3% or 82 single-father households and 21.6% or 425 single-mother households are living below the poverty line. Among single-father households, those with no children have the highest poverty rate, with 46 households (17.5%) experiencing poverty. Likewise, among single-mother households, those with 5 or more children have the highest poverty rate, with 45 households (100.0%) falling below the poverty line.

| Children | Single Father | Single Mother |
| No Children | 46 (17.5%) | 53 (10.2%) |
| 1 or 2 Children | 36 (5.4%) | 236 (19.9%) |
| 3 or 4 Children | 0 (0.0%) | 91 (43.1%) |
| 5 or more Children | 0 (0.0%) | 45 (100.0%) |
| Total | 82 (8.3%) | 425 (21.6%) |
Income Below Poverty Among Married-Couple vs Single-Parent Households in Henry County
The poverty data for Henry County shows that 271 of the married-couple family households (2.6%) and 507 of the single-parent households (17.2%) are living below the poverty level. Within the married-couple family households, those with no children have the highest poverty rate, with 222 households (3.4%) falling below the poverty line. Among the single-parent households, those with 5 or more children have the highest poverty rate, with 45 household (100.0%) living below poverty.
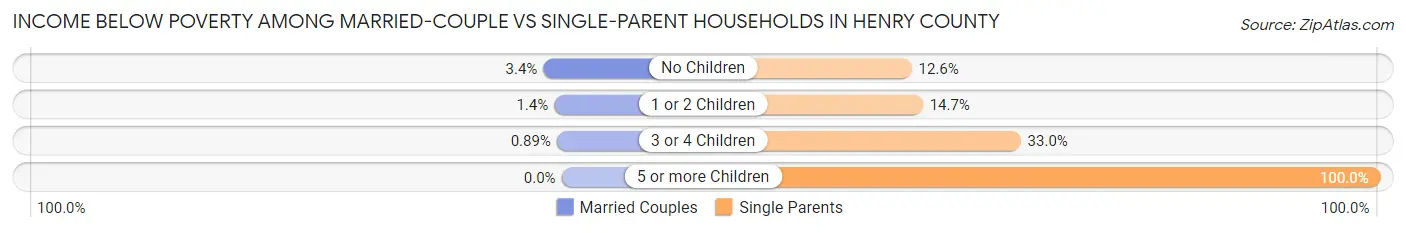
| Children | Married-Couple Families | Single-Parent Households |
| No Children | 222 (3.4%) | 99 (12.6%) |
| 1 or 2 Children | 43 (1.4%) | 272 (14.7%) |
| 3 or 4 Children | 6 (0.9%) | 91 (33.0%) |
| 5 or more Children | 0 (0.0%) | 45 (100.0%) |
| Total | 271 (2.6%) | 507 (17.2%) |
Employment Characteristics in Henry County
Employment by Class of Employer in Henry County
Among the 23,067 employed individuals in Henry County, private company employees (14,963 | 64.9%), local government employees (2,354 | 10.2%), and not-for-profit organizations (2,106 | 9.1%) make up the most common classes of employment.
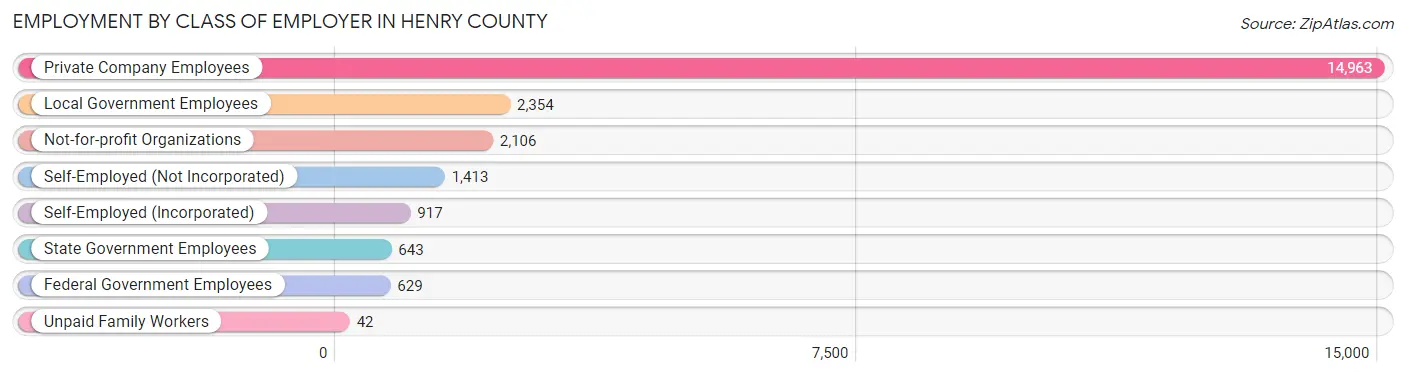
| Employer Class | # Employees | % Employees |
| Private Company Employees | 14,963 | 64.9% |
| Self-Employed (Incorporated) | 917 | 4.0% |
| Self-Employed (Not Incorporated) | 1,413 | 6.1% |
| Not-for-profit Organizations | 2,106 | 9.1% |
| Local Government Employees | 2,354 | 10.2% |
| State Government Employees | 643 | 2.8% |
| Federal Government Employees | 629 | 2.7% |
| Unpaid Family Workers | 42 | 0.2% |
| Total | 23,067 | 100.0% |
Employment Status by Age in Henry County
According to the labor force statistics for Henry County, out of the total population over 16 years of age (39,756), 61.6% or 24,490 individuals are in the labor force, with 4.5% or 1,102 of them unemployed. The age group with the highest labor force participation rate is 35 to 44 years, with 89.7% or 5,474 individuals in the labor force. Within the labor force, the 16 to 19 years age range has the highest percentage of unemployed individuals, with 17.4% or 217 of them being unemployed.
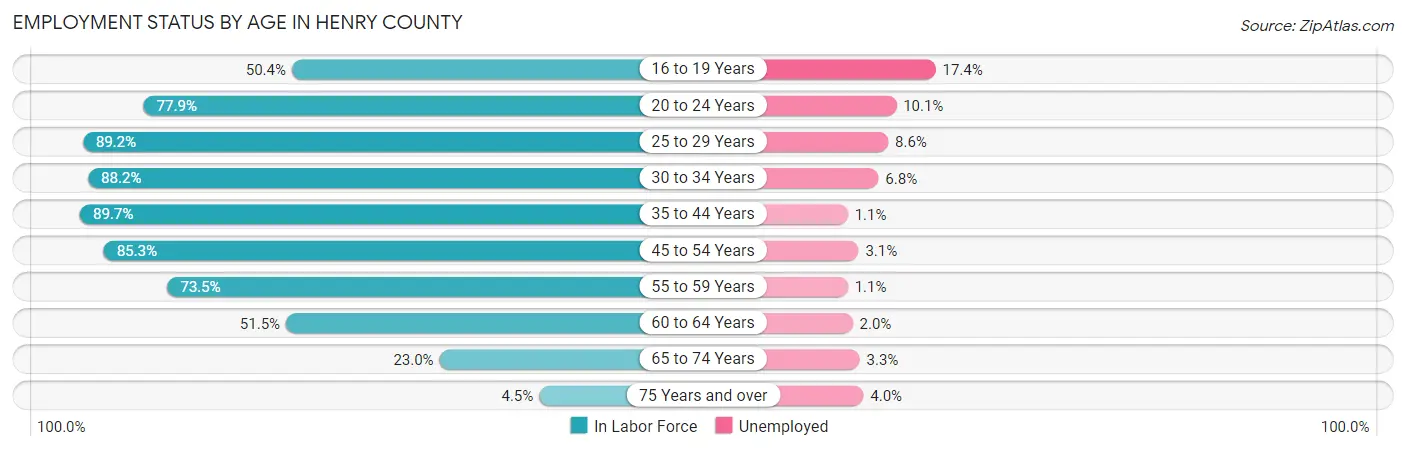
| Age Bracket | In Labor Force | Unemployed |
| 16 to 19 Years | 1,246 (50.4%) | 217 (17.4%) |
| 20 to 24 Years | 1,924 (77.9%) | 194 (10.1%) |
| 25 to 29 Years | 2,242 (89.2%) | 193 (8.6%) |
| 30 to 34 Years | 2,401 (88.2%) | 163 (6.8%) |
| 35 to 44 Years | 5,474 (89.7%) | 60 (1.1%) |
| 45 to 54 Years | 5,226 (85.3%) | 162 (3.1%) |
| 55 to 59 Years | 2,670 (73.5%) | 29 (1.1%) |
| 60 to 64 Years | 1,753 (51.5%) | 35 (2.0%) |
| 65 to 74 Years | 1,358 (23.0%) | 45 (3.3%) |
| 75 Years and over | 198 (4.5%) | 8 (4.0%) |
| Total | 24,490 (61.6%) | 1,102 (4.5%) |
Employment Status by Educational Attainment in Henry County
According to labor force statistics for Henry County, 80.7% of individuals (19,774) out of the total population between 25 and 64 years of age (24,503) are in the labor force, with 3.2% or 633 of them being unemployed. The group with the highest labor force participation rate are those with the educational attainment of bachelor's degree or higher, with 90.7% or 6,088 individuals in the labor force. Within the labor force, individuals with less than high school education have the highest percentage of unemployment, with 9.3% or 87 of them being unemployed.

| Educational Attainment | In Labor Force | Unemployed |
| Less than High School | 939 (53.3%) | 164 (9.3%) |
| High School Diploma | 5,838 (77.3%) | 279 (3.7%) |
| College / Associate Degree | 6,900 (81.4%) | 254 (3.0%) |
| Bachelor's Degree or higher | 6,088 (90.7%) | 141 (2.1%) |
| Total | 19,774 (80.7%) | 784 (3.2%) |
Employment Occupations by Sex in Henry County
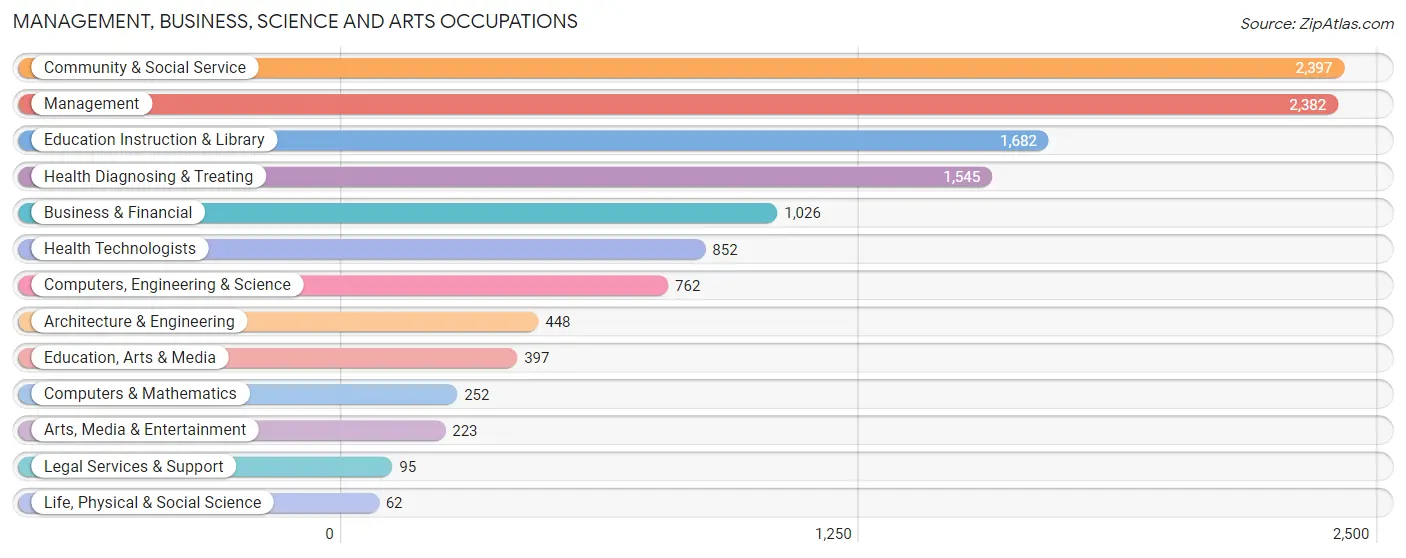
Management, Business, Science and Arts Occupations
The most common Management, Business, Science and Arts occupations in Henry County are Community & Social Service (2,397 | 10.3%), Management (2,382 | 10.2%), Education Instruction & Library (1,682 | 7.2%), Health Diagnosing & Treating (1,545 | 6.6%), and Business & Financial (1,026 | 4.4%).
Management, Business, Science and Arts Occupations by Sex
Within the Management, Business, Science and Arts occupations in Henry County, the most male-oriented occupations are Architecture & Engineering (87.1%), Computers, Engineering & Science (82.7%), and Computers & Mathematics (77.0%), while the most female-oriented occupations are Legal Services & Support (91.6%), Health Technologists (86.0%), and Health Diagnosing & Treating (84.3%).

| Occupation | Male | Female |
| Management | 1,534 (64.4%) | 848 (35.6%) |
| Business & Financial | 457 (44.5%) | 569 (55.5%) |
| Computers, Engineering & Science | 630 (82.7%) | 132 (17.3%) |
| Computers & Mathematics | 194 (77.0%) | 58 (23.0%) |
| Architecture & Engineering | 390 (87.1%) | 58 (13.0%) |
| Life, Physical & Social Science | 46 (74.2%) | 16 (25.8%) |
| Community & Social Service | 450 (18.8%) | 1,947 (81.2%) |
| Education, Arts & Media | 87 (21.9%) | 310 (78.1%) |
| Legal Services & Support | 8 (8.4%) | 87 (91.6%) |
| Education Instruction & Library | 304 (18.1%) | 1,378 (81.9%) |
| Arts, Media & Entertainment | 51 (22.9%) | 172 (77.1%) |
| Health Diagnosing & Treating | 243 (15.7%) | 1,302 (84.3%) |
| Health Technologists | 119 (14.0%) | 733 (86.0%) |
| Total (Category) | 3,314 (40.8%) | 4,798 (59.2%) |
| Total (Overall) | 12,261 (52.5%) | 11,105 (47.5%) |
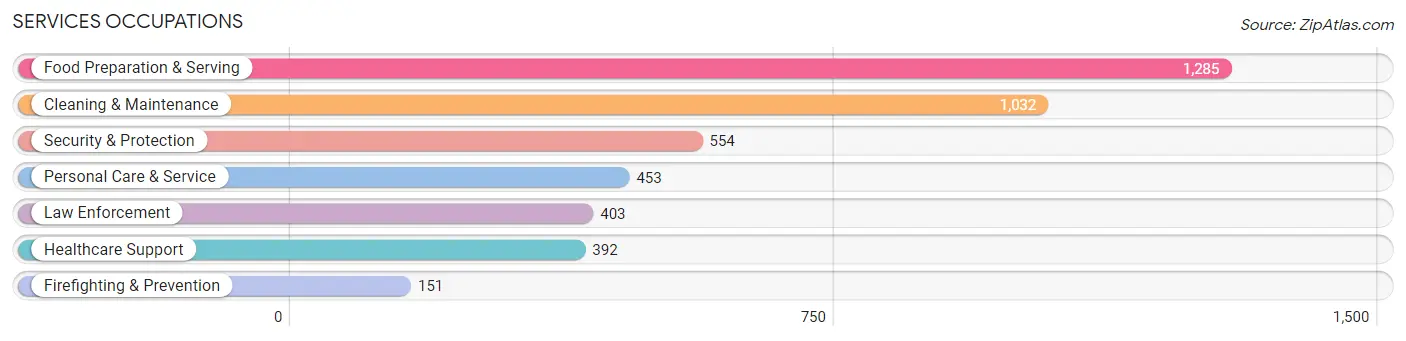
Services Occupations
The most common Services occupations in Henry County are Food Preparation & Serving (1,285 | 5.5%), Cleaning & Maintenance (1,032 | 4.4%), Security & Protection (554 | 2.4%), Personal Care & Service (453 | 1.9%), and Law Enforcement (403 | 1.7%).
Services Occupations by Sex
Within the Services occupations in Henry County, the most male-oriented occupations are Law Enforcement (96.8%), Security & Protection (86.6%), and Cleaning & Maintenance (65.9%), while the most female-oriented occupations are Healthcare Support (95.4%), Personal Care & Service (83.9%), and Food Preparation & Serving (69.3%).
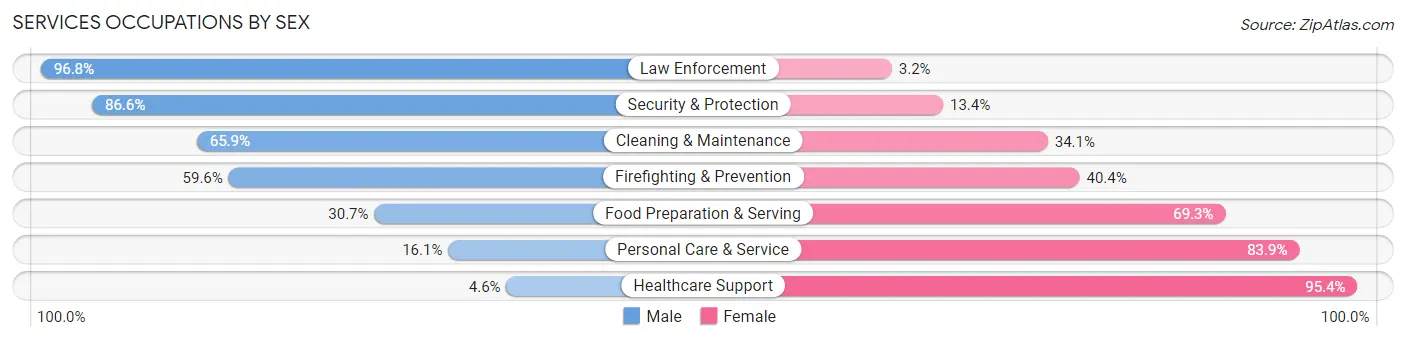
| Occupation | Male | Female |
| Healthcare Support | 18 (4.6%) | 374 (95.4%) |
| Security & Protection | 480 (86.6%) | 74 (13.4%) |
| Firefighting & Prevention | 90 (59.6%) | 61 (40.4%) |
| Law Enforcement | 390 (96.8%) | 13 (3.2%) |
| Food Preparation & Serving | 395 (30.7%) | 890 (69.3%) |
| Cleaning & Maintenance | 680 (65.9%) | 352 (34.1%) |
| Personal Care & Service | 73 (16.1%) | 380 (83.9%) |
| Total (Category) | 1,646 (44.3%) | 2,070 (55.7%) |
| Total (Overall) | 12,261 (52.5%) | 11,105 (47.5%) |
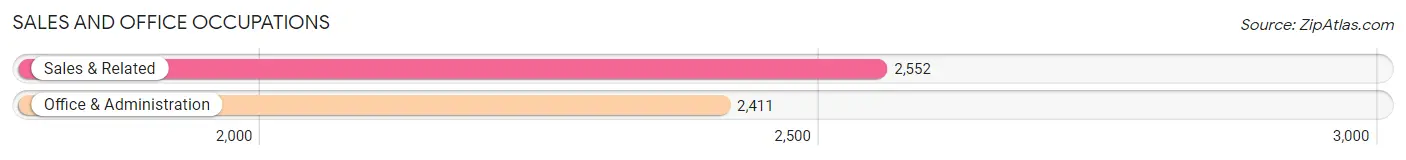
Sales and Office Occupations
The most common Sales and Office occupations in Henry County are Sales & Related (2,552 | 10.9%), and Office & Administration (2,411 | 10.3%).
Sales and Office Occupations by Sex

| Occupation | Male | Female |
| Sales & Related | 1,213 (47.5%) | 1,339 (52.5%) |
| Office & Administration | 462 (19.2%) | 1,949 (80.8%) |
| Total (Category) | 1,675 (33.8%) | 3,288 (66.2%) |
| Total (Overall) | 12,261 (52.5%) | 11,105 (47.5%) |
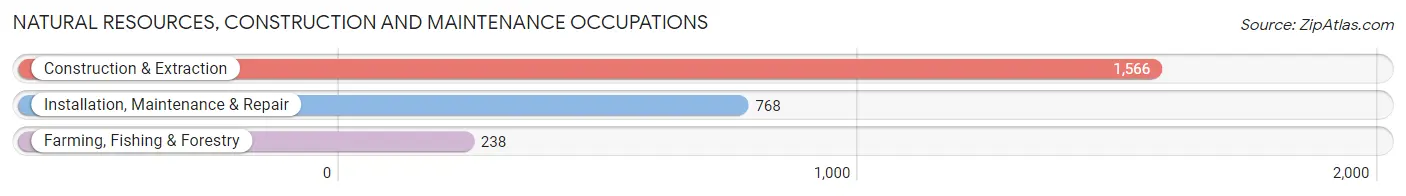
Natural Resources, Construction and Maintenance Occupations
The most common Natural Resources, Construction and Maintenance occupations in Henry County are Construction & Extraction (1,566 | 6.7%), Installation, Maintenance & Repair (768 | 3.3%), and Farming, Fishing & Forestry (238 | 1.0%).
Natural Resources, Construction and Maintenance Occupations by Sex
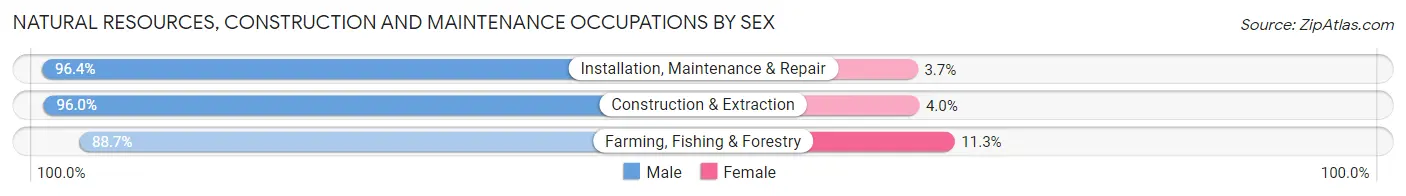
| Occupation | Male | Female |
| Farming, Fishing & Forestry | 211 (88.7%) | 27 (11.3%) |
| Construction & Extraction | 1,504 (96.0%) | 62 (4.0%) |
| Installation, Maintenance & Repair | 740 (96.4%) | 28 (3.6%) |
| Total (Category) | 2,455 (95.5%) | 117 (4.5%) |
| Total (Overall) | 12,261 (52.5%) | 11,105 (47.5%) |
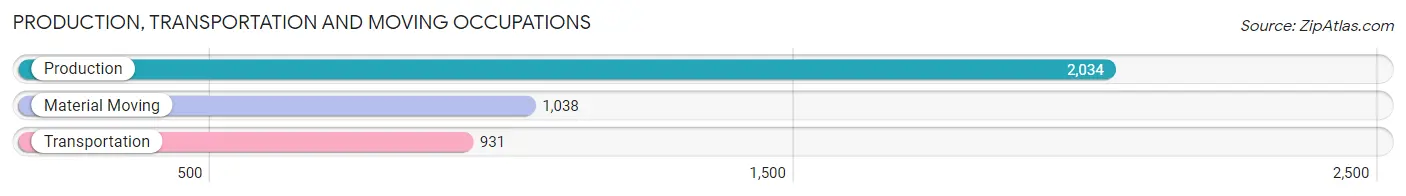
Production, Transportation and Moving Occupations
The most common Production, Transportation and Moving occupations in Henry County are Production (2,034 | 8.7%), Material Moving (1,038 | 4.4%), and Transportation (931 | 4.0%).
Production, Transportation and Moving Occupations by Sex
| Occupation | Male | Female |
| Production | 1,594 (78.4%) | 440 (21.6%) |
| Transportation | 788 (84.6%) | 143 (15.4%) |
| Material Moving | 789 (76.0%) | 249 (24.0%) |
| Total (Category) | 3,171 (79.2%) | 832 (20.8%) |
| Total (Overall) | 12,261 (52.5%) | 11,105 (47.5%) |
Employment Industries by Sex in Henry County
Employment Industries in Henry County
The major employment industries in Henry County include Manufacturing (3,649 | 15.6%), Retail Trade (2,915 | 12.5%), Health Care & Social Assistance (2,767 | 11.8%), Construction (2,013 | 8.6%), and Educational Services (1,966 | 8.4%).
Employment Industries by Sex in Henry County
The Henry County industries that see more men than women are Enterprise Management (90.5%), Utilities (89.1%), and Agriculture, Fishing & Hunting (87.7%), whereas the industries that tend to have a higher number of women are Health Care & Social Assistance (84.3%), Educational Services (82.7%), and Finance & Insurance (68.3%).
| Industry | Male | Female |
| Agriculture, Fishing & Hunting | 700 (87.7%) | 98 (12.3%) |
| Mining, Quarrying, & Extraction | 63 (87.5%) | 9 (12.5%) |
| Construction | 1,711 (85.0%) | 302 (15.0%) |
| Manufacturing | 2,834 (77.7%) | 815 (22.3%) |
| Wholesale Trade | 527 (69.8%) | 228 (30.2%) |
| Retail Trade | 1,331 (45.7%) | 1,584 (54.3%) |
| Transportation & Warehousing | 874 (75.1%) | 289 (24.8%) |
| Utilities | 228 (89.1%) | 28 (10.9%) |
| Information | 100 (31.9%) | 214 (68.1%) |
| Finance & Insurance | 367 (31.7%) | 790 (68.3%) |
| Real Estate, Rental & Leasing | 140 (78.6%) | 38 (21.3%) |
| Professional & Scientific | 202 (38.9%) | 318 (61.2%) |
| Enterprise Management | 19 (90.5%) | 2 (9.5%) |
| Administrative & Support | 303 (48.9%) | 316 (51.0%) |
| Educational Services | 341 (17.3%) | 1,625 (82.7%) |
| Health Care & Social Assistance | 434 (15.7%) | 2,333 (84.3%) |
| Arts, Entertainment & Recreation | 234 (58.2%) | 168 (41.8%) |
| Accommodation & Food Services | 535 (38.3%) | 861 (61.7%) |
| Public Administration | 839 (67.7%) | 400 (32.3%) |
| Total | 12,261 (52.5%) | 11,105 (47.5%) |
Education in Henry County
School Enrollment in Henry County
The most common levels of schooling among the 10,935 students in Henry County are high school (2,788 | 25.5%), elementary school (2,545 | 23.3%), and middle school (2,202 | 20.1%).
| School Level | # Students | % Students |
| Nursery / Preschool | 919 | 8.4% |
| Kindergarten | 591 | 5.4% |
| Elementary School | 2,545 | 23.3% |
| Middle School | 2,202 | 20.1% |
| High School | 2,788 | 25.5% |
| College / Undergraduate | 1,403 | 12.8% |
| Graduate / Professional | 487 | 4.4% |
| Total | 10,935 | 100.0% |
School Enrollment by Age by Funding Source in Henry County
Out of a total of 10,935 students who are enrolled in schools in Henry County, 1,170 (10.7%) attend a private institution, while the remaining 9,765 (89.3%) are enrolled in public schools. The age group of 35 years and over has the highest likelihood of being enrolled in private schools, with 124 (24.3% in the age bracket) enrolled. Conversely, the age group of 18 to 19 year olds has the lowest likelihood of being enrolled in a private school, with 663 (97.2% in the age bracket) attending a public institution.
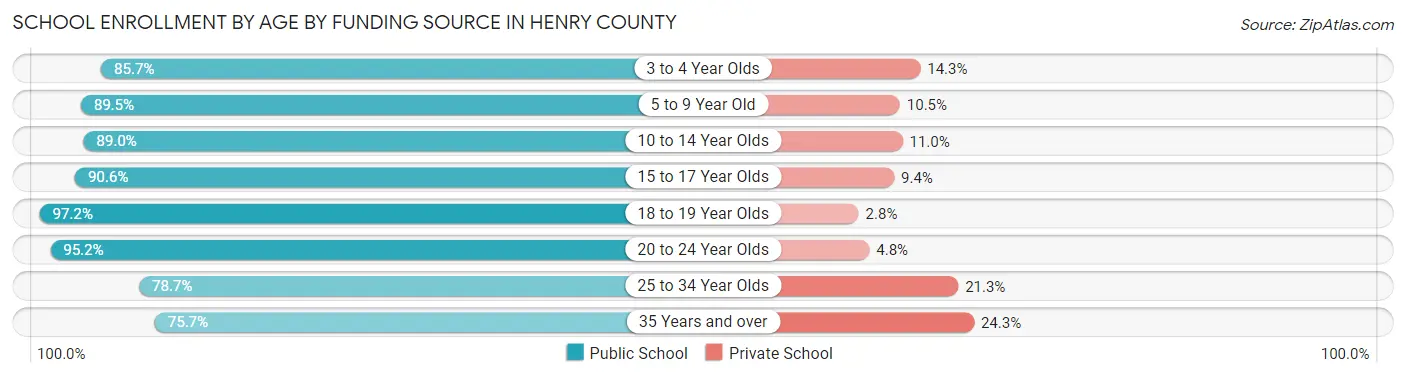
| Age Bracket | Public School | Private School |
| 3 to 4 Year Olds | 643 (85.7%) | 107 (14.3%) |
| 5 to 9 Year Old | 2,693 (89.5%) | 315 (10.5%) |
| 10 to 14 Year Olds | 2,584 (89.0%) | 318 (11.0%) |
| 15 to 17 Year Olds | 1,833 (90.6%) | 190 (9.4%) |
| 18 to 19 Year Olds | 663 (97.2%) | 19 (2.8%) |
| 20 to 24 Year Olds | 736 (95.2%) | 37 (4.8%) |
| 25 to 34 Year Olds | 225 (78.7%) | 61 (21.3%) |
| 35 Years and over | 387 (75.7%) | 124 (24.3%) |
| Total | 9,765 (89.3%) | 1,170 (10.7%) |
Educational Attainment by Field of Study in Henry County
Business (2,095 | 22.5%), education (1,769 | 19.0%), science & technology (980 | 10.5%), bio, nature & agricultural (819 | 8.8%), and arts & humanities (725 | 7.8%) are the most common fields of study among 9,325 individuals in Henry County who have obtained a bachelor's degree or higher.
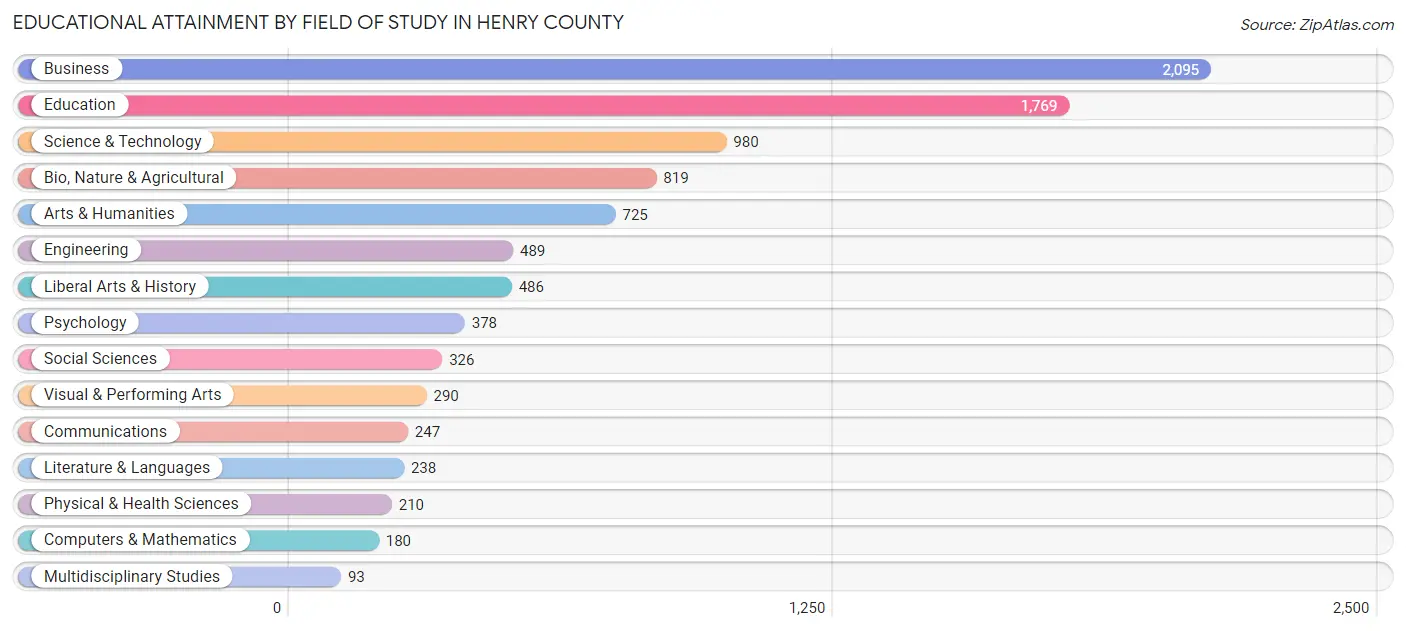
| Field of Study | # Graduates | % Graduates |
| Computers & Mathematics | 180 | 1.9% |
| Bio, Nature & Agricultural | 819 | 8.8% |
| Physical & Health Sciences | 210 | 2.2% |
| Psychology | 378 | 4.1% |
| Social Sciences | 326 | 3.5% |
| Engineering | 489 | 5.2% |
| Multidisciplinary Studies | 93 | 1.0% |
| Science & Technology | 980 | 10.5% |
| Business | 2,095 | 22.5% |
| Education | 1,769 | 19.0% |
| Literature & Languages | 238 | 2.5% |
| Liberal Arts & History | 486 | 5.2% |
| Visual & Performing Arts | 290 | 3.1% |
| Communications | 247 | 2.6% |
| Arts & Humanities | 725 | 7.8% |
| Total | 9,325 | 100.0% |
Transportation & Commute in Henry County
Vehicle Availability by Sex in Henry County
The most prevalent vehicle ownership categories in Henry County are males with 2 vehicles (4,900, accounting for 40.7%) and females with 2 vehicles (4,297, making up 44.5%).
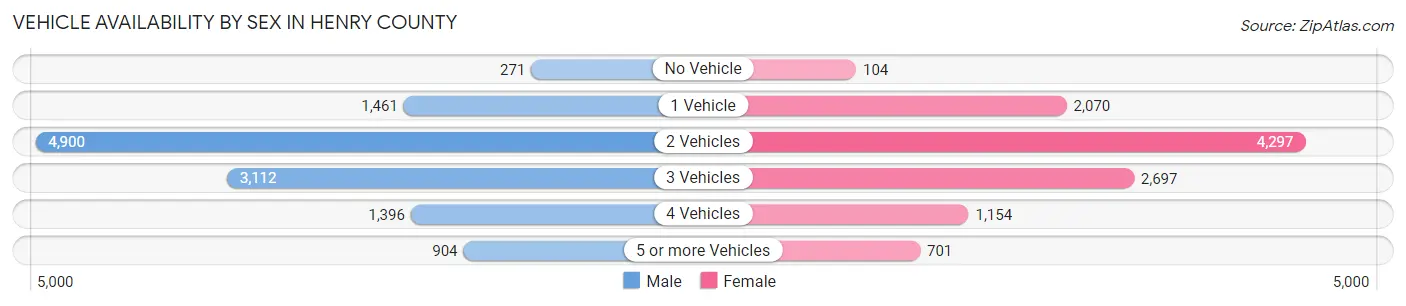
| Vehicles Available | Male | Female |
| No Vehicle | 271 (2.2%) | 104 (0.9%) |
| 1 Vehicle | 1,461 (12.1%) | 2,070 (18.8%) |
| 2 Vehicles | 4,900 (40.7%) | 4,297 (39.0%) |
| 3 Vehicles | 3,112 (25.8%) | 2,697 (24.5%) |
| 4 Vehicles | 1,396 (11.6%) | 1,154 (10.5%) |
| 5 or more Vehicles | 904 (7.5%) | 701 (6.4%) |
| Total | 12,044 (100.0%) | 11,023 (100.0%) |
Commute Time in Henry County
The most frequently occuring commute durations in Henry County are 5 to 9 minutes (3,875 commuters, 17.9%), 20 to 24 minutes (2,663 commuters, 12.3%), and 30 to 34 minutes (2,623 commuters, 12.1%).
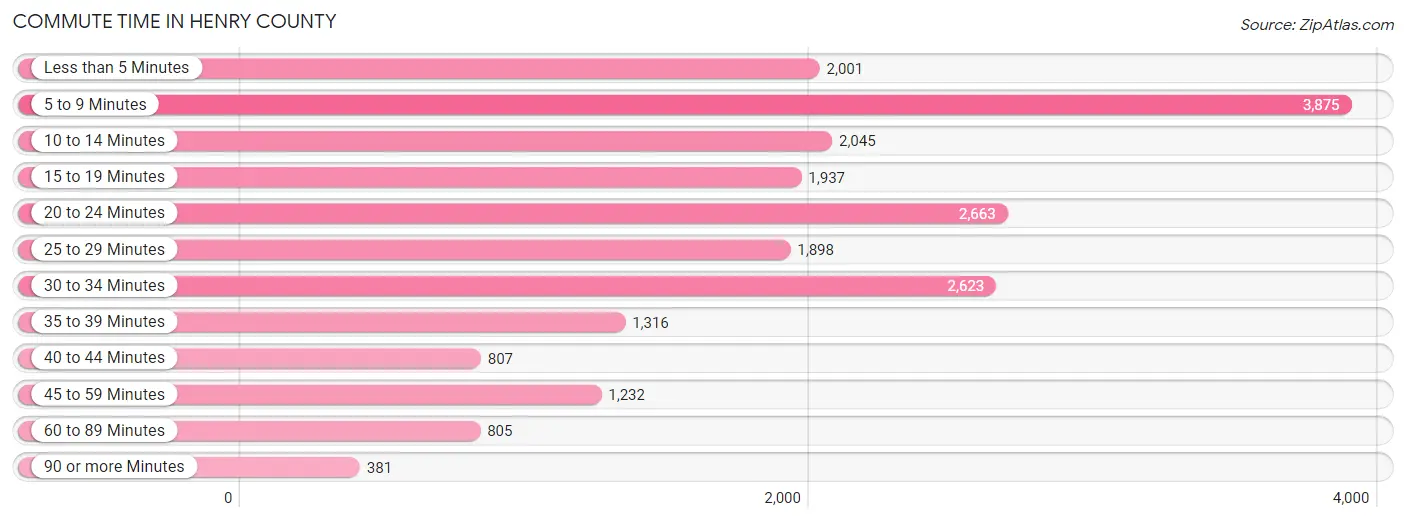
| Commute Time | # Commuters | % Commuters |
| Less than 5 Minutes | 2,001 | 9.3% |
| 5 to 9 Minutes | 3,875 | 17.9% |
| 10 to 14 Minutes | 2,045 | 9.5% |
| 15 to 19 Minutes | 1,937 | 9.0% |
| 20 to 24 Minutes | 2,663 | 12.3% |
| 25 to 29 Minutes | 1,898 | 8.8% |
| 30 to 34 Minutes | 2,623 | 12.1% |
| 35 to 39 Minutes | 1,316 | 6.1% |
| 40 to 44 Minutes | 807 | 3.7% |
| 45 to 59 Minutes | 1,232 | 5.7% |
| 60 to 89 Minutes | 805 | 3.7% |
| 90 or more Minutes | 381 | 1.8% |
Commute Time by Sex in Henry County
The most common commute times in Henry County are 30 to 34 minutes (1,626 commuters, 14.3%) for males and 5 to 9 minutes (2,362 commuters, 23.1%) for females.
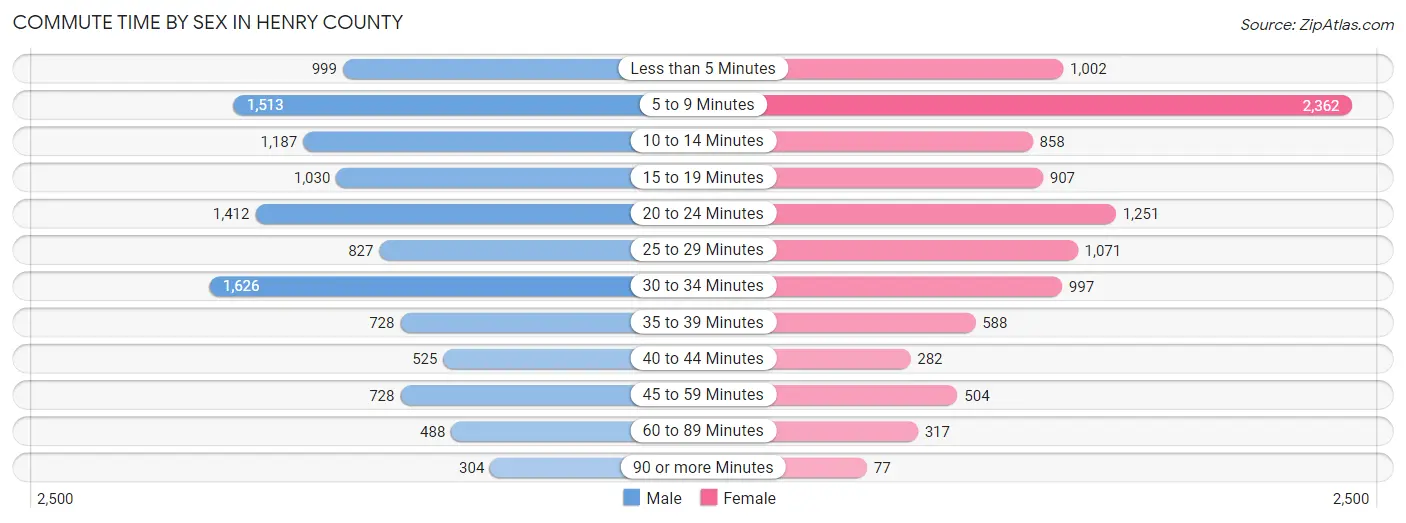
| Commute Time | Male | Female |
| Less than 5 Minutes | 999 (8.8%) | 1,002 (9.8%) |
| 5 to 9 Minutes | 1,513 (13.3%) | 2,362 (23.1%) |
| 10 to 14 Minutes | 1,187 (10.4%) | 858 (8.4%) |
| 15 to 19 Minutes | 1,030 (9.1%) | 907 (8.9%) |
| 20 to 24 Minutes | 1,412 (12.4%) | 1,251 (12.2%) |
| 25 to 29 Minutes | 827 (7.3%) | 1,071 (10.5%) |
| 30 to 34 Minutes | 1,626 (14.3%) | 997 (9.8%) |
| 35 to 39 Minutes | 728 (6.4%) | 588 (5.8%) |
| 40 to 44 Minutes | 525 (4.6%) | 282 (2.8%) |
| 45 to 59 Minutes | 728 (6.4%) | 504 (4.9%) |
| 60 to 89 Minutes | 488 (4.3%) | 317 (3.1%) |
| 90 or more Minutes | 304 (2.7%) | 77 (0.7%) |
Time of Departure to Work by Sex in Henry County
The most frequent times of departure to work in Henry County are 6:00 AM to 6:29 AM (1,585, 13.9%) for males and 7:00 AM to 7:29 AM (1,982, 19.4%) for females.
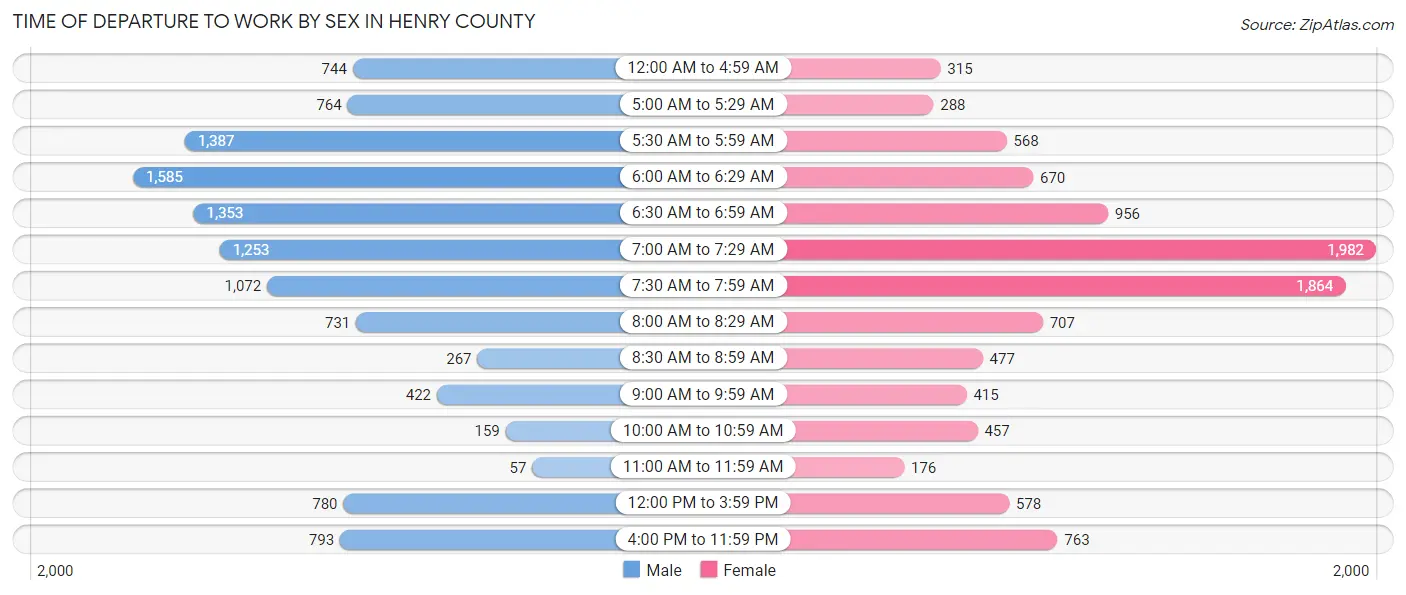
| Time of Departure | Male | Female |
| 12:00 AM to 4:59 AM | 744 (6.6%) | 315 (3.1%) |
| 5:00 AM to 5:29 AM | 764 (6.7%) | 288 (2.8%) |
| 5:30 AM to 5:59 AM | 1,387 (12.2%) | 568 (5.6%) |
| 6:00 AM to 6:29 AM | 1,585 (13.9%) | 670 (6.6%) |
| 6:30 AM to 6:59 AM | 1,353 (11.9%) | 956 (9.4%) |
| 7:00 AM to 7:29 AM | 1,253 (11.0%) | 1,982 (19.4%) |
| 7:30 AM to 7:59 AM | 1,072 (9.4%) | 1,864 (18.2%) |
| 8:00 AM to 8:29 AM | 731 (6.4%) | 707 (6.9%) |
| 8:30 AM to 8:59 AM | 267 (2.4%) | 477 (4.7%) |
| 9:00 AM to 9:59 AM | 422 (3.7%) | 415 (4.1%) |
| 10:00 AM to 10:59 AM | 159 (1.4%) | 457 (4.5%) |
| 11:00 AM to 11:59 AM | 57 (0.5%) | 176 (1.7%) |
| 12:00 PM to 3:59 PM | 780 (6.9%) | 578 (5.7%) |
| 4:00 PM to 11:59 PM | 793 (7.0%) | 763 (7.5%) |
| Total | 11,367 (100.0%) | 10,216 (100.0%) |
Housing Occupancy in Henry County
Occupancy by Ownership in Henry County
Of the total 20,187 dwellings in Henry County, owner-occupied units account for 16,103 (79.8%), while renter-occupied units make up 4,084 (20.2%).
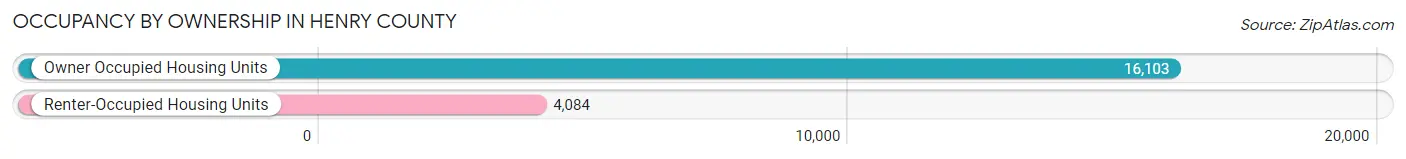
| Occupancy | # Housing Units | % Housing Units |
| Owner Occupied Housing Units | 16,103 | 79.8% |
| Renter-Occupied Housing Units | 4,084 | 20.2% |
| Total Occupied Housing Units | 20,187 | 100.0% |
Occupancy by Household Size in Henry County
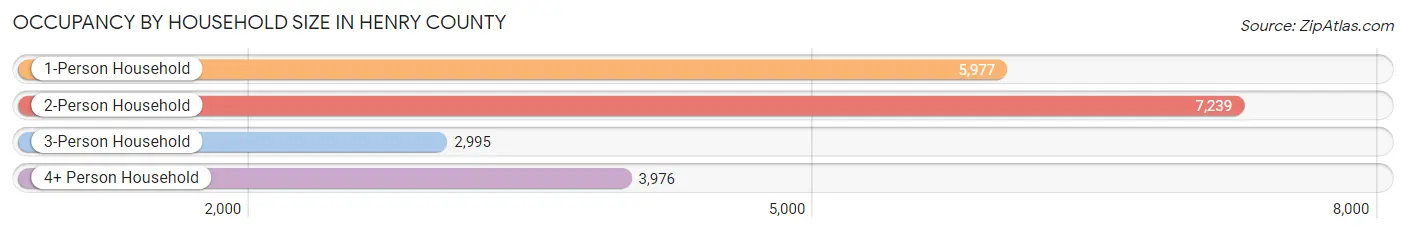
| Household Size | # Housing Units | % Housing Units |
| 1-Person Household | 5,977 | 29.6% |
| 2-Person Household | 7,239 | 35.9% |
| 3-Person Household | 2,995 | 14.8% |
| 4+ Person Household | 3,976 | 19.7% |
| Total Housing Units | 20,187 | 100.0% |
Occupancy by Ownership by Household Size in Henry County
| Household Size | Owner-occupied | Renter-occupied |
| 1-Person Household | 4,120 (68.9%) | 1,857 (31.1%) |
| 2-Person Household | 6,397 (88.4%) | 842 (11.6%) |
| 3-Person Household | 2,393 (79.9%) | 602 (20.1%) |
| 4+ Person Household | 3,193 (80.3%) | 783 (19.7%) |
| Total Housing Units | 16,103 (79.8%) | 4,084 (20.2%) |
Occupancy by Educational Attainment in Henry County
| Household Size | Owner-occupied | Renter-occupied |
| Less than High School | 818 (62.0%) | 502 (38.0%) |
| High School Diploma | 5,251 (77.4%) | 1,536 (22.6%) |
| College/Associate Degree | 5,384 (78.2%) | 1,501 (21.8%) |
| Bachelor's Degree or higher | 4,650 (89.5%) | 545 (10.5%) |
Occupancy by Age of Householder in Henry County
| Age Bracket | # Households | % Households |
| Under 35 Years | 2,885 | 14.3% |
| 35 to 44 Years | 3,338 | 16.5% |
| 45 to 54 Years | 3,341 | 16.6% |
| 55 to 64 Years | 4,068 | 20.2% |
| 65 to 74 Years | 3,629 | 18.0% |
| 75 to 84 Years | 1,965 | 9.7% |
| 85 Years and Over | 961 | 4.8% |
| Total | 20,187 | 100.0% |
Housing Finances in Henry County
Median Income by Occupancy in Henry County
| Occupancy Type | # Households | Median Income |
| Owner-Occupied | 16,103 (79.8%) | $77,409 |
| Renter-Occupied | 4,084 (20.2%) | $38,258 |
| Average | 20,187 (100.0%) | $66,313 |
Occupancy by Householder Income Bracket in Henry County
| Income Bracket | Owner-occupied | Renter-occupied |
| Less than $5,000 | 257 (1.6%) | 160 (3.9%) |
| $5,000 to $9,999 | 197 (1.2%) | 222 (5.4%) |
| $10,000 to $14,999 | 522 (3.2%) | 251 (6.1%) |
| $15,000 to $19,999 | 342 (2.1%) | 322 (7.9%) |
| $20,000 to $24,999 | 483 (3.0%) | 288 (7.0%) |
| $25,000 to $34,999 | 868 (5.4%) | 646 (15.8%) |
| $35,000 to $49,999 | 2,267 (14.1%) | 690 (16.9%) |
| $50,000 to $74,999 | 2,864 (17.8%) | 798 (19.5%) |
| $75,000 to $99,999 | 2,130 (13.2%) | 355 (8.7%) |
| $100,000 to $149,999 | 3,422 (21.2%) | 266 (6.5%) |
| $150,000 or more | 2,751 (17.1%) | 86 (2.1%) |
| Total | 16,103 (100.0%) | 4,084 (100.0%) |
Monthly Housing Cost Tiers in Henry County
| Monthly Cost | Owner-occupied | Renter-occupied |
| Less than $300 | 1,085 (6.7%) | 278 (6.8%) |
| $300 to $499 | 2,186 (13.6%) | 220 (5.4%) |
| $500 to $799 | 4,115 (25.6%) | 1,264 (30.9%) |
| $800 to $999 | 1,891 (11.7%) | 1,110 (27.2%) |
| $1,000 to $1,499 | 3,578 (22.2%) | 516 (12.6%) |
| $1,500 to $1,999 | 1,740 (10.8%) | 182 (4.5%) |
| $2,000 to $2,499 | 796 (4.9%) | 29 (0.7%) |
| $2,500 to $2,999 | 284 (1.8%) | 20 (0.5%) |
| $3,000 or more | 428 (2.7%) | 69 (1.7%) |
| Total | 16,103 (100.0%) | 4,084 (100.0%) |
Physical Housing Characteristics in Henry County
Housing Structures in Henry County
| Structure Type | # Housing Units | % Housing Units |
| Single Unit, Detached | 17,883 | 88.6% |
| Single Unit, Attached | 183 | 0.9% |
| 2 Unit Apartments | 615 | 3.0% |
| 3 or 4 Unit Apartments | 362 | 1.8% |
| 5 to 9 Unit Apartments | 223 | 1.1% |
| 10 or more Apartments | 549 | 2.7% |
| Mobile Home / Other | 372 | 1.8% |
| Total | 20,187 | 100.0% |
Housing Structures by Occupancy in Henry County
| Structure Type | Owner-occupied | Renter-occupied |
| Single Unit, Detached | 15,482 (86.6%) | 2,401 (13.4%) |
| Single Unit, Attached | 115 (62.8%) | 68 (37.2%) |
| 2 Unit Apartments | 203 (33.0%) | 412 (67.0%) |
| 3 or 4 Unit Apartments | 4 (1.1%) | 358 (98.9%) |
| 5 to 9 Unit Apartments | 8 (3.6%) | 215 (96.4%) |
| 10 or more Apartments | 34 (6.2%) | 515 (93.8%) |
| Mobile Home / Other | 257 (69.1%) | 115 (30.9%) |
| Total | 16,103 (79.8%) | 4,084 (20.2%) |
Housing Structures by Number of Rooms in Henry County
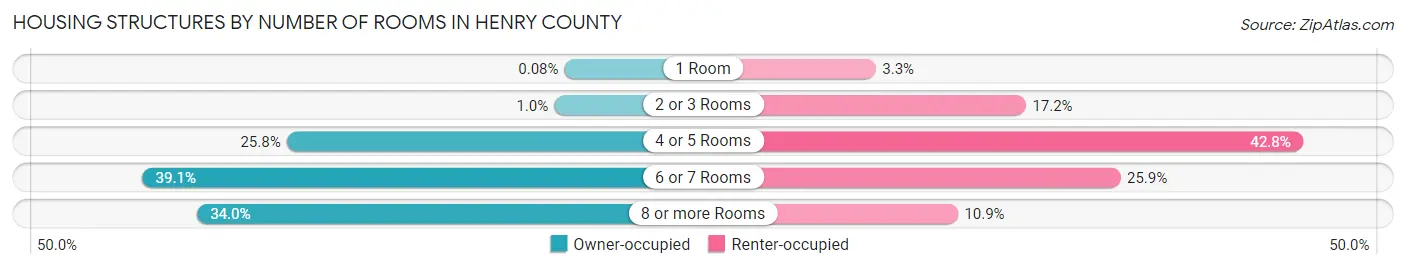
| Number of Rooms | Owner-occupied | Renter-occupied |
| 1 Room | 13 (0.1%) | 134 (3.3%) |
| 2 or 3 Rooms | 166 (1.0%) | 701 (17.2%) |
| 4 or 5 Rooms | 4,151 (25.8%) | 1,747 (42.8%) |
| 6 or 7 Rooms | 6,293 (39.1%) | 1,058 (25.9%) |
| 8 or more Rooms | 5,480 (34.0%) | 444 (10.9%) |
| Total | 16,103 (100.0%) | 4,084 (100.0%) |
Housing Structure by Heating Type in Henry County
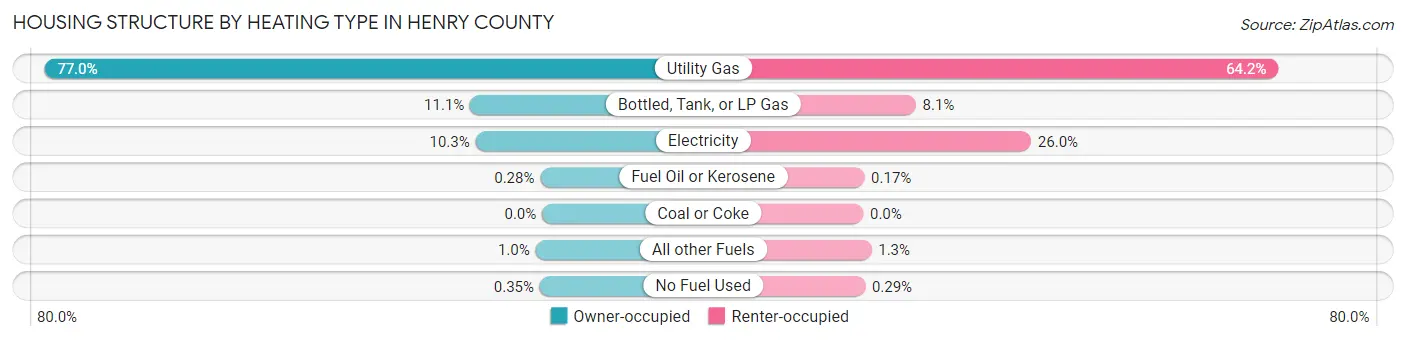
| Heating Type | Owner-occupied | Renter-occupied |
| Utility Gas | 12,391 (76.9%) | 2,621 (64.2%) |
| Bottled, Tank, or LP Gas | 1,790 (11.1%) | 332 (8.1%) |
| Electricity | 1,657 (10.3%) | 1,060 (26.0%) |
| Fuel Oil or Kerosene | 45 (0.3%) | 7 (0.2%) |
| Coal or Coke | 0 (0.0%) | 0 (0.0%) |
| All other Fuels | 163 (1.0%) | 52 (1.3%) |
| No Fuel Used | 57 (0.4%) | 12 (0.3%) |
| Total | 16,103 (100.0%) | 4,084 (100.0%) |
Household Vehicle Usage in Henry County
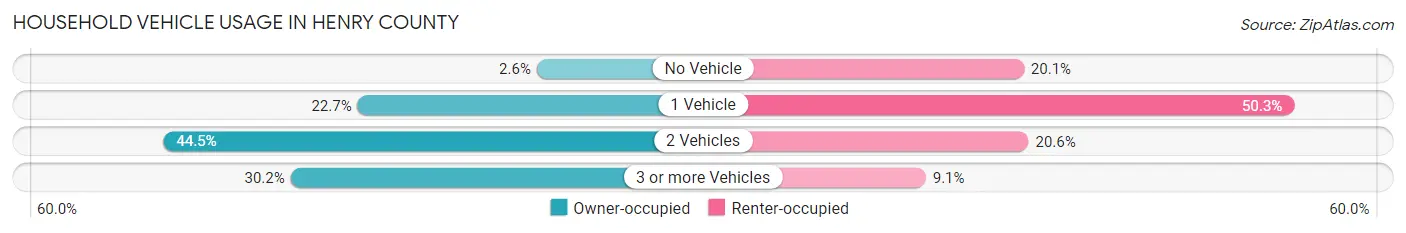
| Vehicles per Household | Owner-occupied | Renter-occupied |
| No Vehicle | 424 (2.6%) | 819 (20.1%) |
| 1 Vehicle | 3,657 (22.7%) | 2,055 (50.3%) |
| 2 Vehicles | 7,157 (44.5%) | 840 (20.6%) |
| 3 or more Vehicles | 4,865 (30.2%) | 370 (9.1%) |
| Total | 16,103 (100.0%) | 4,084 (100.0%) |
Real Estate & Mortgages in Henry County
Real Estate and Mortgage Overview in Henry County
| Characteristic | Without Mortgage | With Mortgage |
| Housing Units | 7,731 | 8,372 |
| Median Property Value | $122,400 | $153,700 |
| Median Household Income | $54,700 | $1,876 |
| Monthly Housing Costs | $548 | $395 |
| Real Estate Taxes | $2,536 | $83 |
Property Value by Mortgage Status in Henry County
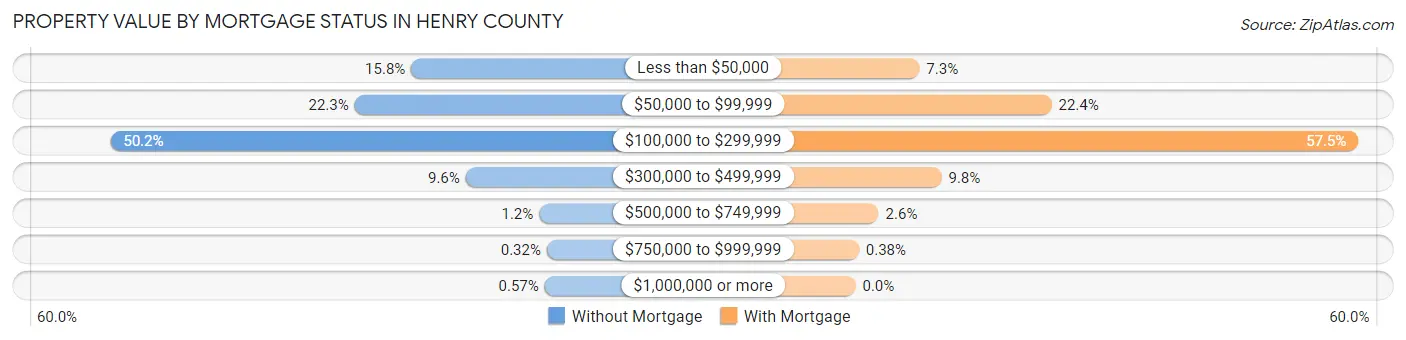
| Property Value | Without Mortgage | With Mortgage |
| Less than $50,000 | 1,223 (15.8%) | 611 (7.3%) |
| $50,000 to $99,999 | 1,723 (22.3%) | 1,875 (22.4%) |
| $100,000 to $299,999 | 3,881 (50.2%) | 4,810 (57.5%) |
| $300,000 to $499,999 | 742 (9.6%) | 823 (9.8%) |
| $500,000 to $749,999 | 93 (1.2%) | 221 (2.6%) |
| $750,000 to $999,999 | 25 (0.3%) | 32 (0.4%) |
| $1,000,000 or more | 44 (0.6%) | 0 (0.0%) |
| Total | 7,731 (100.0%) | 8,372 (100.0%) |
Household Income by Mortgage Status in Henry County
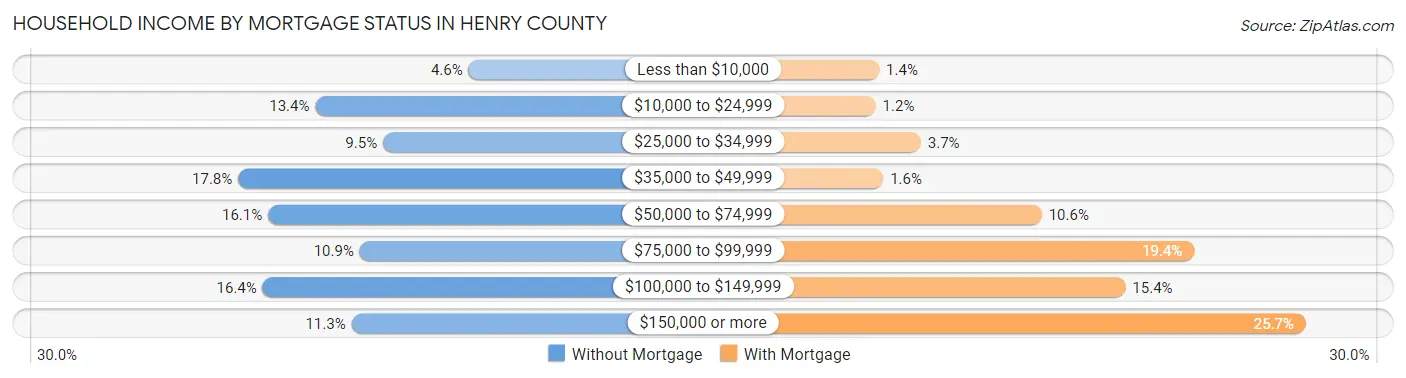
| Household Income | Without Mortgage | With Mortgage |
| Less than $10,000 | 358 (4.6%) | 113 (1.3%) |
| $10,000 to $24,999 | 1,035 (13.4%) | 96 (1.1%) |
| $25,000 to $34,999 | 736 (9.5%) | 312 (3.7%) |
| $35,000 to $49,999 | 1,376 (17.8%) | 132 (1.6%) |
| $50,000 to $74,999 | 1,244 (16.1%) | 891 (10.6%) |
| $75,000 to $99,999 | 839 (10.8%) | 1,620 (19.4%) |
| $100,000 to $149,999 | 1,268 (16.4%) | 1,291 (15.4%) |
| $150,000 or more | 875 (11.3%) | 2,154 (25.7%) |
| Total | 7,731 (100.0%) | 8,372 (100.0%) |
Property Value to Household Income Ratio in Henry County
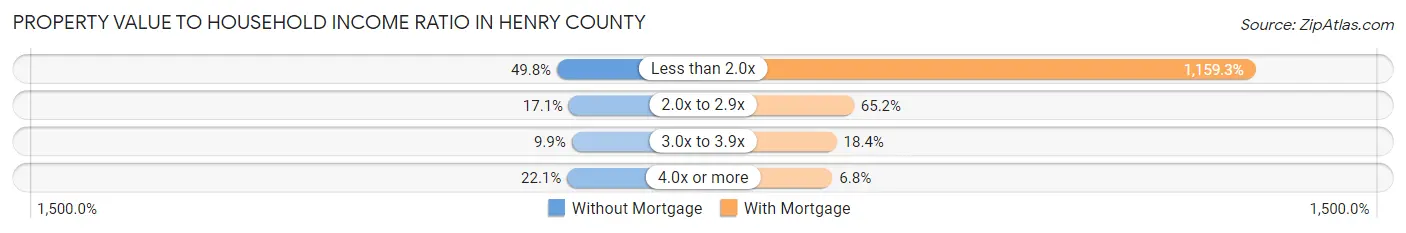
| Value-to-Income Ratio | Without Mortgage | With Mortgage |
| Less than 2.0x | 3,846 (49.7%) | 97,055 (1,159.3%) |
| 2.0x to 2.9x | 1,325 (17.1%) | 5,459 (65.2%) |
| 3.0x to 3.9x | 768 (9.9%) | 1,538 (18.4%) |
| 4.0x or more | 1,711 (22.1%) | 568 (6.8%) |
| Total | 7,731 (100.0%) | 8,372 (100.0%) |
Real Estate Taxes by Mortgage Status in Henry County

| Property Taxes | Without Mortgage | With Mortgage |
| Less than $800 | 1,238 (16.0%) | 52 (0.6%) |
| $800 to $1,499 | 1,191 (15.4%) | 616 (7.4%) |
| $800 to $1,499 | 4,943 (63.9%) | 1,048 (12.5%) |
| Total | 7,731 (100.0%) | 8,372 (100.0%) |
Health & Disability in Henry County
Health Insurance Coverage by Age in Henry County
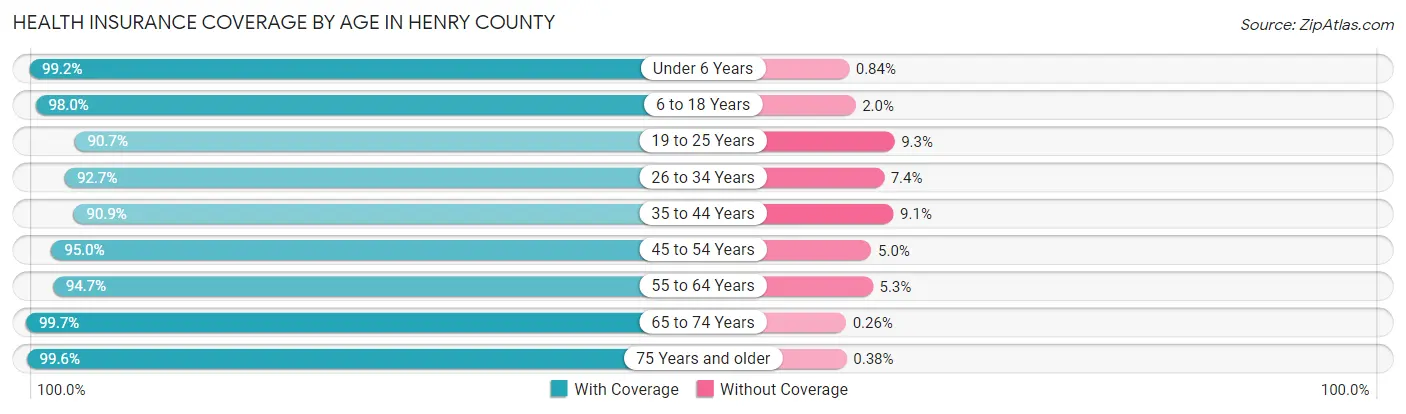
| Age Bracket | With Coverage | Without Coverage |
| Under 6 Years | 3,057 (99.2%) | 26 (0.8%) |
| 6 to 18 Years | 8,070 (98.0%) | 167 (2.0%) |
| 19 to 25 Years | 3,001 (90.7%) | 308 (9.3%) |
| 26 to 34 Years | 4,434 (92.6%) | 352 (7.3%) |
| 35 to 44 Years | 5,494 (90.9%) | 551 (9.1%) |
| 45 to 54 Years | 5,790 (95.0%) | 304 (5.0%) |
| 55 to 64 Years | 6,547 (94.7%) | 364 (5.3%) |
| 65 to 74 Years | 5,822 (99.7%) | 15 (0.3%) |
| 75 Years and older | 4,166 (99.6%) | 16 (0.4%) |
| Total | 46,381 (95.7%) | 2,103 (4.3%) |
Health Insurance Coverage by Citizenship Status in Henry County
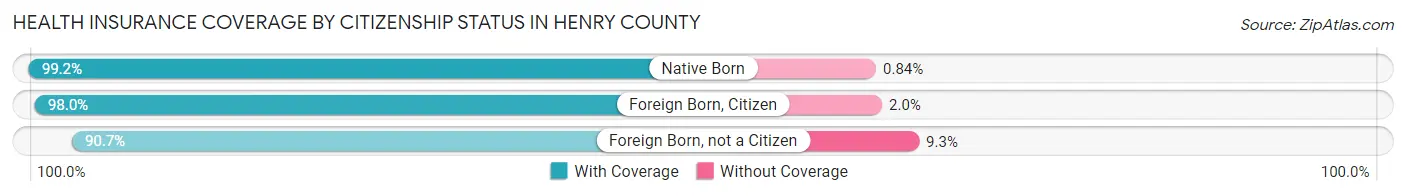
| Citizenship Status | With Coverage | Without Coverage |
| Native Born | 3,057 (99.2%) | 26 (0.8%) |
| Foreign Born, Citizen | 8,070 (98.0%) | 167 (2.0%) |
| Foreign Born, not a Citizen | 3,001 (90.7%) | 308 (9.3%) |
Health Insurance Coverage by Household Income in Henry County
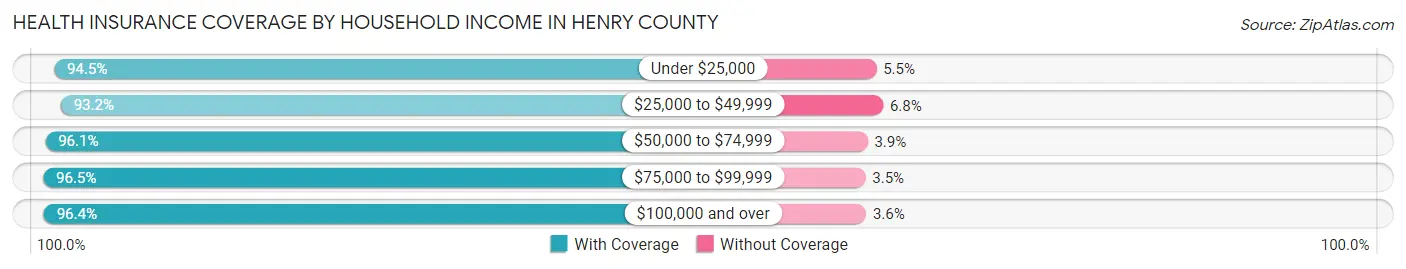
| Household Income | With Coverage | Without Coverage |
| Under $25,000 | 4,731 (94.5%) | 276 (5.5%) |
| $25,000 to $49,999 | 7,352 (93.2%) | 534 (6.8%) |
| $50,000 to $74,999 | 8,357 (96.1%) | 336 (3.9%) |
| $75,000 to $99,999 | 6,056 (96.5%) | 218 (3.5%) |
| $100,000 and over | 19,844 (96.4%) | 739 (3.6%) |
Public vs Private Health Insurance Coverage by Age in Henry County
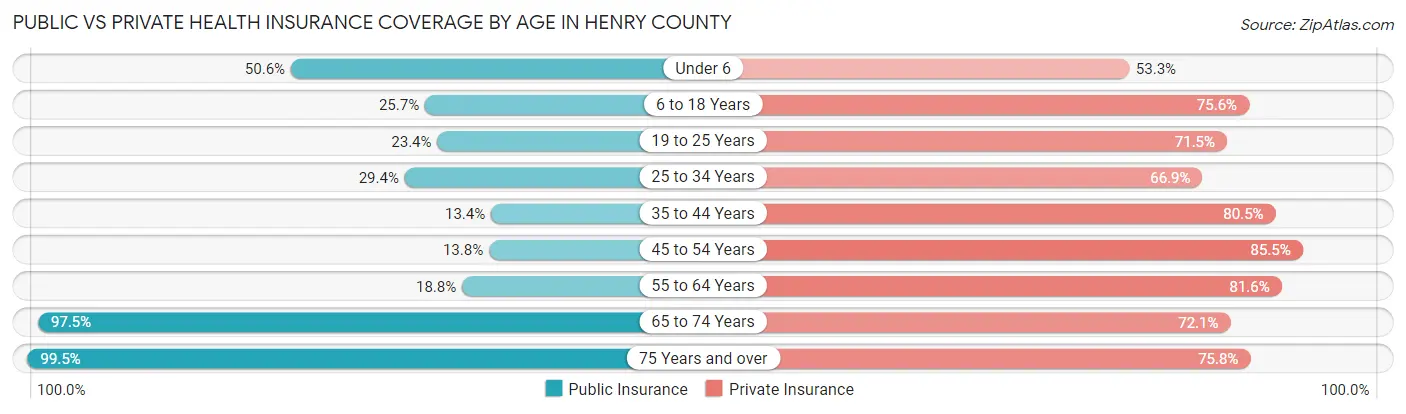
| Age Bracket | Public Insurance | Private Insurance |
| Under 6 | 1,559 (50.6%) | 1,643 (53.3%) |
| 6 to 18 Years | 2,115 (25.7%) | 6,224 (75.6%) |
| 19 to 25 Years | 774 (23.4%) | 2,365 (71.5%) |
| 25 to 34 Years | 1,409 (29.4%) | 3,203 (66.9%) |
| 35 to 44 Years | 811 (13.4%) | 4,865 (80.5%) |
| 45 to 54 Years | 841 (13.8%) | 5,212 (85.5%) |
| 55 to 64 Years | 1,299 (18.8%) | 5,640 (81.6%) |
| 65 to 74 Years | 5,693 (97.5%) | 4,209 (72.1%) |
| 75 Years and over | 4,160 (99.5%) | 3,170 (75.8%) |
| Total | 18,661 (38.5%) | 36,531 (75.3%) |
Disability Status by Sex by Age in Henry County
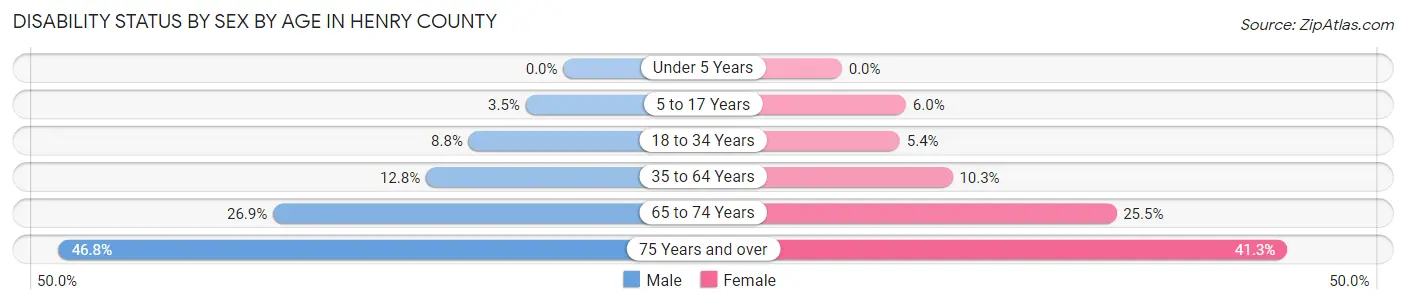
| Age Bracket | Male | Female |
| Under 5 Years | 0 (0.0%) | 0 (0.0%) |
| 5 to 17 Years | 145 (3.5%) | 243 (5.9%) |
| 18 to 34 Years | 389 (8.8%) | 227 (5.4%) |
| 35 to 64 Years | 1,211 (12.8%) | 981 (10.3%) |
| 65 to 74 Years | 779 (26.9%) | 750 (25.5%) |
| 75 Years and over | 856 (46.8%) | 973 (41.3%) |
Disability Class by Sex by Age in Henry County
Disability Class: Hearing Difficulty
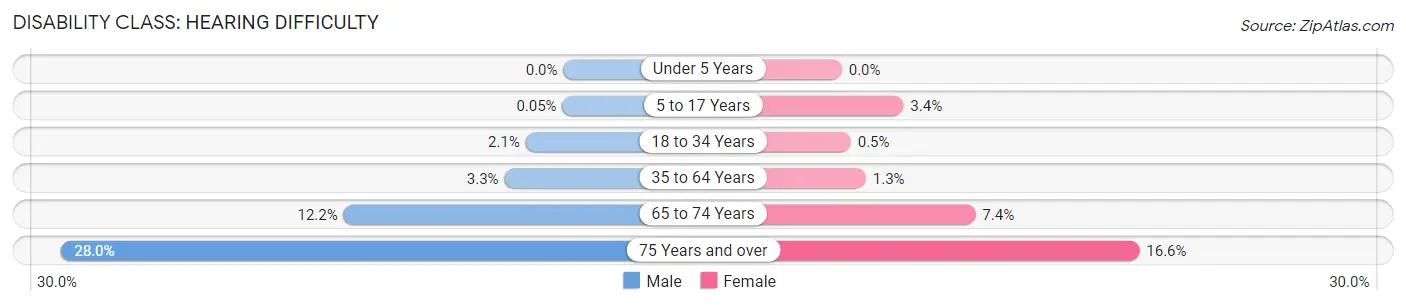
| Age Bracket | Male | Female |
| Under 5 Years | 0 (0.0%) | 0 (0.0%) |
| 5 to 17 Years | 2 (0.1%) | 140 (3.4%) |
| 18 to 34 Years | 93 (2.1%) | 21 (0.5%) |
| 35 to 64 Years | 312 (3.3%) | 128 (1.3%) |
| 65 to 74 Years | 354 (12.2%) | 219 (7.4%) |
| 75 Years and over | 511 (28.0%) | 390 (16.6%) |
Disability Class: Vision Difficulty
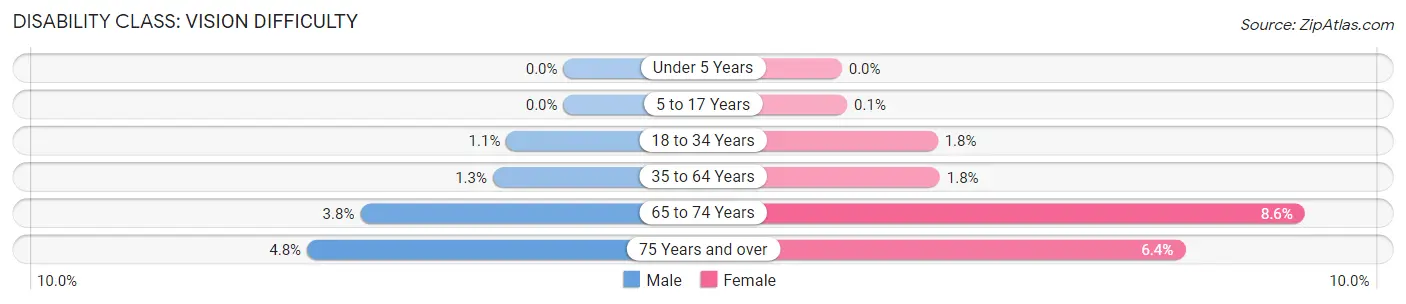
| Age Bracket | Male | Female |
| Under 5 Years | 0 (0.0%) | 0 (0.0%) |
| 5 to 17 Years | 0 (0.0%) | 4 (0.1%) |
| 18 to 34 Years | 47 (1.1%) | 75 (1.8%) |
| 35 to 64 Years | 124 (1.3%) | 174 (1.8%) |
| 65 to 74 Years | 109 (3.8%) | 253 (8.6%) |
| 75 Years and over | 87 (4.8%) | 150 (6.4%) |
Disability Class: Cognitive Difficulty
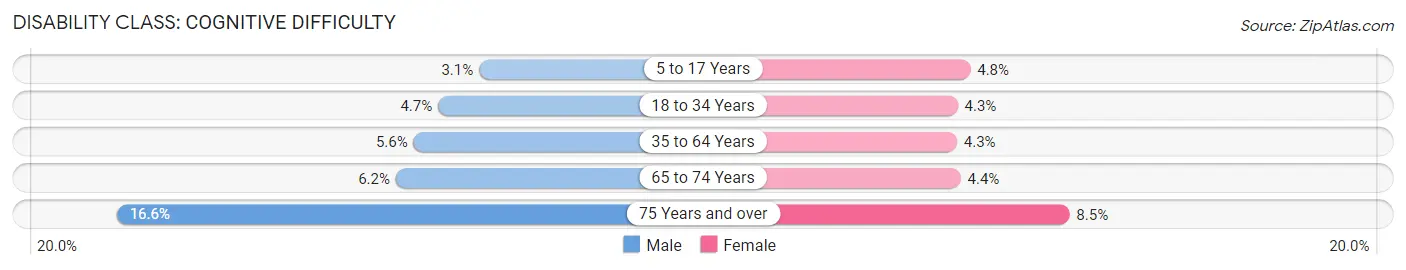
| Age Bracket | Male | Female |
| 5 to 17 Years | 130 (3.1%) | 195 (4.8%) |
| 18 to 34 Years | 206 (4.6%) | 181 (4.3%) |
| 35 to 64 Years | 528 (5.6%) | 408 (4.3%) |
| 65 to 74 Years | 180 (6.2%) | 130 (4.4%) |
| 75 Years and over | 303 (16.6%) | 199 (8.5%) |
Disability Class: Ambulatory Difficulty
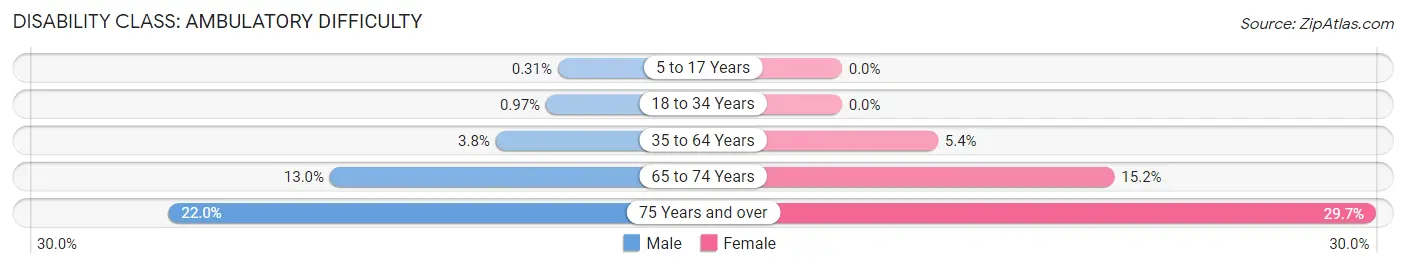
| Age Bracket | Male | Female |
| 5 to 17 Years | 13 (0.3%) | 0 (0.0%) |
| 18 to 34 Years | 43 (1.0%) | 0 (0.0%) |
| 35 to 64 Years | 358 (3.8%) | 511 (5.3%) |
| 65 to 74 Years | 376 (13.0%) | 447 (15.2%) |
| 75 Years and over | 402 (22.0%) | 700 (29.7%) |
Disability Class: Self-Care Difficulty
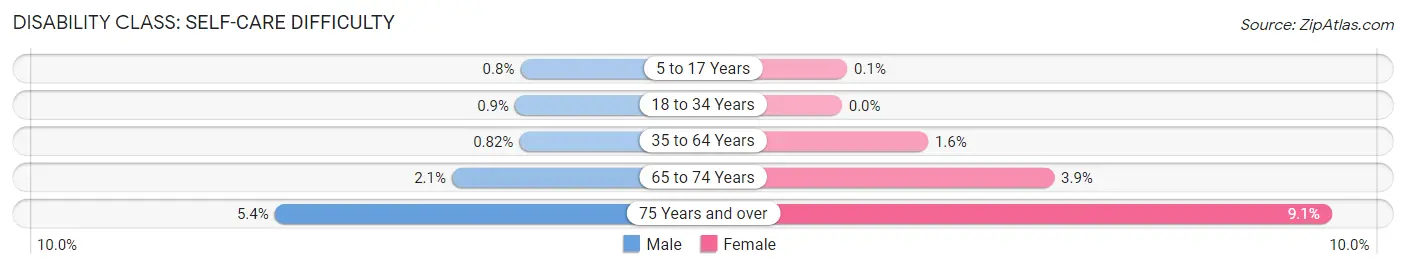
| Age Bracket | Male | Female |
| 5 to 17 Years | 33 (0.8%) | 4 (0.1%) |
| 18 to 34 Years | 40 (0.9%) | 0 (0.0%) |
| 35 to 64 Years | 78 (0.8%) | 153 (1.6%) |
| 65 to 74 Years | 60 (2.1%) | 116 (3.9%) |
| 75 Years and over | 98 (5.4%) | 214 (9.1%) |
Technology Access in Henry County
Computing Device Access in Henry County
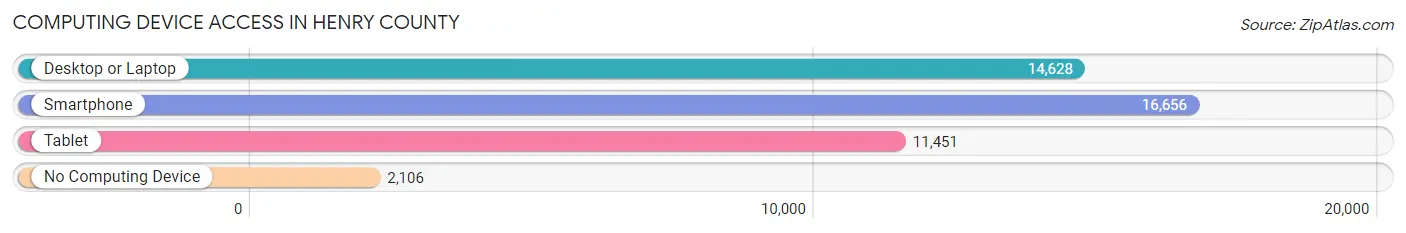
| Device Type | # Households | % Households |
| Desktop or Laptop | 14,628 | 72.5% |
| Smartphone | 16,656 | 82.5% |
| Tablet | 11,451 | 56.7% |
| No Computing Device | 2,106 | 10.4% |
| Total | 20,187 | 100.0% |
Internet Access in Henry County
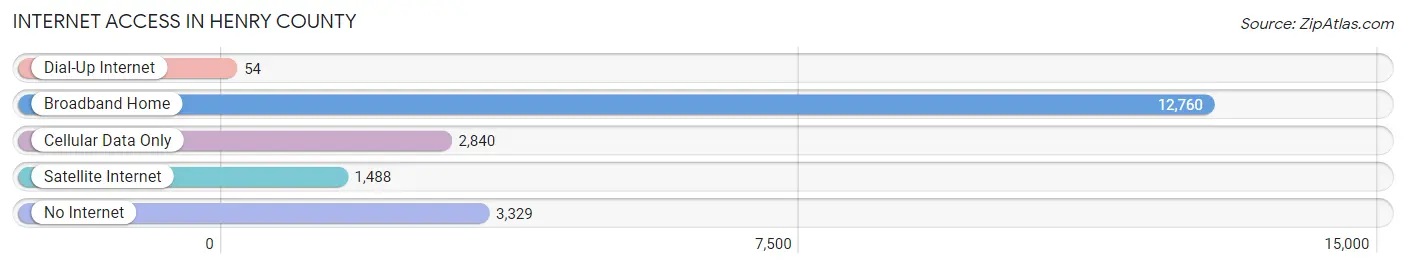
| Internet Type | # Households | % Households |
| Dial-Up Internet | 54 | 0.3% |
| Broadband Home | 12,760 | 63.2% |
| Cellular Data Only | 2,840 | 14.1% |
| Satellite Internet | 1,488 | 7.4% |
| No Internet | 3,329 | 16.5% |
| Total | 20,187 | 100.0% |
Henry County Summary
Henry County is located in the northwestern corner of Illinois, and is part of the Quad Cities metropolitan area. It is bordered by Rock Island County to the north, Mercer County to the east, Whiteside County to the south, and Iowa to the west. The county seat is Cambridge, and the largest city is Geneseo. The county was established in 1825 and named after Patrick Henry, a Revolutionary War hero and the first Governor of Virginia.
Geography
Henry County covers an area of 576 square miles, of which 574 square miles is land and 2 square miles is water. The county is mostly flat, with some rolling hills in the northern and western parts. The highest point in the county is located in the northwest corner, at an elevation of 810 feet. The county is drained by the Rock River, which forms the western border, and its tributaries, the Green River and the Hennepin Canal.
The climate of Henry County is humid continental, with cold winters and hot, humid summers. The average annual temperature is 48°F, and the average annual precipitation is 33 inches.
Economy
The economy of Henry County is largely based on agriculture. The county is home to a number of large farms, and the main crops grown are corn, soybeans, and wheat. Other important industries in the county include manufacturing, retail, and tourism.
The largest employers in the county are the Henry County Health Department, the Henry County School District, and the Henry County Sheriff's Office. Other major employers include the Geneseo Community Unit School District, the Geneseo Public Library, and the Geneseo Community Hospital.
Demographics
As of the 2010 census, Henry County had a population of 50,486. The racial makeup of the county was 94.3% White, 1.3% African American, 0.4% Native American, 0.7% Asian, 0.1% Pacific Islander, 1.7% from other races, and 1.5% from two or more races. Hispanic or Latino of any race were 4.2% of the population.
The median household income in the county was $54,845, and the median family income was $63,945. The per capita income was $25,845. About 8.3% of the population was below the poverty line.
Education
Henry County is served by the Henry County Community Unit School District, which operates seven elementary schools, two middle schools, and two high schools. The county is also home to a number of private schools, including St. Mary's Catholic School and Geneseo Christian Academy.
The county is served by Black Hawk College, a two-year community college located in Moline, Illinois. The college offers a variety of associate's degrees and certificate programs.
Conclusion
Henry County is a rural county located in the northwestern corner of Illinois. It is home to a number of large farms, and the main crops grown are corn, soybeans, and wheat. The county is also home to a number of manufacturing, retail, and tourism businesses. The population of the county is largely white, and the median household income is slightly above the state average. The county is served by the Henry County Community Unit School District, as well as a number of private schools and Black Hawk College.
Common Questions
What is the Total Population of Henry County?
Total Population of Henry County is 49,157.
What is the Total Male Population of Henry County?
Total Male Population of Henry County is 24,530.
What is the Total Female Population of Henry County?
Total Female Population of Henry County is 24,627.
What is the Ratio of Males per 100 Females in Henry County?
There are 99.61 Males per 100 Females in Henry County.
What is the Ratio of Females per 100 Males in Henry County?
There are 100.40 Females per 100 Males in Henry County.
What is the Median Population Age in Henry County?
Median Population Age in Henry County is 43.5 Years.
What is the Average Family Size in Henry County
Average Family Size in Henry County is 3.0 People.
What is the Average Household Size in Henry County
Average Household Size in Henry County is 2.4 People.
What is Per Capita Income in Henry County?
Per Capita income in Henry County is $37,212.
What is the Median Family Income in Henry County?
Median Family Income in Henry County is $86,547.
What is the Median Household income in Henry County?
Median Household Income in Henry County is $66,313.
What is Income or Wage Gap in Henry County?
Income or Wage Gap in Henry County is 33.2%.
Women in Henry County earn 66.8 cents for every dollar earned by a man.
What is Family Income Deficit in Henry County?
Family Income Deficit in Henry County is $11,031.
Families that are below poverty line in Henry County earn $11,031 less on average than the poverty threshold level.
What is Inequality or Gini Index in Henry County?
Inequality or Gini Index in Henry County is 0.44.
How Large is the Labor Force in Henry County?
There are 24,490 People in the Labor Forcein in Henry County.
What is the Percentage of People in the Labor Force in Henry County?
61.6% of People are in the Labor Force in Henry County.
What is the Unemployment Rate in Henry County?
Unemployment Rate in Henry County is 4.5%.