Grundy County, IL
Grundy County Map
Grundy County Overview
52,624
TOTAL POPULATION
26,702
MALE POPULATION
25,922
FEMALE POPULATION
103.01
MALES / 100 FEMALES
97.08
FEMALES / 100 MALES
38.8
MEDIAN AGE
3.1
AVG FAMILY SIZE
2.6
AVG HOUSEHOLD SIZE
$42,192
PER CAPITA INCOME
$107,740
AVG FAMILY INCOME
$89,993
AVG HOUSEHOLD INCOME
45.0%
WAGE / INCOME GAP [ % ]
55.0¢/ $1
WAGE / INCOME GAP [ $ ]
$8,600
FAMILY INCOME DEFICIT
0.40
INEQUALITY / GINI INDEX
28,014
LABOR FORCE [ PEOPLE ]
68.1%
PERCENT IN LABOR FORCE
4.2%
UNEMPLOYMENT RATE
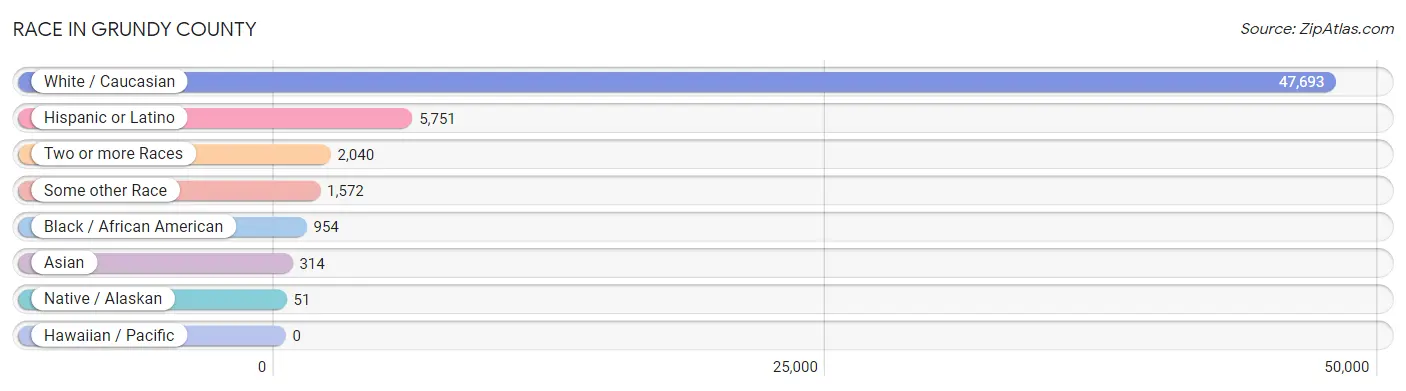
Race in Grundy County
The most populous races in Grundy County are White / Caucasian (47,693 | 90.6%), Hispanic or Latino (5,751 | 10.9%), and Two or more Races (2,040 | 3.9%).
| Race | # Population | % Population |
| Asian | 314 | 0.6% |
| Black / African American | 954 | 1.8% |
| Hawaiian / Pacific | 0 | 0.0% |
| Hispanic or Latino | 5,751 | 10.9% |
| Native / Alaskan | 51 | 0.1% |
| White / Caucasian | 47,693 | 90.6% |
| Two or more Races | 2,040 | 3.9% |
| Some other Race | 1,572 | 3.0% |
| Total | 52,624 | 100.0% |
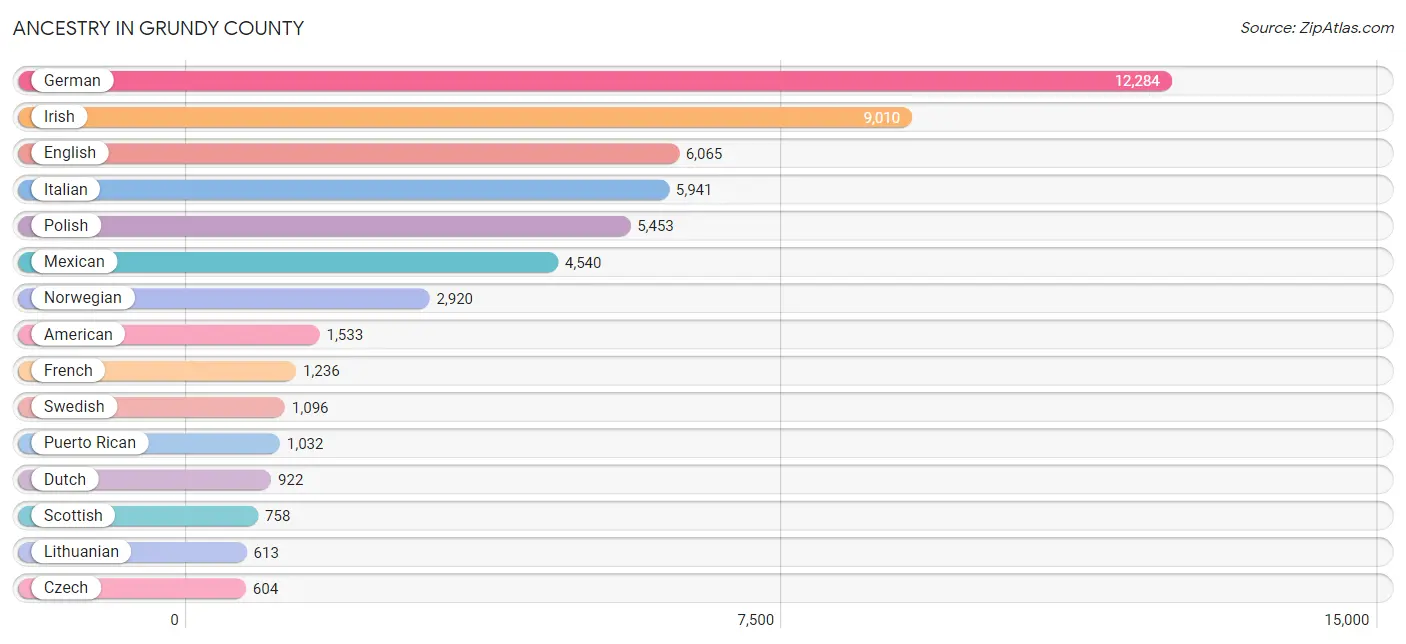
Ancestry in Grundy County
The most populous ancestries reported in Grundy County are German (12,284 | 23.3%), Irish (9,010 | 17.1%), English (6,065 | 11.5%), Italian (5,941 | 11.3%), and Polish (5,453 | 10.4%), together accounting for 73.6% of all Grundy County residents.
| Ancestry | # Population | % Population |
| African | 178 | 0.3% |
| Albanian | 482 | 0.9% |
| American | 1,533 | 2.9% |
| Apache | 1 | 0.0% |
| Arab | 55 | 0.1% |
| Australian | 2 | 0.0% |
| Austrian | 75 | 0.1% |
| Belgian | 97 | 0.2% |
| Belizean | 4 | 0.0% |
| Bhutanese | 81 | 0.2% |
| Blackfeet | 4 | 0.0% |
| British | 232 | 0.4% |
| Bulgarian | 43 | 0.1% |
| Burmese | 8 | 0.0% |
| Cajun | 6 | 0.0% |
| Canadian | 8 | 0.0% |
| Central American | 19 | 0.0% |
| Cherokee | 50 | 0.1% |
| Cheyenne | 8 | 0.0% |
| Choctaw | 35 | 0.1% |
| Colombian | 32 | 0.1% |
| Croatian | 237 | 0.4% |
| Cuban | 46 | 0.1% |
| Czech | 604 | 1.1% |
| Czechoslovakian | 99 | 0.2% |
| Danish | 298 | 0.6% |
| Dutch | 922 | 1.8% |
| Eastern European | 185 | 0.4% |
| English | 6,065 | 11.5% |
| Ethiopian | 11 | 0.0% |
| European | 358 | 0.7% |
| Finnish | 109 | 0.2% |
| French | 1,236 | 2.4% |
| French Canadian | 88 | 0.2% |
| German | 12,284 | 23.3% |
| Greek | 135 | 0.3% |
| Haitian | 15 | 0.0% |
| Hungarian | 83 | 0.2% |
| Icelander | 1 | 0.0% |
| Indian (Asian) | 35 | 0.1% |
| Irish | 9,010 | 17.1% |
| Italian | 5,941 | 11.3% |
| Japanese | 3 | 0.0% |
| Kenyan | 3 | 0.0% |
| Korean | 328 | 0.6% |
| Lebanese | 36 | 0.1% |
| Lithuanian | 613 | 1.2% |
| Luxembourger | 20 | 0.0% |
| Mexican | 4,540 | 8.6% |
| Mexican American Indian | 12 | 0.0% |
| Navajo | 11 | 0.0% |
| Nicaraguan | 17 | 0.0% |
| Nigerian | 8 | 0.0% |
| Northern European | 44 | 0.1% |
| Norwegian | 2,920 | 5.6% |
| Pakistani | 169 | 0.3% |
| Palestinian | 17 | 0.0% |
| Peruvian | 7 | 0.0% |
| Polish | 5,453 | 10.4% |
| Portuguese | 9 | 0.0% |
| Puerto Rican | 1,032 | 2.0% |
| Romanian | 29 | 0.1% |
| Russian | 50 | 0.1% |
| Salvadoran | 2 | 0.0% |
| Scandinavian | 57 | 0.1% |
| Scotch-Irish | 510 | 1.0% |
| Scottish | 758 | 1.4% |
| Serbian | 14 | 0.0% |
| Sioux | 1 | 0.0% |
| Slavic | 43 | 0.1% |
| Slovak | 440 | 0.8% |
| Slovene | 161 | 0.3% |
| South African | 1 | 0.0% |
| South American | 88 | 0.2% |
| Spaniard | 14 | 0.0% |
| Sri Lankan | 40 | 0.1% |
| Subsaharan African | 308 | 0.6% |
| Swedish | 1,096 | 2.1% |
| Swiss | 49 | 0.1% |
| Syrian | 2 | 0.0% |
| Thai | 113 | 0.2% |
| Ukrainian | 93 | 0.2% |
| Uruguayan | 49 | 0.1% |
| Welsh | 147 | 0.3% |
| Yugoslavian | 27 | 0.1% | View All 85 Rows |
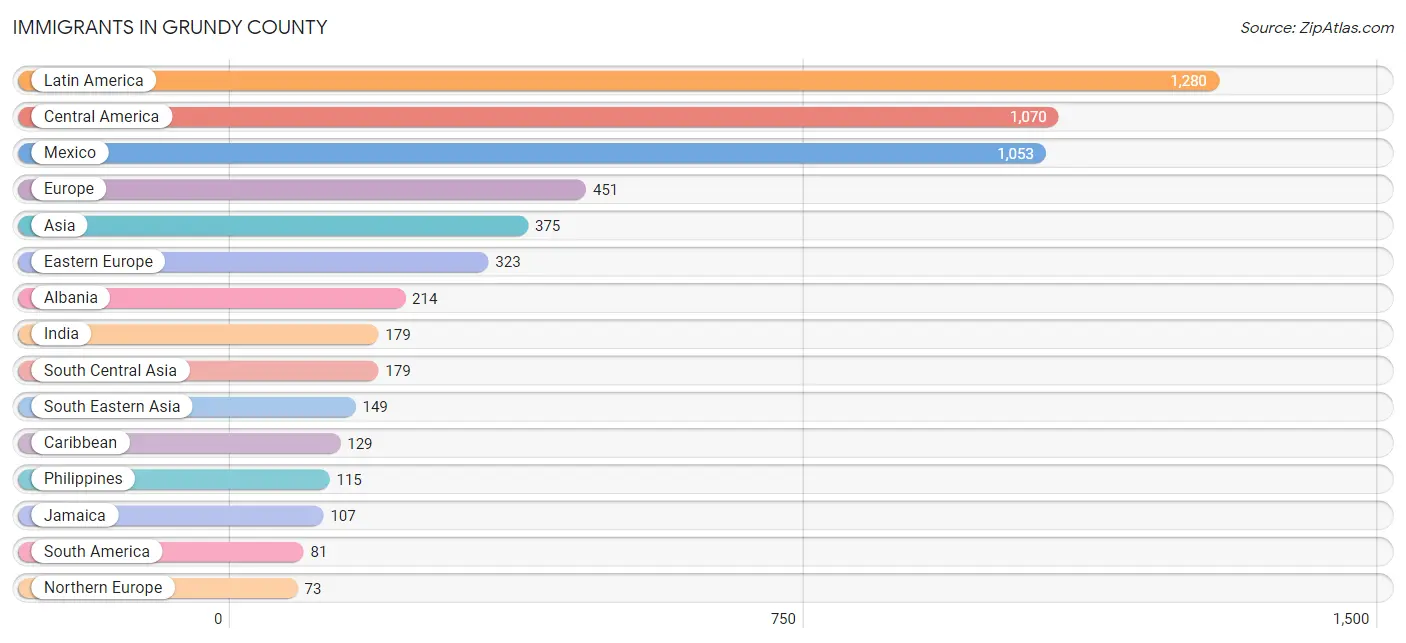
Immigrants in Grundy County
The most numerous immigrant groups reported in Grundy County came from Latin America (1,280 | 2.4%), Central America (1,070 | 2.0%), Mexico (1,053 | 2.0%), Europe (451 | 0.9%), and Asia (375 | 0.7%), together accounting for 8.0% of all Grundy County residents.
| Immigration Origin | # Population | % Population |
| Africa | 3 | 0.0% |
| Albania | 214 | 0.4% |
| Asia | 375 | 0.7% |
| Australia | 2 | 0.0% |
| Bulgaria | 24 | 0.1% |
| Cambodia | 3 | 0.0% |
| Canada | 1 | 0.0% |
| Caribbean | 129 | 0.3% |
| Central America | 1,070 | 2.0% |
| China | 12 | 0.0% |
| Colombia | 32 | 0.1% |
| Cuba | 7 | 0.0% |
| Eastern Africa | 3 | 0.0% |
| Eastern Asia | 30 | 0.1% |
| Eastern Europe | 323 | 0.6% |
| England | 28 | 0.1% |
| Europe | 451 | 0.9% |
| France | 12 | 0.0% |
| Germany | 12 | 0.0% |
| Greece | 22 | 0.0% |
| Haiti | 15 | 0.0% |
| India | 179 | 0.3% |
| Israel | 17 | 0.0% |
| Italy | 6 | 0.0% |
| Jamaica | 107 | 0.2% |
| Japan | 18 | 0.0% |
| Kenya | 3 | 0.0% |
| Latin America | 1,280 | 2.4% |
| Lithuania | 9 | 0.0% |
| Mexico | 1,053 | 2.0% |
| Nicaragua | 17 | 0.0% |
| North Macedonia | 18 | 0.0% |
| Northern Europe | 73 | 0.1% |
| Oceania | 2 | 0.0% |
| Philippines | 115 | 0.2% |
| Poland | 58 | 0.1% |
| South America | 81 | 0.2% |
| South Central Asia | 179 | 0.3% |
| South Eastern Asia | 149 | 0.3% |
| Southern Europe | 31 | 0.1% |
| Spain | 3 | 0.0% |
| Sweden | 20 | 0.0% |
| Thailand | 31 | 0.1% |
| Uruguay | 49 | 0.1% |
| Western Asia | 17 | 0.0% |
| Western Europe | 24 | 0.1% | View All 46 Rows |
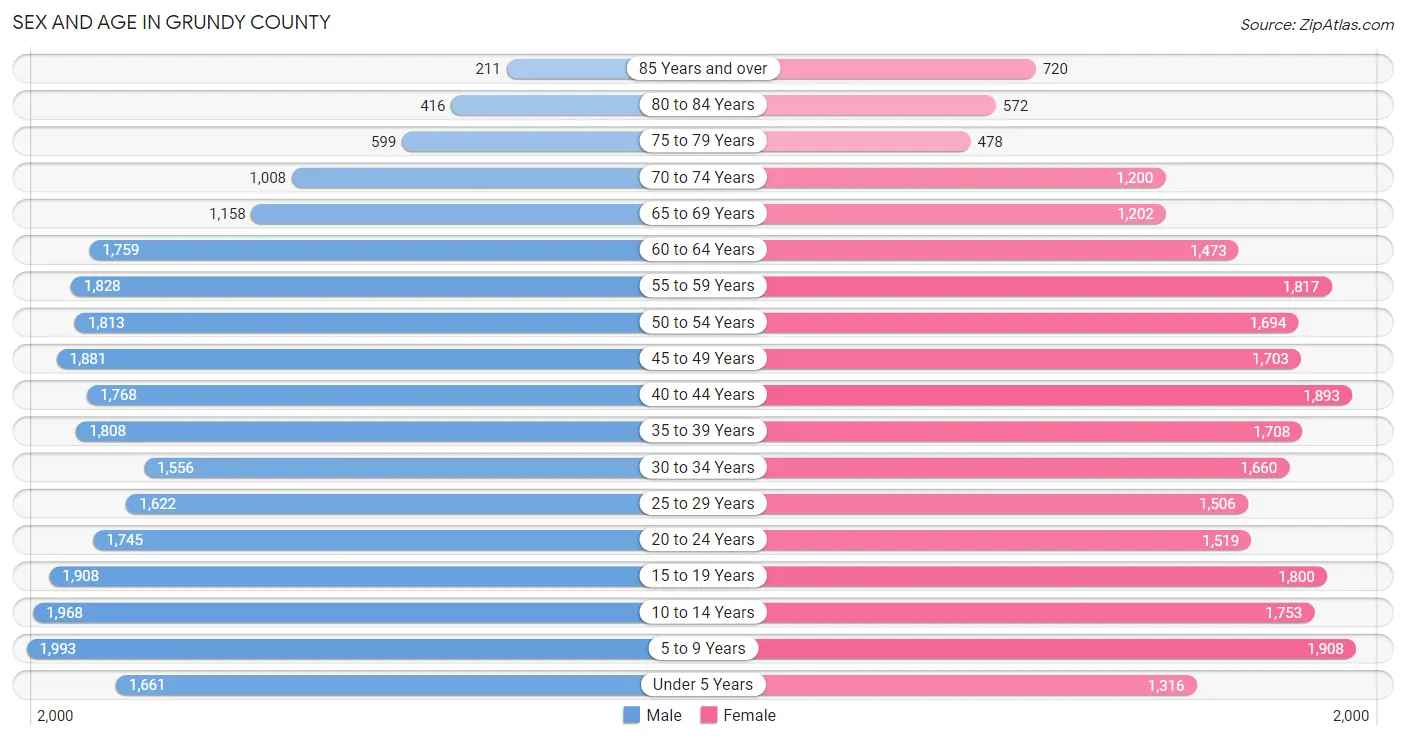
Sex and Age in Grundy County
Sex and Age in Grundy County
The most populous age groups in Grundy County are 5 to 9 Years (1,993 | 7.5%) for men and 5 to 9 Years (1,908 | 7.4%) for women.
| Age Bracket | Male | Female |
| Under 5 Years | 1,661 (6.2%) | 1,316 (5.1%) |
| 5 to 9 Years | 1,993 (7.5%) | 1,908 (7.4%) |
| 10 to 14 Years | 1,968 (7.4%) | 1,753 (6.8%) |
| 15 to 19 Years | 1,908 (7.1%) | 1,800 (6.9%) |
| 20 to 24 Years | 1,745 (6.5%) | 1,519 (5.9%) |
| 25 to 29 Years | 1,622 (6.1%) | 1,506 (5.8%) |
| 30 to 34 Years | 1,556 (5.8%) | 1,660 (6.4%) |
| 35 to 39 Years | 1,808 (6.8%) | 1,708 (6.6%) |
| 40 to 44 Years | 1,768 (6.6%) | 1,893 (7.3%) |
| 45 to 49 Years | 1,881 (7.0%) | 1,703 (6.6%) |
| 50 to 54 Years | 1,813 (6.8%) | 1,694 (6.5%) |
| 55 to 59 Years | 1,828 (6.9%) | 1,817 (7.0%) |
| 60 to 64 Years | 1,759 (6.6%) | 1,473 (5.7%) |
| 65 to 69 Years | 1,158 (4.3%) | 1,202 (4.6%) |
| 70 to 74 Years | 1,008 (3.8%) | 1,200 (4.6%) |
| 75 to 79 Years | 599 (2.2%) | 478 (1.8%) |
| 80 to 84 Years | 416 (1.6%) | 572 (2.2%) |
| 85 Years and over | 211 (0.8%) | 720 (2.8%) |
| Total | 26,702 (100.0%) | 25,922 (100.0%) |
Families and Households in Grundy County
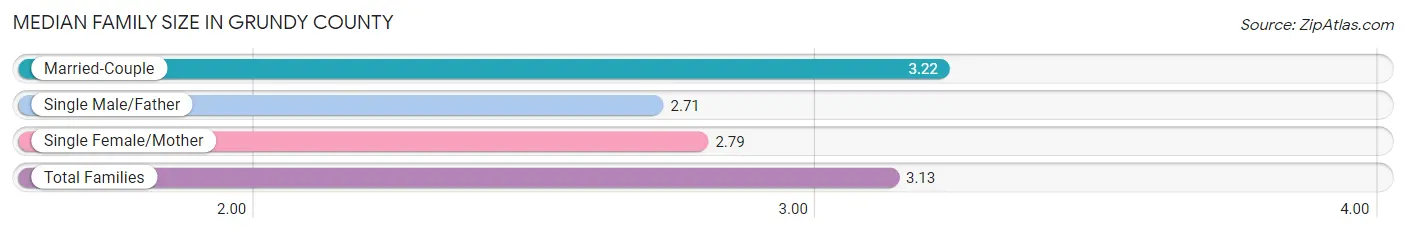
Median Family Size in Grundy County
The median family size in Grundy County is 3.13 persons per family, with married-couple families (11,058 | 79.7%) accounting for the largest median family size of 3.22 persons per family. On the other hand, single male/father families (1,171 | 8.4%) represent the smallest median family size with 2.71 persons per family.
| Family Type | # Families | Family Size |
| Married-Couple | 11,058 (79.7%) | 3.22 |
| Single Male/Father | 1,171 (8.4%) | 2.71 |
| Single Female/Mother | 1,651 (11.9%) | 2.79 |
| Total Families | 13,880 (100.0%) | 3.13 |
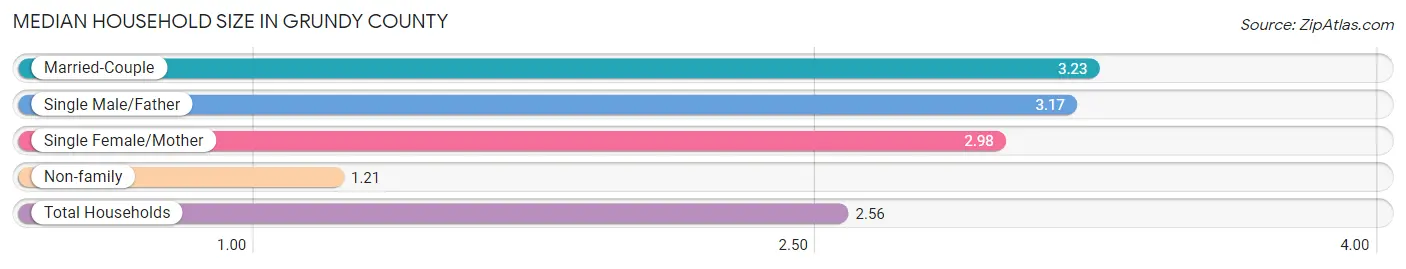
Median Household Size in Grundy County
The median household size in Grundy County is 2.56 persons per household, with married-couple households (11,058 | 54.3%) accounting for the largest median household size of 3.23 persons per household. non-family households (6,496 | 31.9%) represent the smallest median household size with 1.21 persons per household.
| Household Type | # Households | Household Size |
| Married-Couple | 11,058 (54.3%) | 3.23 |
| Single Male/Father | 1,171 (5.8%) | 3.17 |
| Single Female/Mother | 1,651 (8.1%) | 2.98 |
| Non-family | 6,496 (31.9%) | 1.21 |
| Total Households | 20,376 (100.0%) | 2.56 |
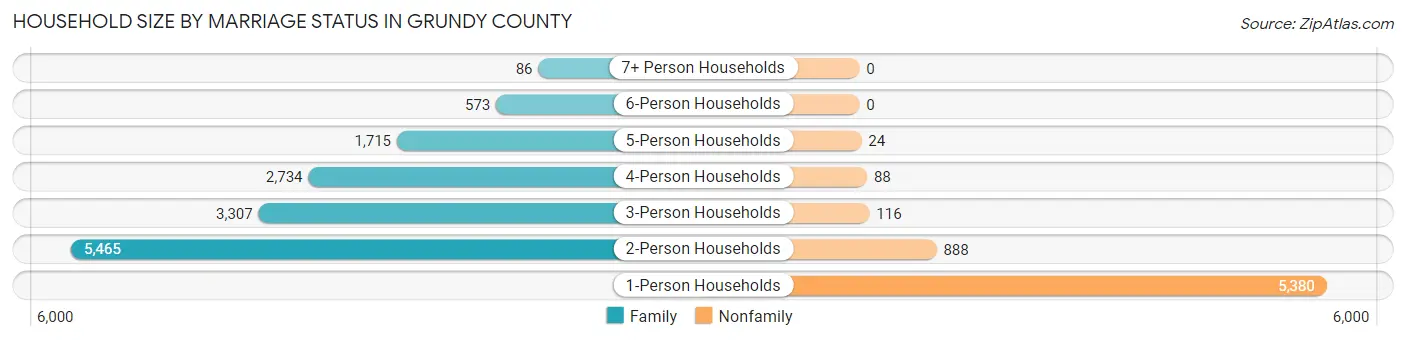
Household Size by Marriage Status in Grundy County
Out of a total of 20,376 households in Grundy County, 13,880 (68.1%) are family households, while 6,496 (31.9%) are nonfamily households. The most numerous type of family households are 2-person households, comprising 5,465, and the most common type of nonfamily households are 1-person households, comprising 5,380.
| Household Size | Family Households | Nonfamily Households |
| 1-Person Households | - | 5,380 (26.4%) |
| 2-Person Households | 5,465 (26.8%) | 888 (4.4%) |
| 3-Person Households | 3,307 (16.2%) | 116 (0.6%) |
| 4-Person Households | 2,734 (13.4%) | 88 (0.4%) |
| 5-Person Households | 1,715 (8.4%) | 24 (0.1%) |
| 6-Person Households | 573 (2.8%) | 0 (0.0%) |
| 7+ Person Households | 86 (0.4%) | 0 (0.0%) |
| Total | 13,880 (68.1%) | 6,496 (31.9%) |
Female Fertility in Grundy County
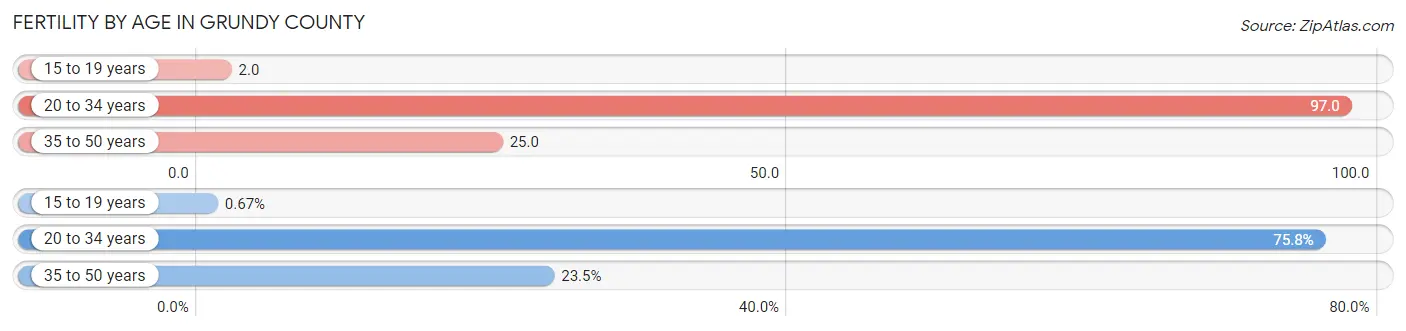
Fertility by Age in Grundy County
Average fertility rate in Grundy County is 49.0 births per 1,000 women. Women in the age bracket of 20 to 34 years have the highest fertility rate with 97.0 births per 1,000 women. Women in the age bracket of 20 to 34 years acount for 75.8% of all women with births.
| Age Bracket | Women with Births | Births / 1,000 Women |
| 15 to 19 years | 4 (0.7%) | 2.0 |
| 20 to 34 years | 455 (75.8%) | 97.0 |
| 35 to 50 years | 141 (23.5%) | 25.0 |
| Total | 600 (100.0%) | 49.0 |
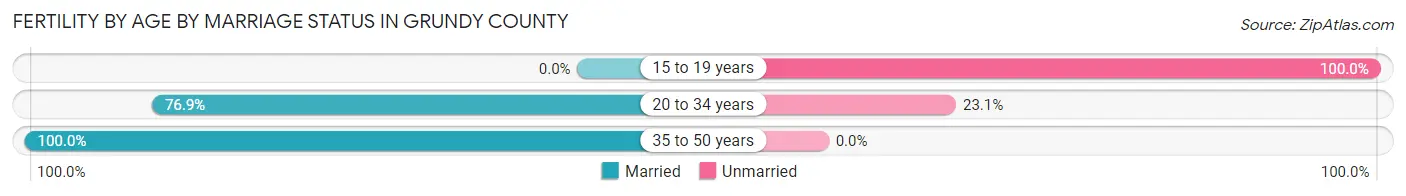
Fertility by Age by Marriage Status in Grundy County
81.8% of women with births (600) in Grundy County are married. The highest percentage of unmarried women with births falls into 15 to 19 years age bracket with 100.0% of them unmarried at the time of birth, while the lowest percentage of unmarried women with births belong to 35 to 50 years age bracket with 0.0% of them unmarried.
| Age Bracket | Married | Unmarried |
| 15 to 19 years | 0 (0.0%) | 4 (100.0%) |
| 20 to 34 years | 350 (76.9%) | 105 (23.1%) |
| 35 to 50 years | 141 (100.0%) | 0 (0.0%) |
| Total | 491 (81.8%) | 109 (18.2%) |
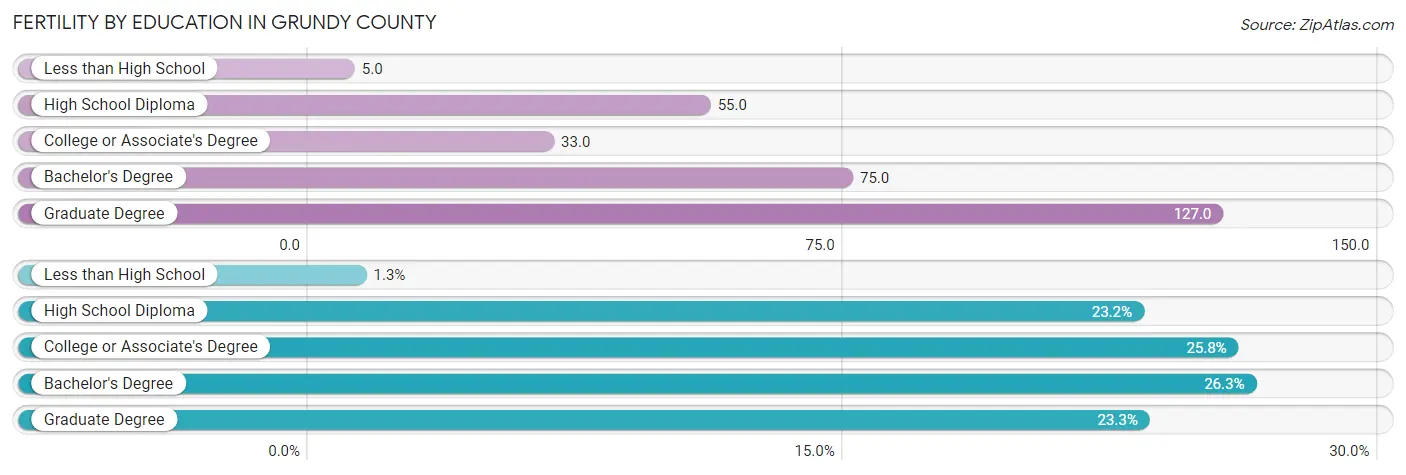
Fertility by Education in Grundy County
Average fertility rate in Grundy County is 49.0 births per 1,000 women. Women with the education attainment of graduate degree have the highest fertility rate of 127.0 births per 1,000 women, while women with the education attainment of less than high school have the lowest fertility at 5.0 births per 1,000 women. Women with the education attainment of bachelor's degree represent 26.3% of all women with births.
| Educational Attainment | Women with Births | Births / 1,000 Women |
| Less than High School | 8 (1.3%) | 5.0 |
| High School Diploma | 139 (23.2%) | 55.0 |
| College or Associate's Degree | 155 (25.8%) | 33.0 |
| Bachelor's Degree | 158 (26.3%) | 75.0 |
| Graduate Degree | 140 (23.3%) | 127.0 |
| Total | 600 (100.0%) | 49.0 |
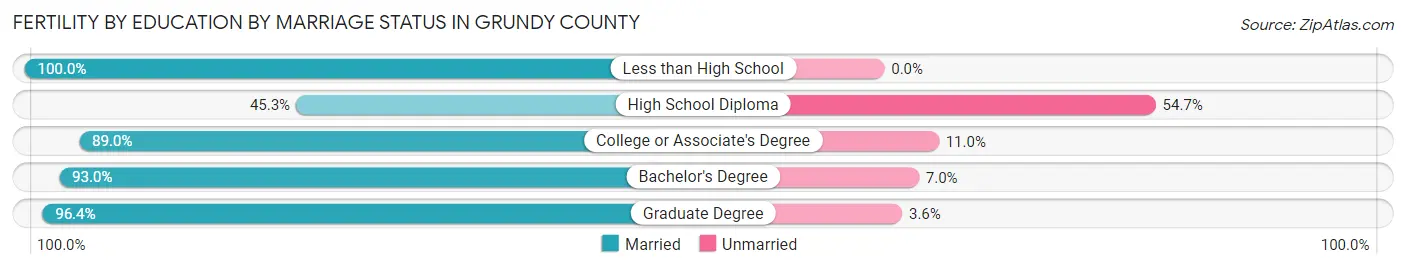
Fertility by Education by Marriage Status in Grundy County
18.2% of women with births in Grundy County are unmarried. Women with the educational attainment of less than high school are most likely to be married with 100.0% of them married at childbirth, while women with the educational attainment of high school diploma are least likely to be married with 54.7% of them unmarried at childbirth.
| Educational Attainment | Married | Unmarried |
| Less than High School | 8 (100.0%) | 0 (0.0%) |
| High School Diploma | 63 (45.3%) | 76 (54.7%) |
| College or Associate's Degree | 138 (89.0%) | 17 (11.0%) |
| Bachelor's Degree | 147 (93.0%) | 11 (7.0%) |
| Graduate Degree | 135 (96.4%) | 5 (3.6%) |
| Total | 491 (81.8%) | 109 (18.2%) |
Income in Grundy County
Income Overview in Grundy County
Per Capita Income in Grundy County is $42,192, while median incomes of families and households are $107,740 and $89,993 respectively.
| Characteristic | Number | Measure |
| Per Capita Income | 52,624 | $42,192 |
| Median Family Income | 13,880 | $107,740 |
| Mean Family Income | 13,880 | $124,026 |
| Median Household Income | 20,376 | $89,993 |
| Mean Household Income | 20,376 | $107,987 |
| Income Deficit | 13,880 | $8,600 |
| Wage / Income Gap (%) | 52,624 | 44.97% |
| Wage / Income Gap ($) | 52,624 | 55.03¢ per $1 |
| Gini / Inequality Index | 52,624 | 0.40 |
Earnings by Sex in Grundy County
Average Earnings in Grundy County are $48,076, $64,928 for men and $35,729 for women, a difference of 45.0%.
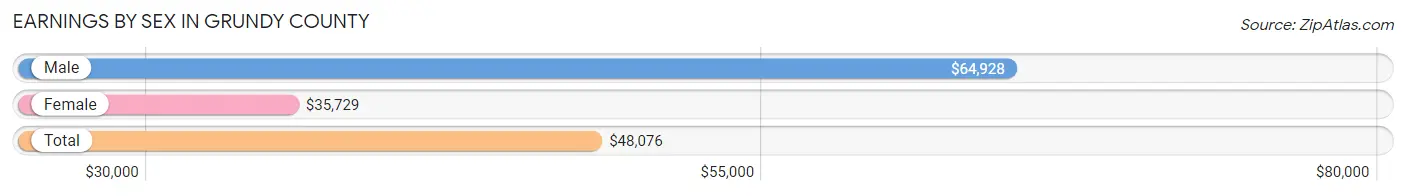
| Sex | Number | Average Earnings |
| Male | 15,775 (54.1%) | $64,928 |
| Female | 13,384 (45.9%) | $35,729 |
| Total | 29,159 (100.0%) | $48,076 |
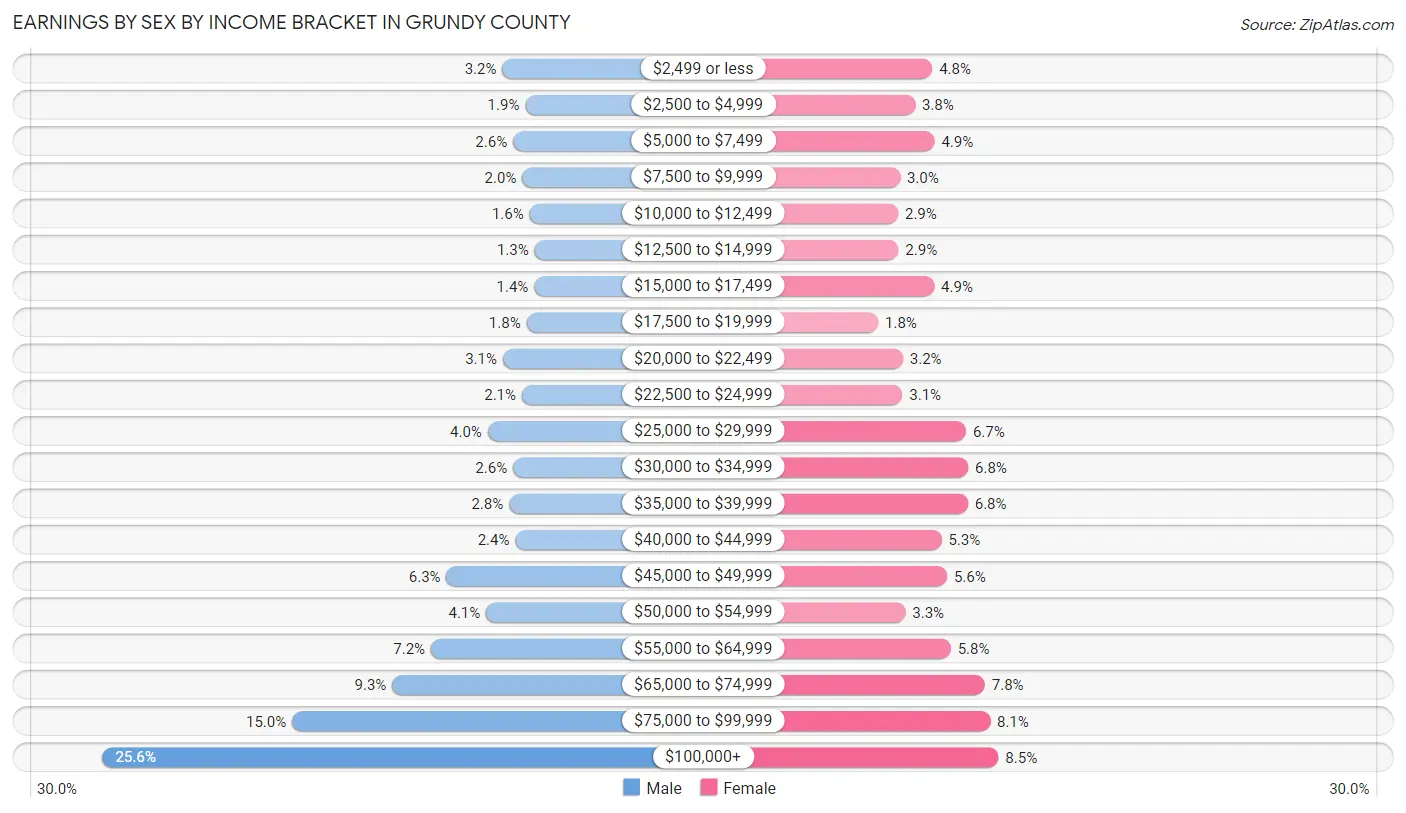
Earnings by Sex by Income Bracket in Grundy County
The most common earnings brackets in Grundy County are $100,000+ for men (4,041 | 25.6%) and $100,000+ for women (1,140 | 8.5%).
| Income | Male | Female |
| $2,499 or less | 497 (3.2%) | 643 (4.8%) |
| $2,500 to $4,999 | 293 (1.9%) | 513 (3.8%) |
| $5,000 to $7,499 | 402 (2.5%) | 660 (4.9%) |
| $7,500 to $9,999 | 320 (2.0%) | 400 (3.0%) |
| $10,000 to $12,499 | 255 (1.6%) | 385 (2.9%) |
| $12,500 to $14,999 | 211 (1.3%) | 388 (2.9%) |
| $15,000 to $17,499 | 214 (1.4%) | 657 (4.9%) |
| $17,500 to $19,999 | 282 (1.8%) | 236 (1.8%) |
| $20,000 to $22,499 | 492 (3.1%) | 422 (3.2%) |
| $22,500 to $24,999 | 323 (2.1%) | 417 (3.1%) |
| $25,000 to $29,999 | 626 (4.0%) | 897 (6.7%) |
| $30,000 to $34,999 | 402 (2.5%) | 913 (6.8%) |
| $35,000 to $39,999 | 437 (2.8%) | 910 (6.8%) |
| $40,000 to $44,999 | 382 (2.4%) | 712 (5.3%) |
| $45,000 to $49,999 | 992 (6.3%) | 754 (5.6%) |
| $50,000 to $54,999 | 641 (4.1%) | 440 (3.3%) |
| $55,000 to $64,999 | 1,130 (7.2%) | 781 (5.8%) |
| $65,000 to $74,999 | 1,474 (9.3%) | 1,038 (7.8%) |
| $75,000 to $99,999 | 2,361 (15.0%) | 1,078 (8.1%) |
| $100,000+ | 4,041 (25.6%) | 1,140 (8.5%) |
| Total | 15,775 (100.0%) | 13,384 (100.0%) |
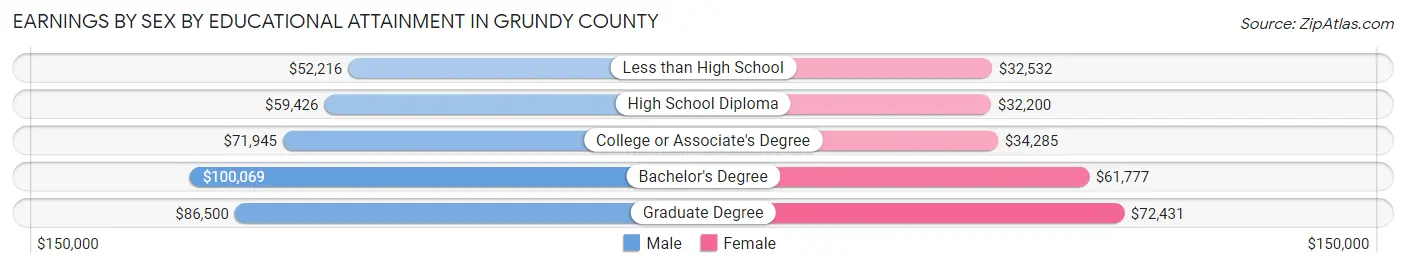
Earnings by Sex by Educational Attainment in Grundy County
Average earnings in Grundy County are $72,984 for men and $41,426 for women, a difference of 43.2%. Men with an educational attainment of bachelor's degree enjoy the highest average annual earnings of $100,069, while those with less than high school education earn the least with $52,216. Women with an educational attainment of graduate degree earn the most with the average annual earnings of $72,431, while those with high school diploma education have the smallest earnings of $32,200.
| Educational Attainment | Male Income | Female Income |
| Less than High School | $52,216 | $32,532 |
| High School Diploma | $59,426 | $32,200 |
| College or Associate's Degree | $71,945 | $34,285 |
| Bachelor's Degree | $100,069 | $61,777 |
| Graduate Degree | $86,500 | $72,431 |
| Total | $72,984 | $41,426 |
Family Income in Grundy County
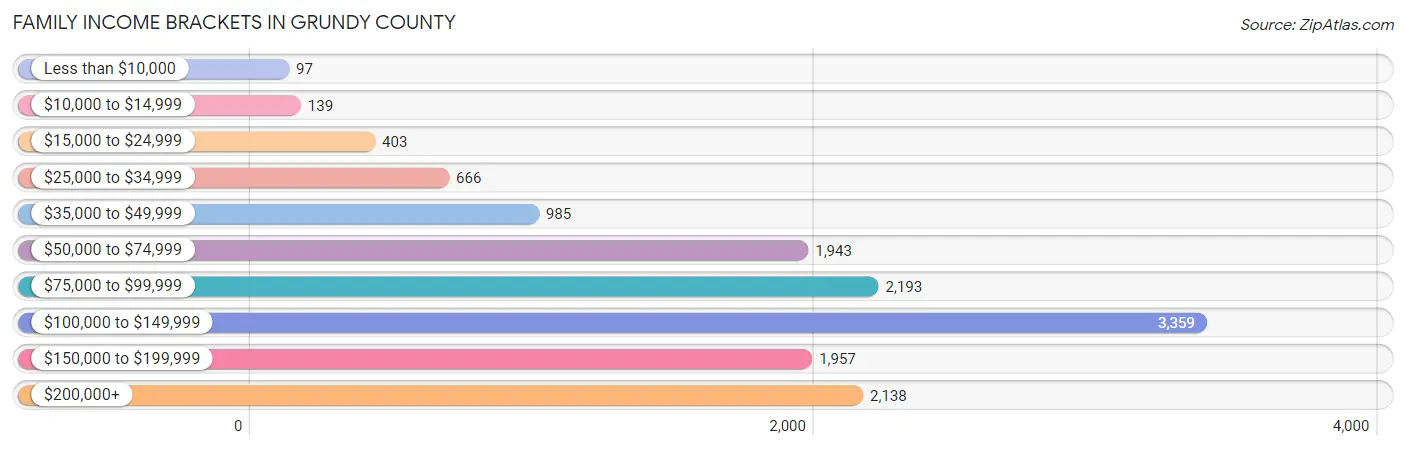
Family Income Brackets in Grundy County
According to the Grundy County family income data, there are 3,359 families falling into the $100,000 to $149,999 income range, which is the most common income bracket and makes up 24.2% of all families. Conversely, the less than $10,000 income bracket is the least frequent group with only 97 families (0.7%) belonging to this category.
| Income Bracket | # Families | % Families |
| Less than $10,000 | 97 | 0.7% |
| $10,000 to $14,999 | 139 | 1.0% |
| $15,000 to $24,999 | 403 | 2.9% |
| $25,000 to $34,999 | 666 | 4.8% |
| $35,000 to $49,999 | 985 | 7.1% |
| $50,000 to $74,999 | 1,943 | 14.0% |
| $75,000 to $99,999 | 2,193 | 15.8% |
| $100,000 to $149,999 | 3,359 | 24.2% |
| $150,000 to $199,999 | 1,957 | 14.1% |
| $200,000+ | 2,138 | 15.4% |
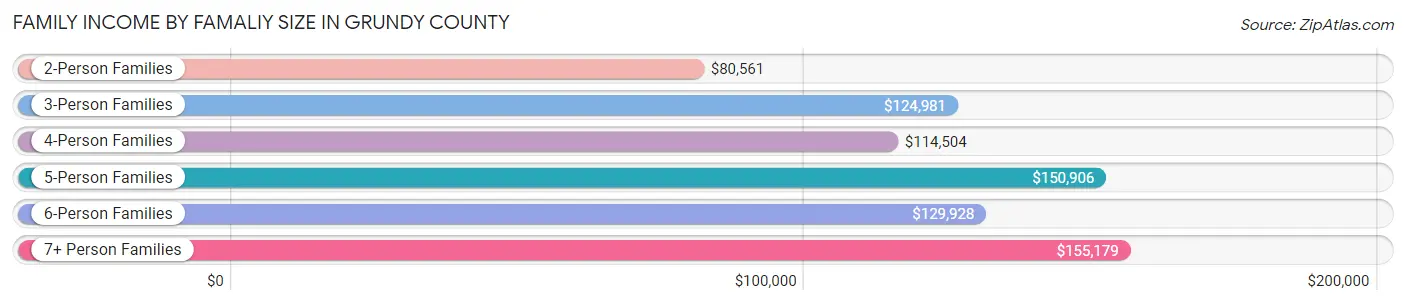
Family Income by Famaliy Size in Grundy County
7+ person families (85 | 0.6%) account for the highest median family income in Grundy County with $155,179 per family, while 3-person families (3,101 | 22.3%) have the highest median income of $41,660 per family member.
| Income Bracket | # Families | Median Income |
| 2-Person Families | 5,843 (42.1%) | $80,561 |
| 3-Person Families | 3,101 (22.3%) | $124,981 |
| 4-Person Families | 2,785 (20.1%) | $114,504 |
| 5-Person Families | 1,531 (11.0%) | $150,906 |
| 6-Person Families | 535 (3.8%) | $129,928 |
| 7+ Person Families | 85 (0.6%) | $155,179 |
| Total | 13,880 (100.0%) | $107,740 |
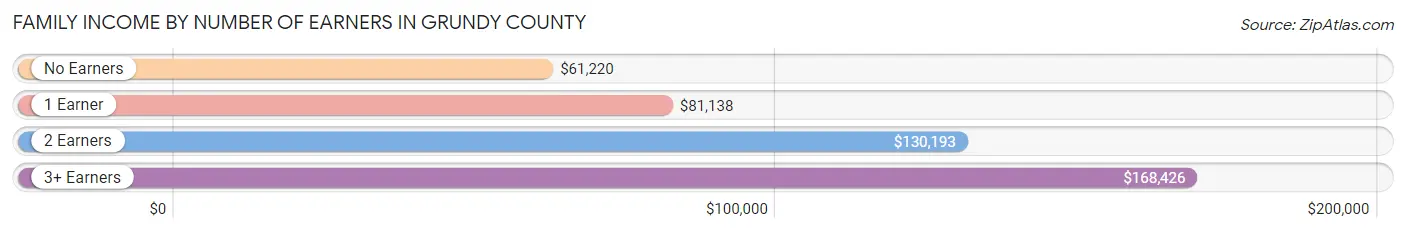
Family Income by Number of Earners in Grundy County
The median family income in Grundy County is $107,740, with families comprising 3+ earners (2,410) having the highest median family income of $168,426, while families with no earners (1,769) have the lowest median family income of $61,220, accounting for 17.4% and 12.7% of families, respectively.
| Number of Earners | # Families | Median Income |
| No Earners | 1,769 (12.7%) | $61,220 |
| 1 Earner | 4,254 (30.6%) | $81,138 |
| 2 Earners | 5,447 (39.2%) | $130,193 |
| 3+ Earners | 2,410 (17.4%) | $168,426 |
| Total | 13,880 (100.0%) | $107,740 |
Household Income in Grundy County
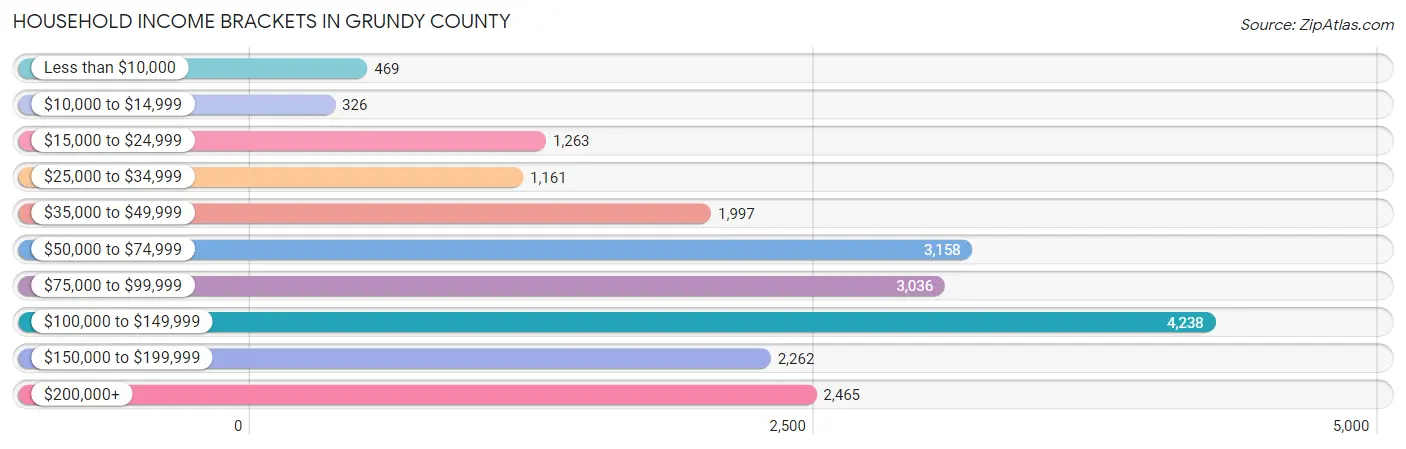
Household Income Brackets in Grundy County
With 4,238 households falling in the category, the $100,000 to $149,999 income range is the most frequent in Grundy County, accounting for 20.8% of all households. In contrast, only 326 households (1.6%) fall into the $10,000 to $14,999 income bracket, making it the least populous group.
| Income Bracket | # Households | % Households |
| Less than $10,000 | 469 | 2.3% |
| $10,000 to $14,999 | 326 | 1.6% |
| $15,000 to $24,999 | 1,263 | 6.2% |
| $25,000 to $34,999 | 1,161 | 5.7% |
| $35,000 to $49,999 | 1,997 | 9.8% |
| $50,000 to $74,999 | 3,158 | 15.5% |
| $75,000 to $99,999 | 3,036 | 14.9% |
| $100,000 to $149,999 | 4,238 | 20.8% |
| $150,000 to $199,999 | 2,262 | 11.1% |
| $200,000+ | 2,465 | 12.1% |
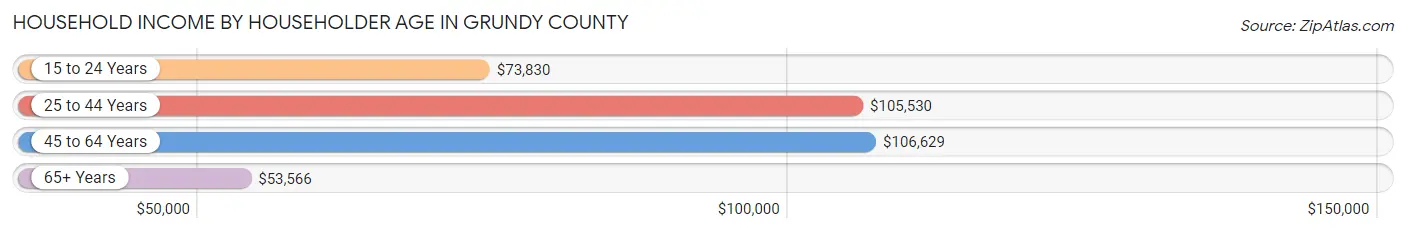
Household Income by Householder Age in Grundy County
The median household income in Grundy County is $89,993, with the highest median household income of $106,629 found in the 45 to 64 years age bracket for the primary householder. A total of 8,063 households (39.6%) fall into this category. Meanwhile, the 65+ years age bracket for the primary householder has the lowest median household income of $53,566, with 4,872 households (23.9%) in this group.
| Income Bracket | # Households | Median Income |
| 15 to 24 Years | 651 (3.2%) | $73,830 |
| 25 to 44 Years | 6,790 (33.3%) | $105,530 |
| 45 to 64 Years | 8,063 (39.6%) | $106,629 |
| 65+ Years | 4,872 (23.9%) | $53,566 |
| Total | 20,376 (100.0%) | $89,993 |
Poverty in Grundy County
Income Below Poverty by Sex and Age in Grundy County
With 5.0% poverty level for males and 7.0% for females among the residents of Grundy County, 15 year old males and 75 year old and over females are the most vulnerable to poverty, with 88 males (19.5%) and 266 females (16.5%) in their respective age groups living below the poverty level.
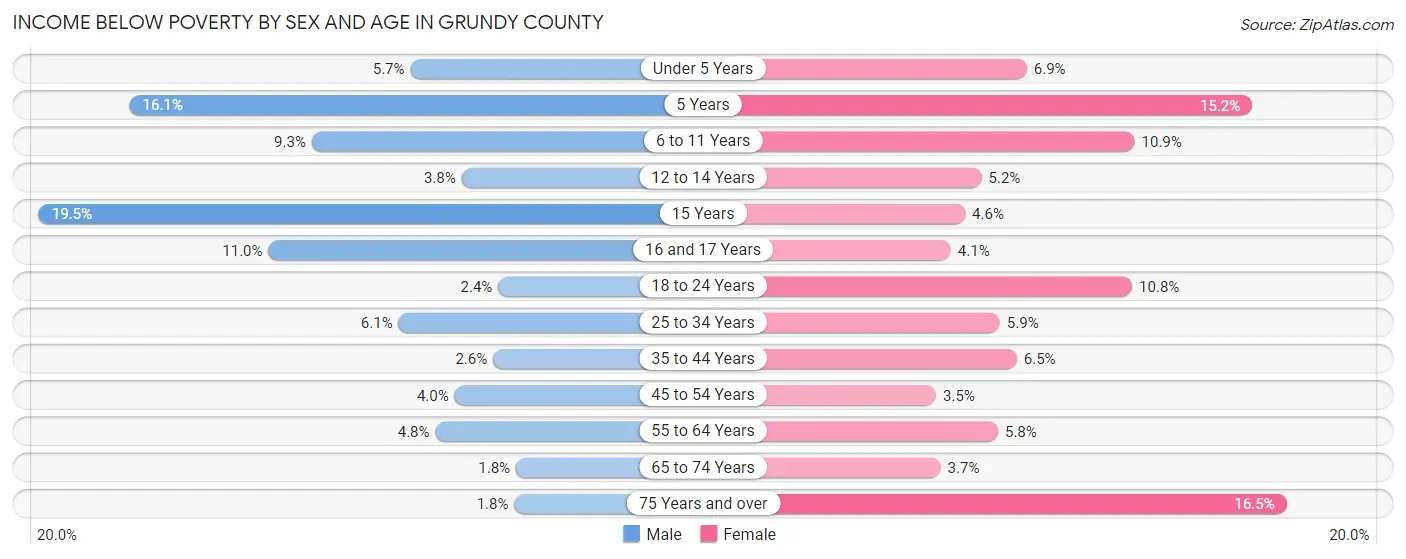
| Age Bracket | Male | Female |
| Under 5 Years | 93 (5.7%) | 89 (6.9%) |
| 5 Years | 66 (16.1%) | 46 (15.2%) |
| 6 to 11 Years | 218 (9.3%) | 235 (10.9%) |
| 12 to 14 Years | 42 (3.8%) | 60 (5.2%) |
| 15 Years | 88 (19.5%) | 20 (4.6%) |
| 16 and 17 Years | 88 (11.0%) | 28 (4.1%) |
| 18 to 24 Years | 58 (2.4%) | 236 (10.8%) |
| 25 to 34 Years | 194 (6.1%) | 186 (5.9%) |
| 35 to 44 Years | 93 (2.6%) | 234 (6.5%) |
| 45 to 54 Years | 149 (4.0%) | 119 (3.5%) |
| 55 to 64 Years | 170 (4.8%) | 190 (5.8%) |
| 65 to 74 Years | 38 (1.8%) | 87 (3.7%) |
| 75 Years and over | 21 (1.8%) | 266 (16.5%) |
| Total | 1,318 (5.0%) | 1,796 (7.0%) |
Income Above Poverty by Sex and Age in Grundy County
According to the poverty statistics in Grundy County, males aged 65 to 74 years and females aged 45 to 54 years are the age groups that are most secure financially, with 98.2% of males and 96.5% of females in these age groups living above the poverty line.
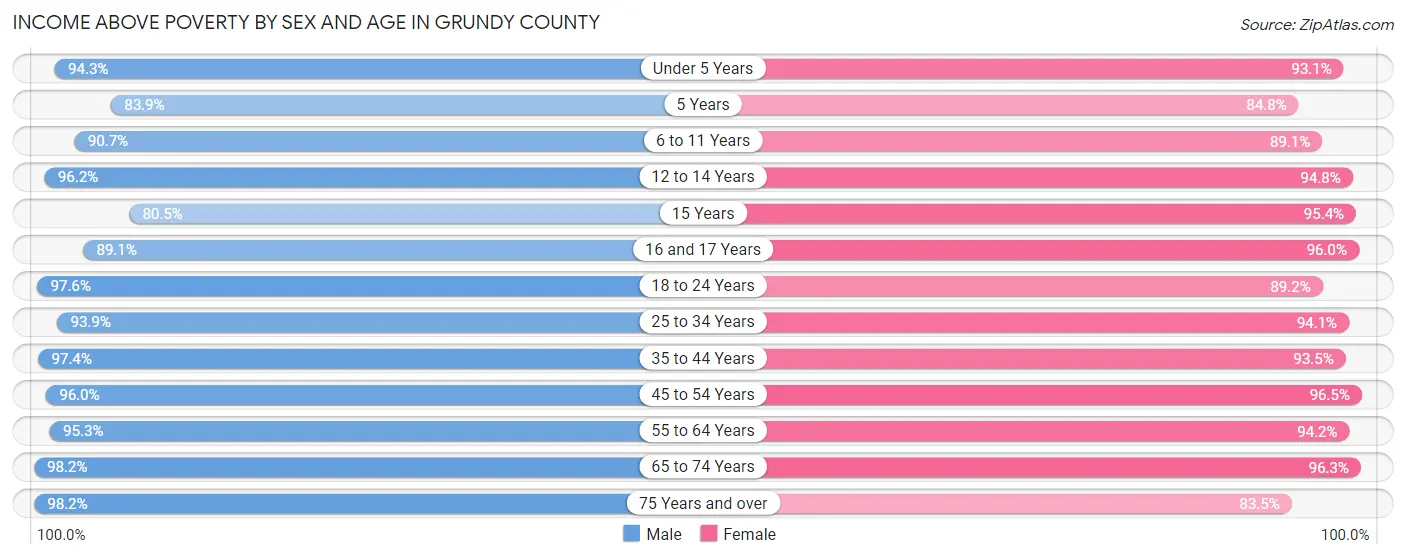
| Age Bracket | Male | Female |
| Under 5 Years | 1,545 (94.3%) | 1,207 (93.1%) |
| 5 Years | 344 (83.9%) | 256 (84.8%) |
| 6 to 11 Years | 2,115 (90.7%) | 1,926 (89.1%) |
| 12 to 14 Years | 1,070 (96.2%) | 1,097 (94.8%) |
| 15 Years | 364 (80.5%) | 417 (95.4%) |
| 16 and 17 Years | 716 (89.0%) | 664 (96.0%) |
| 18 to 24 Years | 2,335 (97.6%) | 1,954 (89.2%) |
| 25 to 34 Years | 2,978 (93.9%) | 2,980 (94.1%) |
| 35 to 44 Years | 3,473 (97.4%) | 3,367 (93.5%) |
| 45 to 54 Years | 3,536 (96.0%) | 3,278 (96.5%) |
| 55 to 64 Years | 3,409 (95.3%) | 3,087 (94.2%) |
| 65 to 74 Years | 2,115 (98.2%) | 2,285 (96.3%) |
| 75 Years and over | 1,133 (98.2%) | 1,345 (83.5%) |
| Total | 25,133 (95.0%) | 23,863 (93.0%) |
Income Below Poverty Among Married-Couple Families in Grundy County
The poverty statistics for married-couple families in Grundy County show that 2.1% or 233 of the total 11,058 families live below the poverty line. Families with 3 or 4 children have the highest poverty rate of 8.7%, comprising of 100 families. On the other hand, families with 5 or more children have the lowest poverty rate of 0.0%, which includes 0 families.
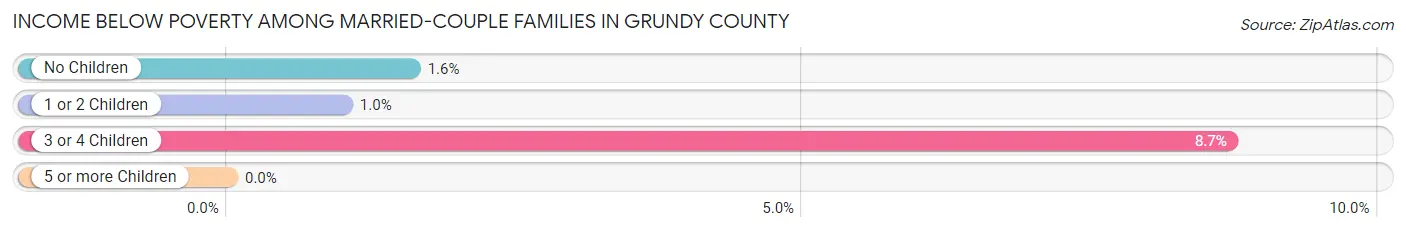
| Children | Above Poverty | Below Poverty |
| No Children | 5,684 (98.4%) | 92 (1.6%) |
| 1 or 2 Children | 4,062 (99.0%) | 41 (1.0%) |
| 3 or 4 Children | 1,048 (91.3%) | 100 (8.7%) |
| 5 or more Children | 31 (100.0%) | 0 (0.0%) |
| Total | 10,825 (97.9%) | 233 (2.1%) |
Income Below Poverty Among Single-Parent Households in Grundy County
According to the poverty data in Grundy County, 12.0% or 141 single-father households and 13.1% or 216 single-mother households are living below the poverty line. Among single-father households, those with 1 or 2 children have the highest poverty rate, with 113 households (18.4%) experiencing poverty. Likewise, among single-mother households, those with 3 or 4 children have the highest poverty rate, with 91 households (40.4%) falling below the poverty line.
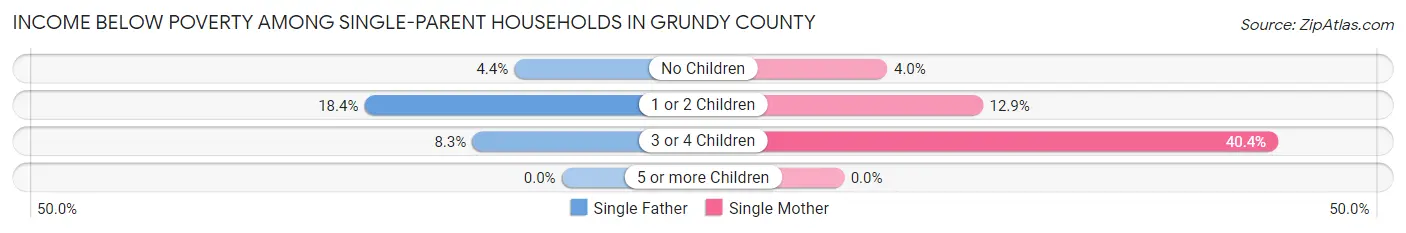
| Children | Single Father | Single Mother |
| No Children | 20 (4.4%) | 27 (4.0%) |
| 1 or 2 Children | 113 (18.4%) | 98 (12.9%) |
| 3 or 4 Children | 8 (8.3%) | 91 (40.4%) |
| 5 or more Children | 0 (0.0%) | 0 (0.0%) |
| Total | 141 (12.0%) | 216 (13.1%) |
Income Below Poverty Among Married-Couple vs Single-Parent Households in Grundy County
The poverty data for Grundy County shows that 233 of the married-couple family households (2.1%) and 357 of the single-parent households (12.7%) are living below the poverty level. Within the married-couple family households, those with 3 or 4 children have the highest poverty rate, with 100 households (8.7%) falling below the poverty line. Among the single-parent households, those with 3 or 4 children have the highest poverty rate, with 99 household (30.8%) living below poverty.
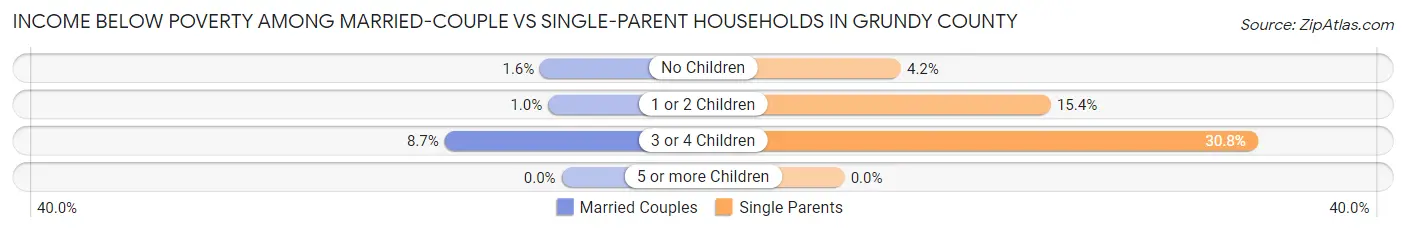
| Children | Married-Couple Families | Single-Parent Households |
| No Children | 92 (1.6%) | 47 (4.2%) |
| 1 or 2 Children | 41 (1.0%) | 211 (15.4%) |
| 3 or 4 Children | 100 (8.7%) | 99 (30.8%) |
| 5 or more Children | 0 (0.0%) | 0 (0.0%) |
| Total | 233 (2.1%) | 357 (12.7%) |
Employment Characteristics in Grundy County
Employment by Class of Employer in Grundy County
Among the 26,321 employed individuals in Grundy County, private company employees (19,807 | 75.2%), local government employees (2,373 | 9.0%), and not-for-profit organizations (1,629 | 6.2%) make up the most common classes of employment.
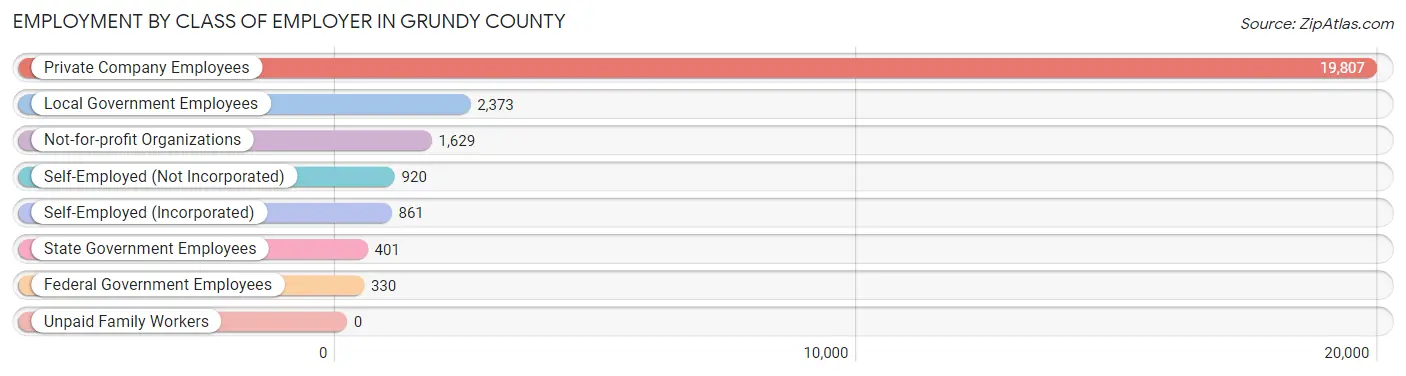
| Employer Class | # Employees | % Employees |
| Private Company Employees | 19,807 | 75.2% |
| Self-Employed (Incorporated) | 861 | 3.3% |
| Self-Employed (Not Incorporated) | 920 | 3.5% |
| Not-for-profit Organizations | 1,629 | 6.2% |
| Local Government Employees | 2,373 | 9.0% |
| State Government Employees | 401 | 1.5% |
| Federal Government Employees | 330 | 1.3% |
| Unpaid Family Workers | 0 | 0.0% |
| Total | 26,321 | 100.0% |
Employment Status by Age in Grundy County
According to the labor force statistics for Grundy County, out of the total population over 16 years of age (41,136), 68.1% or 28,014 individuals are in the labor force, with 4.2% or 1,177 of them unemployed. The age group with the highest labor force participation rate is 25 to 29 years, with 91.4% or 2,859 individuals in the labor force. Within the labor force, the 20 to 24 years age range has the highest percentage of unemployed individuals, with 10.1% or 274 of them being unemployed.
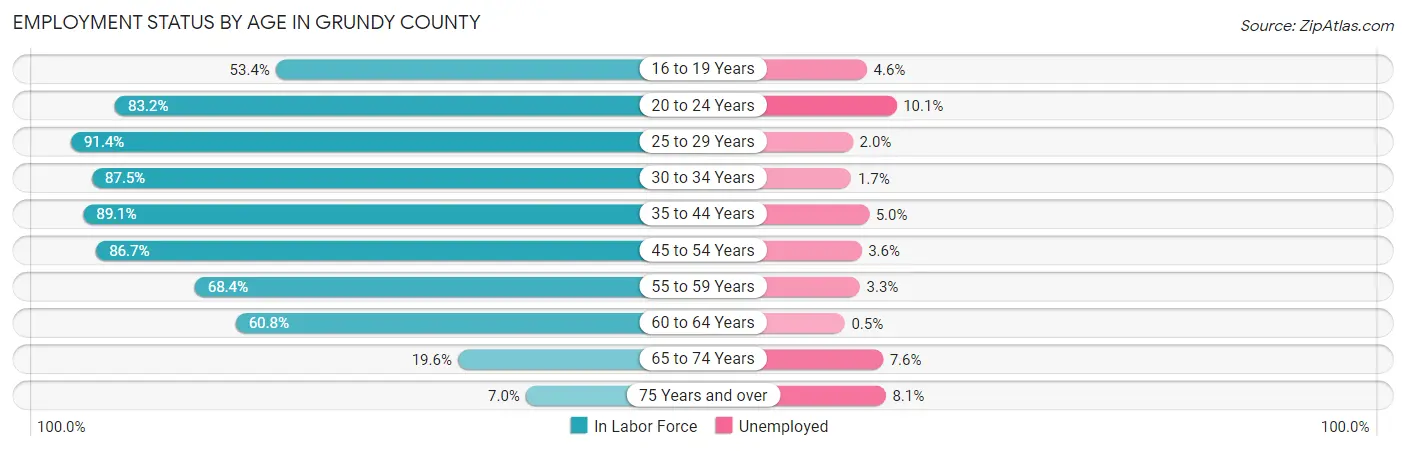
| Age Bracket | In Labor Force | Unemployed |
| 16 to 19 Years | 1,505 (53.4%) | 69 (4.6%) |
| 20 to 24 Years | 2,716 (83.2%) | 274 (10.1%) |
| 25 to 29 Years | 2,859 (91.4%) | 57 (2.0%) |
| 30 to 34 Years | 2,814 (87.5%) | 48 (1.7%) |
| 35 to 44 Years | 6,395 (89.1%) | 320 (5.0%) |
| 45 to 54 Years | 6,148 (86.7%) | 221 (3.6%) |
| 55 to 59 Years | 2,493 (68.4%) | 82 (3.3%) |
| 60 to 64 Years | 1,965 (60.8%) | 10 (0.5%) |
| 65 to 74 Years | 895 (19.6%) | 68 (7.6%) |
| 75 Years and over | 210 (7.0%) | 17 (8.1%) |
| Total | 28,014 (68.1%) | 1,177 (4.2%) |
Employment Status by Educational Attainment in Grundy County
According to labor force statistics for Grundy County, 82.5% of individuals (22,678) out of the total population between 25 and 64 years of age (27,489) are in the labor force, with 3.2% or 726 of them being unemployed. The group with the highest labor force participation rate are those with the educational attainment of bachelor's degree or higher, with 88.1% or 6,676 individuals in the labor force. Within the labor force, individuals with less than high school education have the highest percentage of unemployment, with 15.1% or 153 of them being unemployed.
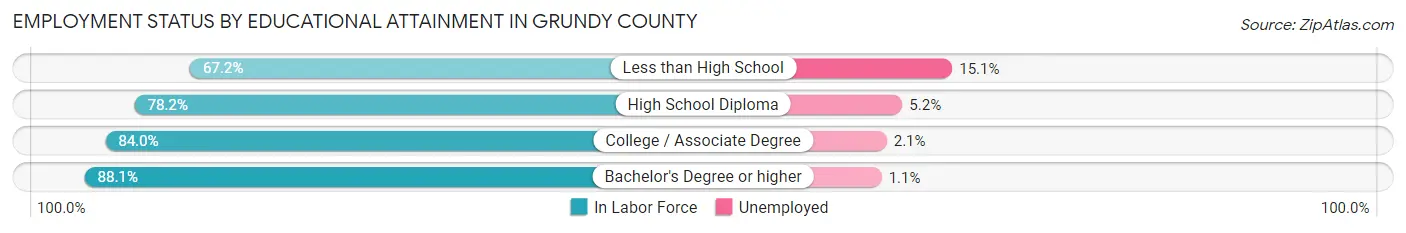
| Educational Attainment | In Labor Force | Unemployed |
| Less than High School | 1,015 (67.2%) | 228 (15.1%) |
| High School Diploma | 6,386 (78.2%) | 425 (5.2%) |
| College / Associate Degree | 8,597 (84.0%) | 215 (2.1%) |
| Bachelor's Degree or higher | 6,676 (88.1%) | 83 (1.1%) |
| Total | 22,678 (82.5%) | 880 (3.2%) |
Employment Occupations by Sex in Grundy County
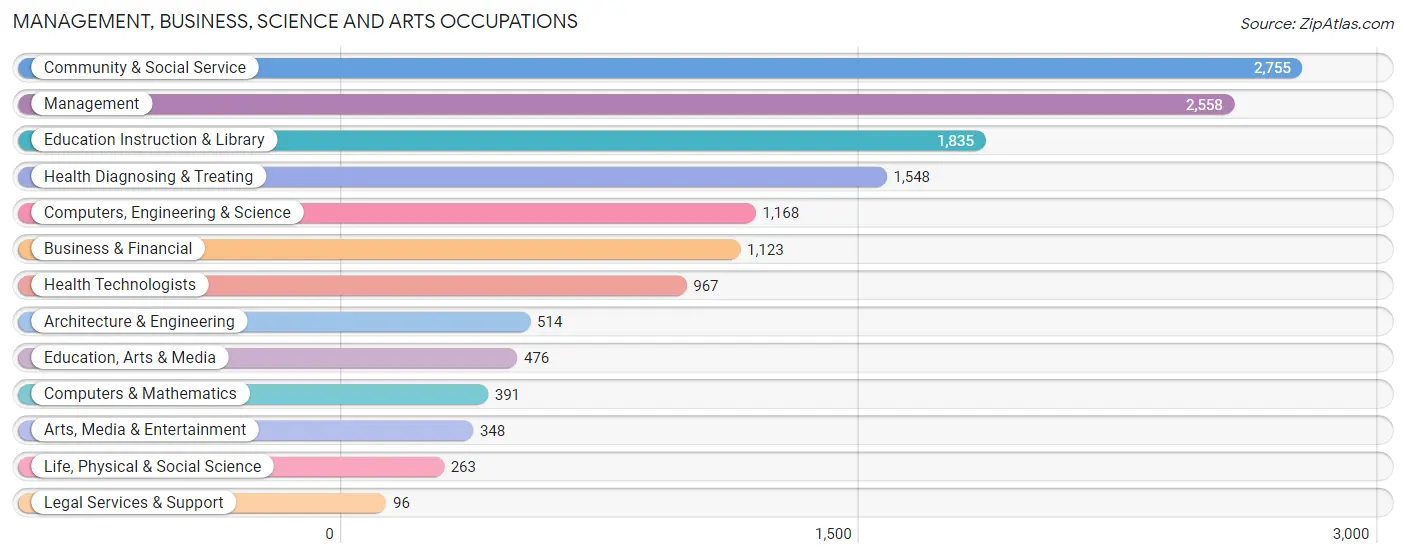
Management, Business, Science and Arts Occupations
The most common Management, Business, Science and Arts occupations in Grundy County are Community & Social Service (2,755 | 10.3%), Management (2,558 | 9.5%), Education Instruction & Library (1,835 | 6.8%), Health Diagnosing & Treating (1,548 | 5.8%), and Computers, Engineering & Science (1,168 | 4.3%).
Management, Business, Science and Arts Occupations by Sex
Within the Management, Business, Science and Arts occupations in Grundy County, the most male-oriented occupations are Life, Physical & Social Science (87.1%), Architecture & Engineering (84.8%), and Computers, Engineering & Science (84.1%), while the most female-oriented occupations are Health Diagnosing & Treating (93.1%), Health Technologists (91.7%), and Education, Arts & Media (73.5%).

| Occupation | Male | Female |
| Management | 1,664 (65.0%) | 894 (34.9%) |
| Business & Financial | 497 (44.3%) | 626 (55.7%) |
| Computers, Engineering & Science | 982 (84.1%) | 186 (15.9%) |
| Computers & Mathematics | 317 (81.1%) | 74 (18.9%) |
| Architecture & Engineering | 436 (84.8%) | 78 (15.2%) |
| Life, Physical & Social Science | 229 (87.1%) | 34 (12.9%) |
| Community & Social Service | 1,061 (38.5%) | 1,694 (61.5%) |
| Education, Arts & Media | 126 (26.5%) | 350 (73.5%) |
| Legal Services & Support | 48 (50.0%) | 48 (50.0%) |
| Education Instruction & Library | 687 (37.4%) | 1,148 (62.6%) |
| Arts, Media & Entertainment | 200 (57.5%) | 148 (42.5%) |
| Health Diagnosing & Treating | 106 (6.9%) | 1,442 (93.1%) |
| Health Technologists | 80 (8.3%) | 887 (91.7%) |
| Total (Category) | 4,310 (47.1%) | 4,842 (52.9%) |
| Total (Overall) | 14,689 (54.8%) | 12,131 (45.2%) |
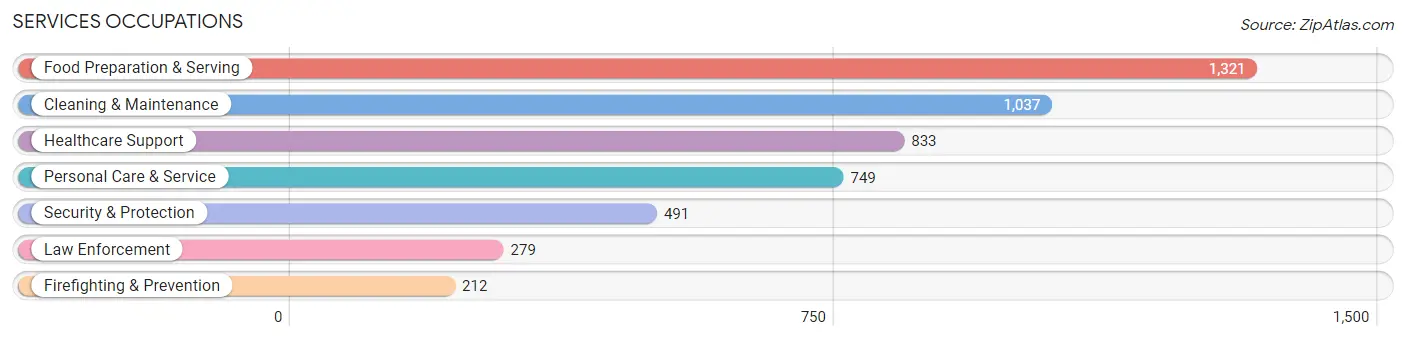
Services Occupations
The most common Services occupations in Grundy County are Food Preparation & Serving (1,321 | 4.9%), Cleaning & Maintenance (1,037 | 3.9%), Healthcare Support (833 | 3.1%), Personal Care & Service (749 | 2.8%), and Security & Protection (491 | 1.8%).
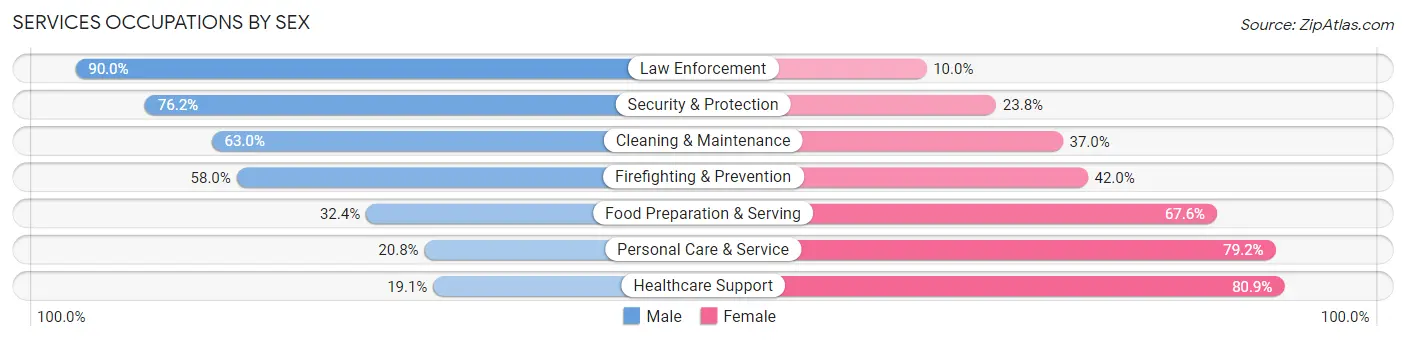
Services Occupations by Sex
Within the Services occupations in Grundy County, the most male-oriented occupations are Law Enforcement (90.0%), Security & Protection (76.2%), and Cleaning & Maintenance (63.0%), while the most female-oriented occupations are Healthcare Support (80.9%), Personal Care & Service (79.2%), and Food Preparation & Serving (67.6%).
| Occupation | Male | Female |
| Healthcare Support | 159 (19.1%) | 674 (80.9%) |
| Security & Protection | 374 (76.2%) | 117 (23.8%) |
| Firefighting & Prevention | 123 (58.0%) | 89 (42.0%) |
| Law Enforcement | 251 (90.0%) | 28 (10.0%) |
| Food Preparation & Serving | 428 (32.4%) | 893 (67.6%) |
| Cleaning & Maintenance | 653 (63.0%) | 384 (37.0%) |
| Personal Care & Service | 156 (20.8%) | 593 (79.2%) |
| Total (Category) | 1,770 (40.0%) | 2,661 (60.1%) |
| Total (Overall) | 14,689 (54.8%) | 12,131 (45.2%) |
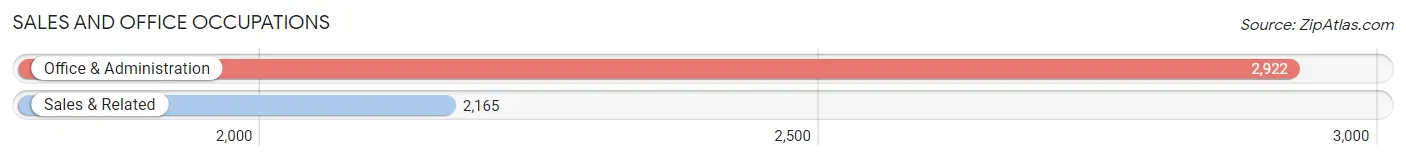
Sales and Office Occupations
The most common Sales and Office occupations in Grundy County are Office & Administration (2,922 | 10.9%), and Sales & Related (2,165 | 8.1%).
Sales and Office Occupations by Sex
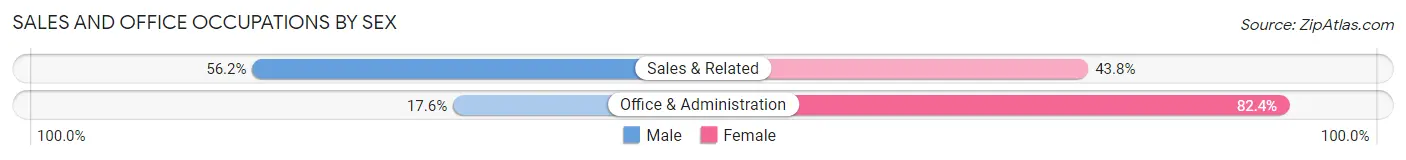
| Occupation | Male | Female |
| Sales & Related | 1,217 (56.2%) | 948 (43.8%) |
| Office & Administration | 515 (17.6%) | 2,407 (82.4%) |
| Total (Category) | 1,732 (34.1%) | 3,355 (65.9%) |
| Total (Overall) | 14,689 (54.8%) | 12,131 (45.2%) |
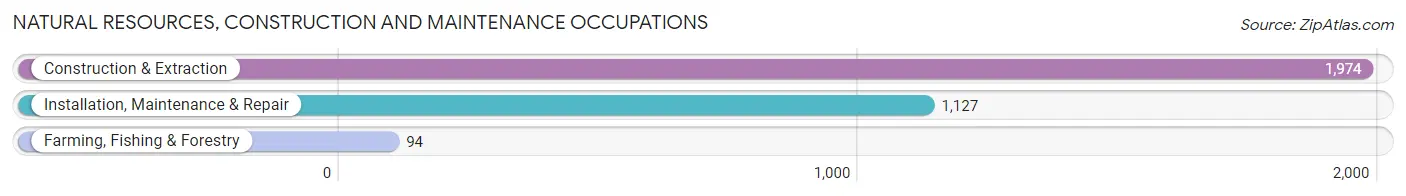
Natural Resources, Construction and Maintenance Occupations
The most common Natural Resources, Construction and Maintenance occupations in Grundy County are Construction & Extraction (1,974 | 7.4%), Installation, Maintenance & Repair (1,127 | 4.2%), and Farming, Fishing & Forestry (94 | 0.4%).
Natural Resources, Construction and Maintenance Occupations by Sex
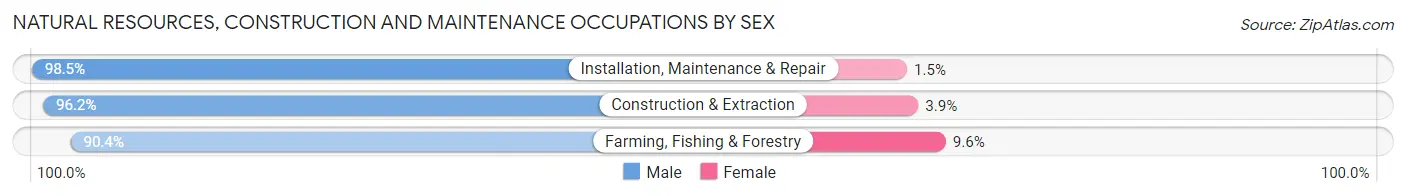
| Occupation | Male | Female |
| Farming, Fishing & Forestry | 85 (90.4%) | 9 (9.6%) |
| Construction & Extraction | 1,898 (96.2%) | 76 (3.8%) |
| Installation, Maintenance & Repair | 1,110 (98.5%) | 17 (1.5%) |
| Total (Category) | 3,093 (96.8%) | 102 (3.2%) |
| Total (Overall) | 14,689 (54.8%) | 12,131 (45.2%) |
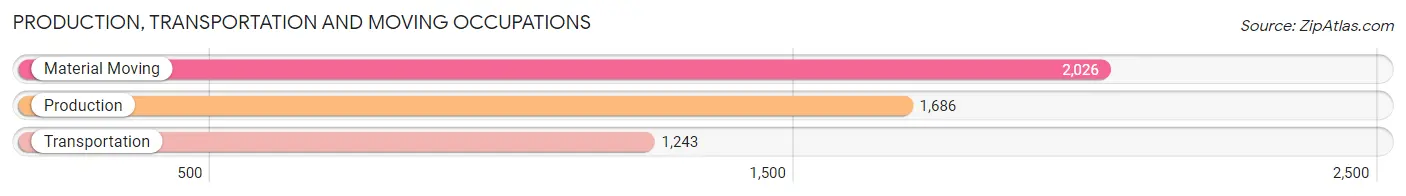
Production, Transportation and Moving Occupations
The most common Production, Transportation and Moving occupations in Grundy County are Material Moving (2,026 | 7.5%), Production (1,686 | 6.3%), and Transportation (1,243 | 4.6%).
Production, Transportation and Moving Occupations by Sex
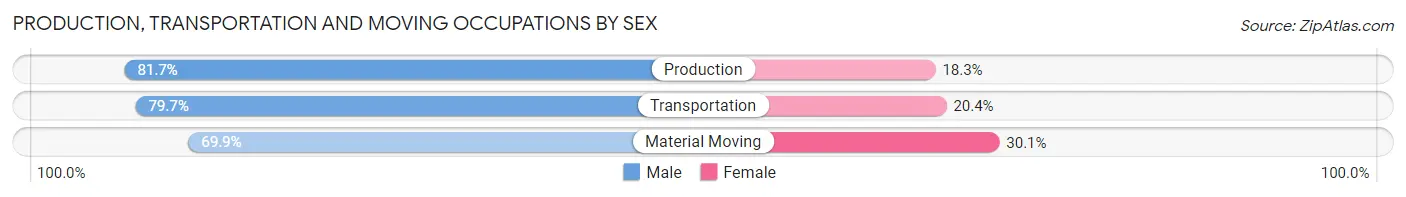
| Occupation | Male | Female |
| Production | 1,377 (81.7%) | 309 (18.3%) |
| Transportation | 990 (79.6%) | 253 (20.3%) |
| Material Moving | 1,417 (69.9%) | 609 (30.1%) |
| Total (Category) | 3,784 (76.4%) | 1,171 (23.6%) |
| Total (Overall) | 14,689 (54.8%) | 12,131 (45.2%) |
Employment Industries by Sex in Grundy County
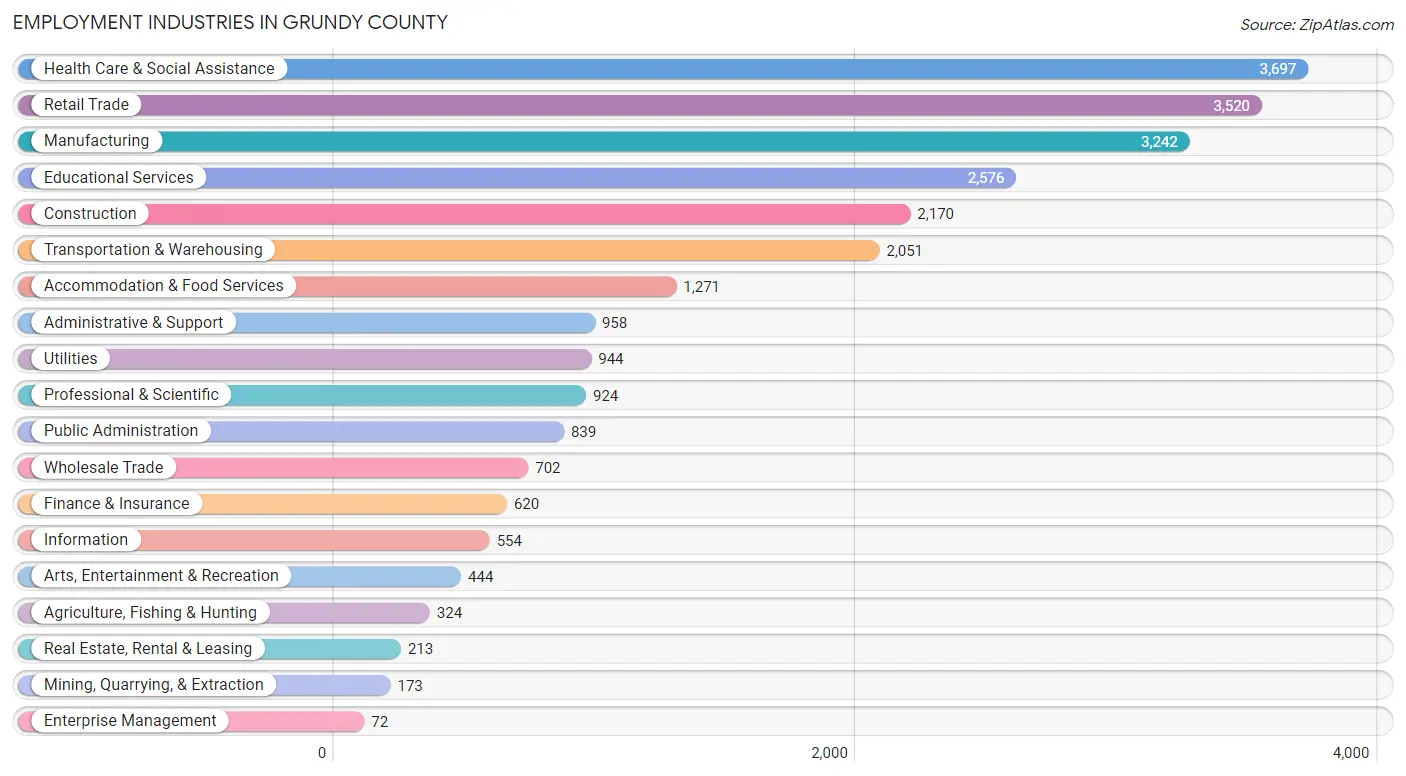
Employment Industries in Grundy County
The major employment industries in Grundy County include Health Care & Social Assistance (3,697 | 13.8%), Retail Trade (3,520 | 13.1%), Manufacturing (3,242 | 12.1%), Educational Services (2,576 | 9.6%), and Construction (2,170 | 8.1%).
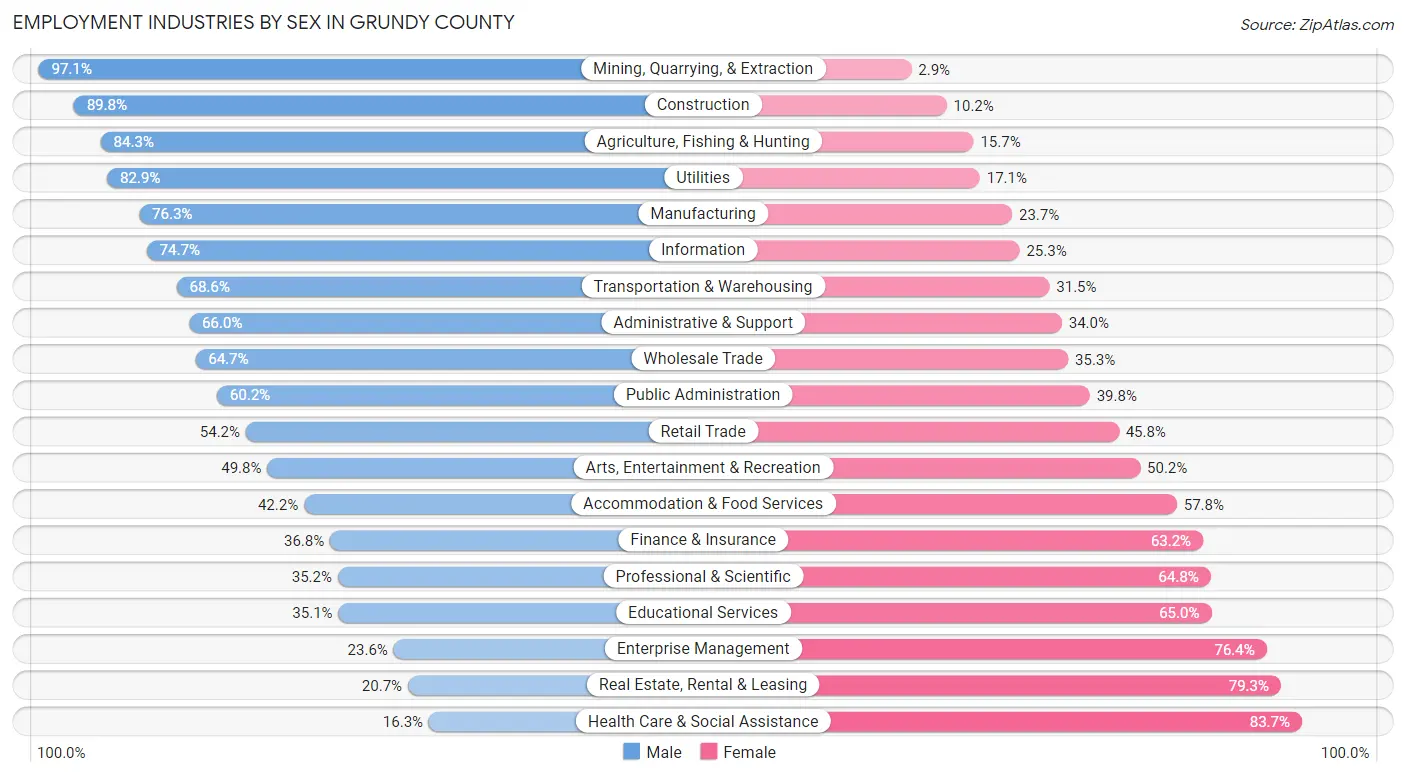
Employment Industries by Sex in Grundy County
The Grundy County industries that see more men than women are Mining, Quarrying, & Extraction (97.1%), Construction (89.8%), and Agriculture, Fishing & Hunting (84.3%), whereas the industries that tend to have a higher number of women are Health Care & Social Assistance (83.7%), Real Estate, Rental & Leasing (79.3%), and Enterprise Management (76.4%).
| Industry | Male | Female |
| Agriculture, Fishing & Hunting | 273 (84.3%) | 51 (15.7%) |
| Mining, Quarrying, & Extraction | 168 (97.1%) | 5 (2.9%) |
| Construction | 1,949 (89.8%) | 221 (10.2%) |
| Manufacturing | 2,473 (76.3%) | 769 (23.7%) |
| Wholesale Trade | 454 (64.7%) | 248 (35.3%) |
| Retail Trade | 1,908 (54.2%) | 1,612 (45.8%) |
| Transportation & Warehousing | 1,406 (68.5%) | 645 (31.5%) |
| Utilities | 783 (82.9%) | 161 (17.1%) |
| Information | 414 (74.7%) | 140 (25.3%) |
| Finance & Insurance | 228 (36.8%) | 392 (63.2%) |
| Real Estate, Rental & Leasing | 44 (20.7%) | 169 (79.3%) |
| Professional & Scientific | 325 (35.2%) | 599 (64.8%) |
| Enterprise Management | 17 (23.6%) | 55 (76.4%) |
| Administrative & Support | 632 (66.0%) | 326 (34.0%) |
| Educational Services | 903 (35.0%) | 1,673 (64.9%) |
| Health Care & Social Assistance | 603 (16.3%) | 3,094 (83.7%) |
| Arts, Entertainment & Recreation | 221 (49.8%) | 223 (50.2%) |
| Accommodation & Food Services | 536 (42.2%) | 735 (57.8%) |
| Public Administration | 505 (60.2%) | 334 (39.8%) |
| Total | 14,689 (54.8%) | 12,131 (45.2%) |
Education in Grundy County
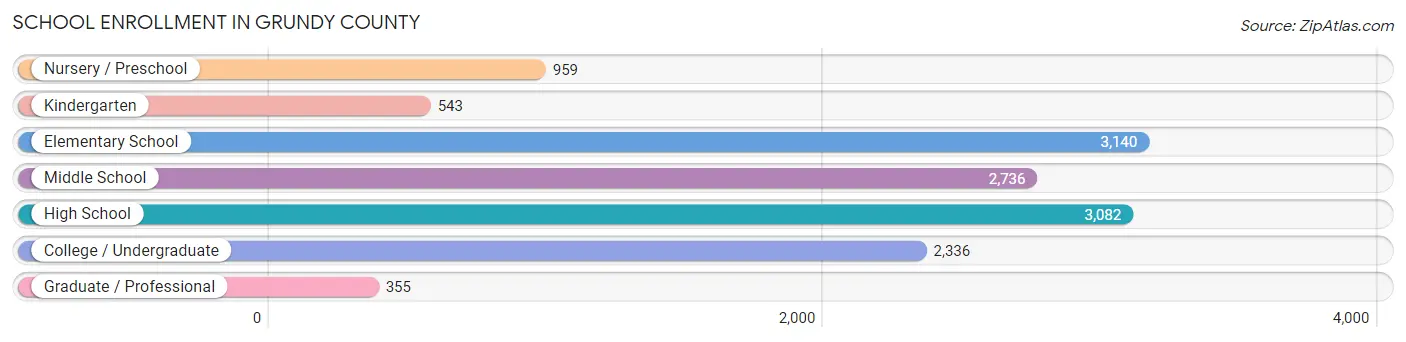
School Enrollment in Grundy County
The most common levels of schooling among the 13,151 students in Grundy County are elementary school (3,140 | 23.9%), high school (3,082 | 23.4%), and middle school (2,736 | 20.8%).
| School Level | # Students | % Students |
| Nursery / Preschool | 959 | 7.3% |
| Kindergarten | 543 | 4.1% |
| Elementary School | 3,140 | 23.9% |
| Middle School | 2,736 | 20.8% |
| High School | 3,082 | 23.4% |
| College / Undergraduate | 2,336 | 17.8% |
| Graduate / Professional | 355 | 2.7% |
| Total | 13,151 | 100.0% |
School Enrollment by Age by Funding Source in Grundy County
Out of a total of 13,151 students who are enrolled in schools in Grundy County, 1,381 (10.5%) attend a private institution, while the remaining 11,770 (89.5%) are enrolled in public schools. The age group of 25 to 34 year olds has the highest likelihood of being enrolled in private schools, with 324 (52.8% in the age bracket) enrolled. Conversely, the age group of 18 to 19 year olds has the lowest likelihood of being enrolled in a private school, with 884 (96.1% in the age bracket) attending a public institution.
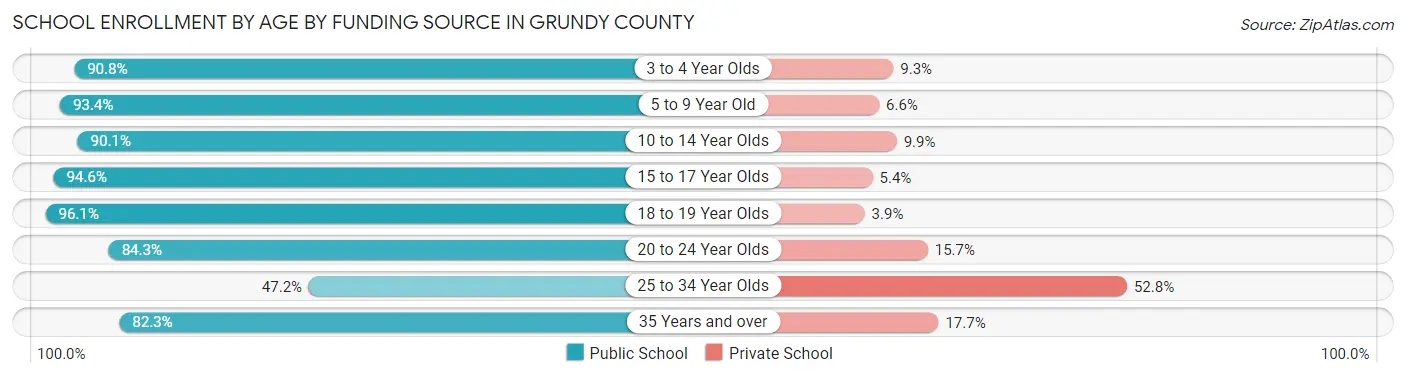
| Age Bracket | Public School | Private School |
| 3 to 4 Year Olds | 726 (90.7%) | 74 (9.2%) |
| 5 to 9 Year Old | 3,255 (93.4%) | 230 (6.6%) |
| 10 to 14 Year Olds | 3,129 (90.1%) | 343 (9.9%) |
| 15 to 17 Year Olds | 2,193 (94.6%) | 125 (5.4%) |
| 18 to 19 Year Olds | 884 (96.1%) | 36 (3.9%) |
| 20 to 24 Year Olds | 904 (84.3%) | 168 (15.7%) |
| 25 to 34 Year Olds | 290 (47.2%) | 324 (52.8%) |
| 35 Years and over | 387 (82.3%) | 83 (17.7%) |
| Total | 11,770 (89.5%) | 1,381 (10.5%) |
Educational Attainment by Field of Study in Grundy County
Business (1,788 | 18.7%), education (1,672 | 17.5%), science & technology (966 | 10.1%), social sciences (690 | 7.2%), and bio, nature & agricultural (654 | 6.9%) are the most common fields of study among 9,539 individuals in Grundy County who have obtained a bachelor's degree or higher.
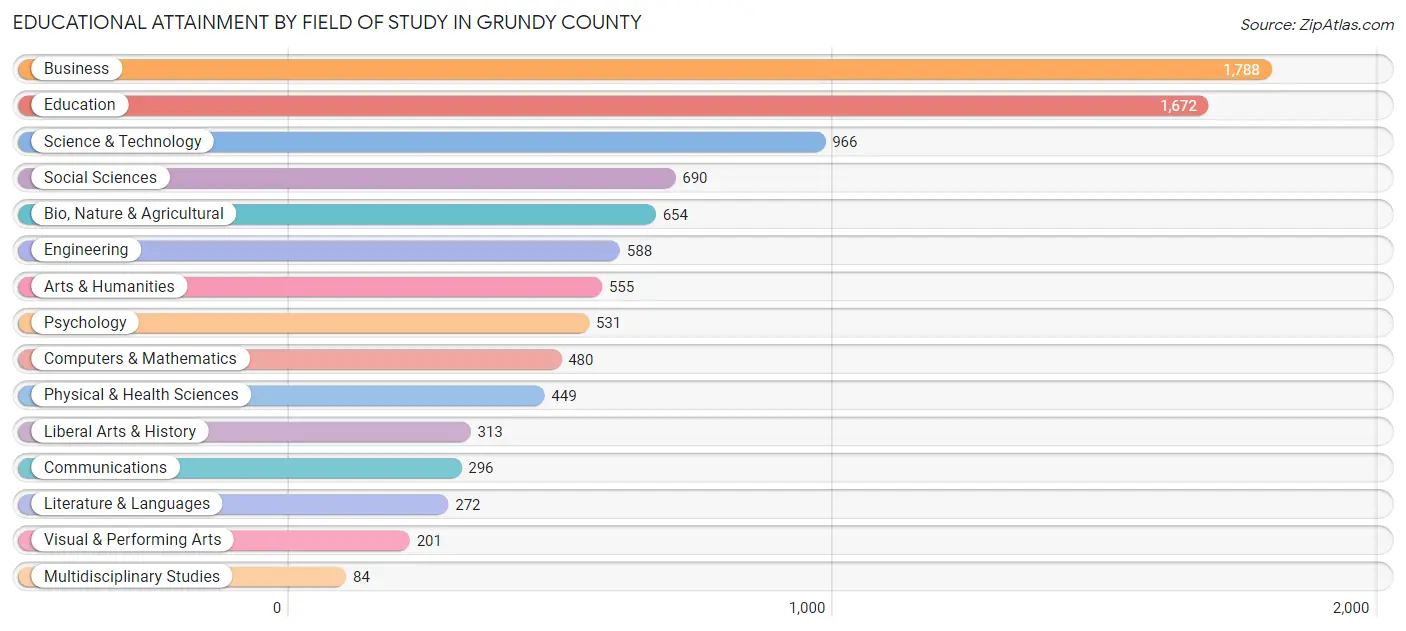
| Field of Study | # Graduates | % Graduates |
| Computers & Mathematics | 480 | 5.0% |
| Bio, Nature & Agricultural | 654 | 6.9% |
| Physical & Health Sciences | 449 | 4.7% |
| Psychology | 531 | 5.6% |
| Social Sciences | 690 | 7.2% |
| Engineering | 588 | 6.2% |
| Multidisciplinary Studies | 84 | 0.9% |
| Science & Technology | 966 | 10.1% |
| Business | 1,788 | 18.7% |
| Education | 1,672 | 17.5% |
| Literature & Languages | 272 | 2.9% |
| Liberal Arts & History | 313 | 3.3% |
| Visual & Performing Arts | 201 | 2.1% |
| Communications | 296 | 3.1% |
| Arts & Humanities | 555 | 5.8% |
| Total | 9,539 | 100.0% |
Transportation & Commute in Grundy County
Vehicle Availability by Sex in Grundy County
The most prevalent vehicle ownership categories in Grundy County are males with 2 vehicles (6,338, accounting for 43.7%) and females with 2 vehicles (4,870, making up 53.7%).
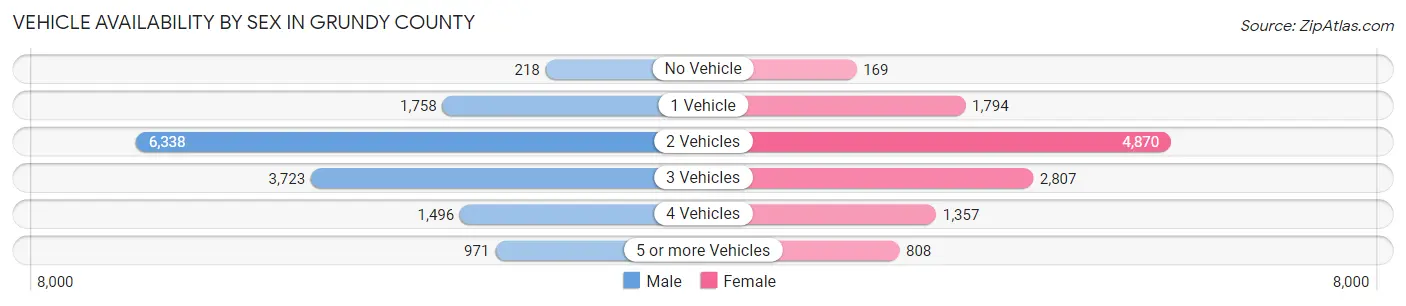
| Vehicles Available | Male | Female |
| No Vehicle | 218 (1.5%) | 169 (1.4%) |
| 1 Vehicle | 1,758 (12.1%) | 1,794 (15.2%) |
| 2 Vehicles | 6,338 (43.7%) | 4,870 (41.2%) |
| 3 Vehicles | 3,723 (25.7%) | 2,807 (23.8%) |
| 4 Vehicles | 1,496 (10.3%) | 1,357 (11.5%) |
| 5 or more Vehicles | 971 (6.7%) | 808 (6.8%) |
| Total | 14,504 (100.0%) | 11,805 (100.0%) |
Commute Time in Grundy County
The most frequently occuring commute durations in Grundy County are 30 to 34 minutes (3,323 commuters, 13.7%), 5 to 9 minutes (3,108 commuters, 12.8%), and 20 to 24 minutes (2,875 commuters, 11.9%).
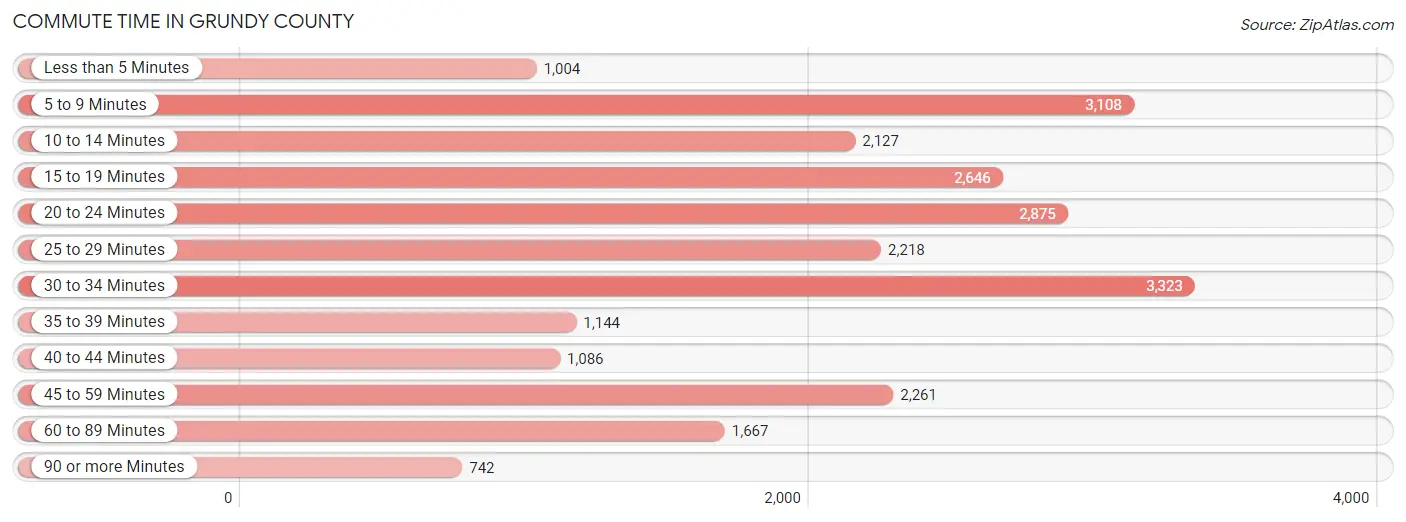
| Commute Time | # Commuters | % Commuters |
| Less than 5 Minutes | 1,004 | 4.2% |
| 5 to 9 Minutes | 3,108 | 12.8% |
| 10 to 14 Minutes | 2,127 | 8.8% |
| 15 to 19 Minutes | 2,646 | 10.9% |
| 20 to 24 Minutes | 2,875 | 11.9% |
| 25 to 29 Minutes | 2,218 | 9.2% |
| 30 to 34 Minutes | 3,323 | 13.7% |
| 35 to 39 Minutes | 1,144 | 4.7% |
| 40 to 44 Minutes | 1,086 | 4.5% |
| 45 to 59 Minutes | 2,261 | 9.3% |
| 60 to 89 Minutes | 1,667 | 6.9% |
| 90 or more Minutes | 742 | 3.1% |
Commute Time by Sex in Grundy County
The most common commute times in Grundy County are 30 to 34 minutes (1,792 commuters, 13.5%) for males and 5 to 9 minutes (1,999 commuters, 18.3%) for females.
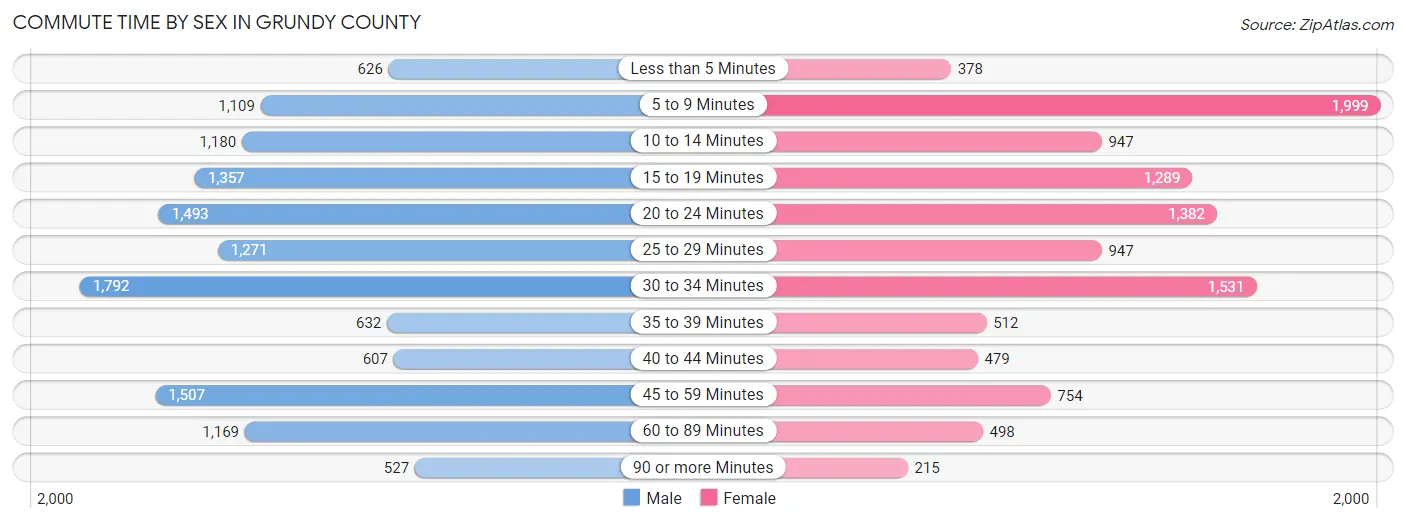
| Commute Time | Male | Female |
| Less than 5 Minutes | 626 (4.7%) | 378 (3.5%) |
| 5 to 9 Minutes | 1,109 (8.4%) | 1,999 (18.3%) |
| 10 to 14 Minutes | 1,180 (8.9%) | 947 (8.7%) |
| 15 to 19 Minutes | 1,357 (10.2%) | 1,289 (11.8%) |
| 20 to 24 Minutes | 1,493 (11.3%) | 1,382 (12.6%) |
| 25 to 29 Minutes | 1,271 (9.6%) | 947 (8.7%) |
| 30 to 34 Minutes | 1,792 (13.5%) | 1,531 (14.0%) |
| 35 to 39 Minutes | 632 (4.8%) | 512 (4.7%) |
| 40 to 44 Minutes | 607 (4.6%) | 479 (4.4%) |
| 45 to 59 Minutes | 1,507 (11.4%) | 754 (6.9%) |
| 60 to 89 Minutes | 1,169 (8.8%) | 498 (4.6%) |
| 90 or more Minutes | 527 (4.0%) | 215 (2.0%) |
Time of Departure to Work by Sex in Grundy County
The most frequent times of departure to work in Grundy County are 6:00 AM to 6:29 AM (2,039, 15.4%) for males and 7:00 AM to 7:29 AM (1,894, 17.3%) for females.
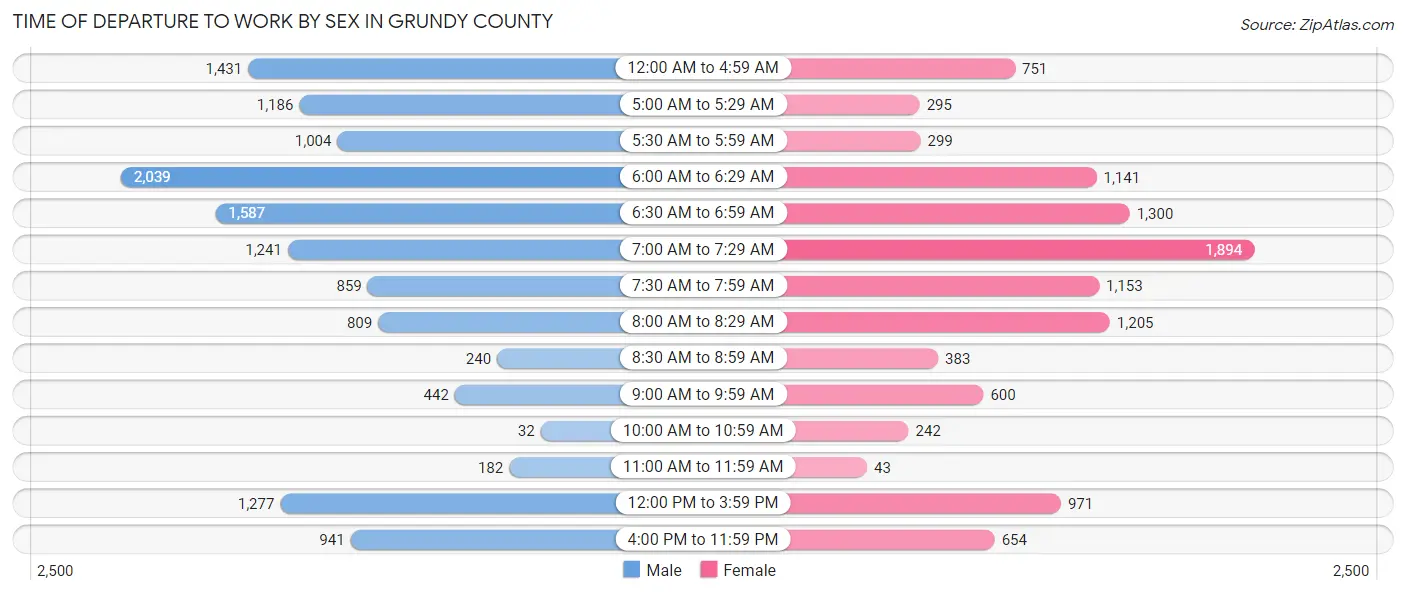
| Time of Departure | Male | Female |
| 12:00 AM to 4:59 AM | 1,431 (10.8%) | 751 (6.9%) |
| 5:00 AM to 5:29 AM | 1,186 (8.9%) | 295 (2.7%) |
| 5:30 AM to 5:59 AM | 1,004 (7.6%) | 299 (2.7%) |
| 6:00 AM to 6:29 AM | 2,039 (15.4%) | 1,141 (10.4%) |
| 6:30 AM to 6:59 AM | 1,587 (12.0%) | 1,300 (11.9%) |
| 7:00 AM to 7:29 AM | 1,241 (9.3%) | 1,894 (17.3%) |
| 7:30 AM to 7:59 AM | 859 (6.5%) | 1,153 (10.5%) |
| 8:00 AM to 8:29 AM | 809 (6.1%) | 1,205 (11.0%) |
| 8:30 AM to 8:59 AM | 240 (1.8%) | 383 (3.5%) |
| 9:00 AM to 9:59 AM | 442 (3.3%) | 600 (5.5%) |
| 10:00 AM to 10:59 AM | 32 (0.2%) | 242 (2.2%) |
| 11:00 AM to 11:59 AM | 182 (1.4%) | 43 (0.4%) |
| 12:00 PM to 3:59 PM | 1,277 (9.6%) | 971 (8.9%) |
| 4:00 PM to 11:59 PM | 941 (7.1%) | 654 (6.0%) |
| Total | 13,270 (100.0%) | 10,931 (100.0%) |
Housing Occupancy in Grundy County
Occupancy by Ownership in Grundy County
Of the total 20,376 dwellings in Grundy County, owner-occupied units account for 15,440 (75.8%), while renter-occupied units make up 4,936 (24.2%).
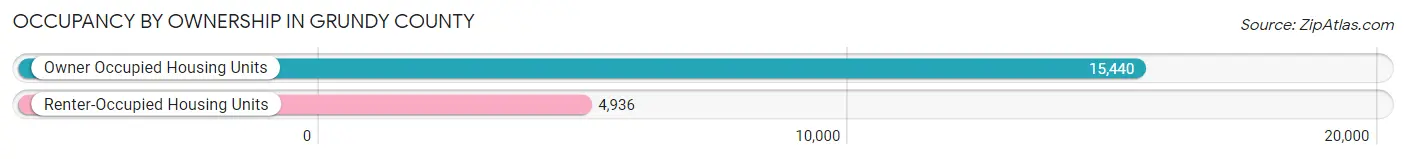
| Occupancy | # Housing Units | % Housing Units |
| Owner Occupied Housing Units | 15,440 | 75.8% |
| Renter-Occupied Housing Units | 4,936 | 24.2% |
| Total Occupied Housing Units | 20,376 | 100.0% |
Occupancy by Household Size in Grundy County
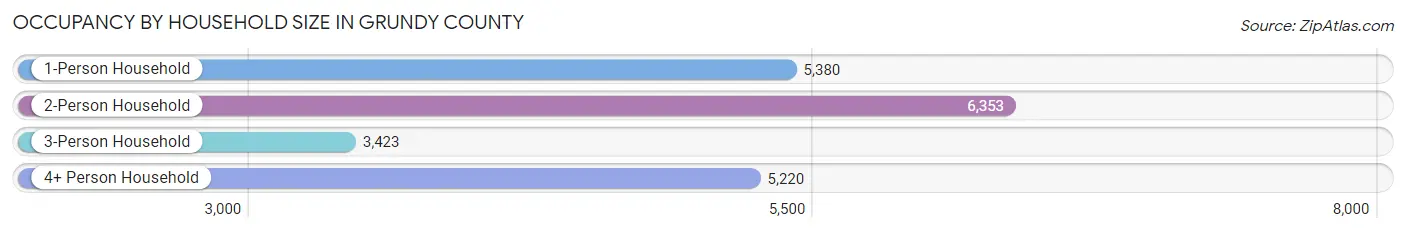
| Household Size | # Housing Units | % Housing Units |
| 1-Person Household | 5,380 | 26.4% |
| 2-Person Household | 6,353 | 31.2% |
| 3-Person Household | 3,423 | 16.8% |
| 4+ Person Household | 5,220 | 25.6% |
| Total Housing Units | 20,376 | 100.0% |
Occupancy by Ownership by Household Size in Grundy County

| Household Size | Owner-occupied | Renter-occupied |
| 1-Person Household | 3,109 (57.8%) | 2,271 (42.2%) |
| 2-Person Household | 5,198 (81.8%) | 1,155 (18.2%) |
| 3-Person Household | 2,639 (77.1%) | 784 (22.9%) |
| 4+ Person Household | 4,494 (86.1%) | 726 (13.9%) |
| Total Housing Units | 15,440 (75.8%) | 4,936 (24.2%) |
Occupancy by Educational Attainment in Grundy County
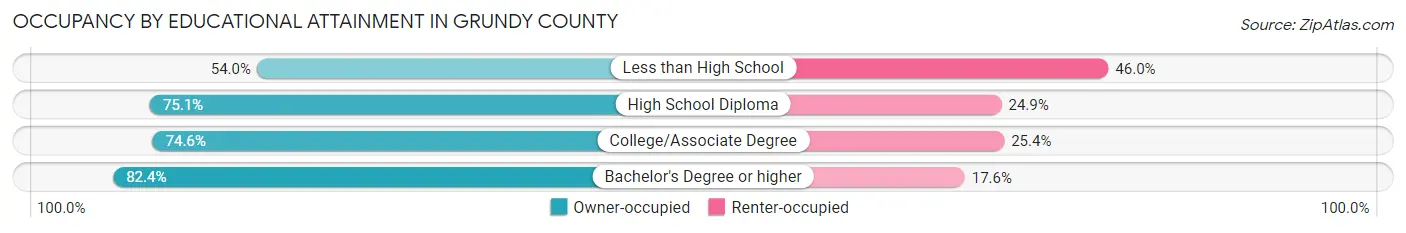
| Household Size | Owner-occupied | Renter-occupied |
| Less than High School | 525 (54.0%) | 448 (46.0%) |
| High School Diploma | 4,842 (75.1%) | 1,602 (24.9%) |
| College/Associate Degree | 5,806 (74.6%) | 1,976 (25.4%) |
| Bachelor's Degree or higher | 4,267 (82.4%) | 910 (17.6%) |
Occupancy by Age of Householder in Grundy County
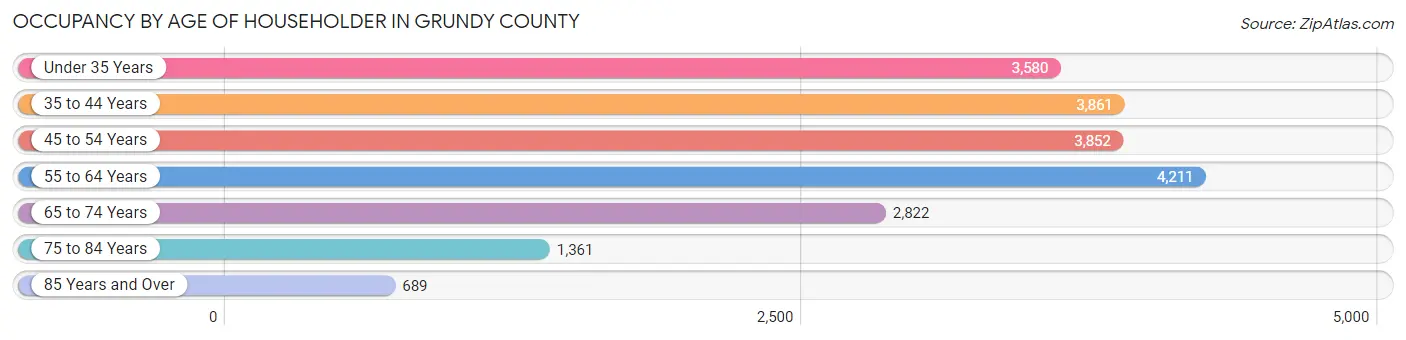
| Age Bracket | # Households | % Households |
| Under 35 Years | 3,580 | 17.6% |
| 35 to 44 Years | 3,861 | 19.0% |
| 45 to 54 Years | 3,852 | 18.9% |
| 55 to 64 Years | 4,211 | 20.7% |
| 65 to 74 Years | 2,822 | 13.9% |
| 75 to 84 Years | 1,361 | 6.7% |
| 85 Years and Over | 689 | 3.4% |
| Total | 20,376 | 100.0% |
Housing Finances in Grundy County
Median Income by Occupancy in Grundy County
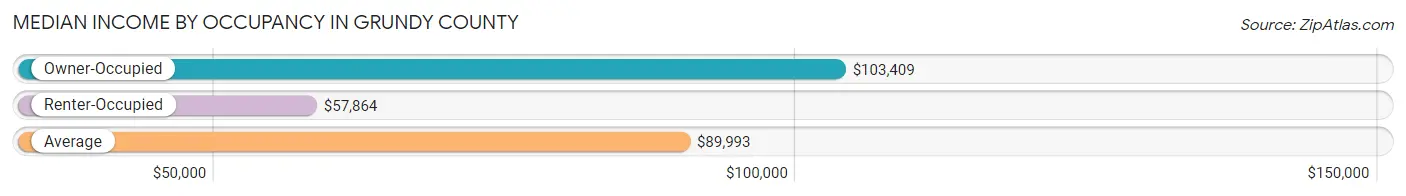
| Occupancy Type | # Households | Median Income |
| Owner-Occupied | 15,440 (75.8%) | $103,409 |
| Renter-Occupied | 4,936 (24.2%) | $57,864 |
| Average | 20,376 (100.0%) | $89,993 |
Occupancy by Householder Income Bracket in Grundy County
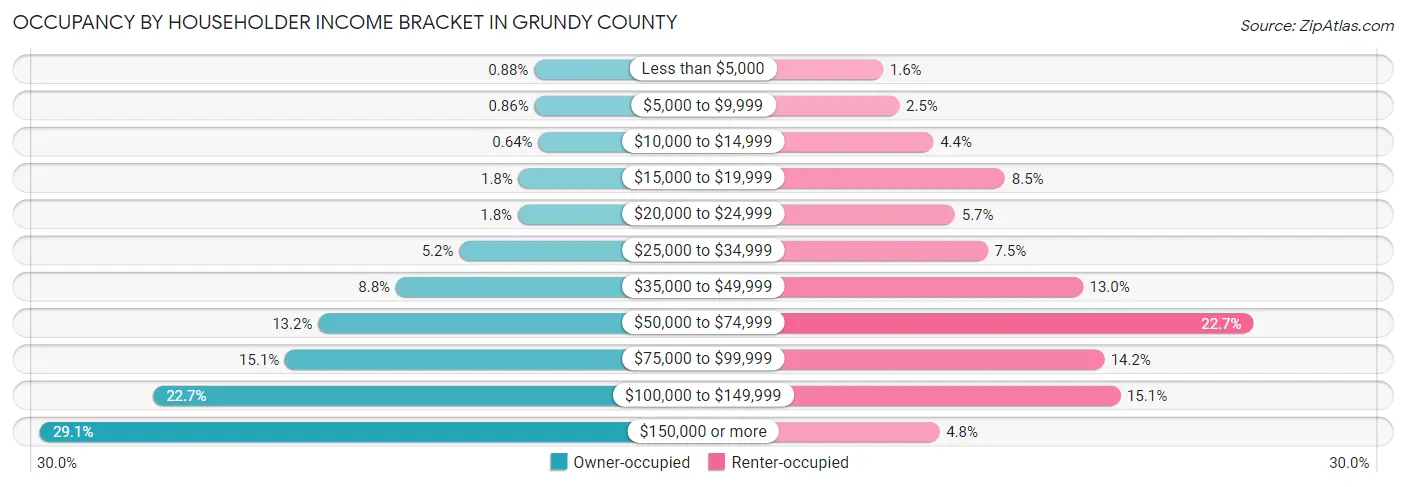
| Income Bracket | Owner-occupied | Renter-occupied |
| Less than $5,000 | 136 (0.9%) | 77 (1.6%) |
| $5,000 to $9,999 | 133 (0.9%) | 123 (2.5%) |
| $10,000 to $14,999 | 99 (0.6%) | 219 (4.4%) |
| $15,000 to $19,999 | 273 (1.8%) | 421 (8.5%) |
| $20,000 to $24,999 | 280 (1.8%) | 280 (5.7%) |
| $25,000 to $34,999 | 797 (5.2%) | 372 (7.5%) |
| $35,000 to $49,999 | 1,355 (8.8%) | 640 (13.0%) |
| $50,000 to $74,999 | 2,041 (13.2%) | 1,122 (22.7%) |
| $75,000 to $99,999 | 2,333 (15.1%) | 700 (14.2%) |
| $100,000 to $149,999 | 3,497 (22.7%) | 746 (15.1%) |
| $150,000 or more | 4,496 (29.1%) | 236 (4.8%) |
| Total | 15,440 (100.0%) | 4,936 (100.0%) |
Monthly Housing Cost Tiers in Grundy County
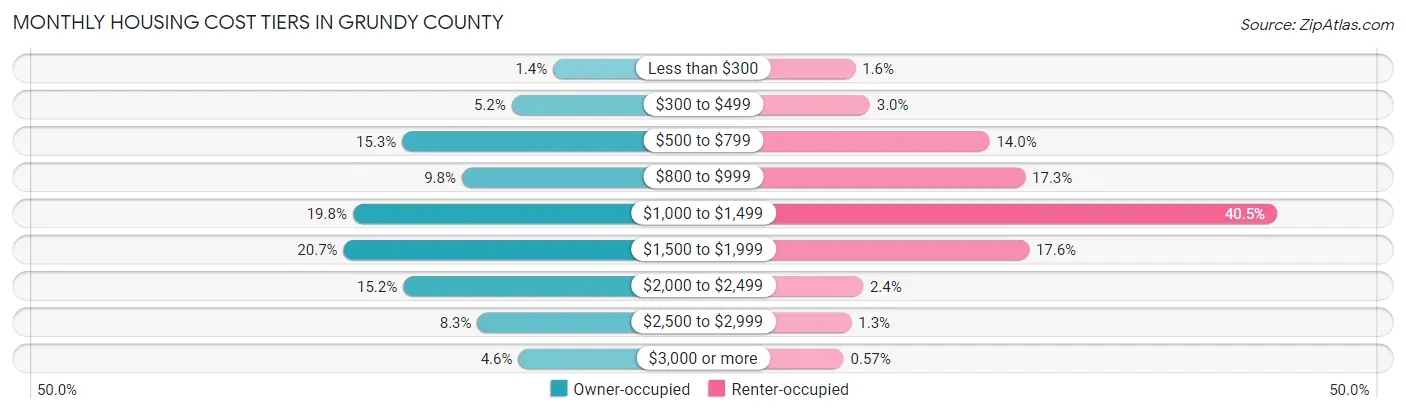
| Monthly Cost | Owner-occupied | Renter-occupied |
| Less than $300 | 209 (1.3%) | 81 (1.6%) |
| $300 to $499 | 799 (5.2%) | 147 (3.0%) |
| $500 to $799 | 2,355 (15.2%) | 691 (14.0%) |
| $800 to $999 | 1,505 (9.8%) | 853 (17.3%) |
| $1,000 to $1,499 | 3,055 (19.8%) | 1,997 (40.5%) |
| $1,500 to $1,999 | 3,189 (20.6%) | 870 (17.6%) |
| $2,000 to $2,499 | 2,340 (15.2%) | 116 (2.4%) |
| $2,500 to $2,999 | 1,285 (8.3%) | 63 (1.3%) |
| $3,000 or more | 703 (4.5%) | 28 (0.6%) |
| Total | 15,440 (100.0%) | 4,936 (100.0%) |
Physical Housing Characteristics in Grundy County
Housing Structures in Grundy County
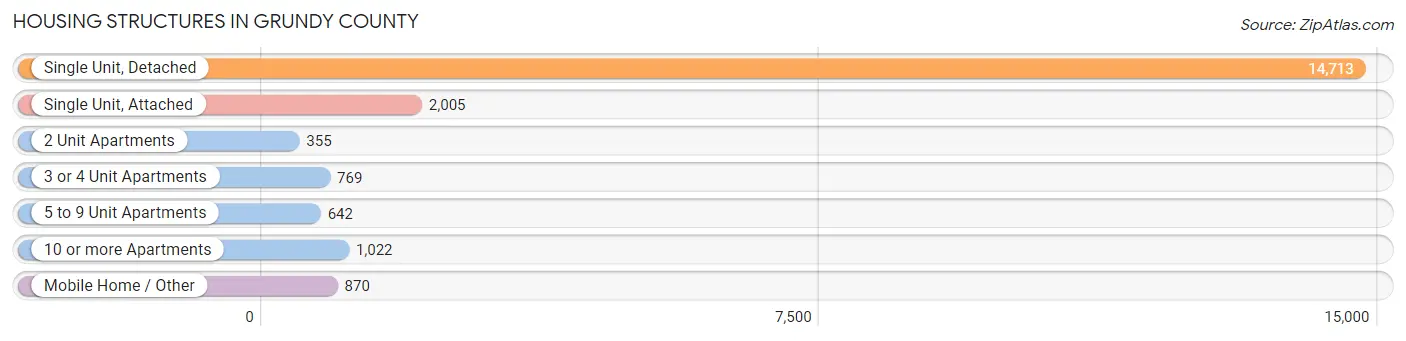
| Structure Type | # Housing Units | % Housing Units |
| Single Unit, Detached | 14,713 | 72.2% |
| Single Unit, Attached | 2,005 | 9.8% |
| 2 Unit Apartments | 355 | 1.7% |
| 3 or 4 Unit Apartments | 769 | 3.8% |
| 5 to 9 Unit Apartments | 642 | 3.2% |
| 10 or more Apartments | 1,022 | 5.0% |
| Mobile Home / Other | 870 | 4.3% |
| Total | 20,376 | 100.0% |
Housing Structures by Occupancy in Grundy County
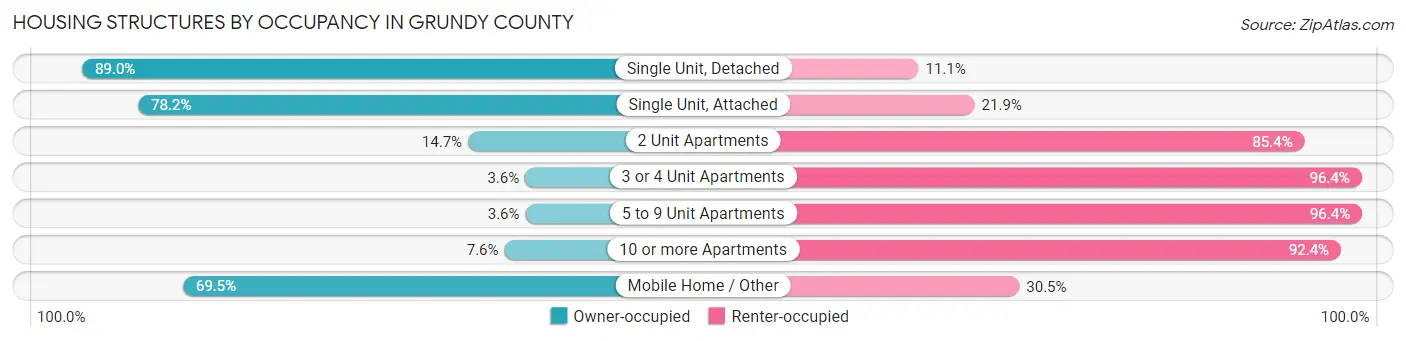
| Structure Type | Owner-occupied | Renter-occupied |
| Single Unit, Detached | 13,087 (88.9%) | 1,626 (11.1%) |
| Single Unit, Attached | 1,567 (78.1%) | 438 (21.8%) |
| 2 Unit Apartments | 52 (14.6%) | 303 (85.4%) |
| 3 or 4 Unit Apartments | 28 (3.6%) | 741 (96.4%) |
| 5 to 9 Unit Apartments | 23 (3.6%) | 619 (96.4%) |
| 10 or more Apartments | 78 (7.6%) | 944 (92.4%) |
| Mobile Home / Other | 605 (69.5%) | 265 (30.5%) |
| Total | 15,440 (75.8%) | 4,936 (24.2%) |
Housing Structures by Number of Rooms in Grundy County
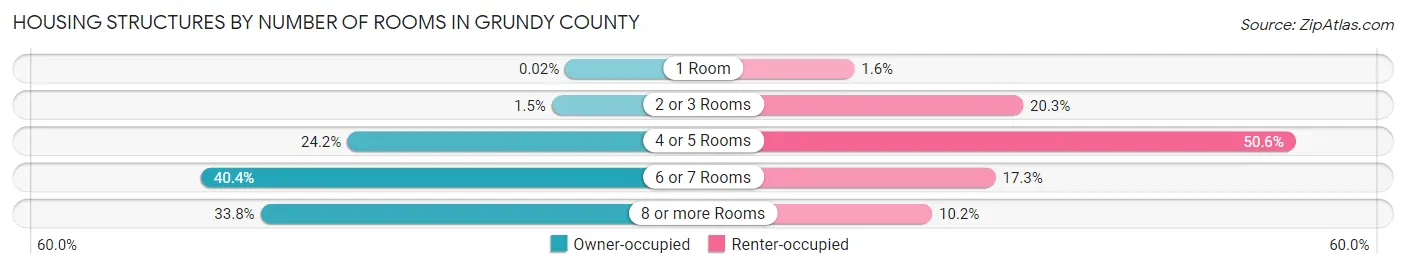
| Number of Rooms | Owner-occupied | Renter-occupied |
| 1 Room | 3 (0.0%) | 79 (1.6%) |
| 2 or 3 Rooms | 232 (1.5%) | 1,003 (20.3%) |
| 4 or 5 Rooms | 3,738 (24.2%) | 2,496 (50.6%) |
| 6 or 7 Rooms | 6,243 (40.4%) | 853 (17.3%) |
| 8 or more Rooms | 5,224 (33.8%) | 505 (10.2%) |
| Total | 15,440 (100.0%) | 4,936 (100.0%) |
Housing Structure by Heating Type in Grundy County
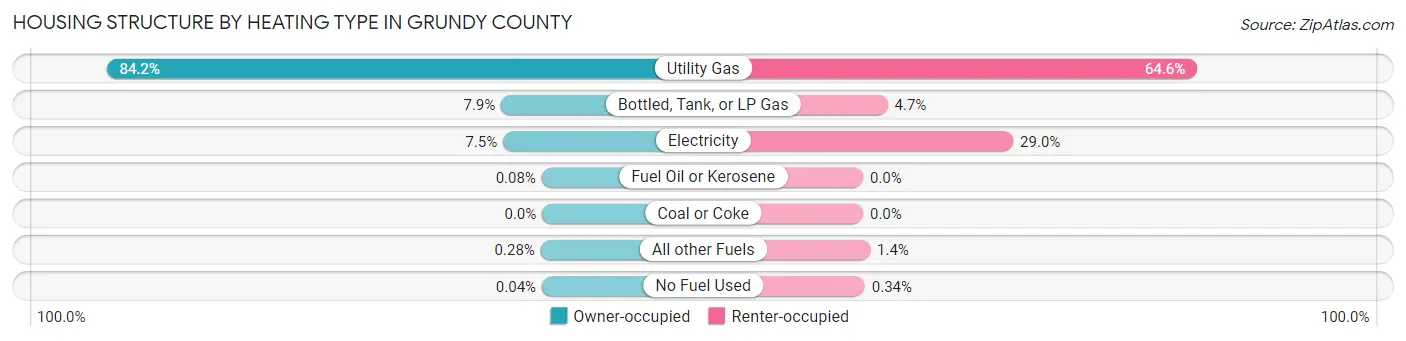
| Heating Type | Owner-occupied | Renter-occupied |
| Utility Gas | 12,992 (84.2%) | 3,186 (64.5%) |
| Bottled, Tank, or LP Gas | 1,223 (7.9%) | 234 (4.7%) |
| Electricity | 1,163 (7.5%) | 1,432 (29.0%) |
| Fuel Oil or Kerosene | 12 (0.1%) | 0 (0.0%) |
| Coal or Coke | 0 (0.0%) | 0 (0.0%) |
| All other Fuels | 44 (0.3%) | 67 (1.4%) |
| No Fuel Used | 6 (0.0%) | 17 (0.3%) |
| Total | 15,440 (100.0%) | 4,936 (100.0%) |
Household Vehicle Usage in Grundy County
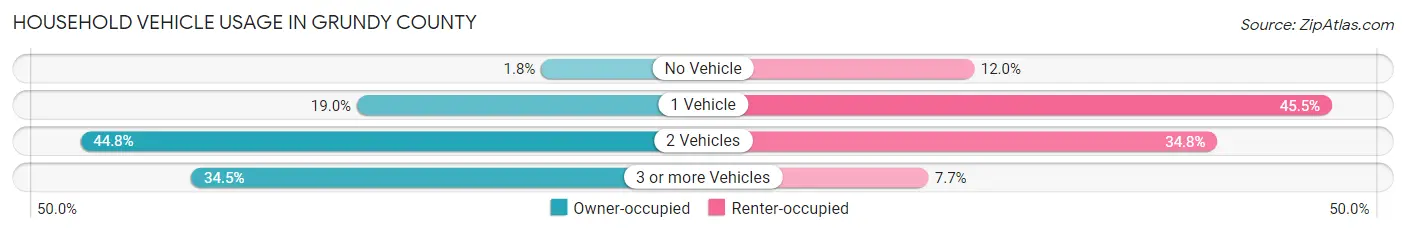
| Vehicles per Household | Owner-occupied | Renter-occupied |
| No Vehicle | 275 (1.8%) | 594 (12.0%) |
| 1 Vehicle | 2,930 (19.0%) | 2,244 (45.5%) |
| 2 Vehicles | 6,916 (44.8%) | 1,716 (34.8%) |
| 3 or more Vehicles | 5,319 (34.4%) | 382 (7.7%) |
| Total | 15,440 (100.0%) | 4,936 (100.0%) |
Real Estate & Mortgages in Grundy County
Real Estate and Mortgage Overview in Grundy County
| Characteristic | Without Mortgage | With Mortgage |
| Housing Units | 5,262 | 10,178 |
| Median Property Value | $218,000 | $259,200 |
| Median Household Income | $76,045 | $3,420 |
| Monthly Housing Costs | $736 | $703 |
| Real Estate Taxes | $4,316 | $143 |
Property Value by Mortgage Status in Grundy County
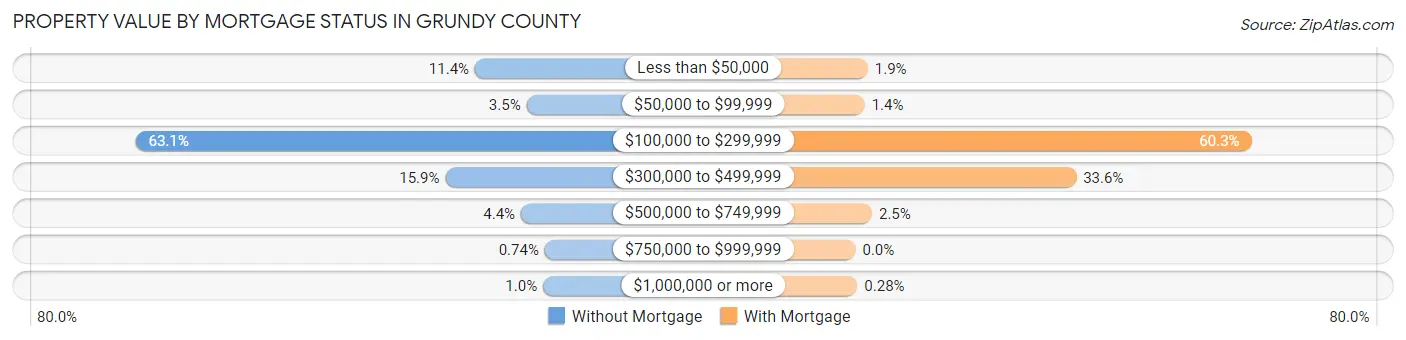
| Property Value | Without Mortgage | With Mortgage |
| Less than $50,000 | 599 (11.4%) | 190 (1.9%) |
| $50,000 to $99,999 | 185 (3.5%) | 143 (1.4%) |
| $100,000 to $299,999 | 3,320 (63.1%) | 6,139 (60.3%) |
| $300,000 to $499,999 | 836 (15.9%) | 3,422 (33.6%) |
| $500,000 to $749,999 | 230 (4.4%) | 255 (2.5%) |
| $750,000 to $999,999 | 39 (0.7%) | 0 (0.0%) |
| $1,000,000 or more | 53 (1.0%) | 29 (0.3%) |
| Total | 5,262 (100.0%) | 10,178 (100.0%) |
Household Income by Mortgage Status in Grundy County
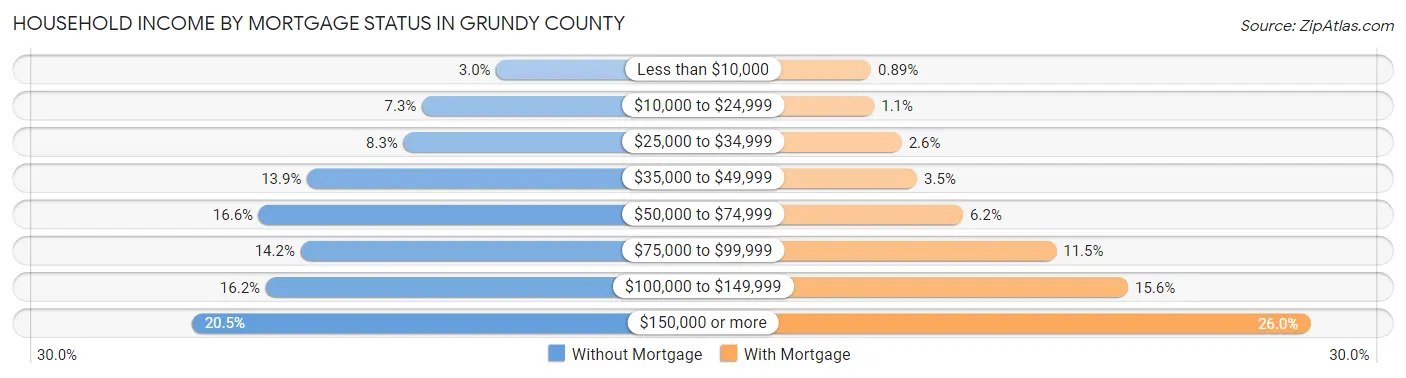
| Household Income | Without Mortgage | With Mortgage |
| Less than $10,000 | 160 (3.0%) | 91 (0.9%) |
| $10,000 to $24,999 | 383 (7.3%) | 109 (1.1%) |
| $25,000 to $34,999 | 439 (8.3%) | 269 (2.6%) |
| $35,000 to $49,999 | 729 (13.9%) | 358 (3.5%) |
| $50,000 to $74,999 | 874 (16.6%) | 626 (6.1%) |
| $75,000 to $99,999 | 748 (14.2%) | 1,167 (11.5%) |
| $100,000 to $149,999 | 853 (16.2%) | 1,585 (15.6%) |
| $150,000 or more | 1,076 (20.4%) | 2,644 (26.0%) |
| Total | 5,262 (100.0%) | 10,178 (100.0%) |
Property Value to Household Income Ratio in Grundy County
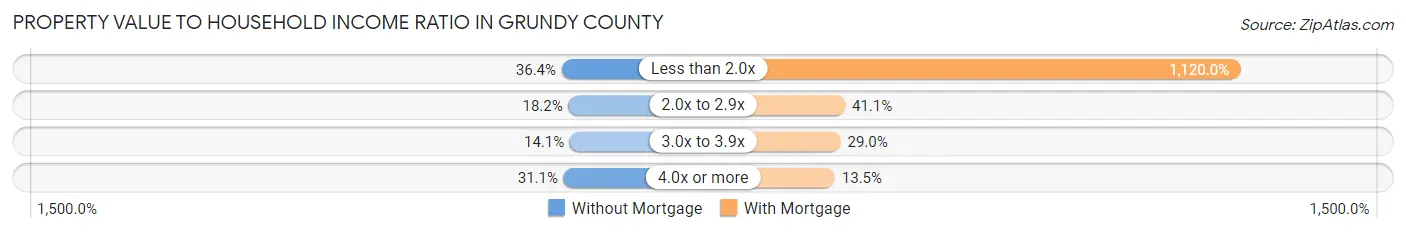
| Value-to-Income Ratio | Without Mortgage | With Mortgage |
| Less than 2.0x | 1,915 (36.4%) | 113,989 (1,120.0%) |
| 2.0x to 2.9x | 955 (18.1%) | 4,184 (41.1%) |
| 3.0x to 3.9x | 740 (14.1%) | 2,956 (29.0%) |
| 4.0x or more | 1,635 (31.1%) | 1,370 (13.5%) |
| Total | 5,262 (100.0%) | 10,178 (100.0%) |
Real Estate Taxes by Mortgage Status in Grundy County
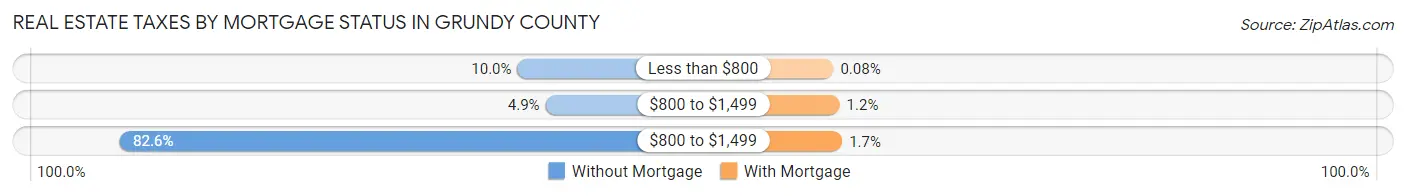
| Property Taxes | Without Mortgage | With Mortgage |
| Less than $800 | 526 (10.0%) | 8 (0.1%) |
| $800 to $1,499 | 256 (4.9%) | 123 (1.2%) |
| $800 to $1,499 | 4,344 (82.6%) | 171 (1.7%) |
| Total | 5,262 (100.0%) | 10,178 (100.0%) |
Health & Disability in Grundy County
Health Insurance Coverage by Age in Grundy County
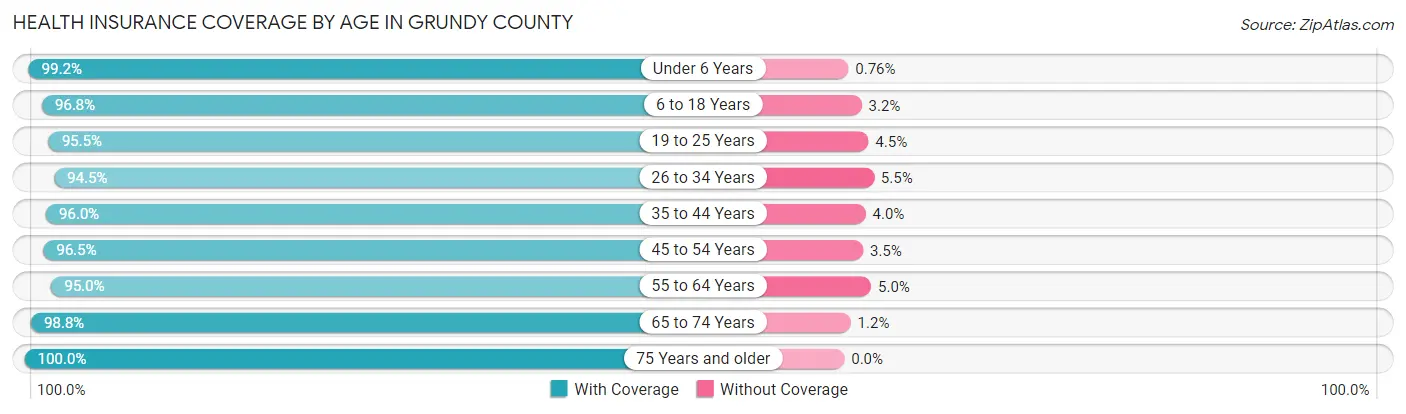
| Age Bracket | With Coverage | Without Coverage |
| Under 6 Years | 3,672 (99.2%) | 28 (0.8%) |
| 6 to 18 Years | 9,608 (96.8%) | 320 (3.2%) |
| 19 to 25 Years | 4,176 (95.5%) | 197 (4.5%) |
| 26 to 34 Years | 5,566 (94.5%) | 325 (5.5%) |
| 35 to 44 Years | 6,882 (96.0%) | 285 (4.0%) |
| 45 to 54 Years | 6,834 (96.5%) | 248 (3.5%) |
| 55 to 64 Years | 6,514 (95.0%) | 342 (5.0%) |
| 65 to 74 Years | 4,471 (98.8%) | 54 (1.2%) |
| 75 Years and older | 2,765 (100.0%) | 0 (0.0%) |
| Total | 50,488 (96.6%) | 1,799 (3.4%) |
Health Insurance Coverage by Citizenship Status in Grundy County
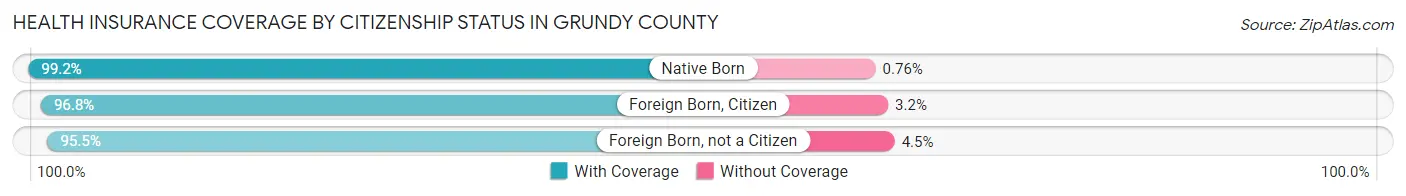
| Citizenship Status | With Coverage | Without Coverage |
| Native Born | 3,672 (99.2%) | 28 (0.8%) |
| Foreign Born, Citizen | 9,608 (96.8%) | 320 (3.2%) |
| Foreign Born, not a Citizen | 4,176 (95.5%) | 197 (4.5%) |
Health Insurance Coverage by Household Income in Grundy County
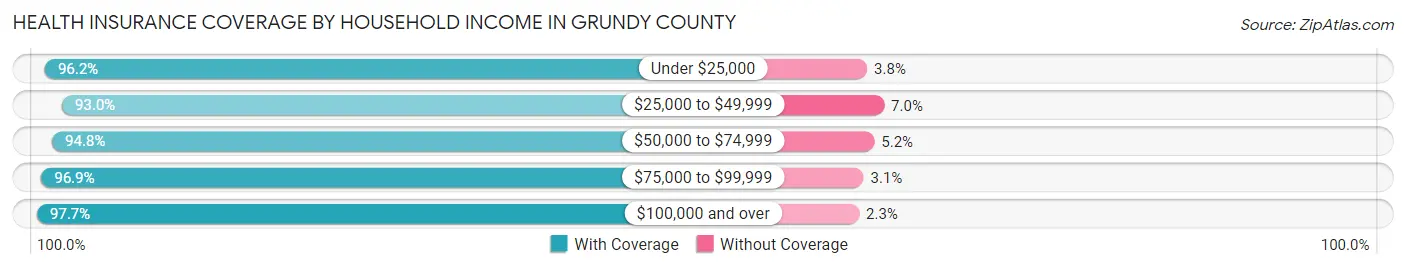
| Household Income | With Coverage | Without Coverage |
| Under $25,000 | 2,999 (96.2%) | 119 (3.8%) |
| $25,000 to $49,999 | 5,529 (93.0%) | 416 (7.0%) |
| $50,000 to $74,999 | 6,397 (94.8%) | 348 (5.2%) |
| $75,000 to $99,999 | 7,053 (96.9%) | 229 (3.1%) |
| $100,000 and over | 28,471 (97.7%) | 671 (2.3%) |
Public vs Private Health Insurance Coverage by Age in Grundy County
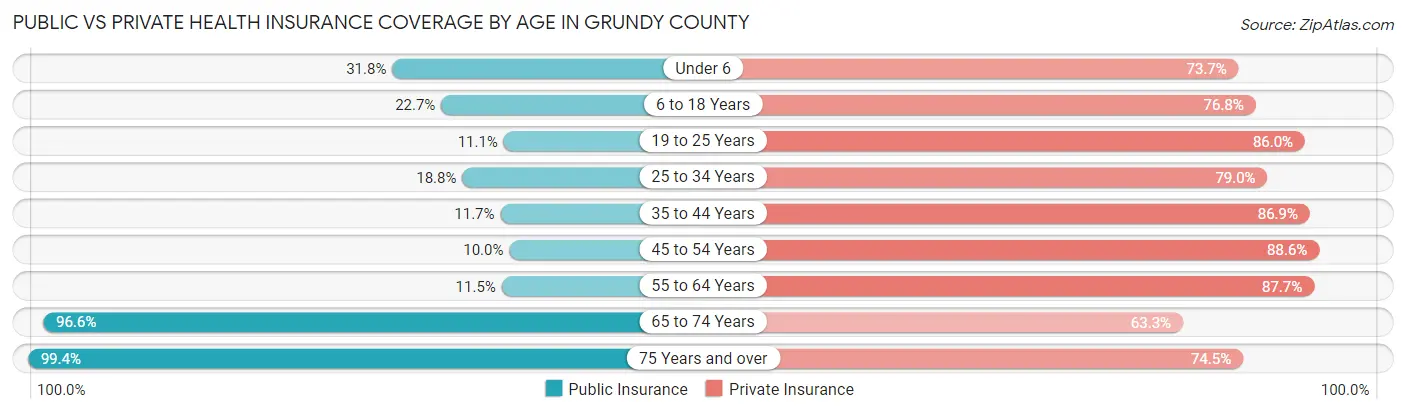
| Age Bracket | Public Insurance | Private Insurance |
| Under 6 | 1,175 (31.8%) | 2,725 (73.7%) |
| 6 to 18 Years | 2,251 (22.7%) | 7,626 (76.8%) |
| 19 to 25 Years | 484 (11.1%) | 3,759 (86.0%) |
| 25 to 34 Years | 1,105 (18.8%) | 4,654 (79.0%) |
| 35 to 44 Years | 838 (11.7%) | 6,225 (86.9%) |
| 45 to 54 Years | 710 (10.0%) | 6,275 (88.6%) |
| 55 to 64 Years | 785 (11.5%) | 6,009 (87.6%) |
| 65 to 74 Years | 4,370 (96.6%) | 2,865 (63.3%) |
| 75 Years and over | 2,749 (99.4%) | 2,059 (74.5%) |
| Total | 14,467 (27.7%) | 42,197 (80.7%) |
Disability Status by Sex by Age in Grundy County
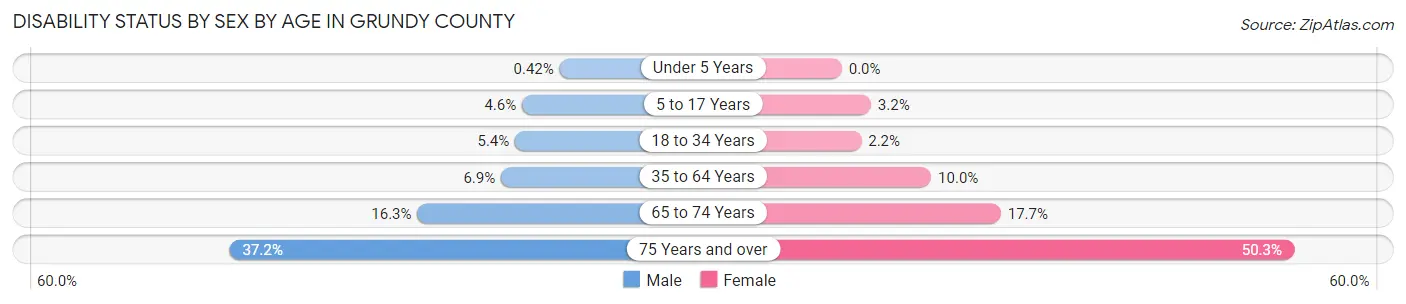
| Age Bracket | Male | Female |
| Under 5 Years | 7 (0.4%) | 0 (0.0%) |
| 5 to 17 Years | 240 (4.6%) | 155 (3.2%) |
| 18 to 34 Years | 298 (5.4%) | 116 (2.2%) |
| 35 to 64 Years | 752 (6.9%) | 1,022 (10.0%) |
| 65 to 74 Years | 350 (16.3%) | 420 (17.7%) |
| 75 Years and over | 429 (37.2%) | 811 (50.3%) |
Disability Class by Sex by Age in Grundy County
Disability Class: Hearing Difficulty
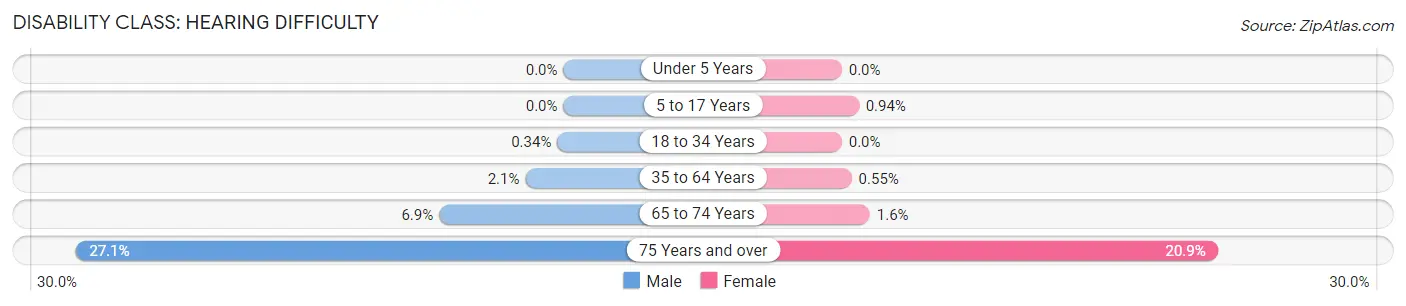
| Age Bracket | Male | Female |
| Under 5 Years | 0 (0.0%) | 0 (0.0%) |
| 5 to 17 Years | 0 (0.0%) | 45 (0.9%) |
| 18 to 34 Years | 19 (0.3%) | 0 (0.0%) |
| 35 to 64 Years | 230 (2.1%) | 56 (0.5%) |
| 65 to 74 Years | 149 (6.9%) | 37 (1.6%) |
| 75 Years and over | 313 (27.1%) | 337 (20.9%) |
Disability Class: Vision Difficulty
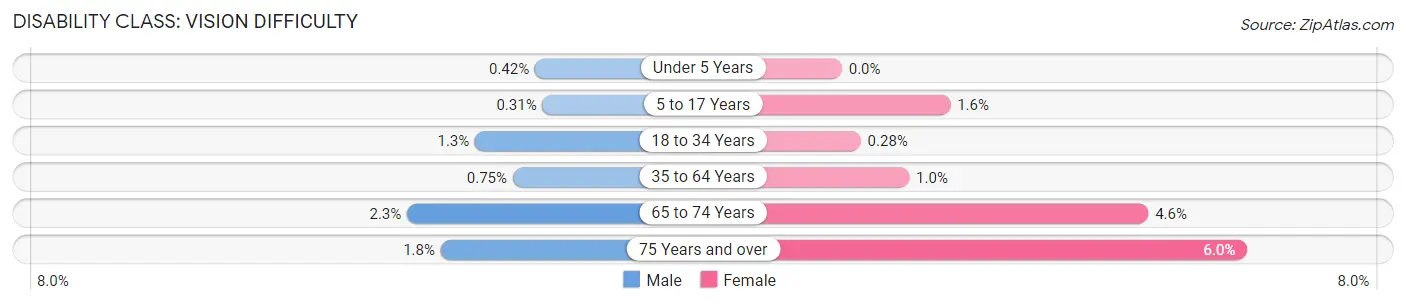
| Age Bracket | Male | Female |
| Under 5 Years | 7 (0.4%) | 0 (0.0%) |
| 5 to 17 Years | 16 (0.3%) | 77 (1.6%) |
| 18 to 34 Years | 73 (1.3%) | 15 (0.3%) |
| 35 to 64 Years | 81 (0.7%) | 103 (1.0%) |
| 65 to 74 Years | 50 (2.3%) | 108 (4.5%) |
| 75 Years and over | 21 (1.8%) | 97 (6.0%) |
Disability Class: Cognitive Difficulty
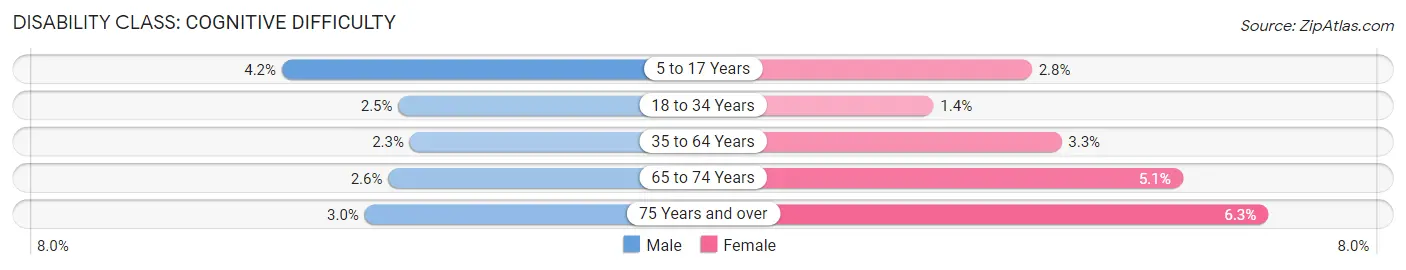
| Age Bracket | Male | Female |
| 5 to 17 Years | 218 (4.2%) | 135 (2.8%) |
| 18 to 34 Years | 136 (2.5%) | 73 (1.4%) |
| 35 to 64 Years | 247 (2.3%) | 335 (3.3%) |
| 65 to 74 Years | 56 (2.6%) | 120 (5.1%) |
| 75 Years and over | 34 (2.9%) | 102 (6.3%) |
Disability Class: Ambulatory Difficulty
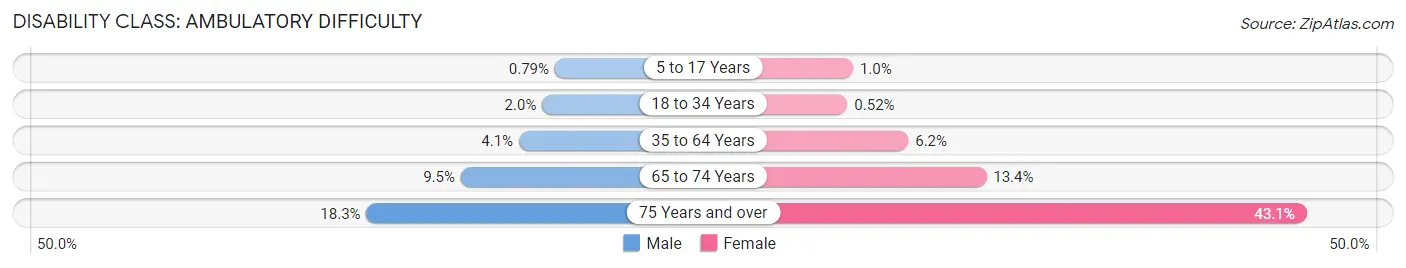
| Age Bracket | Male | Female |
| 5 to 17 Years | 41 (0.8%) | 50 (1.0%) |
| 18 to 34 Years | 109 (2.0%) | 28 (0.5%) |
| 35 to 64 Years | 446 (4.1%) | 634 (6.2%) |
| 65 to 74 Years | 205 (9.5%) | 318 (13.4%) |
| 75 Years and over | 211 (18.3%) | 695 (43.1%) |
Disability Class: Self-Care Difficulty
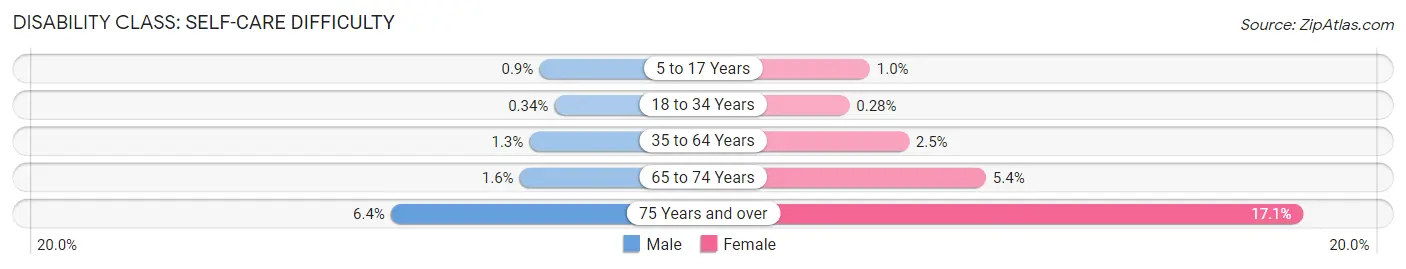
| Age Bracket | Male | Female |
| 5 to 17 Years | 47 (0.9%) | 50 (1.0%) |
| 18 to 34 Years | 19 (0.3%) | 15 (0.3%) |
| 35 to 64 Years | 137 (1.3%) | 256 (2.5%) |
| 65 to 74 Years | 35 (1.6%) | 127 (5.3%) |
| 75 Years and over | 74 (6.4%) | 276 (17.1%) |
Technology Access in Grundy County
Computing Device Access in Grundy County
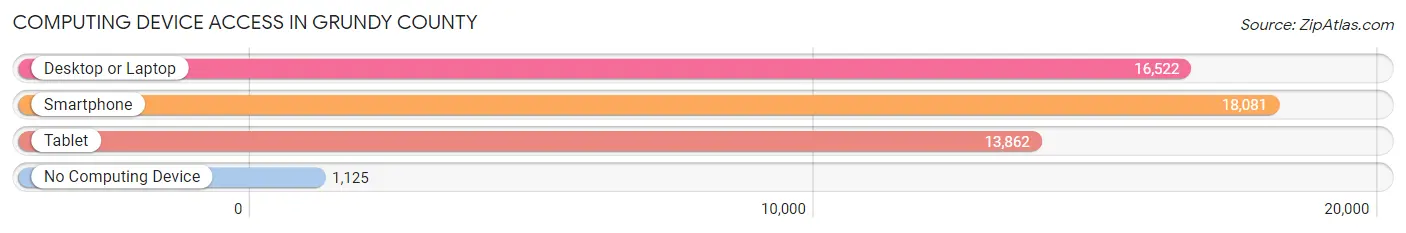
| Device Type | # Households | % Households |
| Desktop or Laptop | 16,522 | 81.1% |
| Smartphone | 18,081 | 88.7% |
| Tablet | 13,862 | 68.0% |
| No Computing Device | 1,125 | 5.5% |
| Total | 20,376 | 100.0% |
Internet Access in Grundy County
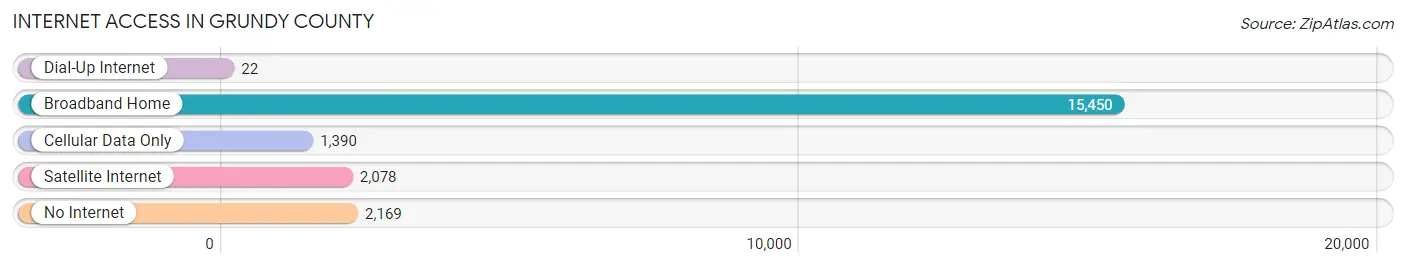
| Internet Type | # Households | % Households |
| Dial-Up Internet | 22 | 0.1% |
| Broadband Home | 15,450 | 75.8% |
| Cellular Data Only | 1,390 | 6.8% |
| Satellite Internet | 2,078 | 10.2% |
| No Internet | 2,169 | 10.6% |
| Total | 20,376 | 100.0% |
Grundy County Summary
Grundy County is located in the northeastern part of the state of Illinois, in the United States. It is part of the Chicago metropolitan area and is bordered by Will County to the north, LaSalle County to the east, Livingston County to the south, and Kendall County to the west. The county seat is Morris, and the largest city is Minooka. As of the 2010 census, the population was 50,063.
Geography
Grundy County is located in the northeastern part of Illinois, in the United States. It is part of the Chicago metropolitan area and is bordered by Will County to the north, LaSalle County to the east, Livingston County to the south, and Kendall County to the west. The county has a total area of 519 square miles, of which 517 square miles is land and 2.2 square miles is water.
The county is mostly flat, with some rolling hills in the western part of the county. The Kankakee River flows through the county, and there are several small lakes and ponds scattered throughout the county. The highest point in the county is located in the western part of the county, near the village of Mazon, and is 890 feet above sea level.
History
Grundy County was formed in 1841 from parts of LaSalle and Will Counties. It was named after Felix Grundy, a U.S. Senator from Tennessee. The county seat was originally located in the village of Morris, which was named after Morris Birkbeck, an early settler in the area.
The first settlers in the area were mostly of English and German descent, and they began arriving in the early 1830s. The first railroad line in the county was built in 1853, connecting Morris to Chicago. This line was later extended to Joliet and Ottawa.
The county experienced rapid growth in the late 19th and early 20th centuries, as the population increased from 8,000 in 1880 to over 50,000 by 1930. This growth was largely due to the influx of immigrants from Europe, as well as the development of the coal mining industry in the area.
Economy
Grundy County’s economy is largely based on agriculture and manufacturing. The county is home to several large farms, which produce corn, soybeans, wheat, and other crops. The county is also home to several manufacturing companies, including Caterpillar, Inc., which has a large plant in Morris.
The county also has a large tourism industry, as it is home to several state parks and recreational areas, including the Illinois and Michigan Canal State Trail, the I&M Canal National Heritage Corridor, and the Morris Canal and Rail Road State Historic Site.
Demographics
As of the 2010 census, the population of Grundy County was 50,063. The racial makeup of the county was 92.3% White, 2.7% Black or African American, 0.3% Native American, 1.2% Asian, 0.1% Pacific Islander, 2.2% from other races, and 1.4% from two or more races. Hispanic or Latino of any race were 6.7% of the population.
The median household income in the county was $63,945, and the median family income was $76,945. The per capita income was $27,945. About 6.3% of the population was below the poverty line.
Conclusion
Grundy County is located in the northeastern part of the state of Illinois, in the United States. It is part of the Chicago metropolitan area and is bordered by Will County to the north, LaSalle County to the east, Livingston County to the south, and Kendall County to the west. The county was formed in 1841 and was named after Felix Grundy, a U.S. Senator from Tennessee. The county’s economy is largely based on agriculture and manufacturing, and it also has a large tourism industry. As of the 2010 census, the population of Grundy County was 50,063. The racial makeup of the county was 92.3% White, 2.7% Black or African American, 0.3% Native American, 1.2% Asian, 0.1% Pacific Islander, 2.2% from other races, and 1.4% from two or more races. The median household income in the county was $63,945, and the median family income was $76,945.
Common Questions
What is the Total Population of Grundy County?
Total Population of Grundy County is 52,624.
What is the Total Male Population of Grundy County?
Total Male Population of Grundy County is 26,702.
What is the Total Female Population of Grundy County?
Total Female Population of Grundy County is 25,922.
What is the Ratio of Males per 100 Females in Grundy County?
There are 103.01 Males per 100 Females in Grundy County.
What is the Ratio of Females per 100 Males in Grundy County?
There are 97.08 Females per 100 Males in Grundy County.
What is the Median Population Age in Grundy County?
Median Population Age in Grundy County is 38.8 Years.
What is the Average Family Size in Grundy County
Average Family Size in Grundy County is 3.1 People.
What is the Average Household Size in Grundy County
Average Household Size in Grundy County is 2.6 People.
What is Per Capita Income in Grundy County?
Per Capita income in Grundy County is $42,192.
What is the Median Family Income in Grundy County?
Median Family Income in Grundy County is $107,740.
What is the Median Household income in Grundy County?
Median Household Income in Grundy County is $89,993.
What is Income or Wage Gap in Grundy County?
Income or Wage Gap in Grundy County is 45.0%.
Women in Grundy County earn 55.0 cents for every dollar earned by a man.
What is Family Income Deficit in Grundy County?
Family Income Deficit in Grundy County is $8,600.
Families that are below poverty line in Grundy County earn $8,600 less on average than the poverty threshold level.
What is Inequality or Gini Index in Grundy County?
Inequality or Gini Index in Grundy County is 0.40.
How Large is the Labor Force in Grundy County?
There are 28,014 People in the Labor Forcein in Grundy County.
What is the Percentage of People in the Labor Force in Grundy County?
68.1% of People are in the Labor Force in Grundy County.
What is the Unemployment Rate in Grundy County?
Unemployment Rate in Grundy County is 4.2%.