Edgar County, IL
Edgar County Map
Edgar County Overview
16,852
TOTAL POPULATION
8,364
MALE POPULATION
8,488
FEMALE POPULATION
98.54
MALES / 100 FEMALES
101.48
FEMALES / 100 MALES
46.0
MEDIAN AGE
2.6
AVG FAMILY SIZE
2.2
AVG HOUSEHOLD SIZE
$31,634
PER CAPITA INCOME
$70,765
AVG FAMILY INCOME
$56,687
AVG HOUSEHOLD INCOME
43.5%
WAGE / INCOME GAP [ % ]
56.5¢/ $1
WAGE / INCOME GAP [ $ ]
$9,841
FAMILY INCOME DEFICIT
0.41
INEQUALITY / GINI INDEX
7,886
LABOR FORCE [ PEOPLE ]
56.2%
PERCENT IN LABOR FORCE
4.6%
UNEMPLOYMENT RATE
Edgar County Area Codes
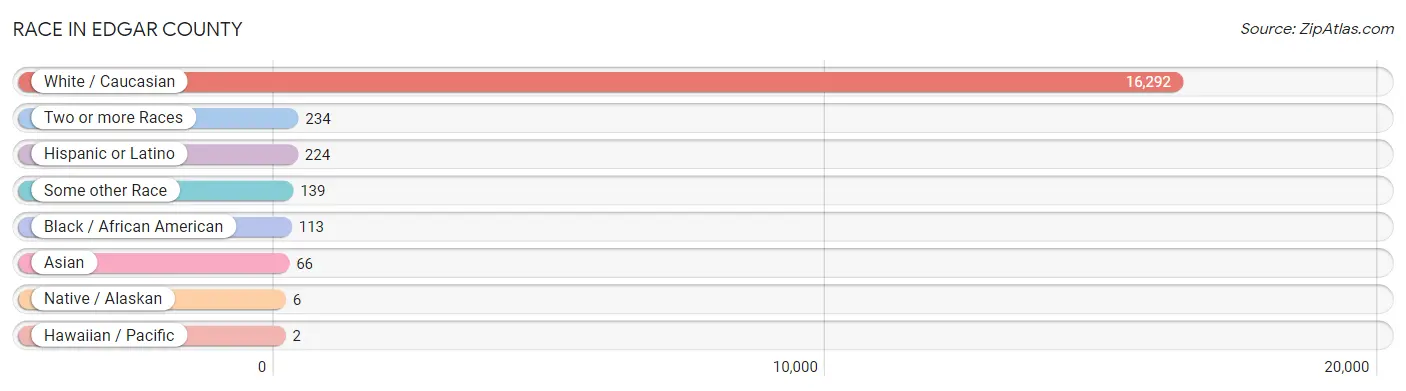
Race in Edgar County
The most populous races in Edgar County are White / Caucasian (16,292 | 96.7%), Two or more Races (234 | 1.4%), and Hispanic or Latino (224 | 1.3%).
| Race | # Population | % Population |
| Asian | 66 | 0.4% |
| Black / African American | 113 | 0.7% |
| Hawaiian / Pacific | 2 | 0.0% |
| Hispanic or Latino | 224 | 1.3% |
| Native / Alaskan | 6 | 0.0% |
| White / Caucasian | 16,292 | 96.7% |
| Two or more Races | 234 | 1.4% |
| Some other Race | 139 | 0.8% |
| Total | 16,852 | 100.0% |
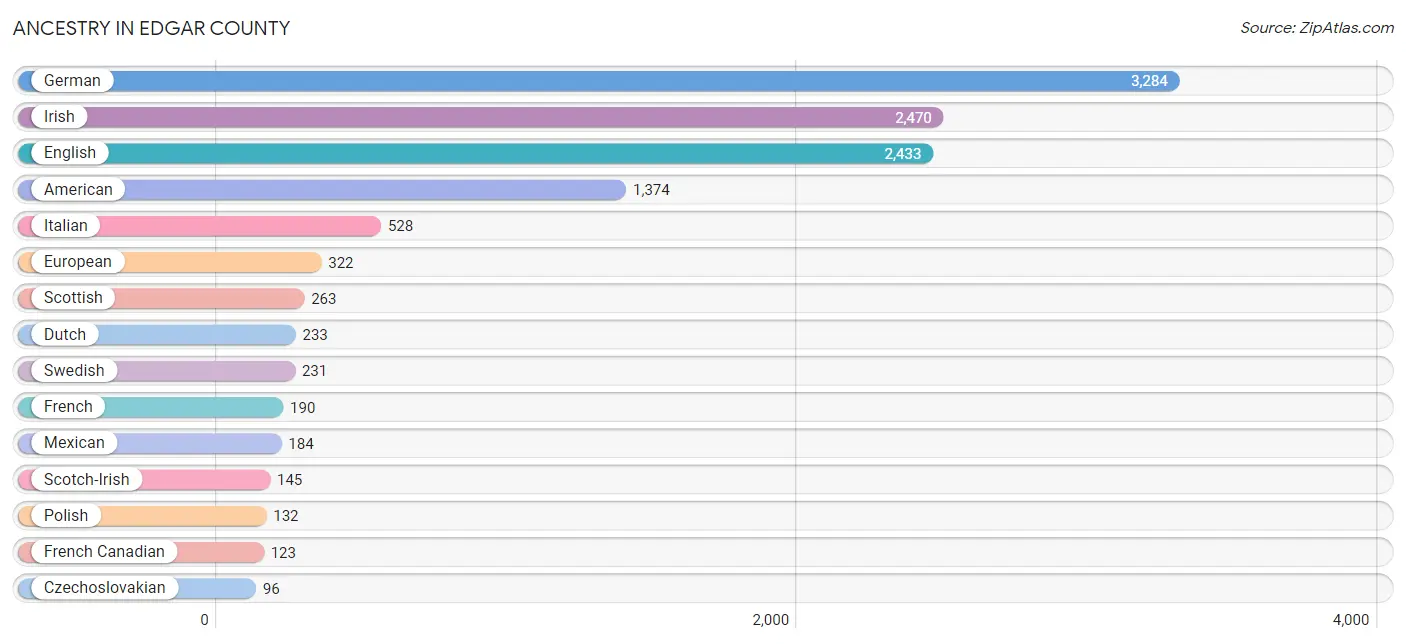
Ancestry in Edgar County
The most populous ancestries reported in Edgar County are German (3,284 | 19.5%), Irish (2,470 | 14.7%), English (2,433 | 14.4%), American (1,374 | 8.2%), and Italian (528 | 3.1%), together accounting for 59.9% of all Edgar County residents.
| Ancestry | # Population | % Population |
| African | 5 | 0.0% |
| American | 1,374 | 8.2% |
| Bahamian | 1 | 0.0% |
| Belgian | 4 | 0.0% |
| Bhutanese | 22 | 0.1% |
| Blackfeet | 3 | 0.0% |
| British | 38 | 0.2% |
| Bulgarian | 29 | 0.2% |
| Cherokee | 40 | 0.2% |
| Czechoslovakian | 96 | 0.6% |
| Danish | 2 | 0.0% |
| Dutch | 233 | 1.4% |
| Eastern European | 90 | 0.5% |
| English | 2,433 | 14.4% |
| European | 322 | 1.9% |
| Finnish | 3 | 0.0% |
| French | 190 | 1.1% |
| French Canadian | 123 | 0.7% |
| German | 3,284 | 19.5% |
| Greek | 30 | 0.2% |
| Hungarian | 24 | 0.1% |
| Indian (Asian) | 16 | 0.1% |
| Irish | 2,470 | 14.7% |
| Italian | 528 | 3.1% |
| Korean | 40 | 0.2% |
| Mexican | 184 | 1.1% |
| Native Hawaiian | 2 | 0.0% |
| Northern European | 9 | 0.1% |
| Norwegian | 39 | 0.2% |
| Pakistani | 1 | 0.0% |
| Pennsylvania German | 5 | 0.0% |
| Polish | 132 | 0.8% |
| Romanian | 8 | 0.1% |
| Russian | 14 | 0.1% |
| Scandinavian | 25 | 0.2% |
| Scotch-Irish | 145 | 0.9% |
| Scottish | 263 | 1.6% |
| Serbian | 1 | 0.0% |
| Sioux | 14 | 0.1% |
| Slavic | 16 | 0.1% |
| Spaniard | 6 | 0.0% |
| Subsaharan African | 5 | 0.0% |
| Swedish | 231 | 1.4% |
| Swiss | 10 | 0.1% |
| Welsh | 23 | 0.1% | View All 45 Rows |
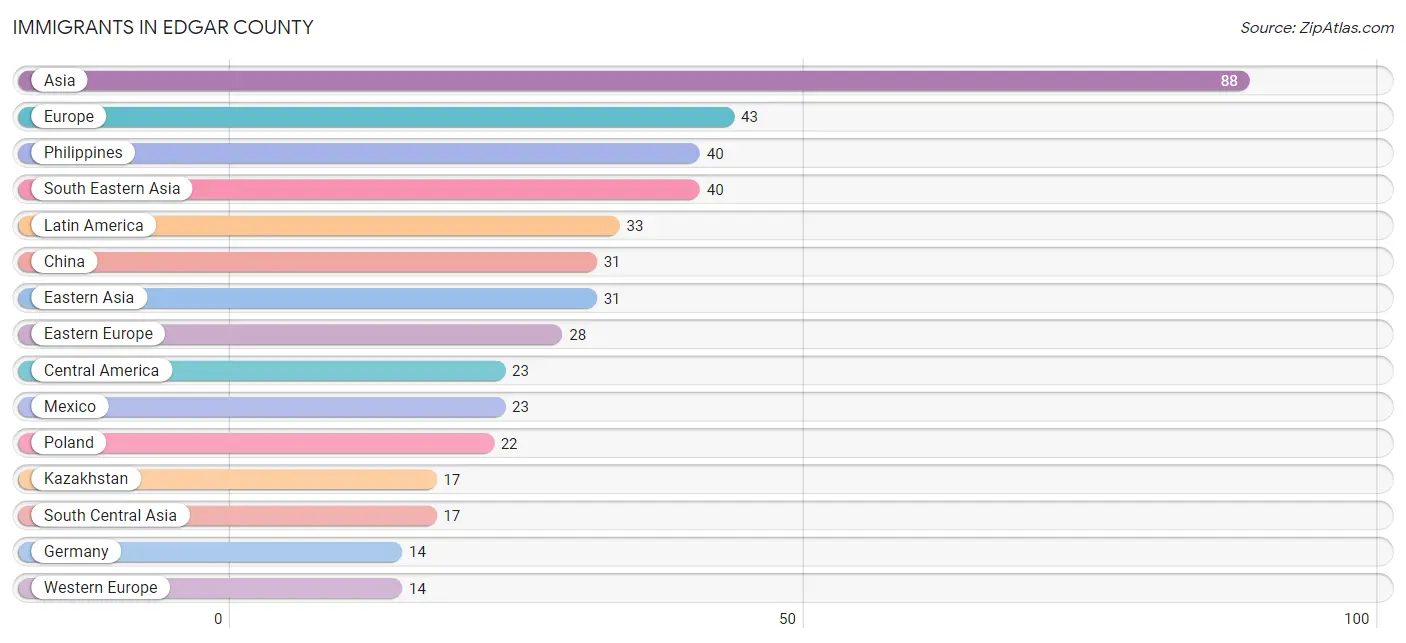
Immigrants in Edgar County
The most numerous immigrant groups reported in Edgar County came from Asia (88 | 0.5%), Europe (43 | 0.3%), Philippines (40 | 0.2%), South Eastern Asia (40 | 0.2%), and Latin America (33 | 0.2%), together accounting for 1.5% of all Edgar County residents.
| Immigration Origin | # Population | % Population |
| Asia | 88 | 0.5% |
| Bahamas | 1 | 0.0% |
| Brazil | 9 | 0.1% |
| Caribbean | 1 | 0.0% |
| Central America | 23 | 0.1% |
| China | 31 | 0.2% |
| Eastern Asia | 31 | 0.2% |
| Eastern Europe | 28 | 0.2% |
| England | 1 | 0.0% |
| Europe | 43 | 0.3% |
| Germany | 14 | 0.1% |
| Kazakhstan | 17 | 0.1% |
| Latin America | 33 | 0.2% |
| Mexico | 23 | 0.1% |
| Northern Europe | 1 | 0.0% |
| Philippines | 40 | 0.2% |
| Poland | 22 | 0.1% |
| Romania | 6 | 0.0% |
| South America | 9 | 0.1% |
| South Central Asia | 17 | 0.1% |
| South Eastern Asia | 40 | 0.2% |
| Western Europe | 14 | 0.1% | View All 22 Rows |
Sex and Age in Edgar County
Sex and Age in Edgar County
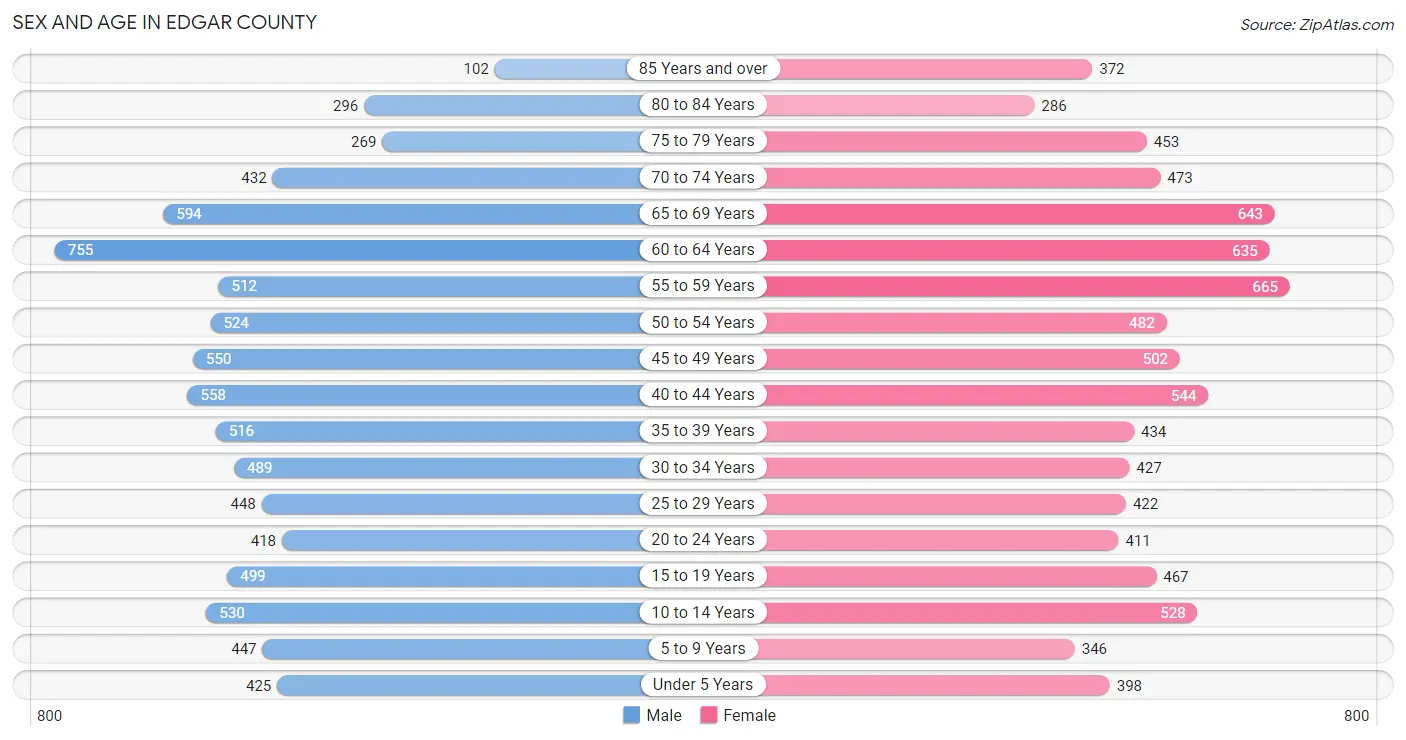
The most populous age groups in Edgar County are 60 to 64 Years (755 | 9.0%) for men and 55 to 59 Years (665 | 7.8%) for women.
| Age Bracket | Male | Female |
| Under 5 Years | 425 (5.1%) | 398 (4.7%) |
| 5 to 9 Years | 447 (5.3%) | 346 (4.1%) |
| 10 to 14 Years | 530 (6.3%) | 528 (6.2%) |
| 15 to 19 Years | 499 (6.0%) | 467 (5.5%) |
| 20 to 24 Years | 418 (5.0%) | 411 (4.8%) |
| 25 to 29 Years | 448 (5.4%) | 422 (5.0%) |
| 30 to 34 Years | 489 (5.9%) | 427 (5.0%) |
| 35 to 39 Years | 516 (6.2%) | 434 (5.1%) |
| 40 to 44 Years | 558 (6.7%) | 544 (6.4%) |
| 45 to 49 Years | 550 (6.6%) | 502 (5.9%) |
| 50 to 54 Years | 524 (6.3%) | 482 (5.7%) |
| 55 to 59 Years | 512 (6.1%) | 665 (7.8%) |
| 60 to 64 Years | 755 (9.0%) | 635 (7.5%) |
| 65 to 69 Years | 594 (7.1%) | 643 (7.6%) |
| 70 to 74 Years | 432 (5.2%) | 473 (5.6%) |
| 75 to 79 Years | 269 (3.2%) | 453 (5.3%) |
| 80 to 84 Years | 296 (3.5%) | 286 (3.4%) |
| 85 Years and over | 102 (1.2%) | 372 (4.4%) |
| Total | 8,364 (100.0%) | 8,488 (100.0%) |
Families and Households in Edgar County
Median Family Size in Edgar County
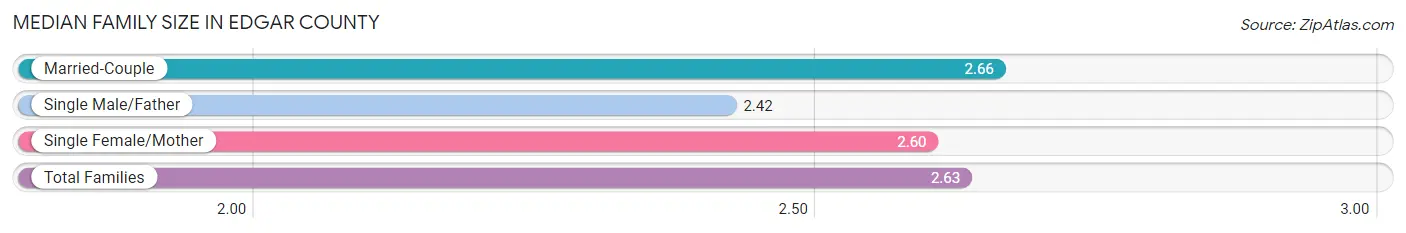
The median family size in Edgar County is 2.63 persons per family, with married-couple families (3,929 | 78.3%) accounting for the largest median family size of 2.66 persons per family. On the other hand, single male/father families (238 | 4.7%) represent the smallest median family size with 2.42 persons per family.
| Family Type | # Families | Family Size |
| Married-Couple | 3,929 (78.3%) | 2.66 |
| Single Male/Father | 238 (4.7%) | 2.42 |
| Single Female/Mother | 849 (16.9%) | 2.60 |
| Total Families | 5,016 (100.0%) | 2.63 |
Median Household Size in Edgar County
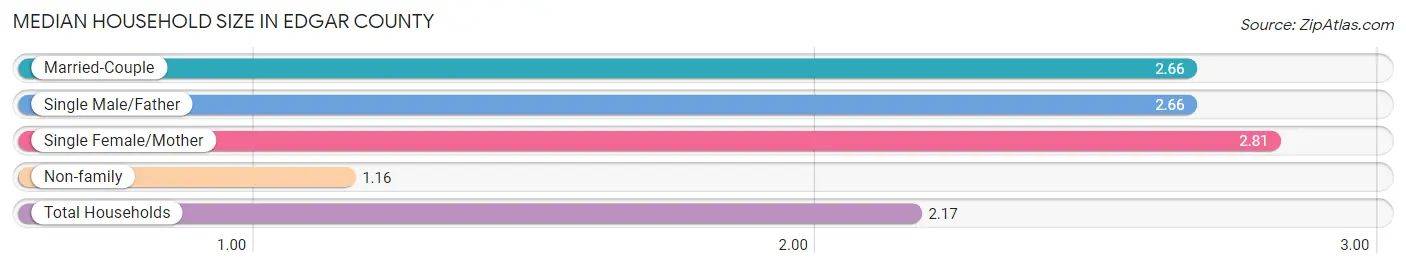
The median household size in Edgar County is 2.17 persons per household, with single female/mother households (849 | 11.2%) accounting for the largest median household size of 2.81 persons per household. non-family households (2,582 | 34.0%) represent the smallest median household size with 1.16 persons per household.
| Household Type | # Households | Household Size |
| Married-Couple | 3,929 (51.7%) | 2.66 |
| Single Male/Father | 238 (3.1%) | 2.66 |
| Single Female/Mother | 849 (11.2%) | 2.81 |
| Non-family | 2,582 (34.0%) | 1.16 |
| Total Households | 7,598 (100.0%) | 2.17 |
Household Size by Marriage Status in Edgar County
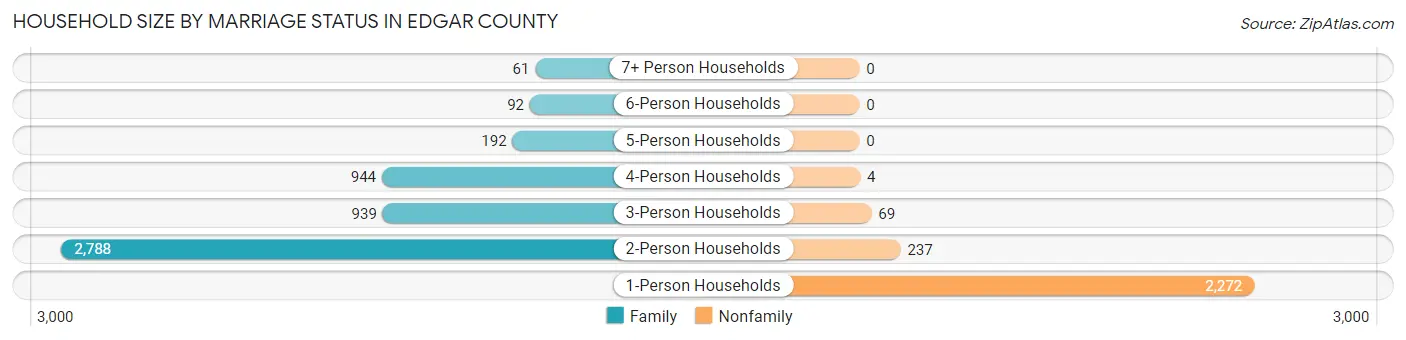
Out of a total of 7,598 households in Edgar County, 5,016 (66.0%) are family households, while 2,582 (34.0%) are nonfamily households. The most numerous type of family households are 2-person households, comprising 2,788, and the most common type of nonfamily households are 1-person households, comprising 2,272.
| Household Size | Family Households | Nonfamily Households |
| 1-Person Households | - | 2,272 (29.9%) |
| 2-Person Households | 2,788 (36.7%) | 237 (3.1%) |
| 3-Person Households | 939 (12.4%) | 69 (0.9%) |
| 4-Person Households | 944 (12.4%) | 4 (0.1%) |
| 5-Person Households | 192 (2.5%) | 0 (0.0%) |
| 6-Person Households | 92 (1.2%) | 0 (0.0%) |
| 7+ Person Households | 61 (0.8%) | 0 (0.0%) |
| Total | 5,016 (66.0%) | 2,582 (34.0%) |
Female Fertility in Edgar County
Fertility by Age in Edgar County
Average fertility rate in Edgar County is 40.0 births per 1,000 women. Women in the age bracket of 15 to 19 years have the highest fertility rate with 92.0 births per 1,000 women. Women in the age bracket of 20 to 34 years acount for 67.7% of all women with births.
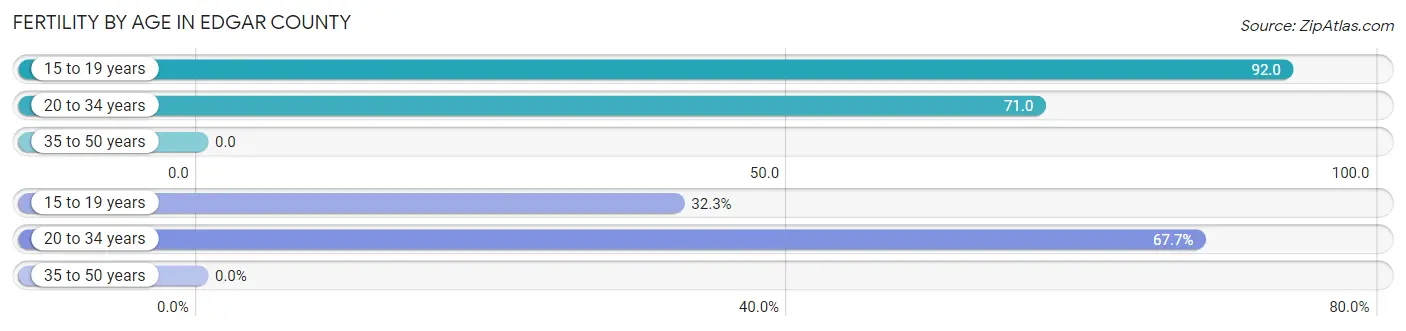
| Age Bracket | Women with Births | Births / 1,000 Women |
| 15 to 19 years | 43 (32.3%) | 92.0 |
| 20 to 34 years | 90 (67.7%) | 71.0 |
| 35 to 50 years | 0 (0.0%) | 0.0 |
| Total | 133 (100.0%) | 40.0 |
Fertility by Age by Marriage Status in Edgar County
54.1% of women with births (133) in Edgar County are married. The highest percentage of unmarried women with births falls into 20 to 34 years age bracket with 58.9% of them unmarried at the time of birth, while the lowest percentage of unmarried women with births belong to 15 to 19 years age bracket with 18.6% of them unmarried.
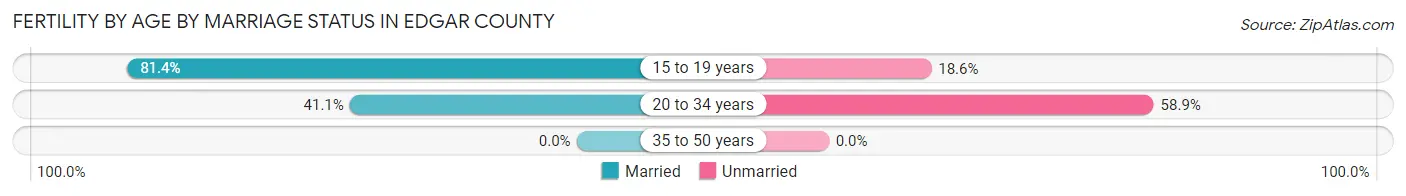
| Age Bracket | Married | Unmarried |
| 15 to 19 years | 35 (81.4%) | 8 (18.6%) |
| 20 to 34 years | 37 (41.1%) | 53 (58.9%) |
| 35 to 50 years | 0 (0.0%) | 0 (0.0%) |
| Total | 72 (54.1%) | 61 (45.9%) |
Fertility by Education in Edgar County
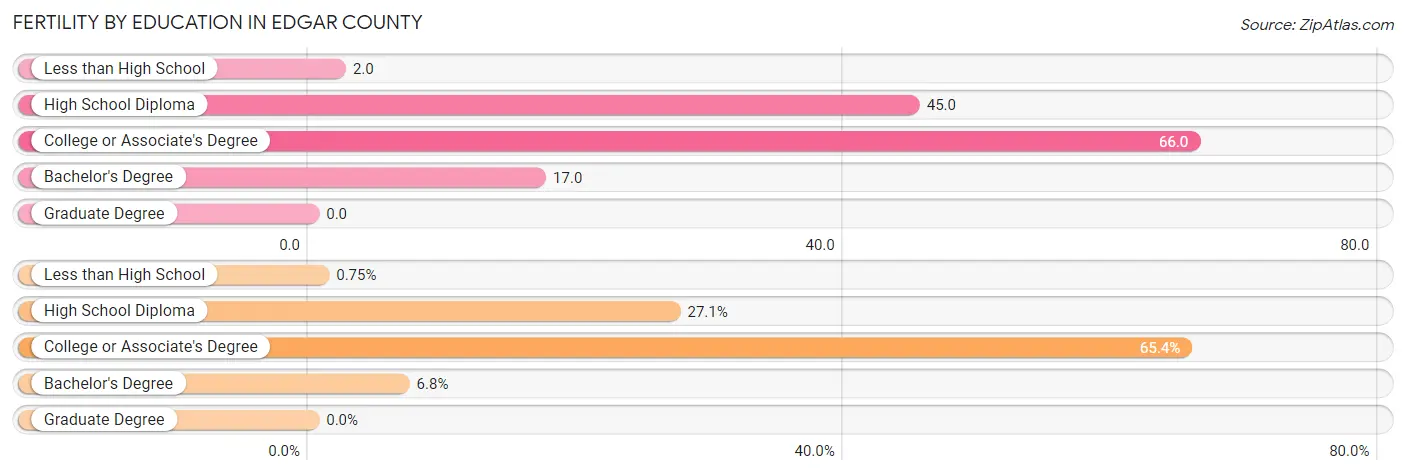
| Educational Attainment | Women with Births | Births / 1,000 Women |
| Less than High School | 1 (0.7%) | 2.0 |
| High School Diploma | 36 (27.1%) | 45.0 |
| College or Associate's Degree | 87 (65.4%) | 66.0 |
| Bachelor's Degree | 9 (6.8%) | 17.0 |
| Graduate Degree | 0 (0.0%) | 0.0 |
| Total | 133 (100.0%) | 40.0 |
Fertility by Education by Marriage Status in Edgar County
45.9% of women with births in Edgar County are unmarried. Women with the educational attainment of bachelor's degree are most likely to be married with 100.0% of them married at childbirth, while women with the educational attainment of less than high school are least likely to be married with 100.0% of them unmarried at childbirth.
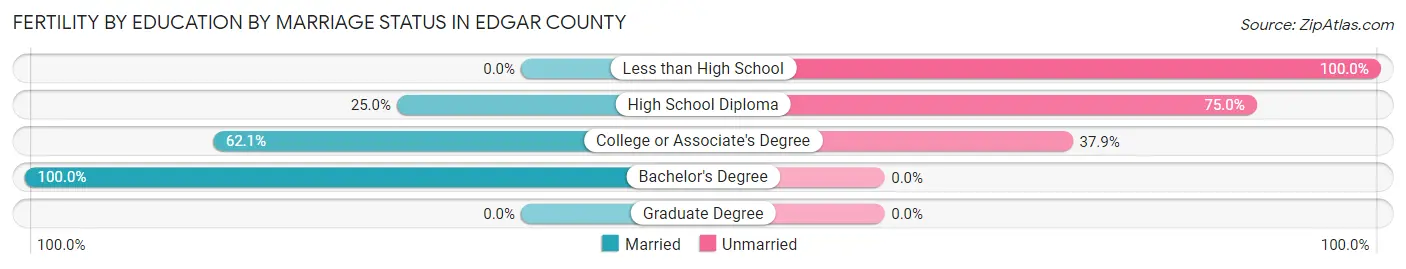
| Educational Attainment | Married | Unmarried |
| Less than High School | 0 (0.0%) | 1 (100.0%) |
| High School Diploma | 9 (25.0%) | 27 (75.0%) |
| College or Associate's Degree | 54 (62.1%) | 33 (37.9%) |
| Bachelor's Degree | 9 (100.0%) | 0 (0.0%) |
| Graduate Degree | 0 (0.0%) | 0 (0.0%) |
| Total | 72 (54.1%) | 61 (45.9%) |
Income in Edgar County
Income Overview in Edgar County
Per Capita Income in Edgar County is $31,634, while median incomes of families and households are $70,765 and $56,687 respectively.
| Characteristic | Number | Measure |
| Per Capita Income | 16,852 | $31,634 |
| Median Family Income | 5,016 | $70,765 |
| Mean Family Income | 5,016 | $82,847 |
| Median Household Income | 7,598 | $56,687 |
| Mean Household Income | 7,598 | $70,504 |
| Income Deficit | 5,016 | $9,841 |
| Wage / Income Gap (%) | 16,852 | 43.46% |
| Wage / Income Gap ($) | 16,852 | 56.54¢ per $1 |
| Gini / Inequality Index | 16,852 | 0.41 |
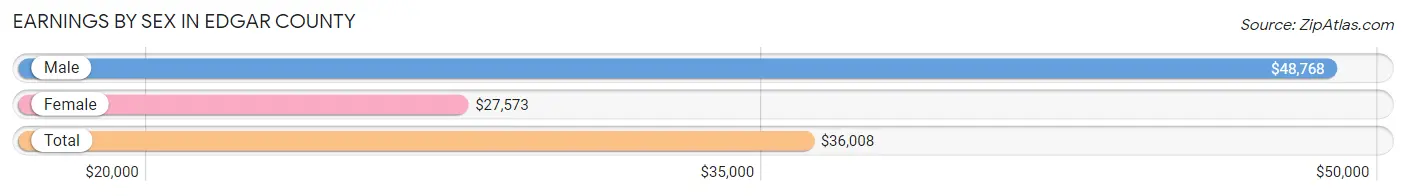
Earnings by Sex in Edgar County
Average Earnings in Edgar County are $36,008, $48,768 for men and $27,573 for women, a difference of 43.5%.
| Sex | Number | Average Earnings |
| Male | 4,312 (51.9%) | $48,768 |
| Female | 3,997 (48.1%) | $27,573 |
| Total | 8,309 (100.0%) | $36,008 |
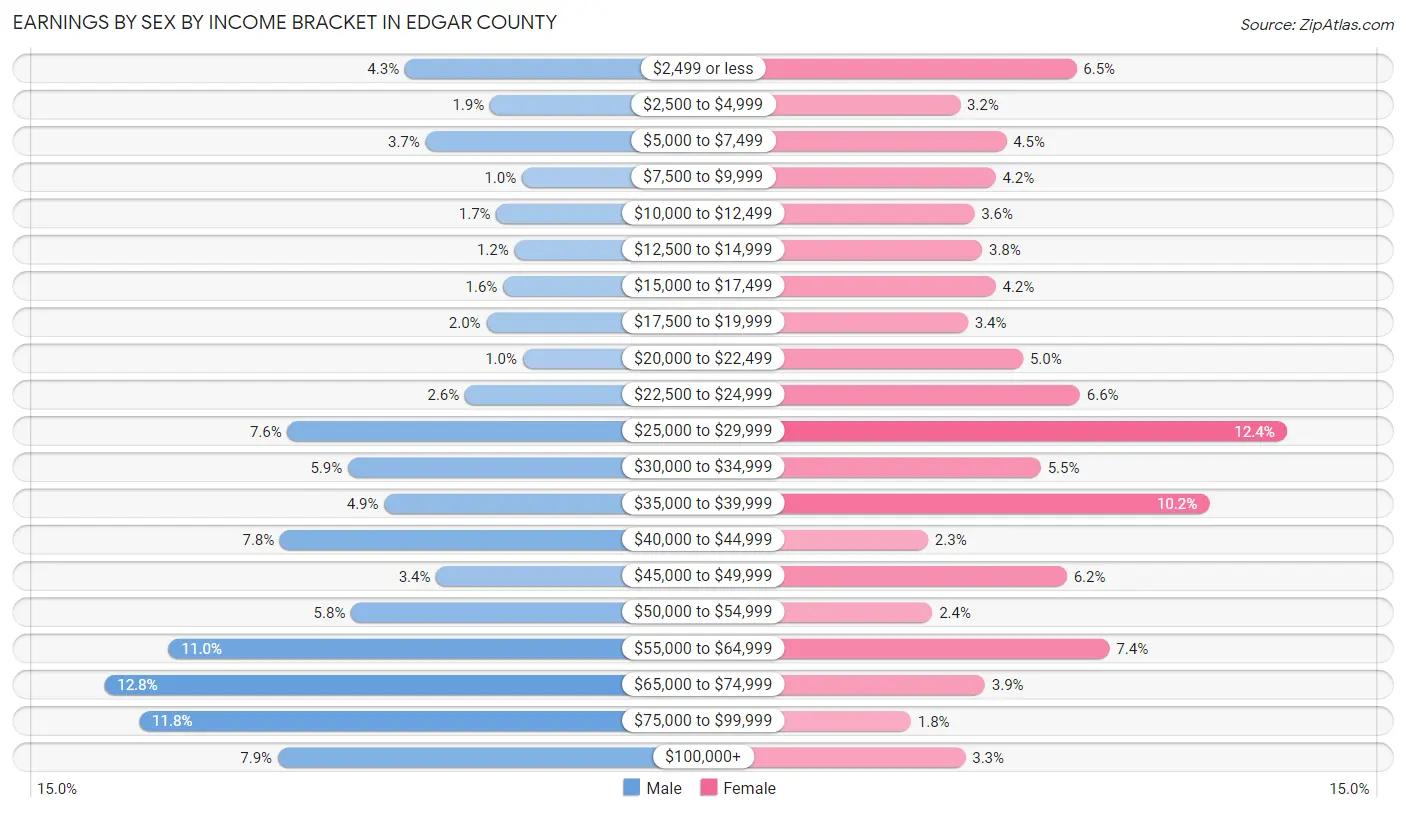
Earnings by Sex by Income Bracket in Edgar County
The most common earnings brackets in Edgar County are $65,000 to $74,999 for men (550 | 12.8%) and $25,000 to $29,999 for women (494 | 12.4%).
| Income | Male | Female |
| $2,499 or less | 186 (4.3%) | 258 (6.5%) |
| $2,500 to $4,999 | 83 (1.9%) | 127 (3.2%) |
| $5,000 to $7,499 | 161 (3.7%) | 179 (4.5%) |
| $7,500 to $9,999 | 44 (1.0%) | 167 (4.2%) |
| $10,000 to $12,499 | 75 (1.7%) | 143 (3.6%) |
| $12,500 to $14,999 | 53 (1.2%) | 152 (3.8%) |
| $15,000 to $17,499 | 67 (1.5%) | 167 (4.2%) |
| $17,500 to $19,999 | 87 (2.0%) | 136 (3.4%) |
| $20,000 to $22,499 | 43 (1.0%) | 198 (5.0%) |
| $22,500 to $24,999 | 113 (2.6%) | 262 (6.6%) |
| $25,000 to $29,999 | 328 (7.6%) | 494 (12.4%) |
| $30,000 to $34,999 | 255 (5.9%) | 218 (5.4%) |
| $35,000 to $39,999 | 211 (4.9%) | 407 (10.2%) |
| $40,000 to $44,999 | 337 (7.8%) | 91 (2.3%) |
| $45,000 to $49,999 | 148 (3.4%) | 247 (6.2%) |
| $50,000 to $54,999 | 251 (5.8%) | 96 (2.4%) |
| $55,000 to $64,999 | 472 (11.0%) | 295 (7.4%) |
| $65,000 to $74,999 | 550 (12.8%) | 155 (3.9%) |
| $75,000 to $99,999 | 508 (11.8%) | 72 (1.8%) |
| $100,000+ | 340 (7.9%) | 133 (3.3%) |
| Total | 4,312 (100.0%) | 3,997 (100.0%) |
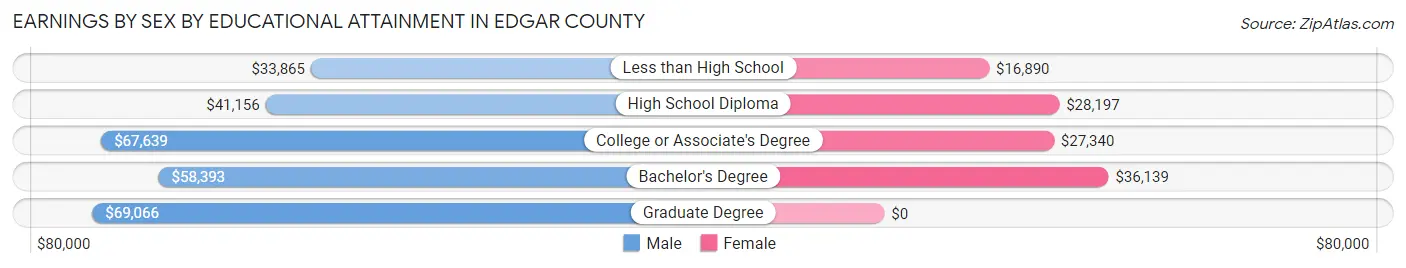
Earnings by Sex by Educational Attainment in Edgar County
Average earnings in Edgar County are $53,245 for men and $28,454 for women, a difference of 46.6%. Men with an educational attainment of graduate degree enjoy the highest average annual earnings of $69,066, while those with less than high school education earn the least with $33,865. Women with an educational attainment of bachelor's degree earn the most with the average annual earnings of $36,139, while those with less than high school education have the smallest earnings of $16,890.
| Educational Attainment | Male Income | Female Income |
| Less than High School | $33,865 | $16,890 |
| High School Diploma | $41,156 | $28,197 |
| College or Associate's Degree | $67,639 | $27,340 |
| Bachelor's Degree | $58,393 | $36,139 |
| Graduate Degree | $69,066 | $0 |
| Total | $53,245 | $28,454 |
Family Income in Edgar County
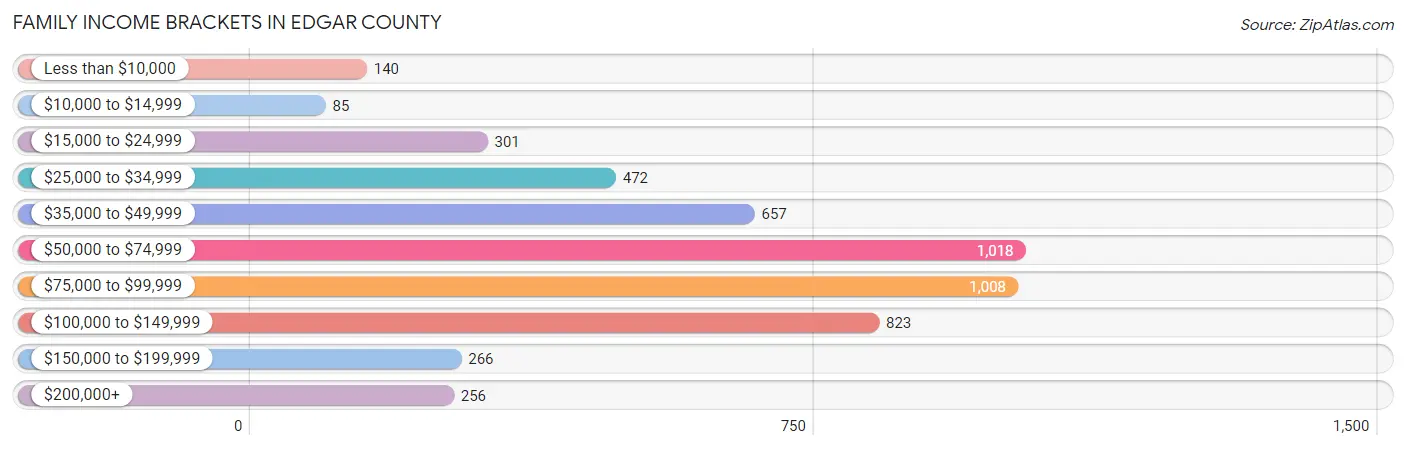
Family Income Brackets in Edgar County
According to the Edgar County family income data, there are 1,018 families falling into the $50,000 to $74,999 income range, which is the most common income bracket and makes up 20.3% of all families. Conversely, the $10,000 to $14,999 income bracket is the least frequent group with only 85 families (1.7%) belonging to this category.
| Income Bracket | # Families | % Families |
| Less than $10,000 | 140 | 2.8% |
| $10,000 to $14,999 | 85 | 1.7% |
| $15,000 to $24,999 | 301 | 6.0% |
| $25,000 to $34,999 | 472 | 9.4% |
| $35,000 to $49,999 | 657 | 13.1% |
| $50,000 to $74,999 | 1,018 | 20.3% |
| $75,000 to $99,999 | 1,008 | 20.1% |
| $100,000 to $149,999 | 823 | 16.4% |
| $150,000 to $199,999 | 266 | 5.3% |
| $200,000+ | 256 | 5.1% |
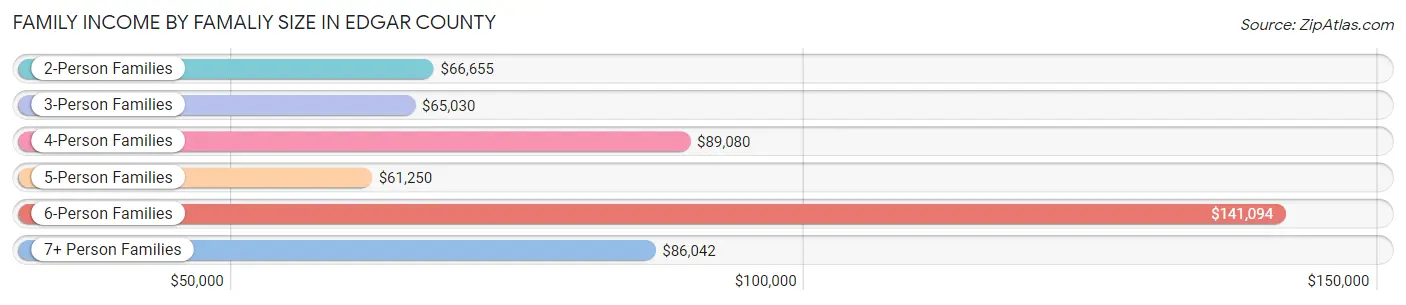
Family Income by Famaliy Size in Edgar County
6-person families (82 | 1.6%) account for the highest median family income in Edgar County with $141,094 per family, while 2-person families (2,867 | 57.2%) have the highest median income of $33,328 per family member.
| Income Bracket | # Families | Median Income |
| 2-Person Families | 2,867 (57.2%) | $66,655 |
| 3-Person Families | 995 (19.8%) | $65,030 |
| 4-Person Families | 843 (16.8%) | $89,080 |
| 5-Person Families | 170 (3.4%) | $61,250 |
| 6-Person Families | 82 (1.6%) | $141,094 |
| 7+ Person Families | 59 (1.2%) | $86,042 |
| Total | 5,016 (100.0%) | $70,765 |
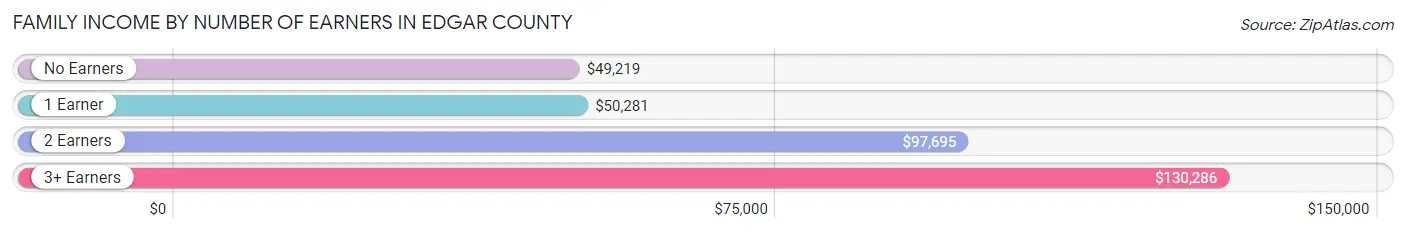
Family Income by Number of Earners in Edgar County
The median family income in Edgar County is $70,765, with families comprising 3+ earners (456) having the highest median family income of $130,286, while families with no earners (1,012) have the lowest median family income of $49,219, accounting for 9.1% and 20.2% of families, respectively.
| Number of Earners | # Families | Median Income |
| No Earners | 1,012 (20.2%) | $49,219 |
| 1 Earner | 1,728 (34.4%) | $50,281 |
| 2 Earners | 1,820 (36.3%) | $97,695 |
| 3+ Earners | 456 (9.1%) | $130,286 |
| Total | 5,016 (100.0%) | $70,765 |
Household Income in Edgar County
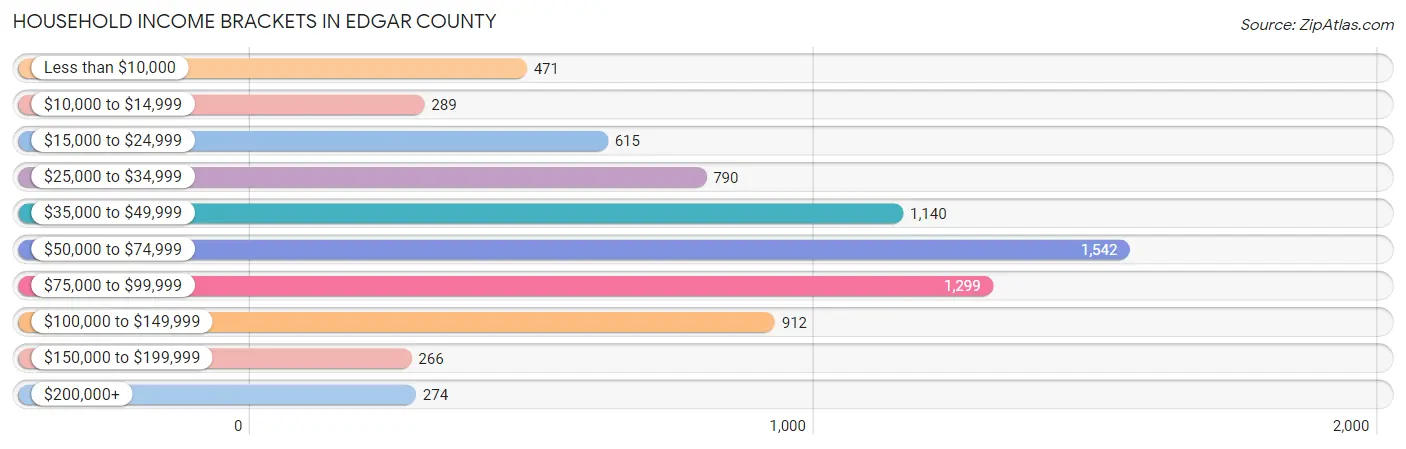
Household Income Brackets in Edgar County
With 1,542 households falling in the category, the $50,000 to $74,999 income range is the most frequent in Edgar County, accounting for 20.3% of all households. In contrast, only 266 households (3.5%) fall into the $150,000 to $199,999 income bracket, making it the least populous group.
| Income Bracket | # Households | % Households |
| Less than $10,000 | 471 | 6.2% |
| $10,000 to $14,999 | 289 | 3.8% |
| $15,000 to $24,999 | 615 | 8.1% |
| $25,000 to $34,999 | 790 | 10.4% |
| $35,000 to $49,999 | 1,140 | 15.0% |
| $50,000 to $74,999 | 1,542 | 20.3% |
| $75,000 to $99,999 | 1,299 | 17.1% |
| $100,000 to $149,999 | 912 | 12.0% |
| $150,000 to $199,999 | 266 | 3.5% |
| $200,000+ | 274 | 3.6% |
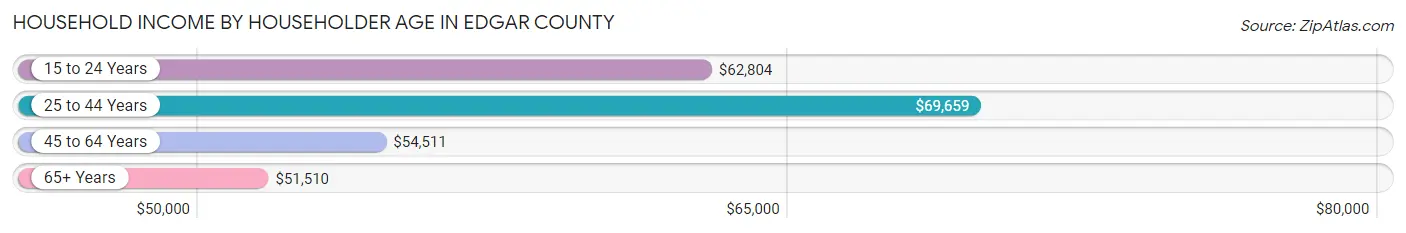
Household Income by Householder Age in Edgar County
The median household income in Edgar County is $56,687, with the highest median household income of $69,659 found in the 25 to 44 years age bracket for the primary householder. A total of 1,951 households (25.7%) fall into this category. Meanwhile, the 65+ years age bracket for the primary householder has the lowest median household income of $51,510, with 2,455 households (32.3%) in this group.
| Income Bracket | # Households | Median Income |
| 15 to 24 Years | 436 (5.7%) | $62,804 |
| 25 to 44 Years | 1,951 (25.7%) | $69,659 |
| 45 to 64 Years | 2,756 (36.3%) | $54,511 |
| 65+ Years | 2,455 (32.3%) | $51,510 |
| Total | 7,598 (100.0%) | $56,687 |
Poverty in Edgar County
Income Below Poverty by Sex and Age in Edgar County
With 9.9% poverty level for males and 13.7% for females among the residents of Edgar County, 6 to 11 year old males and 16 and 17 year old females are the most vulnerable to poverty, with 159 males (27.9%) and 97 females (42.5%) in their respective age groups living below the poverty level.
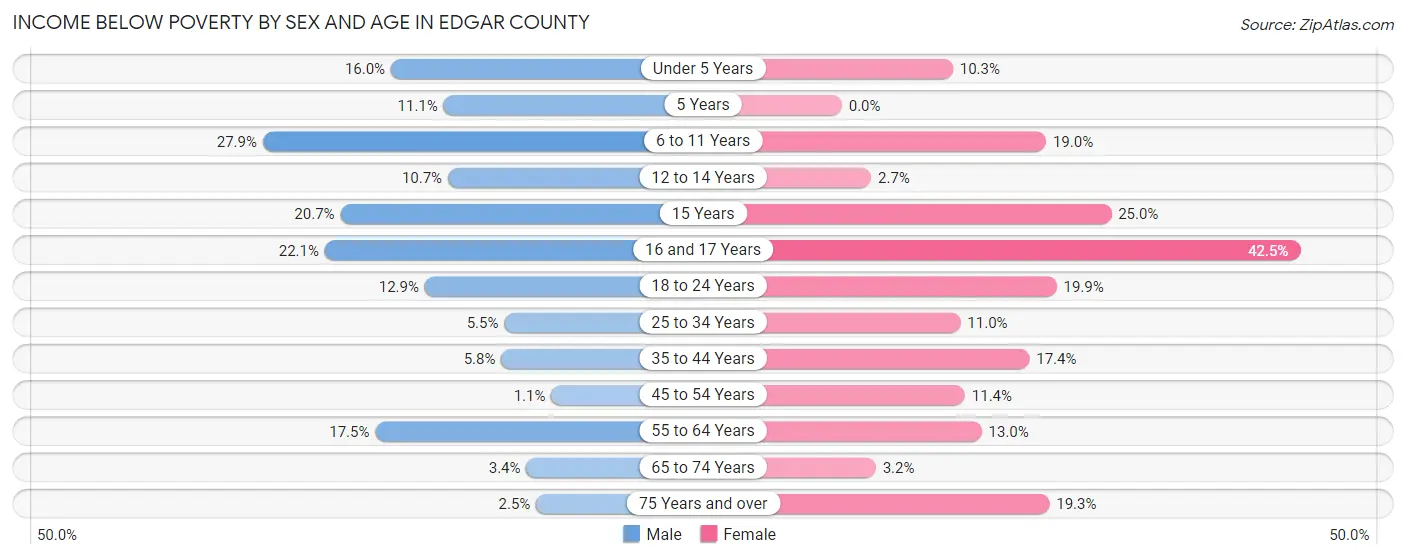
| Age Bracket | Male | Female |
| Under 5 Years | 68 (16.0%) | 41 (10.3%) |
| 5 Years | 10 (11.1%) | 0 (0.0%) |
| 6 to 11 Years | 159 (27.9%) | 97 (19.0%) |
| 12 to 14 Years | 33 (10.7%) | 8 (2.7%) |
| 15 Years | 12 (20.7%) | 22 (25.0%) |
| 16 and 17 Years | 58 (22.1%) | 97 (42.5%) |
| 18 to 24 Years | 76 (12.9%) | 112 (19.9%) |
| 25 to 34 Years | 50 (5.5%) | 93 (11.0%) |
| 35 to 44 Years | 61 (5.8%) | 170 (17.4%) |
| 45 to 54 Years | 12 (1.1%) | 111 (11.4%) |
| 55 to 64 Years | 219 (17.4%) | 166 (13.0%) |
| 65 to 74 Years | 34 (3.4%) | 35 (3.2%) |
| 75 Years and over | 15 (2.5%) | 187 (19.3%) |
| Total | 807 (9.9%) | 1,139 (13.7%) |
Income Above Poverty by Sex and Age in Edgar County
According to the poverty statistics in Edgar County, males aged 45 to 54 years and females aged 5 years are the age groups that are most secure financially, with 98.9% of males and 100.0% of females in these age groups living above the poverty line.
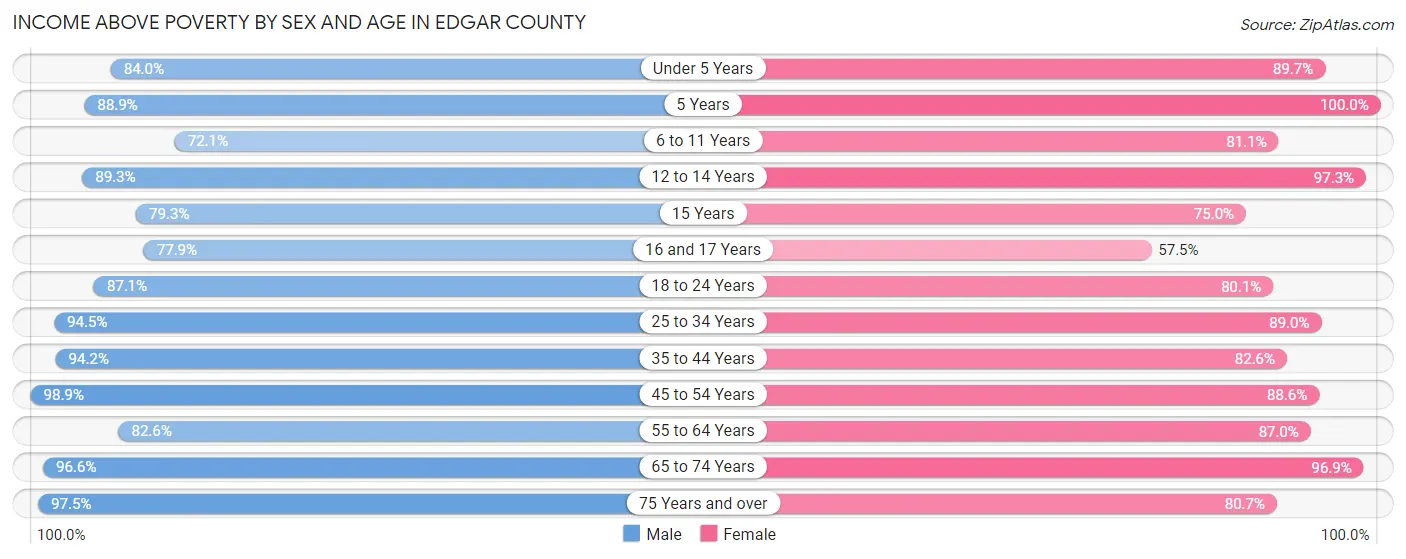
| Age Bracket | Male | Female |
| Under 5 Years | 357 (84.0%) | 357 (89.7%) |
| 5 Years | 80 (88.9%) | 63 (100.0%) |
| 6 to 11 Years | 411 (72.1%) | 415 (81.0%) |
| 12 to 14 Years | 275 (89.3%) | 286 (97.3%) |
| 15 Years | 46 (79.3%) | 66 (75.0%) |
| 16 and 17 Years | 204 (77.9%) | 131 (57.5%) |
| 18 to 24 Years | 515 (87.1%) | 450 (80.1%) |
| 25 to 34 Years | 863 (94.5%) | 752 (89.0%) |
| 35 to 44 Years | 998 (94.2%) | 807 (82.6%) |
| 45 to 54 Years | 1,062 (98.9%) | 861 (88.6%) |
| 55 to 64 Years | 1,036 (82.6%) | 1,114 (87.0%) |
| 65 to 74 Years | 957 (96.6%) | 1,077 (96.9%) |
| 75 Years and over | 581 (97.5%) | 784 (80.7%) |
| Total | 7,385 (90.1%) | 7,163 (86.3%) |
Income Below Poverty Among Married-Couple Families in Edgar County
The poverty statistics for married-couple families in Edgar County show that 2.9% or 113 of the total 3,929 families live below the poverty line. Families with 3 or 4 children have the highest poverty rate of 8.5%, comprising of 9 families. On the other hand, families with 5 or more children have the lowest poverty rate of 0.0%, which includes 0 families.

| Children | Above Poverty | Below Poverty |
| No Children | 2,620 (96.7%) | 89 (3.3%) |
| 1 or 2 Children | 1,060 (98.6%) | 15 (1.4%) |
| 3 or 4 Children | 97 (91.5%) | 9 (8.5%) |
| 5 or more Children | 39 (100.0%) | 0 (0.0%) |
| Total | 3,816 (97.1%) | 113 (2.9%) |
Income Below Poverty Among Single-Parent Households in Edgar County
According to the poverty data in Edgar County, 13.9% or 33 single-father households and 31.9% or 271 single-mother households are living below the poverty line. Among single-father households, those with 3 or 4 children have the highest poverty rate, with 9 households (24.3%) experiencing poverty. Likewise, among single-mother households, those with 1 or 2 children have the highest poverty rate, with 225 households (49.1%) falling below the poverty line.
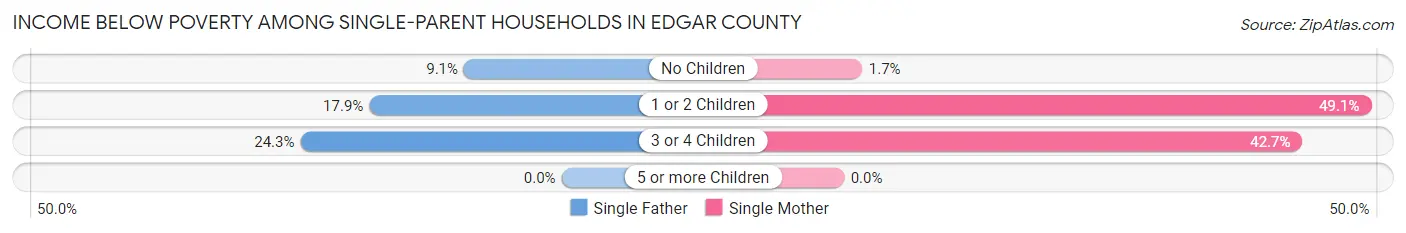
| Children | Single Father | Single Mother |
| No Children | 12 (9.1%) | 5 (1.7%) |
| 1 or 2 Children | 12 (17.9%) | 225 (49.1%) |
| 3 or 4 Children | 9 (24.3%) | 41 (42.7%) |
| 5 or more Children | 0 (0.0%) | 0 (0.0%) |
| Total | 33 (13.9%) | 271 (31.9%) |
Income Below Poverty Among Married-Couple vs Single-Parent Households in Edgar County
The poverty data for Edgar County shows that 113 of the married-couple family households (2.9%) and 304 of the single-parent households (28.0%) are living below the poverty level. Within the married-couple family households, those with 3 or 4 children have the highest poverty rate, with 9 households (8.5%) falling below the poverty line. Among the single-parent households, those with 1 or 2 children have the highest poverty rate, with 237 household (45.1%) living below poverty.
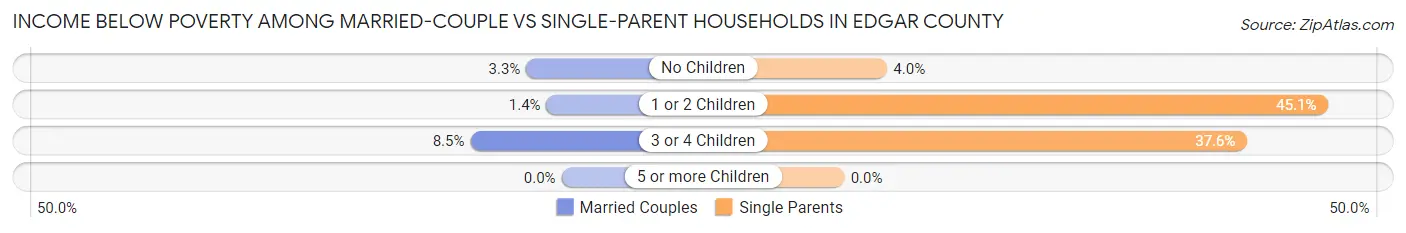
| Children | Married-Couple Families | Single-Parent Households |
| No Children | 89 (3.3%) | 17 (4.0%) |
| 1 or 2 Children | 15 (1.4%) | 237 (45.1%) |
| 3 or 4 Children | 9 (8.5%) | 50 (37.6%) |
| 5 or more Children | 0 (0.0%) | 0 (0.0%) |
| Total | 113 (2.9%) | 304 (28.0%) |
Employment Characteristics in Edgar County
Employment by Class of Employer in Edgar County
Among the 7,409 employed individuals in Edgar County, private company employees (4,927 | 66.5%), not-for-profit organizations (943 | 12.7%), and self-employed (not incorporated) (455 | 6.1%) make up the most common classes of employment.
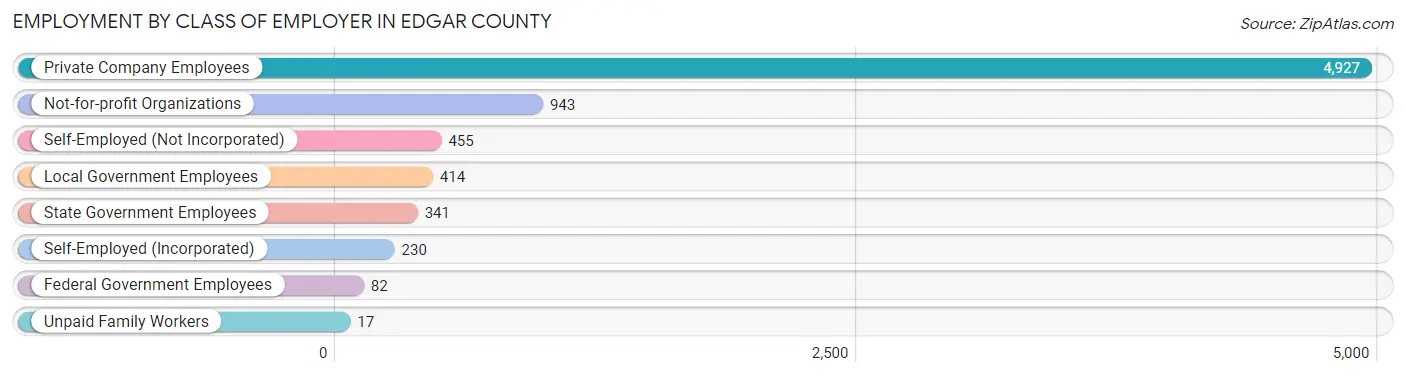
| Employer Class | # Employees | % Employees |
| Private Company Employees | 4,927 | 66.5% |
| Self-Employed (Incorporated) | 230 | 3.1% |
| Self-Employed (Not Incorporated) | 455 | 6.1% |
| Not-for-profit Organizations | 943 | 12.7% |
| Local Government Employees | 414 | 5.6% |
| State Government Employees | 341 | 4.6% |
| Federal Government Employees | 82 | 1.1% |
| Unpaid Family Workers | 17 | 0.2% |
| Total | 7,409 | 100.0% |
Employment Status by Age in Edgar County
According to the labor force statistics for Edgar County, out of the total population over 16 years of age (14,032), 56.2% or 7,886 individuals are in the labor force, with 4.6% or 363 of them unemployed. The age group with the highest labor force participation rate is 30 to 34 years, with 90.8% or 832 individuals in the labor force. Within the labor force, the 16 to 19 years age range has the highest percentage of unemployed individuals, with 12.8% or 54 of them being unemployed.
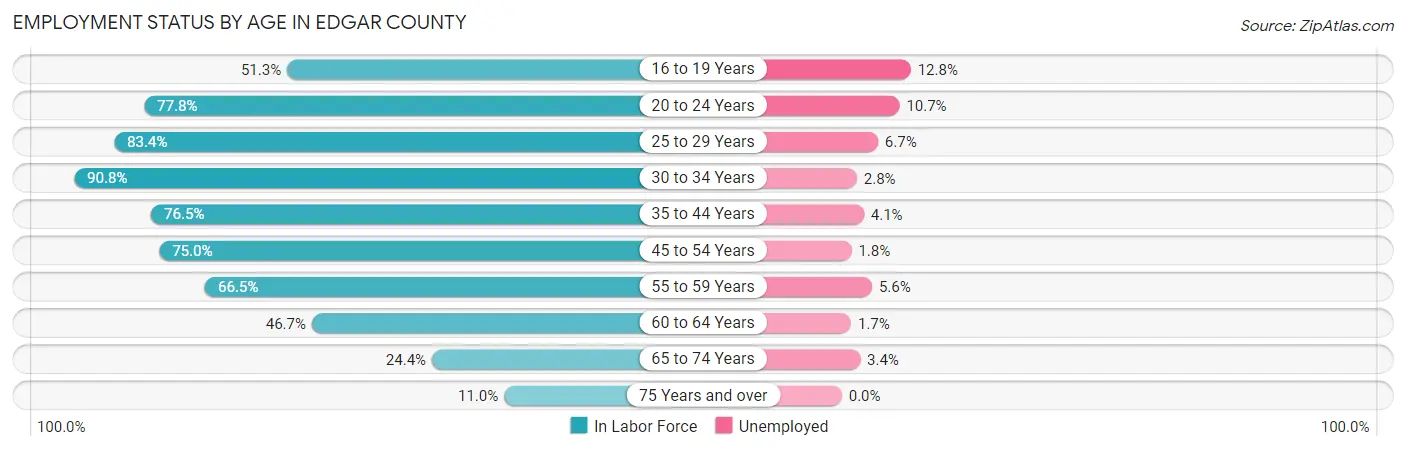
| Age Bracket | In Labor Force | Unemployed |
| 16 to 19 Years | 421 (51.3%) | 54 (12.8%) |
| 20 to 24 Years | 645 (77.8%) | 69 (10.7%) |
| 25 to 29 Years | 726 (83.4%) | 49 (6.7%) |
| 30 to 34 Years | 832 (90.8%) | 23 (2.8%) |
| 35 to 44 Years | 1,570 (76.5%) | 64 (4.1%) |
| 45 to 54 Years | 1,544 (75.0%) | 28 (1.8%) |
| 55 to 59 Years | 783 (66.5%) | 44 (5.6%) |
| 60 to 64 Years | 649 (46.7%) | 11 (1.7%) |
| 65 to 74 Years | 523 (24.4%) | 18 (3.4%) |
| 75 Years and over | 196 (11.0%) | 0 (0.0%) |
| Total | 7,886 (56.2%) | 363 (4.6%) |
Employment Status by Educational Attainment in Edgar County
According to labor force statistics for Edgar County, 72.1% of individuals (6,102) out of the total population between 25 and 64 years of age (8,463) are in the labor force, with 3.6% or 220 of them being unemployed. The group with the highest labor force participation rate are those with the educational attainment of college / associate degree, with 79.5% or 2,236 individuals in the labor force. Within the labor force, individuals with high school diploma education have the highest percentage of unemployment, with 6.4% or 139 of them being unemployed.

| Educational Attainment | In Labor Force | Unemployed |
| Less than High School | 426 (40.6%) | 37 (3.5%) |
| High School Diploma | 2,173 (72.4%) | 192 (6.4%) |
| College / Associate Degree | 2,236 (79.5%) | 62 (2.2%) |
| Bachelor's Degree or higher | 1,266 (79.1%) | 21 (1.3%) |
| Total | 6,102 (72.1%) | 305 (3.6%) |
Employment Occupations by Sex in Edgar County
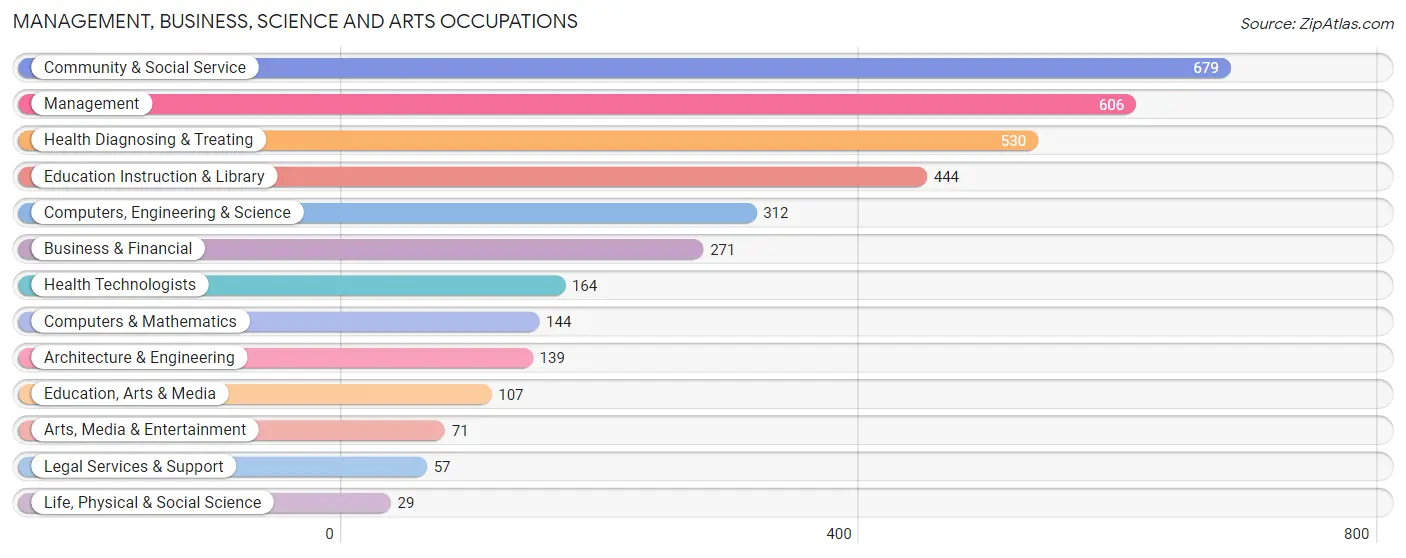
Management, Business, Science and Arts Occupations
The most common Management, Business, Science and Arts occupations in Edgar County are Community & Social Service (679 | 9.0%), Management (606 | 8.1%), Health Diagnosing & Treating (530 | 7.0%), Education Instruction & Library (444 | 5.9%), and Computers, Engineering & Science (312 | 4.2%).
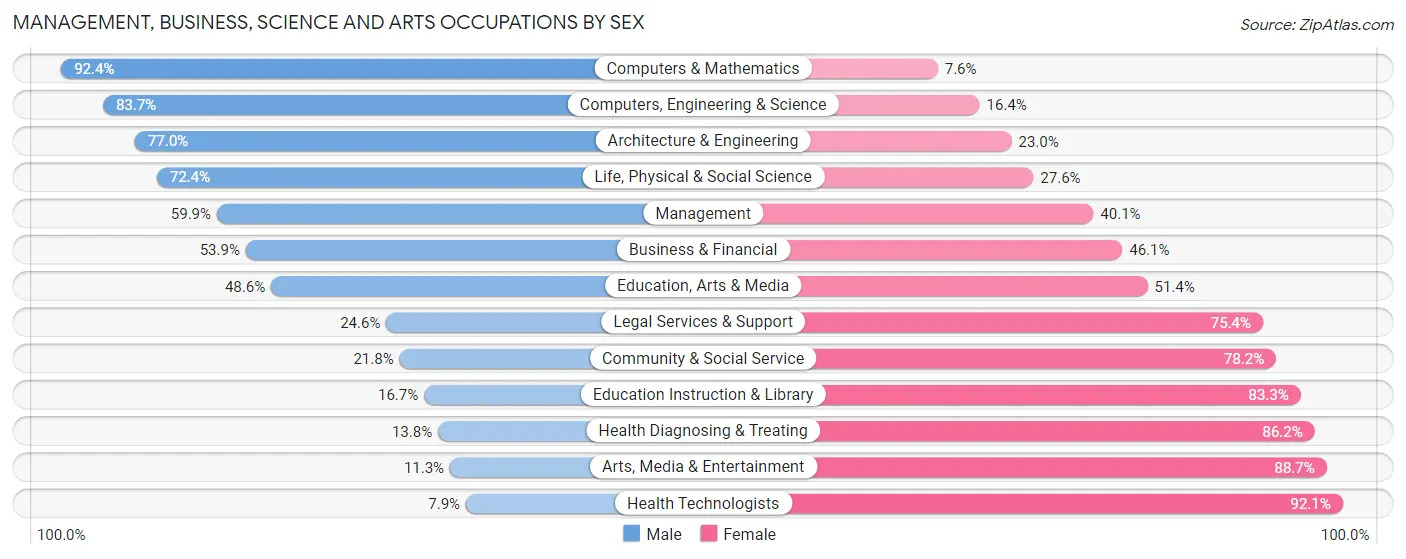
Management, Business, Science and Arts Occupations by Sex
Within the Management, Business, Science and Arts occupations in Edgar County, the most male-oriented occupations are Computers & Mathematics (92.4%), Computers, Engineering & Science (83.7%), and Architecture & Engineering (77.0%), while the most female-oriented occupations are Health Technologists (92.1%), Arts, Media & Entertainment (88.7%), and Health Diagnosing & Treating (86.2%).
| Occupation | Male | Female |
| Management | 363 (59.9%) | 243 (40.1%) |
| Business & Financial | 146 (53.9%) | 125 (46.1%) |
| Computers, Engineering & Science | 261 (83.7%) | 51 (16.4%) |
| Computers & Mathematics | 133 (92.4%) | 11 (7.6%) |
| Architecture & Engineering | 107 (77.0%) | 32 (23.0%) |
| Life, Physical & Social Science | 21 (72.4%) | 8 (27.6%) |
| Community & Social Service | 148 (21.8%) | 531 (78.2%) |
| Education, Arts & Media | 52 (48.6%) | 55 (51.4%) |
| Legal Services & Support | 14 (24.6%) | 43 (75.4%) |
| Education Instruction & Library | 74 (16.7%) | 370 (83.3%) |
| Arts, Media & Entertainment | 8 (11.3%) | 63 (88.7%) |
| Health Diagnosing & Treating | 73 (13.8%) | 457 (86.2%) |
| Health Technologists | 13 (7.9%) | 151 (92.1%) |
| Total (Category) | 991 (41.3%) | 1,407 (58.7%) |
| Total (Overall) | 3,850 (51.2%) | 3,676 (48.8%) |
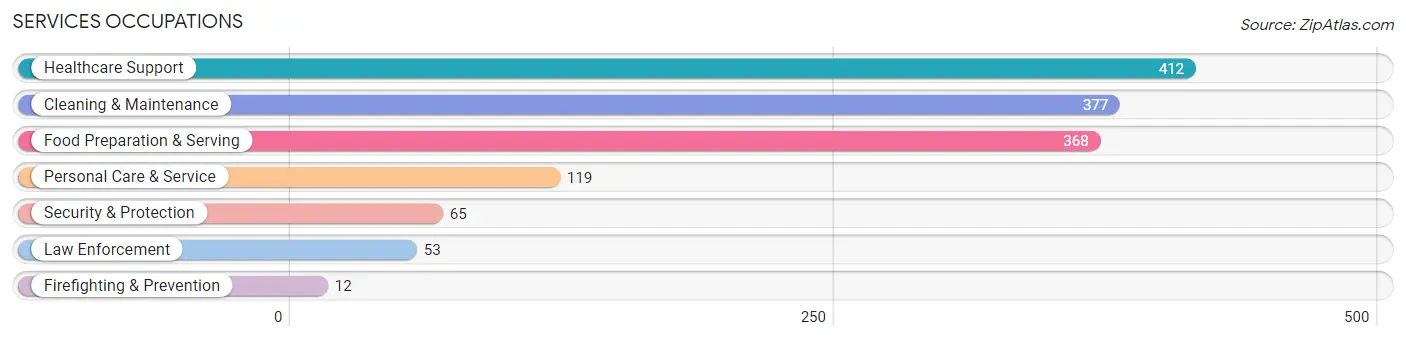
Services Occupations
The most common Services occupations in Edgar County are Healthcare Support (412 | 5.5%), Cleaning & Maintenance (377 | 5.0%), Food Preparation & Serving (368 | 4.9%), Personal Care & Service (119 | 1.6%), and Security & Protection (65 | 0.9%).
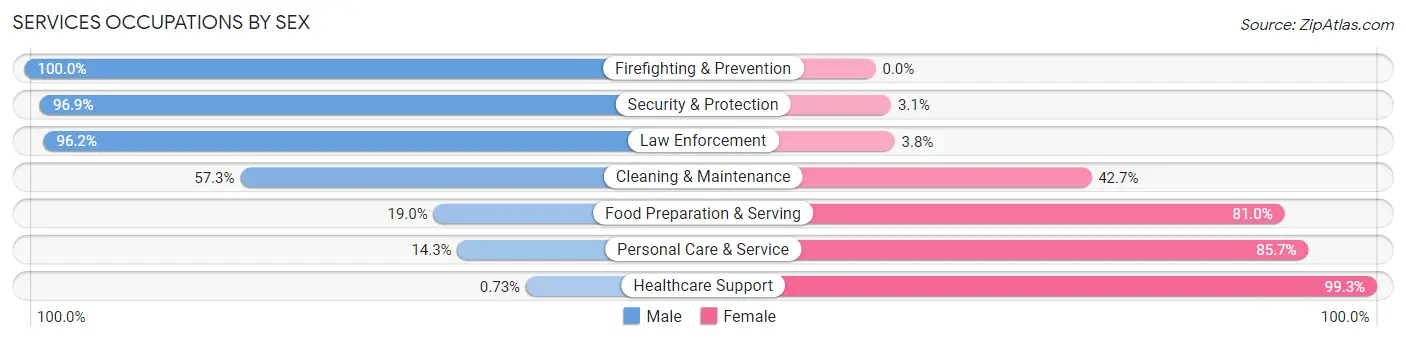
Services Occupations by Sex
Within the Services occupations in Edgar County, the most male-oriented occupations are Firefighting & Prevention (100.0%), Security & Protection (96.9%), and Law Enforcement (96.2%), while the most female-oriented occupations are Healthcare Support (99.3%), Personal Care & Service (85.7%), and Food Preparation & Serving (81.0%).
| Occupation | Male | Female |
| Healthcare Support | 3 (0.7%) | 409 (99.3%) |
| Security & Protection | 63 (96.9%) | 2 (3.1%) |
| Firefighting & Prevention | 12 (100.0%) | 0 (0.0%) |
| Law Enforcement | 51 (96.2%) | 2 (3.8%) |
| Food Preparation & Serving | 70 (19.0%) | 298 (81.0%) |
| Cleaning & Maintenance | 216 (57.3%) | 161 (42.7%) |
| Personal Care & Service | 17 (14.3%) | 102 (85.7%) |
| Total (Category) | 369 (27.5%) | 972 (72.5%) |
| Total (Overall) | 3,850 (51.2%) | 3,676 (48.8%) |
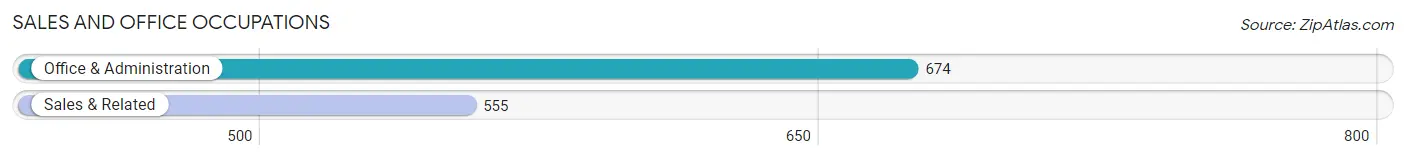
Sales and Office Occupations
The most common Sales and Office occupations in Edgar County are Office & Administration (674 | 9.0%), and Sales & Related (555 | 7.4%).
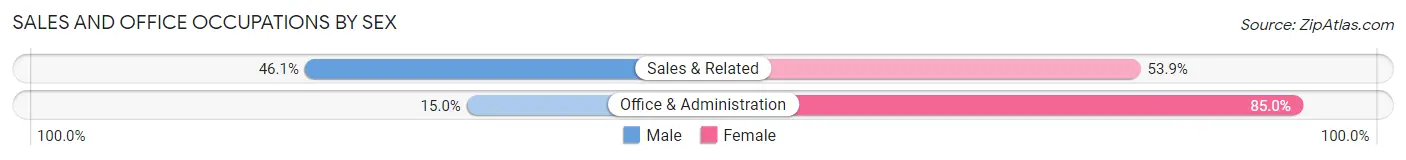
Sales and Office Occupations by Sex
| Occupation | Male | Female |
| Sales & Related | 256 (46.1%) | 299 (53.9%) |
| Office & Administration | 101 (15.0%) | 573 (85.0%) |
| Total (Category) | 357 (29.0%) | 872 (71.0%) |
| Total (Overall) | 3,850 (51.2%) | 3,676 (48.8%) |
Natural Resources, Construction and Maintenance Occupations
The most common Natural Resources, Construction and Maintenance occupations in Edgar County are Installation, Maintenance & Repair (507 | 6.7%), Construction & Extraction (335 | 4.4%), and Farming, Fishing & Forestry (80 | 1.1%).
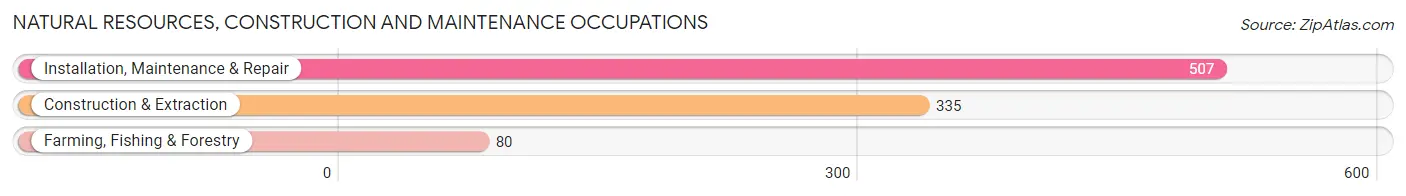
Natural Resources, Construction and Maintenance Occupations by Sex

| Occupation | Male | Female |
| Farming, Fishing & Forestry | 79 (98.8%) | 1 (1.3%) |
| Construction & Extraction | 335 (100.0%) | 0 (0.0%) |
| Installation, Maintenance & Repair | 506 (99.8%) | 1 (0.2%) |
| Total (Category) | 920 (99.8%) | 2 (0.2%) |
| Total (Overall) | 3,850 (51.2%) | 3,676 (48.8%) |
Production, Transportation and Moving Occupations
The most common Production, Transportation and Moving occupations in Edgar County are Production (814 | 10.8%), Material Moving (589 | 7.8%), and Transportation (233 | 3.1%).
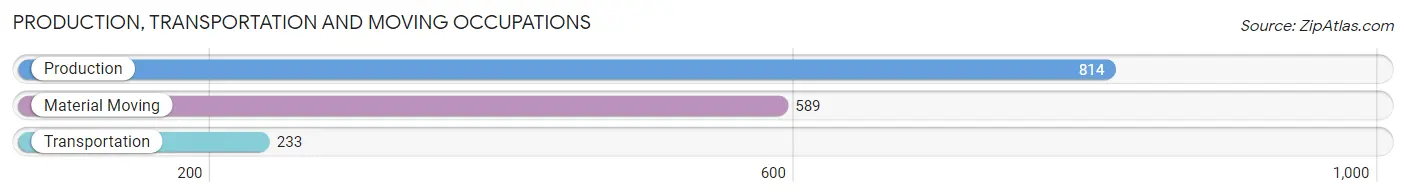
Production, Transportation and Moving Occupations by Sex
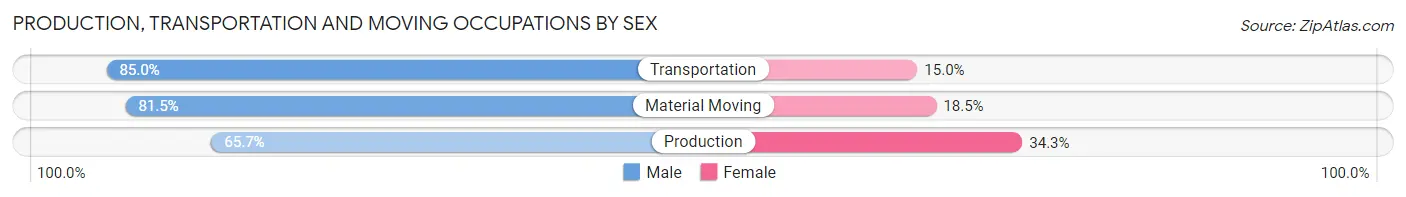
| Occupation | Male | Female |
| Production | 535 (65.7%) | 279 (34.3%) |
| Transportation | 198 (85.0%) | 35 (15.0%) |
| Material Moving | 480 (81.5%) | 109 (18.5%) |
| Total (Category) | 1,213 (74.1%) | 423 (25.9%) |
| Total (Overall) | 3,850 (51.2%) | 3,676 (48.8%) |
Employment Industries by Sex in Edgar County
Employment Industries in Edgar County
The major employment industries in Edgar County include Manufacturing (1,506 | 20.0%), Health Care & Social Assistance (1,386 | 18.4%), Retail Trade (770 | 10.2%), Educational Services (642 | 8.5%), and Construction (452 | 6.0%).
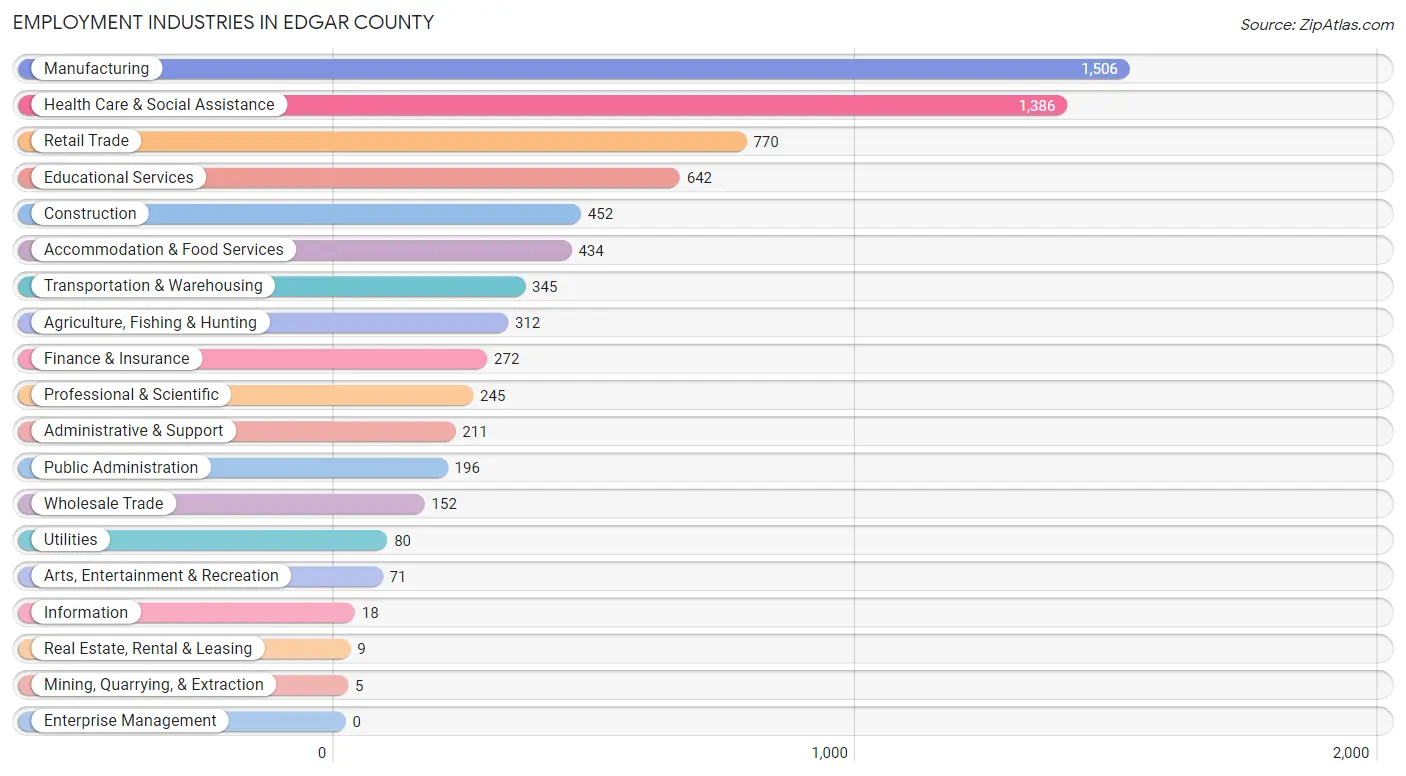
Employment Industries by Sex in Edgar County
The Edgar County industries that see more men than women are Mining, Quarrying, & Extraction (100.0%), Construction (93.4%), and Agriculture, Fishing & Hunting (93.3%), whereas the industries that tend to have a higher number of women are Real Estate, Rental & Leasing (100.0%), Information (88.9%), and Finance & Insurance (88.2%).
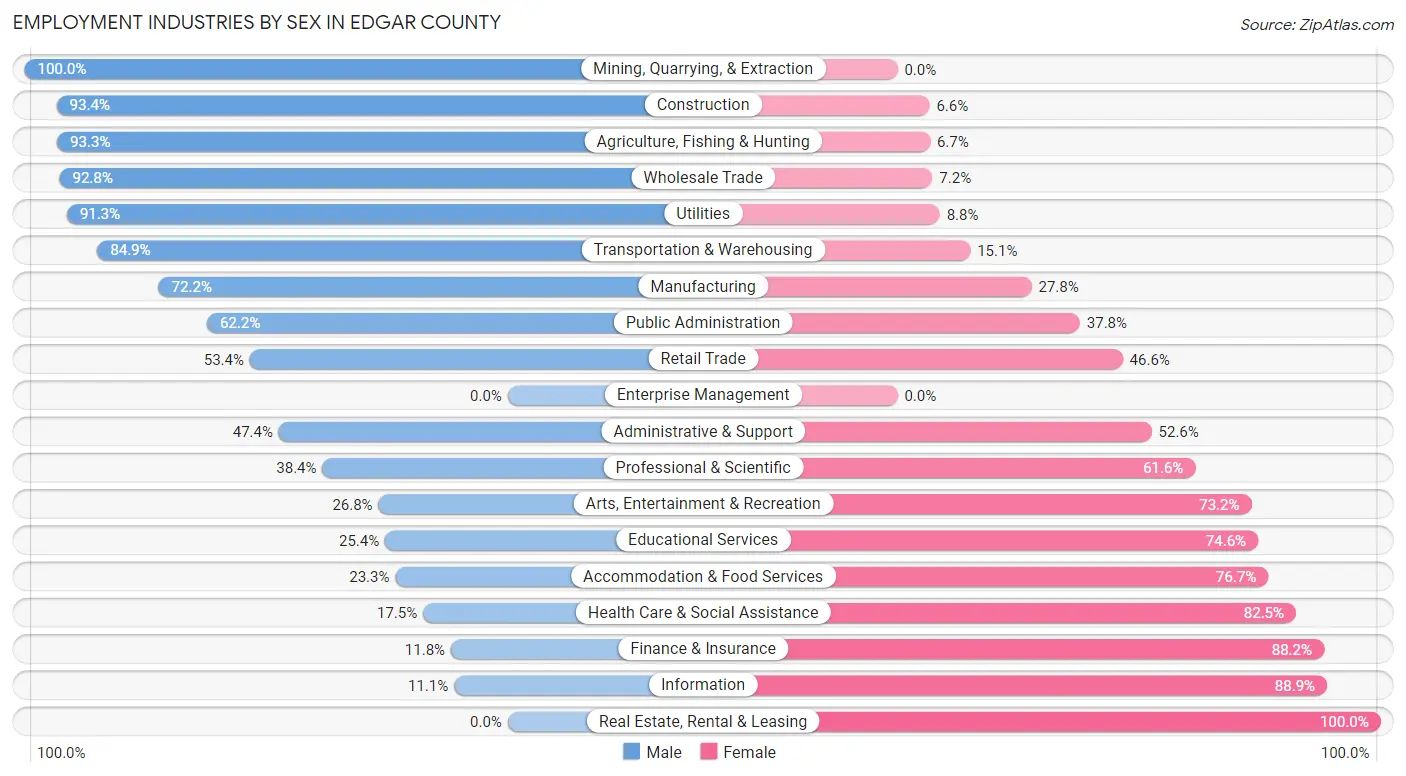
| Industry | Male | Female |
| Agriculture, Fishing & Hunting | 291 (93.3%) | 21 (6.7%) |
| Mining, Quarrying, & Extraction | 5 (100.0%) | 0 (0.0%) |
| Construction | 422 (93.4%) | 30 (6.6%) |
| Manufacturing | 1,088 (72.2%) | 418 (27.8%) |
| Wholesale Trade | 141 (92.8%) | 11 (7.2%) |
| Retail Trade | 411 (53.4%) | 359 (46.6%) |
| Transportation & Warehousing | 293 (84.9%) | 52 (15.1%) |
| Utilities | 73 (91.2%) | 7 (8.7%) |
| Information | 2 (11.1%) | 16 (88.9%) |
| Finance & Insurance | 32 (11.8%) | 240 (88.2%) |
| Real Estate, Rental & Leasing | 0 (0.0%) | 9 (100.0%) |
| Professional & Scientific | 94 (38.4%) | 151 (61.6%) |
| Enterprise Management | 0 (0.0%) | 0 (0.0%) |
| Administrative & Support | 100 (47.4%) | 111 (52.6%) |
| Educational Services | 163 (25.4%) | 479 (74.6%) |
| Health Care & Social Assistance | 243 (17.5%) | 1,143 (82.5%) |
| Arts, Entertainment & Recreation | 19 (26.8%) | 52 (73.2%) |
| Accommodation & Food Services | 101 (23.3%) | 333 (76.7%) |
| Public Administration | 122 (62.2%) | 74 (37.8%) |
| Total | 3,850 (51.2%) | 3,676 (48.8%) |
Education in Edgar County
School Enrollment in Edgar County
The most common levels of schooling among the 3,140 students in Edgar County are middle school (769 | 24.5%), high school (743 | 23.7%), and elementary school (656 | 20.9%).
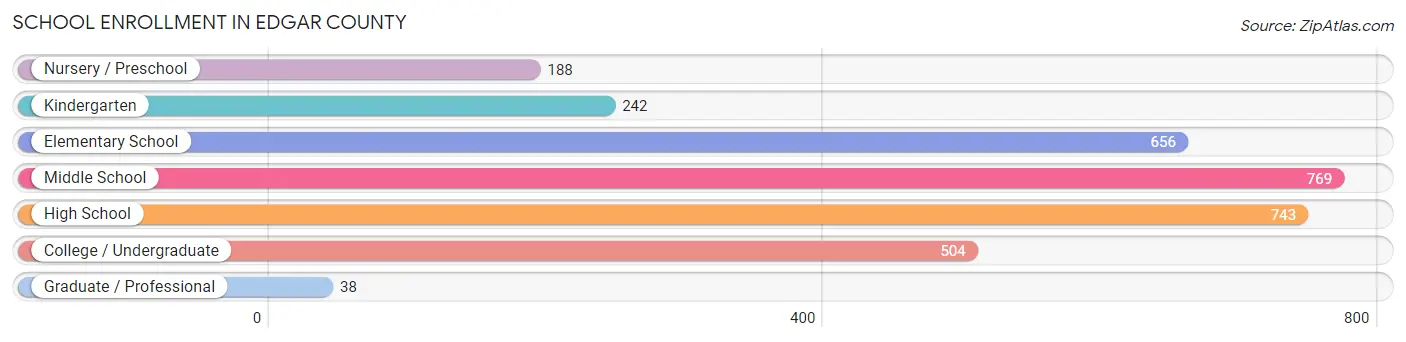
| School Level | # Students | % Students |
| Nursery / Preschool | 188 | 6.0% |
| Kindergarten | 242 | 7.7% |
| Elementary School | 656 | 20.9% |
| Middle School | 769 | 24.5% |
| High School | 743 | 23.7% |
| College / Undergraduate | 504 | 16.1% |
| Graduate / Professional | 38 | 1.2% |
| Total | 3,140 | 100.0% |
School Enrollment by Age by Funding Source in Edgar County
Out of a total of 3,140 students who are enrolled in schools in Edgar County, 154 (4.9%) attend a private institution, while the remaining 2,986 (95.1%) are enrolled in public schools. The age group of 25 to 34 year olds has the highest likelihood of being enrolled in private schools, with 9 (18.4% in the age bracket) enrolled. Conversely, the age group of 18 to 19 year olds has the lowest likelihood of being enrolled in a private school, with 173 (100.0% in the age bracket) attending a public institution.
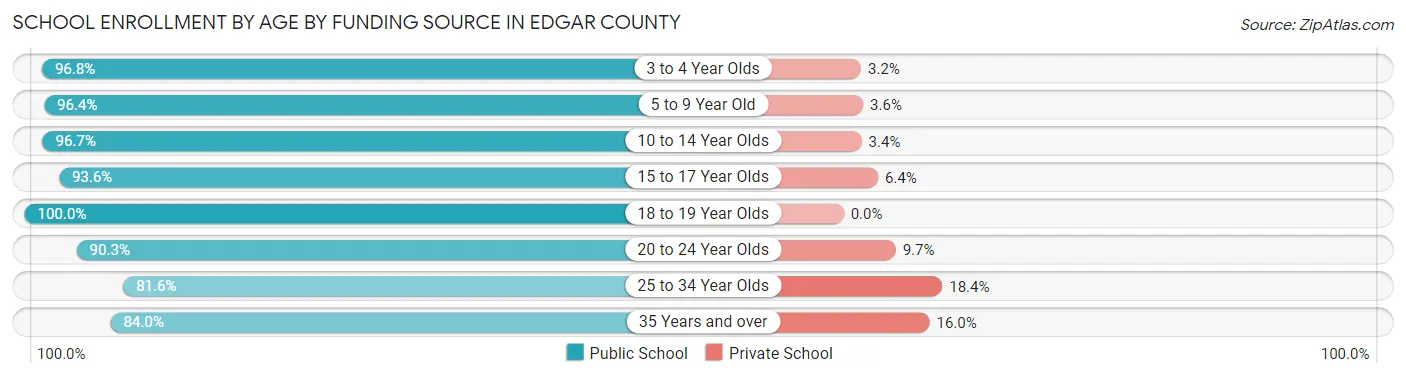
| Age Bracket | Public School | Private School |
| 3 to 4 Year Olds | 179 (96.8%) | 6 (3.2%) |
| 5 to 9 Year Old | 716 (96.4%) | 27 (3.6%) |
| 10 to 14 Year Olds | 982 (96.7%) | 34 (3.4%) |
| 15 to 17 Year Olds | 556 (93.6%) | 38 (6.4%) |
| 18 to 19 Year Olds | 173 (100.0%) | 0 (0.0%) |
| 20 to 24 Year Olds | 298 (90.3%) | 32 (9.7%) |
| 25 to 34 Year Olds | 40 (81.6%) | 9 (18.4%) |
| 35 Years and over | 42 (84.0%) | 8 (16.0%) |
| Total | 2,986 (95.1%) | 154 (4.9%) |
Educational Attainment by Field of Study in Edgar County
Education (500 | 20.5%), business (484 | 19.9%), science & technology (378 | 15.5%), engineering (170 | 7.0%), and arts & humanities (161 | 6.6%) are the most common fields of study among 2,438 individuals in Edgar County who have obtained a bachelor's degree or higher.
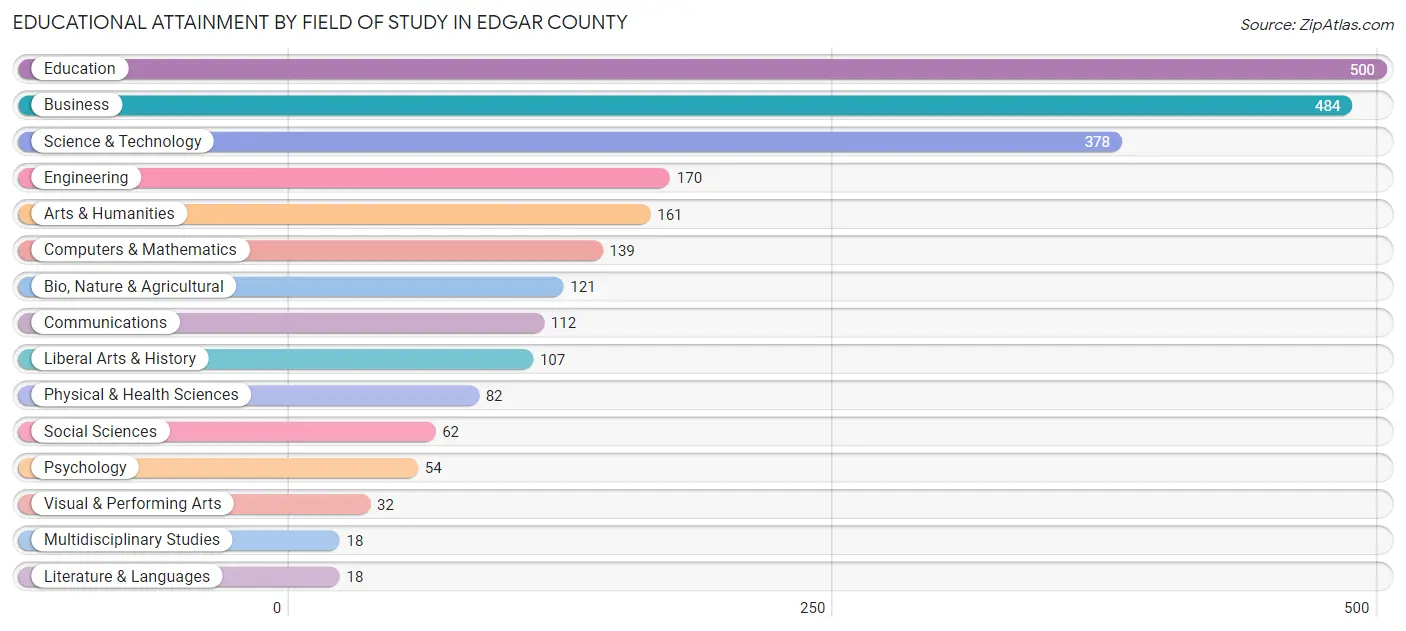
| Field of Study | # Graduates | % Graduates |
| Computers & Mathematics | 139 | 5.7% |
| Bio, Nature & Agricultural | 121 | 5.0% |
| Physical & Health Sciences | 82 | 3.4% |
| Psychology | 54 | 2.2% |
| Social Sciences | 62 | 2.5% |
| Engineering | 170 | 7.0% |
| Multidisciplinary Studies | 18 | 0.7% |
| Science & Technology | 378 | 15.5% |
| Business | 484 | 19.9% |
| Education | 500 | 20.5% |
| Literature & Languages | 18 | 0.7% |
| Liberal Arts & History | 107 | 4.4% |
| Visual & Performing Arts | 32 | 1.3% |
| Communications | 112 | 4.6% |
| Arts & Humanities | 161 | 6.6% |
| Total | 2,438 | 100.0% |
Transportation & Commute in Edgar County
Vehicle Availability by Sex in Edgar County
The most prevalent vehicle ownership categories in Edgar County are males with 2 vehicles (1,638, accounting for 42.6%) and females with 2 vehicles (1,445, making up 46.1%).
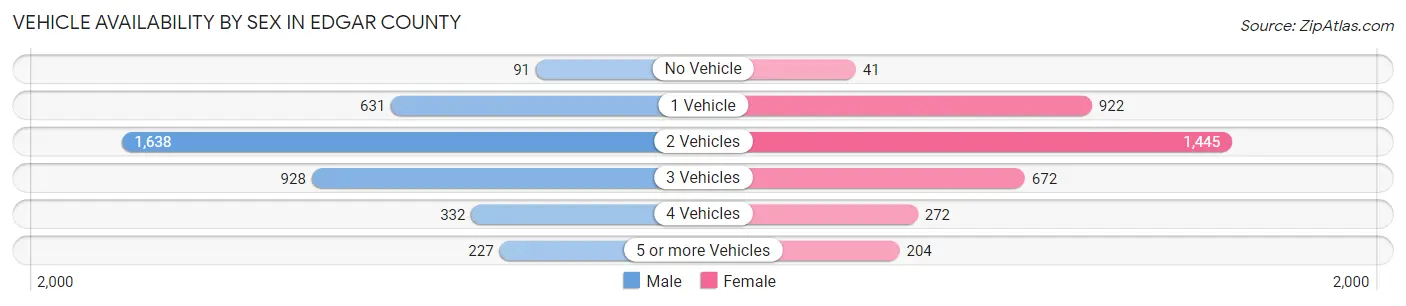
| Vehicles Available | Male | Female |
| No Vehicle | 91 (2.4%) | 41 (1.1%) |
| 1 Vehicle | 631 (16.4%) | 922 (25.9%) |
| 2 Vehicles | 1,638 (42.6%) | 1,445 (40.6%) |
| 3 Vehicles | 928 (24.1%) | 672 (18.9%) |
| 4 Vehicles | 332 (8.6%) | 272 (7.6%) |
| 5 or more Vehicles | 227 (5.9%) | 204 (5.7%) |
| Total | 3,847 (100.0%) | 3,556 (100.0%) |
Commute Time in Edgar County
The most frequently occuring commute durations in Edgar County are 5 to 9 minutes (1,832 commuters, 25.7%), 10 to 14 minutes (1,335 commuters, 18.7%), and less than 5 minutes (747 commuters, 10.5%).
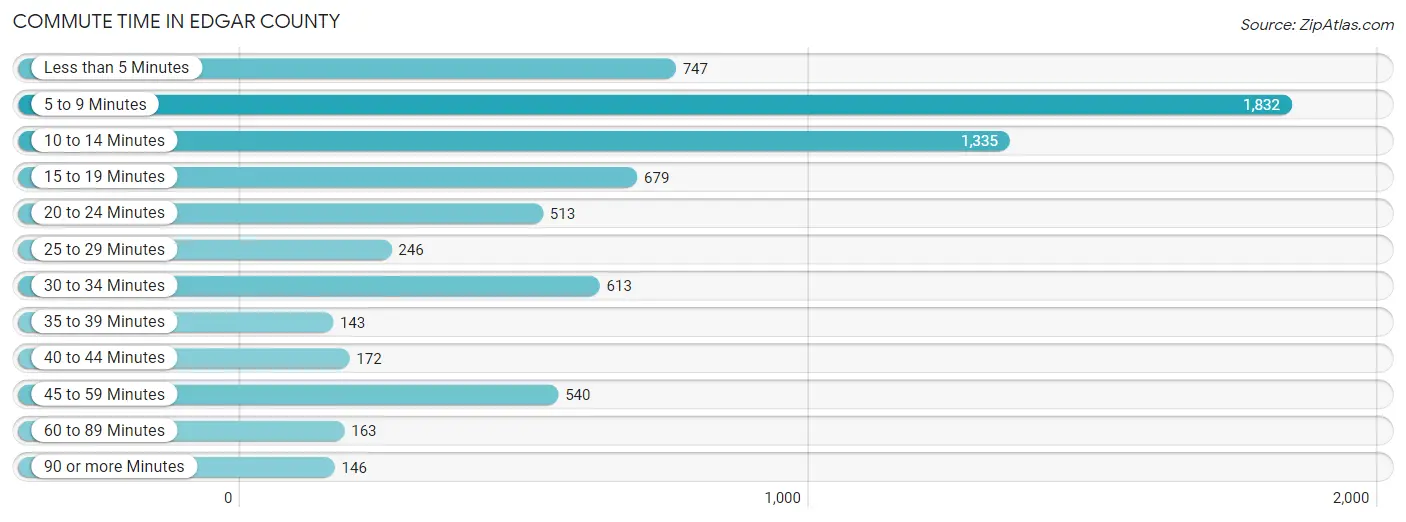
| Commute Time | # Commuters | % Commuters |
| Less than 5 Minutes | 747 | 10.5% |
| 5 to 9 Minutes | 1,832 | 25.7% |
| 10 to 14 Minutes | 1,335 | 18.7% |
| 15 to 19 Minutes | 679 | 9.5% |
| 20 to 24 Minutes | 513 | 7.2% |
| 25 to 29 Minutes | 246 | 3.5% |
| 30 to 34 Minutes | 613 | 8.6% |
| 35 to 39 Minutes | 143 | 2.0% |
| 40 to 44 Minutes | 172 | 2.4% |
| 45 to 59 Minutes | 540 | 7.6% |
| 60 to 89 Minutes | 163 | 2.3% |
| 90 or more Minutes | 146 | 2.1% |
Commute Time by Sex in Edgar County
The most common commute times in Edgar County are 5 to 9 minutes (834 commuters, 22.5%) for males and 5 to 9 minutes (998 commuters, 29.2%) for females.
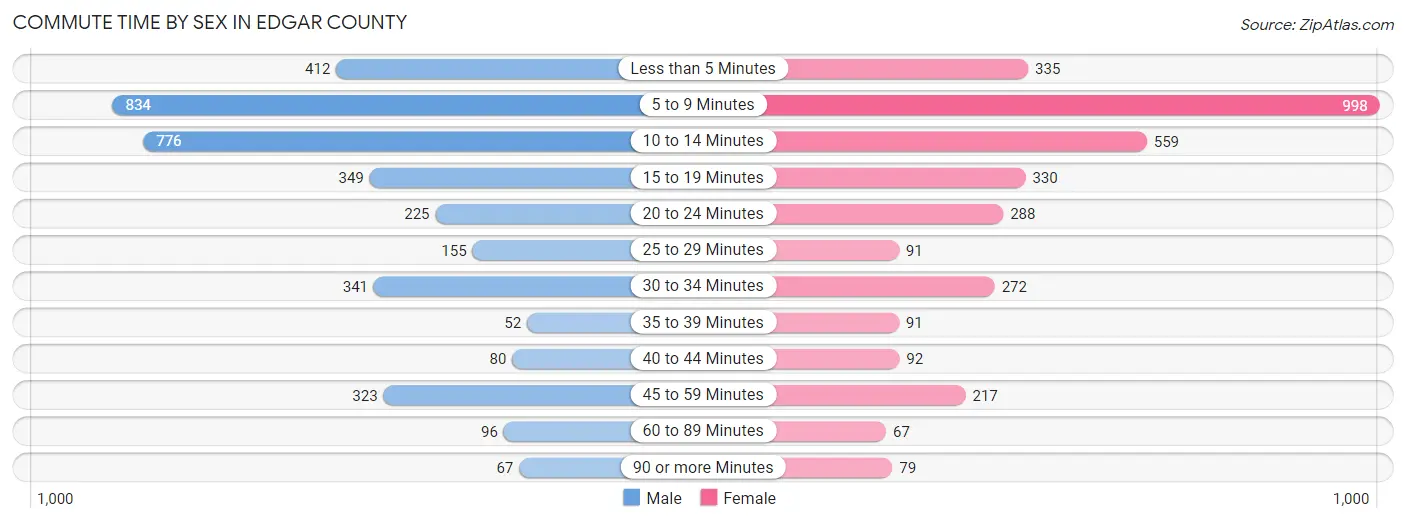
| Commute Time | Male | Female |
| Less than 5 Minutes | 412 (11.1%) | 335 (9.8%) |
| 5 to 9 Minutes | 834 (22.5%) | 998 (29.2%) |
| 10 to 14 Minutes | 776 (20.9%) | 559 (16.4%) |
| 15 to 19 Minutes | 349 (9.4%) | 330 (9.7%) |
| 20 to 24 Minutes | 225 (6.1%) | 288 (8.4%) |
| 25 to 29 Minutes | 155 (4.2%) | 91 (2.7%) |
| 30 to 34 Minutes | 341 (9.2%) | 272 (8.0%) |
| 35 to 39 Minutes | 52 (1.4%) | 91 (2.7%) |
| 40 to 44 Minutes | 80 (2.2%) | 92 (2.7%) |
| 45 to 59 Minutes | 323 (8.7%) | 217 (6.4%) |
| 60 to 89 Minutes | 96 (2.6%) | 67 (2.0%) |
| 90 or more Minutes | 67 (1.8%) | 79 (2.3%) |
Time of Departure to Work by Sex in Edgar County
The most frequent times of departure to work in Edgar County are 6:30 AM to 6:59 AM (515, 13.9%) for males and 7:30 AM to 7:59 AM (523, 15.3%) for females.
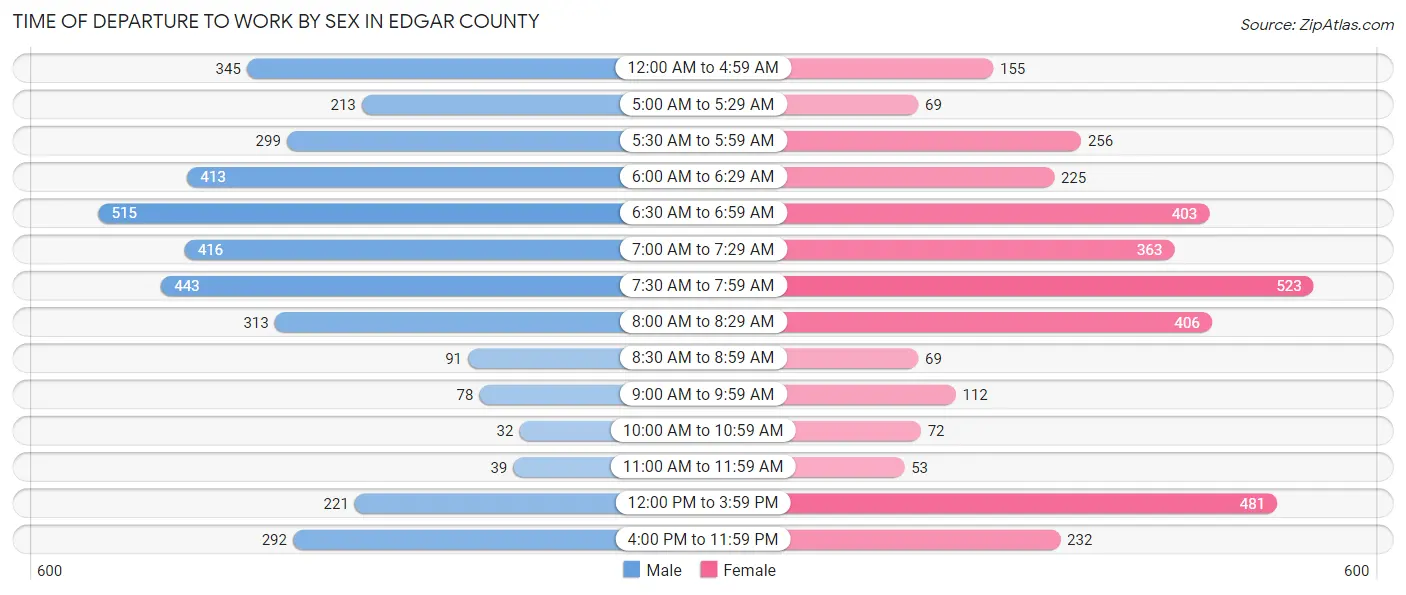
| Time of Departure | Male | Female |
| 12:00 AM to 4:59 AM | 345 (9.3%) | 155 (4.5%) |
| 5:00 AM to 5:29 AM | 213 (5.7%) | 69 (2.0%) |
| 5:30 AM to 5:59 AM | 299 (8.1%) | 256 (7.5%) |
| 6:00 AM to 6:29 AM | 413 (11.1%) | 225 (6.6%) |
| 6:30 AM to 6:59 AM | 515 (13.9%) | 403 (11.8%) |
| 7:00 AM to 7:29 AM | 416 (11.2%) | 363 (10.6%) |
| 7:30 AM to 7:59 AM | 443 (11.9%) | 523 (15.3%) |
| 8:00 AM to 8:29 AM | 313 (8.4%) | 406 (11.9%) |
| 8:30 AM to 8:59 AM | 91 (2.5%) | 69 (2.0%) |
| 9:00 AM to 9:59 AM | 78 (2.1%) | 112 (3.3%) |
| 10:00 AM to 10:59 AM | 32 (0.9%) | 72 (2.1%) |
| 11:00 AM to 11:59 AM | 39 (1.1%) | 53 (1.5%) |
| 12:00 PM to 3:59 PM | 221 (6.0%) | 481 (14.1%) |
| 4:00 PM to 11:59 PM | 292 (7.9%) | 232 (6.8%) |
| Total | 3,710 (100.0%) | 3,419 (100.0%) |
Housing Occupancy in Edgar County
Occupancy by Ownership in Edgar County
Of the total 7,598 dwellings in Edgar County, owner-occupied units account for 5,598 (73.7%), while renter-occupied units make up 2,000 (26.3%).
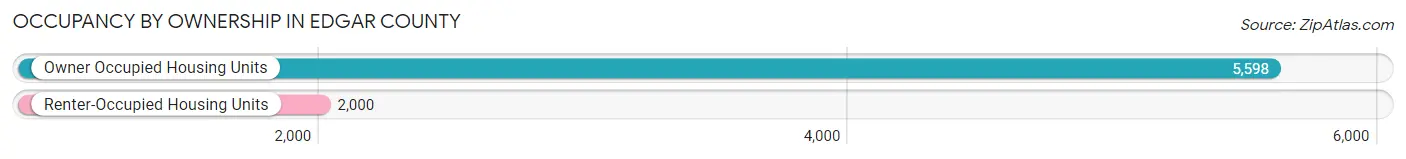
| Occupancy | # Housing Units | % Housing Units |
| Owner Occupied Housing Units | 5,598 | 73.7% |
| Renter-Occupied Housing Units | 2,000 | 26.3% |
| Total Occupied Housing Units | 7,598 | 100.0% |
Occupancy by Household Size in Edgar County
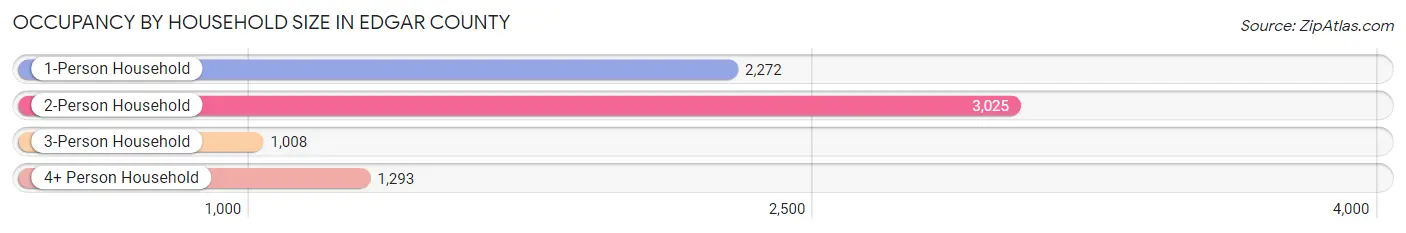
| Household Size | # Housing Units | % Housing Units |
| 1-Person Household | 2,272 | 29.9% |
| 2-Person Household | 3,025 | 39.8% |
| 3-Person Household | 1,008 | 13.3% |
| 4+ Person Household | 1,293 | 17.0% |
| Total Housing Units | 7,598 | 100.0% |
Occupancy by Ownership by Household Size in Edgar County
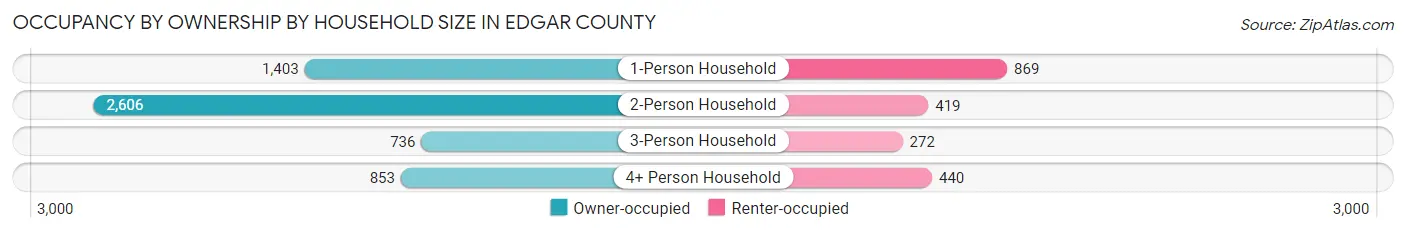
| Household Size | Owner-occupied | Renter-occupied |
| 1-Person Household | 1,403 (61.8%) | 869 (38.3%) |
| 2-Person Household | 2,606 (86.2%) | 419 (13.9%) |
| 3-Person Household | 736 (73.0%) | 272 (27.0%) |
| 4+ Person Household | 853 (66.0%) | 440 (34.0%) |
| Total Housing Units | 5,598 (73.7%) | 2,000 (26.3%) |
Occupancy by Educational Attainment in Edgar County
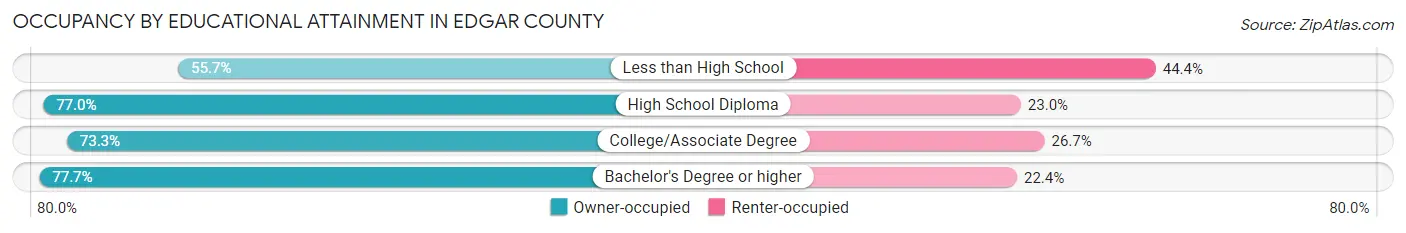
| Household Size | Owner-occupied | Renter-occupied |
| Less than High School | 458 (55.6%) | 365 (44.4%) |
| High School Diploma | 2,261 (77.0%) | 674 (23.0%) |
| College/Associate Degree | 1,729 (73.3%) | 630 (26.7%) |
| Bachelor's Degree or higher | 1,150 (77.6%) | 331 (22.4%) |
Occupancy by Age of Householder in Edgar County
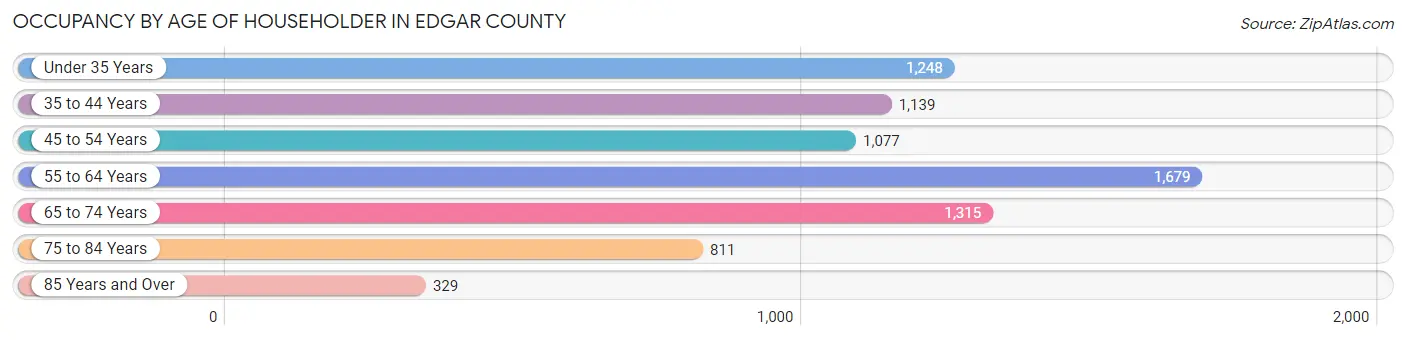
| Age Bracket | # Households | % Households |
| Under 35 Years | 1,248 | 16.4% |
| 35 to 44 Years | 1,139 | 15.0% |
| 45 to 54 Years | 1,077 | 14.2% |
| 55 to 64 Years | 1,679 | 22.1% |
| 65 to 74 Years | 1,315 | 17.3% |
| 75 to 84 Years | 811 | 10.7% |
| 85 Years and Over | 329 | 4.3% |
| Total | 7,598 | 100.0% |
Housing Finances in Edgar County
Median Income by Occupancy in Edgar County
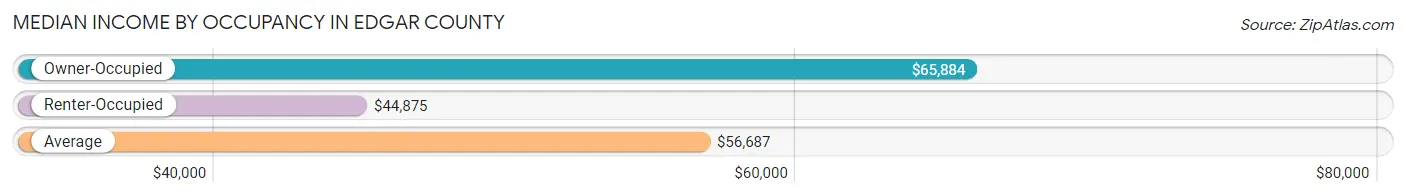
| Occupancy Type | # Households | Median Income |
| Owner-Occupied | 5,598 (73.7%) | $65,884 |
| Renter-Occupied | 2,000 (26.3%) | $44,875 |
| Average | 7,598 (100.0%) | $56,687 |
Occupancy by Householder Income Bracket in Edgar County
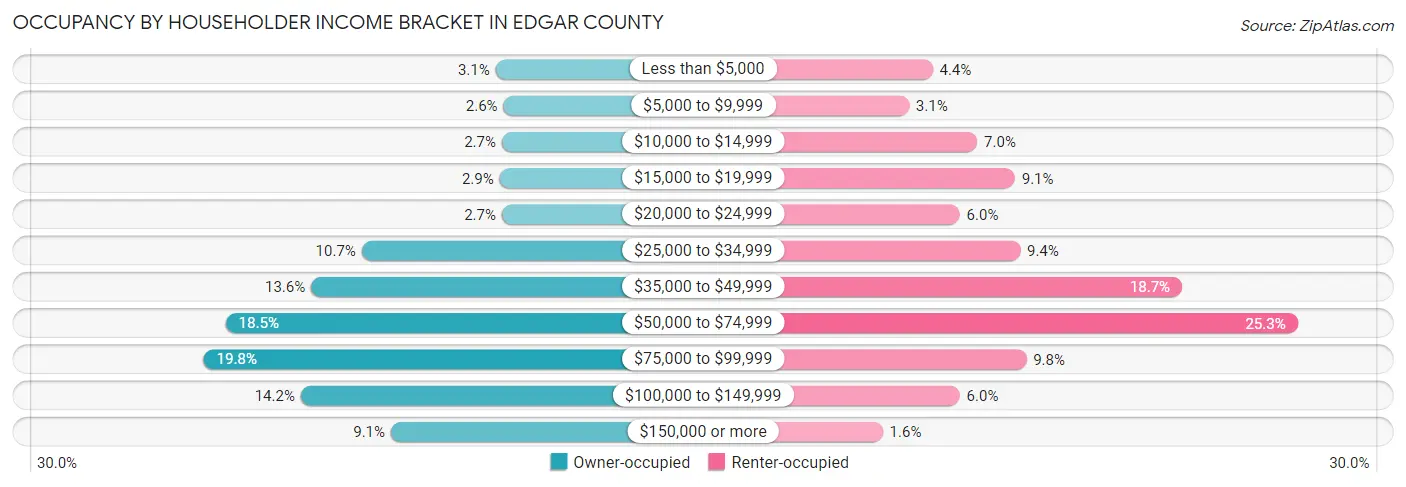
| Income Bracket | Owner-occupied | Renter-occupied |
| Less than $5,000 | 173 (3.1%) | 88 (4.4%) |
| $5,000 to $9,999 | 148 (2.6%) | 61 (3.0%) |
| $10,000 to $14,999 | 153 (2.7%) | 139 (7.0%) |
| $15,000 to $19,999 | 160 (2.9%) | 182 (9.1%) |
| $20,000 to $24,999 | 153 (2.7%) | 119 (5.9%) |
| $25,000 to $34,999 | 601 (10.7%) | 188 (9.4%) |
| $35,000 to $49,999 | 763 (13.6%) | 373 (18.6%) |
| $50,000 to $74,999 | 1,036 (18.5%) | 505 (25.3%) |
| $75,000 to $99,999 | 1,107 (19.8%) | 195 (9.8%) |
| $100,000 to $149,999 | 796 (14.2%) | 119 (5.9%) |
| $150,000 or more | 508 (9.1%) | 31 (1.5%) |
| Total | 5,598 (100.0%) | 2,000 (100.0%) |
Monthly Housing Cost Tiers in Edgar County
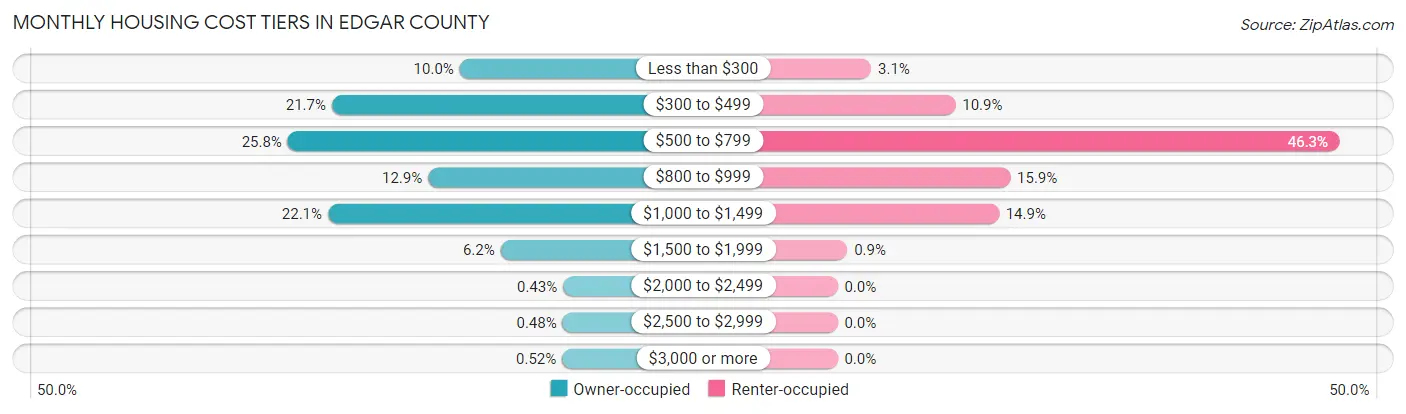
| Monthly Cost | Owner-occupied | Renter-occupied |
| Less than $300 | 557 (10.0%) | 62 (3.1%) |
| $300 to $499 | 1,216 (21.7%) | 217 (10.8%) |
| $500 to $799 | 1,443 (25.8%) | 925 (46.3%) |
| $800 to $999 | 720 (12.9%) | 318 (15.9%) |
| $1,000 to $1,499 | 1,236 (22.1%) | 297 (14.8%) |
| $1,500 to $1,999 | 346 (6.2%) | 18 (0.9%) |
| $2,000 to $2,499 | 24 (0.4%) | 0 (0.0%) |
| $2,500 to $2,999 | 27 (0.5%) | 0 (0.0%) |
| $3,000 or more | 29 (0.5%) | 0 (0.0%) |
| Total | 5,598 (100.0%) | 2,000 (100.0%) |
Physical Housing Characteristics in Edgar County
Housing Structures in Edgar County
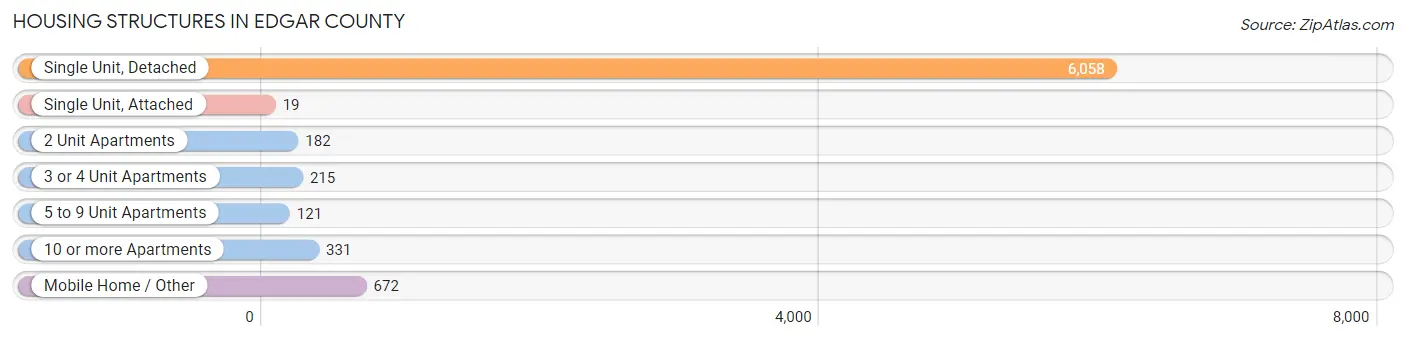
| Structure Type | # Housing Units | % Housing Units |
| Single Unit, Detached | 6,058 | 79.7% |
| Single Unit, Attached | 19 | 0.3% |
| 2 Unit Apartments | 182 | 2.4% |
| 3 or 4 Unit Apartments | 215 | 2.8% |
| 5 to 9 Unit Apartments | 121 | 1.6% |
| 10 or more Apartments | 331 | 4.4% |
| Mobile Home / Other | 672 | 8.8% |
| Total | 7,598 | 100.0% |
Housing Structures by Occupancy in Edgar County
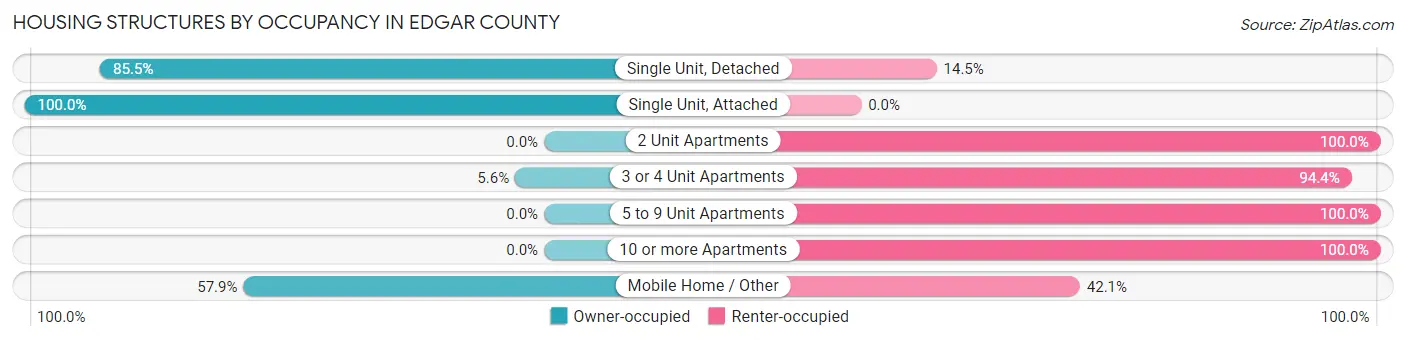
| Structure Type | Owner-occupied | Renter-occupied |
| Single Unit, Detached | 5,178 (85.5%) | 880 (14.5%) |
| Single Unit, Attached | 19 (100.0%) | 0 (0.0%) |
| 2 Unit Apartments | 0 (0.0%) | 182 (100.0%) |
| 3 or 4 Unit Apartments | 12 (5.6%) | 203 (94.4%) |
| 5 to 9 Unit Apartments | 0 (0.0%) | 121 (100.0%) |
| 10 or more Apartments | 0 (0.0%) | 331 (100.0%) |
| Mobile Home / Other | 389 (57.9%) | 283 (42.1%) |
| Total | 5,598 (73.7%) | 2,000 (26.3%) |
Housing Structures by Number of Rooms in Edgar County
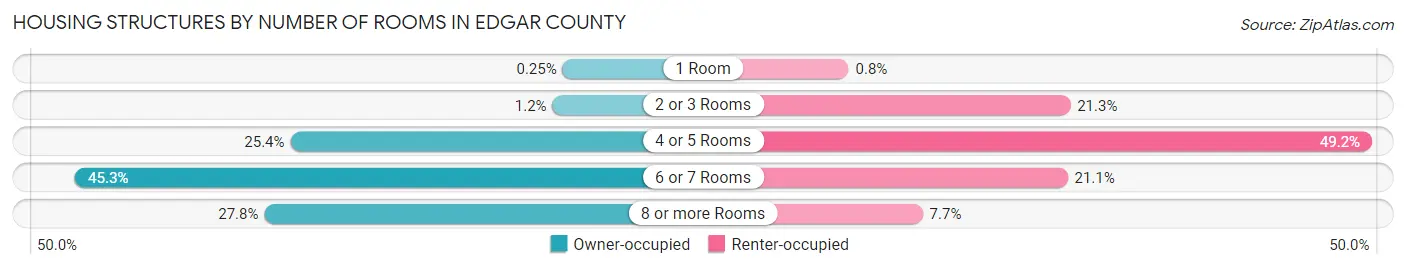
| Number of Rooms | Owner-occupied | Renter-occupied |
| 1 Room | 14 (0.3%) | 16 (0.8%) |
| 2 or 3 Rooms | 66 (1.2%) | 426 (21.3%) |
| 4 or 5 Rooms | 1,423 (25.4%) | 984 (49.2%) |
| 6 or 7 Rooms | 2,537 (45.3%) | 421 (21.0%) |
| 8 or more Rooms | 1,558 (27.8%) | 153 (7.6%) |
| Total | 5,598 (100.0%) | 2,000 (100.0%) |
Housing Structure by Heating Type in Edgar County
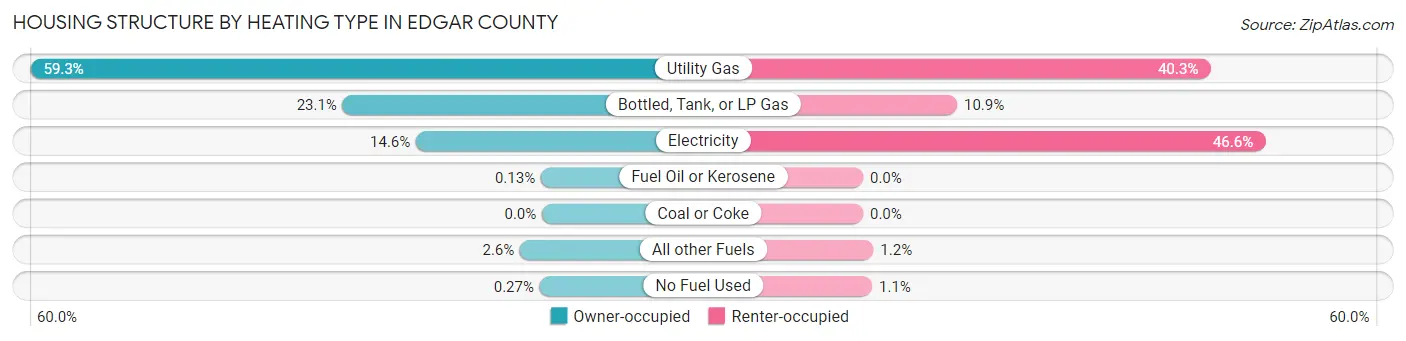
| Heating Type | Owner-occupied | Renter-occupied |
| Utility Gas | 3,321 (59.3%) | 805 (40.3%) |
| Bottled, Tank, or LP Gas | 1,294 (23.1%) | 218 (10.9%) |
| Electricity | 818 (14.6%) | 932 (46.6%) |
| Fuel Oil or Kerosene | 7 (0.1%) | 0 (0.0%) |
| Coal or Coke | 0 (0.0%) | 0 (0.0%) |
| All other Fuels | 143 (2.5%) | 24 (1.2%) |
| No Fuel Used | 15 (0.3%) | 21 (1.1%) |
| Total | 5,598 (100.0%) | 2,000 (100.0%) |
Household Vehicle Usage in Edgar County
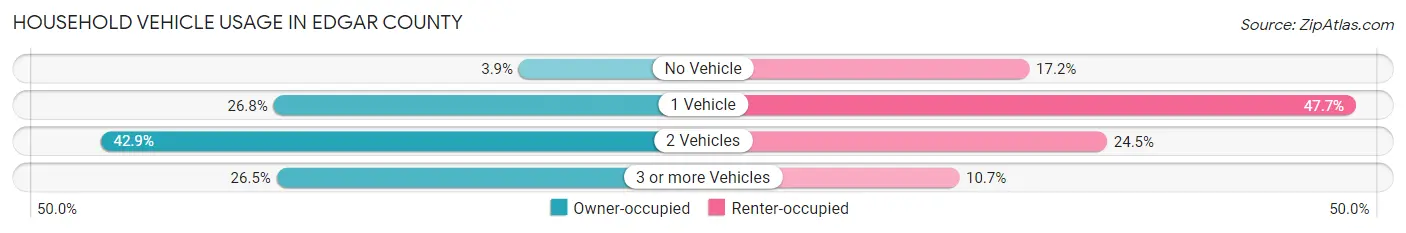
| Vehicles per Household | Owner-occupied | Renter-occupied |
| No Vehicle | 216 (3.9%) | 344 (17.2%) |
| 1 Vehicle | 1,498 (26.8%) | 954 (47.7%) |
| 2 Vehicles | 2,402 (42.9%) | 489 (24.4%) |
| 3 or more Vehicles | 1,482 (26.5%) | 213 (10.6%) |
| Total | 5,598 (100.0%) | 2,000 (100.0%) |
Real Estate & Mortgages in Edgar County
Real Estate and Mortgage Overview in Edgar County
| Characteristic | Without Mortgage | With Mortgage |
| Housing Units | 2,883 | 2,715 |
| Median Property Value | $86,000 | $98,200 |
| Median Household Income | $49,911 | $349 |
| Monthly Housing Costs | $444 | $29 |
| Real Estate Taxes | $1,384 | $63 |
Property Value by Mortgage Status in Edgar County
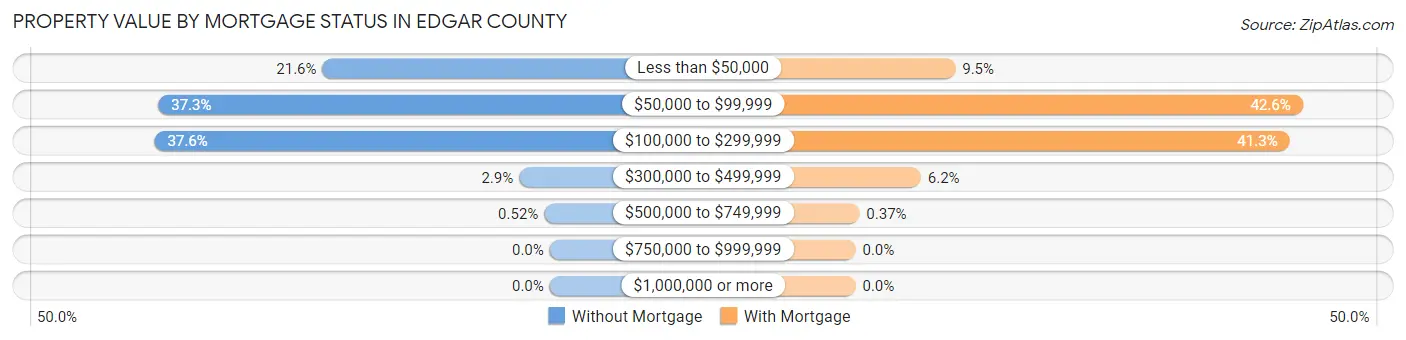
| Property Value | Without Mortgage | With Mortgage |
| Less than $50,000 | 624 (21.6%) | 258 (9.5%) |
| $50,000 to $99,999 | 1,075 (37.3%) | 1,156 (42.6%) |
| $100,000 to $299,999 | 1,085 (37.6%) | 1,122 (41.3%) |
| $300,000 to $499,999 | 84 (2.9%) | 169 (6.2%) |
| $500,000 to $749,999 | 15 (0.5%) | 10 (0.4%) |
| $750,000 to $999,999 | 0 (0.0%) | 0 (0.0%) |
| $1,000,000 or more | 0 (0.0%) | 0 (0.0%) |
| Total | 2,883 (100.0%) | 2,715 (100.0%) |
Household Income by Mortgage Status in Edgar County
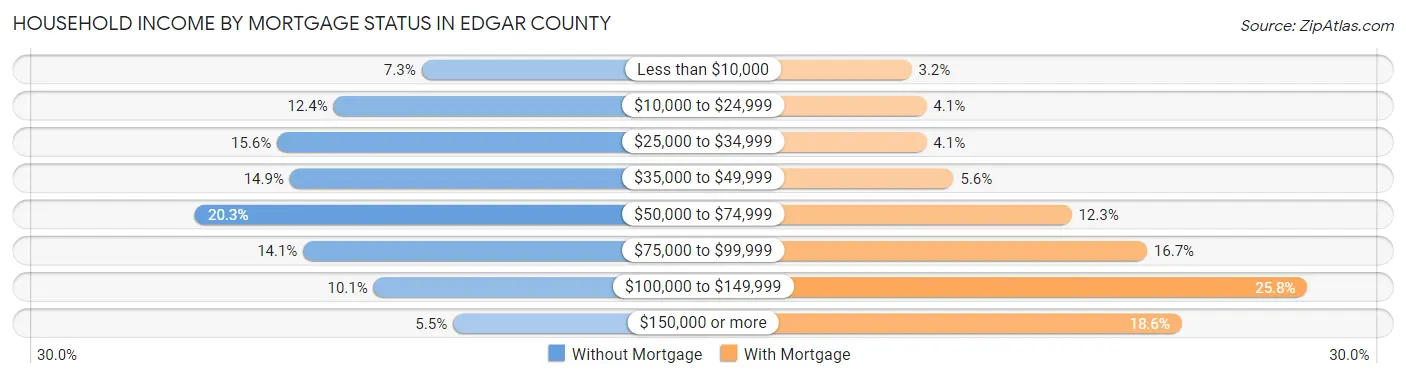
| Household Income | Without Mortgage | With Mortgage |
| Less than $10,000 | 211 (7.3%) | 87 (3.2%) |
| $10,000 to $24,999 | 356 (12.3%) | 110 (4.1%) |
| $25,000 to $34,999 | 449 (15.6%) | 110 (4.1%) |
| $35,000 to $49,999 | 428 (14.8%) | 152 (5.6%) |
| $50,000 to $74,999 | 584 (20.3%) | 335 (12.3%) |
| $75,000 to $99,999 | 406 (14.1%) | 452 (16.7%) |
| $100,000 to $149,999 | 290 (10.1%) | 701 (25.8%) |
| $150,000 or more | 159 (5.5%) | 506 (18.6%) |
| Total | 2,883 (100.0%) | 2,715 (100.0%) |
Property Value to Household Income Ratio in Edgar County
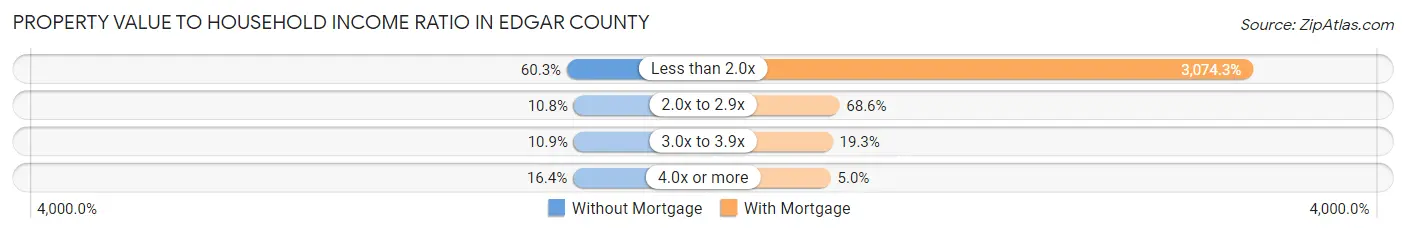
| Value-to-Income Ratio | Without Mortgage | With Mortgage |
| Less than 2.0x | 1,739 (60.3%) | 83,466 (3,074.2%) |
| 2.0x to 2.9x | 312 (10.8%) | 1,863 (68.6%) |
| 3.0x to 3.9x | 313 (10.9%) | 525 (19.3%) |
| 4.0x or more | 473 (16.4%) | 136 (5.0%) |
| Total | 2,883 (100.0%) | 2,715 (100.0%) |
Real Estate Taxes by Mortgage Status in Edgar County
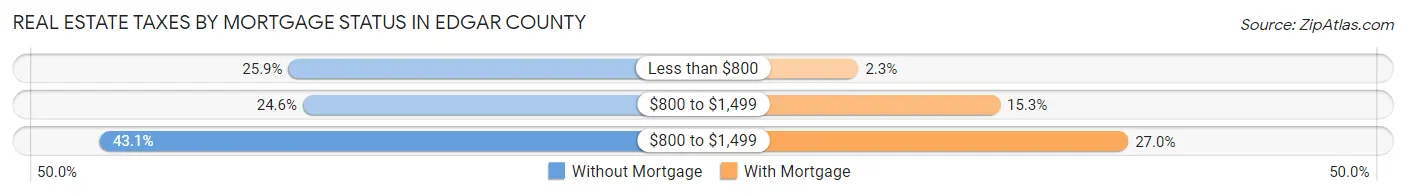
| Property Taxes | Without Mortgage | With Mortgage |
| Less than $800 | 747 (25.9%) | 63 (2.3%) |
| $800 to $1,499 | 709 (24.6%) | 414 (15.2%) |
| $800 to $1,499 | 1,243 (43.1%) | 732 (27.0%) |
| Total | 2,883 (100.0%) | 2,715 (100.0%) |
Health & Disability in Edgar County
Health Insurance Coverage by Age in Edgar County
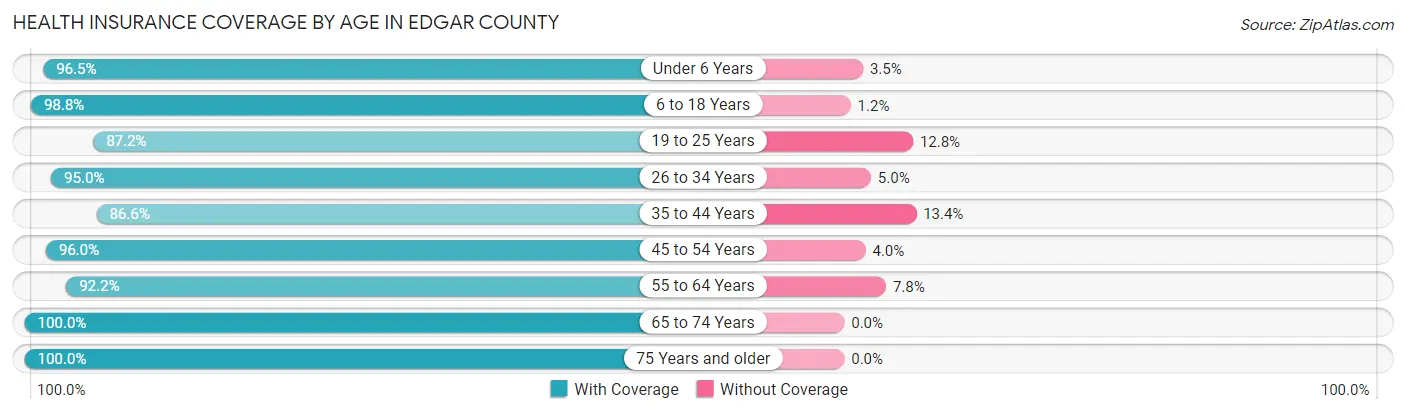
| Age Bracket | With Coverage | Without Coverage |
| Under 6 Years | 942 (96.5%) | 34 (3.5%) |
| 6 to 18 Years | 2,400 (98.8%) | 29 (1.2%) |
| 19 to 25 Years | 1,015 (87.2%) | 149 (12.8%) |
| 26 to 34 Years | 1,570 (95.0%) | 82 (5.0%) |
| 35 to 44 Years | 1,763 (86.6%) | 273 (13.4%) |
| 45 to 54 Years | 1,965 (96.0%) | 81 (4.0%) |
| 55 to 64 Years | 2,338 (92.2%) | 197 (7.8%) |
| 65 to 74 Years | 2,103 (100.0%) | 0 (0.0%) |
| 75 Years and older | 1,567 (100.0%) | 0 (0.0%) |
| Total | 15,663 (94.9%) | 845 (5.1%) |
Health Insurance Coverage by Citizenship Status in Edgar County
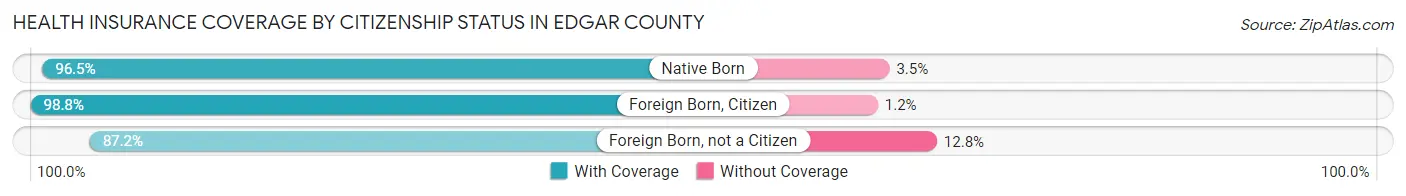
| Citizenship Status | With Coverage | Without Coverage |
| Native Born | 942 (96.5%) | 34 (3.5%) |
| Foreign Born, Citizen | 2,400 (98.8%) | 29 (1.2%) |
| Foreign Born, not a Citizen | 1,015 (87.2%) | 149 (12.8%) |
Health Insurance Coverage by Household Income in Edgar County
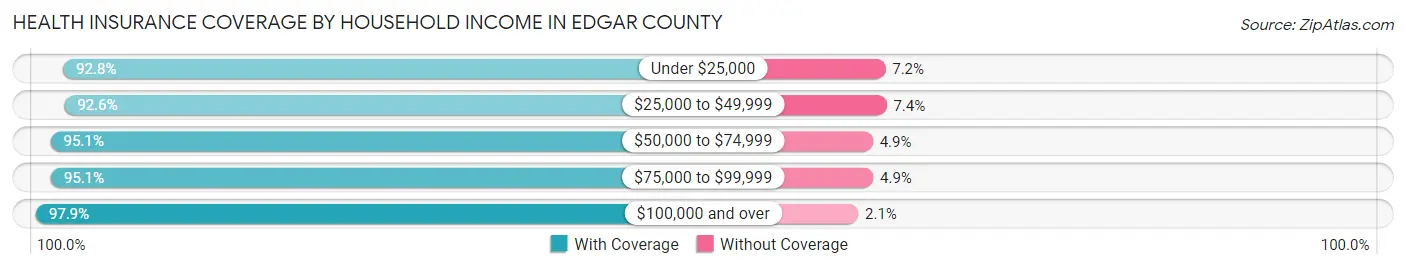
| Household Income | With Coverage | Without Coverage |
| Under $25,000 | 1,879 (92.8%) | 146 (7.2%) |
| $25,000 to $49,999 | 3,513 (92.6%) | 282 (7.4%) |
| $50,000 to $74,999 | 3,053 (95.1%) | 156 (4.9%) |
| $75,000 to $99,999 | 3,394 (95.1%) | 176 (4.9%) |
| $100,000 and over | 3,784 (97.9%) | 82 (2.1%) |
Public vs Private Health Insurance Coverage by Age in Edgar County
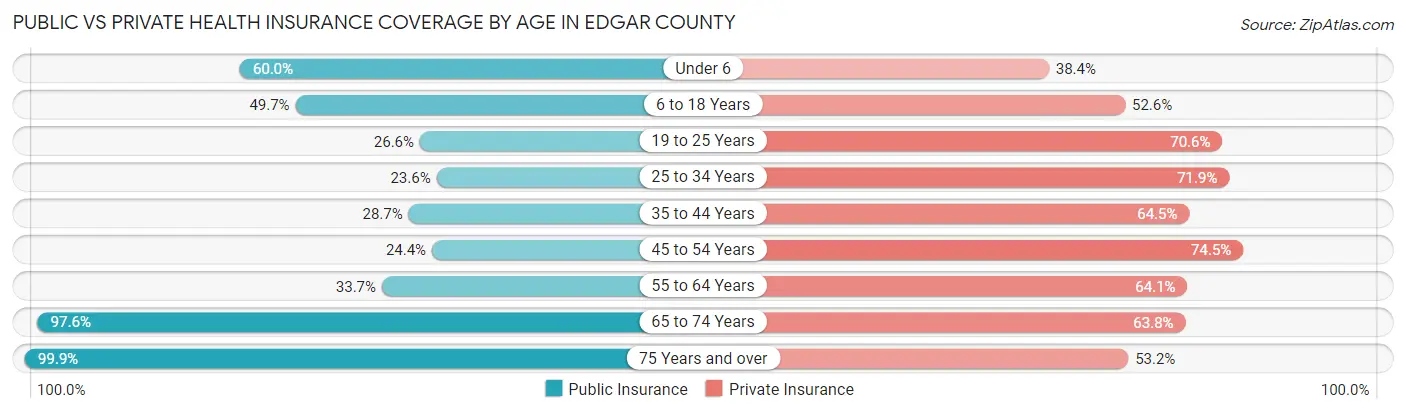
| Age Bracket | Public Insurance | Private Insurance |
| Under 6 | 586 (60.0%) | 375 (38.4%) |
| 6 to 18 Years | 1,208 (49.7%) | 1,277 (52.6%) |
| 19 to 25 Years | 310 (26.6%) | 822 (70.6%) |
| 25 to 34 Years | 389 (23.5%) | 1,188 (71.9%) |
| 35 to 44 Years | 585 (28.7%) | 1,313 (64.5%) |
| 45 to 54 Years | 499 (24.4%) | 1,524 (74.5%) |
| 55 to 64 Years | 854 (33.7%) | 1,626 (64.1%) |
| 65 to 74 Years | 2,052 (97.6%) | 1,341 (63.8%) |
| 75 Years and over | 1,566 (99.9%) | 833 (53.2%) |
| Total | 8,049 (48.8%) | 10,299 (62.4%) |
Disability Status by Sex by Age in Edgar County
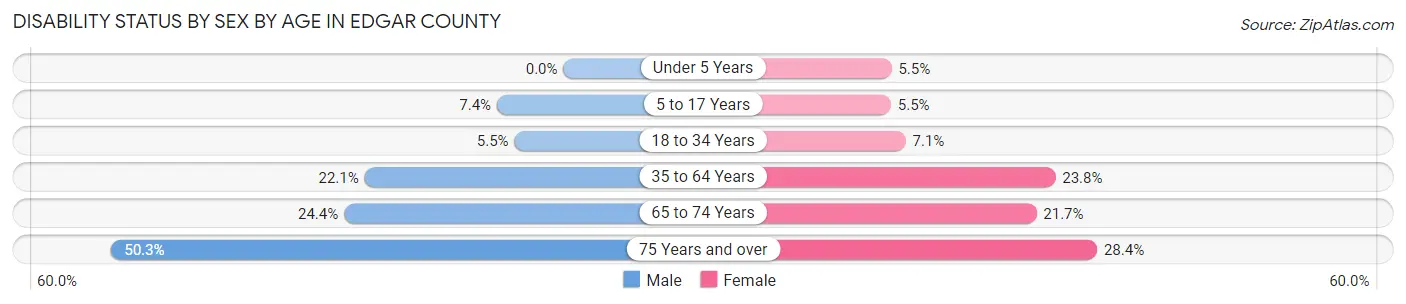
| Age Bracket | Male | Female |
| Under 5 Years | 0 (0.0%) | 22 (5.5%) |
| 5 to 17 Years | 96 (7.4%) | 65 (5.5%) |
| 18 to 34 Years | 82 (5.4%) | 100 (7.1%) |
| 35 to 64 Years | 750 (22.1%) | 768 (23.8%) |
| 65 to 74 Years | 242 (24.4%) | 241 (21.7%) |
| 75 Years and over | 300 (50.3%) | 276 (28.4%) |
Disability Class by Sex by Age in Edgar County
Disability Class: Hearing Difficulty
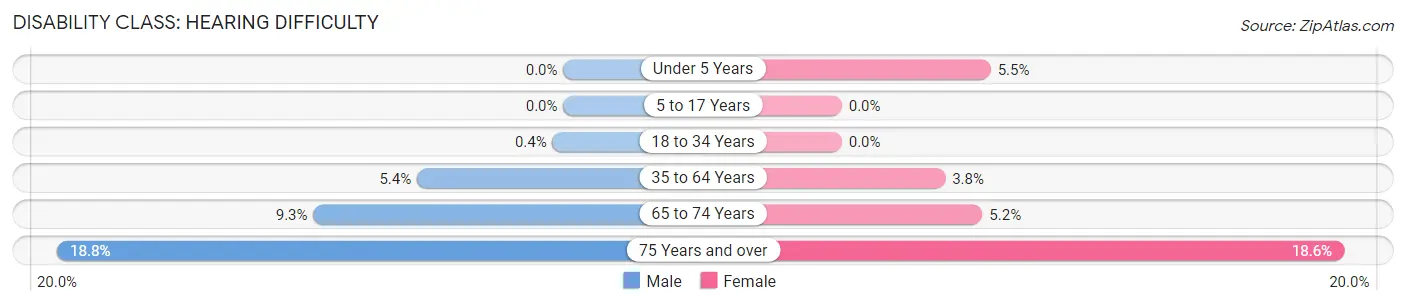
| Age Bracket | Male | Female |
| Under 5 Years | 0 (0.0%) | 22 (5.5%) |
| 5 to 17 Years | 0 (0.0%) | 0 (0.0%) |
| 18 to 34 Years | 6 (0.4%) | 0 (0.0%) |
| 35 to 64 Years | 184 (5.4%) | 124 (3.8%) |
| 65 to 74 Years | 92 (9.3%) | 58 (5.2%) |
| 75 Years and over | 112 (18.8%) | 181 (18.6%) |
Disability Class: Vision Difficulty
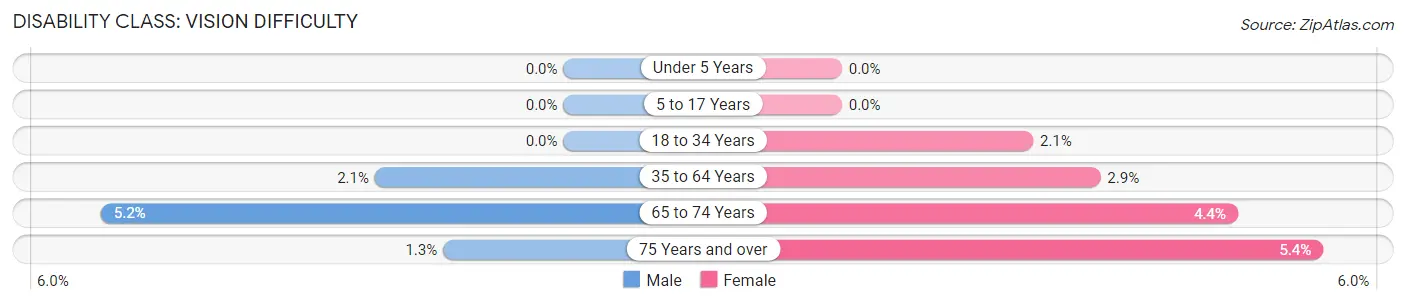
| Age Bracket | Male | Female |
| Under 5 Years | 0 (0.0%) | 0 (0.0%) |
| 5 to 17 Years | 0 (0.0%) | 0 (0.0%) |
| 18 to 34 Years | 0 (0.0%) | 30 (2.1%) |
| 35 to 64 Years | 71 (2.1%) | 93 (2.9%) |
| 65 to 74 Years | 51 (5.1%) | 49 (4.4%) |
| 75 Years and over | 8 (1.3%) | 52 (5.4%) |
Disability Class: Cognitive Difficulty
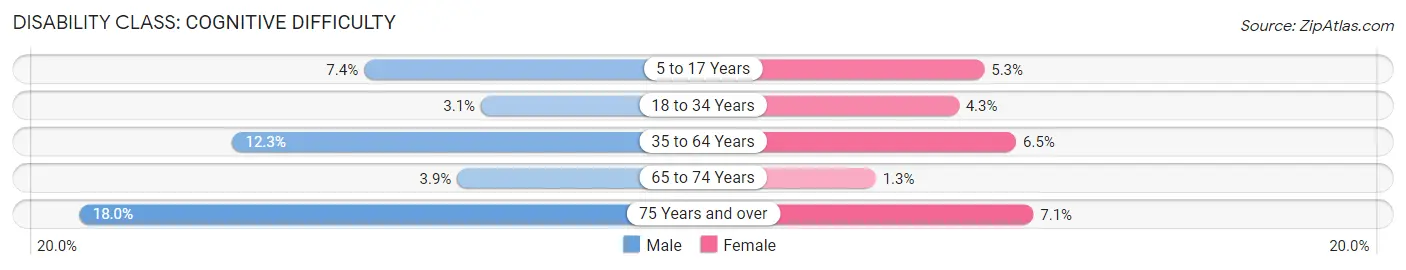
| Age Bracket | Male | Female |
| 5 to 17 Years | 96 (7.4%) | 63 (5.3%) |
| 18 to 34 Years | 46 (3.1%) | 61 (4.3%) |
| 35 to 64 Years | 416 (12.3%) | 209 (6.5%) |
| 65 to 74 Years | 39 (3.9%) | 14 (1.3%) |
| 75 Years and over | 107 (17.9%) | 69 (7.1%) |
Disability Class: Ambulatory Difficulty
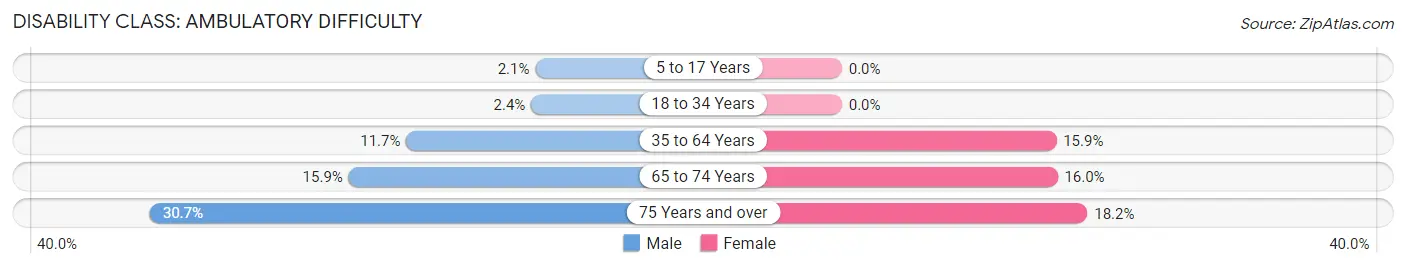
| Age Bracket | Male | Female |
| 5 to 17 Years | 27 (2.1%) | 0 (0.0%) |
| 18 to 34 Years | 36 (2.4%) | 0 (0.0%) |
| 35 to 64 Years | 395 (11.7%) | 514 (15.9%) |
| 65 to 74 Years | 158 (15.9%) | 178 (16.0%) |
| 75 Years and over | 183 (30.7%) | 177 (18.2%) |
Disability Class: Self-Care Difficulty
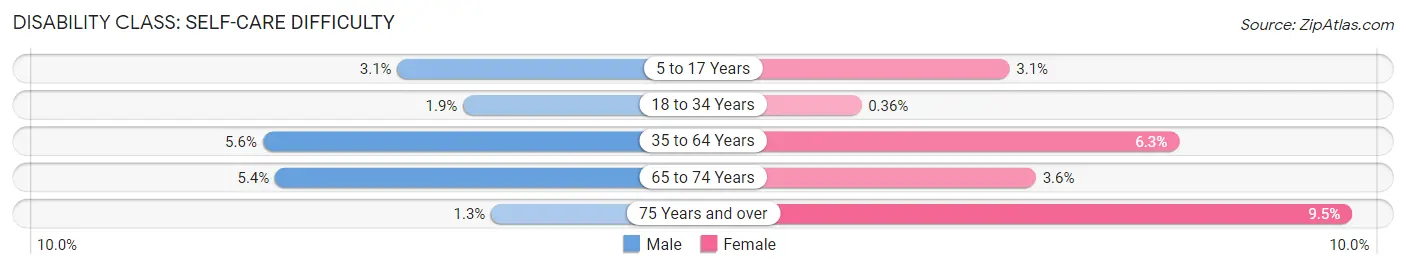
| Age Bracket | Male | Female |
| 5 to 17 Years | 40 (3.1%) | 37 (3.1%) |
| 18 to 34 Years | 28 (1.9%) | 5 (0.4%) |
| 35 to 64 Years | 189 (5.6%) | 202 (6.3%) |
| 65 to 74 Years | 53 (5.3%) | 40 (3.6%) |
| 75 Years and over | 8 (1.3%) | 92 (9.5%) |
Technology Access in Edgar County
Computing Device Access in Edgar County
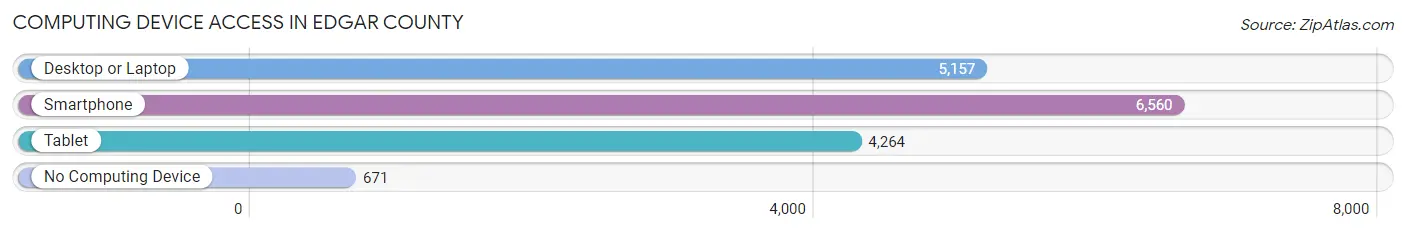
| Device Type | # Households | % Households |
| Desktop or Laptop | 5,157 | 67.9% |
| Smartphone | 6,560 | 86.3% |
| Tablet | 4,264 | 56.1% |
| No Computing Device | 671 | 8.8% |
| Total | 7,598 | 100.0% |
Internet Access in Edgar County
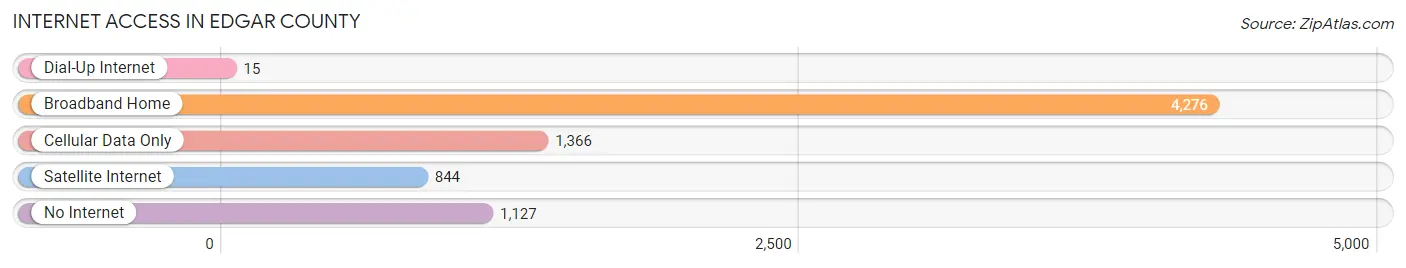
| Internet Type | # Households | % Households |
| Dial-Up Internet | 15 | 0.2% |
| Broadband Home | 4,276 | 56.3% |
| Cellular Data Only | 1,366 | 18.0% |
| Satellite Internet | 844 | 11.1% |
| No Internet | 1,127 | 14.8% |
| Total | 7,598 | 100.0% |
Edgar County Summary
Edgar County, Illinois is located in the east-central part of the state, and is part of the Champaign-Urbana metropolitan area. It is bordered by Clark County to the north, Coles County to the east, Douglas County to the south, and Vermilion County to the west. The county seat is Paris, and the county has a total area of 517 square miles.
History
Edgar County was formed in 1823 from parts of Clark and Coles counties. It was named after John Edgar, a prominent early settler and the first sheriff of the county. The first settlers arrived in the area in 1819, and the county was officially organized in 1823.
The county was largely agricultural in its early years, with corn, wheat, and oats being the main crops. The county also had a thriving livestock industry, with cattle, sheep, and hogs being raised. The county was also home to several coal mines, which provided employment for many of the county’s residents.
In the late 19th century, the county began to industrialize, with the establishment of several factories and mills. The county also saw an influx of immigrants, particularly from Germany and Ireland.
Geography
Edgar County is located in the east-central part of Illinois, and is part of the Champaign-Urbana metropolitan area. It is bordered by Clark County to the north, Coles County to the east, Douglas County to the south, and Vermilion County to the west. The county has a total area of 517 square miles, and is mostly flat, with some rolling hills in the northern part of the county.
The county is drained by the Embarras River, which flows through the county from north to south. The county also contains several small lakes, including Lake Paris, Lake Edgar, and Lake Vermilion.
Economy
The economy of Edgar County is largely based on agriculture and manufacturing. The county is home to several large farms, which produce corn, wheat, soybeans, and other crops. The county also has a thriving livestock industry, with cattle, sheep, and hogs being raised.
The county is also home to several manufacturing companies, including a paper mill, a plastics factory, and a metal fabrication plant. The county also has a growing tourism industry, with several attractions, including the Edgar County Historical Museum and the Edgar County Fairgrounds.
Demographics
As of the 2010 census, Edgar County had a population of 18,576. The population was spread out, with 48.3% male and 51.7% female. The median age was 40.2 years.
The racial makeup of the county was 97.2% White, 0.7% African American, 0.2% Native American, 0.3% Asian, 0.1% Pacific Islander, 0.5% from other races, and 1.1% from two or more races. Hispanic or Latino of any race were 1.7% of the population.
The median household income was $45,845, and the median family income was $54,845. The per capita income was $22,845. About 11.2% of the population was below the poverty line.
Common Questions
What is the Total Population of Edgar County?
Total Population of Edgar County is 16,852.
What is the Total Male Population of Edgar County?
Total Male Population of Edgar County is 8,364.
What is the Total Female Population of Edgar County?
Total Female Population of Edgar County is 8,488.
What is the Ratio of Males per 100 Females in Edgar County?
There are 98.54 Males per 100 Females in Edgar County.
What is the Ratio of Females per 100 Males in Edgar County?
There are 101.48 Females per 100 Males in Edgar County.
What is the Median Population Age in Edgar County?
Median Population Age in Edgar County is 46.0 Years.
What is the Average Family Size in Edgar County
Average Family Size in Edgar County is 2.6 People.
What is the Average Household Size in Edgar County
Average Household Size in Edgar County is 2.2 People.
What is Per Capita Income in Edgar County?
Per Capita income in Edgar County is $31,634.
What is the Median Family Income in Edgar County?
Median Family Income in Edgar County is $70,765.
What is the Median Household income in Edgar County?
Median Household Income in Edgar County is $56,687.
What is Income or Wage Gap in Edgar County?
Income or Wage Gap in Edgar County is 43.5%.
Women in Edgar County earn 56.5 cents for every dollar earned by a man.
What is Family Income Deficit in Edgar County?
Family Income Deficit in Edgar County is $9,841.
Families that are below poverty line in Edgar County earn $9,841 less on average than the poverty threshold level.
What is Inequality or Gini Index in Edgar County?
Inequality or Gini Index in Edgar County is 0.41.
How Large is the Labor Force in Edgar County?
There are 7,886 People in the Labor Forcein in Edgar County.
What is the Percentage of People in the Labor Force in Edgar County?
56.2% of People are in the Labor Force in Edgar County.
What is the Unemployment Rate in Edgar County?
Unemployment Rate in Edgar County is 4.6%.