DeKalb County, IL
DeKalb County Map
DeKalb County Overview
100,686
TOTAL POPULATION
50,029
MALE POPULATION
50,657
FEMALE POPULATION
98.76
MALES / 100 FEMALES
101.26
FEMALES / 100 MALES
31.8
MEDIAN AGE
3.1
AVG FAMILY SIZE
2.5
AVG HOUSEHOLD SIZE
$34,196
PER CAPITA INCOME
$91,538
AVG FAMILY INCOME
$68,617
AVG HOUSEHOLD INCOME
43.0%
WAGE / INCOME GAP [ % ]
57.0¢/ $1
WAGE / INCOME GAP [ $ ]
$11,412
FAMILY INCOME DEFICIT
0.44
INEQUALITY / GINI INDEX
55,574
LABOR FORCE [ PEOPLE ]
68.3%
PERCENT IN LABOR FORCE
7.0%
UNEMPLOYMENT RATE
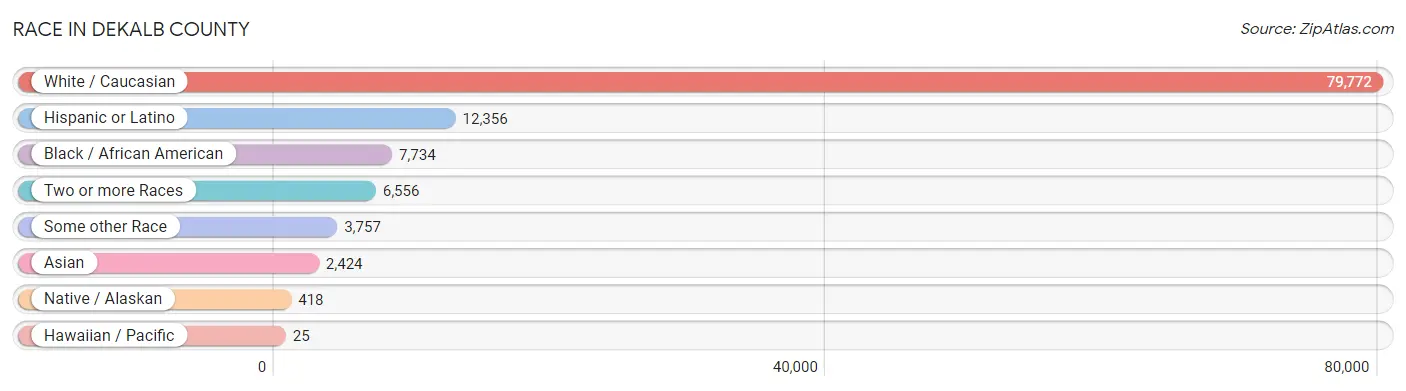
Race in DeKalb County
The most populous races in DeKalb County are White / Caucasian (79,772 | 79.2%), Hispanic or Latino (12,356 | 12.3%), and Black / African American (7,734 | 7.7%).
| Race | # Population | % Population |
| Asian | 2,424 | 2.4% |
| Black / African American | 7,734 | 7.7% |
| Hawaiian / Pacific | 25 | 0.0% |
| Hispanic or Latino | 12,356 | 12.3% |
| Native / Alaskan | 418 | 0.4% |
| White / Caucasian | 79,772 | 79.2% |
| Two or more Races | 6,556 | 6.5% |
| Some other Race | 3,757 | 3.7% |
| Total | 100,686 | 100.0% |
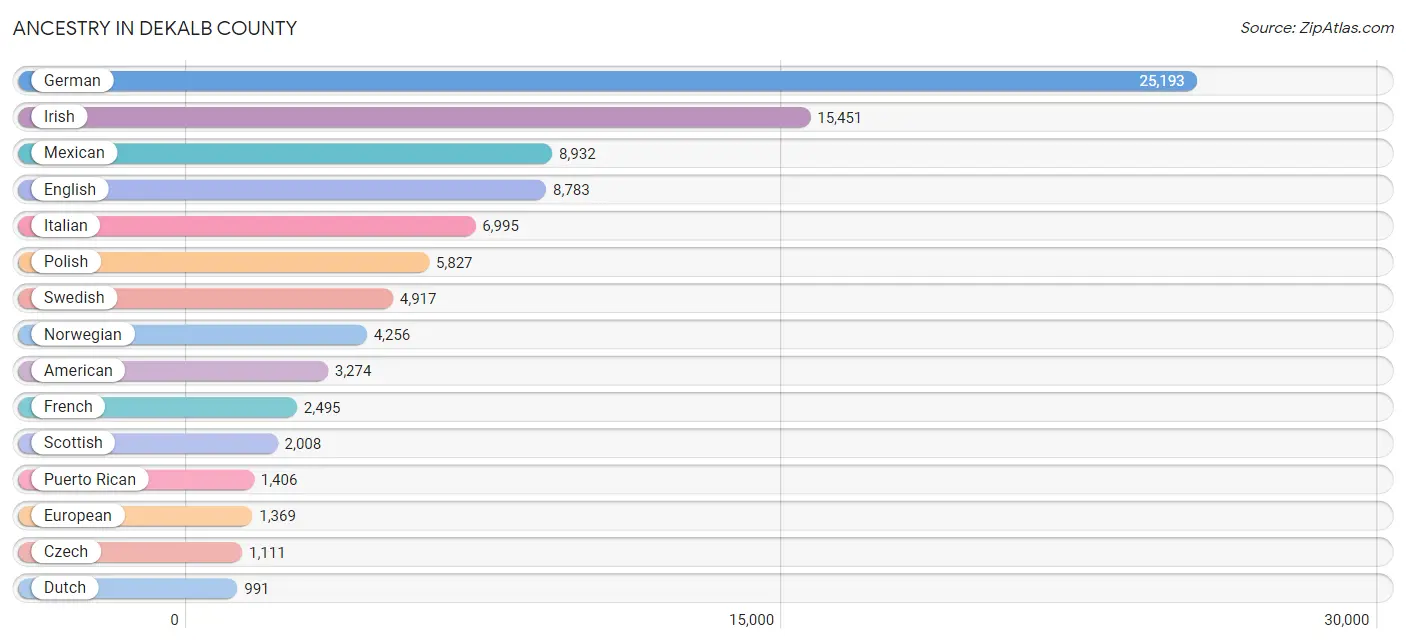
Ancestry in DeKalb County
The most populous ancestries reported in DeKalb County are German (25,193 | 25.0%), Irish (15,451 | 15.3%), Mexican (8,932 | 8.9%), English (8,783 | 8.7%), and Italian (6,995 | 7.0%), together accounting for 64.9% of all DeKalb County residents.
| Ancestry | # Population | % Population |
| African | 296 | 0.3% |
| Albanian | 4 | 0.0% |
| American | 3,274 | 3.3% |
| Apache | 87 | 0.1% |
| Arab | 601 | 0.6% |
| Argentinean | 3 | 0.0% |
| Armenian | 70 | 0.1% |
| Assyrian / Chaldean / Syriac | 19 | 0.0% |
| Australian | 86 | 0.1% |
| Austrian | 212 | 0.2% |
| Belgian | 195 | 0.2% |
| Belizean | 13 | 0.0% |
| Bhutanese | 253 | 0.3% |
| Blackfeet | 49 | 0.1% |
| Brazilian | 47 | 0.1% |
| British | 298 | 0.3% |
| British West Indian | 92 | 0.1% |
| Bulgarian | 37 | 0.0% |
| Burmese | 199 | 0.2% |
| Canadian | 78 | 0.1% |
| Central American | 127 | 0.1% |
| Central American Indian | 241 | 0.2% |
| Cherokee | 341 | 0.3% |
| Chilean | 172 | 0.2% |
| Chippewa | 6 | 0.0% |
| Choctaw | 68 | 0.1% |
| Colombian | 681 | 0.7% |
| Comanche | 2 | 0.0% |
| Costa Rican | 20 | 0.0% |
| Creek | 9 | 0.0% |
| Croatian | 173 | 0.2% |
| Cuban | 341 | 0.3% |
| Czech | 1,111 | 1.1% |
| Czechoslovakian | 209 | 0.2% |
| Danish | 458 | 0.4% |
| Dutch | 991 | 1.0% |
| Eastern European | 338 | 0.3% |
| Ecuadorian | 36 | 0.0% |
| Egyptian | 6 | 0.0% |
| English | 8,783 | 8.7% |
| Estonian | 56 | 0.1% |
| Ethiopian | 11 | 0.0% |
| European | 1,369 | 1.4% |
| Finnish | 231 | 0.2% |
| French | 2,495 | 2.5% |
| French American Indian | 1 | 0.0% |
| French Canadian | 388 | 0.4% |
| German | 25,193 | 25.0% |
| Ghanaian | 64 | 0.1% |
| Greek | 628 | 0.6% |
| Guamanian / Chamorro | 39 | 0.0% |
| Guatemalan | 57 | 0.1% |
| Guyanese | 168 | 0.2% |
| Haitian | 54 | 0.1% |
| Honduran | 19 | 0.0% |
| Hungarian | 508 | 0.5% |
| Icelander | 2 | 0.0% |
| Indian (Asian) | 879 | 0.9% |
| Indonesian | 24 | 0.0% |
| Iranian | 41 | 0.0% |
| Irish | 15,451 | 15.3% |
| Iroquois | 11 | 0.0% |
| Israeli | 42 | 0.0% |
| Italian | 6,995 | 7.0% |
| Jamaican | 185 | 0.2% |
| Japanese | 33 | 0.0% |
| Jordanian | 63 | 0.1% |
| Kenyan | 5 | 0.0% |
| Korean | 828 | 0.8% |
| Laotian | 41 | 0.0% |
| Latvian | 38 | 0.0% |
| Lebanese | 10 | 0.0% |
| Lithuanian | 394 | 0.4% |
| Luxembourger | 48 | 0.1% |
| Malaysian | 69 | 0.1% |
| Mexican | 8,932 | 8.9% |
| Mexican American Indian | 205 | 0.2% |
| Mongolian | 57 | 0.1% |
| Native Hawaiian | 242 | 0.2% |
| Navajo | 1 | 0.0% |
| Nigerian | 403 | 0.4% |
| Northern European | 126 | 0.1% |
| Norwegian | 4,256 | 4.2% |
| Pakistani | 79 | 0.1% |
| Palestinian | 288 | 0.3% |
| Panamanian | 2 | 0.0% |
| Pennsylvania German | 13 | 0.0% |
| Peruvian | 22 | 0.0% |
| Polish | 5,827 | 5.8% |
| Portuguese | 23 | 0.0% |
| Puerto Rican | 1,406 | 1.4% |
| Romanian | 396 | 0.4% |
| Russian | 563 | 0.6% |
| Salvadoran | 29 | 0.0% |
| Samoan | 11 | 0.0% |
| Scandinavian | 586 | 0.6% |
| Scotch-Irish | 569 | 0.6% |
| Scottish | 2,008 | 2.0% |
| Serbian | 157 | 0.2% |
| Sioux | 53 | 0.1% |
| Slavic | 48 | 0.1% |
| Slovak | 287 | 0.3% |
| Slovene | 178 | 0.2% |
| Somali | 56 | 0.1% |
| South African | 18 | 0.0% |
| South American | 914 | 0.9% |
| Spaniard | 207 | 0.2% |
| Spanish | 213 | 0.2% |
| Sri Lankan | 49 | 0.1% |
| Subsaharan African | 943 | 0.9% |
| Sudanese | 82 | 0.1% |
| Swedish | 4,917 | 4.9% |
| Swiss | 434 | 0.4% |
| Thai | 718 | 0.7% |
| Turkish | 67 | 0.1% |
| Ukrainian | 573 | 0.6% |
| Vietnamese | 22 | 0.0% |
| Welsh | 484 | 0.5% |
| Yugoslavian | 611 | 0.6% | View All 119 Rows |
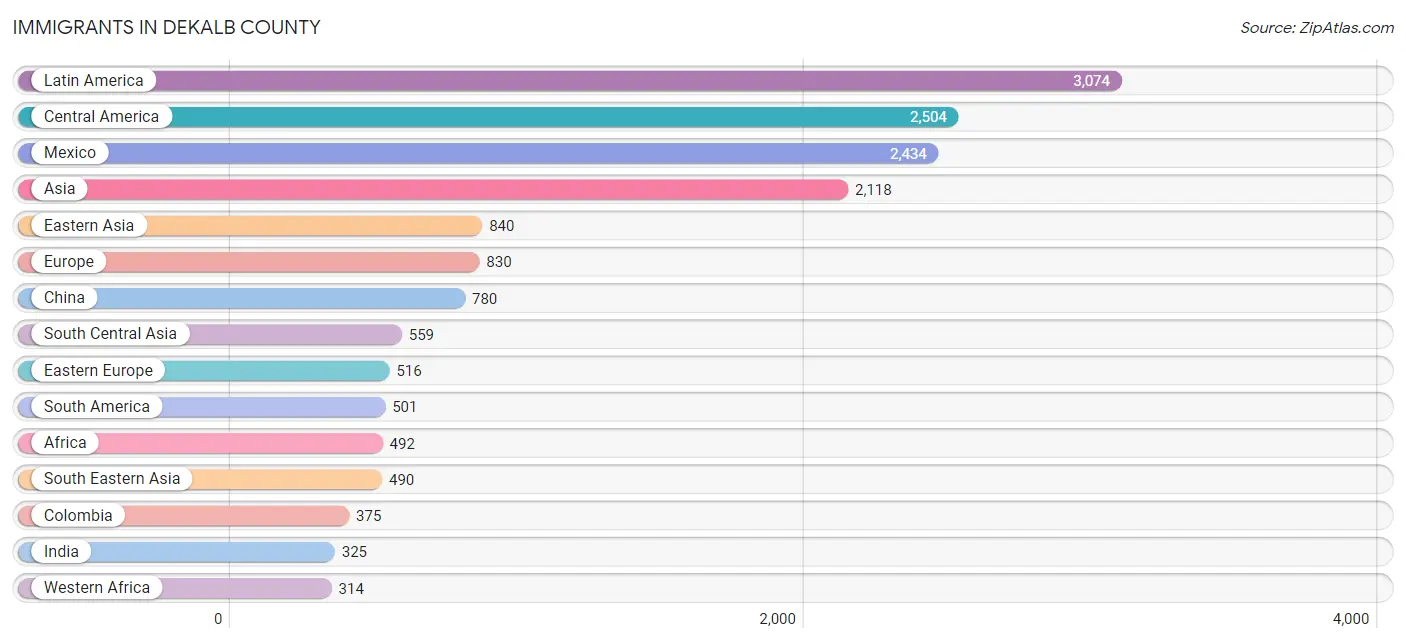
Immigrants in DeKalb County
The most numerous immigrant groups reported in DeKalb County came from Latin America (3,074 | 3.0%), Central America (2,504 | 2.5%), Mexico (2,434 | 2.4%), Asia (2,118 | 2.1%), and Eastern Asia (840 | 0.8%), together accounting for 10.9% of all DeKalb County residents.
| Immigration Origin | # Population | % Population |
| Africa | 492 | 0.5% |
| Albania | 4 | 0.0% |
| Argentina | 13 | 0.0% |
| Asia | 2,118 | 2.1% |
| Bangladesh | 4 | 0.0% |
| Belarus | 22 | 0.0% |
| Belgium | 13 | 0.0% |
| Bosnia and Herzegovina | 218 | 0.2% |
| Brazil | 26 | 0.0% |
| Bulgaria | 10 | 0.0% |
| Cambodia | 6 | 0.0% |
| Canada | 15 | 0.0% |
| Caribbean | 69 | 0.1% |
| Central America | 2,504 | 2.5% |
| Chile | 50 | 0.1% |
| China | 780 | 0.8% |
| Colombia | 375 | 0.4% |
| Costa Rica | 2 | 0.0% |
| Cuba | 8 | 0.0% |
| Eastern Africa | 33 | 0.0% |
| Eastern Asia | 840 | 0.8% |
| Eastern Europe | 516 | 0.5% |
| Ecuador | 15 | 0.0% |
| El Salvador | 5 | 0.0% |
| England | 15 | 0.0% |
| Europe | 830 | 0.8% |
| France | 39 | 0.0% |
| Germany | 64 | 0.1% |
| Greece | 21 | 0.0% |
| Guatemala | 57 | 0.1% |
| Haiti | 54 | 0.1% |
| Honduras | 6 | 0.0% |
| Hong Kong | 23 | 0.0% |
| Hungary | 11 | 0.0% |
| India | 325 | 0.3% |
| Indonesia | 41 | 0.0% |
| Iran | 41 | 0.0% |
| Ireland | 17 | 0.0% |
| Italy | 5 | 0.0% |
| Japan | 29 | 0.0% |
| Kazakhstan | 57 | 0.1% |
| Kenya | 27 | 0.0% |
| Korea | 31 | 0.0% |
| Laos | 49 | 0.1% |
| Latin America | 3,074 | 3.0% |
| Lebanon | 3 | 0.0% |
| Lithuania | 13 | 0.0% |
| Malaysia | 57 | 0.1% |
| Mexico | 2,434 | 2.4% |
| Middle Africa | 3 | 0.0% |
| Nepal | 48 | 0.1% |
| Netherlands | 17 | 0.0% |
| Nigeria | 313 | 0.3% |
| Northern Africa | 76 | 0.1% |
| Northern Europe | 110 | 0.1% |
| Norway | 16 | 0.0% |
| Pakistan | 6 | 0.0% |
| Peru | 22 | 0.0% |
| Philippines | 261 | 0.3% |
| Poland | 168 | 0.2% |
| Romania | 11 | 0.0% |
| Russia | 17 | 0.0% |
| Saudi Arabia | 150 | 0.2% |
| South Africa | 66 | 0.1% |
| South America | 501 | 0.5% |
| South Central Asia | 559 | 0.6% |
| South Eastern Asia | 490 | 0.5% |
| Southern Europe | 71 | 0.1% |
| Spain | 45 | 0.0% |
| Sudan | 60 | 0.1% |
| Sweden | 10 | 0.0% |
| Taiwan | 63 | 0.1% |
| Thailand | 31 | 0.0% |
| Trinidad and Tobago | 7 | 0.0% |
| Turkey | 40 | 0.0% |
| Ukraine | 40 | 0.0% |
| Uzbekistan | 12 | 0.0% |
| Vietnam | 21 | 0.0% |
| Western Africa | 314 | 0.3% |
| Western Asia | 229 | 0.2% |
| Western Europe | 133 | 0.1% |
| Zaire | 3 | 0.0% |
| Zimbabwe | 6 | 0.0% | View All 83 Rows |
Sex and Age in DeKalb County
Sex and Age in DeKalb County
The most populous age groups in DeKalb County are 20 to 24 Years (7,197 | 14.4%) for men and 20 to 24 Years (6,918 | 13.7%) for women.
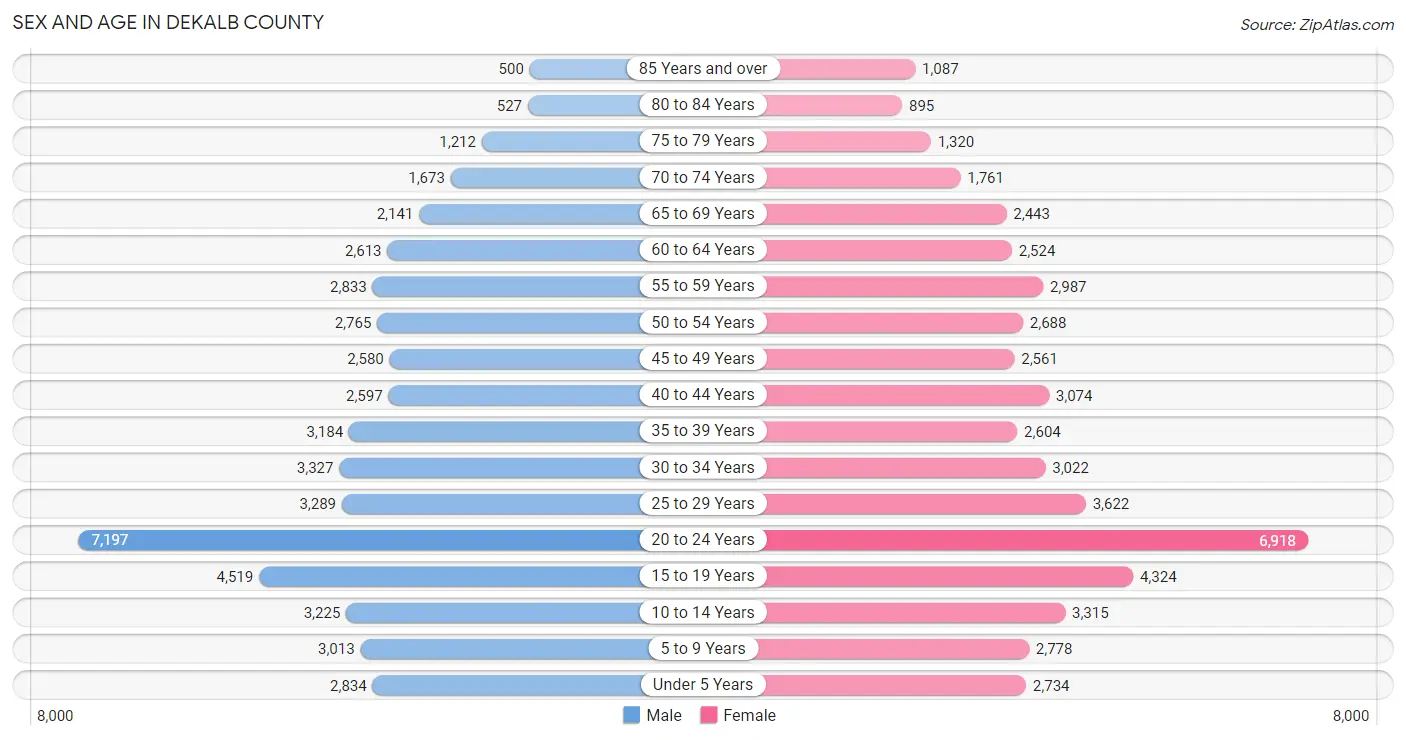
| Age Bracket | Male | Female |
| Under 5 Years | 2,834 (5.7%) | 2,734 (5.4%) |
| 5 to 9 Years | 3,013 (6.0%) | 2,778 (5.5%) |
| 10 to 14 Years | 3,225 (6.5%) | 3,315 (6.5%) |
| 15 to 19 Years | 4,519 (9.0%) | 4,324 (8.5%) |
| 20 to 24 Years | 7,197 (14.4%) | 6,918 (13.7%) |
| 25 to 29 Years | 3,289 (6.6%) | 3,622 (7.1%) |
| 30 to 34 Years | 3,327 (6.7%) | 3,022 (6.0%) |
| 35 to 39 Years | 3,184 (6.4%) | 2,604 (5.1%) |
| 40 to 44 Years | 2,597 (5.2%) | 3,074 (6.1%) |
| 45 to 49 Years | 2,580 (5.2%) | 2,561 (5.1%) |
| 50 to 54 Years | 2,765 (5.5%) | 2,688 (5.3%) |
| 55 to 59 Years | 2,833 (5.7%) | 2,987 (5.9%) |
| 60 to 64 Years | 2,613 (5.2%) | 2,524 (5.0%) |
| 65 to 69 Years | 2,141 (4.3%) | 2,443 (4.8%) |
| 70 to 74 Years | 1,673 (3.3%) | 1,761 (3.5%) |
| 75 to 79 Years | 1,212 (2.4%) | 1,320 (2.6%) |
| 80 to 84 Years | 527 (1.1%) | 895 (1.8%) |
| 85 Years and over | 500 (1.0%) | 1,087 (2.1%) |
| Total | 50,029 (100.0%) | 50,657 (100.0%) |
Families and Households in DeKalb County
Median Family Size in DeKalb County
The median family size in DeKalb County is 3.11 persons per family, with married-couple families (17,091 | 73.7%) accounting for the largest median family size of 3.14 persons per family. On the other hand, single male/father families (1,783 | 7.7%) represent the smallest median family size with 2.96 persons per family.
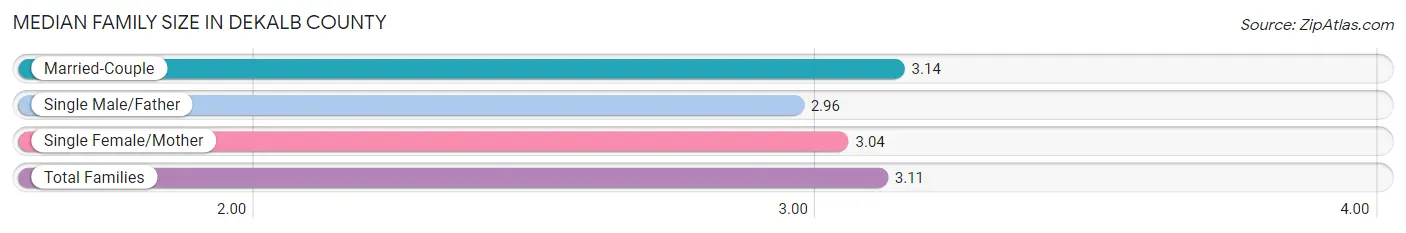
| Family Type | # Families | Family Size |
| Married-Couple | 17,091 (73.7%) | 3.14 |
| Single Male/Father | 1,783 (7.7%) | 2.96 |
| Single Female/Mother | 4,317 (18.6%) | 3.04 |
| Total Families | 23,191 (100.0%) | 3.11 |
Median Household Size in DeKalb County
The median household size in DeKalb County is 2.47 persons per household, with single male/father households (1,783 | 4.6%) accounting for the largest median household size of 3.44 persons per household. non-family households (15,948 | 40.7%) represent the smallest median household size with 1.38 persons per household.
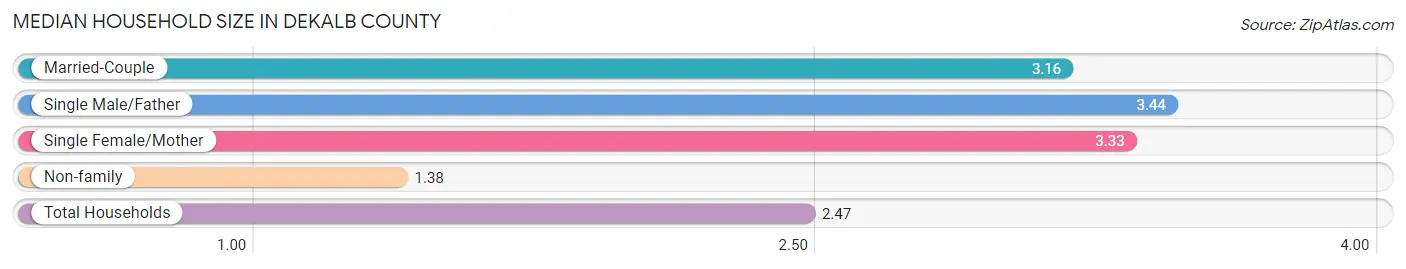
| Household Type | # Households | Household Size |
| Married-Couple | 17,091 (43.7%) | 3.16 |
| Single Male/Father | 1,783 (4.6%) | 3.44 |
| Single Female/Mother | 4,317 (11.0%) | 3.33 |
| Non-family | 15,948 (40.7%) | 1.38 |
| Total Households | 39,139 (100.0%) | 2.47 |
Household Size by Marriage Status in DeKalb County
Out of a total of 39,139 households in DeKalb County, 23,191 (59.3%) are family households, while 15,948 (40.7%) are nonfamily households. The most numerous type of family households are 2-person households, comprising 10,349, and the most common type of nonfamily households are 1-person households, comprising 11,291.
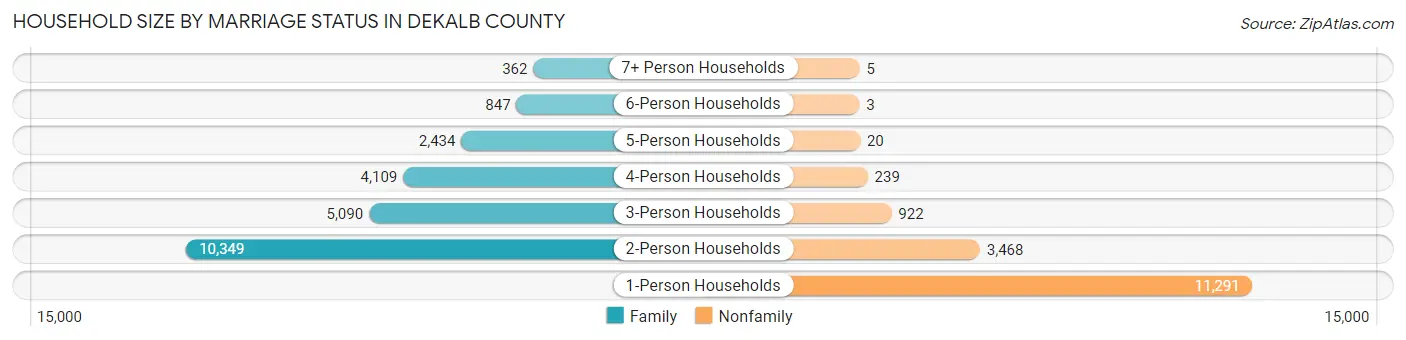
| Household Size | Family Households | Nonfamily Households |
| 1-Person Households | - | 11,291 (28.8%) |
| 2-Person Households | 10,349 (26.4%) | 3,468 (8.9%) |
| 3-Person Households | 5,090 (13.0%) | 922 (2.4%) |
| 4-Person Households | 4,109 (10.5%) | 239 (0.6%) |
| 5-Person Households | 2,434 (6.2%) | 20 (0.1%) |
| 6-Person Households | 847 (2.2%) | 3 (0.0%) |
| 7+ Person Households | 362 (0.9%) | 5 (0.0%) |
| Total | 23,191 (59.3%) | 15,948 (40.7%) |
Female Fertility in DeKalb County
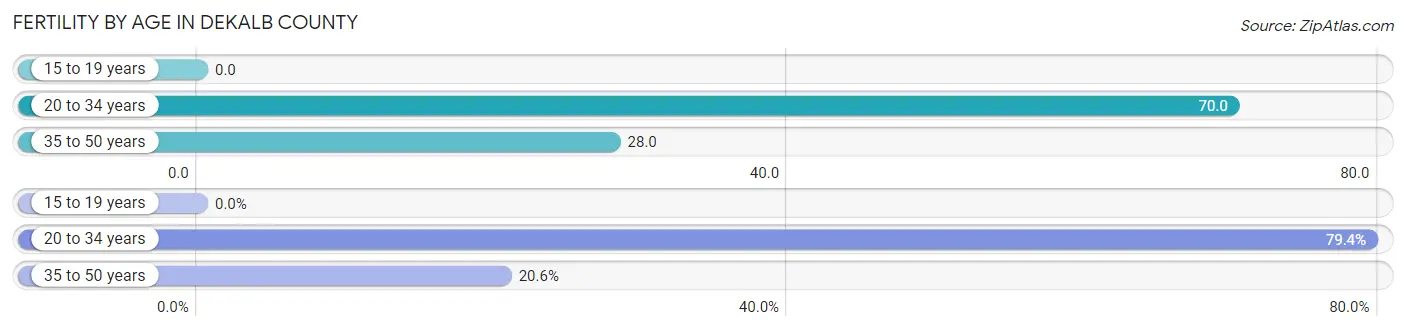
Fertility by Age in DeKalb County
Average fertility rate in DeKalb County is 45.0 births per 1,000 women. Women in the age bracket of 20 to 34 years have the highest fertility rate with 70.0 births per 1,000 women. Women in the age bracket of 20 to 34 years acount for 79.4% of all women with births.
| Age Bracket | Women with Births | Births / 1,000 Women |
| 15 to 19 years | 0 (0.0%) | 0.0 |
| 20 to 34 years | 944 (79.4%) | 70.0 |
| 35 to 50 years | 245 (20.6%) | 28.0 |
| Total | 1,189 (100.0%) | 45.0 |
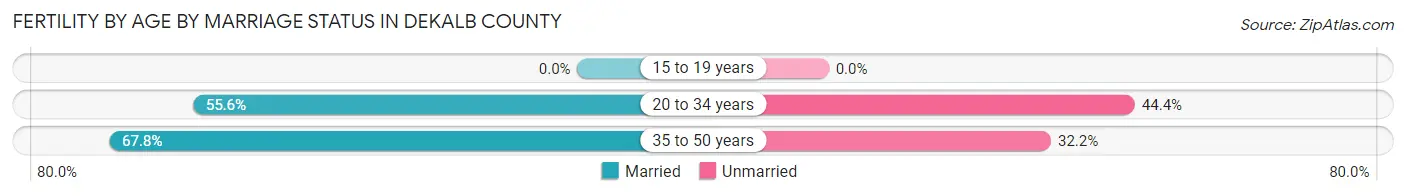
Fertility by Age by Marriage Status in DeKalb County
58.1% of women with births (1,189) in DeKalb County are married. The highest percentage of unmarried women with births falls into 20 to 34 years age bracket with 44.4% of them unmarried at the time of birth, while the lowest percentage of unmarried women with births belong to 35 to 50 years age bracket with 32.2% of them unmarried.
| Age Bracket | Married | Unmarried |
| 15 to 19 years | 0 (0.0%) | 0 (0.0%) |
| 20 to 34 years | 525 (55.6%) | 419 (44.4%) |
| 35 to 50 years | 166 (67.8%) | 79 (32.2%) |
| Total | 691 (58.1%) | 498 (41.9%) |
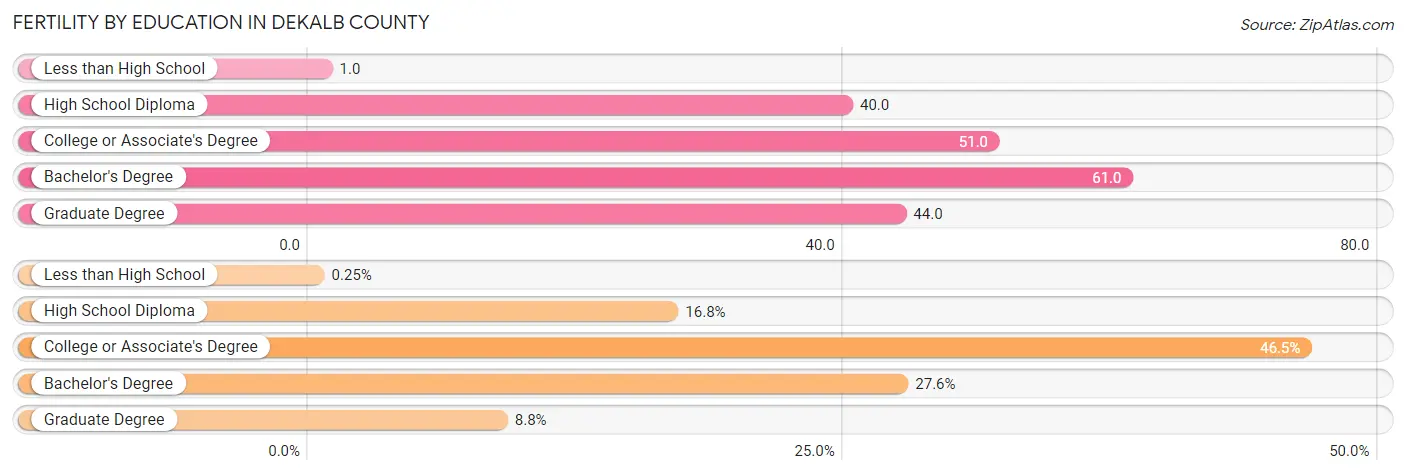
Fertility by Education in DeKalb County
Average fertility rate in DeKalb County is 45.0 births per 1,000 women. Women with the education attainment of bachelor's degree have the highest fertility rate of 61.0 births per 1,000 women, while women with the education attainment of less than high school have the lowest fertility at 1.0 births per 1,000 women. Women with the education attainment of college or associate's degree represent 46.5% of all women with births.
| Educational Attainment | Women with Births | Births / 1,000 Women |
| Less than High School | 3 (0.3%) | 1.0 |
| High School Diploma | 200 (16.8%) | 40.0 |
| College or Associate's Degree | 553 (46.5%) | 51.0 |
| Bachelor's Degree | 328 (27.6%) | 61.0 |
| Graduate Degree | 105 (8.8%) | 44.0 |
| Total | 1,189 (100.0%) | 45.0 |
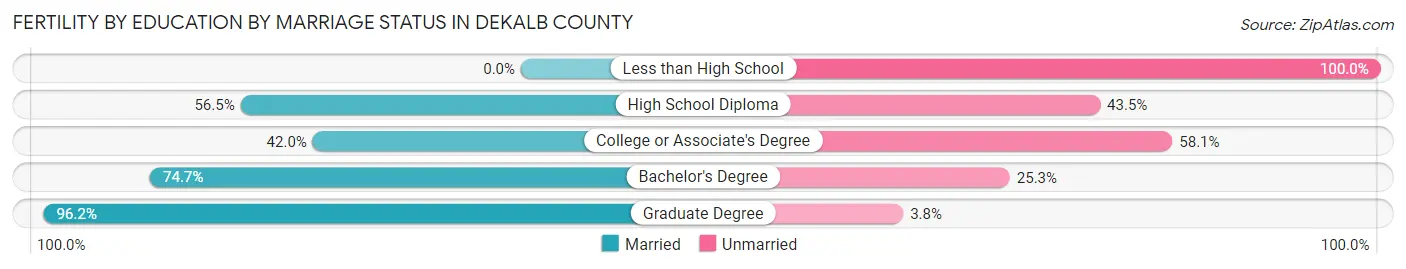
Fertility by Education by Marriage Status in DeKalb County
41.9% of women with births in DeKalb County are unmarried. Women with the educational attainment of graduate degree are most likely to be married with 96.2% of them married at childbirth, while women with the educational attainment of less than high school are least likely to be married with 100.0% of them unmarried at childbirth.
| Educational Attainment | Married | Unmarried |
| Less than High School | 0 (0.0%) | 3 (100.0%) |
| High School Diploma | 113 (56.5%) | 87 (43.5%) |
| College or Associate's Degree | 232 (41.9%) | 321 (58.1%) |
| Bachelor's Degree | 245 (74.7%) | 83 (25.3%) |
| Graduate Degree | 101 (96.2%) | 4 (3.8%) |
| Total | 691 (58.1%) | 498 (41.9%) |
Income in DeKalb County
Income Overview in DeKalb County
Per Capita Income in DeKalb County is $34,196, while median incomes of families and households are $91,538 and $68,617 respectively.
| Characteristic | Number | Measure |
| Per Capita Income | 100,686 | $34,196 |
| Median Family Income | 23,191 | $91,538 |
| Mean Family Income | 23,191 | $106,923 |
| Median Household Income | 39,139 | $68,617 |
| Mean Household Income | 39,139 | $86,040 |
| Income Deficit | 23,191 | $11,412 |
| Wage / Income Gap (%) | 100,686 | 43.03% |
| Wage / Income Gap ($) | 100,686 | 56.97¢ per $1 |
| Gini / Inequality Index | 100,686 | 0.44 |
Earnings by Sex in DeKalb County
Average Earnings in DeKalb County are $33,283, $43,539 for men and $24,806 for women, a difference of 43.0%.
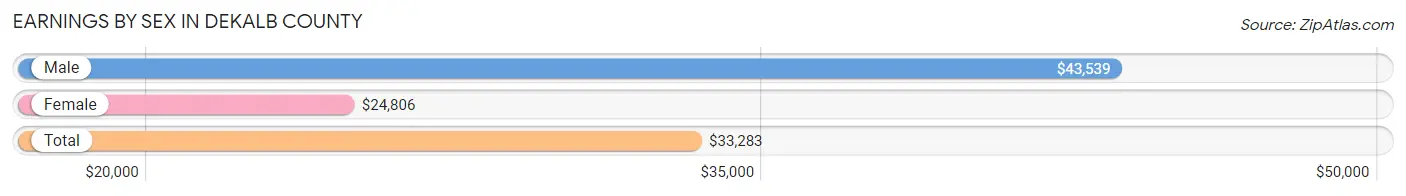
| Sex | Number | Average Earnings |
| Male | 30,809 (52.2%) | $43,539 |
| Female | 28,239 (47.8%) | $24,806 |
| Total | 59,048 (100.0%) | $33,283 |
Earnings by Sex by Income Bracket in DeKalb County
The most common earnings brackets in DeKalb County are $100,000+ for men (4,681 | 15.2%) and $2,499 or less for women (2,339 | 8.3%).
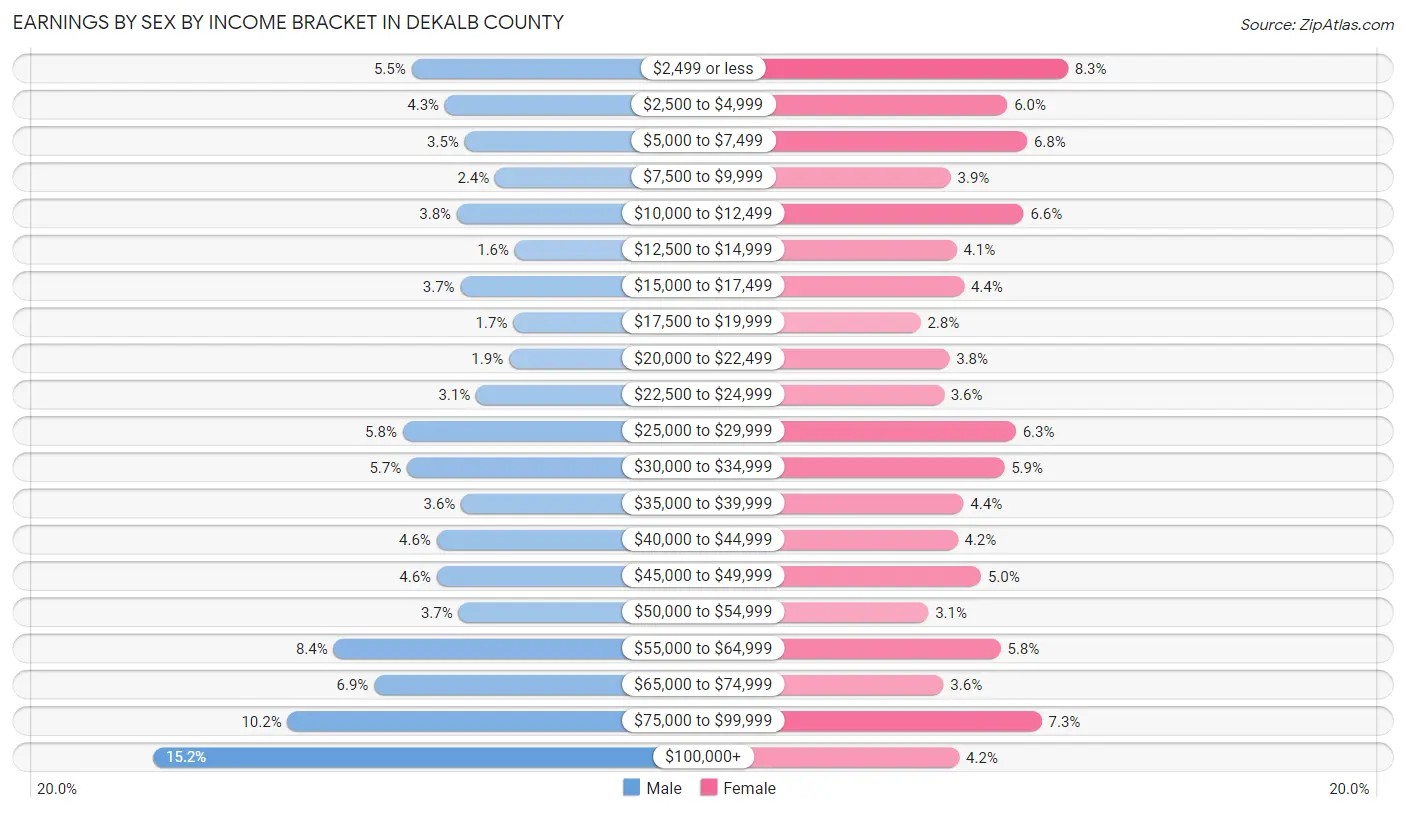
| Income | Male | Female |
| $2,499 or less | 1,693 (5.5%) | 2,339 (8.3%) |
| $2,500 to $4,999 | 1,310 (4.3%) | 1,696 (6.0%) |
| $5,000 to $7,499 | 1,082 (3.5%) | 1,906 (6.8%) |
| $7,500 to $9,999 | 731 (2.4%) | 1,098 (3.9%) |
| $10,000 to $12,499 | 1,170 (3.8%) | 1,870 (6.6%) |
| $12,500 to $14,999 | 502 (1.6%) | 1,161 (4.1%) |
| $15,000 to $17,499 | 1,130 (3.7%) | 1,241 (4.4%) |
| $17,500 to $19,999 | 521 (1.7%) | 779 (2.8%) |
| $20,000 to $22,499 | 571 (1.8%) | 1,085 (3.8%) |
| $22,500 to $24,999 | 948 (3.1%) | 1,024 (3.6%) |
| $25,000 to $29,999 | 1,795 (5.8%) | 1,787 (6.3%) |
| $30,000 to $34,999 | 1,748 (5.7%) | 1,666 (5.9%) |
| $35,000 to $39,999 | 1,120 (3.6%) | 1,235 (4.4%) |
| $40,000 to $44,999 | 1,405 (4.6%) | 1,172 (4.2%) |
| $45,000 to $49,999 | 1,402 (4.5%) | 1,421 (5.0%) |
| $50,000 to $54,999 | 1,152 (3.7%) | 860 (3.0%) |
| $55,000 to $64,999 | 2,595 (8.4%) | 1,627 (5.8%) |
| $65,000 to $74,999 | 2,125 (6.9%) | 1,021 (3.6%) |
| $75,000 to $99,999 | 3,128 (10.2%) | 2,061 (7.3%) |
| $100,000+ | 4,681 (15.2%) | 1,190 (4.2%) |
| Total | 30,809 (100.0%) | 28,239 (100.0%) |
Earnings by Sex by Educational Attainment in DeKalb County
Average earnings in DeKalb County are $58,449 for men and $35,640 for women, a difference of 39.0%. Men with an educational attainment of graduate degree enjoy the highest average annual earnings of $87,308, while those with less than high school education earn the least with $41,333. Women with an educational attainment of graduate degree earn the most with the average annual earnings of $62,041, while those with less than high school education have the smallest earnings of $22,008.
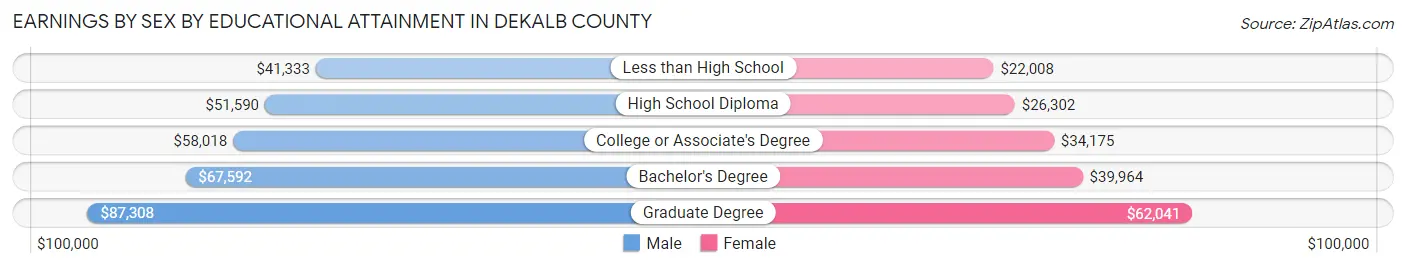
| Educational Attainment | Male Income | Female Income |
| Less than High School | $41,333 | $22,008 |
| High School Diploma | $51,590 | $26,302 |
| College or Associate's Degree | $58,018 | $34,175 |
| Bachelor's Degree | $67,592 | $39,964 |
| Graduate Degree | $87,308 | $62,041 |
| Total | $58,449 | $35,640 |
Family Income in DeKalb County
Family Income Brackets in DeKalb County
According to the DeKalb County family income data, there are 5,450 families falling into the $100,000 to $149,999 income range, which is the most common income bracket and makes up 23.5% of all families. Conversely, the $10,000 to $14,999 income bracket is the least frequent group with only 348 families (1.5%) belonging to this category.
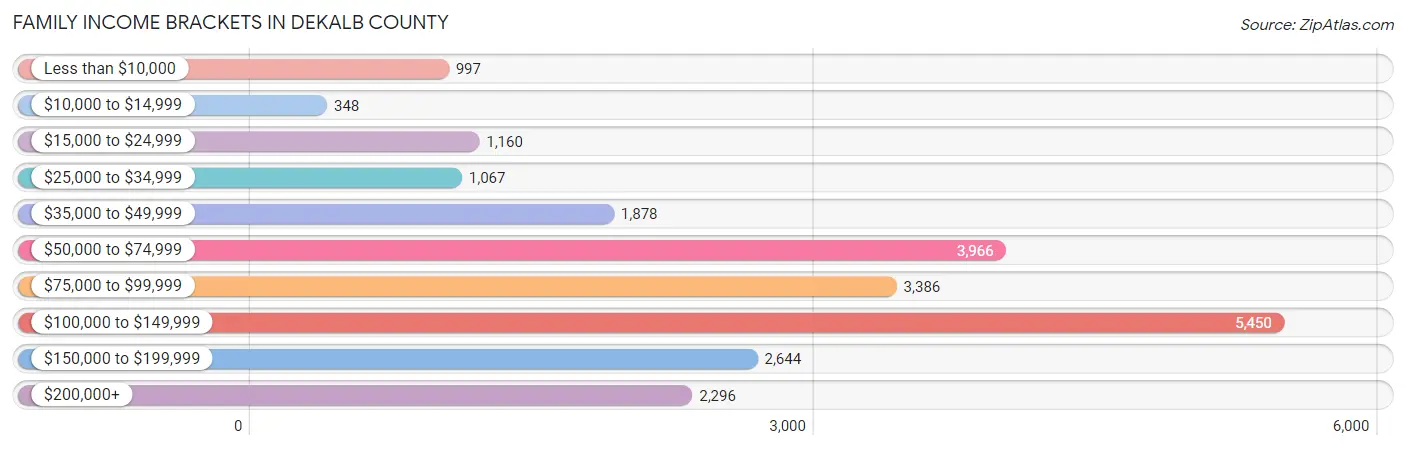
| Income Bracket | # Families | % Families |
| Less than $10,000 | 997 | 4.3% |
| $10,000 to $14,999 | 348 | 1.5% |
| $15,000 to $24,999 | 1,160 | 5.0% |
| $25,000 to $34,999 | 1,067 | 4.6% |
| $35,000 to $49,999 | 1,878 | 8.1% |
| $50,000 to $74,999 | 3,966 | 17.1% |
| $75,000 to $99,999 | 3,386 | 14.6% |
| $100,000 to $149,999 | 5,450 | 23.5% |
| $150,000 to $199,999 | 2,644 | 11.4% |
| $200,000+ | 2,296 | 9.9% |
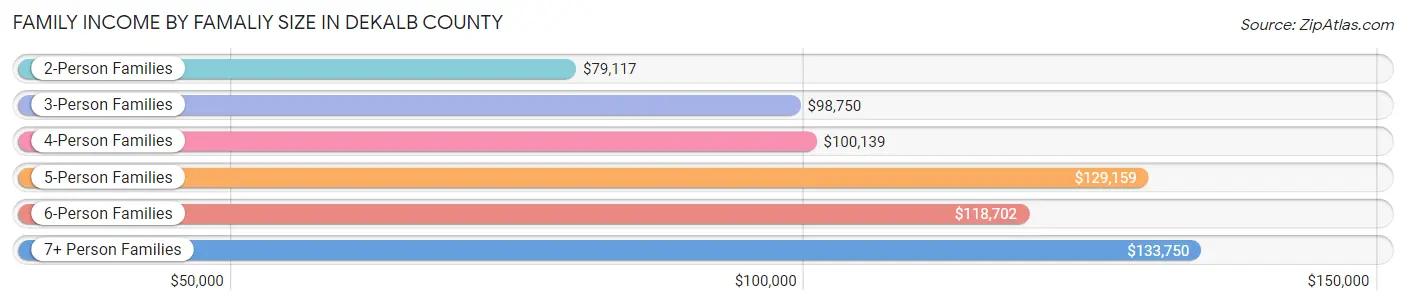
Family Income by Famaliy Size in DeKalb County
7+ person families (226 | 1.0%) account for the highest median family income in DeKalb County with $133,750 per family, while 2-person families (11,067 | 47.7%) have the highest median income of $39,558 per family member.
| Income Bracket | # Families | Median Income |
| 2-Person Families | 11,067 (47.7%) | $79,117 |
| 3-Person Families | 5,058 (21.8%) | $98,750 |
| 4-Person Families | 3,976 (17.1%) | $100,139 |
| 5-Person Families | 2,199 (9.5%) | $129,159 |
| 6-Person Families | 665 (2.9%) | $118,702 |
| 7+ Person Families | 226 (1.0%) | $133,750 |
| Total | 23,191 (100.0%) | $91,538 |
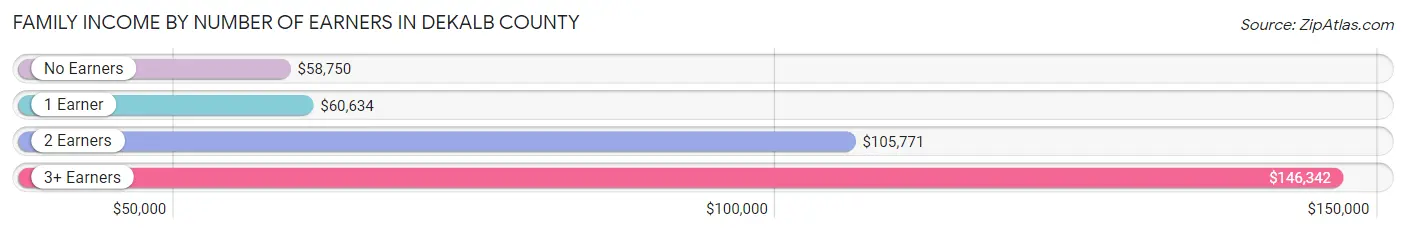
Family Income by Number of Earners in DeKalb County
The median family income in DeKalb County is $91,538, with families comprising 3+ earners (2,959) having the highest median family income of $146,342, while families with no earners (3,574) have the lowest median family income of $58,750, accounting for 12.8% and 15.4% of families, respectively.
| Number of Earners | # Families | Median Income |
| No Earners | 3,574 (15.4%) | $58,750 |
| 1 Earner | 6,630 (28.6%) | $60,634 |
| 2 Earners | 10,028 (43.2%) | $105,771 |
| 3+ Earners | 2,959 (12.8%) | $146,342 |
| Total | 23,191 (100.0%) | $91,538 |
Household Income in DeKalb County
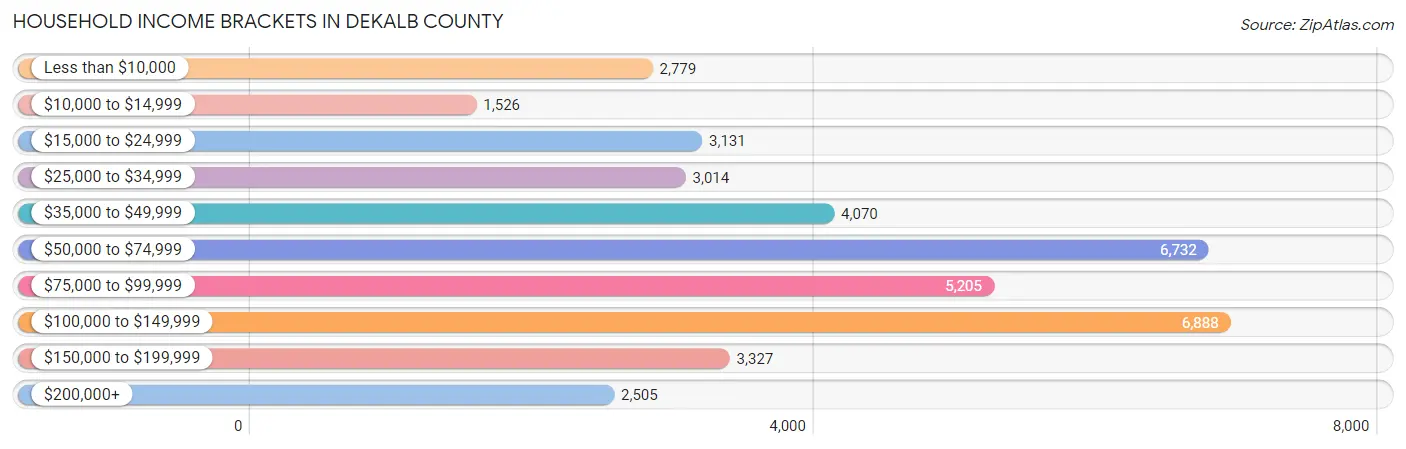
Household Income Brackets in DeKalb County
With 6,888 households falling in the category, the $100,000 to $149,999 income range is the most frequent in DeKalb County, accounting for 17.6% of all households. In contrast, only 1,526 households (3.9%) fall into the $10,000 to $14,999 income bracket, making it the least populous group.
| Income Bracket | # Households | % Households |
| Less than $10,000 | 2,779 | 7.1% |
| $10,000 to $14,999 | 1,526 | 3.9% |
| $15,000 to $24,999 | 3,131 | 8.0% |
| $25,000 to $34,999 | 3,014 | 7.7% |
| $35,000 to $49,999 | 4,070 | 10.4% |
| $50,000 to $74,999 | 6,732 | 17.2% |
| $75,000 to $99,999 | 5,205 | 13.3% |
| $100,000 to $149,999 | 6,888 | 17.6% |
| $150,000 to $199,999 | 3,327 | 8.5% |
| $200,000+ | 2,505 | 6.4% |
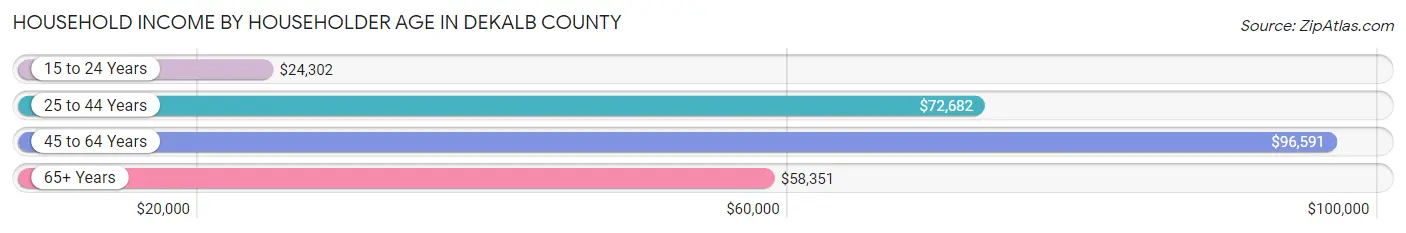
Household Income by Householder Age in DeKalb County
The median household income in DeKalb County is $68,617, with the highest median household income of $96,591 found in the 45 to 64 years age bracket for the primary householder. A total of 12,320 households (31.5%) fall into this category. Meanwhile, the 15 to 24 years age bracket for the primary householder has the lowest median household income of $24,302, with 4,877 households (12.5%) in this group.
| Income Bracket | # Households | Median Income |
| 15 to 24 Years | 4,877 (12.5%) | $24,302 |
| 25 to 44 Years | 13,525 (34.6%) | $72,682 |
| 45 to 64 Years | 12,320 (31.5%) | $96,591 |
| 65+ Years | 8,417 (21.5%) | $58,351 |
| Total | 39,139 (100.0%) | $68,617 |
Poverty in DeKalb County
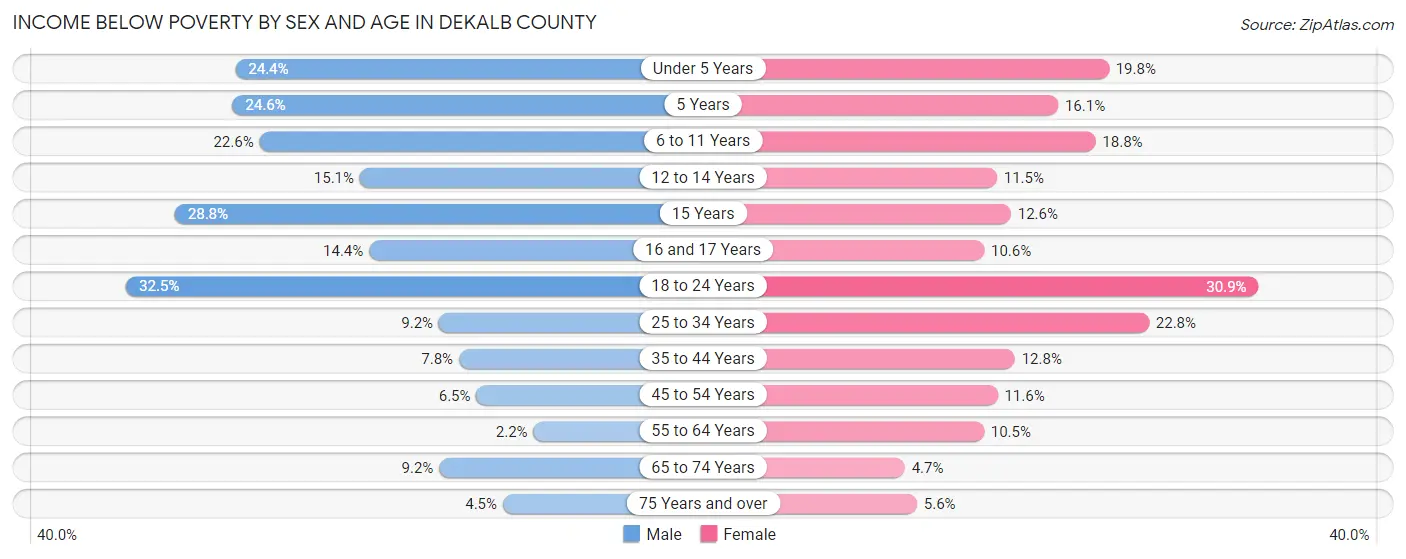
Income Below Poverty by Sex and Age in DeKalb County
With 14.4% poverty level for males and 16.3% for females among the residents of DeKalb County, 18 to 24 year old males and 18 to 24 year old females are the most vulnerable to poverty, with 2,667 males (32.5%) and 2,410 females (30.9%) in their respective age groups living below the poverty level.
| Age Bracket | Male | Female |
| Under 5 Years | 670 (24.3%) | 539 (19.8%) |
| 5 Years | 184 (24.6%) | 78 (16.1%) |
| 6 to 11 Years | 780 (22.6%) | 677 (18.8%) |
| 12 to 14 Years | 292 (15.1%) | 224 (11.5%) |
| 15 Years | 212 (28.8%) | 86 (12.6%) |
| 16 and 17 Years | 182 (14.4%) | 109 (10.6%) |
| 18 to 24 Years | 2,667 (32.5%) | 2,410 (30.9%) |
| 25 to 34 Years | 605 (9.2%) | 1,499 (22.8%) |
| 35 to 44 Years | 446 (7.7%) | 729 (12.8%) |
| 45 to 54 Years | 345 (6.5%) | 607 (11.6%) |
| 55 to 64 Years | 121 (2.2%) | 577 (10.5%) |
| 65 to 74 Years | 349 (9.2%) | 194 (4.7%) |
| 75 Years and over | 95 (4.5%) | 164 (5.6%) |
| Total | 6,948 (14.4%) | 7,893 (16.3%) |
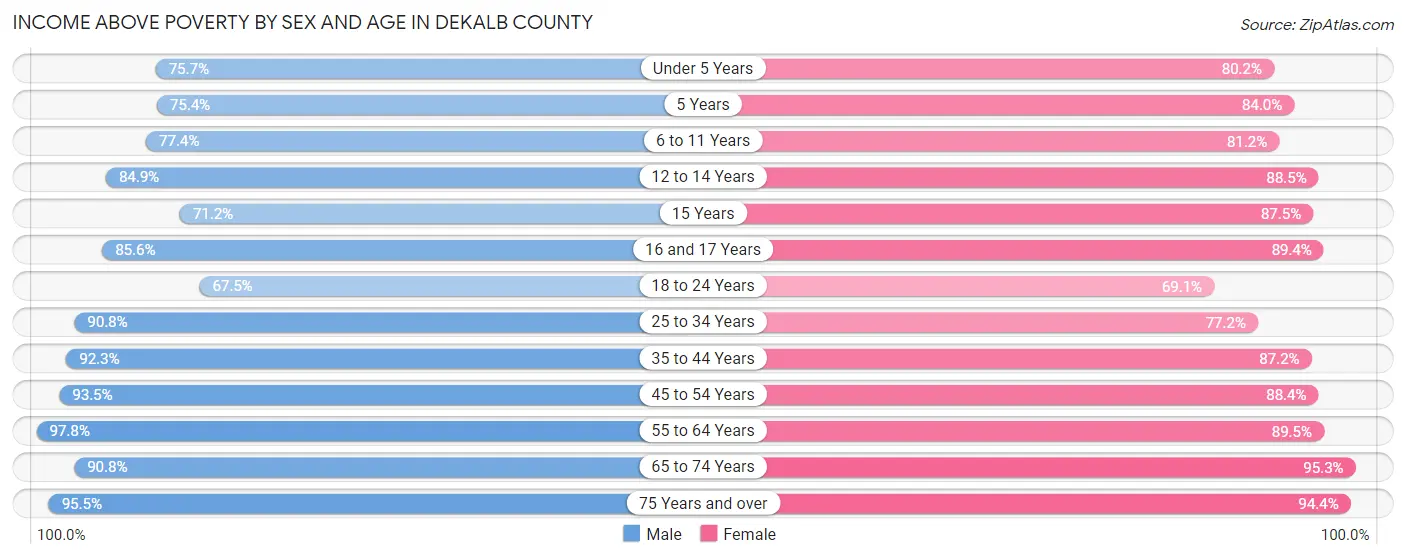
Income Above Poverty by Sex and Age in DeKalb County
According to the poverty statistics in DeKalb County, males aged 55 to 64 years and females aged 65 to 74 years are the age groups that are most secure financially, with 97.8% of males and 95.3% of females in these age groups living above the poverty line.
| Age Bracket | Male | Female |
| Under 5 Years | 2,081 (75.6%) | 2,180 (80.2%) |
| 5 Years | 565 (75.4%) | 408 (84.0%) |
| 6 to 11 Years | 2,678 (77.4%) | 2,919 (81.2%) |
| 12 to 14 Years | 1,641 (84.9%) | 1,722 (88.5%) |
| 15 Years | 523 (71.2%) | 599 (87.5%) |
| 16 and 17 Years | 1,080 (85.6%) | 923 (89.4%) |
| 18 to 24 Years | 5,549 (67.5%) | 5,381 (69.1%) |
| 25 to 34 Years | 5,945 (90.8%) | 5,076 (77.2%) |
| 35 to 44 Years | 5,311 (92.2%) | 4,949 (87.2%) |
| 45 to 54 Years | 4,996 (93.5%) | 4,642 (88.4%) |
| 55 to 64 Years | 5,325 (97.8%) | 4,898 (89.5%) |
| 65 to 74 Years | 3,438 (90.8%) | 3,957 (95.3%) |
| 75 Years and over | 2,020 (95.5%) | 2,778 (94.4%) |
| Total | 41,152 (85.6%) | 40,432 (83.7%) |
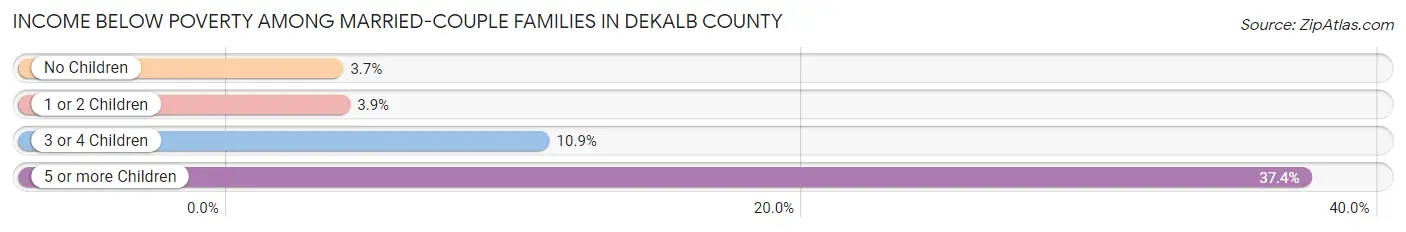
Income Below Poverty Among Married-Couple Families in DeKalb County
The poverty statistics for married-couple families in DeKalb County show that 4.7% or 797 of the total 17,091 families live below the poverty line. Families with 5 or more children have the highest poverty rate of 37.4%, comprising of 37 families. On the other hand, families with no children have the lowest poverty rate of 3.7%, which includes 360 families.
| Children | Above Poverty | Below Poverty |
| No Children | 9,444 (96.3%) | 360 (3.7%) |
| 1 or 2 Children | 5,260 (96.1%) | 214 (3.9%) |
| 3 or 4 Children | 1,528 (89.1%) | 186 (10.8%) |
| 5 or more Children | 62 (62.6%) | 37 (37.4%) |
| Total | 16,294 (95.3%) | 797 (4.7%) |
Income Below Poverty Among Single-Parent Households in DeKalb County
According to the poverty data in DeKalb County, 13.0% or 231 single-father households and 30.5% or 1,315 single-mother households are living below the poverty line. Among single-father households, those with 3 or 4 children have the highest poverty rate, with 33 households (17.4%) experiencing poverty. Likewise, among single-mother households, those with 5 or more children have the highest poverty rate, with 35 households (100.0%) falling below the poverty line.

| Children | Single Father | Single Mother |
| No Children | 86 (13.0%) | 191 (12.8%) |
| 1 or 2 Children | 112 (12.1%) | 593 (28.8%) |
| 3 or 4 Children | 33 (17.4%) | 496 (68.1%) |
| 5 or more Children | 0 (0.0%) | 35 (100.0%) |
| Total | 231 (13.0%) | 1,315 (30.5%) |
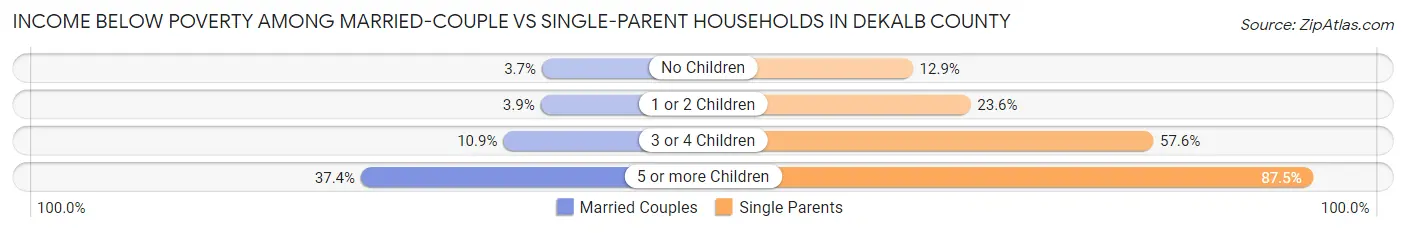
Income Below Poverty Among Married-Couple vs Single-Parent Households in DeKalb County
The poverty data for DeKalb County shows that 797 of the married-couple family households (4.7%) and 1,546 of the single-parent households (25.3%) are living below the poverty level. Within the married-couple family households, those with 5 or more children have the highest poverty rate, with 37 households (37.4%) falling below the poverty line. Among the single-parent households, those with 5 or more children have the highest poverty rate, with 35 household (87.5%) living below poverty.
| Children | Married-Couple Families | Single-Parent Households |
| No Children | 360 (3.7%) | 277 (12.9%) |
| 1 or 2 Children | 214 (3.9%) | 705 (23.6%) |
| 3 or 4 Children | 186 (10.8%) | 529 (57.6%) |
| 5 or more Children | 37 (37.4%) | 35 (87.5%) |
| Total | 797 (4.7%) | 1,546 (25.3%) |
Employment Characteristics in DeKalb County
Employment by Class of Employer in DeKalb County
Among the 50,485 employed individuals in DeKalb County, private company employees (33,684 | 66.7%), local government employees (4,268 | 8.5%), and not-for-profit organizations (3,953 | 7.8%) make up the most common classes of employment.
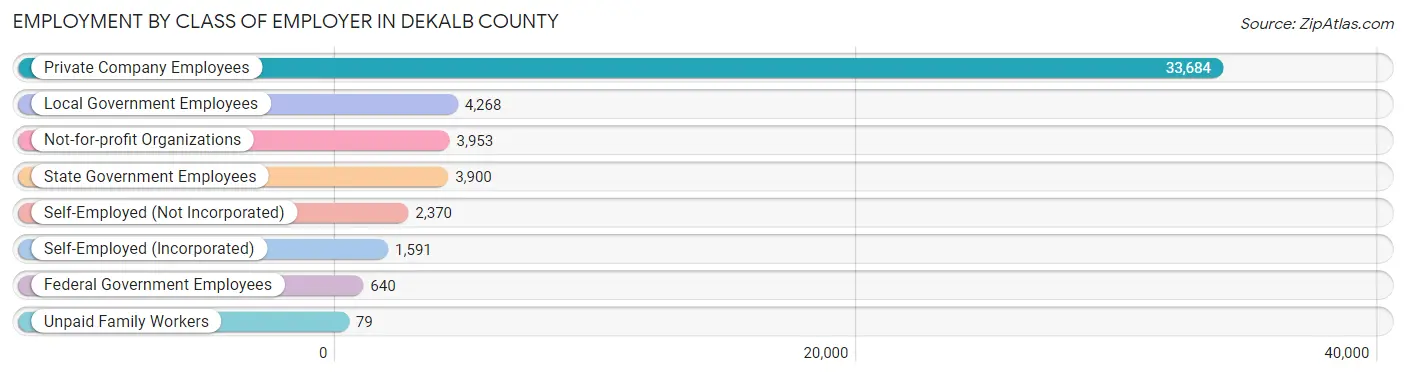
| Employer Class | # Employees | % Employees |
| Private Company Employees | 33,684 | 66.7% |
| Self-Employed (Incorporated) | 1,591 | 3.2% |
| Self-Employed (Not Incorporated) | 2,370 | 4.7% |
| Not-for-profit Organizations | 3,953 | 7.8% |
| Local Government Employees | 4,268 | 8.5% |
| State Government Employees | 3,900 | 7.7% |
| Federal Government Employees | 640 | 1.3% |
| Unpaid Family Workers | 79 | 0.2% |
| Total | 50,485 | 100.0% |
Employment Status by Age in DeKalb County
According to the labor force statistics for DeKalb County, out of the total population over 16 years of age (81,367), 68.3% or 55,574 individuals are in the labor force, with 7.0% or 3,890 of them unemployed. The age group with the highest labor force participation rate is 30 to 34 years, with 89.8% or 5,701 individuals in the labor force. Within the labor force, the 16 to 19 years age range has the highest percentage of unemployed individuals, with 17.8% or 687 of them being unemployed.
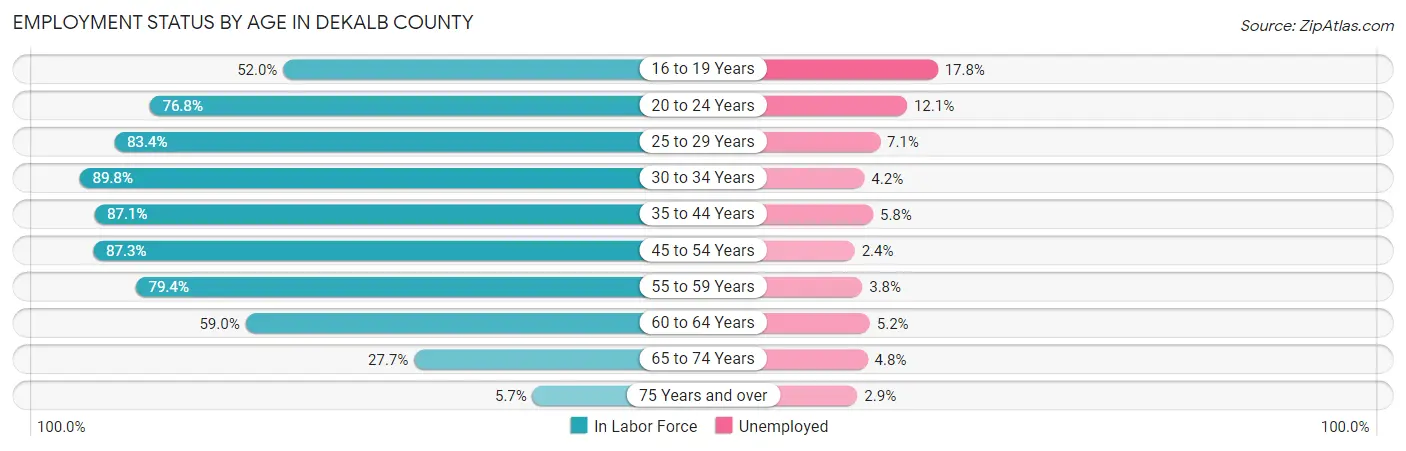
| Age Bracket | In Labor Force | Unemployed |
| 16 to 19 Years | 3,860 (52.0%) | 687 (17.8%) |
| 20 to 24 Years | 10,840 (76.8%) | 1,312 (12.1%) |
| 25 to 29 Years | 5,764 (83.4%) | 409 (7.1%) |
| 30 to 34 Years | 5,701 (89.8%) | 239 (4.2%) |
| 35 to 44 Years | 9,981 (87.1%) | 579 (5.8%) |
| 45 to 54 Years | 9,249 (87.3%) | 222 (2.4%) |
| 55 to 59 Years | 4,621 (79.4%) | 176 (3.8%) |
| 60 to 64 Years | 3,031 (59.0%) | 158 (5.2%) |
| 65 to 74 Years | 2,221 (27.7%) | 107 (4.8%) |
| 75 Years and over | 316 (5.7%) | 9 (2.9%) |
| Total | 55,574 (68.3%) | 3,890 (7.0%) |
Employment Status by Educational Attainment in DeKalb County
According to labor force statistics for DeKalb County, 82.9% of individuals (38,358) out of the total population between 25 and 64 years of age (46,270) are in the labor force, with 4.7% or 1,803 of them being unemployed. The group with the highest labor force participation rate are those with the educational attainment of bachelor's degree or higher, with 86.8% or 14,051 individuals in the labor force. Within the labor force, individuals with high school diploma education have the highest percentage of unemployment, with 8.1% or 704 of them being unemployed.
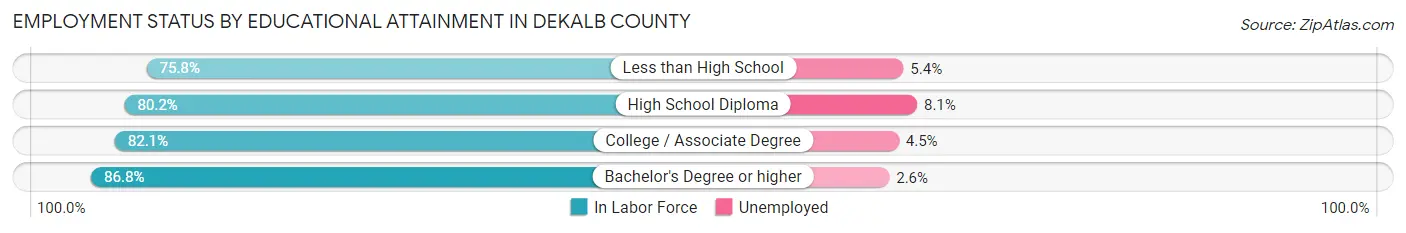
| Educational Attainment | In Labor Force | Unemployed |
| Less than High School | 2,218 (75.8%) | 158 (5.4%) |
| High School Diploma | 8,690 (80.2%) | 878 (8.1%) |
| College / Associate Degree | 13,399 (82.1%) | 734 (4.5%) |
| Bachelor's Degree or higher | 14,051 (86.8%) | 421 (2.6%) |
| Total | 38,358 (82.9%) | 2,175 (4.7%) |
Employment Occupations by Sex in DeKalb County
Management, Business, Science and Arts Occupations
The most common Management, Business, Science and Arts occupations in DeKalb County are Community & Social Service (6,854 | 13.3%), Education Instruction & Library (4,547 | 8.8%), Management (4,273 | 8.3%), Health Diagnosing & Treating (3,139 | 6.1%), and Computers, Engineering & Science (2,081 | 4.0%).
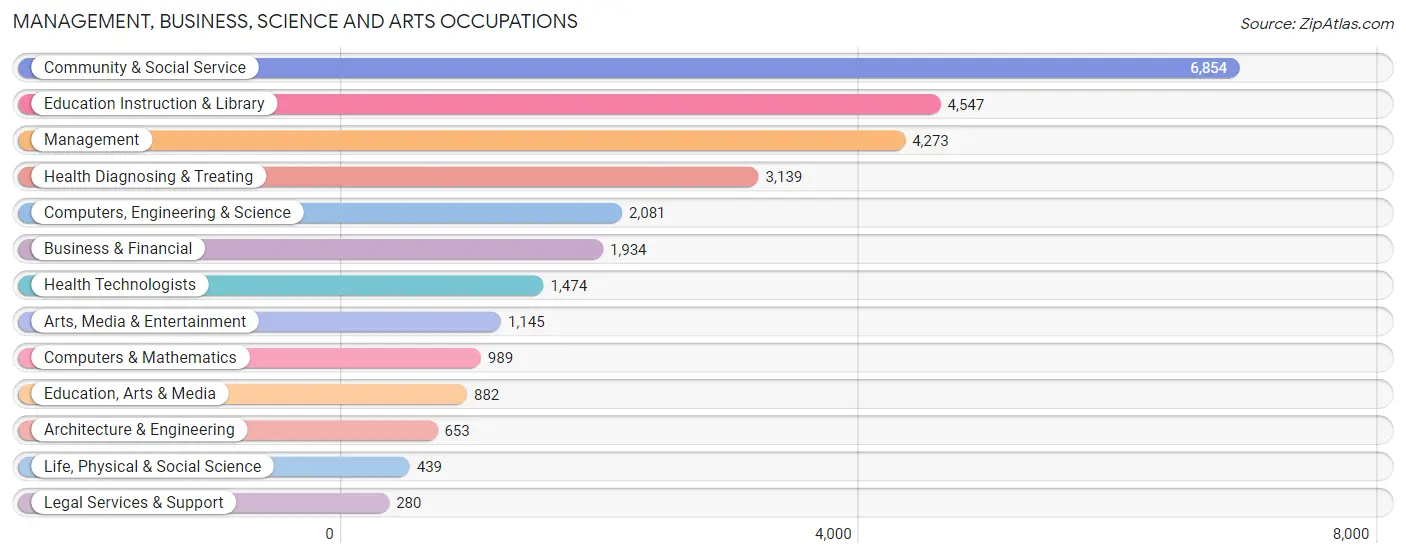
Management, Business, Science and Arts Occupations by Sex
Within the Management, Business, Science and Arts occupations in DeKalb County, the most male-oriented occupations are Architecture & Engineering (88.1%), Computers & Mathematics (78.3%), and Computers, Engineering & Science (73.3%), while the most female-oriented occupations are Health Technologists (79.9%), Health Diagnosing & Treating (76.3%), and Education, Arts & Media (71.2%).
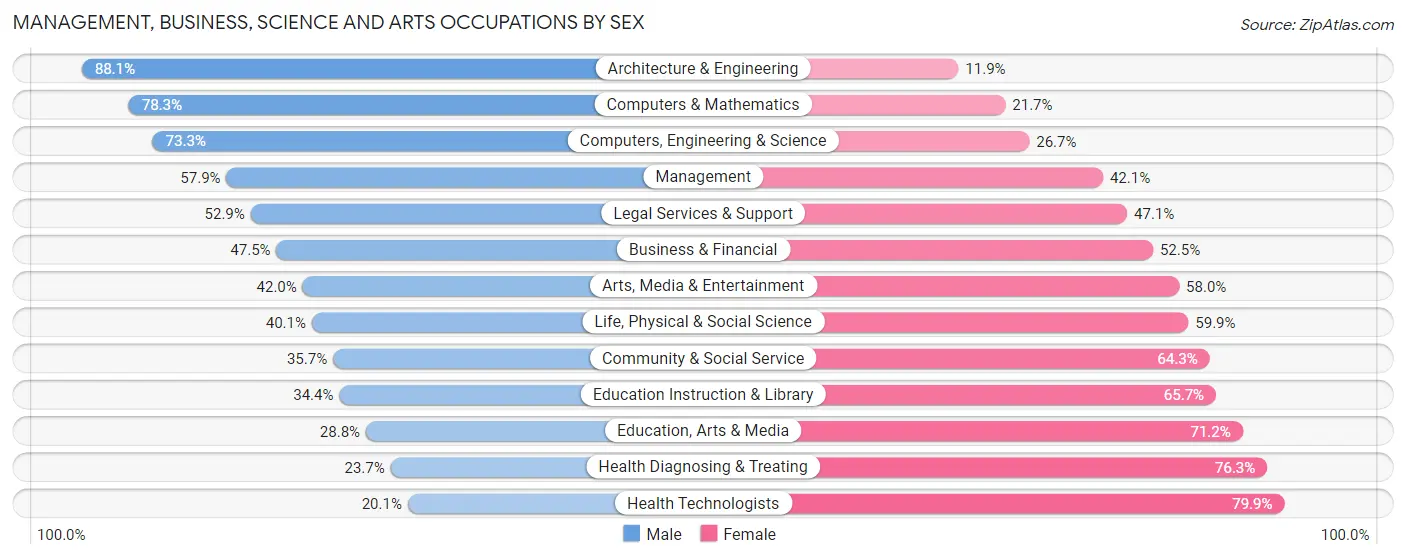
| Occupation | Male | Female |
| Management | 2,474 (57.9%) | 1,799 (42.1%) |
| Business & Financial | 918 (47.5%) | 1,016 (52.5%) |
| Computers, Engineering & Science | 1,525 (73.3%) | 556 (26.7%) |
| Computers & Mathematics | 774 (78.3%) | 215 (21.7%) |
| Architecture & Engineering | 575 (88.1%) | 78 (11.9%) |
| Life, Physical & Social Science | 176 (40.1%) | 263 (59.9%) |
| Community & Social Service | 2,445 (35.7%) | 4,409 (64.3%) |
| Education, Arts & Media | 254 (28.8%) | 628 (71.2%) |
| Legal Services & Support | 148 (52.9%) | 132 (47.1%) |
| Education Instruction & Library | 1,562 (34.4%) | 2,985 (65.6%) |
| Arts, Media & Entertainment | 481 (42.0%) | 664 (58.0%) |
| Health Diagnosing & Treating | 743 (23.7%) | 2,396 (76.3%) |
| Health Technologists | 296 (20.1%) | 1,178 (79.9%) |
| Total (Category) | 8,105 (44.3%) | 10,176 (55.7%) |
| Total (Overall) | 26,985 (52.3%) | 24,643 (47.7%) |
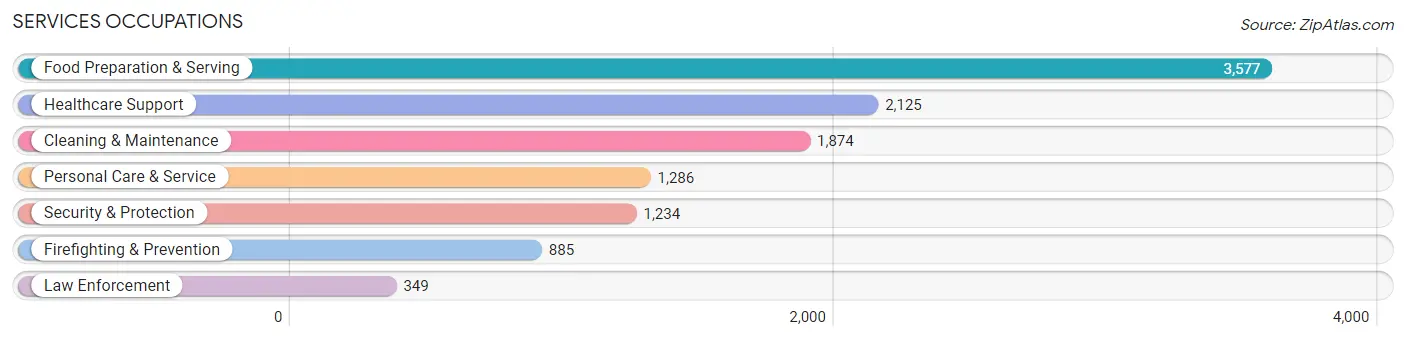
Services Occupations
The most common Services occupations in DeKalb County are Food Preparation & Serving (3,577 | 6.9%), Healthcare Support (2,125 | 4.1%), Cleaning & Maintenance (1,874 | 3.6%), Personal Care & Service (1,286 | 2.5%), and Security & Protection (1,234 | 2.4%).
Services Occupations by Sex
Within the Services occupations in DeKalb County, the most male-oriented occupations are Firefighting & Prevention (74.4%), Security & Protection (72.9%), and Law Enforcement (69.1%), while the most female-oriented occupations are Healthcare Support (90.9%), Personal Care & Service (84.2%), and Food Preparation & Serving (57.3%).
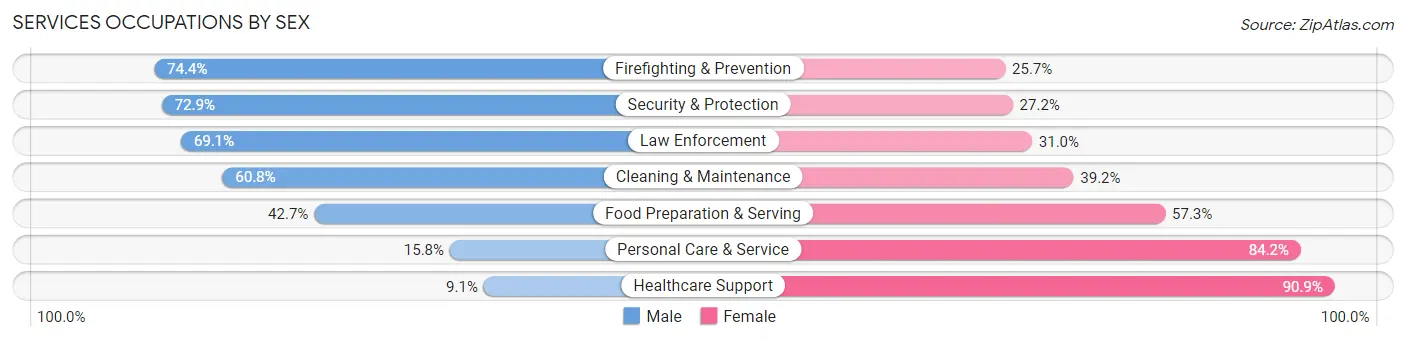
| Occupation | Male | Female |
| Healthcare Support | 193 (9.1%) | 1,932 (90.9%) |
| Security & Protection | 899 (72.9%) | 335 (27.2%) |
| Firefighting & Prevention | 658 (74.4%) | 227 (25.7%) |
| Law Enforcement | 241 (69.1%) | 108 (30.9%) |
| Food Preparation & Serving | 1,526 (42.7%) | 2,051 (57.3%) |
| Cleaning & Maintenance | 1,140 (60.8%) | 734 (39.2%) |
| Personal Care & Service | 203 (15.8%) | 1,083 (84.2%) |
| Total (Category) | 3,961 (39.2%) | 6,135 (60.8%) |
| Total (Overall) | 26,985 (52.3%) | 24,643 (47.7%) |
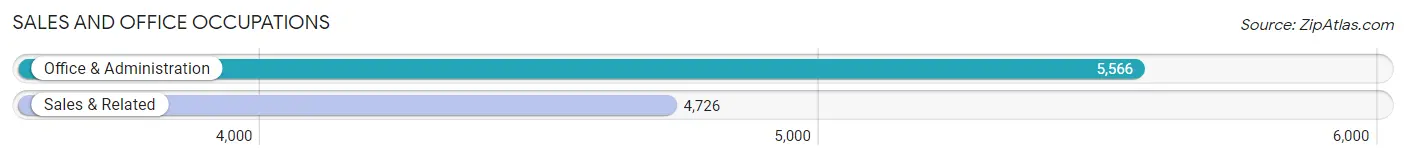
Sales and Office Occupations
The most common Sales and Office occupations in DeKalb County are Office & Administration (5,566 | 10.8%), and Sales & Related (4,726 | 9.1%).
Sales and Office Occupations by Sex
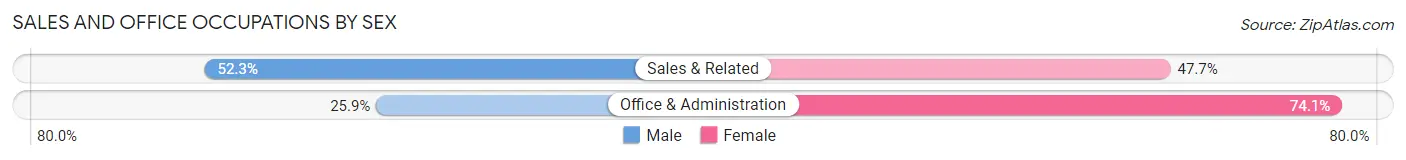
| Occupation | Male | Female |
| Sales & Related | 2,472 (52.3%) | 2,254 (47.7%) |
| Office & Administration | 1,442 (25.9%) | 4,124 (74.1%) |
| Total (Category) | 3,914 (38.0%) | 6,378 (62.0%) |
| Total (Overall) | 26,985 (52.3%) | 24,643 (47.7%) |
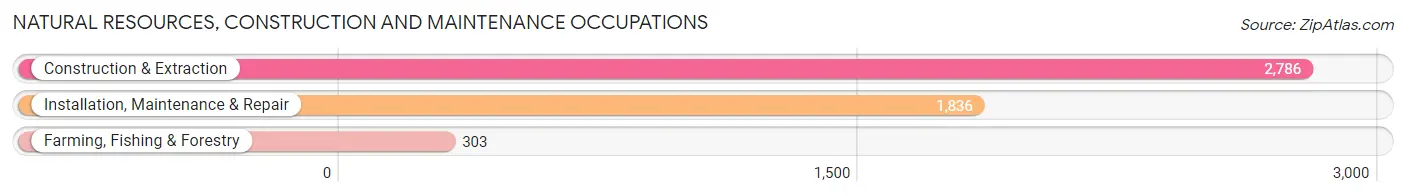
Natural Resources, Construction and Maintenance Occupations
The most common Natural Resources, Construction and Maintenance occupations in DeKalb County are Construction & Extraction (2,786 | 5.4%), Installation, Maintenance & Repair (1,836 | 3.6%), and Farming, Fishing & Forestry (303 | 0.6%).
Natural Resources, Construction and Maintenance Occupations by Sex
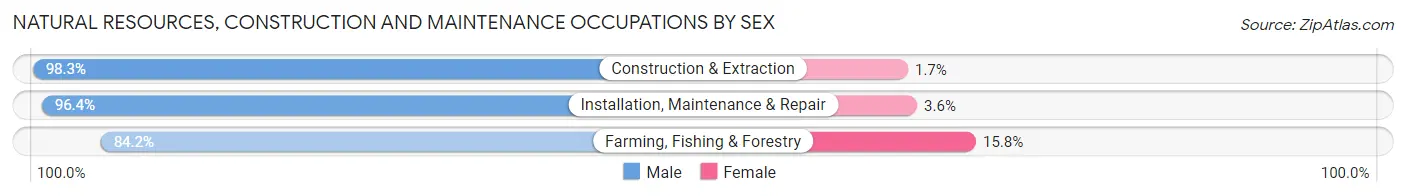
| Occupation | Male | Female |
| Farming, Fishing & Forestry | 255 (84.2%) | 48 (15.8%) |
| Construction & Extraction | 2,739 (98.3%) | 47 (1.7%) |
| Installation, Maintenance & Repair | 1,770 (96.4%) | 66 (3.6%) |
| Total (Category) | 4,764 (96.7%) | 161 (3.3%) |
| Total (Overall) | 26,985 (52.3%) | 24,643 (47.7%) |
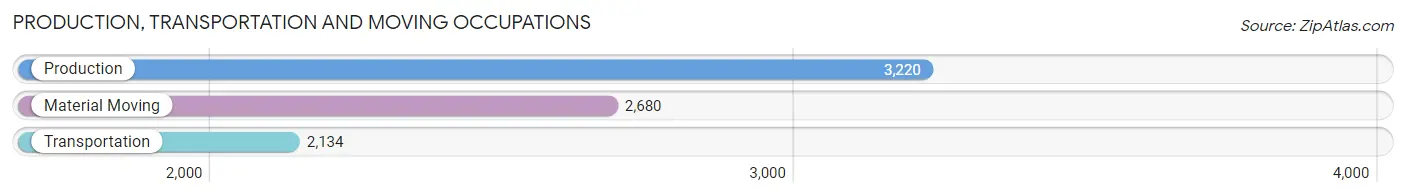
Production, Transportation and Moving Occupations
The most common Production, Transportation and Moving occupations in DeKalb County are Production (3,220 | 6.2%), Material Moving (2,680 | 5.2%), and Transportation (2,134 | 4.1%).
Production, Transportation and Moving Occupations by Sex
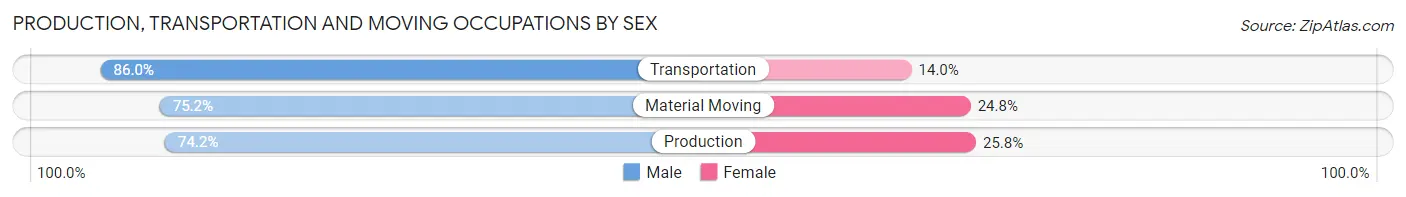
| Occupation | Male | Female |
| Production | 2,390 (74.2%) | 830 (25.8%) |
| Transportation | 1,836 (86.0%) | 298 (14.0%) |
| Material Moving | 2,015 (75.2%) | 665 (24.8%) |
| Total (Category) | 6,241 (77.7%) | 1,793 (22.3%) |
| Total (Overall) | 26,985 (52.3%) | 24,643 (47.7%) |
Employment Industries by Sex in DeKalb County
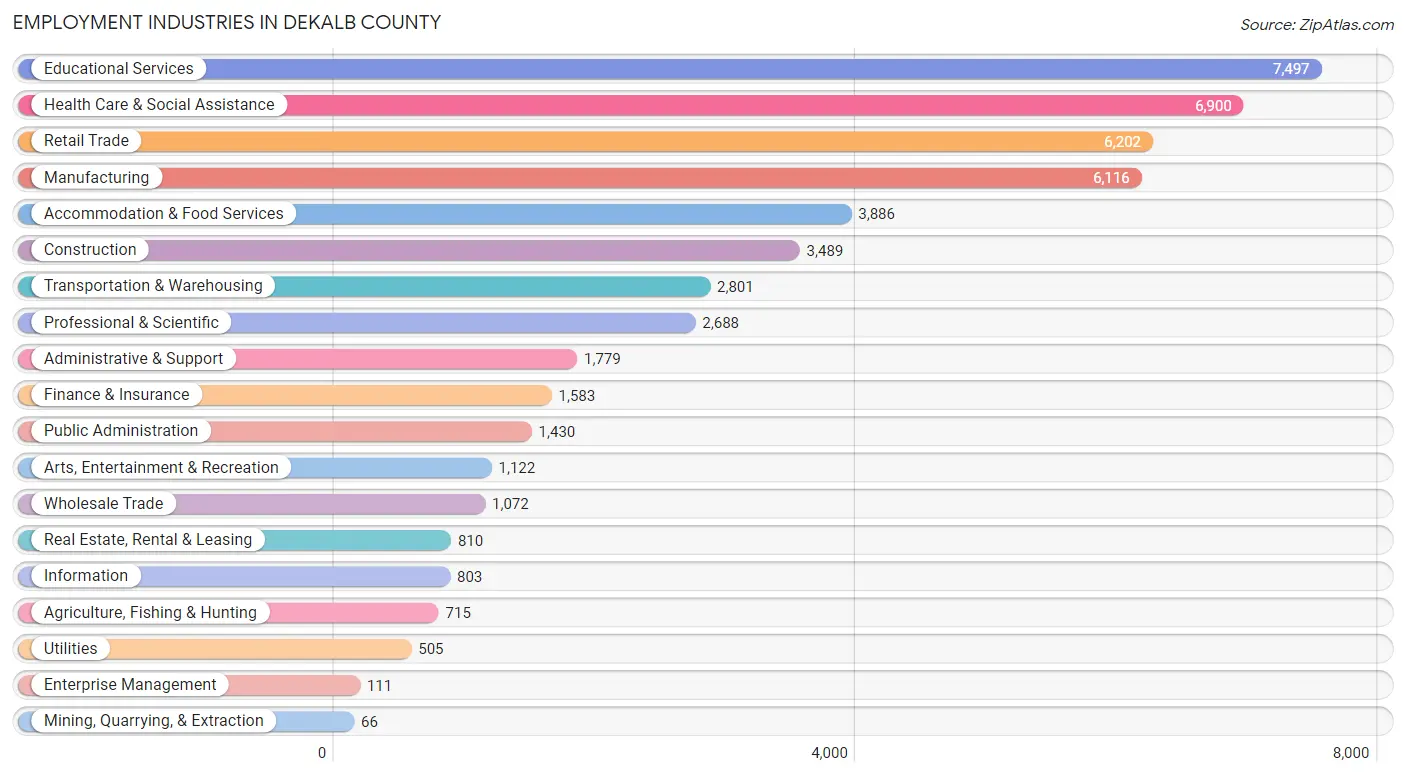
Employment Industries in DeKalb County
The major employment industries in DeKalb County include Educational Services (7,497 | 14.5%), Health Care & Social Assistance (6,900 | 13.4%), Retail Trade (6,202 | 12.0%), Manufacturing (6,116 | 11.8%), and Accommodation & Food Services (3,886 | 7.5%).
Employment Industries by Sex in DeKalb County
The DeKalb County industries that see more men than women are Construction (90.7%), Transportation & Warehousing (77.5%), and Utilities (77.2%), whereas the industries that tend to have a higher number of women are Health Care & Social Assistance (82.9%), Educational Services (60.5%), and Arts, Entertainment & Recreation (56.2%).
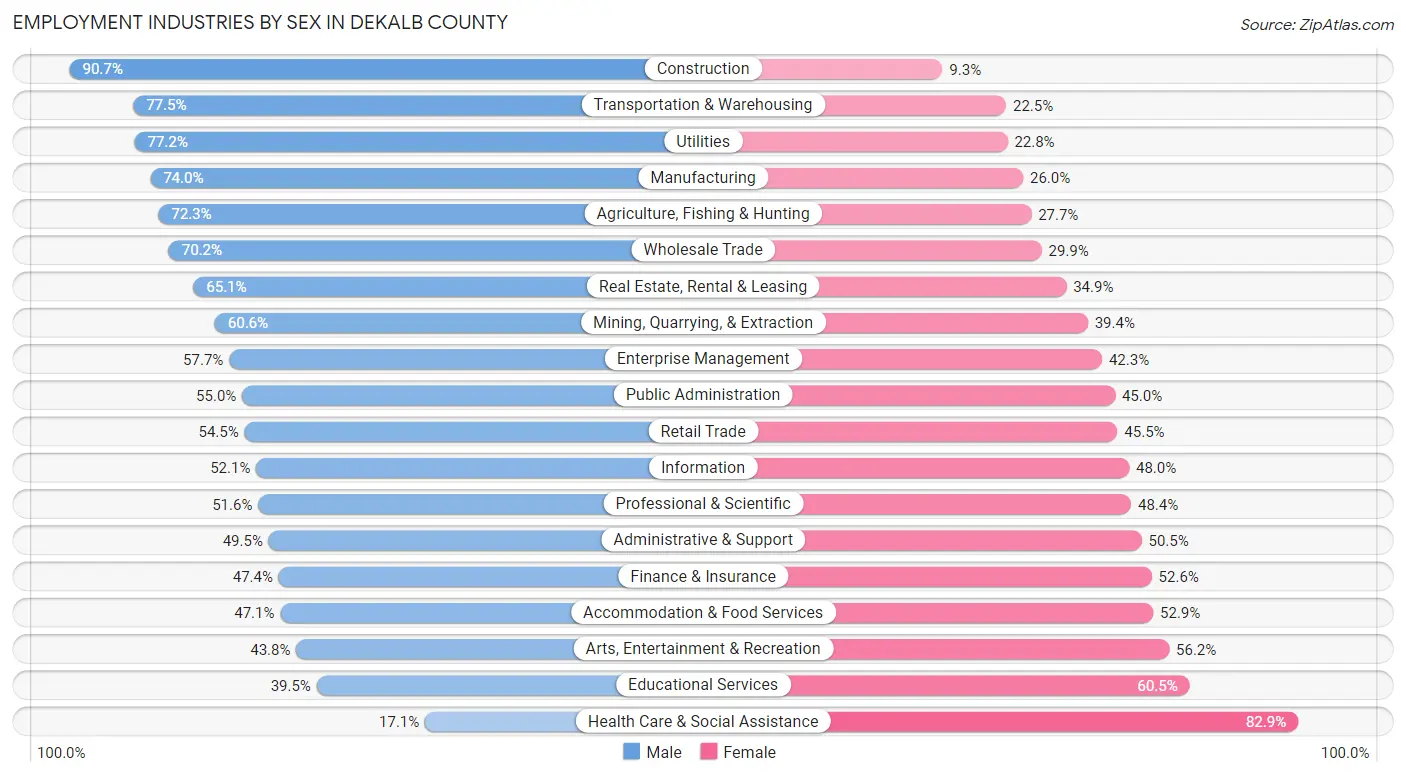
| Industry | Male | Female |
| Agriculture, Fishing & Hunting | 517 (72.3%) | 198 (27.7%) |
| Mining, Quarrying, & Extraction | 40 (60.6%) | 26 (39.4%) |
| Construction | 3,164 (90.7%) | 325 (9.3%) |
| Manufacturing | 4,525 (74.0%) | 1,591 (26.0%) |
| Wholesale Trade | 752 (70.2%) | 320 (29.8%) |
| Retail Trade | 3,378 (54.5%) | 2,824 (45.5%) |
| Transportation & Warehousing | 2,171 (77.5%) | 630 (22.5%) |
| Utilities | 390 (77.2%) | 115 (22.8%) |
| Information | 418 (52.0%) | 385 (47.9%) |
| Finance & Insurance | 750 (47.4%) | 833 (52.6%) |
| Real Estate, Rental & Leasing | 527 (65.1%) | 283 (34.9%) |
| Professional & Scientific | 1,388 (51.6%) | 1,300 (48.4%) |
| Enterprise Management | 64 (57.7%) | 47 (42.3%) |
| Administrative & Support | 880 (49.5%) | 899 (50.5%) |
| Educational Services | 2,964 (39.5%) | 4,533 (60.5%) |
| Health Care & Social Assistance | 1,180 (17.1%) | 5,720 (82.9%) |
| Arts, Entertainment & Recreation | 491 (43.8%) | 631 (56.2%) |
| Accommodation & Food Services | 1,829 (47.1%) | 2,057 (52.9%) |
| Public Administration | 786 (55.0%) | 644 (45.0%) |
| Total | 26,985 (52.3%) | 24,643 (47.7%) |
Education in DeKalb County
School Enrollment in DeKalb County
The most common levels of schooling among the 32,992 students in DeKalb County are college / undergraduate (12,621 | 38.3%), high school (5,433 | 16.5%), and middle school (5,186 | 15.7%).
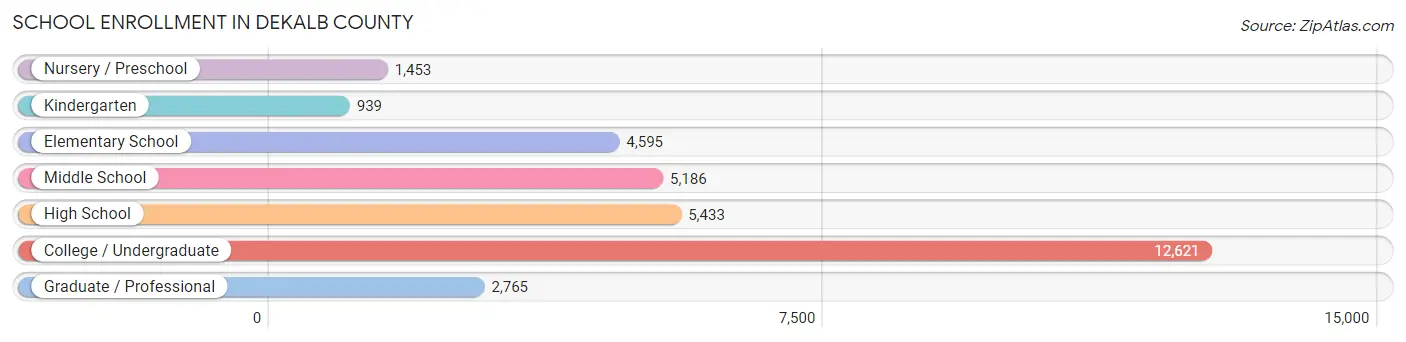
| School Level | # Students | % Students |
| Nursery / Preschool | 1,453 | 4.4% |
| Kindergarten | 939 | 2.9% |
| Elementary School | 4,595 | 13.9% |
| Middle School | 5,186 | 15.7% |
| High School | 5,433 | 16.5% |
| College / Undergraduate | 12,621 | 38.3% |
| Graduate / Professional | 2,765 | 8.4% |
| Total | 32,992 | 100.0% |
School Enrollment by Age by Funding Source in DeKalb County
Out of a total of 32,992 students who are enrolled in schools in DeKalb County, 3,332 (10.1%) attend a private institution, while the remaining 29,660 (89.9%) are enrolled in public schools. The age group of 3 to 4 year olds has the highest likelihood of being enrolled in private schools, with 413 (43.2% in the age bracket) enrolled. Conversely, the age group of 15 to 17 year olds has the lowest likelihood of being enrolled in a private school, with 3,453 (93.7% in the age bracket) attending a public institution.
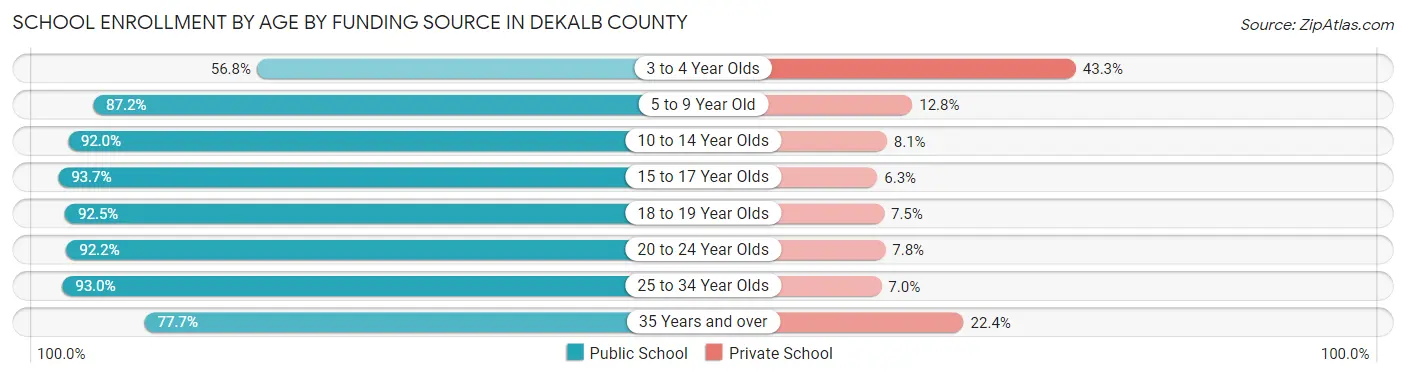
| Age Bracket | Public School | Private School |
| 3 to 4 Year Olds | 542 (56.8%) | 413 (43.2%) |
| 5 to 9 Year Old | 4,770 (87.2%) | 699 (12.8%) |
| 10 to 14 Year Olds | 5,893 (91.9%) | 516 (8.1%) |
| 15 to 17 Year Olds | 3,453 (93.7%) | 231 (6.3%) |
| 18 to 19 Year Olds | 3,948 (92.5%) | 321 (7.5%) |
| 20 to 24 Year Olds | 7,795 (92.2%) | 657 (7.8%) |
| 25 to 34 Year Olds | 2,051 (93.0%) | 155 (7.0%) |
| 35 Years and over | 1,202 (77.6%) | 346 (22.4%) |
| Total | 29,660 (89.9%) | 3,332 (10.1%) |
Educational Attainment by Field of Study in DeKalb County
Business (3,512 | 15.8%), education (3,506 | 15.8%), science & technology (2,399 | 10.8%), social sciences (1,712 | 7.7%), and arts & humanities (1,407 | 6.3%) are the most common fields of study among 22,234 individuals in DeKalb County who have obtained a bachelor's degree or higher.
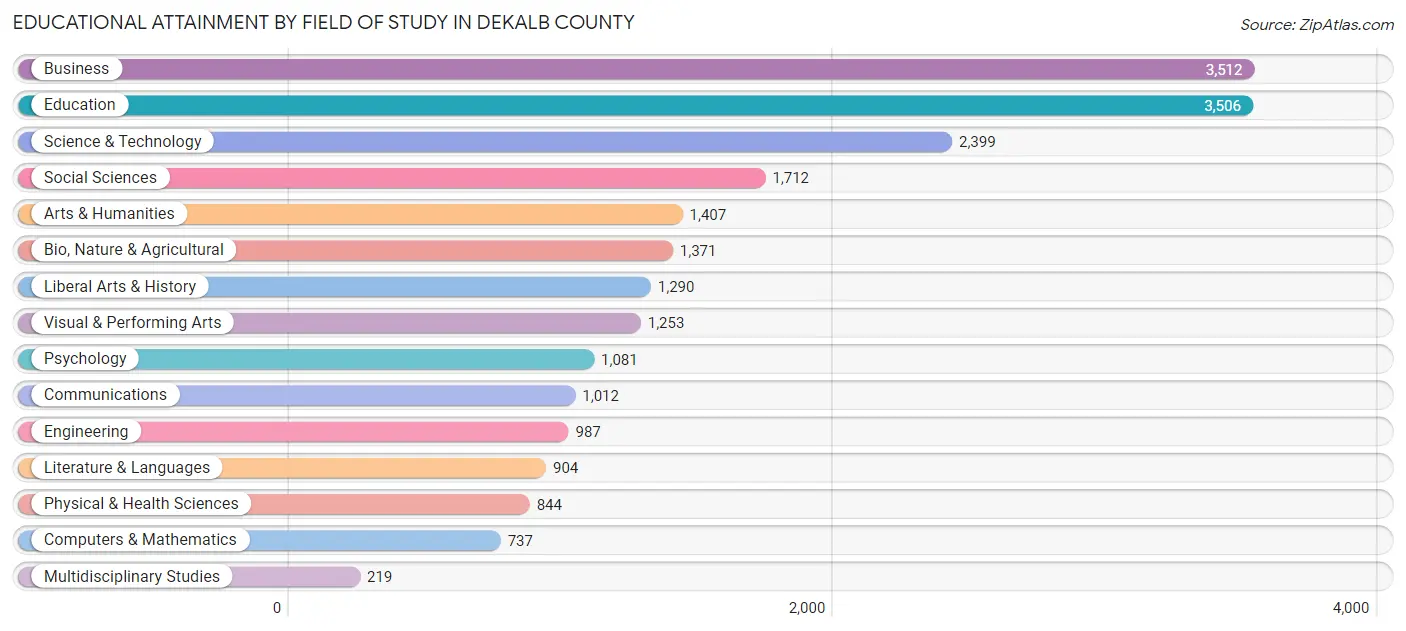
| Field of Study | # Graduates | % Graduates |
| Computers & Mathematics | 737 | 3.3% |
| Bio, Nature & Agricultural | 1,371 | 6.2% |
| Physical & Health Sciences | 844 | 3.8% |
| Psychology | 1,081 | 4.9% |
| Social Sciences | 1,712 | 7.7% |
| Engineering | 987 | 4.4% |
| Multidisciplinary Studies | 219 | 1.0% |
| Science & Technology | 2,399 | 10.8% |
| Business | 3,512 | 15.8% |
| Education | 3,506 | 15.8% |
| Literature & Languages | 904 | 4.1% |
| Liberal Arts & History | 1,290 | 5.8% |
| Visual & Performing Arts | 1,253 | 5.6% |
| Communications | 1,012 | 4.5% |
| Arts & Humanities | 1,407 | 6.3% |
| Total | 22,234 | 100.0% |
Transportation & Commute in DeKalb County
Vehicle Availability by Sex in DeKalb County
The most prevalent vehicle ownership categories in DeKalb County are males with 2 vehicles (11,540, accounting for 44.5%) and females with 2 vehicles (10,399, making up 49.4%).
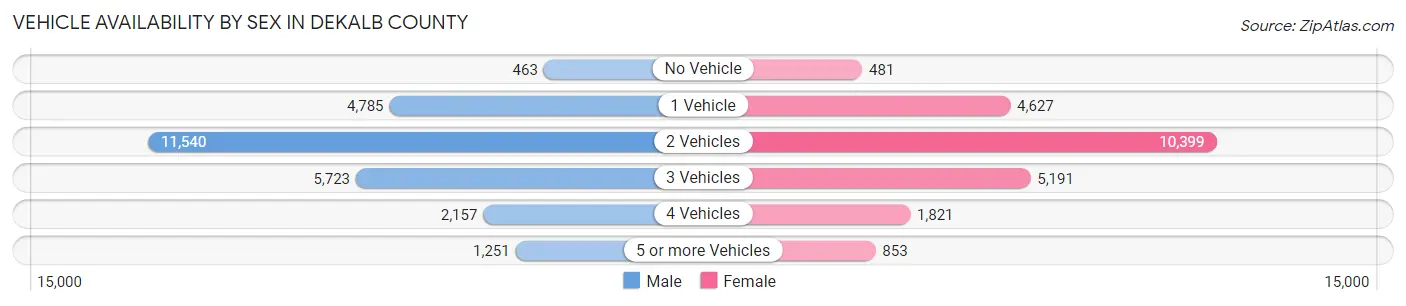
| Vehicles Available | Male | Female |
| No Vehicle | 463 (1.8%) | 481 (2.1%) |
| 1 Vehicle | 4,785 (18.5%) | 4,627 (19.8%) |
| 2 Vehicles | 11,540 (44.5%) | 10,399 (44.5%) |
| 3 Vehicles | 5,723 (22.1%) | 5,191 (22.2%) |
| 4 Vehicles | 2,157 (8.3%) | 1,821 (7.8%) |
| 5 or more Vehicles | 1,251 (4.8%) | 853 (3.6%) |
| Total | 25,919 (100.0%) | 23,372 (100.0%) |
Commute Time in DeKalb County
The most frequently occuring commute durations in DeKalb County are 10 to 14 minutes (8,339 commuters, 17.6%), 5 to 9 minutes (7,655 commuters, 16.2%), and 15 to 19 minutes (5,425 commuters, 11.5%).
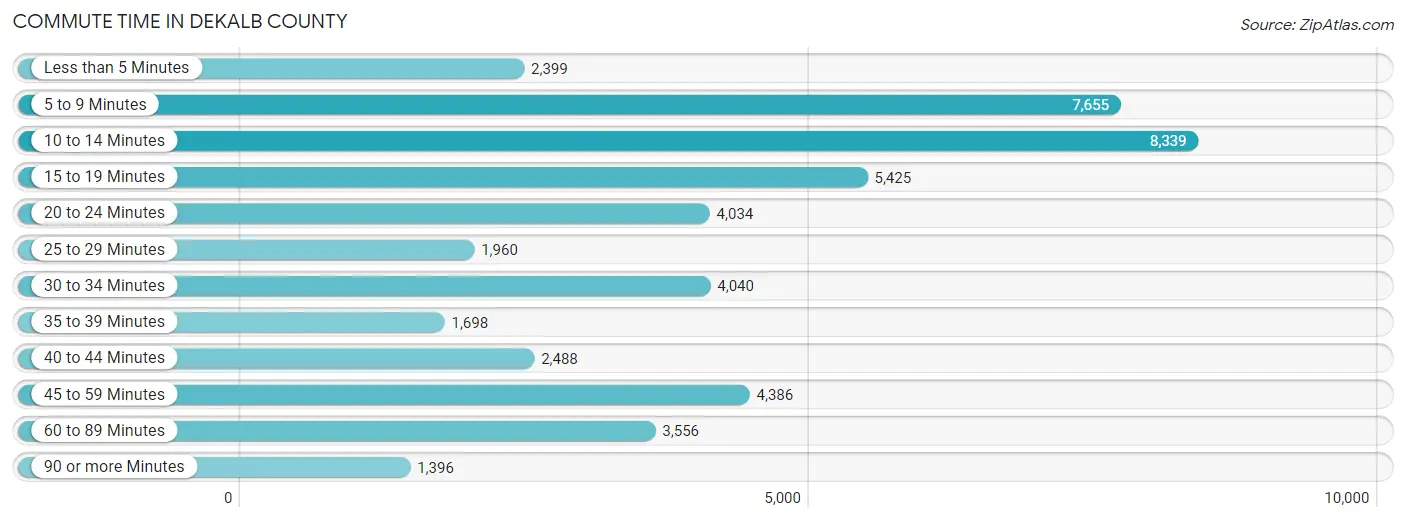
| Commute Time | # Commuters | % Commuters |
| Less than 5 Minutes | 2,399 | 5.1% |
| 5 to 9 Minutes | 7,655 | 16.2% |
| 10 to 14 Minutes | 8,339 | 17.6% |
| 15 to 19 Minutes | 5,425 | 11.5% |
| 20 to 24 Minutes | 4,034 | 8.5% |
| 25 to 29 Minutes | 1,960 | 4.1% |
| 30 to 34 Minutes | 4,040 | 8.5% |
| 35 to 39 Minutes | 1,698 | 3.6% |
| 40 to 44 Minutes | 2,488 | 5.2% |
| 45 to 59 Minutes | 4,386 | 9.3% |
| 60 to 89 Minutes | 3,556 | 7.5% |
| 90 or more Minutes | 1,396 | 2.9% |
Commute Time by Sex in DeKalb County
The most common commute times in DeKalb County are 10 to 14 minutes (4,084 commuters, 16.2%) for males and 10 to 14 minutes (4,255 commuters, 19.2%) for females.
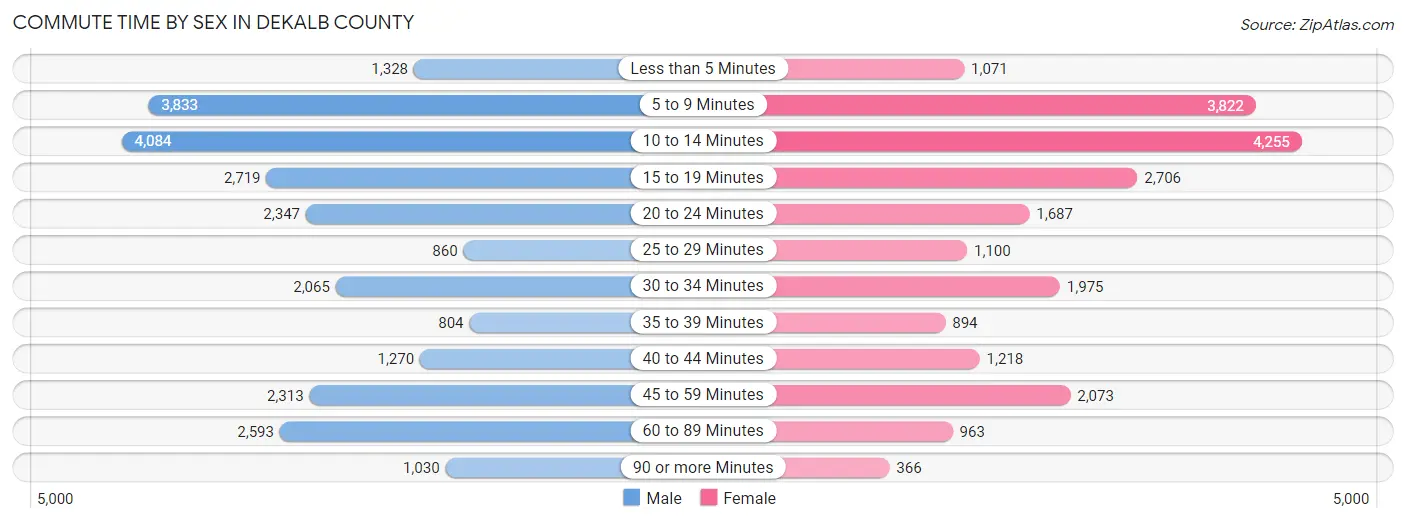
| Commute Time | Male | Female |
| Less than 5 Minutes | 1,328 (5.3%) | 1,071 (4.8%) |
| 5 to 9 Minutes | 3,833 (15.2%) | 3,822 (17.3%) |
| 10 to 14 Minutes | 4,084 (16.2%) | 4,255 (19.2%) |
| 15 to 19 Minutes | 2,719 (10.8%) | 2,706 (12.2%) |
| 20 to 24 Minutes | 2,347 (9.3%) | 1,687 (7.6%) |
| 25 to 29 Minutes | 860 (3.4%) | 1,100 (5.0%) |
| 30 to 34 Minutes | 2,065 (8.2%) | 1,975 (8.9%) |
| 35 to 39 Minutes | 804 (3.2%) | 894 (4.0%) |
| 40 to 44 Minutes | 1,270 (5.0%) | 1,218 (5.5%) |
| 45 to 59 Minutes | 2,313 (9.2%) | 2,073 (9.4%) |
| 60 to 89 Minutes | 2,593 (10.3%) | 963 (4.3%) |
| 90 or more Minutes | 1,030 (4.1%) | 366 (1.7%) |
Time of Departure to Work by Sex in DeKalb County
The most frequent times of departure to work in DeKalb County are 7:30 AM to 7:59 AM (3,006, 11.9%) for males and 7:00 AM to 7:29 AM (3,161, 14.3%) for females.
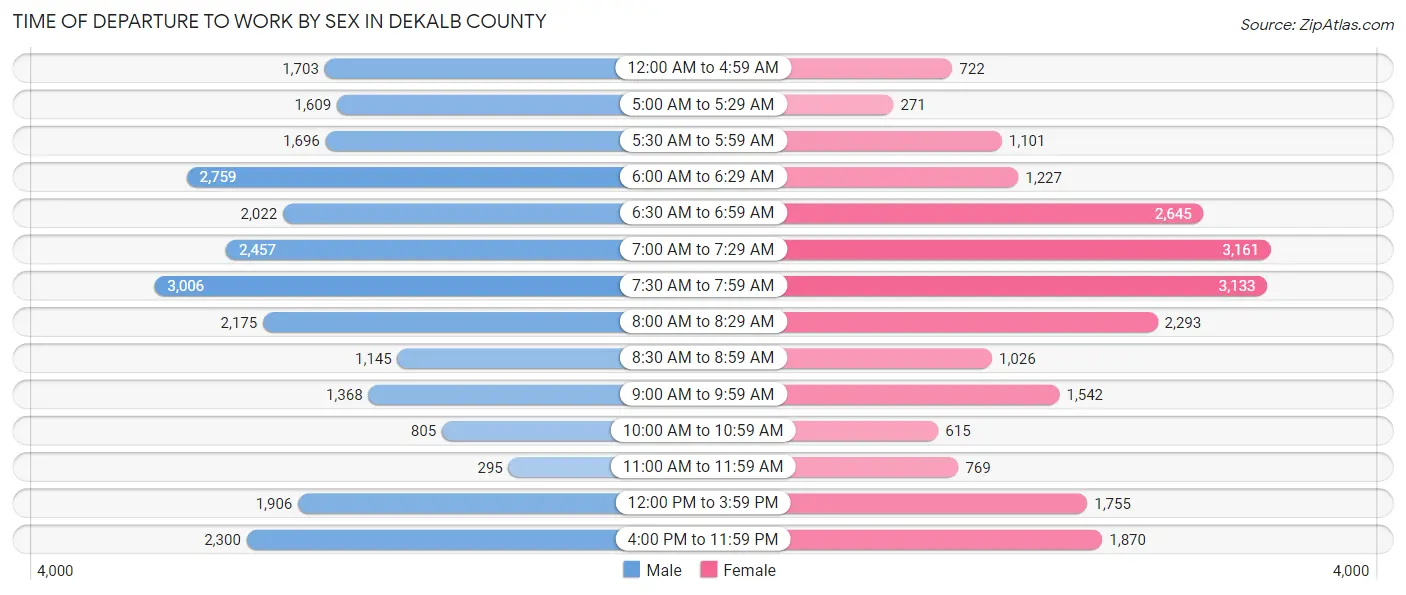
| Time of Departure | Male | Female |
| 12:00 AM to 4:59 AM | 1,703 (6.8%) | 722 (3.3%) |
| 5:00 AM to 5:29 AM | 1,609 (6.4%) | 271 (1.2%) |
| 5:30 AM to 5:59 AM | 1,696 (6.7%) | 1,101 (5.0%) |
| 6:00 AM to 6:29 AM | 2,759 (10.9%) | 1,227 (5.5%) |
| 6:30 AM to 6:59 AM | 2,022 (8.0%) | 2,645 (11.9%) |
| 7:00 AM to 7:29 AM | 2,457 (9.7%) | 3,161 (14.3%) |
| 7:30 AM to 7:59 AM | 3,006 (11.9%) | 3,133 (14.2%) |
| 8:00 AM to 8:29 AM | 2,175 (8.6%) | 2,293 (10.4%) |
| 8:30 AM to 8:59 AM | 1,145 (4.5%) | 1,026 (4.6%) |
| 9:00 AM to 9:59 AM | 1,368 (5.4%) | 1,542 (7.0%) |
| 10:00 AM to 10:59 AM | 805 (3.2%) | 615 (2.8%) |
| 11:00 AM to 11:59 AM | 295 (1.2%) | 769 (3.5%) |
| 12:00 PM to 3:59 PM | 1,906 (7.5%) | 1,755 (7.9%) |
| 4:00 PM to 11:59 PM | 2,300 (9.1%) | 1,870 (8.5%) |
| Total | 25,246 (100.0%) | 22,130 (100.0%) |
Housing Occupancy in DeKalb County
Occupancy by Ownership in DeKalb County
Of the total 39,139 dwellings in DeKalb County, owner-occupied units account for 23,489 (60.0%), while renter-occupied units make up 15,650 (40.0%).
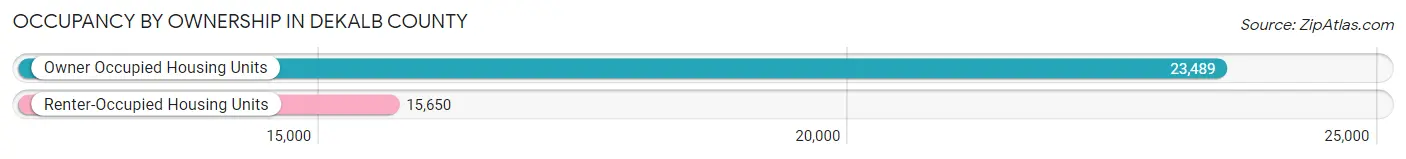
| Occupancy | # Housing Units | % Housing Units |
| Owner Occupied Housing Units | 23,489 | 60.0% |
| Renter-Occupied Housing Units | 15,650 | 40.0% |
| Total Occupied Housing Units | 39,139 | 100.0% |
Occupancy by Household Size in DeKalb County
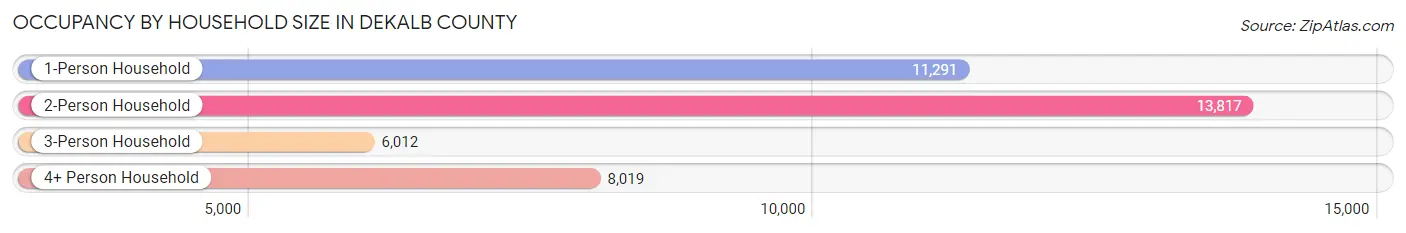
| Household Size | # Housing Units | % Housing Units |
| 1-Person Household | 11,291 | 28.8% |
| 2-Person Household | 13,817 | 35.3% |
| 3-Person Household | 6,012 | 15.4% |
| 4+ Person Household | 8,019 | 20.5% |
| Total Housing Units | 39,139 | 100.0% |
Occupancy by Ownership by Household Size in DeKalb County
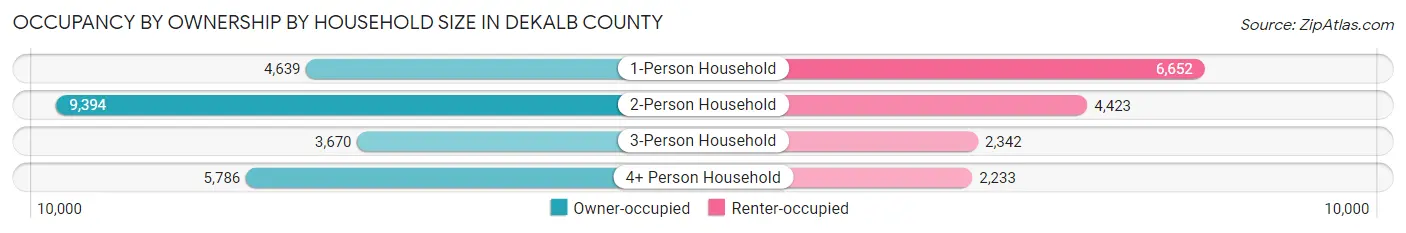
| Household Size | Owner-occupied | Renter-occupied |
| 1-Person Household | 4,639 (41.1%) | 6,652 (58.9%) |
| 2-Person Household | 9,394 (68.0%) | 4,423 (32.0%) |
| 3-Person Household | 3,670 (61.0%) | 2,342 (39.0%) |
| 4+ Person Household | 5,786 (72.2%) | 2,233 (27.9%) |
| Total Housing Units | 23,489 (60.0%) | 15,650 (40.0%) |
Occupancy by Educational Attainment in DeKalb County
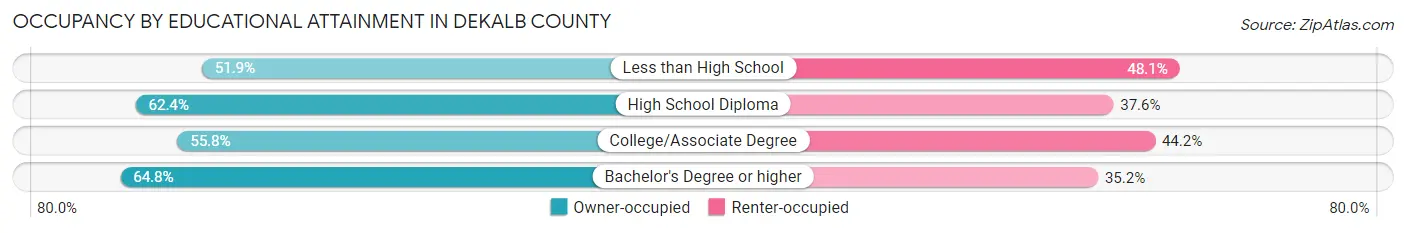
| Household Size | Owner-occupied | Renter-occupied |
| Less than High School | 1,234 (51.9%) | 1,144 (48.1%) |
| High School Diploma | 4,985 (62.4%) | 3,005 (37.6%) |
| College/Associate Degree | 8,520 (55.8%) | 6,753 (44.2%) |
| Bachelor's Degree or higher | 8,750 (64.8%) | 4,748 (35.2%) |
Occupancy by Age of Householder in DeKalb County
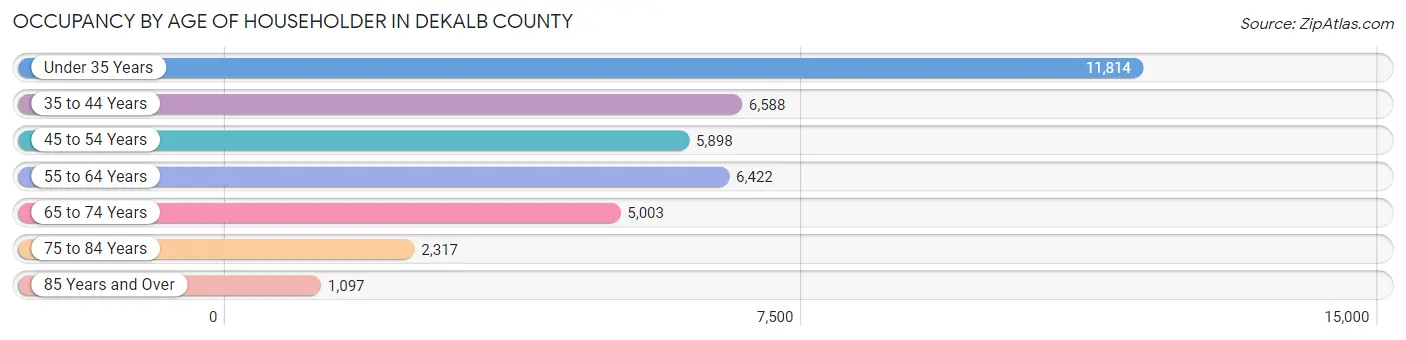
| Age Bracket | # Households | % Households |
| Under 35 Years | 11,814 | 30.2% |
| 35 to 44 Years | 6,588 | 16.8% |
| 45 to 54 Years | 5,898 | 15.1% |
| 55 to 64 Years | 6,422 | 16.4% |
| 65 to 74 Years | 5,003 | 12.8% |
| 75 to 84 Years | 2,317 | 5.9% |
| 85 Years and Over | 1,097 | 2.8% |
| Total | 39,139 | 100.0% |
Housing Finances in DeKalb County
Median Income by Occupancy in DeKalb County
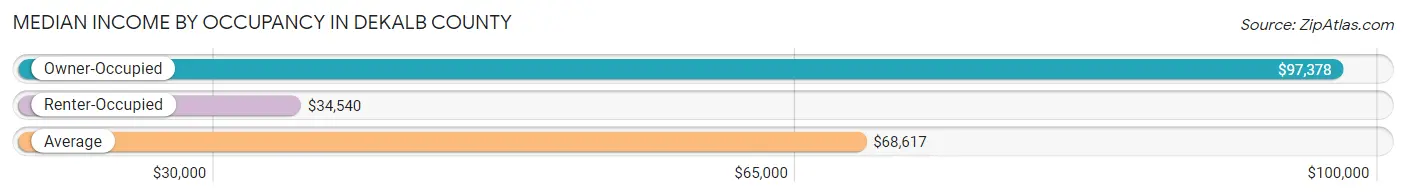
| Occupancy Type | # Households | Median Income |
| Owner-Occupied | 23,489 (60.0%) | $97,378 |
| Renter-Occupied | 15,650 (40.0%) | $34,540 |
| Average | 39,139 (100.0%) | $68,617 |
Occupancy by Householder Income Bracket in DeKalb County
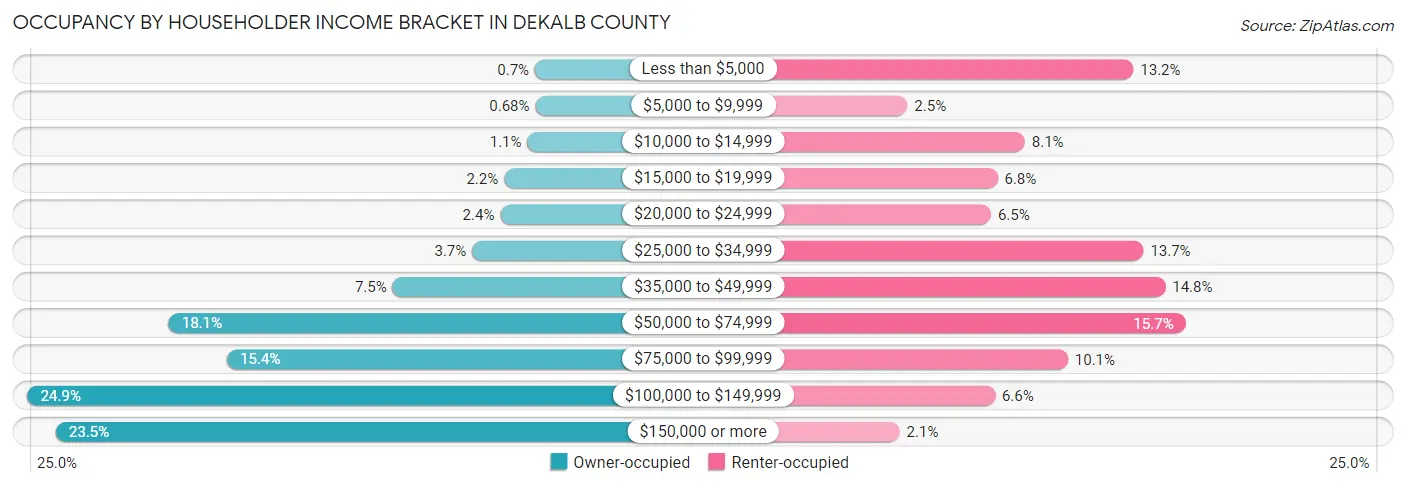
| Income Bracket | Owner-occupied | Renter-occupied |
| Less than $5,000 | 165 (0.7%) | 2,071 (13.2%) |
| $5,000 to $9,999 | 159 (0.7%) | 387 (2.5%) |
| $10,000 to $14,999 | 250 (1.1%) | 1,262 (8.1%) |
| $15,000 to $19,999 | 509 (2.2%) | 1,058 (6.8%) |
| $20,000 to $24,999 | 553 (2.4%) | 1,010 (6.5%) |
| $25,000 to $34,999 | 867 (3.7%) | 2,145 (13.7%) |
| $35,000 to $49,999 | 1,757 (7.5%) | 2,308 (14.7%) |
| $50,000 to $74,999 | 4,259 (18.1%) | 2,459 (15.7%) |
| $75,000 to $99,999 | 3,609 (15.4%) | 1,582 (10.1%) |
| $100,000 to $149,999 | 5,839 (24.9%) | 1,039 (6.6%) |
| $150,000 or more | 5,522 (23.5%) | 329 (2.1%) |
| Total | 23,489 (100.0%) | 15,650 (100.0%) |
Monthly Housing Cost Tiers in DeKalb County
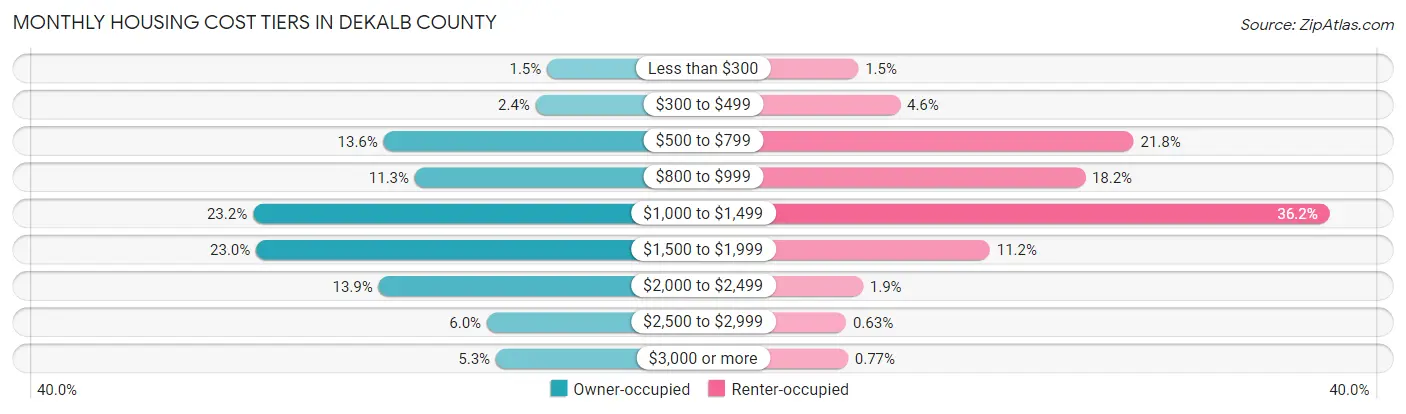
| Monthly Cost | Owner-occupied | Renter-occupied |
| Less than $300 | 358 (1.5%) | 239 (1.5%) |
| $300 to $499 | 554 (2.4%) | 721 (4.6%) |
| $500 to $799 | 3,185 (13.6%) | 3,414 (21.8%) |
| $800 to $999 | 2,645 (11.3%) | 2,853 (18.2%) |
| $1,000 to $1,499 | 5,444 (23.2%) | 5,672 (36.2%) |
| $1,500 to $1,999 | 5,390 (23.0%) | 1,756 (11.2%) |
| $2,000 to $2,499 | 3,273 (13.9%) | 293 (1.9%) |
| $2,500 to $2,999 | 1,397 (5.9%) | 98 (0.6%) |
| $3,000 or more | 1,243 (5.3%) | 121 (0.8%) |
| Total | 23,489 (100.0%) | 15,650 (100.0%) |
Physical Housing Characteristics in DeKalb County
Housing Structures in DeKalb County

| Structure Type | # Housing Units | % Housing Units |
| Single Unit, Detached | 23,030 | 58.8% |
| Single Unit, Attached | 3,758 | 9.6% |
| 2 Unit Apartments | 1,130 | 2.9% |
| 3 or 4 Unit Apartments | 1,916 | 4.9% |
| 5 to 9 Unit Apartments | 3,808 | 9.7% |
| 10 or more Apartments | 4,660 | 11.9% |
| Mobile Home / Other | 837 | 2.1% |
| Total | 39,139 | 100.0% |
Housing Structures by Occupancy in DeKalb County

| Structure Type | Owner-occupied | Renter-occupied |
| Single Unit, Detached | 20,223 (87.8%) | 2,807 (12.2%) |
| Single Unit, Attached | 2,052 (54.6%) | 1,706 (45.4%) |
| 2 Unit Apartments | 134 (11.9%) | 996 (88.1%) |
| 3 or 4 Unit Apartments | 236 (12.3%) | 1,680 (87.7%) |
| 5 to 9 Unit Apartments | 31 (0.8%) | 3,777 (99.2%) |
| 10 or more Apartments | 33 (0.7%) | 4,627 (99.3%) |
| Mobile Home / Other | 780 (93.2%) | 57 (6.8%) |
| Total | 23,489 (60.0%) | 15,650 (40.0%) |
Housing Structures by Number of Rooms in DeKalb County
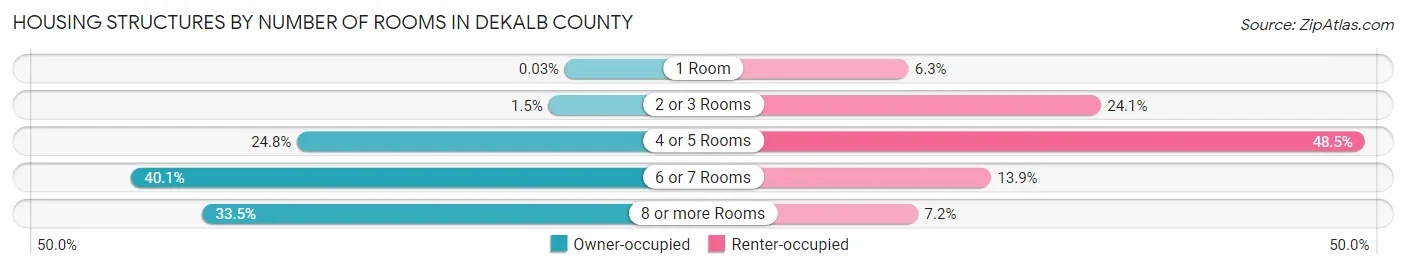
| Number of Rooms | Owner-occupied | Renter-occupied |
| 1 Room | 7 (0.0%) | 983 (6.3%) |
| 2 or 3 Rooms | 360 (1.5%) | 3,768 (24.1%) |
| 4 or 5 Rooms | 5,823 (24.8%) | 7,595 (48.5%) |
| 6 or 7 Rooms | 9,423 (40.1%) | 2,178 (13.9%) |
| 8 or more Rooms | 7,876 (33.5%) | 1,126 (7.2%) |
| Total | 23,489 (100.0%) | 15,650 (100.0%) |
Housing Structure by Heating Type in DeKalb County
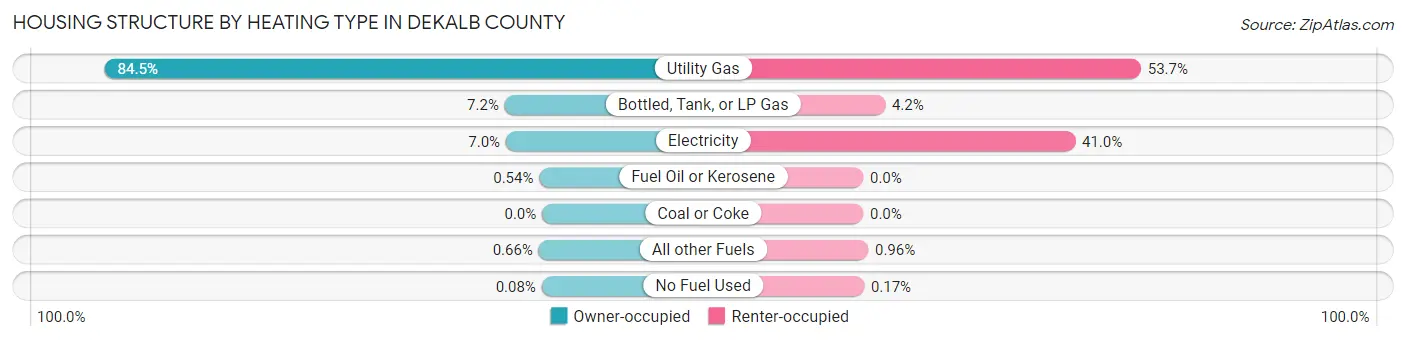
| Heating Type | Owner-occupied | Renter-occupied |
| Utility Gas | 19,854 (84.5%) | 8,399 (53.7%) |
| Bottled, Tank, or LP Gas | 1,695 (7.2%) | 663 (4.2%) |
| Electricity | 1,641 (7.0%) | 6,411 (41.0%) |
| Fuel Oil or Kerosene | 126 (0.5%) | 0 (0.0%) |
| Coal or Coke | 0 (0.0%) | 0 (0.0%) |
| All other Fuels | 154 (0.7%) | 151 (1.0%) |
| No Fuel Used | 19 (0.1%) | 26 (0.2%) |
| Total | 23,489 (100.0%) | 15,650 (100.0%) |
Household Vehicle Usage in DeKalb County
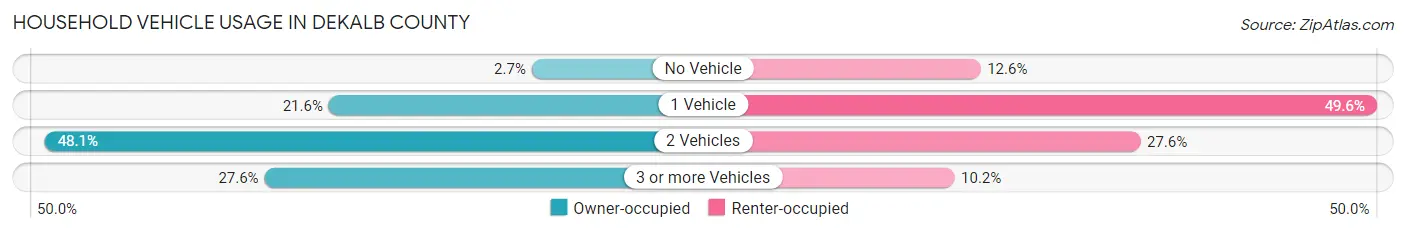
| Vehicles per Household | Owner-occupied | Renter-occupied |
| No Vehicle | 625 (2.7%) | 1,976 (12.6%) |
| 1 Vehicle | 5,075 (21.6%) | 7,768 (49.6%) |
| 2 Vehicles | 11,304 (48.1%) | 4,311 (27.6%) |
| 3 or more Vehicles | 6,485 (27.6%) | 1,595 (10.2%) |
| Total | 23,489 (100.0%) | 15,650 (100.0%) |
Real Estate & Mortgages in DeKalb County
Real Estate and Mortgage Overview in DeKalb County
| Characteristic | Without Mortgage | With Mortgage |
| Housing Units | 7,678 | 15,811 |
| Median Property Value | $214,300 | $220,200 |
| Median Household Income | $73,818 | $4,024 |
| Monthly Housing Costs | $812 | $1,226 |
| Real Estate Taxes | $5,275 | $407 |
Property Value by Mortgage Status in DeKalb County
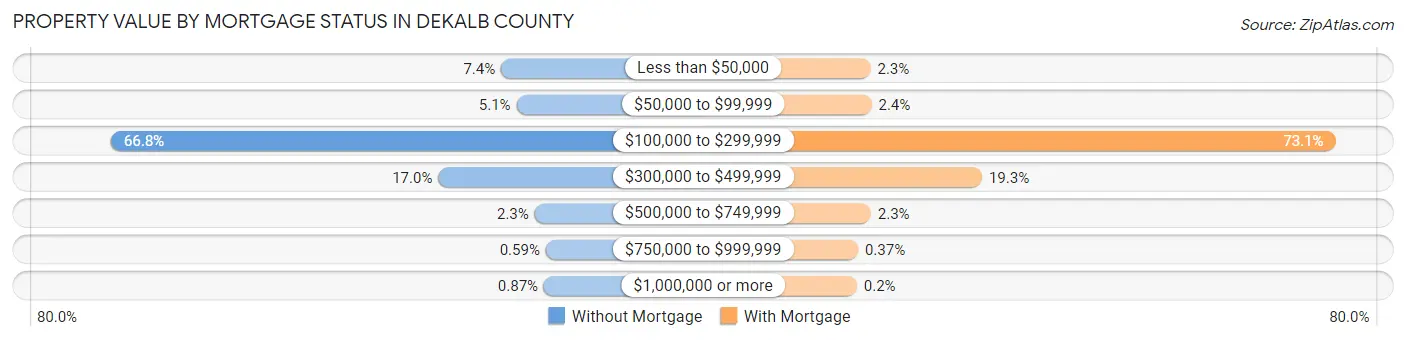
| Property Value | Without Mortgage | With Mortgage |
| Less than $50,000 | 568 (7.4%) | 360 (2.3%) |
| $50,000 to $99,999 | 388 (5.1%) | 385 (2.4%) |
| $100,000 to $299,999 | 5,132 (66.8%) | 11,561 (73.1%) |
| $300,000 to $499,999 | 1,303 (17.0%) | 3,047 (19.3%) |
| $500,000 to $749,999 | 175 (2.3%) | 369 (2.3%) |
| $750,000 to $999,999 | 45 (0.6%) | 58 (0.4%) |
| $1,000,000 or more | 67 (0.9%) | 31 (0.2%) |
| Total | 7,678 (100.0%) | 15,811 (100.0%) |
Household Income by Mortgage Status in DeKalb County
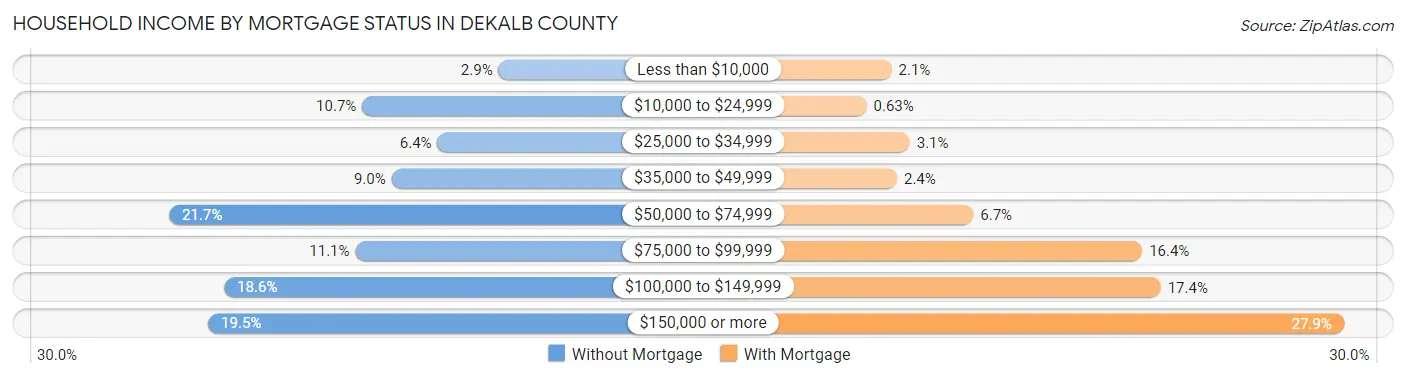
| Household Income | Without Mortgage | With Mortgage |
| Less than $10,000 | 224 (2.9%) | 325 (2.1%) |
| $10,000 to $24,999 | 822 (10.7%) | 100 (0.6%) |
| $25,000 to $34,999 | 492 (6.4%) | 490 (3.1%) |
| $35,000 to $49,999 | 693 (9.0%) | 375 (2.4%) |
| $50,000 to $74,999 | 1,669 (21.7%) | 1,064 (6.7%) |
| $75,000 to $99,999 | 852 (11.1%) | 2,590 (16.4%) |
| $100,000 to $149,999 | 1,428 (18.6%) | 2,757 (17.4%) |
| $150,000 or more | 1,498 (19.5%) | 4,411 (27.9%) |
| Total | 7,678 (100.0%) | 15,811 (100.0%) |
Property Value to Household Income Ratio in DeKalb County
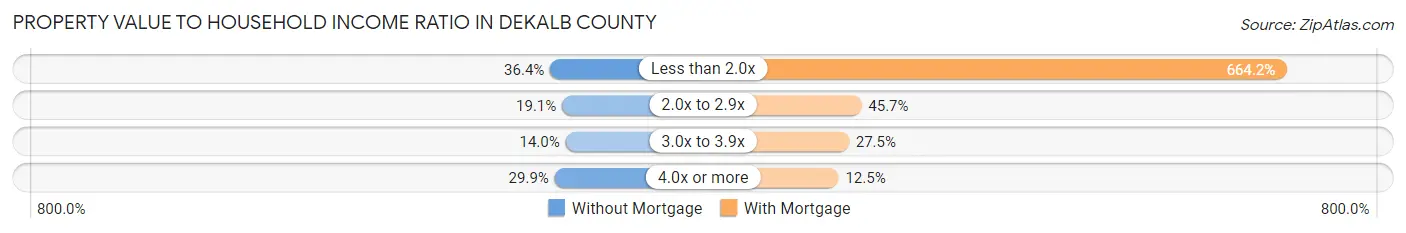
| Value-to-Income Ratio | Without Mortgage | With Mortgage |
| Less than 2.0x | 2,798 (36.4%) | 105,021 (664.2%) |
| 2.0x to 2.9x | 1,463 (19.1%) | 7,222 (45.7%) |
| 3.0x to 3.9x | 1,077 (14.0%) | 4,340 (27.5%) |
| 4.0x or more | 2,296 (29.9%) | 1,973 (12.5%) |
| Total | 7,678 (100.0%) | 15,811 (100.0%) |
Real Estate Taxes by Mortgage Status in DeKalb County
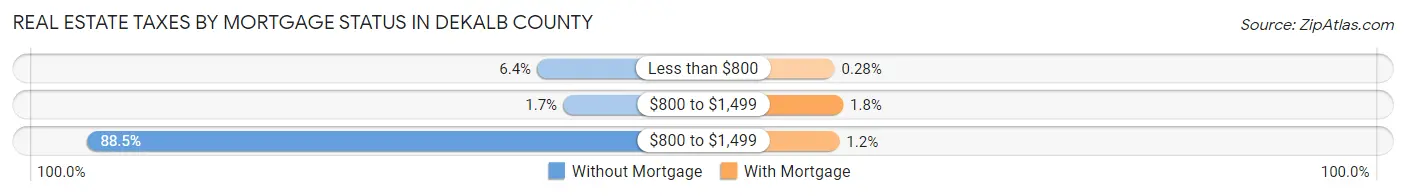
| Property Taxes | Without Mortgage | With Mortgage |
| Less than $800 | 494 (6.4%) | 45 (0.3%) |
| $800 to $1,499 | 129 (1.7%) | 291 (1.8%) |
| $800 to $1,499 | 6,796 (88.5%) | 184 (1.2%) |
| Total | 7,678 (100.0%) | 15,811 (100.0%) |
Health & Disability in DeKalb County
Health Insurance Coverage by Age in DeKalb County
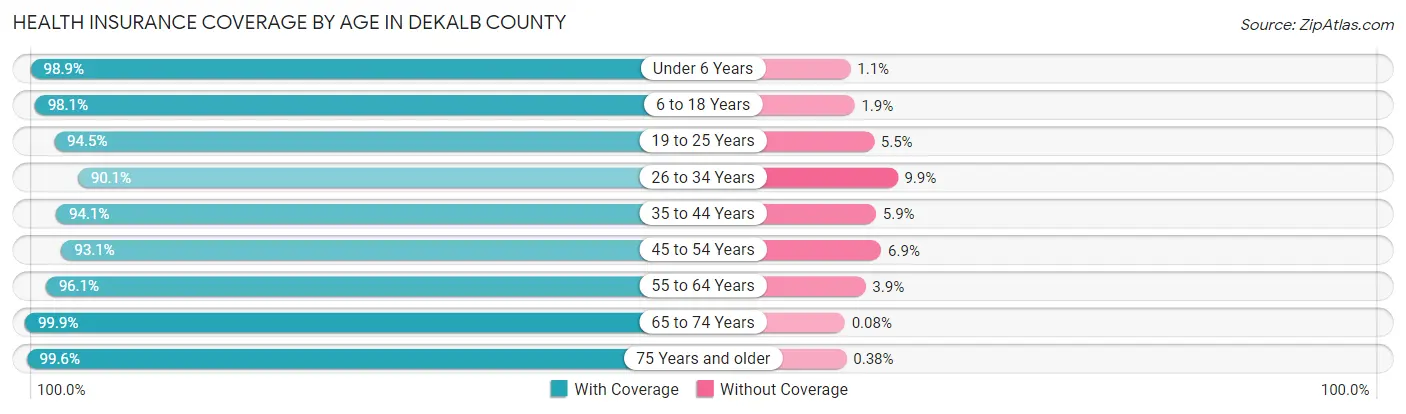
| Age Bracket | With Coverage | Without Coverage |
| Under 6 Years | 6,761 (98.9%) | 77 (1.1%) |
| 6 to 18 Years | 16,863 (98.1%) | 327 (1.9%) |
| 19 to 25 Years | 16,985 (94.5%) | 990 (5.5%) |
| 26 to 34 Years | 10,865 (90.1%) | 1,196 (9.9%) |
| 35 to 44 Years | 10,763 (94.1%) | 672 (5.9%) |
| 45 to 54 Years | 9,828 (93.1%) | 725 (6.9%) |
| 55 to 64 Years | 10,491 (96.1%) | 430 (3.9%) |
| 65 to 74 Years | 7,932 (99.9%) | 6 (0.1%) |
| 75 Years and older | 5,038 (99.6%) | 19 (0.4%) |
| Total | 95,526 (95.6%) | 4,442 (4.4%) |
Health Insurance Coverage by Citizenship Status in DeKalb County
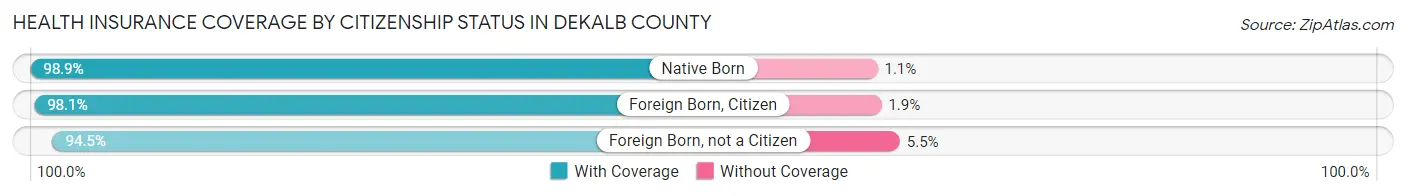
| Citizenship Status | With Coverage | Without Coverage |
| Native Born | 6,761 (98.9%) | 77 (1.1%) |
| Foreign Born, Citizen | 16,863 (98.1%) | 327 (1.9%) |
| Foreign Born, not a Citizen | 16,985 (94.5%) | 990 (5.5%) |
Health Insurance Coverage by Household Income in DeKalb County
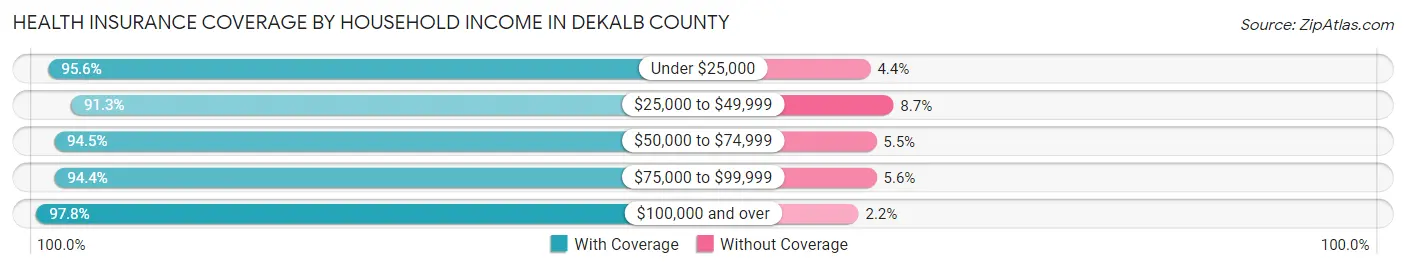
| Household Income | With Coverage | Without Coverage |
| Under $25,000 | 11,826 (95.6%) | 550 (4.4%) |
| $25,000 to $49,999 | 12,716 (91.3%) | 1,217 (8.7%) |
| $50,000 to $74,999 | 14,844 (94.5%) | 869 (5.5%) |
| $75,000 to $99,999 | 12,628 (94.4%) | 747 (5.6%) |
| $100,000 and over | 40,186 (97.8%) | 906 (2.2%) |
Public vs Private Health Insurance Coverage by Age in DeKalb County
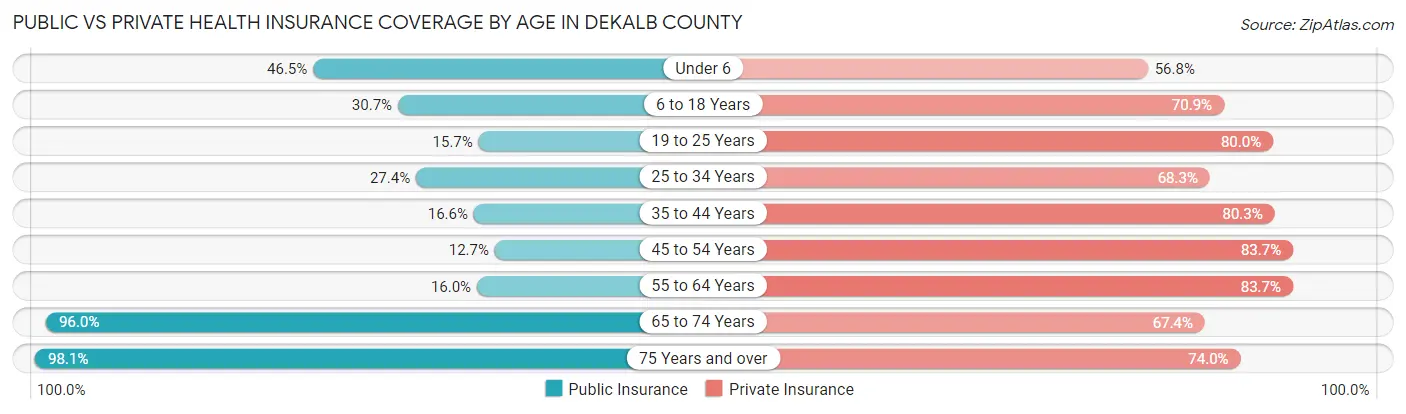
| Age Bracket | Public Insurance | Private Insurance |
| Under 6 | 3,176 (46.5%) | 3,883 (56.8%) |
| 6 to 18 Years | 5,279 (30.7%) | 12,191 (70.9%) |
| 19 to 25 Years | 2,828 (15.7%) | 14,385 (80.0%) |
| 25 to 34 Years | 3,299 (27.4%) | 8,237 (68.3%) |
| 35 to 44 Years | 1,900 (16.6%) | 9,185 (80.3%) |
| 45 to 54 Years | 1,343 (12.7%) | 8,837 (83.7%) |
| 55 to 64 Years | 1,752 (16.0%) | 9,141 (83.7%) |
| 65 to 74 Years | 7,622 (96.0%) | 5,349 (67.4%) |
| 75 Years and over | 4,959 (98.1%) | 3,741 (74.0%) |
| Total | 32,158 (32.2%) | 74,949 (75.0%) |
Disability Status by Sex by Age in DeKalb County
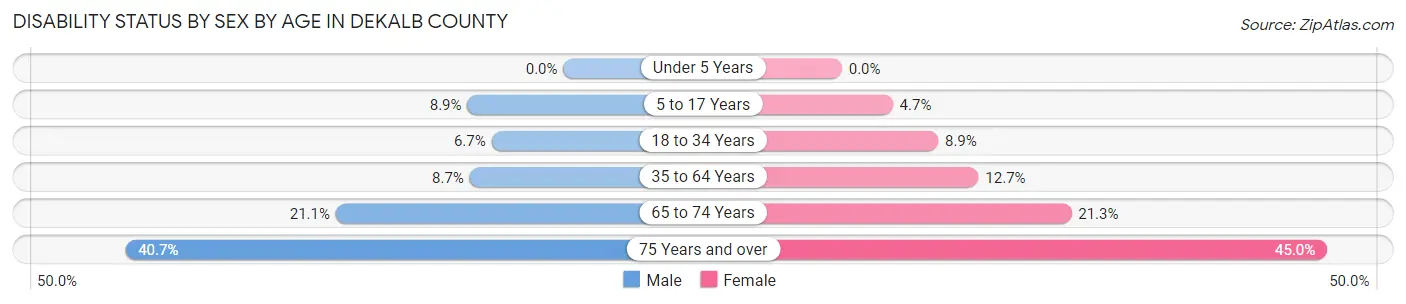
| Age Bracket | Male | Female |
| Under 5 Years | 0 (0.0%) | 0 (0.0%) |
| 5 to 17 Years | 734 (8.9%) | 369 (4.7%) |
| 18 to 34 Years | 1,084 (6.7%) | 1,442 (8.9%) |
| 35 to 64 Years | 1,434 (8.7%) | 2,080 (12.7%) |
| 65 to 74 Years | 800 (21.1%) | 884 (21.3%) |
| 75 Years and over | 860 (40.7%) | 1,325 (45.0%) |
Disability Class by Sex by Age in DeKalb County
Disability Class: Hearing Difficulty
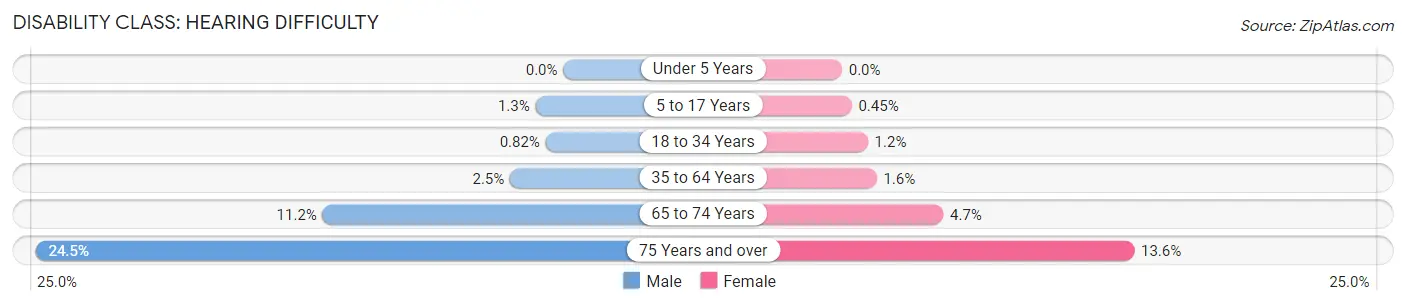
| Age Bracket | Male | Female |
| Under 5 Years | 0 (0.0%) | 0 (0.0%) |
| 5 to 17 Years | 106 (1.3%) | 35 (0.4%) |
| 18 to 34 Years | 134 (0.8%) | 194 (1.2%) |
| 35 to 64 Years | 408 (2.5%) | 264 (1.6%) |
| 65 to 74 Years | 423 (11.2%) | 195 (4.7%) |
| 75 Years and over | 518 (24.5%) | 399 (13.6%) |
Disability Class: Vision Difficulty
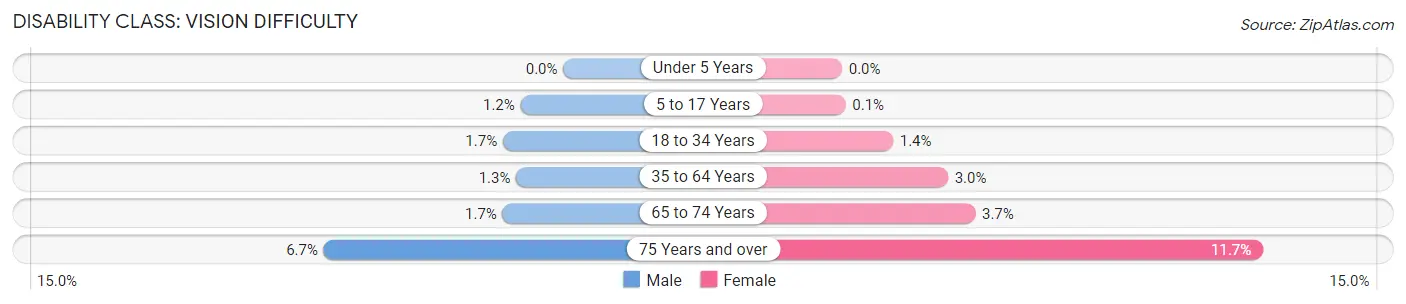
| Age Bracket | Male | Female |
| Under 5 Years | 0 (0.0%) | 0 (0.0%) |
| 5 to 17 Years | 98 (1.2%) | 8 (0.1%) |
| 18 to 34 Years | 274 (1.7%) | 229 (1.4%) |
| 35 to 64 Years | 216 (1.3%) | 484 (2.9%) |
| 65 to 74 Years | 64 (1.7%) | 154 (3.7%) |
| 75 Years and over | 141 (6.7%) | 345 (11.7%) |
Disability Class: Cognitive Difficulty
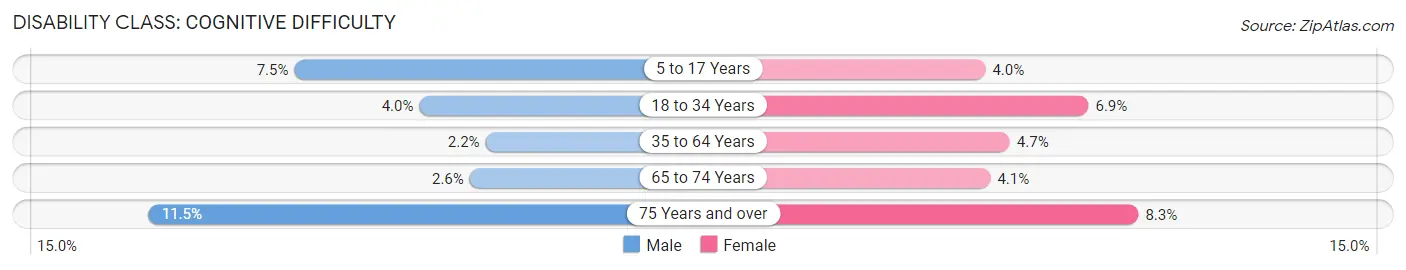
| Age Bracket | Male | Female |
| 5 to 17 Years | 617 (7.5%) | 313 (4.0%) |
| 18 to 34 Years | 653 (4.0%) | 1,110 (6.9%) |
| 35 to 64 Years | 359 (2.2%) | 767 (4.7%) |
| 65 to 74 Years | 99 (2.6%) | 172 (4.1%) |
| 75 Years and over | 244 (11.5%) | 243 (8.3%) |
Disability Class: Ambulatory Difficulty
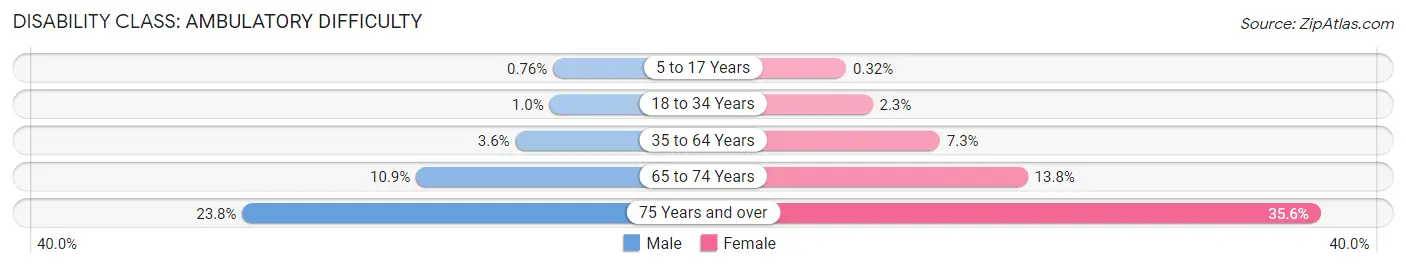
| Age Bracket | Male | Female |
| 5 to 17 Years | 63 (0.8%) | 25 (0.3%) |
| 18 to 34 Years | 167 (1.0%) | 369 (2.3%) |
| 35 to 64 Years | 588 (3.6%) | 1,194 (7.3%) |
| 65 to 74 Years | 414 (10.9%) | 573 (13.8%) |
| 75 Years and over | 504 (23.8%) | 1,046 (35.5%) |
Disability Class: Self-Care Difficulty
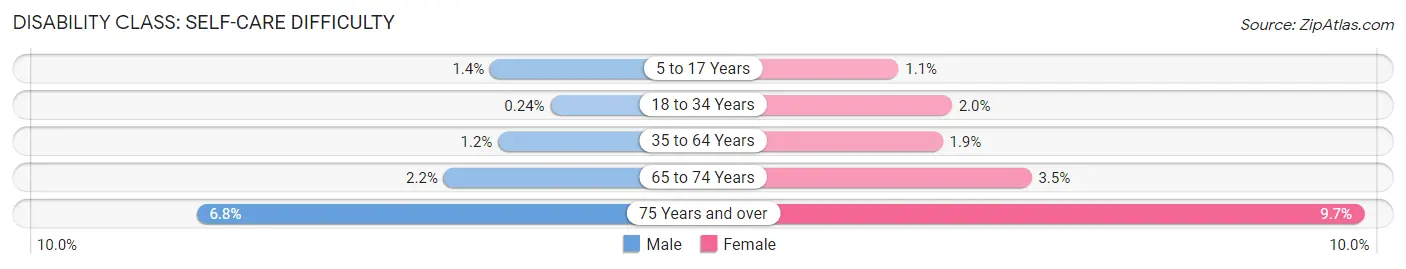
| Age Bracket | Male | Female |
| 5 to 17 Years | 112 (1.4%) | 82 (1.1%) |
| 18 to 34 Years | 39 (0.2%) | 329 (2.0%) |
| 35 to 64 Years | 199 (1.2%) | 307 (1.9%) |
| 65 to 74 Years | 84 (2.2%) | 146 (3.5%) |
| 75 Years and over | 144 (6.8%) | 285 (9.7%) |
Technology Access in DeKalb County
Computing Device Access in DeKalb County
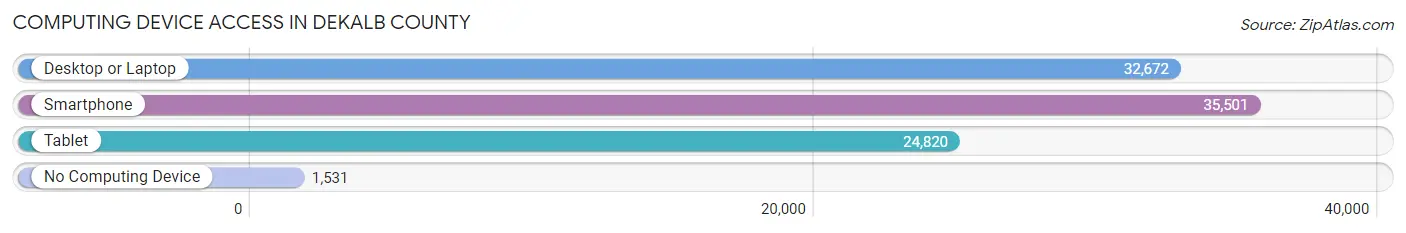
| Device Type | # Households | % Households |
| Desktop or Laptop | 32,672 | 83.5% |
| Smartphone | 35,501 | 90.7% |
| Tablet | 24,820 | 63.4% |
| No Computing Device | 1,531 | 3.9% |
| Total | 39,139 | 100.0% |
Internet Access in DeKalb County
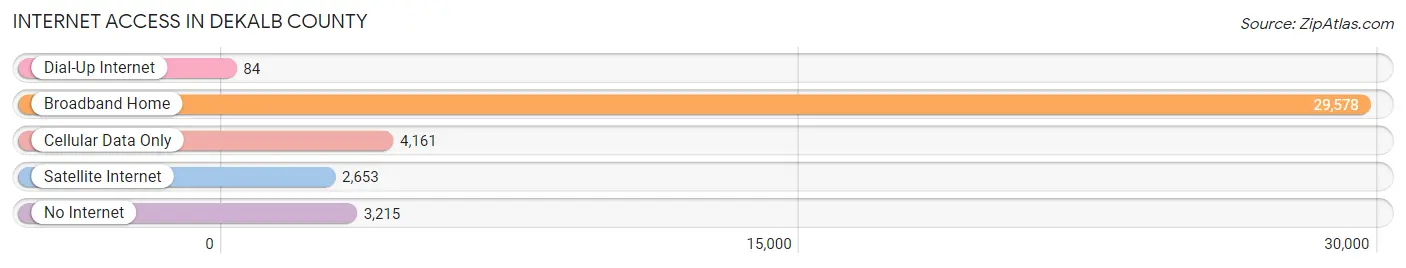
| Internet Type | # Households | % Households |
| Dial-Up Internet | 84 | 0.2% |
| Broadband Home | 29,578 | 75.6% |
| Cellular Data Only | 4,161 | 10.6% |
| Satellite Internet | 2,653 | 6.8% |
| No Internet | 3,215 | 8.2% |
| Total | 39,139 | 100.0% |
DeKalb County Summary
Dekalb County, Illinois is located in the northern part of the state, about 65 miles west of Chicago. It is part of the Chicago metropolitan area and is bordered by Kane, Kendall, LaSalle, and Ogle counties. The county seat is Sycamore, and the population was estimated to be 104,719 in 2019.
History
Dekalb County was formed in 1837 from parts of Kane and LaSalle counties. It was named after Johann de Kalb, a German-born soldier who fought in the American Revolutionary War. The county was initially settled by New Englanders, and the first county seat was in Sycamore. The county was largely agricultural, and the main crops were wheat, corn, and oats.
In the late 19th century, the county experienced a period of rapid growth. The Chicago, Milwaukee, St. Paul and Pacific Railroad (the Milwaukee Road) was built through the county in 1874, and the Chicago and Northwestern Railway was built in 1881. This led to an influx of new settlers and businesses, and the county's population grew from 8,000 in 1870 to over 20,000 by 1900.
Geography
Dekalb County covers an area of 845 square miles, making it the fourth-largest county in Illinois. It is located in the northern part of the state, about 65 miles west of Chicago. The county is mostly flat, with some rolling hills in the western part. The Kishwaukee River flows through the county, and there are several small lakes and ponds. The climate is humid continental, with cold winters and hot, humid summers.
Economy
Agriculture is still an important part of the economy in Dekalb County. The main crops are corn, soybeans, and wheat. There are also several livestock farms in the county.
The county is also home to several large companies, including the DeKalb AgResearch Center, a research facility for agricultural products; the Northern Illinois University Research Park, a technology park; and the DeKalb County Airport, which serves the Chicago metropolitan area.
Demographics
As of the 2010 census, the population of Dekalb County was 105,160. The racial makeup of the county was 87.2% White, 6.3% African American, 0.4% Native American, 3.2% Asian, 0.1% Pacific Islander, and 2.8% from other races. Hispanic or Latino of any race were 8.2% of the population.
The median household income was $50,867, and the median family income was $63,964. The per capita income was $24,945. About 11.2% of the population was below the poverty line.
Conclusion
Dekalb County, Illinois is a rural county located in the northern part of the state, about 65 miles west of Chicago. It has a long history of agriculture, and the main crops are corn, soybeans, and wheat. The county is also home to several large companies, including the DeKalb AgResearch Center, the Northern Illinois University Research Park, and the DeKalb County Airport. The population of the county was estimated to be 104,719 in 2019, and the racial makeup was 87.2% White, 6.3% African American, 0.4% Native American, 3.2% Asian, 0.1% Pacific Islander, and 2.8% from other races. The median household income was $50,867, and the median family income was $63,964.
Common Questions
What is the Total Population of DeKalb County?
Total Population of DeKalb County is 100,686.
What is the Total Male Population of DeKalb County?
Total Male Population of DeKalb County is 50,029.
What is the Total Female Population of DeKalb County?
Total Female Population of DeKalb County is 50,657.
What is the Ratio of Males per 100 Females in DeKalb County?
There are 98.76 Males per 100 Females in DeKalb County.
What is the Ratio of Females per 100 Males in DeKalb County?
There are 101.26 Females per 100 Males in DeKalb County.
What is the Median Population Age in DeKalb County?
Median Population Age in DeKalb County is 31.8 Years.
What is the Average Family Size in DeKalb County
Average Family Size in DeKalb County is 3.1 People.
What is the Average Household Size in DeKalb County
Average Household Size in DeKalb County is 2.5 People.
What is Per Capita Income in DeKalb County?
Per Capita income in DeKalb County is $34,196.
What is the Median Family Income in DeKalb County?
Median Family Income in DeKalb County is $91,538.
What is the Median Household income in DeKalb County?
Median Household Income in DeKalb County is $68,617.
What is Income or Wage Gap in DeKalb County?
Income or Wage Gap in DeKalb County is 43.0%.
Women in DeKalb County earn 57.0 cents for every dollar earned by a man.
What is Family Income Deficit in DeKalb County?
Family Income Deficit in DeKalb County is $11,412.
Families that are below poverty line in DeKalb County earn $11,412 less on average than the poverty threshold level.
What is Inequality or Gini Index in DeKalb County?
Inequality or Gini Index in DeKalb County is 0.44.
How Large is the Labor Force in DeKalb County?
There are 55,574 People in the Labor Forcein in DeKalb County.
What is the Percentage of People in the Labor Force in DeKalb County?
68.3% of People are in the Labor Force in DeKalb County.
What is the Unemployment Rate in DeKalb County?
Unemployment Rate in DeKalb County is 7.0%.